Article

The Addition of Straw Affects the Response of Labile Soil Organic Carbon to the Freezing and Thawing Process

1
Institute of Applied Ecology, Chinese Academy of Sciences, Shenyang 110016, China
2
University of Chinese Academy of Sciences, Beijing 100049, China
3
School of Municipal and Environmental Engineering, Henan University of Urban Construction, Pingdingshan 467036, China
*
Author to whom correspondence should be addressed.
Agronomy 2025, 15(2), 479; https://doi.org/10.3390/agronomy15020479
Submission received: 9 January 2025 / Revised: 27 January 2025 / Accepted: 6 February 2025 / Published: 17 February 2025
(This article belongs to the Section Soil and Plant Nutrition)

Abstract

:
Global warming alters freeze–thaw process frequency and intensity, impacting soil carbon cycles. Four soils from a 12-year straw return experiment were used: S0 (no straw), S1 (low rate of addition), S2 (medium rate), and S3 (high rate). Ten treatments with or without temporary straw addition at different rates were conducted to explore their effects on soil microbial biomass carbon (MBC) and dissolved organic carbon (DOC) under laboratory and field freeze–thaw conditions. Compared to constant temperature, the freeze–thaw process under laboratory conditions reduced MBC (5.79%~29.9%), whereas this trend was mitigated or reversed under field conditions. The alleviating effect of straw addition on the decrease in MBC was greater in S0 than in S1, S2, and S3 by an average of 31.7%. Medium rate straw application (S2 8 t/ha) provided appropriate labile C levels, enhancing microbial activity while keeping DOC low and reducing C loss risk. The results revealed discrepancies in freeze–thaw effects on soil labile OC between laboratory and field conditions, the mitigation of freeze–thaw impacts on MBC by straw addition, and the appropriate straw return rate in Liaohe Plain. Therefore, proper nutrient management can maintain and regulate microbial activity and soil labile C in areas with freeze–thaw cycles.

1. Introduction

Freeze–thaw cycles often occur in the middle- and high-latitude and high-elevation ecosystems and can affect changes in the physical properties and microbial activity of the soil [1,2]. With global warming, freeze–thaw cycles have become common, and changes in soil carbon pools during freeze–thaw cycles has become a focus issue.
The soil organic C pool is the largest C pool in the global terrestrial ecosystem and is an important carbon sink for mitigating global warming [3]. Compared with total soil carbon pools, labile organic carbon decomposes and transforms quickly and is more sensitive to environmental changes [4]. Soil microbial biomass carbon (MBC) and dissolved organic carbon (DOC) represent the labile carbon pool in soil and are important indices reflecting soil organic carbon quality and determining the soil C balance. The soil MBC is not only a readily decomposed form and a reservoir of available nutrients [5], but also an indicator of soil microbial activity [6]. The DOC supports nutrient transport and is an essential substrate for microorganisms, influencing microbial activity and organic matter decomposition and turnover rates [7]. Therefore, the dynamics of MBC and DOC have been widely discussed when evaluating organic C availability and stability.
The freeze–thaw cycle is an important process in the nongrowing season in Northeast China and significantly affects soil structure, nutrient status, and C fluxes, especially for labile organic C [1]. The rupture of dead microbial cells and the destruction of soil aggregates during the freezing period promote the release of DOC, which increases microbial biomass [8]. Christensen and Tiedje [9] reported that the freeze–thaw process generally decreases the microbial biomass, although microbial reproduction can be stimulated by an increase in soluble substances [10]. Therefore, the impact of freeze–thaw cycles on soil labile organic carbon pools, such as DOC and MBC, remains inconclusive.
Furthermore, this impact varies with different numbers of freeze–thaw cycles, intensities, and experimental conditions. As the number of freeze–thaw cycles increases, the amount of DOC released during the freezing period gradually decreases, corresponding to a decrease in the amount of available C for microorganisms [11]. Moreover, microorganisms can adapt to freeze–thaw condition after multiple cycles [12]. The level of labile organic C and the relationship between the MBC and DOC can be determined based on MBC and DOC dynamics over different numbers of the freeze–thaw cycle [7]. Moreover, the intensity of freeze–thaw cycles exerts an important influence on the labile carbon pool. In general, more microorganisms are killed and more DOC is released with increasing freeze–thaw process intensity [13]. However, Gao et al. [14] noted that a mild freeze–thaw process has little effect on the labile organic C pool, implying different soil C transformations in various regions at different latitudes [15]. Furthermore, laboratory simulations are often conducted to investigate the freeze–thaw process because of the difficulty of field sampling in winter. However, soil C transformation is significantly affected by differences in the duration time, frequency, and intensity of the freeze–thaw process between laboratory and field conditions [16,17]. Notably, do simulation experiments represent the natural situation? Sufficient attention should be given to this question clarify the differences in observations obtained under laboratory and field conditions.
Straw is an important carrier of energy and nutrients, improving the soil structure, soil moisture [18], and the nutrient supply capacity. Moreover, straw return is also an effective means of increasing soil organic C and enhancing soil microbial activity [19]. The impacts on the soil labile carbon pool vary with the different duration and amount of straw addition. Ekwunife et al. [20] found that short-term (2 years) straw return has little effect on DOC, whereas an increasing effect was significantly exhibited with the straw addition extended to 9 years. Furthermore, microbial sensitivity to straw addition varied in the soils with different straw return histories [21]. On the other hand, the soil organic C content and microbial activity were generally increased with increasing application rate, although the increasing efficiency gradually declined [22]. Under freeze–thaw conditions, straw addition also significantly influences soil labile C, such as by replenishing DOC, stimulating microbial activity, and alleviating temperature changes [23]. However, studies of the effects of different straw return rates and durations on soil labile C under the freeze–thaw condition are lacking. Therefore, a series of freeze–thaw experiments was conducted to explore the impacts of the straw return amount and history on soil MBC and DOC under laboratory and field freeze–thaw conditions.
The sampling site is located in Shenyang, Liaoning Province, Northeast China, where there is an obvious freeze–thaw process in early winter and spring, and this period is the fallow season. Carbon transformation and microbial activity at this stage have an important influence on crop growth in the subsequent season and C and nutrient losses. Based on a long-term straw return experiment, the effects of straw addition on soil labile organic C were investigated under laboratory and field freeze–thaw conditions. We hypothesized that (i) simulation laboratory experiments can reflect the effect of freeze–thaw on the soil labile C pool under field conditions; (ii) straw addition can mitigate the negative effects of freeze–thaw cycles on the microbial activity.

2. Materials and Methods

2.1. Site Description and Soil Sampling

The tested soil was obtained from the National Field Observation and Research Station of Shenyang Agroecosystem (41°31′ N, 123°24′ E), Chinese Academy of Sciences, Liaoning Province, which is located in Northeast China on the Liaohe Plain. The region is characterized by a temperate semihumid continental monsoon climate. The average annual temperature is 7–8 °C, the average annual maximum temperature is 29.3 °C, and the average annual minimum temperature is −21.7 °C. The frost-free period is 147–164 days, and the average annual rainfall totals 600–700 mm. The soil contains 16.2% sand, 59.6% silt, and 24.1% clay, and it is classified as Alfisol [24] with the local name of brown soil. Soil samples were collected from the experimental field for long-term straw return (starting in 2009), with four levels of the dry mass addition for corn straw: no straw (S0), a low level of 4 t ha−1 year−1 (S1), a middle level of 8 t ha−1 year−1 (S2), and a high level of 12 t ha−1 year−1 (S3). There were four replicates in each case. Every October after harvest, air-dried aboveground residues (e.g., stems and leaves) are chopped and incorporated into the soil at depths of 0–20 cm, according to the experimental design. N fertilizer (urea; 46% N) and P fertilizer (calcium triple superphosphate) were applied at a rates of 150 kg N ha−1 year−1 and 90 kg P2O5 ha−1 year−1, respectively, for each replicate. The soil samples were collected at a depth of 0–20 cm from the surface, passed through a 2 mm sieve, homogenized, and stored in an air-dried state after the removing plant roots and stone particles were removed. The chemical properties of the test soil are shown in Table 1.

2.2. Experimental Design

The experiment included ten treatments: (1) S0; (2) S0 + L, adding a low amount of straw to S0; (3) S0 + M, adding a middle amount of straw to S0; (4) S0 + H, adding a high amount of straw to S0; (5) S1; (6) S1 + L, adding a low amount of straw to S; (7) S2; (8) S2 + M, adding a middle amount of straw to S2; (9) S3; and (10) S3 + H, adding a high amount of straw to S3. The low, middle, and high amounts of straw represented 4, 8, and 12 t ha−1, respectively. The corresponding application rates were 2.22, 4.44, and 6.67 g straw per kg soil, respectively. The experiment included three experimental conditions: laboratory constant-temperature conditions (Constant), laboratory freeze–thaw conditions (Laboratory), and field freeze–thaw conditions (Field). Each set of experimental conditions (10 treatments × 3 replicates) was repeated 8 sampling times. Corn straw (ground and sieved <1 mm) was applied during the mixing process in accordance with the treatments. The soil bulk density was calculated as 1.2 g cm−3. The C/N ratio of the corn straw used in this study was 55. Prior to mixing with dry mass straw, the soil was rewetted (30% water holding capacity (WHC)) and preincubated at 25 °C for two weeks to restore soil microbial activity. After thorough mixing with dry straw, 41.7 g (in dry weight) of soil was weighed into for each replicate, and the soil water content was adjusted to 44.4% of the WHC.
The details of the three sets of experimental conditions are described below. The laboratory constant-temperature conditions were as follows. The soils were added to 100 mL bottles for each replicate. The bottles were covered with lids and placed in a refrigerator at +4 °C in the dark and were ventilated for 30 min every four days during the incubation period. The loss of soil moisture was replenished by adding deionized water gravimetrically. The sampling times were 0, 16, 32, 48, 96, 112, 128, and 144 days of incubation. The laboratory freeze–thaw conditions were as follows. The soils were added to 100 mL bottles for each replicate, and the bottles were covered with lids and stored in two refrigerators in the dark. The bottles were frozen at −18 °C for 72 h and then thawed at +4 °C for 24 h, which was one freeze–thaw cycle. The bottles were ventilated for 30 min every four days during the incubation period. The loss of soil moisture was replenished by adding deionized water gravimetrically, and the sampling times were 0, 16, 32, 48, 96, 112, 128, and 144 days of incubation. The field freeze–thaw conditions were as follows. The soils were added to PE net bags for each replicate. The net bags were made of size 300 mesh (300 holes within each inch of length) and were 15 cm × 10 cm. The mesh bags were tied with red PE rope and then buried in the field located at the National Field Observation and Shenyang Agroecosystem Station, Chinese Academy of Sciences, Liaoning Province, on 15 November. The burial depth was 0–15 cm, and a portion of the red rope was left unburied to mark the location of each sample. The field had no straw to return in autumn, and no fertilizer was applied in previous years. The sampling times were 15 and 30 November, 15 and 30 December, 1 and 15 March, and 1 and 15 April (since the soil was frozen in January and February and there was no freeze–thaw cycle, there was no sampling during that period). The changes in daily air temperature and soil temperature from November to April are shown in Figure S1.

2.3. Soil Sample Analyses

The MBC of the soil samples was determined via the chloroform fumigation–extraction method [25]. Briefly, 30 g of fresh soil was sampled in duplicate and incubated individually at 25 °C for 24 h under fumigated and unfumigated conditions. Once the chloroform was removed, 100 mL of 0.5 M K2SO4 was added for the extraction. Then, 2 mL of 0.067 M K2Cr2O7, 15 mL of mixed acid (18 M H2SO4:14.7 M H3PO4 = 2:1), and 70 mg of HgO were added to both aliquots, and the mixture was digested at 180 °C for 50 min. Superfluous K2Cr2O7 was titrated with 0.033 M FeSO4·7H2O [26]. The MBC level was calculated as the difference in organic C content between fumigated and nonfumigated soil extracts, with a correction factor (KEC) of 0.38 [27]. The content of organic carbon in the unfumigated samples was assumed to be the DOC content. The extract of DOC was a 1:2 ratio of soil: 0.5 M K2SO4 [28]. The soil organic carbon (SOC) content was determined via an Elementar Vario EL III element analyzer (Elementar Corporation, Langenselbold, Germany). The soil microbial entropy (qMB) was calculated as the percentage of MBC relative to SOC.
The general chemical properties were determined via the following methods: the available K was measured with 1 M ammonium acetate in a 1:10 suspension via the flame photometer method [29]; the available P was quantified with 0.5 M sodium bicarbonate in a 1:20 suspension via the Olsen method; the available N was determined with 1.8 M sodium hydroxide in a 1:5 suspension via the alkaline hydrolysis method; the soil pH was determined in a 1:2.5 soil–water suspension using an electrode pH meter [30]; and the total C and total N were measured with an Elementar Vario EL III element analyzer (Elementar Corporation, Germany).

2.4. Statistical Analysis

The data presented are the means of the three replicates and were analyzed via ANOVA following Duncan’s multiple comparisons at the 0.05 significance level. Linear regression was performed to explore the relationship between the MBC concentration and the DOC concentrate ion. Statistical analysis was performed with the SPSS 19.0 software package. Figures were generated using the Origin 2021 program.

3. Results

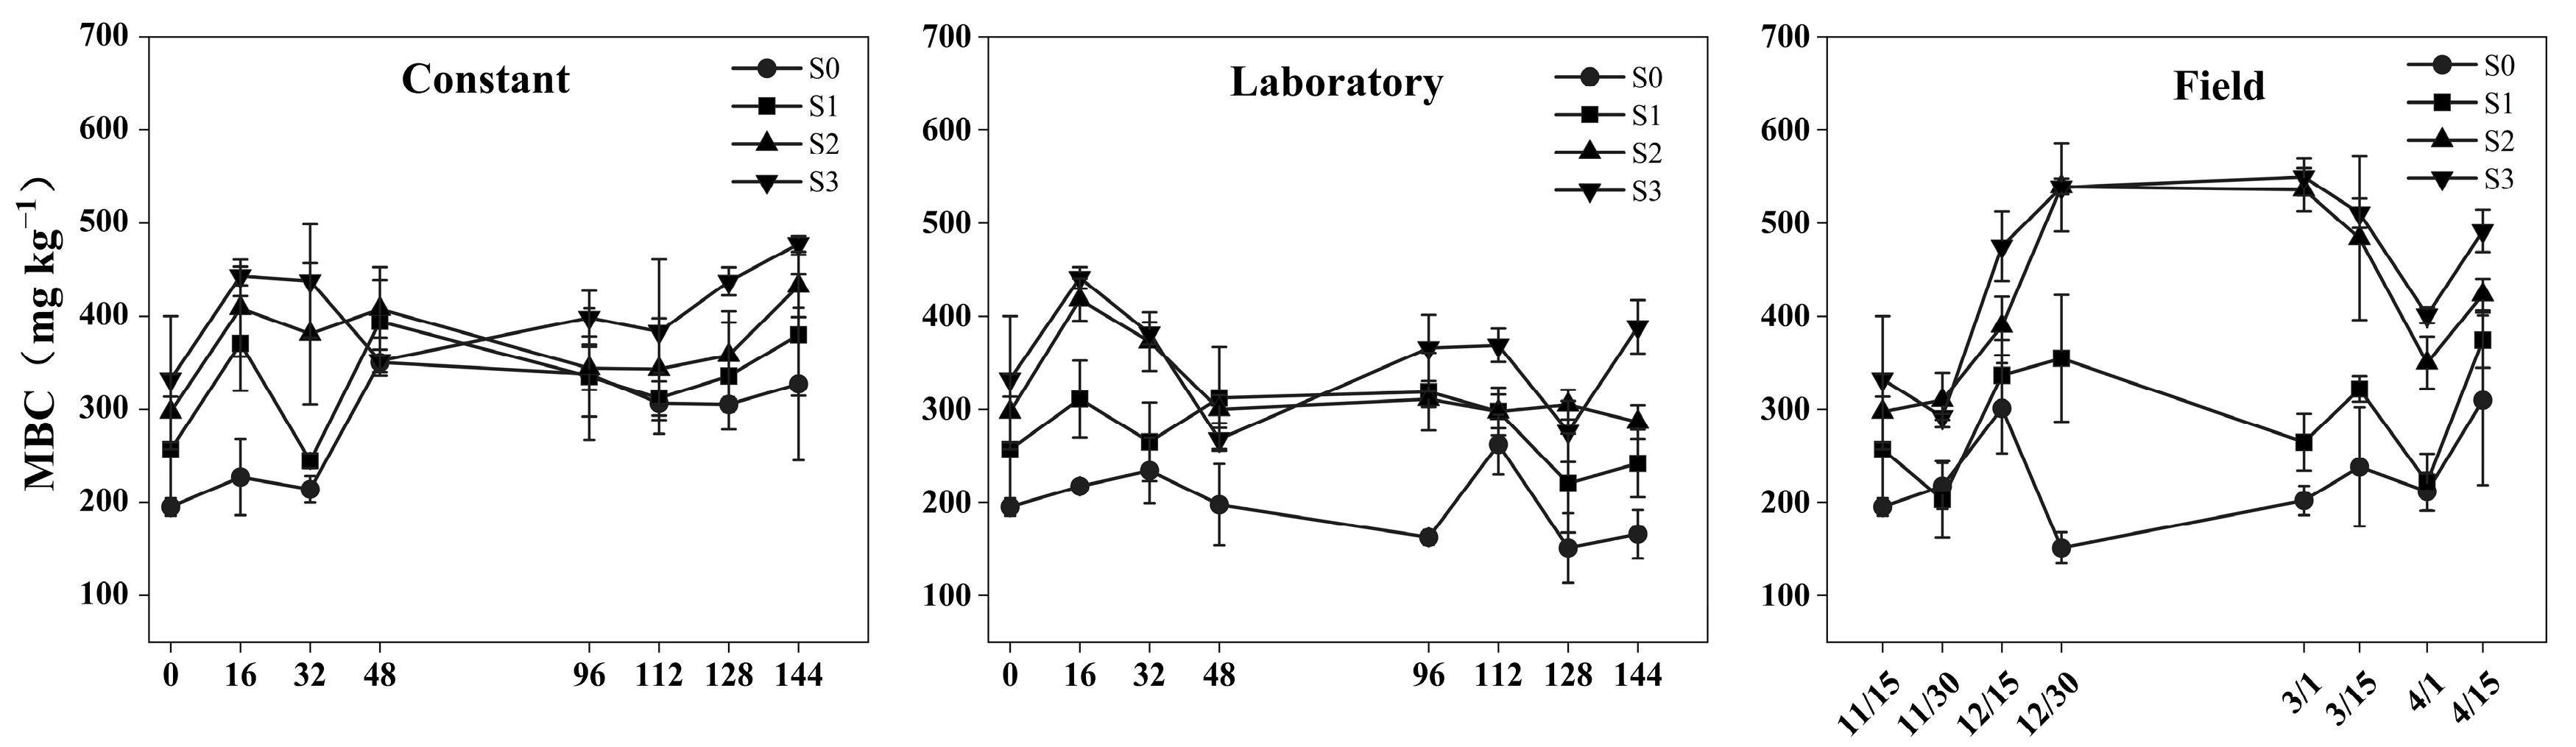
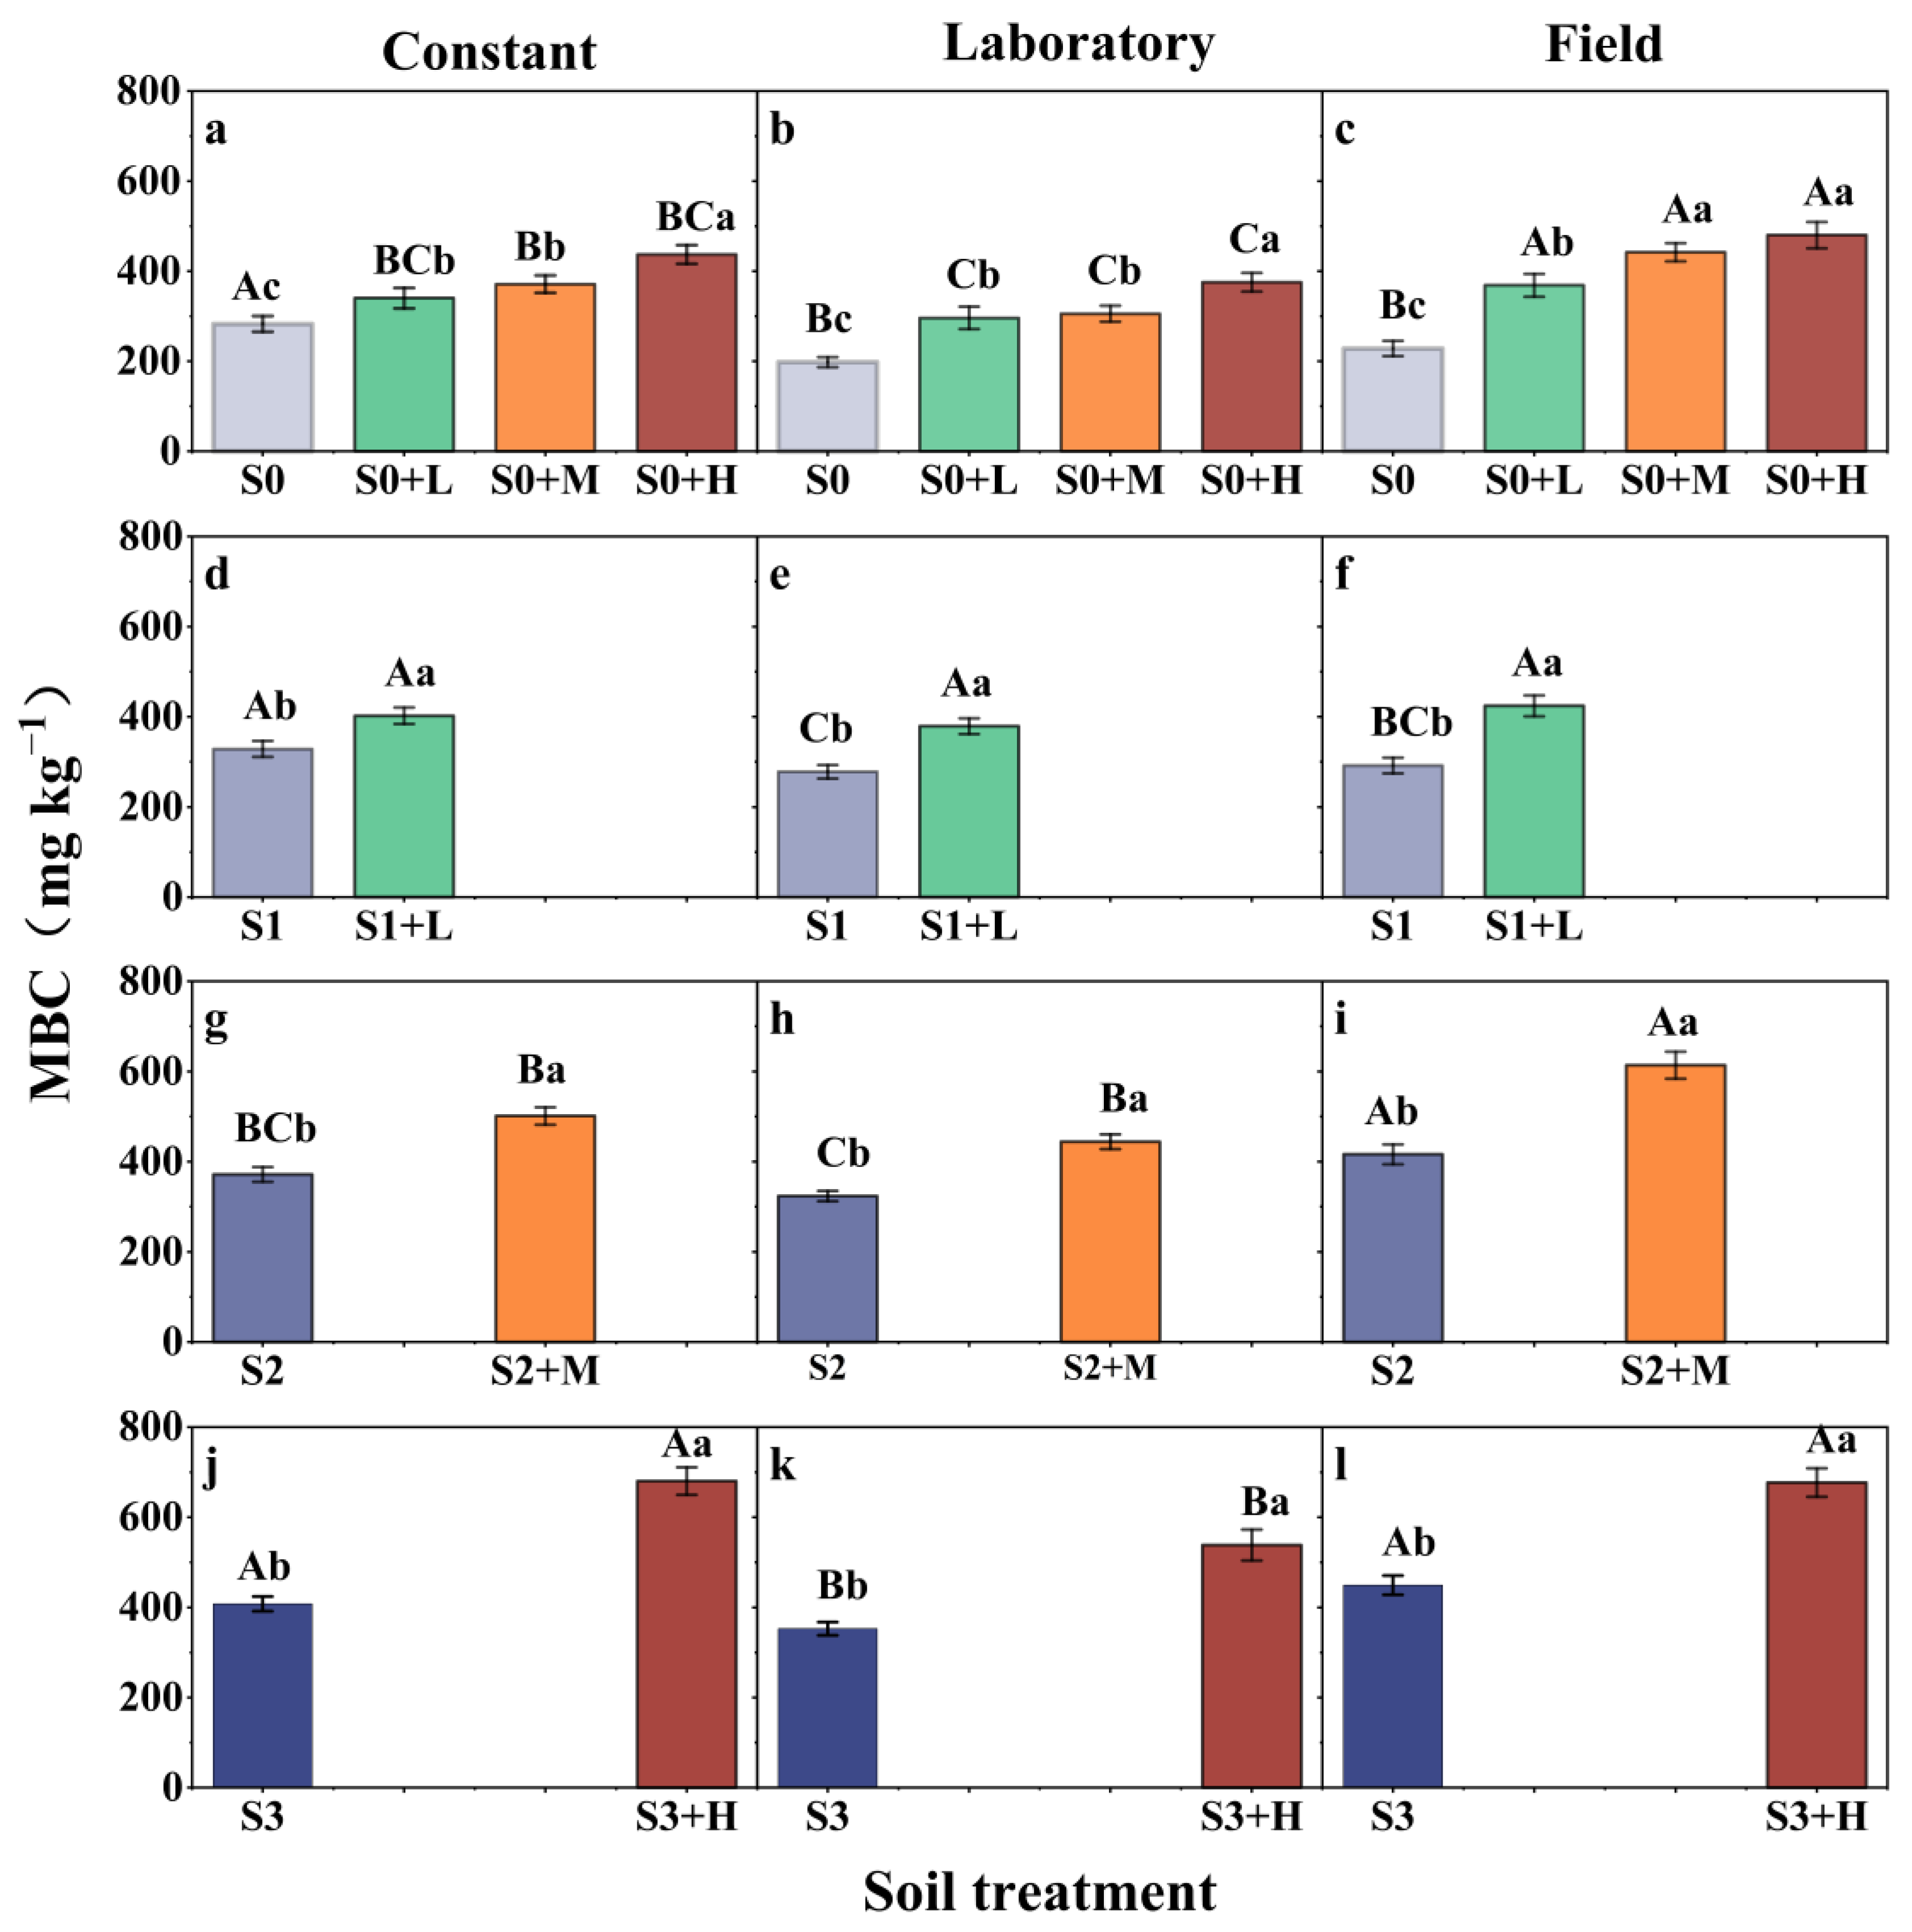
3.1. Changes in Soil MBC

The MBC concentration increased with the increasing straw application rate, although fluctuations in the MBC were observed during the freeze–thaw process (Figure 1). The changes in the MBC were more moderate at constant temperatures and under laboratory freeze–thaw conditions, whereas the fluctuations in the MBC were greater under field freeze–thaw conditions, indicating differences in the MBC under the different sets of freeze–thaw conditions. The average MBC concentration was lower in both the S0 and S1 treatments in the freeze–thaw treatment than in the constant-temperature treatment (S0: 283 mg kg−1 at a constant temperature > 228 mg kg−1 in the field freeze–thaw process > 198 mg kg−1 in the laboratory freeze–thaw process; S1: 328 mg kg−1 at a constant temperature > 291 mg kg−1 in the field freeze–thaw process > 278 mg kg−1 in the laboratory freeze–thaw process). The highest MBC was obtained in the S2 and S3 treatments under field freeze–thaw conditions compared with the other conditions (S2: 323 mg kg−1 under laboratory freeze–thaw conditions < 371 mg kg−1 at a constant temperature < 416 mg kg−1 under field freeze–thaw conditions; S3: 352 mg kg−1 under laboratory freeze–thaw conditions < 407 mg kg−1 at a constant temperature < 449 mg kg−1 under field freeze–thaw conditions).
Under laboratory freeze–thaw conditions, the mean decrements of MBC caused by the freeze–thaw process were mitigated by adding straw compared with that in the treatments without temporary straw addition (S0, S1, and S2) (Figure 2 and Figure S2). The mean decrements in MBC caused by freeze–thaw was 50.3%, 62.5%, and 12.4% lower in the S0, S1, and S2 soils, respectively, after temporary straw application than under con stant-temperature conditions. However, the mitigative effect of straw application on the decrements in MBC caused by freeze–thaw was not observed in the S3 soil. Under field freeze–thaw conditions, the average MBC was highest after temporary straw application except for that in the S3 + H treatment, compared with that under the other experimental conditions. This result suggested that the soils with no straw addition (S0) or with long-term straw return at low and medium rates (S1 and S2) were more sensitive to straw addition than that with long-term addition at a high rate (S3).
The mean increments in MBC caused by temporary straw application varied among the different soils and different experimental conditions (Figure 2). Under the constant-temperature conditions, the mean increment in MBC caused by straw addition was greater in the S1, S2, and S3 soils than in the S0 soil (20.2% in S0 + L < 22.4% in S1 + L, 31.2% in S0 + M < 34.9% in S2 + M, and 54.5% in S0 + H < 66.9% in S3 + H). However, the opposite occurred under freeze–thaw conditions (laboratory freeze–thaw conditions: 49.7% in S0 + L > 36.3% in S1 + L, 54.4% in S0 + M > 37.4% in S2 + M, and 89.7% in S0 + H > 52.7% in S3 + H; field freeze–thaw conditions: 61.7% in S0 + L > 45.4% in S1 + L, 93.8% in S0 + M > 47.5% in S2 + M, and 111% in S0 + H > 50.7% in S3 + H). These findings implied that straw return had different effects on soil microorganisms under different freeze–thaw conditions in northern or southern winter.
There was a difference in soil carbon use efficiency between the laboratory freeze–thaw conditions and the field freeze–thaw conditions. The soil microbial entropy (qMB) represents the efficiency with which soil microorganisms utilize substrate carbon [31]. Under constant-temperature conditions and field freeze–thaw conditions, the soil qMB increased, whereas it decreased under laboratory freeze–thaw conditions at the end of the cultivation, compared with that during the initial stages (Table 2). At the end of the incubation period, the qMB values were generally lower under the freeze–thaw conditions than under the constant-temperature conditions. The mean soil qMB was greater in S2 than in S0, S1, and S3 under the three sets of experimental conditions (Figure S3).

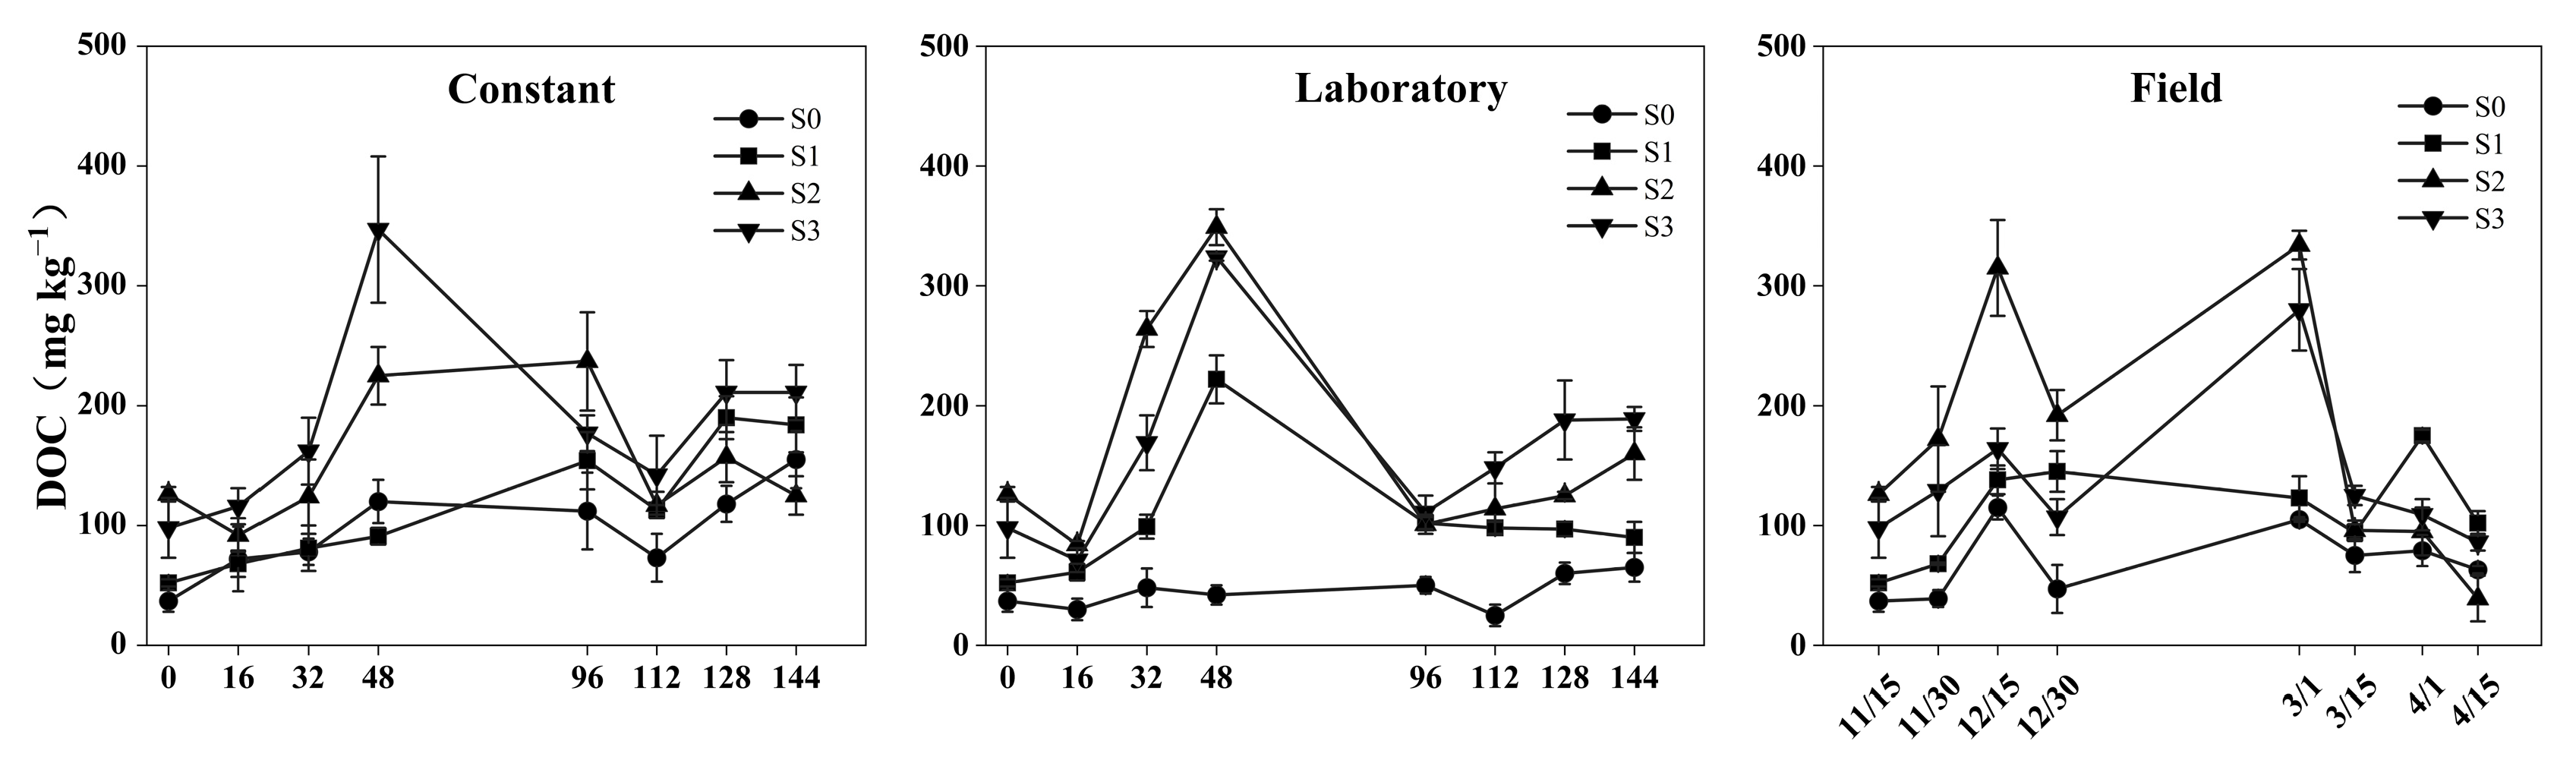
3.2. Changes in Soil DOC

The soil DOC concentrations fluctuated over the incubation period under the three experimental conditions (Figure 3). The mean of DOC was highest in the S3 treatment under constant-temperature conditions, while it was highest in the S2 treatment under the different freeze–thaw conditions.
In S0 and the corresponding straw addition treatments (S0 + L, S0 + M and S0 + H), the average DOC was highest under constant-temperature conditions, followed by that under field and laboratory freeze–thaw conditions (Figure 4a–c and Figure S4). However, under both sets of freeze–thaw conditions, no significant differences caused by freeze–thaw were detected in the soils with straw addition in the long term or in the corresponding treatments with temporary straw addition compared with those under constant-temperature conditions (Figure 4d–l and Figure S4). Under both sets of freeze–thaw conditions, the mean decrements in DOC caused by freeze–thaw in the treatments with straw addition for the first time (S0 + L, S0 + M, and S0 + H) was significantly greater than that in the corresponding treatments with long-term straw addition (S1 + L, S2 + M, S3 + H) (Figure 4 and Figure S5).
Under the three sets of experimental conditions, the average DOC was increased to varying degrees by temporary straw addition, except in the S2 treatment under field freeze–thaw conditions (Figure 4 and Figure S6). For the S0, S0 + L, S0 + M, and S0 + H treatments, under the both sets of freeze–thaw conditions, the percentage increase in DOC caused by temporary straw addition was significantly greater than that under constant-temperature conditions, especially under laboratory freeze–thaw conditions. Furthermore, the mean increment in DOC caused by straw addition was greater in the soil with first straw addition than that in the soils that received straw in the long term (S1, S2 and S3) under the three sets of experimental conditions.

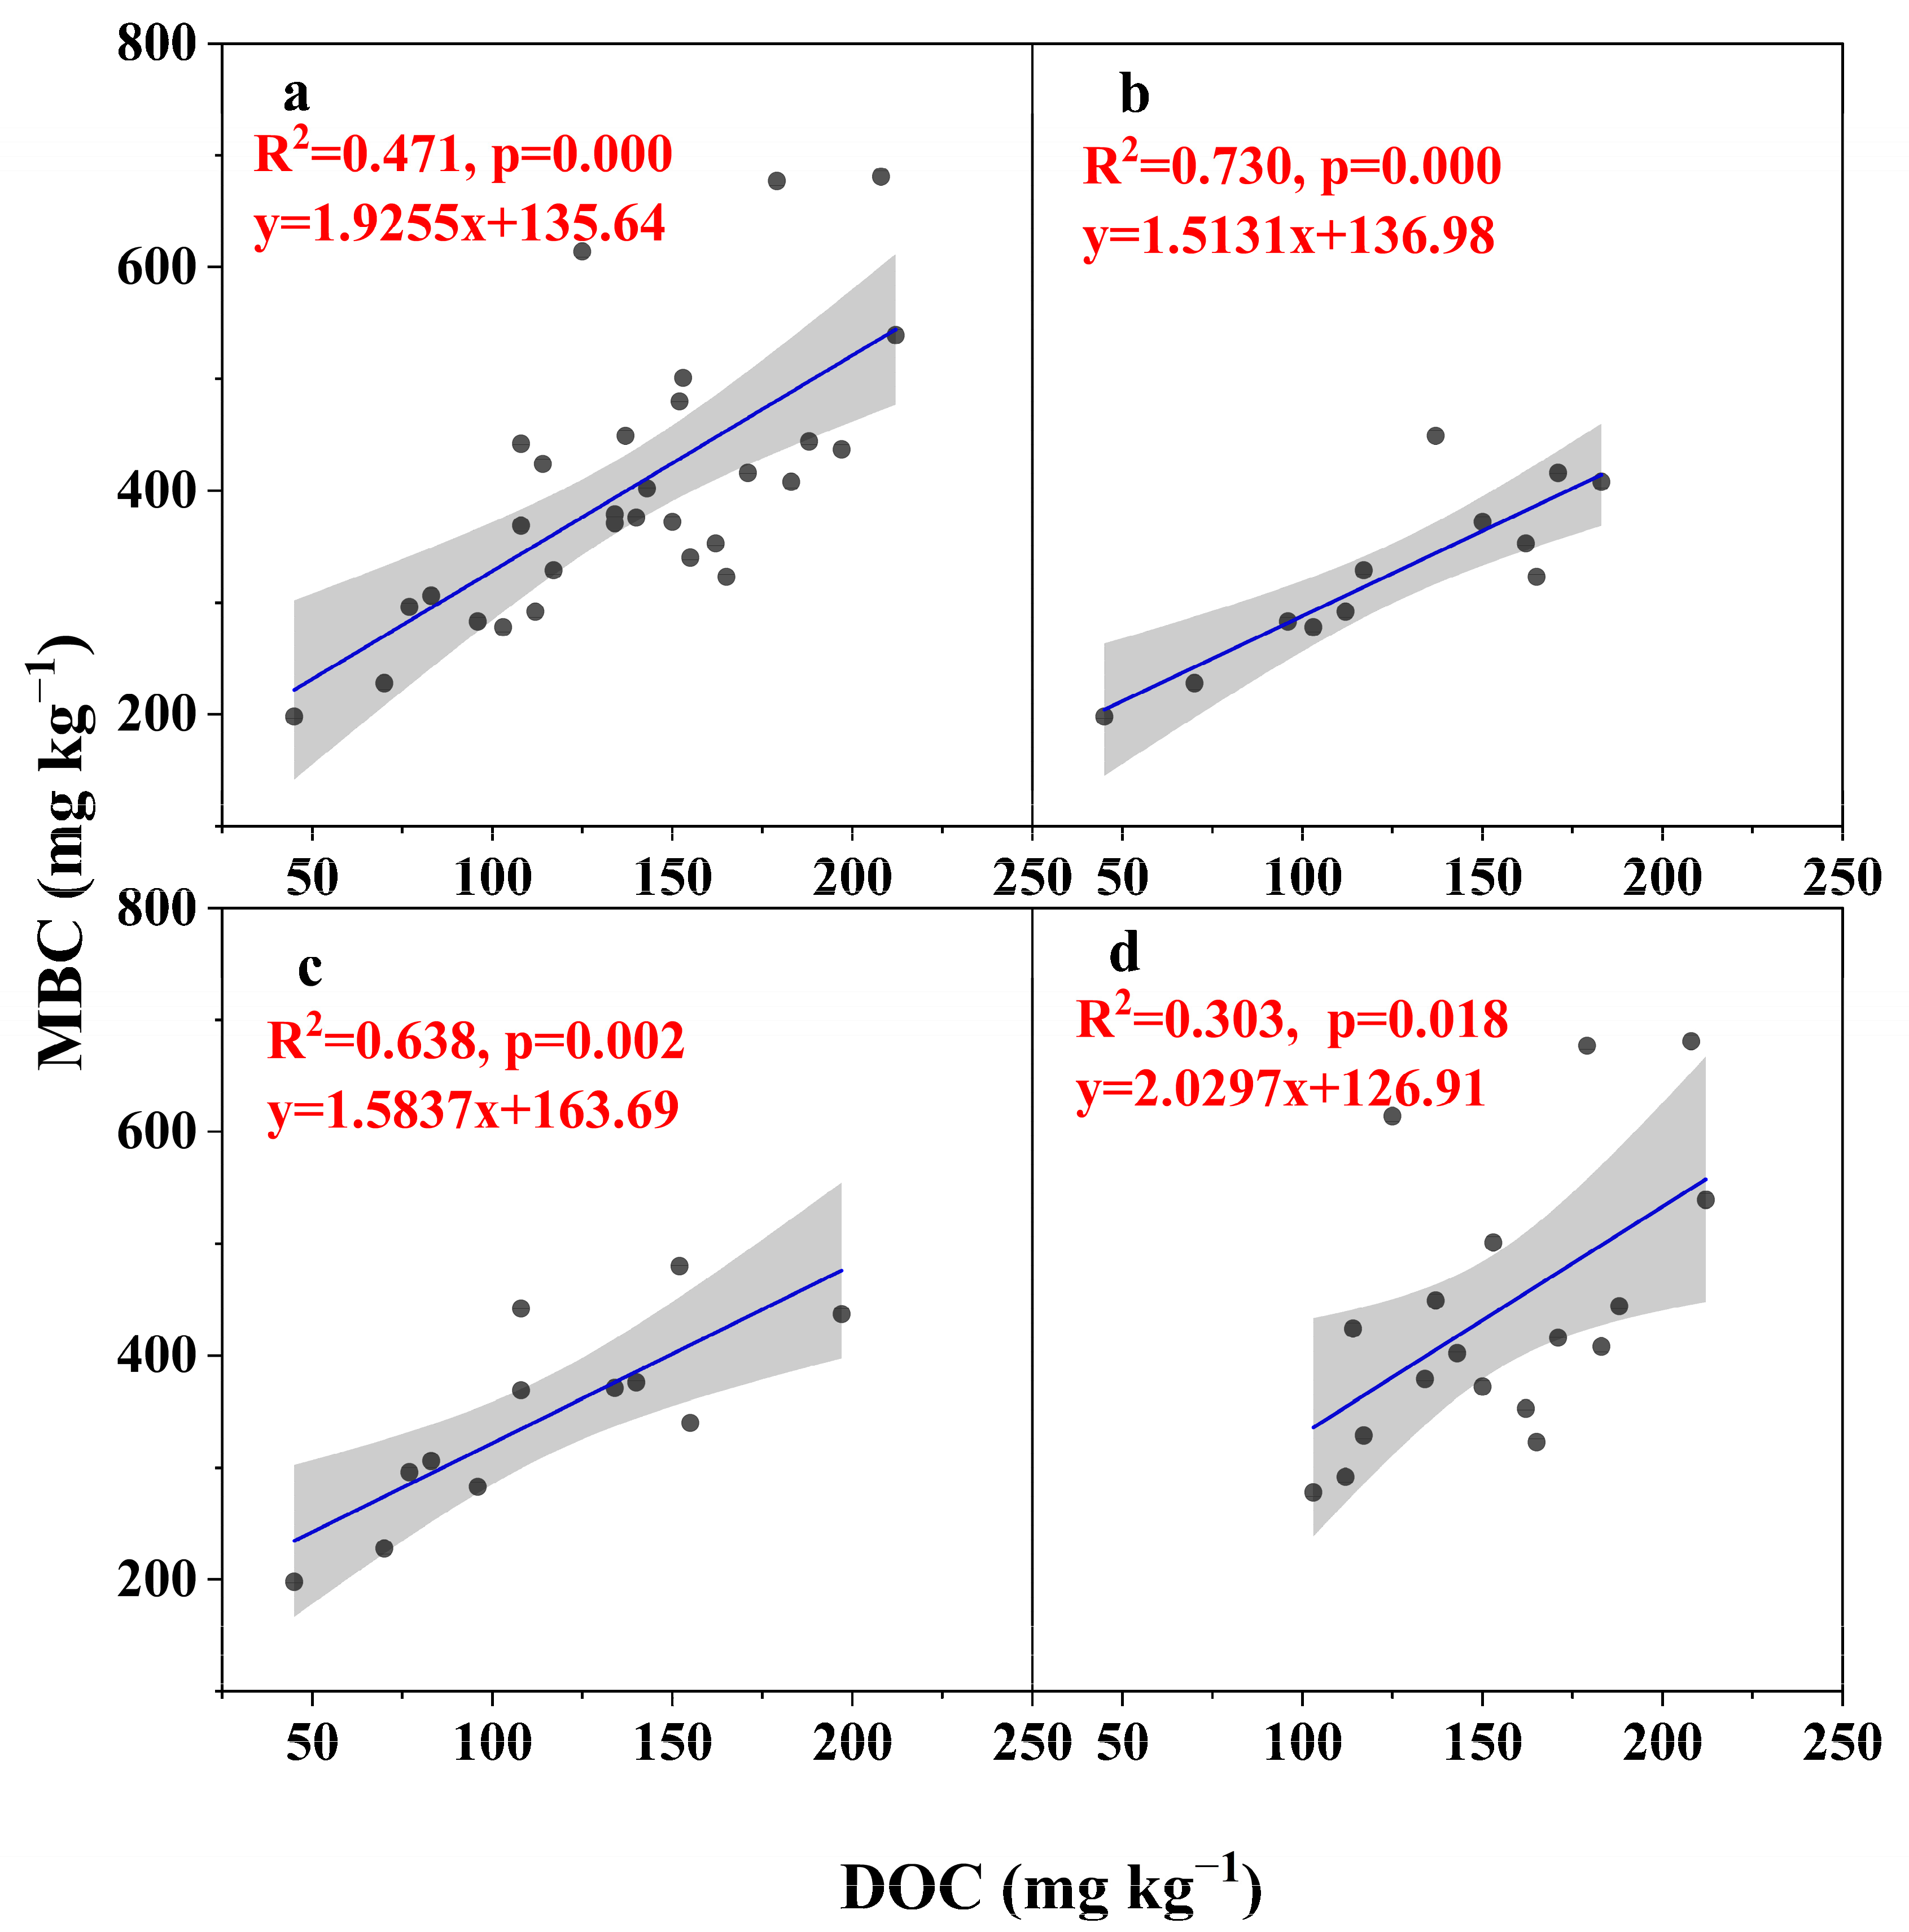
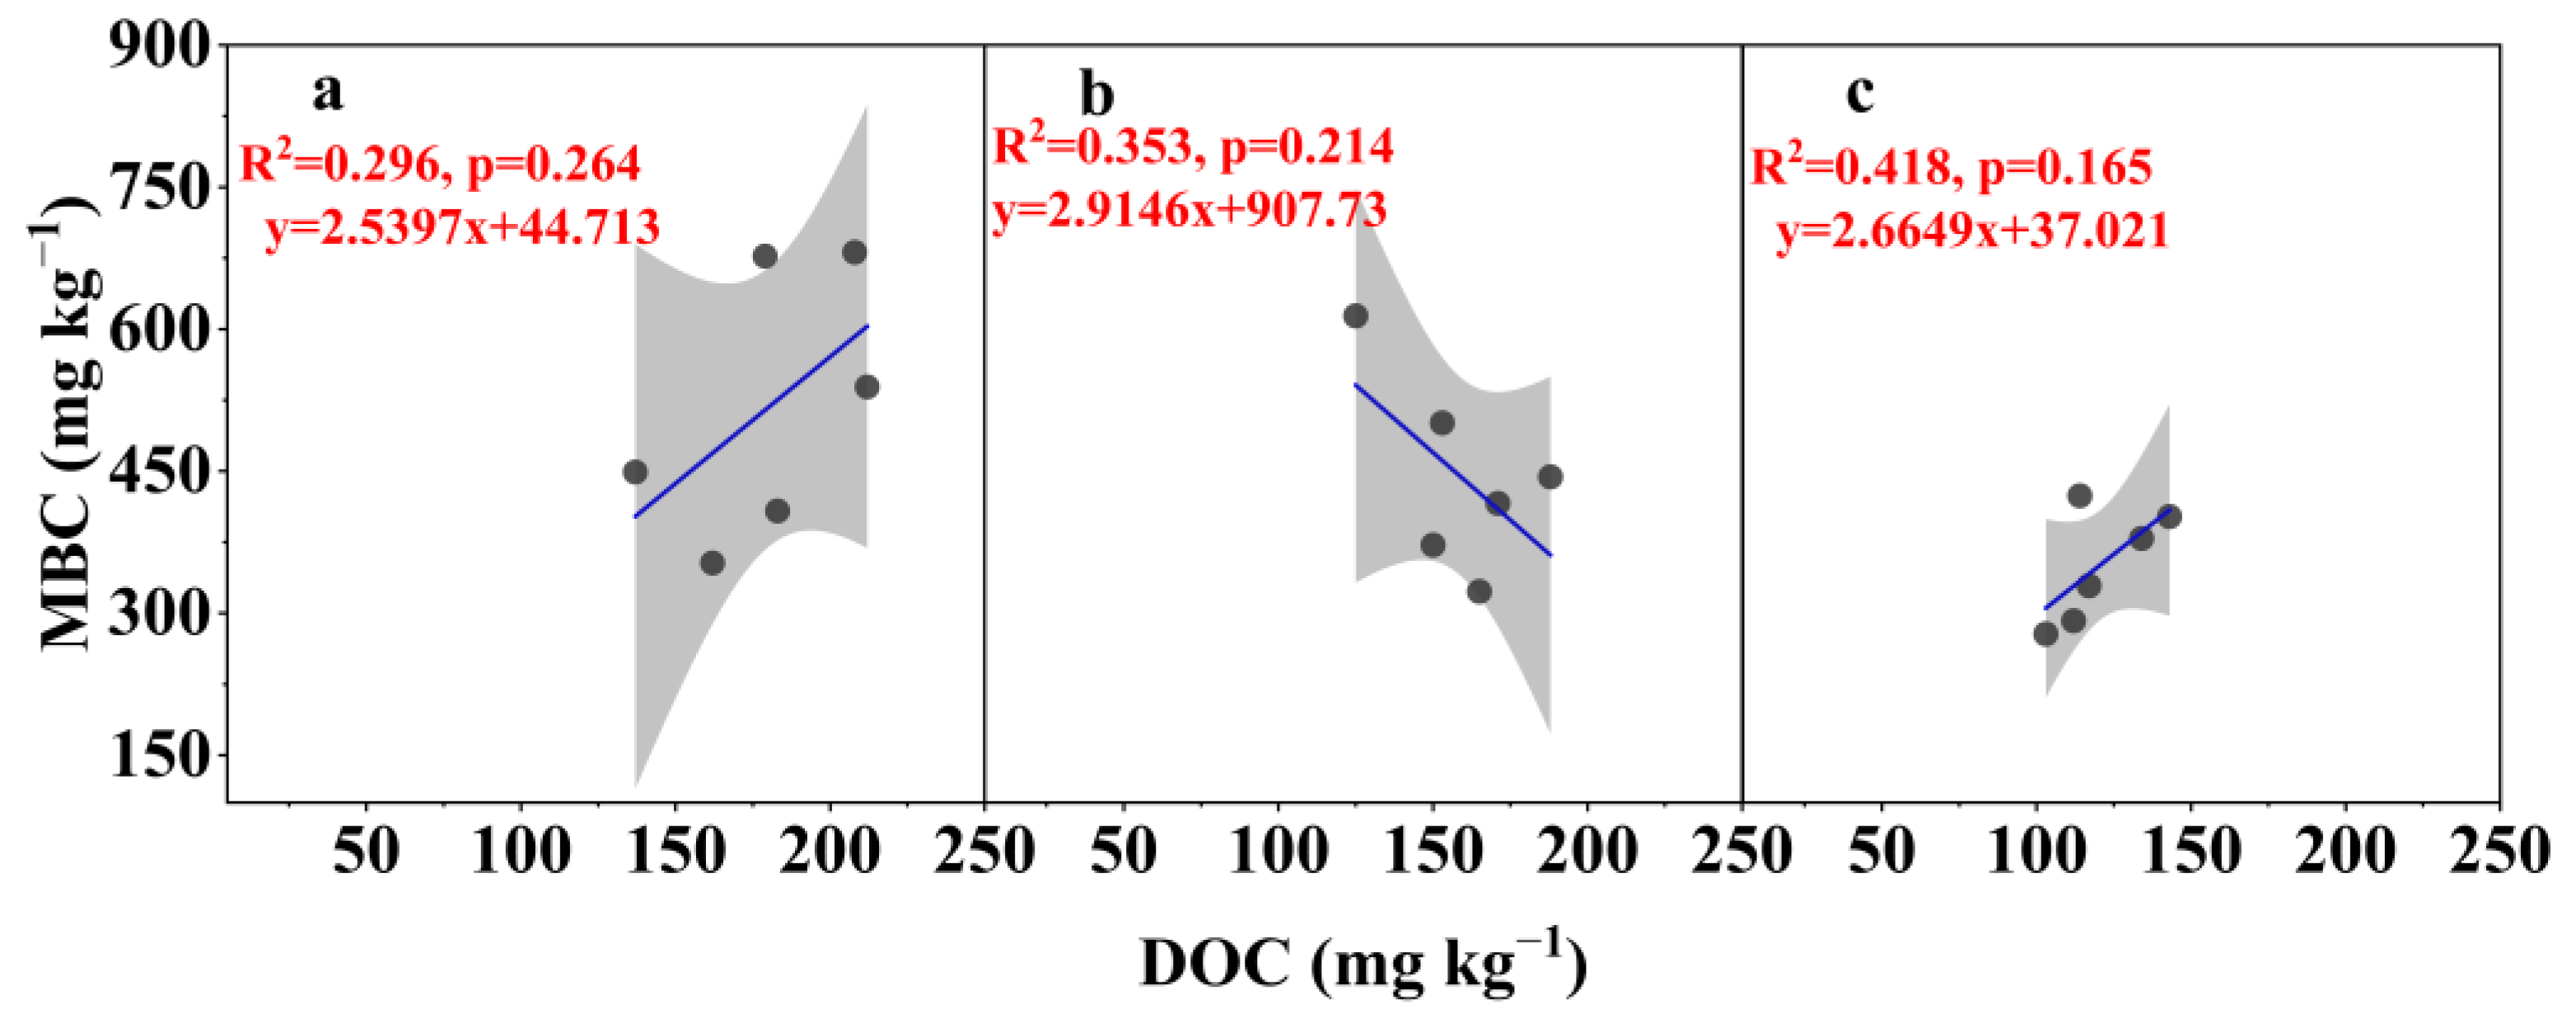
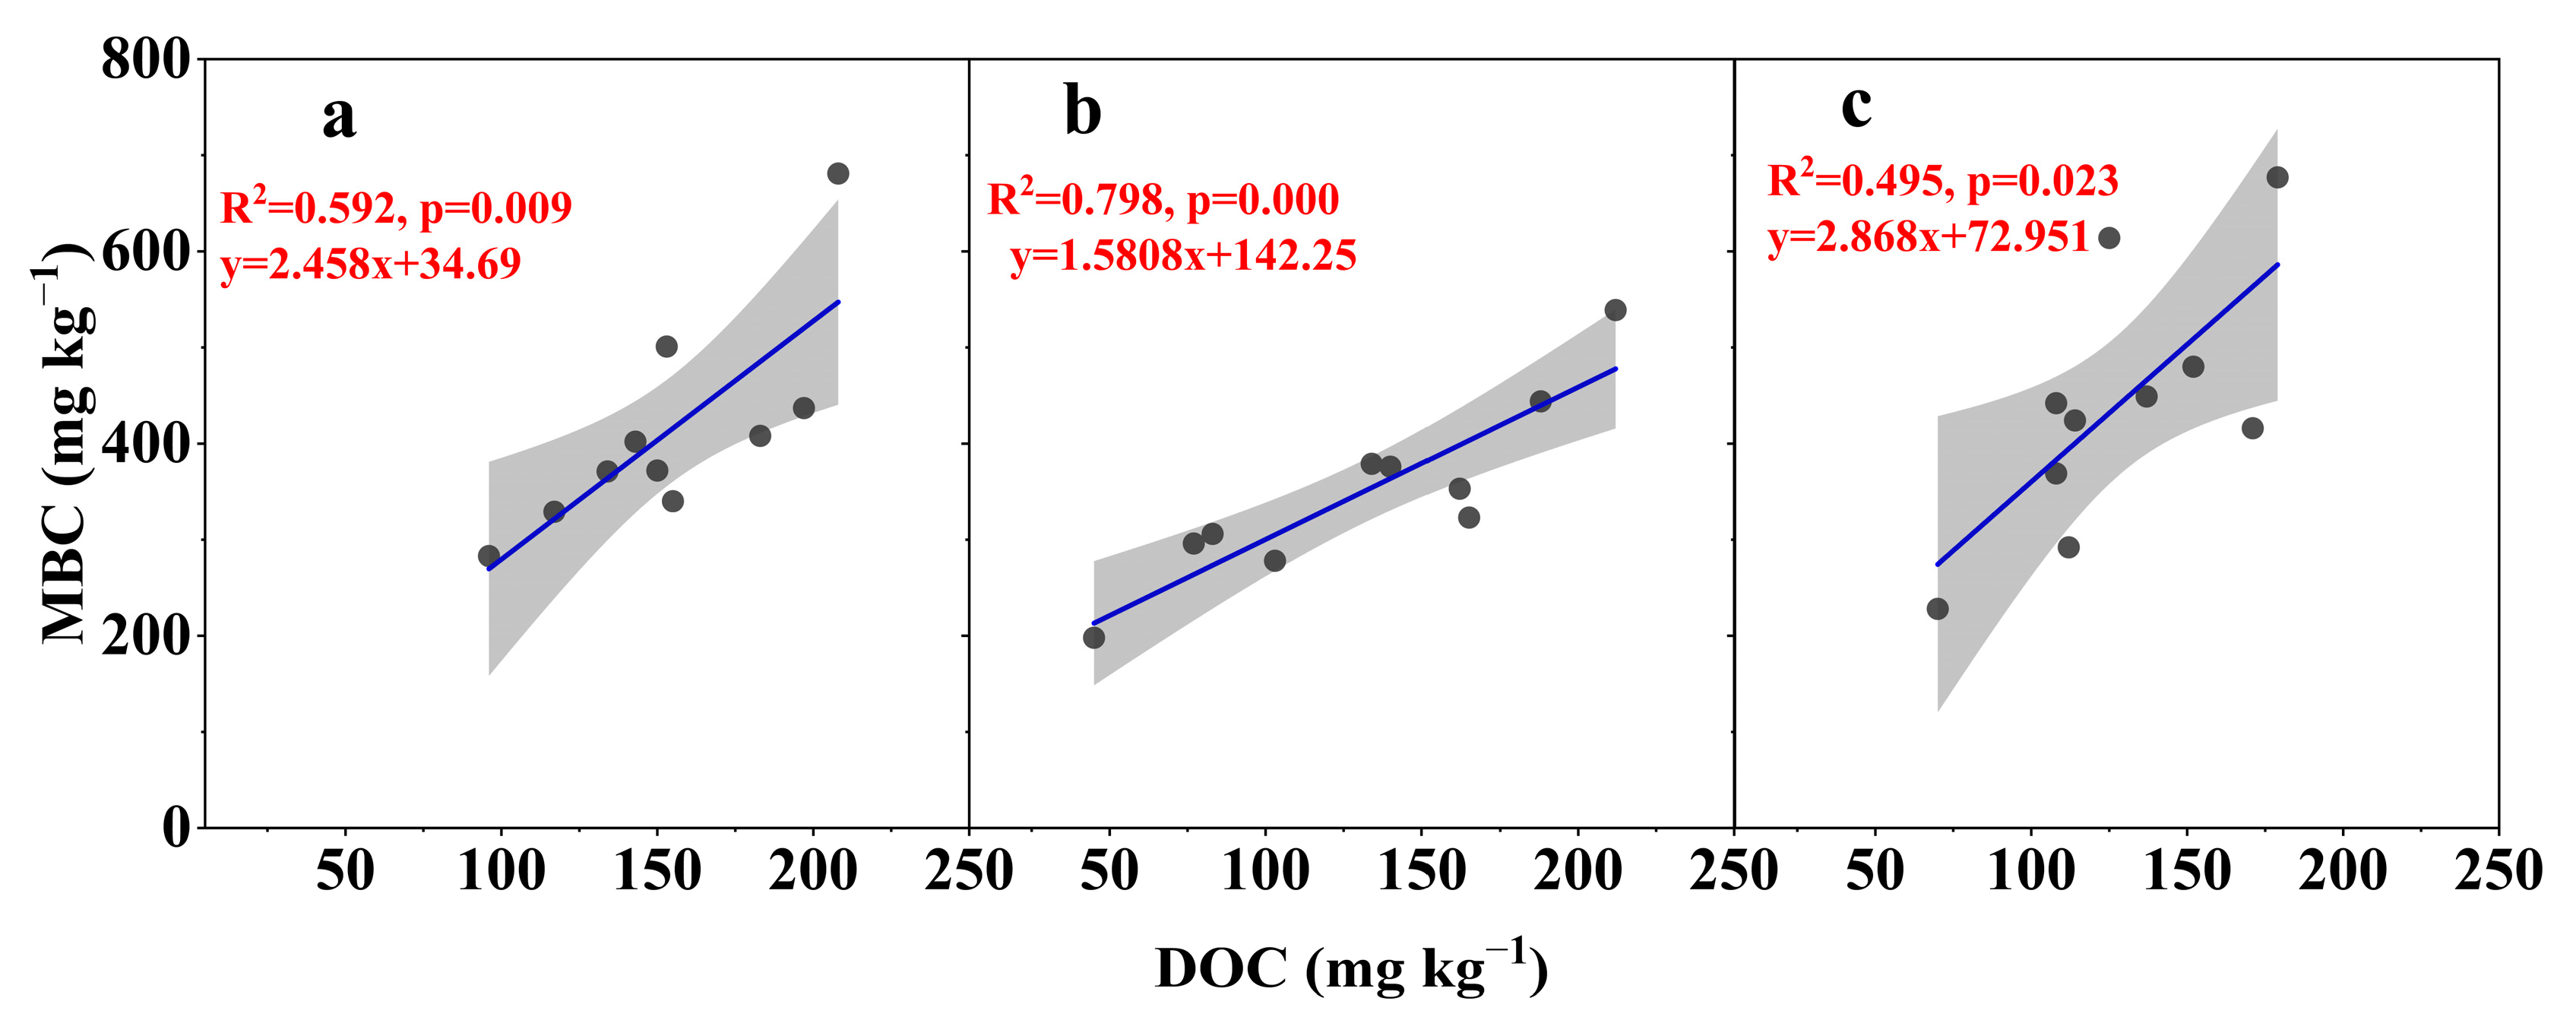
3.3. Relationship Between MBC and DOC

In general, a significantly positive correlation was observed between MBC and DOC (Figure 5a). The linear relationship between the soil MBC and DOC was the strongest across the treatments (S0, S1, S2, and S3) without the temporary addition of straw (Figure 5b). There was also a high correlation between MBC and DOC in the S0, S0 + L, S0 + M, and S0 + H treatments, in which straw was first added to the S0 soil (Figure 5c). However, the correlation between MBC and DOC was worse when straw was added to the soils over the long term (S1, S1 + L, S2, S2 + M, S3, and S3 + H) (Figure 5d). These findings illustrated that straw addition had a relatively small influence on the relationship between MBC and DOC in the higher fertility soils. Notably, a unique negative relationship addition was observed in the S2 and S2 + M treatments (Figure 6b).
The highest correlation between MBC and DOC was obtained under laboratory freeze–thaw conditions, followed by those under constant-temperature and field freeze–thaw conditions (Figure 7a–c). Moreover, the regression coefficient of MBC and DOC under field freeze–thaw conditions (2.87) was greater than that under constant-temperature condition (2.46) and laboratory freeze–thaw conditions (1.58).

4. Discussion

4.1. Effects of the Freeze–Thaw Process on the MBC and DOC

In the absence of temporary straw addition, the soil MBC in S0 was reduced by the freeze–thaw process (Figure 2a–c and Figure S5). Deluca et al. [32] have reported that in freeze–thaw simulations in the laboratory, more than half of all microorganisms are killed in the first freeze–thaw cycle because of poor adaptation. However, long-term straw return mitigates the reduction in MBC caused by the freeze–thaw process (S1, S2, and S3), especially under field freeze–thaw conditions (Figure 2g–l and Figure S5). Moreover, the adaptability of the microorganisms was found to be enhanced with an increasing number of freeze–thaw cycles [1], and 60 to 94% of the soil microorganisms survived following successive freeze–thaw cycles [12]. These findings indicate that improvements in soil fertility and nutrient conditions are beneficial for the microbial adaptation to the freeze–thaw process and subsequent recovery.
The effects of the freeze–thaw process on soil microorganisms differ under laboratory and field conditions. The average MBC under laboratory freeze–thaw conditions was lower than that under field freeze–thaw conditions (Figure 2), suggesting that the freeze–thaw process had a smaller effect on soil MBC under field conditions [33]. The minimum temperature under the laboratory freeze–thaw conditions was generally lower, and the temperature fluctuations were more drastic than those under the field conditions because of the insulation from snow [2]. Thus, the acclimation of soil microorganisms and the microbial capacity of the substrate community were greater under field conditions than under laboratory conditions [34], as evidenced by the lower DOC in the relatively high fertility treatments (S1 + L, S2 + M, S3, and S3 + H) under the field conditions (Figure 4f,i,l). Furthermore, the temperature increased during the later period of the field freeze–thaw experiment, and there was no obvious freeze–thaw process during this stage. This period was included in the study because it was also a part of the agricultural leisure period in Northeast China. Some effects of the freeze–thaw process on microorganisms can be simulated under the laboratory conditions, although there is a thawing process between the freeze–thaw process and the plant growing season under field conditions [13]. This was an important difference between the simulated freeze–thaw process in the laboratory and the actual freeze–thaw process in field, and thus hypothesis (i) was partially supported.
The average DOC was generally greater in S0 under the constant-temperature condition than that under the freeze–thaw conditions (Figure 4a–c), indicating a decrease in soil carbon availability caused by the freeze–thaw process. Some researchers have reported that the freeze–thaw process decreases the DOC concentrations [35]. However, others have reported that the freeze–thaw process increases the amount of DOC via its release from dead microbial cells and the physical disruption of soil aggregates during the freezing period [8]. The difference between the results of the previous and the present studies might be due to two aspects. On the one hand, the number of freeze–thaw cycles in previous studies was less than that in our experiment. Initially, the DOC content generally increased with the number of freeze–thaw cycles [36], but as the number of freeze–thaw cycles increased further, the substrate carbon was utilized by surviving microorganisms with the increase in freeze–thaw cycles [37]. Moreover, the amount of DOC released from the aggregates gradually decreased as the number of freeze–thaw cycles increased [38]. In addition, microbial death was mitigated by the microorganisms adapted to the freeze–thaw process as the number of freeze–thaw cycles increased, reducing the release of small-molecule sugars and amino acids [39]. Therefore, the DOC content tended to decrease as the number of freeze–thaw cycles increased [40]. Another reason might be differences in soil fertility [41]. In this study, the mean decrement of DOC caused by freeze–thaw was alleviated by long-term straw returned, and even the average DOC in S2 caused by freeze–thaw increased (Figure 4d–l and Figure S5). This might be the reason why the soil microorganisms exhibited strong adaptability and recovery ability after the freeze–thaw process in the soil with long-term straw addition.
The relationship between the soil MBC and DOC was interactive. The decomposition of organic matter by microorganisms and the dead microorganisms increases the DOC content [42]. Moreover, microbial reproduction is associated with high soil DOC use [7]. Therefore, the DOC content is influenced by the balance between microbial utilization and organic matter mineralization [43]. This study revealed that the soil MBC was responsive to the soil fertility level [44]. The order of the microbial utilization efficiency of DOC was generally consistent with the qMB results under different experimental conditions (Figure 7a–c and Figure S3). These findings implied that under the laboratory freeze–thaw conditions, microorganisms were most affected by freeze–thaw cycles and that microbial activity was most dependent on DOC (R2 = 0.8) [13].
Research on freeze–thaw processes in farmland ecosystems often focuses on soil microorganisms, labile organic carbon, and the corresponding response to nutrient management measures such as straw addition [45]. Consequently, the effects on soil fertility and agricultural production in subsequent years can be determined. The agricultural leisure period in winter in Northeast China includes not only an obvious freezing period and a freeze–thaw period, but also a thawing period in which the temperature gradually increases in spring. The changes in the soil carbon pool during this agricultural leisure period might affect plant growth during the subsequent growing season and should not be ignored [46]. It was difficult to determine the changes in freeze–thaw in soil microbial activity and organic carbon availability during the agricultural leisure period based on the laboratory freeze–thaw condition.

4.2. Effects of Straw Addition on MBC and DOC Under Different Experimental Conditions

In general, temporary straw addition mitigated the reduction in MBC caused by the freeze–thaw process, except for the S3 treatment under laboratory freeze–thaw conditions (Figure 2 and Figure S6). First, energy and nutrient inputs with straw addition increased both the soil carbon pool and microbial activity [18], resulting in a lower decrease or even an increase in MBC under freeze–thaw conditions. Second, some researchers have shown that straw addition inhibits the reductions in soil temperature [47], which might be a reason for the relatively high MBC resulting from the temporary straw addition under freeze–thaw conditions. Third, the soil MBC is related to the stability of soil aggregates, as the preservation of soil aggregates on microbial carbon [48] and straw addition are favorable for soil aggregate stability [49]. However, the high application rate of straw to S3 soil did not exhibit the expected enhancing effect on MBC under freeze–thaw conditions in the present study. This was primarily due to the high MBC under the constant-temperature conditions in S3, as the control treatment characterized by high fertility, induced by long-term straw return at a high rate, showed low sensitivity of soil response to temporary straw addition [50]. These findings indicate that the straw addition substantially mitigated the decrease in microbial activity caused by the freeze–thaw process, with the exception of high fertility soil due to long-term straw addition at a high rate, and these results were generally in line with hypothesis (ii).
The response of MBC to straw addition also varied under different experimental conditions. Under constant-temperature conditions, the mean increment in MBC caused by temporary straw addition in S0 was less than that in S1, S2, and S3, but the opposite was true under freeze–thaw conditions (Figure 2 and Figure S6). These findings indicate that straw return is important for the recovery of microbial activity under freeze–thaw conditions, especially in low-fertility soils [51]. The microorganisms in low-fertility soil are in a starvation state and more sensitive to straw addition, so the microbial activity increases after straw addition, especially under freeze–thaw conditions [52]. These results imply that soil microbial activity in the winter in southern China, similar to that observed under the constant-temperature conditions in this study, is affected mainly by the soil fertility level, whereas in northern China, where there is an obvious freeze–thaw process, microbial activity is more affected by temporary nutrient management, such as straw addition, especially in low-fertility soils [53]. Therefore, straw addition schemes should pay more attention to prevent intense biological processes from affecting the crop yield in the northern China, especially for the soil with early-stage straw addition.
The soil DOC content generally increased with increasing straw application rate [23]. A negative correlation between MBC and DOC in this study was found in the S2 and S2 + M treatments (Figure 6b), suggesting that the microbial activity was promoted after adding straw at a moderate rate and that a large amount of DOC was utilized by microorganisms [22]. However, the reduction in DOC could not be covered by straw addition at a medium application rate under field freeze–thaw conditions. For the low and high straw addition rates, the DOC was relatively high, possibly due to incomplete utilization by microorganisms and the improvement in soil fertility, respectively, implying a threshold effect for straw addition [54]. Straw application at the medium rate not only improved microbial activity and C utilization efficiency, but also decreased organic carbon availability, consequently decreasing the possibility of C loss. Therefore, the medium straw return (8 t/ha) on the Liaohe Plain is appropriate.

5. Conclusions

In the present study, the freeze–thaw process and straw addition significantly affect soil labile organic carbon. The effects of the freeze–thaw process on soil MBC are smaller in the field than in the laboratory, partially supporting hypothesis (i). The soil MBC in S0 was reduced by an average of 24.6% due to the freeze–thaw process, but in S1 (13.3%), S2 (0.50%), and S3 (1.63%), the reduction was mitigated. Furthermore, the temporary straw addition also mitigated the reduction in MBC caused by the freeze–thaw process. Straw return is important for the recovery of microbial activity under freeze–thaw conditions, especially in low-fertility soil. These results are generally in agreement with hypothesis (ii), except for the high fertility soil because of its low sensitivity to straw addition. On the other hand, the DOC content was generally decreased, which was caused by the freeze–thaw process (−22.8%~+53.3%). Straw application at the medium rate (8 t/ha) on the Liaohe Plain not only improved microbial activity, but also decreased organic carbon availability, consequently decreasing the C loss risk. In northern China, where there is an obvious freeze–thaw phenomenon, nutrient management involving the addition of straw during the first few years of treatment should be investigated, alleviating the reduction in soil nutrient availability caused by straw return. Although the effects of freeze–thaw cycles on soil labile organic carbon were investigated under laboratory freeze–thaw conditions and field freeze–thaw conditions, further research could be conducted to explore additional microbial indicators and the relationships between soil microorganisms and the soil carbon pool.

Supplementary Materials

The following supporting information can be downloaded at: https://www.mdpi.com/article/10.3390/agronomy15020479/s1. Figure S1: Daily minimum and maximum air temperatures, soil temperatures at 15 cm depth under the field condition. Figure S2: Dynamics of microbial biomass carbon (MBC) contents in different soil treatments. Figure S3: The average ratios of soil microbial biomass carbon to soil organic carbon in different soils based on sampling eight times. Figure S4: Dynamics of dissolved organic carbon (DOC) contents in different soil treatments. Figure S5: Mean decrement of MBC and DOC concentrations caused by freeze–thaw based on sampling eight times. Figure S6. Mean increment of MBC and DOC concentrations caused by straw addition based on sampling eight times.

Author Contributions

Conceptualization, S.L., Q.M. and W.Y.; methodology, M.Z. and S.L.; software, M.Z., Z.X. and Y.G.; validation, M.Z., S.L., Z.X. and Q.M.; formal analysis, M.Z., Y.G. and S.L.; investigation, M.Z., C.Z. and X.Z.; resources, S.A. and X.J.; data curation, M.Z., Z.X., C.Z., Y.G., X.Z., S.A. and X.J.; writing—original draft preparation, M.Z. and Q.M.; writing—review and editing, M.Z., Q.M., C.Z., S.A. and W.Y.; visualization, M.Z., Z.X., X.Z. and X.J.; supervision, S.L. and Q.M.; project administration, Q.M. and W.Y; funding acquisition, Q.M. and W.Y. All authors have read and agreed to the published version of the manuscript.

Funding

This research was financially supported by the National Key Research and Development Program of China, grant number 2023YFD1501200; Strategic Priority Research Program of the Chinese Academy of Sciences, grant number XDA28090100; National Natural Science Foundation of China, grant numbers 42277333 and 42477382 and Application Foundation Research Project of Liaoning Province, grant number 2022JH2/101300194.

Data Availability Statement

The original contributions presented in the study are included in the article/Supplementary Materials; further inquiries can be directed to the corresponding author.

Conflicts of Interest

The authors declare no conflicts of interest.

References

  1. Larsen, K.S.; Jonasson, S.; Michelsen, A. Repeated Freeze–Thaw Cycles and Their Effects on Biological Processes in Two Arctic Ecosystem Types. Appl. Soil Ecol. 2002, 21, 187–195. [Google Scholar] [CrossRef]
  2. Watanabe, T.; Tateno, R.; Imada, S.; Fukuzawa, K.; Isobe, K.; Urakawa, R.; Oda, T.; Hosokawa, N.; Sasai, T.; Inagaki, Y.; et al. The Effect of a Freeze–Thaw Cycle on Dissolved Nitrogen Dynamics and Its Relation to Dissolved Organic Matter and Soil Microbial Biomass in the Soil of a Northern Hardwood Forest. Biogeochemistry 2019, 142, 319–338. [Google Scholar] [CrossRef]
  3. Li, S.; Zhang, S.; Pu, Y.; Li, T.; Xu, X.; Jia, Y.; Deng, O.; Gong, G. Dynamics of Soil Labile Organic Carbon Fractions and C-Cycle Enzyme Activities under Straw Mulch in Chengdu Plain. Soil Tillage Res. 2016, 155, 289–297. [Google Scholar] [CrossRef]
  4. Zhang, J.B.; Song, C.C.; Yang, W.Y. Land Use Effects on the Distribution of Labile Organic Carbon Fractions through Soil Profiles. Soil Sci. Soc. Am. J. 2006, 70, 660–667. [Google Scholar]
  5. Silveira, M.L.A. Dissolved Organic Carbon and Bioavailability of N and P as Indicators of Soil Quality. Sci. Agric. 2005, 62, 502–508. [Google Scholar] [CrossRef]
  6. McGILL, W.B.; Cannon, K.R.; Robertson, J.A.; Cook, F.D. Dynamics of Soil Microbial Biomass and Water-Soluble Organic C in Breton L after 50 Years of Cropping to Two Rotations. Can. J. Soil Sci. 1986, 66, 1–19. [Google Scholar] [CrossRef]
  7. Marschner, B.; Bredow, A. Temperature Effects on Release and Ecologically Relevant Properties of Dissolved Organic Carbon in Sterilised and Biologically Active Soil Samples. Soil Biol. Biochem. 2002, 34, 459–466. [Google Scholar] [CrossRef]
  8. Deng, Y.; Li, X.; Shi, F.; Zhang, Y. Divergent Controlling Factors of Freeze–Thaw-Induced Changes in Dissolved Organic Carbon and Microbial Biomass Carbon between Topsoil and Subsoil of Cold Alpine Grasslands. CATENA 2024, 241, 108063. [Google Scholar] [CrossRef]
  9. Christensen, S.; Tiedje, J.M. Brief and Vigorous N2O Production by Soil at Spring Thaw. J. Soil Sci. 1990, 41, 1–4. [Google Scholar] [CrossRef]
  10. Suutari, M.; Laakso, S. Microbial Fatty Acids and Thermal Adaptation. Crit. Rev. Microbiol. 1994, 20, 285–328. [Google Scholar] [CrossRef]
  11. Herrmann, A.; Witter, E. Sources of C and N Contributing to the Flush in Mineralization upon Freeze–Thaw Cycles in Soils. Soil Biol. Biochem. 2002, 34, 1495–1505. [Google Scholar] [CrossRef]
  12. Yanai, Y.; Toyota, K.; Okazaki, M. Effects of Successive Soil Freeze-Thaw Cycles on Soil Microbial Biomass and Organic Matter Decomposition Potential of Soils. Soil Sci. Plant Nutr. 2004, 50, 821–829. [Google Scholar] [CrossRef]
  13. Song, Y.; Zou, Y.; Wang, G.; Yu, X. Altered Soil Carbon and Nitrogen Cycles Due to the Freeze-Thaw Effect: A Meta-Analysis. Soil Biol. Biochem. 2017, 109, 35–49. [Google Scholar] [CrossRef]
  14. Gao, Y.; Zeng, X.; Xie, Q.; Ma, X. Release of Carbon and Nitrogen from Alpine Soils During Thawing Periods in the Eastern Qinghai-Tibet Plateau. Water Air Soil Pollut. 2015, 226, 209. [Google Scholar] [CrossRef]
  15. Henry, H.A.L. Soil Freeze–Thaw Cycle Experiments: Trends, Methodological Weaknesses and Suggested Improvements. Soil Biol. Biochem. 2007, 39, 977–986. [Google Scholar] [CrossRef]
  16. Perez-Mon, C.; Frey, B.; Frossard, A. Functional and Structural Responses of Arctic and Alpine Soil Prokaryotic and Fungal Communities under Freeze-Thaw Cycles of Different Frequencies. Front. Microbiol. 2020, 11, 982. [Google Scholar] [CrossRef] [PubMed]
  17. Grogan, P.; Michelsen, A.; Ambus, P.; Jonasson, S. Freeze–Thaw Regime Effects on Carbon and Nitrogen Dynamics in Sub-Arctic Heath Tundra Mesocosms. Soil Biol. Biochem. 2004, 36, 641–654. [Google Scholar] [CrossRef]
  18. Seitz, S.; Goebes, P.; Puerta, V.L.; Pereira, E.I.P.; Wittwer, R.; Six, J.; Van Der Heijden, M.G.A.; Scholten, T. Conservation Tillage and Organic Farming Reduce Soil Erosion. Agron. Sustain. Dev. 2019, 39, 4. [Google Scholar] [CrossRef]
  19. Liu, C.; Si, B.; Zhao, Y.; Wu, Z.; Lu, X.; Chen, X.; Han, X.; Zhu, Y.; Zou, W. Drivers of Soil Quality and Maize Yield under Long-Term Tillage and Straw Incorporation in Mollisols. Soil Tillage Res. 2025, 246, 106360. [Google Scholar] [CrossRef]
  20. Ekwunife, K.C.; Madramootoo, C.A.; Abbasi, N.A. Assessing the Impacts of Tillage, Cover Crops, Nitrification, and Urease Inhibitors on Nitrous Oxide Emissions over Winter and Early Spring. Biol. Fertil. Soils 2022, 58, 195–206. [Google Scholar] [CrossRef]
  21. Hao, X.; Han, X.; Wang, S.; Li, L.-J. Dynamics and Composition of Soil Organic Carbon in Response to 15 Years of Straw Return in a Mollisol. Soil Tillage Res. 2022, 215, 105221. [Google Scholar] [CrossRef]
  22. Li, S.; Cui, Y.; Xia, Z.; Zhang, X.; Zhu, M.; Gao, Y.; An, S.; Yu, W.; Ma, Q. The Mechanism of the Dose Effect of Straw on Soil Respiration: Evidence from Enzymatic Stoichiometry and Functional Genes. Soil Biol. Biochem. 2022, 168, 108636. [Google Scholar] [CrossRef]
  23. Zhang, X.; Ren, X.; Cai, L. Effects of Different Straw Incorporation Amounts on Soil Organic Carbon, Microbial Biomass, and Enzyme Activities in Dry-Crop Farmland. Sustainability 2024, 16, 10588. [Google Scholar] [CrossRef]
  24. Xiao, D. Alfisols and Closely Related Soils in China. Chin. Geogr. Sci. 1992, 2, 18–29. [Google Scholar] [CrossRef]
  25. Vance, E.D.; Brookes, P.C.; Jenkinson, D.S. An Extraction Method for Measuring Soil Microbial Biomass C. Soil Biol. Biochem. 1987, 19, 703–707. [Google Scholar] [CrossRef]
  26. Zhou, H.; Yu, W.; Ma, Q.; Zhang, L. A modified Fumigation Extraction Method for the Determination of Soil Microbial Biomass Carbon. Chin. J. Soil Sci. 2009, 1, 0154-4. [Google Scholar]
  27. Ocio, J.A.; Brookes, P.C. An Evaluation of Methods for Measuring the Microbial Biomass in Soils Following Recent Additions of Wheat Straw and the Characterization of the Biomass That Develops. Soil Biol. Biochem. 1990, 22, 685–694. [Google Scholar] [CrossRef]
  28. Lin, Q.; Wu, Y.; Liu, H. Improvement on the fumigation method for determining soil microbial biomass carbon. Ecol. Mag. 1999, 2, 64–67. [Google Scholar]
  29. Guo, A.; Zhao, Z.; Zhang, P.; Yang, Q.; Li, Y.; Wang, G. Linkage between Soil Nutrient and Microbial Characteristic in an Opencast Mine, China. Sci. Total Environ. 2019, 671, 905–913. [Google Scholar] [CrossRef] [PubMed]
  30. Lu, R. Chemical Analysis Method of Agricultural Soil; China Agricultural Science and Technology Press: Beijing, China, 2000. [Google Scholar]
  31. Sparling, G. Ratio of Microbial Biomass Carbon to Soil Organic Carbon as a Sensitive Indicator of Changes in Soil Organic Matter. Soil Res. 1992, 30, 195. [Google Scholar] [CrossRef]
  32. DeLuca, T.H.; Keeney, D.R.; McCarty, G.W. Effect of Freeze-Thaw Events on Mineralization of Soil Nitrogen. Biol. Fertil. Soils 1992, 14, 116–120. [Google Scholar] [CrossRef]
  33. Gao, D.; Bai, E.; Yang, Y.; Zong, S.; Hagedorn, F. A Global Meta-Analysis on Freeze-Thaw Effects on Soil Carbon and Phosphorus Cycling. Soil Biol. Biochem. 2021, 159, 108283. [Google Scholar] [CrossRef]
  34. Schmidt, S.K.; Lipson, D.A. Microbial Growth under the Snow: Implications for Nutrient and Allelochemical Availability in Temperate Soils. Plant Soil 2004, 259, 1–7. [Google Scholar] [CrossRef]
  35. Patel, K.F.; Tatariw, C.; MacRae, J.D.; Ohno, T.; Nelson, S.J.; Fernandez, I.J. Repeated Freeze–Thaw Cycles Increase Extractable, but Not Total, Carbon and Nitrogen in a Maine Coniferous Soil. Geoderma 2021, 402, 115353. [Google Scholar] [CrossRef]
  36. Yu, X.; Zou, Y.; Jiang, M.; Lu, X.; Wang, G. Response of Soil Constituents to Freeze–Thaw Cycles in Wetland Soil Solution. Soil Biol. Biochem. 2011, 43, 1308–1320. [Google Scholar] [CrossRef]
  37. Wu, Y.-P.; Hu, X. Soil Open Pore Structure Regulates Soil Organic Carbon Fractions of Soil Aggregates under Simulated Freeze-Thaw Cycles as Determined by X-Ray Computed Tomography. J. Soil Sci. Plant Nutr. 2024, 24, 5235–5248. [Google Scholar] [CrossRef]
  38. Xue, P.; Fu, Q.; Li, T.; Liu, D.; Hou, R.; Li, Q.; Li, M.; Meng, F. Effects of Biochar and Straw Application on the Soil Structure and Water-Holding and Gas Transport Capacities in Seasonally Frozen Soil Areas. J. Environ. Manag. 2022, 301, 113943. [Google Scholar] [CrossRef]
  39. Schimel, P.; Clein, J.S. Microbial response to freeze-thaw cycles in tundra and taiga soils. Soil Biol. Biochem. 1996, 28, 1061–1066. [Google Scholar] [CrossRef]
  40. Kim, Y.J.; Kim, J.; Jung, J.Y. Responses of Dissolved Organic Carbon to Freeze–Thaw Cycles Associated with the Changes in Microbial Activity and Soil Structure. Cryosphere 2023, 17, 3101–3114. [Google Scholar] [CrossRef]
  41. Lei, K.; Dai, W.; Wang, J.; Li, Z.; Cheng, Y.; Jiang, Y.; Yin, W.; Wang, X.; Song, X.; Tang, Q. Biochar and Straw Amendments over a Decade Divergently Alter Soil Organic Carbon Accumulation Pathways. Agronomy 2024, 14, 2176. [Google Scholar] [CrossRef]
  42. Wang, F.; Bettany, J. Influence of Freeze-Thaw and Flooding on the Loss of Soluble Organic-Carbon and Carbon-Dioxide from Soil. J. Environ. Qual. 1993, 22, 709–714. [Google Scholar] [CrossRef]
  43. Batista, É.R.; Franco, A.D.J.; Silva, A.P.V.D.; Silva, J.A.G.F.D.; Tavares, D.S.; Souza, J.K.D.; Silva, A.O.; Barbosa, M.V.; Santos, J.V.D.; Carneiro, M.A.C. Organic Substrate Availability and Enzyme Activity Affect Microbial-Controlled Carbon Dynamics in Areas Disturbed by a Mining Dam Failure. Appl. Soil Ecol. 2022, 169, 104169. [Google Scholar] [CrossRef]
  44. Liu, M.; Lin, H.; Li, J. Are There Links between Nutrient Inputs and the Response of Microbial Carbon Use Efficiency or Soil Organic Carbon? A Meta-Analysis. Soil Biol. Biochem. 2025, 201, 109656. [Google Scholar] [CrossRef]
  45. Zhang, H.; Tang, J.; Liang, S.; Li, Z.; Wang, J.; Wang, S. Early Thawing after Snow Removal and No Straw Mulching Accelerates Organic Carbon Cycling in a Paddy Soil in Northeast China. J. Environ. Manag. 2018, 209, 336–345. [Google Scholar] [CrossRef] [PubMed]
  46. Urakawa, R.; Shibata, H.; Kuroiwa, M.; Inagaki, Y.; Tateno, R.; Hishi, T.; Fukuzawa, K.; Hirai, K.; Toda, H.; Oyanagi, N.; et al. Effects of Freeze–Thaw Cycles Resulting from Winter Climate Change on Soil Nitrogen Cycling in Ten Temperate Forest Ecosystems throughout the Japanese Archipelago. Soil Biol. Biochem. 2014, 74, 82–94. [Google Scholar] [CrossRef]
  47. Hou, R.; Li, T.; Fu, Q.; Liu, D.; Li, M.; Zhou, Z.; Li, Q.; Zhao, H.; Yu, P.; Yan, J. Effects of Biochar and Straw on Greenhouse Gas Emission and Its Response Mechanism in Seasonally Frozen Farmland Ecosystems. CATENA 2020, 194, 104735. [Google Scholar] [CrossRef]
  48. Glaser, B.; Lehmann, J.; Zech, W. Ameliorating Physical and Chemical Properties of Highly Weathered Soils in the Tropics with Charcoal—A Review. Biol. Fertil. Soils 2002, 35, 219–230. [Google Scholar] [CrossRef]
  49. He, Z.; Hou, R.; Fu, Q.; Li, T.; Zhang, S.; Su, A. Evolution Mechanism of Soil Hydrothermal Parameters under Freeze-Thaw Cycles: Regulatory Significance of Straw and Biochar. J. Clean Prod. 2023, 385, 135787. [Google Scholar] [CrossRef]
  50. Berhane, M.; Xu, M.; Liang, Z.; Shi, J.; Wei, G.; Tian, X. Effects of Long-term Straw Return on Soil Organic Carbon Storage and Sequestration Rate in North China Upland Crops: A Meta-analysis. Glob. Change Biol. 2020, 26, 2686–2701. [Google Scholar] [CrossRef]
  51. Zhu, L.; Hu, N.; Zhang, Z.; Xu, J.; Tao, B.; Meng, Y. Short-Term Responses of Soil Organic Carbon and Carbon Pool Management Index to Different Annual Straw Return Rates in a Rice–Wheat Cropping System. CATENA 2015, 135, 283–289. [Google Scholar] [CrossRef]
  52. Liu, M.; Zhang, Z.; He, P.; Zhang, Y.; Li, L.-J. Changes in Soil Microbial Community and Carbon Use Efficiency in Freeze-Thaw Period Restored after Growth Season under Warming and Straw Return. Appl. Soil Ecol. 2025, 205, 105779. [Google Scholar] [CrossRef]
  53. Puissant, J.; Cécillon, L.; Mills, R.T.E.; Robroek, B.J.M.; Gavazov, K.; De Danieli, S.; Spiegelberger, T.; Buttler, A.; Brun, J.-J. Seasonal Influence of Climate Manipulation on Microbial Community Structure and Function in Mountain Soils. Soil Biol. Biochem. 2015, 80, 296–305. [Google Scholar] [CrossRef]
  54. Fang, Y.; Singh, B.P.; Collins, D.; Li, B.; Zhu, J.; Tavakkoli, E. Nutrient Supply Enhanced Wheat Residue-Carbon Mineralization, Microbial Growth, and Microbial Carbon-Use Efficiency When Residues Were Supplied at High Rate in Contrasting Soils. Soil Biol. Biochem. 2018, 126, 168–178. [Google Scholar] [CrossRef]
Figure 1. Dynamics of microbial biomass carbon (MBC) contents in different soils during incubation. Vertical bars represent standard error of the means (n = 3). Constant, Laboratory and Field are experimental conditions in the study.
Agronomy 15 00479 g001
Figure 2. Statistical differences in MBC concentrations in soil solutions (Experimental condition × Soil treatment, mean ± standard error, n = 24). (ac) Average MBC concentrations based on eight samplings in treatments S0, S0 + L, S0 + M, and S0 + H under the three experimental conditions. (df) Average MBC concentrations based on eight samplings in treatments S1 and S1 + L under the three experimental conditions. (gi) Average MBC concentrations based on eight samplings in treatments S2 and S2 + M under the three experimental conditions. (jl) Average MBC concentrations based on eight samplings in treatments S3 and S3 + H under the three experimental conditions. Values with the same capital letters within the same soil treatment are not significantly different at p = 0.05. Values with the same small letters within the same experimental condition are not significantly different at p = 0.05.
Agronomy 15 00479 g002
Figure 3. Dynamics of dissolved organic carbon (DOC) contents in different soils during incubation. Vertical bars represent standard error of the means (n = 3).
Agronomy 15 00479 g003
Figure 4. Statistical differences in DOC concentrations in soil solutions (Experimental condition × Soil treatment, mean ± standard error, n = 24). (ac) Average DOC concentrations based on eight samplings in treatments S0, S0 + L, S0 + M, and S0 + H under the three experimental conditions. (df) Average DOC concentrations based on eight samplings in treatments S1 and S1 + L under the three experimental conditions. (gi) Average DOC concentrations based on eight samplings in treatments S2 and S2 + M under the three experimental conditions. (jl) Average DOC concentrations based on eight samplings in treatments S3 and S3 + H under the three experimental conditions. Values with the same capital letters within the same soil treatment are not significantly different at p = 0.05. Values with the same small letters within the same experimental condition are not significantly different at p = 0.05.
Agronomy 15 00479 g004
Figure 5. Linear regression analysis to show the change in soil MBC along with DOC. (a) Regression analysis of MBC and DOC. (b) Regression analysis of MBC and DOC for the treatments without returning temporary straw (S0, S1, S2, and S3). (c) Regression analysis of MBC and DOC for S0 and S0 + straw (S0, S0 + L, S0 + M, and S0 + H). (d) Regression analysis of MBC and DOC for S1, S1 + L, S2, S0 + M, S3, and S3 + H. The solid line represents the regression line, and the shaded area shows the confidence intervals. The inset numbers represent the R2 and p values from linear regressions.
Agronomy 15 00479 g005
Figure 6. Linear regression analysis to show the change in soil MBC along with DOC. (a) Regression analysis of MBC and DOC for S1 and S1 + L. (b) Regression analysis of MBC and DOC for S2 and S2 + M. (c) Regression analysis of MBC and DOC for S3 and S3 + H.
Agronomy 15 00479 g006
Figure 7. Linear regression analysis to show the change in soil MBC along with DOC. (a) Regression analysis of MBC and DOC under constant temperature conditions. (b) Regression analysis of MBC and DOC under laboratory freeze–thaw conditions. (c) Regression analysis of MBC and DOC under field freeze–thaw conditions.
Agronomy 15 00479 g007
Table 1. Soil chemical properties for tested soils.
SoilTotal C
(g kg−1)
Total N
(g kg−1)
Available P
(mg kg−1)
Available K
(mg kg−1)
Available N
(mg kg−1)
pH
S011.721.037.4798.099.76.78
S114.181.195.371051046.81
S215.941.335.051201146.84
S317.721.465.001271266.90
Table 2. The ratios of microbial biomass carbon to soil organic carbon in different soils.
Freeze–Thaw
Treatment
Induction
Days
S0S1S2S3
Constant01.67 a1.81 a1.87 a1.88 a
161.91 a2.70 a2.61 a2.52 a
321.81 a1.77 a2.44 a2.49 a
482.97 a2.83 a2.60 a1.97 a
962.78 a2.44 a2.19 a2.27 a
1122.56 a2.22 a2.23 a2.18 a
1282.57 a2.37 a2.33 a2.53 a
1442.79 a2.76 a2.76 a2.71 a
Laboratory01.67 ab1.81 a1.87 b1.88 bc
161.81 ab2.15 a2.58 a2.49 a
321.96 ab1.83 a2.28 ab2.14 ab
481.64 ab2.22 a1.85 b1.50 c
961.36 b2.26 a1.92 b2.04 ab
1122.25 a2.10 a1.80 b2.02 ab
1281.28 b1.56 a1.85 b1.53 c
1441.41 b1.73 a1.80 b2.15 ab
Field01.67 ab1.81 bc1.87 c1.88 c
161.79 ab1.44 c1.93 c1.65 c
322.48 ab2.36 ab2.40 bc2.72 ab
481.28 b2.51 ab3.33 a3.04 a
961.66 ab1.91 bc3.35 a3.06 a
1122.03 ab2.34 ab3.06 ab2.90 ab
1281.81 ab1.63 c2.23 bc2.28 bc
1442.63 a2.73 a2.67 bc2.86 ab
The same letter indicates no significant difference incubation days in the same experimental conditions and the same soil (p < 0.05).
Disclaimer/Publisher’s Note: The statements, opinions and data contained in all publications are solely those of the individual author(s) and contributor(s) and not of MDPI and/or the editor(s). MDPI and/or the editor(s) disclaim responsibility for any injury to people or property resulting from any ideas, methods, instructions or products referred to in the content.

