Article

Effects of Biostimulant Foliar Applications on Morphological Traits, Yield, Antioxidant Capacity, and Essential Oil Composition of Thymus vulgaris L. Under Field Conditions

1
Department of Agriculture, Forest, Food and Environmental Sciences, University of Basilicata, Viale dell’Ateneo Lucano, 10, 85100 Potenza, Potenza, Italy
2
Department of Pharmacy, University of Salerno, Via Giovanni Paolo II, 132, 84084 Fisciano, Salerno, Italy
3
Institute of Methodologies for Environmental Analysis, National Research Council (IMAA-CNR), Contrada Santa Loja, 85050 Tito Scalo, Potenza, Italy
*
Authors to whom correspondence should be addressed.
Agronomy 2025, 15(2), 442; https://doi.org/10.3390/agronomy15020442
Submission received: 10 January 2025 / Revised: 3 February 2025 / Accepted: 9 February 2025 / Published: 11 February 2025
(This article belongs to the Section Plant-Crop Biology and Biochemistry)

Abstract

:
Plant biostimulants are used to promote plant growth by increasing tolerance to abiotic stressors and improving the efficiency of natural resource use. In the present two-year research (2022–2023 and 2023–2024), the effects of biostimulant foliar applications on the morphological parameters, fresh and dry yields, antioxidant capacity, total phenolic content, and chemical composition of the essential oil of thyme (Thymus vulgaris L.) were studied. For this purpose, four commercial biostimulants, Biostimol Plus + Peptamin-V Plus®, Acadian MPE®, Megafol®, and BlueN®, were evaluated on thyme cultivated in field conditions. The experiment was laid out in a randomized block design with five treatments and with three replications. During the second growing season, the plants treated with BlueN®, composed of the bacteria Methylobacterium symbioticum SB23, showed the highest plant weight (152.1 g plant−1), fresh biomass yield (501.9 g m−2), and dry yield (172.2 g m−2). BlueN® was the biostimulant that also obtained the highest essential oil yield in both years (0.47 and 0.53%), and for all biostimulants, the amount of thymol and carvacrol increased in the second year, especially with Megafol® (63.75 and 3.16%). The antioxidant capacity was enhanced in the second year by all biostimulants, according to the ABTS assay, but in particular, by BlueN® and BPPVP (26.97 μmol/g and 25.01 μmol/g), while the phenolic content was higher in the first year, especially with BlueN® (65.98 mg GAE/g Extract). The other biostimulants had less intense effects. In conclusion, the biostimulants influenced some characteristics of the essential oil, but the greatest influencers were BlueN®, Megafol®, and BPPVP.

1. Introduction

Medicinal and aromatic plants (MAPs) are botanical raw materials used as ingredients in cosmetics, medicinal products, and health food. They are commercially available in the form of dried plant parts, leaves, roots, bark, wood, flowers or seeds, or, sometimes, the whole plant [1]. In recent years, the demand for organically certified medicinal, cosmetic, and personal care products from MAPs has been increasing [2]. To meet consumer needs, MAP producers must obtain high sustainable production with rich composition in essential oils. In this context, the use of biostimulants represents a valid tool to achieve these goals [3].
Biostimulants can be considered as a support for increasingly sustainable agriculture. In fact, they are specific products containing substances and/or microorganisms capable of promoting the development of plants during their entire life cycle. A peculiarity of biostimulants is their ability to stimulate the natural processes of a plant that contribute to the improvement of the absorption and use of nutrients, tolerance to abiotic stress factors, and crop quality [4]. Algae extracts are certainly the most well-known and most used biostimulant substances. There are currently many biostimulants on the market that use algae extracts, and in particular, the most used contain Ascophyllum nodosum, Ecklonia maxima, and Laminaria digitata. Other biostimulants used in horticulture are humic substances; protein hydrolysates; chitosan; inorganic compounds, such as silica; beneficial fungi; and bacteria [5]. The use of biostimulants is more widespread in protected horticultural environments due to the high profitability of the crops and the more favourable environmental conditions for the effectiveness of the product. Few studies have been carried out on the effect of biostimulants on MAPs, particularly on oregano (Origanum vulgare L.) [6], sage (Salvia officinalis L.) and rosemary (Salvia Rosmarinus Spenn.) [7,8], basil (Ocimum basilicum L.) [9], chamomile (Matricaria chamomilla L.) [10], marigold (Calendula officinalis L.) [11], coriander (Coriandrum sativum L.), mint (Mentha piperita L.), and savory (Satureja hortensis L.) [12].
In the context of MAPs, among the Lamiaceae family, the genus Thymus, which consists of over 400 species, is one of the most studied genera due to its use as a remedy in folk medicine and as a condiment, its high commercial value, and its adaptability to Mediterranean climates [13]. Thyme (Thymus vulgaris L.) is a medicinal herb native to Europe and grown in the Mediterranean basin and Northern Europe and in other parts of the world, such as Asia, South America, and Australia [14,15]. It is a highly appreciated plant both for its culinary properties and for its medicinal properties, such as its antispasmodic, stomachic, antimicrobial, and expectorant properties [1,15]. Thyme offers several health benefits thanks to the presence of bioactive compounds, in particular, thymol and carvacrol [14].
Some studies have focused on the effects of different biostimulants, such as humic acid, chitosan, and arbuscular mycorrhizal fungi, on thyme and in general obtained a positive response on the yield and quality of this crop, but no research on the effect of beneficial bacteria has been reported in the literature. Specifically, Rahimi et al. [16] evaluated the use of four stress-modifier biostimulants, i.e., zinc nano-fertilizer, amino acid, seaweed, and humic acid, on the vegetative growth, nutrients, and antioxidant contents of thyme under water-deficit conditions. These authors reported that the application of humic acid and seaweed resulted in the highest total flavonoid and phenol contents. Sabry et al. [17] showed a positive effect of a foliar spray with cabbage waste extract on the morphological parameters, carbohydrates, minerals, and components of the essential oil (EO) (thymol, p–cymene, and γ-terpinene). Taksera et al. [18] highlighted that the combination of humic acid and arbuscular mycorrhizal fungi has a biostimulant effect on thyme by increasing the fresh weight, chlorophyll a, carbohydrate, and EO yield. Waly et al. [19] reported that foliar applications of seaweed extract at 6 mL L−1, chitosan at 6 mL L−1, and potassium silicate at 12 mL L−1 significantly affected the morphological parameters and percentage of EO under open-field conditions in Egypt. The application of only seaweed extract (3 L ha−1) obtained the maximum EO yield and the highest percentage of γ-terpinene as the second major EO component [20]. The use of Trichoderma spp. separately or in combination with polymers led to an increase in the phenolic content of T. vulgaris L. [21]. The biomass and EO yield were positively influenced by the application of amino acids, such as phenylalanine (150 mg/L) [22].
Considering the above information, the aim of this study was to investigate the effects of the foliar application of four biostimulants with different compositions on the growth and biomass yield of the plant and on the composition, antioxidant capacity, and total phenolic content of the EO.

2. Materials and Methods

2.1. Site and Experimental Design
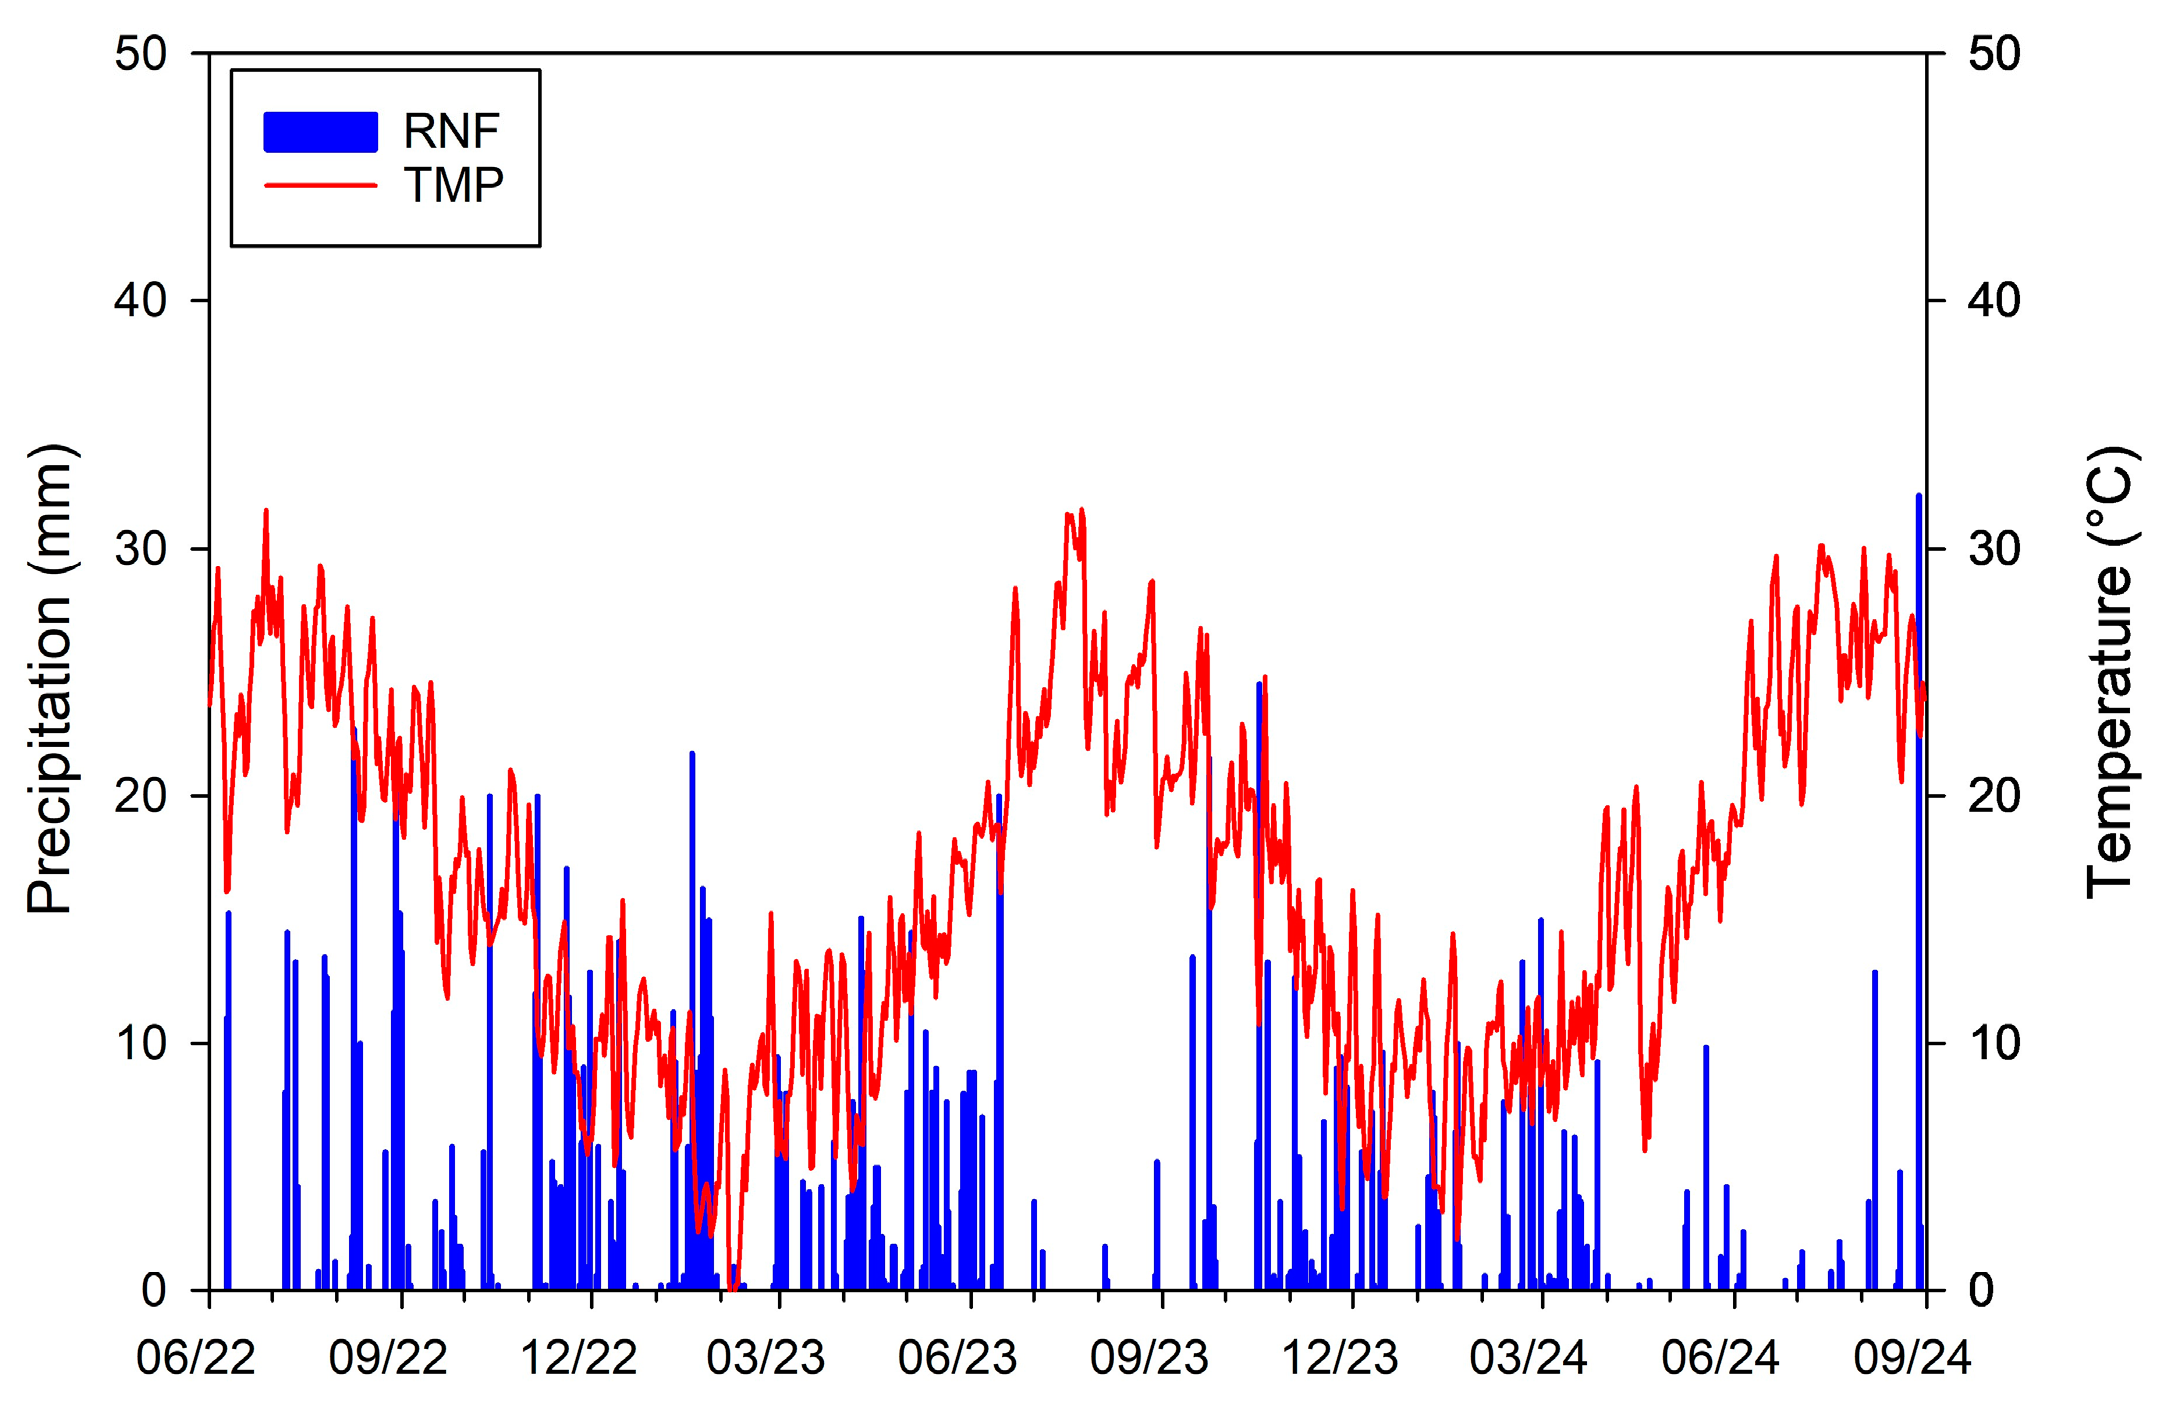
During two growing seasons (2023 and 2024), a trial experiment was carried out at an organic farm situated in the countryside of Melfi, Basilicata region, Southern Italy (41°07′ N; 15°60′ E; 252 above sea level (a.s.l.)), called “Podere Malvarosa”.
The soil has a sandy loam texture (63.6% sand, 23.2% silt and 13.2% clay) and a neutral pH (7.1); is a little calcareous (total lime 16 g kg−1; active lime 15 g kg−1); and has good amount of organic matter (2.9%), total nitrogen (1.6 g kg−1), assimilable phosphate (18 mg/kg), and assimilable potassium (820 mg/kg). Organic fertilization with the distribution of 2 t ha−1 of manure was performed before transplanting.
The seeds of T. vulgaris L. were purchased from the ‘Topseed s.r.l.’ seed company (Sarno (SA)—Italy), and the seedlings were produced by a nursery and grown in hole polystyrene containers. Thyme plants were transplanted on 20 June 2022. The distance between rows and within rows was 1.0 and 0.30 m, respectively, with a crop density of 3.33 plants m−2. Irrigation was performed immediately after planting each plot. The weeds were controlled by hand weeding, and no pesticides and chemical fertilizers were used.
The experiment was laid out in a randomized block design with five treatments (a control; Biostimol Plus (Biophyt Agro S.r.l., Andria, BT, Italy) + Peptamin-V Plus® (Biophyt Agro S.r.l., Andria, BT, Italy); Acadian MPE® (Acadian Sea plants Lte, Dartmouth, NS, Canada); Megafol® (Valagro, Atessa, CH, Italy); and BlueN® (Symborg Business Development s.l.u., Cabezo Cortado, Murcia, Spain)) with three replications. The experimental plots were 3 m × 6 m (18 m2) with 3 rows that were 1 m apart.
For the control treatment, plants were sprayed with only water, without any addition of biostimulants. The commercial biostimulants were applied by a foliar spray during the two growing seasons, according to the recommended dosage by manufacturers. Three treatments were performed in June, each for seven days. In particular, 1.8 L of each biostimulant aqueous suspension was distributed for each plot at the concentrations reported in Table 1.

2.2. Climatic Data

According to the Koppen–Geiger climate classification, the study location is characterized by a warm temperate climate with dry summers (Csa). During the experimental trial period (June 2022–August 2024), a total of 775.58 mm of rainfall was recorded in the first year and 438.48 mm in the second year, highlighting a significant reduction in precipitation. Rainfall was mainly concentrated in specific months, with significant peaks in May and June. The average annual temperature increased from 14.71 °C in the first year to 15.86 °C in the second, with the lowest temperatures observed in February and the highest in July (Figure 1).

2.3. Morphological and Yield Parameters

The plant height and width (cm) were determined during the full flowering period (June) of each year and treatment. To measure the fresh and dry weights, ten randomly selected plants were harvested from the centre rows of each plot, avoiding the border effect. After harvesting, plants were immediately weighted (fresh weight) using a precision balance (TE214S, Sartorius, Goettingen, Germany). To obtain the dry weight, the plant stems were weighed and then dried in a ventilated oven at 45 °C for 48 h until a constant weight was reached [16]. Moreover, the following vegetative growth parameters were measured: the stem diameter (mm), plant fresh weight (g), number of branches per plant, weight of the branches (g), and fresh and dry yields (g m−2) of biomass. Plants were cut at a height of 10 cm above the soil level. The harvest took place in June for the first year and the second year.

2.4. Extraction and Analysis of the EOs

One hundred grams of dried aerial parts were subjected to steam distillation for 2 h, according to the method reported by the European Pharmacopoeia [23]. The EO yield (%) on the distilled dry material was calculated using the following formula:
Y i e l d   % = E O   g D r i e d   p l a n t   m a t e r i a l   ( g ) × 100
The EOs were solubilized in n-hexane, filtered over anhydrous sodium sulphate, and stored under N2 at +4 °C in the dark until tested and analysed. The EOs were then analysed by GC and GC-MS, as reported by Polito et al. [24]. The GC-MS analysis was performed using an Agilent 6850 Ser. II Apparatus equipped with a DB-5 fused silica capillary column (30 m × 0.25 mm; 0.25 μm film thickness) and was connected to an Agilent Mass Selective Detector (MSD 5973) (ionization voltage, 70 V; ion multiplier energy 2000 V). The mass spectra were scanned in the range of 40–500 amu, with five scans per second. The chromatographic conditions were as reported above, and the transfer line temperature was 295 °C. The analysis was conducted on a scheduled basis: 5 min isothermally at 40 °C; subsequently, the temperature was increased by 2 °C/min until 270 °C, and finally, it was kept in an isotherm for 20 min. The analysis was also performed on an HP Innowax column (50 m × 0.20 nm; 0.25 μm film thickness). In both cases, He was used as a carrier gas (1.0 mL/min). The components were identified by comparing their Kovats indices (Ki) with those of the literature [25,26,27,28] and by a careful analysis of the mass spectra compared to those of pure compounds available in our laboratory or to those present in the NIST 02 and Wiley 257 mass libraries [29]. The Kovats indices were determined in relation to a homologous series of n-alkanes (C10–C35), under the same operating conditions. For some compounds, the identification was confirmed by co-injection with standard substances. The components’ relative concentrations were calculated by peak area normalization. Response factors were not considered.

2.5. Antioxidant Capacity and Total Phenolic Content (TPC)

The antioxidant capacity was determined, first of all, by using a modified version of the stable 1,1-diphenyl-2-picrylhydrazyl (DPPH) radical method [30]. A DPPH solution (60 μM) was prepared and stored in the dark. In a cuvette, 25 μL of EO in MeOH solutions of different concentrations and 975 μL of the DPPH solution were added to a final volume of 1 mL. MeOH alone was used as a blank, and a cuvette with 1 mL of the DPPH solution was used as a control. After 45 min, the absorbance at 515 nm was measured using a Thermo scientific Multiskan GO spectrophotometer (Thermo Fischer Scientific, Vantaa, Finland). The absorbance of the DPPH solution without the sample (control) was used as a baseline measurement. The percentage inhibition of free radical formation by DPPH (I%) was calculated as follows:
I% = (Ablank − Asample/Ablank) × 100
where Ablank is the absorbance of the control reaction, and Asample is the absorbance of the test compound. Scavenging activity was expressed as inhibitory concentration 50 (IC50) and is defined as the sample concentration (mg/mL) necessary to inhibit DPPH radical activity by 50% after 45 min of incubation. Experiments were performed in triplicate, and the results are expressed as the mean ± SD. Trolox (6-hydroxy-2,5,7,8-tetramethylchroman-2-carboxylic acid) was used as a reference.
The 2,2-azino-bis 3-ethylbenzothiazoline-6-sulfonic acid (ABTS) test was also carried out [31]. To produce the ABTS radical (ABTS•+), solutions of ABTS (7 mM) and potassium persulfate (2.45 mM) were mixed and then left in the dark at room temperature for 16 h before use. Trolox, dissolved in MeOH at different concentrations, was used as a reference standard. The ABTS + solution was diluted with ethanol to obtain an optical density (OD) of 0.800 at 734 nm, measuring the absorbance immediately after mixing (time 0) and at 6 min (Cary Varian, Milan, Italy). The ABTS•+ solution was diluted with ethanol to achieve an optical density (OD) of 0.800 at 734 nm. Absorbance readings were taken immediately after mixing (time 0) and at 6 min. In triplicate, 10 μL of the different concentrations of EOs dissolved previously in methanol (with final concentrations ranging from 0.1 to 40 mg/mL), and 190 μL ABTS•+ was added to the wells for analysis. A total of 10 μL of PBS and 190 μL of ultrapure water were added to the wells for the control. The results are expressed as the μmol Trolox equivalent antioxidant capacity (TEAC) per gram of samples. All determinations were carried out in triplicate, and the results are expressed as the mean ± SD. Ascorbic acid was used as a reference.
The total phenolic content (TPC) was determined by the Folin–Ciocalteau assay [32]. In cuvettes, 10 μL of a solution of EO or gallic acid, used to determine calibration, was dissolved in suitable solvents to reach the desired concentrations; 790 μL of H2O was deionized; and 50 μL of the Folin–Ciocalteau reagent was added. One hundred and fifty μL of Na2CO3 was added after eight min. Absorbance values were evaluated after 2 h incubation at room temperature, at 765 nm, using a Multiskan GO spectrophotometer (Thermo Fisher Scientific, Vantaa, Finland). TPC was measured in mg of gallic acid equivalent per g of EO (mg GAE/g EO). The analyses were performed in triplicate, and the values reported are as the mean ± SD.

2.6. Statistical Analysis

The data were first tested for normality and homogeneity of variances using the Shapiro–Wilk test and Bartlett’s test, respectively. Then, the data were analysed with a one-way analysis of variance (ANOVA), each year separately, with ‘biostimulant’ as the source of variation. Mean values were separated using Tukey’s post-hoc test, with p ≤ 0.05. GraphPad Prism 6.0 (Software Inc., San Diego, CA, USA) was used to carry out statistical analyses.

3. Results

3.1. Effects of Year and Biostimulants on Morphological and Yield Parameters of Thyme

Table 2 highlights the effects of the type of biostimulant during the two growing seasons.
During the first year, the analysis of variance indicated that all the morphological and productive traits were significantly influenced by the biostimulants, except for the plant height, plant width, and weight of the branches. The highest value of stem diameter was reached by plants treated with BlueN®. Plants treated with Acadian® obtained the highest plant fresh weight, fresh biomass yield, and dry yield, followed by plants treated with BlueN® (Table 2).
During the second year, all the morphological and productive traits were significantly influenced by the biostimulants, except for the plant width and the weight of the branches. BlueN® treatment derived the highest plant fresh weight, fresh biomass yield, and dry yield, while, the lowest values of plant fresh weight, the number of branches per plant, and fresh biomass and dry yields were observed in the control plants (Table 2).
In both years, the highest average values of plant height were observed with BPPVP® application. The highest value of stem diameter was observed in the first year, while the highest values of plant height, plant fresh weight, and biomass fresh yield and dry yield were in the second year (Table 2).

3.2. Yield of Essential Oils

Table 3 highlights the variations in the EO yield, calculated on a dried basis and obtained by different biostimulant treatments with reference to the two years. The yields show minimal variations between the control and treatments both within the same year and between the two years. Table 3 shows how in the first year, the yields of the treatments were lower than the yield of the control (0.55%), ranging between 0.30% of the BPPVP treatment and 0.47% of the BlueN® treatment. In the second year, the yields of the treatments were lower but still very close to that of the control (0.56%): they range from 0.47% of BPPVP to 0.53% of BlueN®. A comparison of the treatments between the two years shows that the yields of the controls were practically identical (0.55% in the first year vs. 0.56% in the second), while the yields of the treatments were slightly higher in the second year than those of the first year. In both years, however, the treatment that provided the highest yields was BlueN®.

3.3. Chemical Composition of Essential Oils

Table 4 reports the percent composition of the EOs. Components are listed in the order of elution on a HP-5 MS capillary column.

3.3.1. Number of Compounds

A total of 32 compounds were identified in all EOs, and no major differences were observed in their number within the same year, but in all cases, in the second year, there was a decrease: for the EO of the control, 27 compounds were identified in the first year and 16 in the second; for the EO from plants treated with BPPVP, 31 compounds were identified in the first year and 18 in the second; for the EO from plants treated with Acadian®, 28 compounds were identified in the first year and 18 in the second; for the EO from plants treated with Megafol®, 30 compounds were identified in the first year and 18 in the second; and for the EO from plants treated with BlueN®, 27 compounds were identified in the first year and 22 in the second.

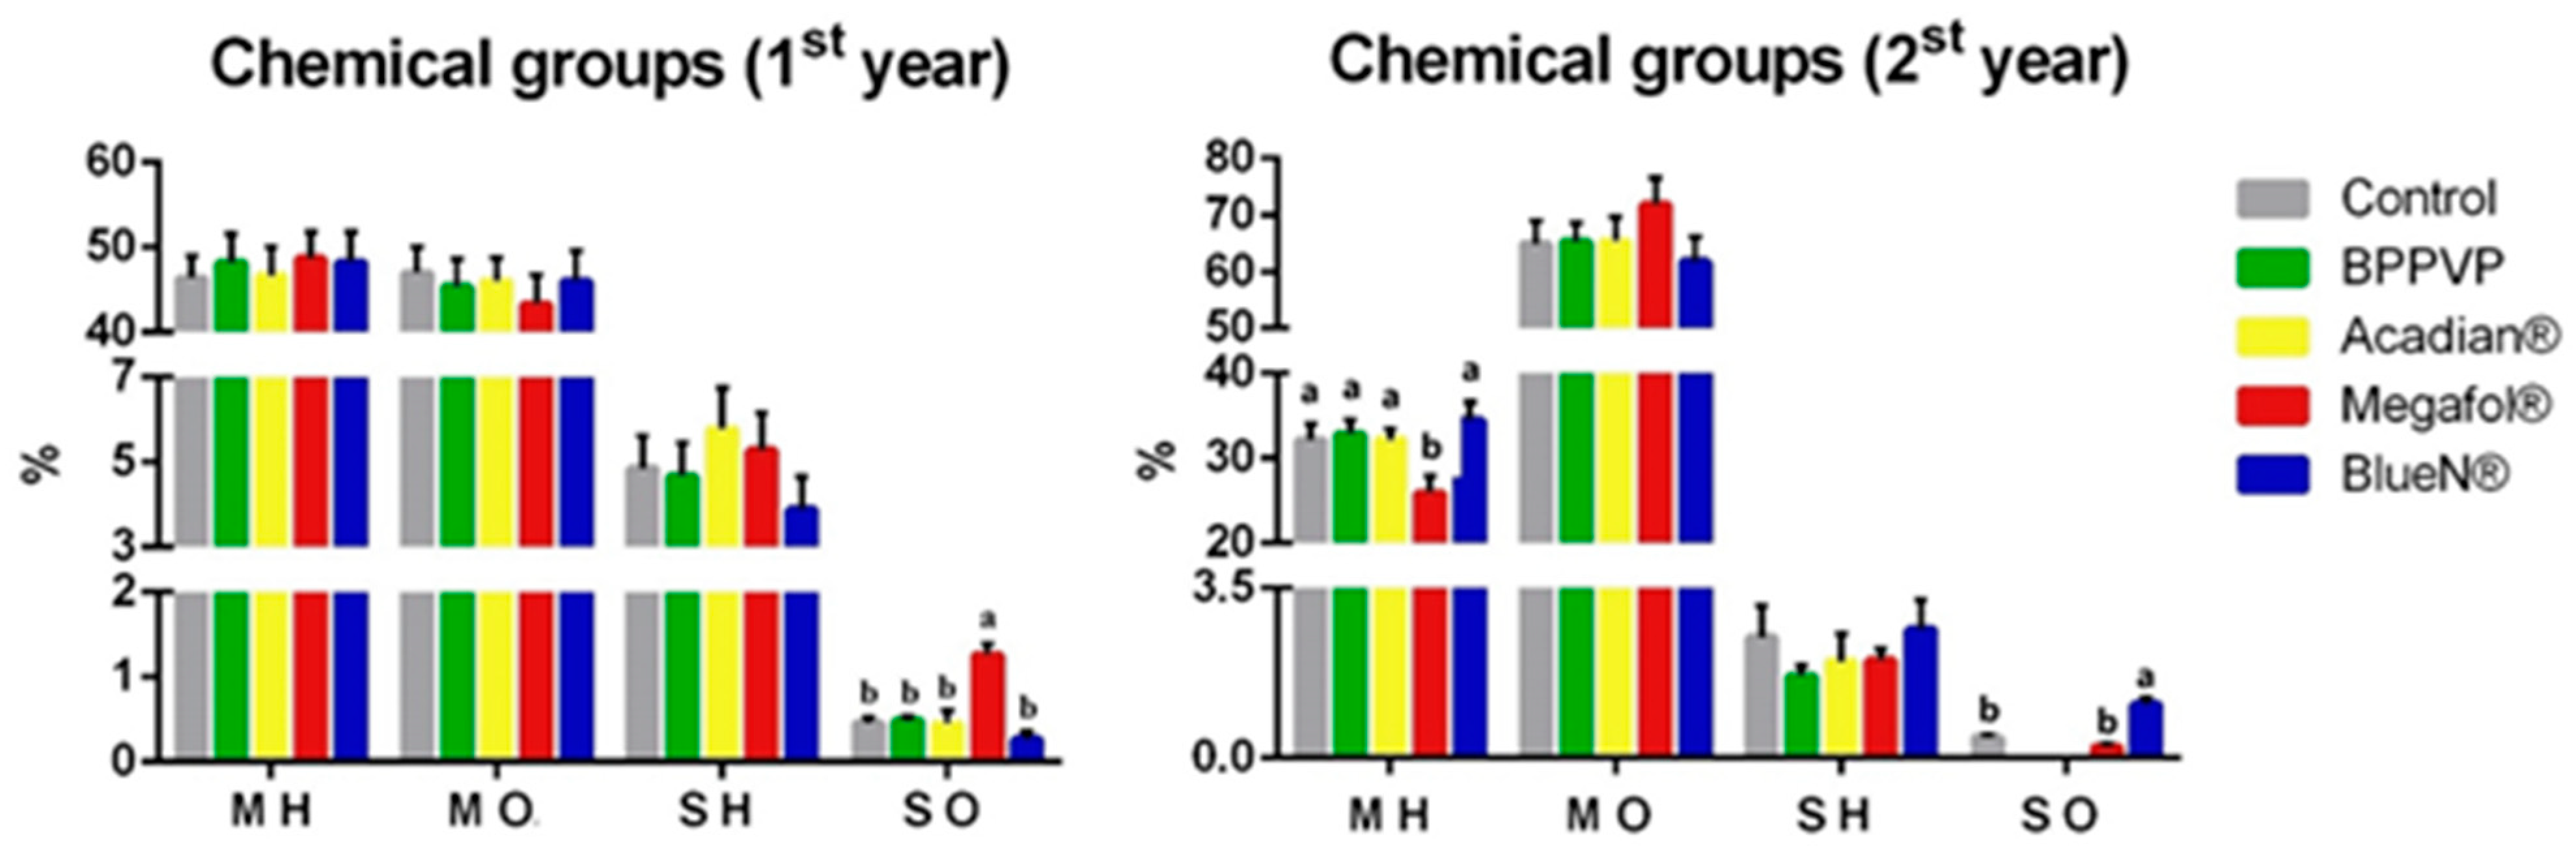
3.3.2. Major Chemical Groups

The predominant classes of components were monoterpene hydrocarbons and oxygenated monoterpenes, and their quantity does not have major variations within the same year but changes from the first to the second year (Figure 2). In fact, in the first year, the amount of monoterpene hydrocarbons was almost similar in all EOs, ranging from a minimum of 46.40% in the control to a maximum of 48.68% in the Megafol® treatment. In the second year, their quantity was similar in all EOs but decreased, ranging from a minimum of 25.91% in the Megafol® treatment to a maximum of 34.46% in the BlueN® treatment. Oxygenated monoterpenes resulted in almost similar amounts in all EOs in the first year, ranging from 43.30% in the Megafol® treatment to of 46.98% in the control, while in the second year, their amount increased in all EOs, ranging from 61.78% for the BlueN® treatment to a maximum of 71.85% for the Megafol® treatment.

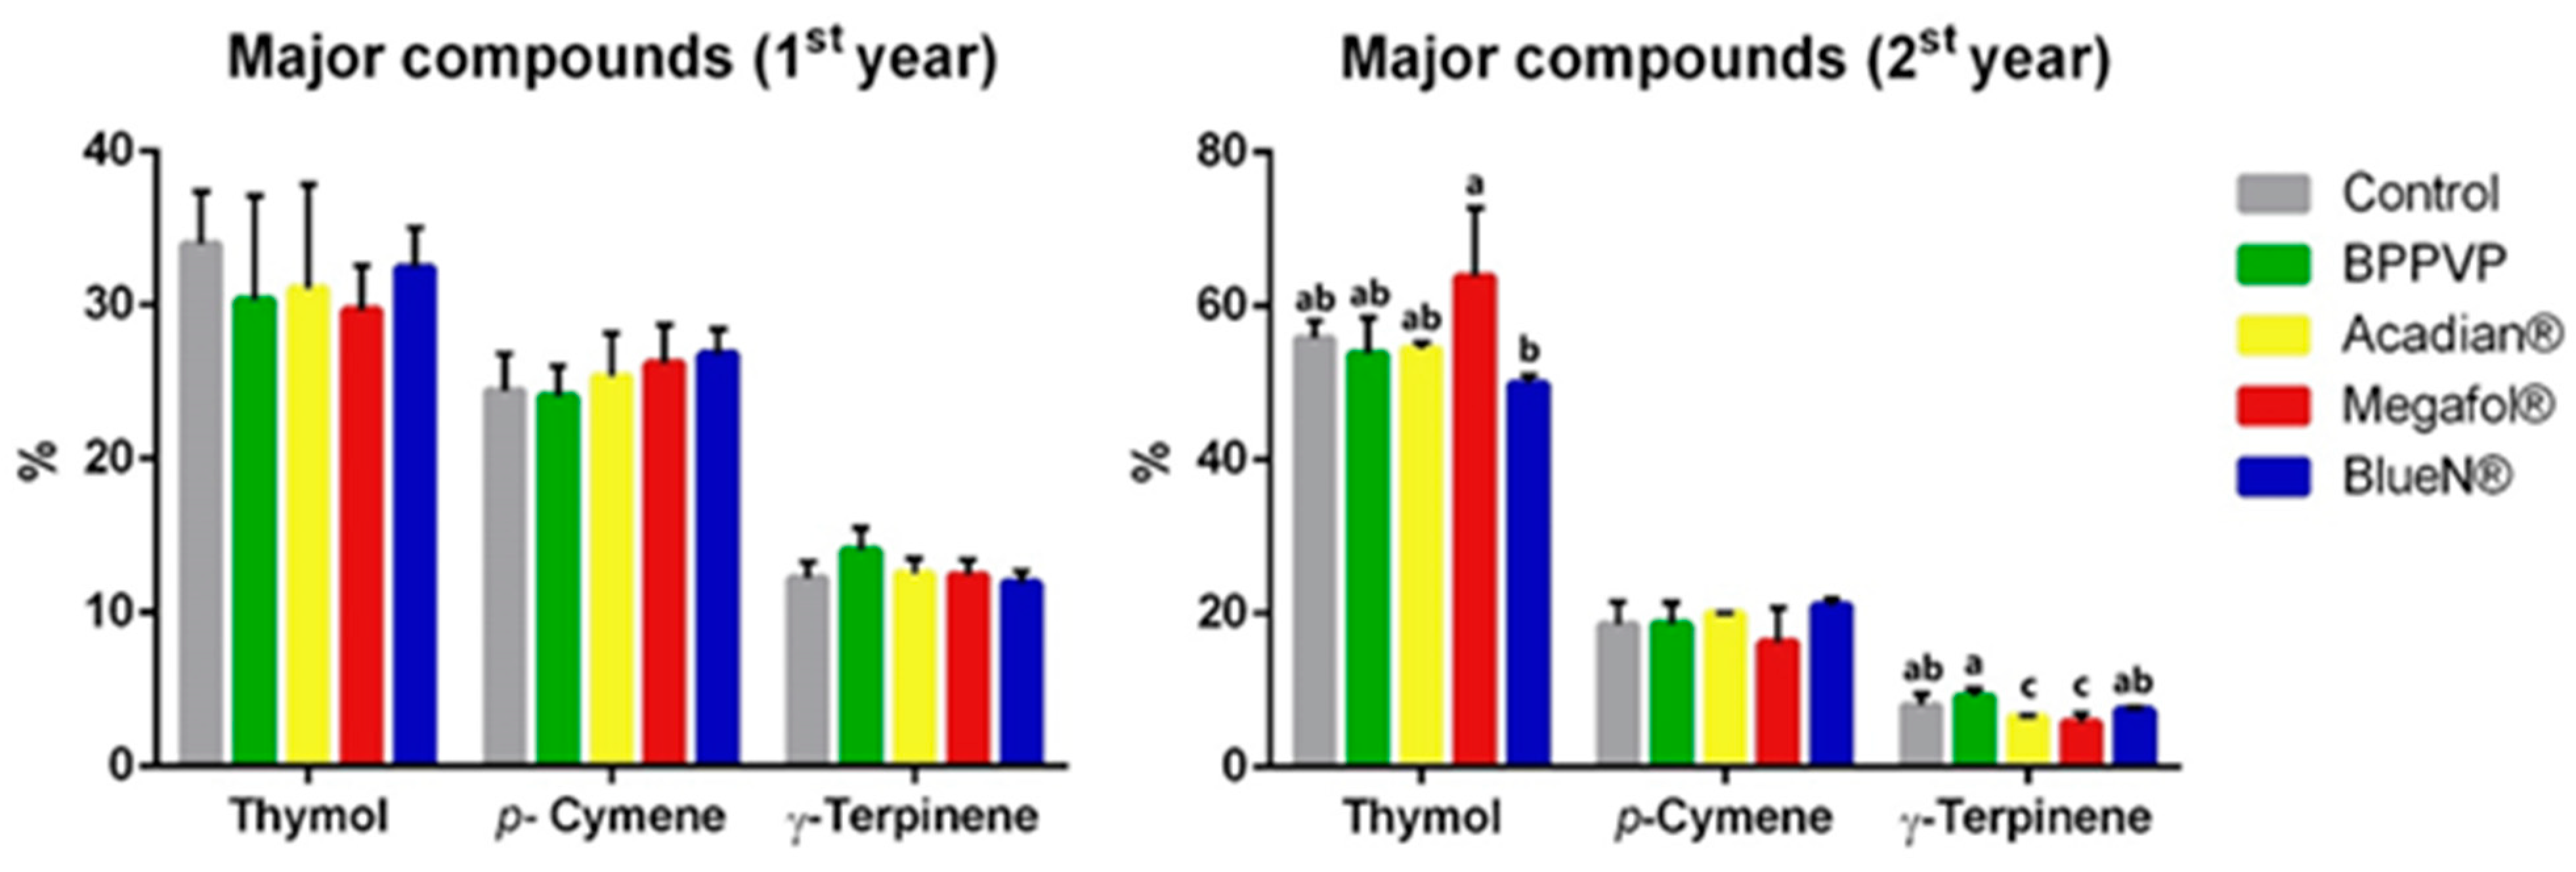
3.3.3. Key Components

Three main components were found in all EOs: thymol, p-cymene, and γ-terpinene (Figure 3). Thymol was the main component in all EOs, and its amount increased from the first to the second year, while maintaining very similar quantities within the same year for all EOs. In the first year, in fact, it ranged from 29.64% (Megafol® treatment) to 33.95% (control), while in the second year, it ranged from 49.93% (BlueN® treatment) to 63.75% (Megafol® treatment). p-Cymene is the second most present component in all EOs, but its amount decreased from the first to the second year, while also maintaining similar quantities within the same year. In the first year, the range was between a minimum of 24.04% (BPPVP treatment) and a maximum of 26.77% (BlueN® treatment), while in the second year, it was between 16.23% (Megafol® treatment) and a maximum of 21.01% (BlueN® treatment). A similar trend was observed for γ-terpinene, the third main component, whose amounts, although remaining almost constant within the same year, decreased from the first to the second year. It ranged from 11.93% (BlueN® treatment) to 14.06% (Acadian® treatment) in the first year and from a minimum of 5.86% (Megafol® treatment) to a maximum of 9.23% (BPPVP treatment).

3.4. Antioxidant Capacity and Total Phenolic Content

Table 5 reports the antioxidant capacity, evaluated by DPPH and ABTS assays, and the total phenolic content (TPC).
The results of the DPPH assay show practically identical activities to the first year, and only the samples treated with Acadian® and Megafol® present a slightly greater activity (IC50 0.97 mg/mL). In the second year, the activity decreased compared to the first (higher IC50 values for all samples): the samples treated with BlueN® and Megafol® present the lowest IC50 values (2.20 ± 0.07 and 2.64 ± 0.09 mg/mL). The situation is different in the case of the ABTS assay, where the activity increases from the first to the second year (higher TEAC values): in the first year only, the sample treated with BPPVP (21.37 ± 1.36 μmol/g) was slightly more active than the control (21.43 ± 1.23 μmol/g), while in the second year, the samples treated with Megafol® and Acadian® were the most active (23.87 ± 2.09 μmol/g and 24.43 ± 1.37 μmol/g, respectively). The TPC decreased from the first to the second year: in the first year, the values were very similar, and only the sample treated with BlueN® showed a higher TPC than the control (65.98 ± 2.47 mg GAE/g EO vs. 65.32 ± 2.54 mg GAE/g EO); in the second year, the samples treated with BPPVP (44.21 ± 2.16 mg GAE/g EO) and BlueN® (45.65 ± 1.91 mg GAE/g EO) showed higher TPC values than the control (43.56 ± 2.28 mg GAE/g EO).
A comparison between the two years shows that the EOs of the first year are those with the highest antioxidant capacity in the DPPH assay and have a higher TPC, while those of the second year were more active in the ABTS assay. However, all samples are much less active than the two reference substances used (Trolox and ascorbic acid). Within the same year, the antioxidant capacity in the DPPH assay was practically identical in all EOs in the first year, while in the second year, the most active sample was the one treated with BlueN®, and the least active was the one treated with Acadian®. In the ABTS assay, the activities were practically identical in the first year, while in the second year, there was greater variability, where the control was the most active and the one treated with Megafol® the least active. The total phenolic content showed little variability in both the first and second year. In the first year, the content was higher for the sample treated with BlueN®, followed immediately by the control sample, while in the second year, the sample treated with BlueN® showed the highest phenolic content, followed by the sample treated with BPPVP. The sample treated with Acadian® instead had a lower value than the others.

4. Discussion

4.1. Effects of Biostimulants on Morphological and Productive Traits

MAPs are greatly studied for their various uses, both in the gastronomic and pharmaceutical sectors. Therefore, the supply of nutrients is important for achieving their maximum economic yield [19]. The use of biostimulants allows one to obtain sustainable production while respecting soil fertility [4,33].
The thyme plants treated with biostimulants resulted in an increase in yield with respect to the control, mainly during the second growing season. In particular, the foliar application of BlueN®, composed of the bacteria Methylobacterium symbioticum SB23, obtained the highest fresh and dry yields in the second year. This biostimulant reached a value of 501.9 g m−2, which was higher than that of the untreated plants (363.7 g m−2). This was due to the ability of this bacteria to offer the plants a source of nutrients, such as nitrogen and phosphorus, as well as to protect the plants from pathogens [33]. In fact, M. symbioticum, in addition to reducing atmospheric N2 to ammonium (NH4+) through the enzyme nitrogenase, also makes phosphorus available to the plant by dissolving inorganic phosphates [34]. Few research about the effect of M. symbioticum SB23 (BlueN®) on MAPs has been reported in the literature [6], with some studies on other crops, such as maize and strawberry [33], lettuce [35], and an olive orchard [36]. The last two authors examined if the inoculation of this microorganism has an influence on the N concentration in the leaves or on yields, reporting no significant effects.
Generally, another biostimulant that provoked interesting results in terms of yield was the Acadian®, based on an extract of A. nodosum. This promoting effect is due to the presence of various bioactive phenolic compounds, such as phlorotannins and polysaccharides, i.e., alginic acid (28%), fucoidans (11.6%), mannitol (7.5%), and laminarin (4.5%) [37]. According to other authors, the application of A. nodosum extracts improves the growth and nutrient assimilation of plants [4,5,6]. Muetasam Jafr et al. [20] highlighted that the highest level of seaweed extract application (Ascokelp brand; 6 L ha−1) on thyme obtained the highest amount of dry matter. Waly et al. [19] evaluated a mixture of algae, including A. nodosum, and obtained the highest values of plant height, number of branches per plant, fresh weight, and dry weight with a seaweed extract application of 6 mL L−1.
According to these authors, generally, the results obtained in the second growing season are higher than the first season. In fact, an increase in plant weight, fresh biomass yield, and dry yield was observed.

4.2. Effects of Biostimulants on Essential Oil Composition

The distribution of classes and the main compounds in the control were preserved in the EOs obtained from the treatments. What changed were the percentage quantities of the components present. A description of this trend was already addressed in the presentation of the results, but here, some conclusions can be drawn by underlining any effects of the biostimulants compared to the control. As regards the two main classes of compounds, in the first year, all the biostimulants produced an increase in the quantity of hydrocarbon monoterpenes but a decrease in oxygenated monoterpenes compared to the control. In the second year, however, Megafol® produced a decrease in the content of hydrocarbon monoterpenes (25.91%) compared to the control (32.23%), while BlueN® showed an increase (34.46%). For almost all of them, in the second year, above all, Megafol® (71.85%) showed an increase in the quantity of oxygenated monoterpenes compared to the control (64.94%), except BlueN® (61.78%). As for the main compounds of the first year, all, apart from BPPVP (24.04%), showed an increase in the quantities of p-cymene (25.35–26.77%) compared to the control (24.43%), and all, with the exception of BlueN® (11.93%), showed an increase in the quantity of γ-terpinene (12.43–14.06%) compared to the control (12.21%). Finally, for the characteristic compound thymol, in all cases, the quantities (29.64–32.40%) were lower than the control (33.95%). In the second year, however, the quantities of p-cymene obtained from the treatments were all higher than those of the control (18.59%) except for that of Megafol® (16.23%). The quantities of γ-terpinene, on the other hand, were all lower than the control (8.02%) except for BPPVP, which was higher (9.23%). For the characteristic compound thymol, the quantities decreased compared to the control (55.75%) except in the case of Megafol® (63.75%).
It is known that the yield and composition of EOs from T. vulgaris are influenced by several factors, not only by the phenological stage (it has been observed that the highest yield is achieved at the beginning of the flowering period) but also by genetic and environmental characteristics [36,37,38]. However, the EO yields from T. vulgaris reported in the literature are higher, regardless of the phenological and harvesting state considered, than the yields obtained in this work: in fact, much higher values have been reported, ranging from 0.99 to 4.73% [39,40,41,42]. There are no studies regarding the effects on the yield and composition of thyme EO after the application of the biostimulants used in this work. However, in some studies, it was shown that the yield and characteristics of EOs are modified after the administration of other types of biostimulants [16,17]. It should be considered, however, that EO yields can be influenced by a variety of factors: genetic diversity; agrotechnology and processing methods; climatic conditions; unpredictable weather events during the growth period; soil characteristics, such as temperature, humidity, and sunlight; as well as variables related to the timing and methods of harvesting, and the distillation and storage processes adopted. One or more of these factors could have been, in our opinion, the cause of obtaining a lower yield than that reported in the literature [43,44,45].
The literature is rich in research regarding the composition of the EO of T. vulgaris. Papers reporting the composition of EOs of Italian T. vulgaris largely agree with data reported in this work. T. vulgaris collected in different locations of Campania (Southern Italy) showed the same chemotype found in this work (thymol chemotype) with similar percentages of thymol (46.2–67.5%) [46]. The other main components, namely, carvacrol (5.7–7.3%) and caryophyllene oxide (1.7–7.3%), were instead different from those reported in this work. In Central Italy, however, different EOs from T. vulgaris have been studied. Two EOs from Tuscany presented a thymol chemotype and the same main components of the EO of this work: thymol (26.9–53.7%), p-cymene (7.2–20.8%), and γ-terpinene (4.5–19.8%) [47]. EOs obtained in the Emilia–Romagna region showed a similar situation, with the same main components found in this work and with similar percentages: thymol (36–55%), p-cymene (15–28%), and γ-terpinene (5–10%) [48]. A similar composition was also registered for an EO of T. vulgaris from Northern Italy, where the main components were, once again, thymol (46.21%), γ-terpinene (14.08%), and p-cymene (9.91%) [49]. A comparison with EOs from foreign countries shows some differences, mainly in the amounts of the main components. An EO from Slovakia showed a similar composition, with two main components in common: thymol (48.1%) and p-cymene (11.7%) [50]. More similar is the composition of two Algerian EOs, where the main components were the same: thymol (59.5 and 67.3%), γ-terpinene (8.7 and 10.1%), and p-cymene (5.6 and 6.0%) [51]. An EO from Romania showed a similar composition, with thymol (47.59%); γ-terpinene (30.90%, a much higher percentage); and p-cymene (8.41%) as the main components [52]. More heterogeneous results were obtained for EOs from various locations in Serbia and France. For these EOs, several chemotypes were identified with many differences regarding chemical components and their percentages, even if the thymol chemotype was the most common. Among these, the EO most similar to the one in this work was found in France, where thymol (47.06%) and p-cymene (20.07%) were found as the main components [53].

4.3. Effects of Biostimulants on Antioxidant Capacity and Total Phenolic Content

There are no studies that have studied whether the antioxidant capacity and TPC of thyme EO are influenced by biostimulants. However, in this work it was determined that their use causes very heterogeneous effects, and not all applications are capable of massively influencing the antioxidant capacity and TPC. In general, the effects caused do not differ much from those obtained with the control, and in many cases, they are even inferior to it. The most pronounced effects, even if not for all biostimulants, occurred on the EOs of the second year, and in fact, the biostimulants were able to increase the yield of the EOs and the quantity of characteristic compounds, such as thymol and carvacrol. With regards to the antioxidant capacity, the two tests agree with regard to the first year but are in disagreement for the second, where the results of the ABTS test show an improvement in the antioxidant capacity due to the application of the biostimulants. Finally, as regards the TPC, the trend is similar to that seen in DPPH: in the first year, there are very similar values, while in the second, the TPC decreases.
On the other hand, there are many studies reporting the evaluation of the antioxidant capacity of thyme EOs through DPPH tests. They often report an activity much greater than that highlighted in this work, with IC50 values ranging from 4.12 to 693.75 μg/mL [46,54,55]. However, there are also studies in which the activity is lower, with IC50 values of 1.64 ± 0.05 and 10.85 ± 0.02 mg/mL [56,57]. On the other hand, there is less research on the evaluation of the antioxidant capacity through the ABTS assay, and the results show modest antioxidant capacities and, in all cases, are lower than those highlighted in this work [58,59]. There are also a few studies evaluating the total phenolic content of thyme EOs, and the results show significant variability. The values range from 62.40 to 177.3 mg of gallic acid equivalents (GAE)/g. This range also includes the values obtained in this work for the first year, while the values of the second year are outside the range considered, resulting in lower values [46,55,60].

5. Conclusions

The results obtained in this research are very useful for the organic farming of thyme and highlight the positive effects on the morphological, biochemical, and productive traits of the foliar application of biostimulants on thyme plants under field conditions. BlueN® was the biostimulant that allowed us to obtain the highest plant fresh weight, number of branches per plant, and dry yield, mainly in the second year.
All biostimulants, in particular Megafol®, influenced the chemical composition by increasing the thymol and carvacrol production. The antioxidant capacity was enhanced in the second year by all biostimulants, according to the ABTS assay, but in particular, by BlueN® and BPPVP, while the phenolic content was higher in the first year, especially with BlueN®. The other biostimulants had less intense effects. In conclusion, the biostimulants influenced some characteristics of the essential oil, but the greatest influencers were BlueN®, Megafol®, and BPPVP. Further research is necessary to evaluate other factors, such as the dosage of the biostimulants, in order to improve the application of these products.

Author Contributions

Conceptualization, L.C. and F.P.; methodology, L.C., F.P., M.D., D.C. (Donato Casiello), D.C. (Donato Castronuovo), and N.C.; software, L.C. and F.P.; validation, L.C. and F.P.; formal analysis, L.C. and F.P.; investigation, L.C. and F.P.; resources, L.C. and F.P.; data curation, L.C. and F.P.; writing—original draft preparation, L.C., F.P., V.D.F. and V.C.; writing—review and editing, L.C., F.P., V.D.F. and V.C.; visualization, L.C., F.P., V.D.F. and V.C.; supervision, M.P. and V.C.; project administration, M.P. and V.C.; funding acquisition, M.P. and V.C. All authors have read and agreed to the published version of the manuscript.

Funding

This research was funded by the VAL.P.O.T. Project “Enhancement of medicinal plants through a product with a high territorial profile”, PSR Basilicata region 2014–2020 (Call Measure 16; Submeasure 16.2—founded by the Basilicata region (Italy)).

Data Availability Statement

Data will be made available on request.

Acknowledgments

The authors thank the farm “Podere Malvarosa” for its kind availability and support during this study.

Conflicts of Interest

The authors declare no conflicts of interest.

Abbreviations

The following abbreviations are used in this manuscript:
MAPsMedicinal and aromatic plants
EOEssential oil

References

  1. Riaz, U.; Iqbal, S.; Sohail, M.I.; Samreen, T.; Ashraf, M.; Akmal, F.; Siddiqui, A.; Ahmad, I.; Naveed, M.; Khan, N.I.; et al. A comprehensive review on emerging importance and economical potential of medicinal and aromatic plants (MAPs) in current scenario. Pak. J. Agric. Res. 2021, 34, 381–392. [Google Scholar] [CrossRef]
  2. Cadar, R.-L.; Amuza, A.; Dumitras, D.E.; Mihai, M.; Pocol, C.B. Analysing Clusters of Consumers Who Use Medicinal and Aromatic Plant Products. Sustainability 2021, 13, 8648. [Google Scholar] [CrossRef]
  3. Sun, W.; Shahrajabian, M.H.; Petropoulos, S.A.; Shahrajabian, N. Developing Sustainable Agriculture Systems in Medicinal and Aromatic Plant Production by Using Chitosan and Chitin-Based Biostimulants. Plants 2023, 12, 2469. [Google Scholar] [CrossRef]
  4. De Pascale, S.; Rouphael, Y.; Colla, G. Plant biostimulants: Innovative tool for enhancing plant nutrition in organic farming. Eur. J. Hortic. Sci. 2017, 82, 277. [Google Scholar] [CrossRef]
  5. Du Jardin, P. Plant biostimulants: Definition, concept, main categories and regulation. Sci. Hortic. 2015, 196, 3–14. [Google Scholar] [CrossRef]
  6. Amato, G.; Cardone, L.; Cicco, N.; Denora, M.; Perniola, M.; Casiello, D.; De Martino, L.; De Feo, V.; Candido, V. Morphological traits, yield, antioxidant activity and essential oil composition of oregano as affected by biostimulant foliar applications. Ind. Crops Prod. 2024, 222, 119702. [Google Scholar] [CrossRef]
  7. Farruggia, D.; Di Miceli, G.; Licata, M.; Leto, C.; Salamone, F.; Novak, J. Foliar application of various biostimulants produces contrasting response on yield, essential oil and chemical properties of organically grown sage (Salvia officinalis L.). Front. Plant Sci. 2024, 15, 1397489. [Google Scholar] [CrossRef]
  8. Farruggia, D.; Tortorici, N.; Iacuzzi, N.; Alaimo, F.; Leto, C.; Tuttolomondo, T. Biostimulants Improve Plant Performance of Rosemary Growth in Agricultural Organic System. Agronomy 2024, 14, 158. [Google Scholar] [CrossRef]
  9. Saia, S.; Corrado, G.; Vitaglione, P.; Colla, G.; Bonini, P.; Giordano, M.; Stasio, E.D.; Raimondi, G.; Sacchi, R.; Rouphael, Y. An endophytic fungi-based biostimulant modulates volatile and non-volatile secondary metabolites and yield of greenhouse basil (Ocimum basilicum L.) through variable mechanisms dependent on salinity stress level. Pathogens 2021, 10, 797. [Google Scholar] [CrossRef]
  10. Rathore, S.; Kumar, R. Dynamics of phosphorus and biostimulants on agro-morphology, yield, and essential oil profile of German Chamomile (Matricaria chamomilla L.) under acidic soil conditions of the Western Himalaya. Front. Plant Sci. 2022, 13, 917388. [Google Scholar] [CrossRef]
  11. Machado, V.P.D.O.; Pacheco, A.C.; Carvalho, M.E.A. Effect of biostimulant application on production and flavonoid content of marigold (Calendula officinalis L.). Rev. Ceres 2014, 61, 983–988. [Google Scholar] [CrossRef]
  12. Rafiee, H.; Badi, H.N.; Mehrafarin, A.; Qaderi, A.; Zarinpanjeh, N.; Sekara, A.; Zand, E. Application of Plant Biostimulants as New Approach to Improve the Biological Responses of Medicinal Plants- A Critical Review. J. Med. Plants 2016, 15, 1–39. [Google Scholar]
  13. Morales, R. The history, botany and taxonomy of the genus Thymus. In Thyme: The Genus Thymus; Stahl-Biskup, E., Sáez, F., Eds.; Taylor & Francis: London, UK; New York, NY, USA, 2002; pp. 1–43. [Google Scholar]
  14. Nabavi, S.M.; Marchese, A.; Izadi, M.; Curti, V.; Daglia, M.; Nabavi, S.F. Plants belonging to the genus Thymus as antibacterial agents: From farm to pharmacy. Food Chem. 2015, 173, 339–347. [Google Scholar] [CrossRef] [PubMed]
  15. Nieto, G. A review on applications and uses of thymus in the food industry. Plants 2020, 9, 961. [Google Scholar] [CrossRef] [PubMed]
  16. Rahimi, A.; Mohammadi, M.M.; Siavash Moghaddam, S.; Heydarzadeh, S.; Gitari, H. Effects of stress modifier biostimulants on vegetative growth, nutrients, and antioxidants contents of garden thyme (Thymus vulgaris L.) under water deficit conditions. J. Plant Growth Regul. 2022, 41, 2059–2072. [Google Scholar] [CrossRef]
  17. Sabry, R.; Salama, A.; Wahba, H.; Mohamed, H.; Abdelhamid, M. The potential of cabbage waste extract as a bio-stimulant for enhancing growth, biochemical constituents, and oil quality of thyme (Thymus vulgaris). Future Food J. Food Agric. Soc. 2022, 11, 1–17. [Google Scholar] [CrossRef]
  18. Taksera, N.R.; Abu El-Leil, E.F.; Abdel-Fattah, G.M. Impact of bio-fertilizer and humic acid applications on productivity and some biochemical characteristics of thymus vulgais grow in sandy soil. Minia J. Agric. Res. Dev. 2023, 43, 853–872. [Google Scholar] [CrossRef]
  19. Waly, A.A.; El-Fattah, A.; Hassan, M.A.E.; El-Ghadban, E.M.; Abd Alla, A.S. Enhancing growth, productivity and essential oil percentage of Thymus vulgaris L. plant using seaweeds extract, chitosan and potassium silicate in sandy soil. Sci. J. Flowers Ornam. Plants 2020, 7, 549–562. [Google Scholar] [CrossRef]
  20. Muetasam Jafr, S.; Rahimi, A.R.; Hashemi, M.; Rokhzadi, A. Influence of N, K, and Seaweed Extract Fertilization on Biomass, Photoisynthetic Pigments, and Essential Oil of Thymus vulgaris: Optimization Study by Response Surface Methodology. Agronomy 2022, 12, 3222. [Google Scholar] [CrossRef]
  21. Kulbat-Warycha, K.; Nawrocka, J.; Kozłowska, L.; Żyżelewicz, D. Effect of Light Conditions, Trichoderma Fungi and Food Polymers on Growth and Profile of Biologically Active Compounds in Thymus vulgaris and Thymus serpyllum. Int. J. Mol. Sci. 2024, 25, 4846. [Google Scholar] [CrossRef]
  22. Ghazal, G.M. Growth and oil yield of Thymus vulgaris plant as influenced by some amino acids and ascorbic acid. World J. Pharm. Sci. 2015, 3, 2321–3086. [Google Scholar]
  23. Council of Europe. European Pharmacopeia, 10th ed.; Council of Europe: Strasbourg Cedex, France, 2020. [Google Scholar]
  24. Polito, F.; Papaianni, M.; Woo, S.L.; Malaspina, P.; Cornara, L.; De Feo, V. Artemisia arborescens (Vaill.) L.: Micromorphology, Essential Oil Composition, and Its Potential as an Alternative Biocontrol Product. Plants 2024, 13, 825. [Google Scholar] [CrossRef] [PubMed]
  25. Jennings, W.; Shibamoto, T. Qualitative Analyisis of Flavour and Fragrance Volatiles by Glass Capillary Gas Chromatography; Academic Press: New York, NY, USA, 1980. [Google Scholar] [CrossRef]
  26. Davies, N.W. Gas chromatographic retention indices of monoterpenes and sesquiterpenes on methyl silicone and Carbowas 20M phases. J. Chromatogr. 1980, 503, 1–24. [Google Scholar] [CrossRef]
  27. Goodner, K.I. Practical retention index models of OV-101, DB-1, DB-5, and DB-Wax for flavour and fragrance compounds. LWT Food Sci. Technol. 2008, 41, 951–958. [Google Scholar] [CrossRef]
  28. Adams, R.P. Identification of Essential Oil Components by Gas Chromatography/Mass Spectrometry, 5th ed.; Texensis Publishing: Gruver, TX, USA, 2017. [Google Scholar]
  29. McLafferty, F.W. The Wiley Registry of Mass Spectral Data, with Nist Spectral Data CD Rom, 7th ed.; John Wiley & Sons: New York, NY, USA, 1998. [Google Scholar]
  30. Brand-Williams, W.; Cuvelier, M.E.; Berset, C. Use of a free radical method to evaluate antioxidant activity. LWT Food Sci. Technol. 1995, 28, 25–30. [Google Scholar] [CrossRef]
  31. Re, R.; Pellegrini, N.; Proteggente, A.; Pannala, A.; Yang, M.; Rice-Evans, C. Antioxidant activity applying an improved ABTS radical cation decolorization assay. Free Rad. Biol. Med. 1999, 26, 1231–1237. [Google Scholar] [CrossRef]
  32. Waterhouse, A.L. Determination of total phenolics. Curr. Protoc. Food Anal. Chem. 2002, 6, 1–8. [Google Scholar] [CrossRef]
  33. Torres Vera, R.; Bernabé García, A.J.; Carmona Álvarez, F.J.; Martínez Ruiz, J.; Fernández Martín, F. Application and Effectiveness of Methylobacterium symbioticum as a Biological Inoculant in Maize and Strawberry Crops. Folia Microbiol. 2024, 69, 121–131. [Google Scholar] [CrossRef]
  34. Agafonova, N.V.; Kaparullina, E.N.; Doronina, N.V.; Trotsenko, Y.A. Phosphate-solubilizing activity of aerobic Methylobacteria. Microbiology 2013, 82, 864–867. [Google Scholar] [CrossRef]
  35. Arrobas, M.; Correia, C.M.; Rodrigues, M.Â. Methylobacterium symbioticum Applied as a Foliar Inoculant Was Little Effective in Enhancing Nitrogen Fixation and Lettuce Dry Matter Yield. Sustainability 2024, 16, 4512. [Google Scholar] [CrossRef]
  36. Rodrigues, M.Â.; Lopes, J.I.; Martins, S.; Brito, C.; Correia, C.M.; Arrobas, M. A Spray Foliar Containing Methylobacterium symbioticum Did Not Increase Nitrogen Concentration in Leaves or Olive Yield Across Three Rainfed Olive Orchards. Horticulturae 2025, 11, 80. [Google Scholar] [CrossRef]
  37. Shukla, P.S.; Mantin, E.G.; Adil, M.; Bajpai, S.; Critchley, A.T.; Prithiviraj, B. Ascophyllum nodosum-Based Biostimulants: Sustainable Applications in Agriculture for the Stimulation of Plant Growth, Stress Tolerance, and Disease Management. Front. Plant Sci. 2019, 10, 655. [Google Scholar] [CrossRef] [PubMed]
  38. Salehi, S.; Golparvar, A.R.; Hadipanah, A. Effect of harvest time on yield and quality of Thymus vulgaris L. essential oil in Isfahan province, Iran. Agric. Conspec. Sci. 2014, 79, 115–118. [Google Scholar]
  39. Golparvar, A.R.; Bahari, B. Effects of phenological stages on herbage yield and quality/quantity of oil in garden thyme (Thymus vulgaris L.). J. Med. Plants Res. 2011, 5, 6085–6089. [Google Scholar] [CrossRef]
  40. Gouyon, P.H.; Vernet, P.; Guillerm, J.L.; Valdeyron, G. Polymorphisms and environment: The adaptive value of the oil polymorphism in Thymus vulgaris L. Heredity 1986, 57, 59–66. [Google Scholar] [CrossRef]
  41. Jordán, M.J.; Martínez, R.M.; Goodner, K.L.; Baldwin, E.A.; Sotomayor, J.A. Seasonal variation of Thymus hyemalis Lange and Spanish Thymus vulgaris L. essential oils composition. Ind. Crops Prod. 2006, 24, 253–263. [Google Scholar] [CrossRef]
  42. Moisa, C.; Lupitu, A.; Pop, G.; Chambre, D.R.; Popovici, L.; Cioca, G.; Bungau, S.; Popovici, D.M. Variation of the chemical composition of Thymus vulgaris essential oils by phenological stages. Rev. Chim. 2019, 70, 633–637. [Google Scholar] [CrossRef]
  43. Mugao, L. Factors influencing yield, chemical composition and efficacy of essential oils. Int. J. Multidiscip. Res. Growth Eval. 2004, 5, 169–178. [Google Scholar] [CrossRef]
  44. Etri, K.; Gosztola, B.; Végvári, G.; Ficzek, G.; Radácsi, P.; Simon, G.; Pluhár, Z. Unravelling the impact of drought and salt stresses on Thymus pannonicus: Morpho-physiological and biochemical insights. Plant Stress 2024, 13, 100557. [Google Scholar] [CrossRef]
  45. Etri, K.; Pluhár, Z. Exploring Chemical Variability in the Essential Oils of the Thymus Genus. Plants 2024, 13, 1375. [Google Scholar] [CrossRef]
  46. Mancini, E.; Senatore, F.; Del Monte, D.; De Martino, L.; Grulova, D.; Scognamiglio, M.; Snoussi, M.; De Feo, V. Studies on chemical composition, antimicrobial and antioxidant activities of five Thymus vulgaris L. essential oils. Molecules 2015, 20, 12016–12028. [Google Scholar] [CrossRef]
  47. Najar, B.; Pistelli, L.; Ferri, B.; Angelini, L.G.; Tavarini, S. Crop yield and essential oil composition of two Thymus vulgaris chemotypes along three years of organic cultivation in a hilly area of central Italy. Molecules 2021, 26, 5109. [Google Scholar] [CrossRef] [PubMed]
  48. Hudaib, M.; Speroni, E.; Di Pietra, A.M.; Cavrini, V. GC/MS evaluation of thyme (Thymus vulgaris L.) oil composition and variations during the vegetative cycle. J. Pharm. Biomed. Anal. 2002, 29, 691–700. [Google Scholar] [CrossRef] [PubMed]
  49. Shabnum, S.; Wagay, M.G. Essential oil composition of Thymus vulgaris L. and their uses. J. Res. Dev. 2011, 11, 83–94. [Google Scholar]
  50. Galovičová, L.; Borotová, P.; Valková, V.; Vukovic, N.L.; Vukic, M.; Štefániková, J.; Ďúranová, H.; Kowalczewski, P.Ł.; Čmiková, N.; Kačániová, M. Thymus vulgaris essential oil and its biological activity. Plants 2021, 10, 1959. [Google Scholar] [CrossRef] [PubMed]
  51. Abdelli, W.; Bahri, F.; Romane, A.; Höferl, M.; Wanner, J.; Schmidt, E.; Jirovetz, L. Chemical composition and anti-inflammatory activity of algerian thymus vulgaris essential oil. Nat. Prod. Commun. 2017, 12, 611–614. [Google Scholar] [CrossRef]
  52. Borugă, O.; Jianu, C.; Mişcă, C.; Goleţ, I.; Gruia, A.T.; Horhat, F.G. Thymus vulgaris essential oil: Chemical composition and antimicrobial activity. J. Med. Life 2014, 7, 56–60. [Google Scholar]
  53. Satyal, P.; Murray, B.L.; McFeeters, R.L.; Setzer, W.N. Essential oil characterization of Thymus vulgaris from various geographical locations. Foods 2016, 5, 70. [Google Scholar] [CrossRef]
  54. Preljević, K.; Pašić, I.; Vlaović, M.; Matić, I.Z.; Krivokapić, S.; Petrović, N.; Stanojković, T.; Zivković, V.; Perović, S. Comparative analysis of chemical profiles, antioxidant, antibacterial, and anticancer effects of essential oils of two Thymus species from Montenegro. Fitoterapia 2024, 174, 105871. [Google Scholar] [CrossRef]
  55. Tohidi, B.; Rahimmalek, M.; Arzani, A. Essential oil composition, total phenolic, flavonoid contents, and antioxidant activity of Thymus species collected from different regions of Iran. Food Chem. 2017, 220, 153–161. [Google Scholar] [CrossRef]
  56. Nikolić, M.; Glamočlija, J.; Ferreira, I.C.; Calhelha, R.C.; Fernandes, Â.; Marković, T.; Giweli, A.; Soković, M. Chemical composition, antimicrobial, antioxidant and antitumor activity of Thymus serpyllum L., Thymus algeriensis Boiss. and Reut and Thymus vulgaris L. essential oils. Ind. Crops Prod. 2014, 52, 183–190. [Google Scholar] [CrossRef]
  57. Imtara, H.; Al-Waili, N.; Aboulghazi, A.; Abdellaoui, A.; Al-Waili, T.; Lyoussi, B. Chemical composition and antioxidant content of Thymus vulgaris honey and Origanum vulgare essential oil; their effect on carbon tetrachloride-induced toxicity. Vet. World 2021, 14, 292. [Google Scholar] [CrossRef] [PubMed]
  58. Punya, H.N.; Mehta, N.; Chatli, M.K.; Wagh, R.V.; Panwar, H. In-vitro evaluation of antimicrobial and antioxidant Efficacy of thyme (Thymus vulgaris L.) essential oil. J. Anim. Res. 2019, 3, 443–449. [Google Scholar] [CrossRef]
  59. Aljabeili, H.S.; Barakat, H.; Abdel-Rahman, H.A. Chemical composition, antibacterial and antioxidant activities of thyme essential oil (Thymus vulgaris). Food Nutr. Sci. 2018, 9, 433–446. [Google Scholar] [CrossRef]
  60. Lemos, M.F.; Lemos, M.F.; Pacheco, H.P.; Guimarães, A.C.; Fronza, M.; Endringer, D.C.; Scherer, R. Seasonal variation affects the composition and antibacterial and antioxidant activities of Thymus vulgaris. Ind. Crops Prod. 2017, 95, 543–548. [Google Scholar] [CrossRef]
Figure 1. Climatic parameters (mean air temperature and precipitation) during the two growing seasons.
Agronomy 15 00442 g001
Figure 2. Percent composition of main chemical groups in the EOs. MH: monoterpene hydrocarbons; MO: oxygenated monoterpenes; SH: sesquiterpene hydrocarbons; SO: oxygenated sesquiterpenes. The same letters in a column indicate no significant difference, and columns with no letters indicate that all values have not significant difference at p < 0.05, according to a one-way ANOVA followed by Tukey’s post hoc test. The results are the mean of three biological replicates ± SD. The error bars represent the SD.
Agronomy 15 00442 g002
Figure 3. Percentage of major components in the EOs. The same letters in a column indicate no significant difference, and columns with no letters indicate that all values have no significant difference at p < 0.05, according to a one-way ANOVA followed by Tukey’s post hoc test. The results are the mean of three biological replicates ± SD. The error bars represent the SD.
Agronomy 15 00442 g003
Table 1. Composition and dose of the application of biostimulants used.
BiostimulantsCompositionDose of Application
BPPVP®
Biostimol PlusAlgal extract of A. nodosum, total organic carbon (C) of biological origin (1.7%), mannitol (7%), and alginic acid (2–3%).2 g L−1
Peptamin-V Plus®Organic nitrogen (N) (3%) and C of biological origin (10%) and chelates of iron, manganese, and zinc.3 g L−1
Acadian®Algal extract of A. nodosum, N (1%), potassium oxide (K2O) (19%) betaines (0.1%), mannitol (4%), and C of biological origin (20%).1 g L−1
Megafol®Total nitrogen (3%); organic nitrogen (1%); urea nitrogen (2%); K2O (8%); C of biological origin (9%); amino acids (glycin and glutamic acid); betaines; proteins; vitamins (B5, PP, B1, and B6); auxin; gibberellin; cytokine.2.5 mL L−1
BlueN®Bacterial strain Methylobacterium symbioticum (SB23; 3 × 10⁷ UFC/g).0.33 g L−1
Table 2. Morphological and yield parameters in response to biostimulants during the first and second years.
TreatmentsPlant Height (cm)Plant Width (cm)Stem
Diameter
(mm)
Plant Fresh Weight (g)Branches
(n. plant−1)
Branches Weight (g)Fresh Biomass Yield
(g m−2)
Dry Yield
(g m−2)
1st year (2023)
Biostimulant
Control25.4 ± 0.1022.6 ± 0.163.9 ±
0.09 a
95.7 ± 0.30 ab35.3 ±
0.07 a
2.7 ±
0.13
315.8 ±
2.21 b
102.9 ±
2.43 ab
BPPVP®26.0 ± 0.0821.9 ± 0.144.1 ±
0.12 ab
89.0 ± 0.21 a40.8 ±
0.10 b
2.2 ±
0.10
293.7 ±
2.32 ab
97.5 ±
2.45 a
Acadian®25.6 ± 0.0620.8 ± 0.124.2 ±
0.13 ab
100.8 ± 0.25 b41.2 ±
0.11 b
2.5 ±
0.10
332.6 ±
2.33 c
115.4 ±
2.34 b
Megafol®25.0 ± 0.1020.8 ± 0.093.9 ±
0.11 a
83.8 ± 0.28 a41.7 ±
0.09 b
2.0 ±
0.12
276.5 ±
2.35 a
96.5 ±
2.41 a
BlueN®25.9 ± 0.0922.9 ± 0.104.5 ±
0.10 b
98.8 ± 0.27 ab39.2 ±
0.15 ab
2.5 ±
0.14
326.1 ±
2.24 bc
108.9 ±
2.39 ab
nsns***ns***
2nd year (2024)
Control29.0 ± 0.07 ab31.2 ± 0.162.7 ±
0.17 a
110.2 ± 0.31 a42.3 ±
0.22 a
2.6 ±
0.07
363.7 ±
2.56 a
128.1 ±
2.54 a
BPPVP®32.1 ± 0.08 b30.2 ± 0.082.5 ±
0.12 a
128.4 ± 0.29 ab54.9 ±
0.18 ab
2.3 ±
0.10
423.7 ±
2.30 ab
149.6 ±
2.40 b
Acadian®29.8 ± 0.05 ab32.4 ± 0.113.0 ±
0.11 ab
139.7 ± 0.27 b58.1 ±
0.14 b
2.4 ±
0.09
461.1 ±
2.38 bc
160.5 ±
2.38 bc
Megafol®27.0 ± 0.09 a31.1 ± 0.143.3 ±
0.10 b
132.7 ± 0.22 b48.8 ±
0.11 a
2.7 ±
0.08
437.9 ±
2.40 b
139.3 ±
2.46 ab
BlueN®28.7 ± 0.09 a31.1 ± 0.083.0 ±
0.20 ab
152.1 ± 0.32 c57.9 ±
0.25 b
2.6 ±
0.11
501.9 ±
2.44 c
172.2 ±
2.82 c
*ns****ns****
Values followed by a different letter within each year are significantly different at p ≤ 0.05, according to Tukey’s test. *, significance at p < 0.05; **, significance at p < 0.01; ns: no significant difference.
Table 3. Yield of the EOs on a dried basis (w/w) of T. vulgaris obtained by different biostimulant treatments with reference to the two years.
Yield (%)
1st Year2nd Year
Control0.55 ± 0.100.56 ± 0.11
BPPVP0.30 ± 0.080.47 ± 0.10
Acadian®0.37 ± 0.170.52 ± 0.13
Megafol®0.31 ± 0.080.45 ± 0.09
BlueN®0.47 ± 0.090.53 ± 0.11
The results are the mean of three experiments ± SD. No significant difference was found at p < 0.05, according to a one-way ANOVA followed by Tukey’s post hoc test.
Table 4. Chemical composition of essential oils.
CompoundKI aKI b%
ControlBPPVPAcadian®Megafol®BlueN®Identification c
1st Year2nd Year1st Year2nd Year1st Year2nd Year1st Year2nd Year1st Year2nd Year
2.Methyl-butanoic acid, methyl ester758-0.10 ± 0.17-0.11 ± 0.20---0.23 ± 0.21-0.27 ± 0.23-1,2
α-Thujene85810272.04 ± 0.121.33 ± 0.052.06 ± 0.291.28 ± 0.171.78 ± 0.361.37 ± 0.062.15 ± 0.411.09 ± 0.292.06 ± 0.091.35 ± 0.021,2,3
α-Pinene86210251.28 ± 0.070.93 ± 0.161.35 ± 0.250.77 ± 0.081.22 ± 0.260.90 ± 0.051.43 ± 0.220.48 ± 0.421.35 ± 0.080.85 ± 0.061,2,3
Camphene87410680.98 ± 0.100.64 ± 0.581.03 ± 0.110.22 ± 0.380.93 ± 0.210.67 ± 0.101.07 ± 0.130.18 ± 0.310.94 ± 0.080.51 ± 0.131,2,3
β-Pinene89911100.46 ± 0.03-0.57 ± 0.16-0.37 ± 0.32-0.50 ± 0.07-0.46 ± 0.02-1,2,3
1-Octen-3-ol90814441.03 ± 0.06-1.03 ± 0.200.17 ± 0.290.96 ± 0.310.37 ± 0.320.94 ± 0.12-1.12 ± 0.07-1,2
β-Myrcene91811612.07 ± 0.171.32 ± 0.122.10 ± 0.121.33 ± 0.091.85 ± 0.291.27 ± 0.072.08 ± 0.350.85 ± 0.432.02 ± 0.131.38 ± 0.191,2,3
α-Terpinene93911782.16 ± 0.151.30 ± 0.322.24 ± 0.241.42 ± 0.131.98 ± 0.231.19 ± 0.082.07 ± 0.301.03 ± 0.162.00 ± 0.031.17 ± 0.151,2,3
p-Cymene949127024.43 ± 2.4018.59 ± 2.9424.04 ± 2.0018.60 ± 2.7925.35 ± 2.8119.95 ± 0.0726.18 ± 2.5216.23 ± 4.4626.77 ± 1.6421.01 ± 0.951,2,3
Limonene95111980.77 ± 0.04-0.77 ± 0.05-0.67 ± 0.070.36 ± 0.310.77 ± 0.110.19 ± 0.330.72 ± 0.020.77 ± 0.161,2,3
Eucalyptol95212110.86 ± 0.111.31 ± 0.371.35 ± 0.641.20 ± 0.531.46 ± 0.861.93 ± 0.761.08 ± 0.080.43 ± 0.381.00 ± 0.101.18 ± 0.331,2,3
γ-Terpinene981124512.21 ± 1.118.02 ± 1.5014.06 ± 1.459.23 ± 0.9212.51 ± 1.026.52 ± 0.2112.43 ± 0.985.86 ± 1.1211.93 ± 0.777.42 ± 0.381,2,3
cis-Sabinene hydrate98714601.44 ± 0.150.92 ± 0.031.20 ± 0.070.75 ± 0.071.10 ± 0.130.98 ± 0.021.26 ± 0.070.78 ± 0.031.30 ± 0.081.35 ± 0.391,2
trans-Sabinene hydrate101215490.25 ± 0.22-0.10 ± 0.17-0.21 ± 0.18-0.34 ± 0.03-0.24 ± 0.21-1,2
Linalool101915432.75 ± 0.061.70 ± 0.243.11 ± 0.082.16 ± 0.123.00 ± 0.442.04 ± 0.072.80 ± 0.121.99 ± 0.292.81 ± 0.151.84 ± 0.051,2,3
Camphor105415150.64 ± 0.420.41 ± 0.720.71 ± 0.23-0.65 ± 0.17-0.98 ± 0.18-0.59 ± 0.080.57 ± 0.051,2,3
Borneol107617001.95 ± 0.251.73 ± 0.451.99 ± 0.111.48 ± 0.142.14 ± 0.141.71 ± 0.401.90 ± 0.221.29 ± 0.201.73 ± 0.101.26 ± 0.231,2,3
Verbenone10791720----0.10 ± 0.17----0.64 ± 0.061,2
Terpinen-4-ol108816010.78 ± 0.01-0.87 ± 0.030.61 ± 0.020.88 ± 0.09-0.87 ± 0.020.22 ± 0.390.70 ± 0.05-1,2
α-Terpineol10971694--0.10 ± 0.17-0.12 ± 0.21-0.10 ± 0.18---1,2,3
Thymol methyl ether114215810.89 ± 0.85-1.96 ± 0.771.55 ± 0.511.80 ± 0.640.57 ± 0.991.89 ± 1.250.23 ± 0.391.79 ± 0.410.96 ± 0.071,2
Carvacrol methyl ether115016140.73 ± 0.29-0.88 ± 0.380.84 ± 0.120.94 ± 0.430.78 ± 0.141.01 ± 0.42-0.91 ± 0.351.28 ± 0.251,2
Bornyl acetate11651575---------0.52 ± 0.041,2
Thymol1198216433.95 ± 3.4455.75 ± 2.2530.32 ± 4.2853.76 ± 4.6531.04 ± 6.7654.42 ± 0.8929.64 ± 2.9263.75 ± 8.9232.40 ± 2.6649.93 ± 1.071,2,3
Carvacrol120422112.74 ± 0.363.13 ± 0.152.43 ± 0.272.93 ± 0.362.45 ± 0.372.93 ± 0.092.40 ± 0.363.16 ± 0.202.55 ± 0.282.25 ± 0.221,2,3
Caryophyllene130415983.80 ± 0.342.49 ± 0.503.82 ± 0.481.69 ± 0.134.42 ± 0.701.99 ± 0.064.03 ± 0.762.01 ± 0.273.28 ± 0.202.65 ± 0.301,2
Thymoquinol1330--0.43 ± 0.380.11 ± 0.18---0.29 ± 0.510.23 ± 0.40-0.62 ± 0.081,2
Germacrene D136417080.66 ± 0.03-0.88 ± 0.15-0.75 ± 0.09-0.55 ± 0.12-0.48 ± 0.10-1,2
γ-Cadinene13971763--0.23 ± 0.21-0.20 ± 0.17-0.33 ± 0.06-0.13 ± 0.23-1,2
δ-Cadinene140217560.39 ± 0.03-0.13 ± 0.23-0.41 ± 0.06-0.37 ± 0.12---1,2
Caryophyllene oxide145719860.46 ± 0.04-0.27 ± 0.24-0.45 ± 0.03-0.97 ± 1.12-0.27 ± 0.230.49 ± 0.181,2
τ-Cadinol14752151--0.11 ± 0.18-------1,2
Total 99.82 ± 0.2899.99 ± 0.0199.93 ± 0.1099.99 ± 0.0199.88 ± 0.1099.96 ± 0.0699.69 ± 0.29100.00 ± 0.0099.82 ± 0.28100.00 ± 0.00
Monoterpene hydrocarbons 46.40 ± 2.6532.13 ± 1.9748.22 ± 3.3532.85 ± 1.6746.66 ± 3.4532.23 ± 1.2348.68 ± 3.1825.91 ± 2.0148.25 ± 3.5634.46 ± 2.17
Oxygenated monoterpenes 46.98 ± 3.0464.94 ± 4.0145.41 ± 3.2365.28 ± 3.2546.03 ± 2.7665.37 ± 4.2243.30 ± 3.4571.85 ± 4.7846.02 ± 3.5661.78 ± 4.35
Sesquiterpene hydrocarbons 4.85 ± 0.782.49 ± 0.654.68 ± 0.771.69 ± 0.225.78 ± 0.981.99 ± 0.575.28 ± 0.882.01 ± 0.243.89 ± 0.762.65 ± 0.62
Oxygenated sesquiterpenes 0.46 ± 0.060.43 ± 0.050.49 ± 0.04-0.45 ± 0.15-1.26 ± 0.130.23 ± 0.070.27 ± 0.091.11 ± 0.14
Others 1.13 ± 0.11-1.13 ± 0.130.17 ± 0.050.96 ± 0.210.37 ± 0.091.17 ± 0.18-1.39 ± 0.17-
a,b Kovats retention indices determined relative to a series of n-alkanes (C10–C35) on the apolar HP-5 MS and the polar HP Innowax capillary columns, respectively. c Identification method: 1 = comparison of the Kovats retention indices with published data; 2 = comparison of mass spectra with those listed in the NIST 02 and Wiley 275 libraries and with published data; 3 = co-injection with authentic compounds; - = absent. The results are the mean of three experiments ± SD.
Table 5. Antioxidant capacity (DPPH and ABTS) and total phenolic content (TPC) of the EOs.
DPPH
IC50 (mg/mL)
(Mean ± SD)
ABTS
TEAC (μmol/g)
(Mean ± SD)
TPC
mg GAE/g EO
(Mean ± SD)
1st Year2nd Year1st Year2nd Year1st Year2nd Year
Control0.98 ± 0.062.70 ± 0.04 bc21.43 ± 1.2327.56 ± 1.8765.32 ± 2.5443.56 ± 2.28 ab
BPPVP0.98 ± 0.082.83 ± 0.05 b21.37 ± 1.3626.97 ± 1.5864.77 ± 2.6744.21 ± 2.16 a
Acadian®0.97 ± 0.063.41 ± 0.08 a22.01 ± 1.6524.43 ± 1.3763.54 ± 2.1237.76 ± 2.54 c
Megafol®0.97 ± 0.092.64 ± 0.09 d21.87 ± 2.3823.87 ± 2.0963.87 ± 2.9743.33 ± 1.93 ab
BlueN®0.98 ± 0.082.20 ± 0.07 e22.23 ± 1.1225.01 ± 2.0165.98 ± 2.4745.65 ± 1.91 a
ns*nsnsns*
Trolox3.45 × 10−3 ± 0.2 × 10⁻³
Ascorbic acid 38.3 × 10³ ± 0.8 × 10³
The results are the mean of three biological replicates ± SD. Trolox and ascorbic acid were used as reference substances.* Values followed by a different letter within each column are significantly different at p < 0.05, according to a one-way ANOVA followed by Tukey’s post hoc test. ns: no significant difference.
Disclaimer/Publisher’s Note: The statements, opinions and data contained in all publications are solely those of the individual author(s) and contributor(s) and not of MDPI and/or the editor(s). MDPI and/or the editor(s) disclaim responsibility for any injury to people or property resulting from any ideas, methods, instructions or products referred to in the content.

