Article

Organic Manure Amendment Fortifies Soil Health by Enriching Beneficial Metabolites and Microorganisms and Suppressing Plant Pathogens

1
State Key Laboratory of Efficient Utilization of Arid and Semi-arid Arable Land in Northern China, the Institute of Agricultural Resources and Regional Planning, Chinese Academy of Agricultural Sciences, Beijing 100081, China
2
Jilin Academy of Agricultural Sciences, Northeast Agricultural Research Center of China, Changchun 130033, China
3
Henan Key Laboratory of Ion-Beam Green Agriculture Bioengineering, School of Agricultural Science, Zhengzhou University, Zhengzhou 450000, China
*
Authors to whom correspondence should be addressed.
These authors contributed equally to this work.
Agronomy 2025, 15(2), 429; https://doi.org/10.3390/agronomy15020429
Submission received: 30 December 2024 / Revised: 4 February 2025 / Accepted: 6 February 2025 / Published: 9 February 2025

Abstract

:
Soil health reflects the sustained capacity of soil to function as a vital living ecosystem, ensuring support for all forms of life. The evaluation of soil health relies heavily on physicochemical indicators. However, it remains unclear whether and how microbial traits are related to soil health in soil with long-term organic manure amendment. This study aims to examine how detrimental and beneficial microbial traits change with soil health based on physicochemical indicators. This research measures the effects of 9-year manure supplementation on soil health using multiomics techniques. We found that, compared to 100% chemical fertilizers, the soil health index increased by 5.2%, 19.3%, and 72.6% with 25%, 50%, and 100% organic fertilizer amendments, respectively. Correspondingly, the abundance of beneficial microorganisms, including Actinomadura, Actinoplanes, Aeromicrobium, Agromyces, Azospira, Cryobacterium, Dactylosporangium, Devosia, Hyphomicrobium, Kribbella, and Lentzea, increased progressively, while the abundance of the pathogenic fungus Fusarium decreased with the organic manure application rate. In addition, the application of organic manure significantly increased the concentrations of soil metabolites, such as sugars (raffinose, trehalose, maltose, and maltotriose) and lithocholic acid, which promoted plant growth and soil aggregation. Moreover, the abundances of pathogens and beneficial microorganisms and the concentrations of beneficial soil metabolites were significantly correlated with the soil health index based on physicochemical indicators. We conclude that organic fertilizer can enhance soil health by promoting the increase in beneficial microorganisms while suppressing detrimental microorganisms, which can serve as potential indicators for assessing soil health. In agricultural production, substituting 25–50% of chemical fertilizers with organic fertilizers significantly helps improve soil health and promotes crop growth.

1. Introduction

Soil health is the soil’s sustained capacity to function as a vital living ecosystem that supports plants, animals, and humans (https://www.nrcs.usda.gov/conservation-basics/natural-resource-concerns/soils/soil-health (accessed on 7 February 2025)). The status of soil health results from the interaction of soil physical and chemical properties, as well as complex microbial communities [1]. While it is widely accepted that soil type governs the soil microbiome, leading to the notion that soil physicochemical properties shape soil microbial composition [2], the soil microbiome can have a significant feedback effect that alters these properties [3,4]. In addition, numerous studies have demonstrated that changes in the soil microbiome, even in soils with similar physical and chemical properties, would substantially impact soil function [5,6,7]. However, traditional assessments of soil health primarily rely on the Soil Health Index (SHI), focusing on physicochemical indicators such as soil organic matter (SOM), pH, total nitrogen (TN), available phosphorus (available P), and available potassium (available K), with insufficient explorations of microbial indicators [1,8,9].
Building on the close relationship between soil microbial communities and soil function, investigating the effects of organic amendment on soil microbial communities is crucial for understanding its role in enhancing soil health. The application of organic manure to farmland not only manages livestock waste but also enhances soil fertility and crop productivity [10,11]. This agricultural practice is used worldwide, and its effect on soil health has garnered significant attention. Early studies predominantly used chemical indicators to assess the effect of manure application on soil health [12]. Later studies gradually incorporated microbial biomass, microbial diversity, and extracellular enzyme activity into the assessment framework for soil health [13,14,15,16]. However, microbial biomass and enzyme activity indicators may not be linearly related to soil health [17,18]. Additionally, abundances of plant-beneficial bacteria and pathogens were widely recognized as influencing plant health [19,20]. However, due to technological limitations, previous studies of the impact of organic fertilizer application on these microorganisms are limited, with research primarily focusing on its effects on soil microbial diversity and community composition [21,22]. This knowledge gap is beginning to close with the development of microbial function trait databases, such as plant-beneficial bacteria (PBB) and FungalTraits, which categorize all sequences in bacteria and fungi reference databases based on established functions [23,24]. The impact of long-term organic amendment on beneficial and pathogenic microorganisms remains unclear, and the relationship between these microorganisms and soil health is not well defined. Mapping microbial sequences to these databases is an effective approach for assessing beneficial microorganisms upon organic fertilizer application, helping to link the roles of beneficial bacteria and pathogens to soil health [25,26,27].
Soil metabolites play a crucial role in mediating the interactions between plants, soil, and microorganisms [28]. Soil metabolites play a crucial role in regulating the assembly of the rhizosphere microbiome and may further influence soil health. The increase in certain metabolites is associated with the colonization of specific beneficial microorganisms in soil and a reduction in disease incidence [29,30]. Organic manure contains a diverse array of metabolites [31,32], which interact with soil microorganisms to modify the soil metabolite profiles. However, knowledge is still limited on how metabolites change in soil subjected to long-term manure application. It is also unclear whether the metabolites enriched in organically amended soils are beneficial to soil health.
In this study, our primary objective is to investigate the impact of the long-term application of organic manure, such as composted cow manure, as a substitute for chemical N fertilizers on soil health. To achieve this, we employed elemental analysis, enzymatic assays, and microbiome and metabolome techniques to focus on the changes in soil physicochemical properties, microbial communities, and metabolites after organic manure amendment, as well as their interrelationships and roles in soil health. We hypothesize that long-term manure application will result in (1) an increase in the soil health index with the rise in organic fertilizer application; (2) an increase in beneficial microorganisms and a decrease in pathogenic microbes; and (3) an enrichment of beneficial metabolites.

2. Materials and Methods

2.1. Study Sites and Sample Collection

The long-term black soil experimental field was established in 2014 in Gongzhuling City, Jilin Province, China (43°37′12″ N, 124°45′0″ E), with an altitude of 150–200 m. The area experiences a temperate continental monsoon climate with an average annual temperature of 5.6 °C, annual sunshine hours between 2500 and 2700 h, average annual precipitation of 594.8 mm, and a frost-free period of 144 days. The experiment was designed using a completely randomized block design with four treatments, each with three replicates, for a total of 12 plots, each 54 m2 in size, with maize as the planted crop. Before the experiment in 2014, the basic physicochemical properties of the 0–20 cm soil layer were as follows: soil organic matter content of 19.4 g/kg, total nitrogen content of 1.033 g/kg, and pH of 5.6. The treatments included the following: (1) full chemical fertilizer (M0); (2) organic fertilizer replacing 25% of nitrogen fertilizer (M25); (3) organic fertilizer replacing 50% of nitrogen fertilizer (M50); and (4) organic fertilizer replacing 100% of nitrogen fertilizer (M100). The experiment started in 2014, with organic fertilizer being applied after each autumn harvest and chemical fertilizers being applied in the second spring as base fertilizers. Organic fertilizer, phosphorus, and potassium fertilizers were all applied once as base fertilizers, with one-third of the nitrogen being applied as base fertilizer and two-thirds as topdressing. The total fertilization regime included N at 180 kg/ha, P2O5 at 90 kg/ha, and K2O at 100 kg/ha. The organic fertilizer used was composted cow manure, while the nitrogen, phosphorus, and potassium fertilizers included urea, diammonium phosphate, and potassium chloride, respectively.
In July 2023, surface soil samples (0–20 cm deep) were collected for each treatment using a five-point sampling method. The soil samples were promptly placed in a cooler and transported to the laboratory. Stones and roots were then removed from the samples. A portion of the samples was frozen at −20 °C for subsequent DNA extraction, enzyme activity assays, and metabolomics analyses, while another portion was air-dried and sieved through 20-mesh and 100-mesh screens to determine soil physicochemical properties. Soil passed through a 20-mesh sieve was used for measuring pH, available P, and available K. Soil passed through a 100-mesh sieve was used for measuring TN and SOM.

2.2. Determination of Soil Physicochemical Properties and Enzyme Activities

Soil pH was measured with a pH electrode at a soil-to-water ratio of 1:2.5. The SOM content was measured using the potassium dichromate volumetric method. Soil TN was quantified using the Kjeldahl digestion–distillation method. Available P was analyzed using the Olsen method. Available K was analyzed using the ammonium acetate extraction and flame photometry method [33].
Enzymatic activities of acid phosphatase (AP), β-glucosidase (BG), N-acetyl-β-glucosaminidase (NAG), and L-leucine aminopeptidase (LAP) were assessed using a high-throughput microplate protocol. In brief, one gram of fresh soil was homogenized in 50 mL of sterile water and kept evenly suspended with a magnetic stirrer. Then, 200 μL of soil slurry was pipetted into 96-well black microplates, with 200 μL of 50 mM sodium acetate solution as a negative control, followed by 50 μL of 50 mM sodium acetate solution, 50 μL of standards (10 μM 4-methylumbelliferone (Sigma-Aldrich, Shanghai, China) for AP, BG, and NAG and 7-amino-4-methyl coumarin (Sigma-Aldrich, Shanghai, China) for LAP), or 50 μL of corresponding substrates (200 μM 4-methylumbelliferyl phosphate (Sigma-Aldrich, Shanghai, China) for AP, 200 μM 4-methylumbelliferyl β-D-glucopyranoside (Sigma-Aldrich, Shanghai, China) for BG, 200 μM 4-methylumbelliferyl N-acetyl-β-D-glucosaminide (Sigma-Aldrich, Shanghai, China) for NAG, and 200 μM L-leucine-7-amido-4-methylcoumarin hydrochloride (Sigma-Aldrich, Shanghai, China) for LAP). The microplate was incubated in the dark at 25 °C for 4 h, after which 10 μL of 1 M NaOH solution was added to each well. Fluorescence was quantified using a microplate fluorometer (Scientific Fluoroskan Ascent FL, Thermo Fisher Scientific Inc., Waltham, MA, USA) with excitation at 365 nm and emission at 450 nm. Enzyme activity was calculated and expressed as nmol/h/g [34].

2.3. Illumina Sequencing and Raw Data Processing

DNA was extracted from 0.5 g soil samples using the Fast DNA SPIN Kit for Soil (MP Biomedicals, Santa Ana, CA, USA) following the manufacturer’s protocol. After extraction, the quality of extracted DNA was verified by agarose gel electrophoresis. Samples were stored at −20 °C for subsequent use. For bacterial analysis, the primers F515 (5′-CACGGTCGKCGGCGCCATT-3′) and R806 (5′-GGACTACHVGGGTWTCTAAT-3′), each carrying a unique 12 bp barcode, were used for PCR amplification in a 50 µL reaction mixture. This mixture included 35.5 µL of molecular biology-grade water, 5 µL of 10 × buffer, 4 µL of 2.5 µmol mL−1 dNTP, 1 µL of 10 µmol L−1 F515, 2 µL of 10 µmol L−1 R806, 0.5 µL of 5 U µL−1 Taq DNA polymerase (Takara Bio Inc., San Jose, CA, USA), and 2 µL of template DNA. The PCR was carried out on a PCR machine (T100, Biorad Laboratories, Inc., Hercules, CA, USA) under the following conditions: initial denaturation at 94 °C for 5 min, followed by 30 cycles of denaturation at 94 °C for 45 s, annealing at 55 °C for 35 s, and extension at 72 °C for 45 s, with a final extension step at 72 °C for 10 min [35].
For fungal analysis, the internal transcribed spacer (ITS) region between ribosomal protein genes was amplified using two rounds of PCR amplification. In the first round, ITS1F (5′-CTTGGTCATTTAGAGGAAGTAA-3′) and ITS4 (5′-TCCTCCGCTTATTGATATGC-3′) primers were used in a 25 μL reaction containing 18.25 μL ddH2O, 2.5 μL 10 × buffer, 2 μL dNTP, 0.25 μL Taq polymerase (Takara Bio Inc., San Jose, CA, USA), 0.5 μL of each primer, and 1 μL DNA template. The cycling conditions were pre-denaturation at 94 °C for 5 min, followed by 20 cycles of denaturing at 94 °C for 40 s, annealing at 55 °C for 30 s, and extending at 72 °C for 40 s, with a final elongation step at 72 °C for 10 min. In the second round of PCR, the ITS1 (5′-CTTGGTCATTTAGAGGAAGTAA-3′) and ITS2 (5′-GCTGCGTTCTTCATCGATGC-3′) primers, each carrying a unique 10 bp barcode, were used. The reaction mixture and thermal cycling conditions were similar to those of the first round, except 25 cycles were performed in the second round [36].
The PCR products were verified by electrophoresis on 1% agarose gels to ensure successful amplification and to check the size of the products. The concentrations of the PCR products were determined using a Picogreen dsDNA Quantitation Kit (Thermo Fisher Scientific Inc., Waltham, MA, USA). The PCR products were then purified using a DNA Purification Kit (Tiangen Technologies, Beijing, China) to remove excess primers, nucleotides, and enzymes. After purification, the PCR products were dissolved in 100 µL of sterile high-purity water and subjected to sequencing using the paired-end 250 bp strategy on the HiSeq2500 platform (Illumina Inc., San Diego, CA, USA). The original fluorescence image files obtained from the Illumina platform were transformed into short reads (raw data) through base calling. These short reads were recorded in FASTQ format, which contains both the sequence information and the corresponding sequencing quality scores, ensuring data reliability and accuracy for downstream analysis.
After removing barcodes and primers and performing quality control and filtering, the sequencing data were processed using the ASV method. Bacterial taxonomy was annotated using the RDP database (https://ngdc.cncb.ac.cn/databasecommons/database/id/237/ (accessed on 1 January 2024)), selecting bacterial and archaeal ASVs while excluding chloroplasts, mitochondria, and unannotated species. Fungal taxonomy was annotated using the UNITE database (https://unite.ut.ee/ (accessed on 1 January 2024)), filtering for fungi and excluding non-fungal and unannotated species. To ensure the consistency of microbial community diversity assessments, sequence counts were standardized to 20,000 for bacteria and 40,000 for fungi across all samples. All subsequent analyses were conducted using these normalized datasets [37]. The bacterial and fungal communities were annotated using the PBB and FungalTraits databases to identify beneficial microorganisms and pathogens.

2.4. Metabolite Extraction and LC-MS Analyses

Soil samples (100 mg) were collected, combined with beads, and immersed in 500 μL of extraction solution (methanol [MeOH]:acetonitrile [ACN]:water [H₂O] at a ratio of 2:2:1, v/v) containing deuterated internal standards. The mixture was vortexed for 30 s, homogenized (35 Hz, 4 min), and sonicated for 5 min in a 4 °C water bath. This process was repeated three times. Samples were then incubated at −40 °C for 1 h to precipitate proteins. Following incubation, the samples were centrifuged at 13,800× g for 15 min at 4 °C. The supernatant was transferred to a new glass vial for subsequent analysis. A quality control (QC) sample was prepared by combining equal portions of the supernatants from all samples.
LC-MS/MS analyses for non-polar metabolites were conducted on a UHPLC system (Vanquish, Thermo Fisher Scientific Inc., Waltham, MA, USA) equipped with a Phenomenex Kinetex C18 column (2.1 mm × 50 mm, 2.6 μm) coupled to an Orbitrap Exploris 120 mass spectrometer (Orbitrap MS, Thermo Fisher Scientific Inc., Waltham, MA, USA). The mobile phase consisted of A (0.01% acetic acid in water) and B (isopropanol (IPA):acetonitrile (ACN) (1:1, v/v)). The auto-sampler was operated at 4 °C with an injection volume of 2 μL. The Orbitrap Exploris 120 mass spectrometer was used in information-dependent acquisition (IDA) mode, controlled by the Xcalibur acquisition software (Thermo Fisher Scientific Inc., Waltham, MA, USA, version 4.7). In this mode, the software continuously assesses the full-scan MS spectrum. The ESI source conditions were configured as follows: a sheath gas flow rate at 50 Arb, an auxiliary gas flow rate at 15 Arb, a capillary temperature of 320 °C, full MS resolution at 60,000, MS/MS resolution at 15,000, collision energy of SNCE 20/30/40, and a spray voltage of 3.8 kV (positive) or −3.4 kV (negative) [38].
Raw data were first converted to mzXML format using MSConvert within the ProteoWizard software package (v3.0.8789). The data were then processed with R XCMS (v3.12.0) for feature detection, retention time correction, and alignment. Key parameter settings were configured as follows: ppm = 15, peakwidth = c (5, 30), mzdiff = 0.01, method = centWave. The data were subsequently normalized using the area normalization method to mitigate systematic errors. Metabolites were identified based on accurate mass and MS/MS data, which were compared with databases such as HMDB (http://www.hmdb.ca/ (accessed on 1 January 2024)), massbank (http://www.massbank.jp/ (accessed on 1 January 2024)), LipidMaps (http://www.lipidmaps.org/ (accessed on 1 January 2024)), mzcloud (https://www.mzcloud.org/ (accessed on 1 January 2024)), KEGG (https://www.genome.jp/kegg/ (accessed on 1 January 2024)), and a metabolite database constructed by Shanghai Personal Biotechnology Cp. Ltd. (Shanghai, China). The molecular weight of metabolites was determined based on the m/z (mass-to-charge ratio) of parent ions in MS data. The molecular formula was predicted by considering adduct ions and matched with the database for MS identification of metabolites. Concurrently, MS/MS data from the quantitative table of MS/MS data were aligned with the fragment ions and other relevant information in the database to facilitate accurate metabolite identification.

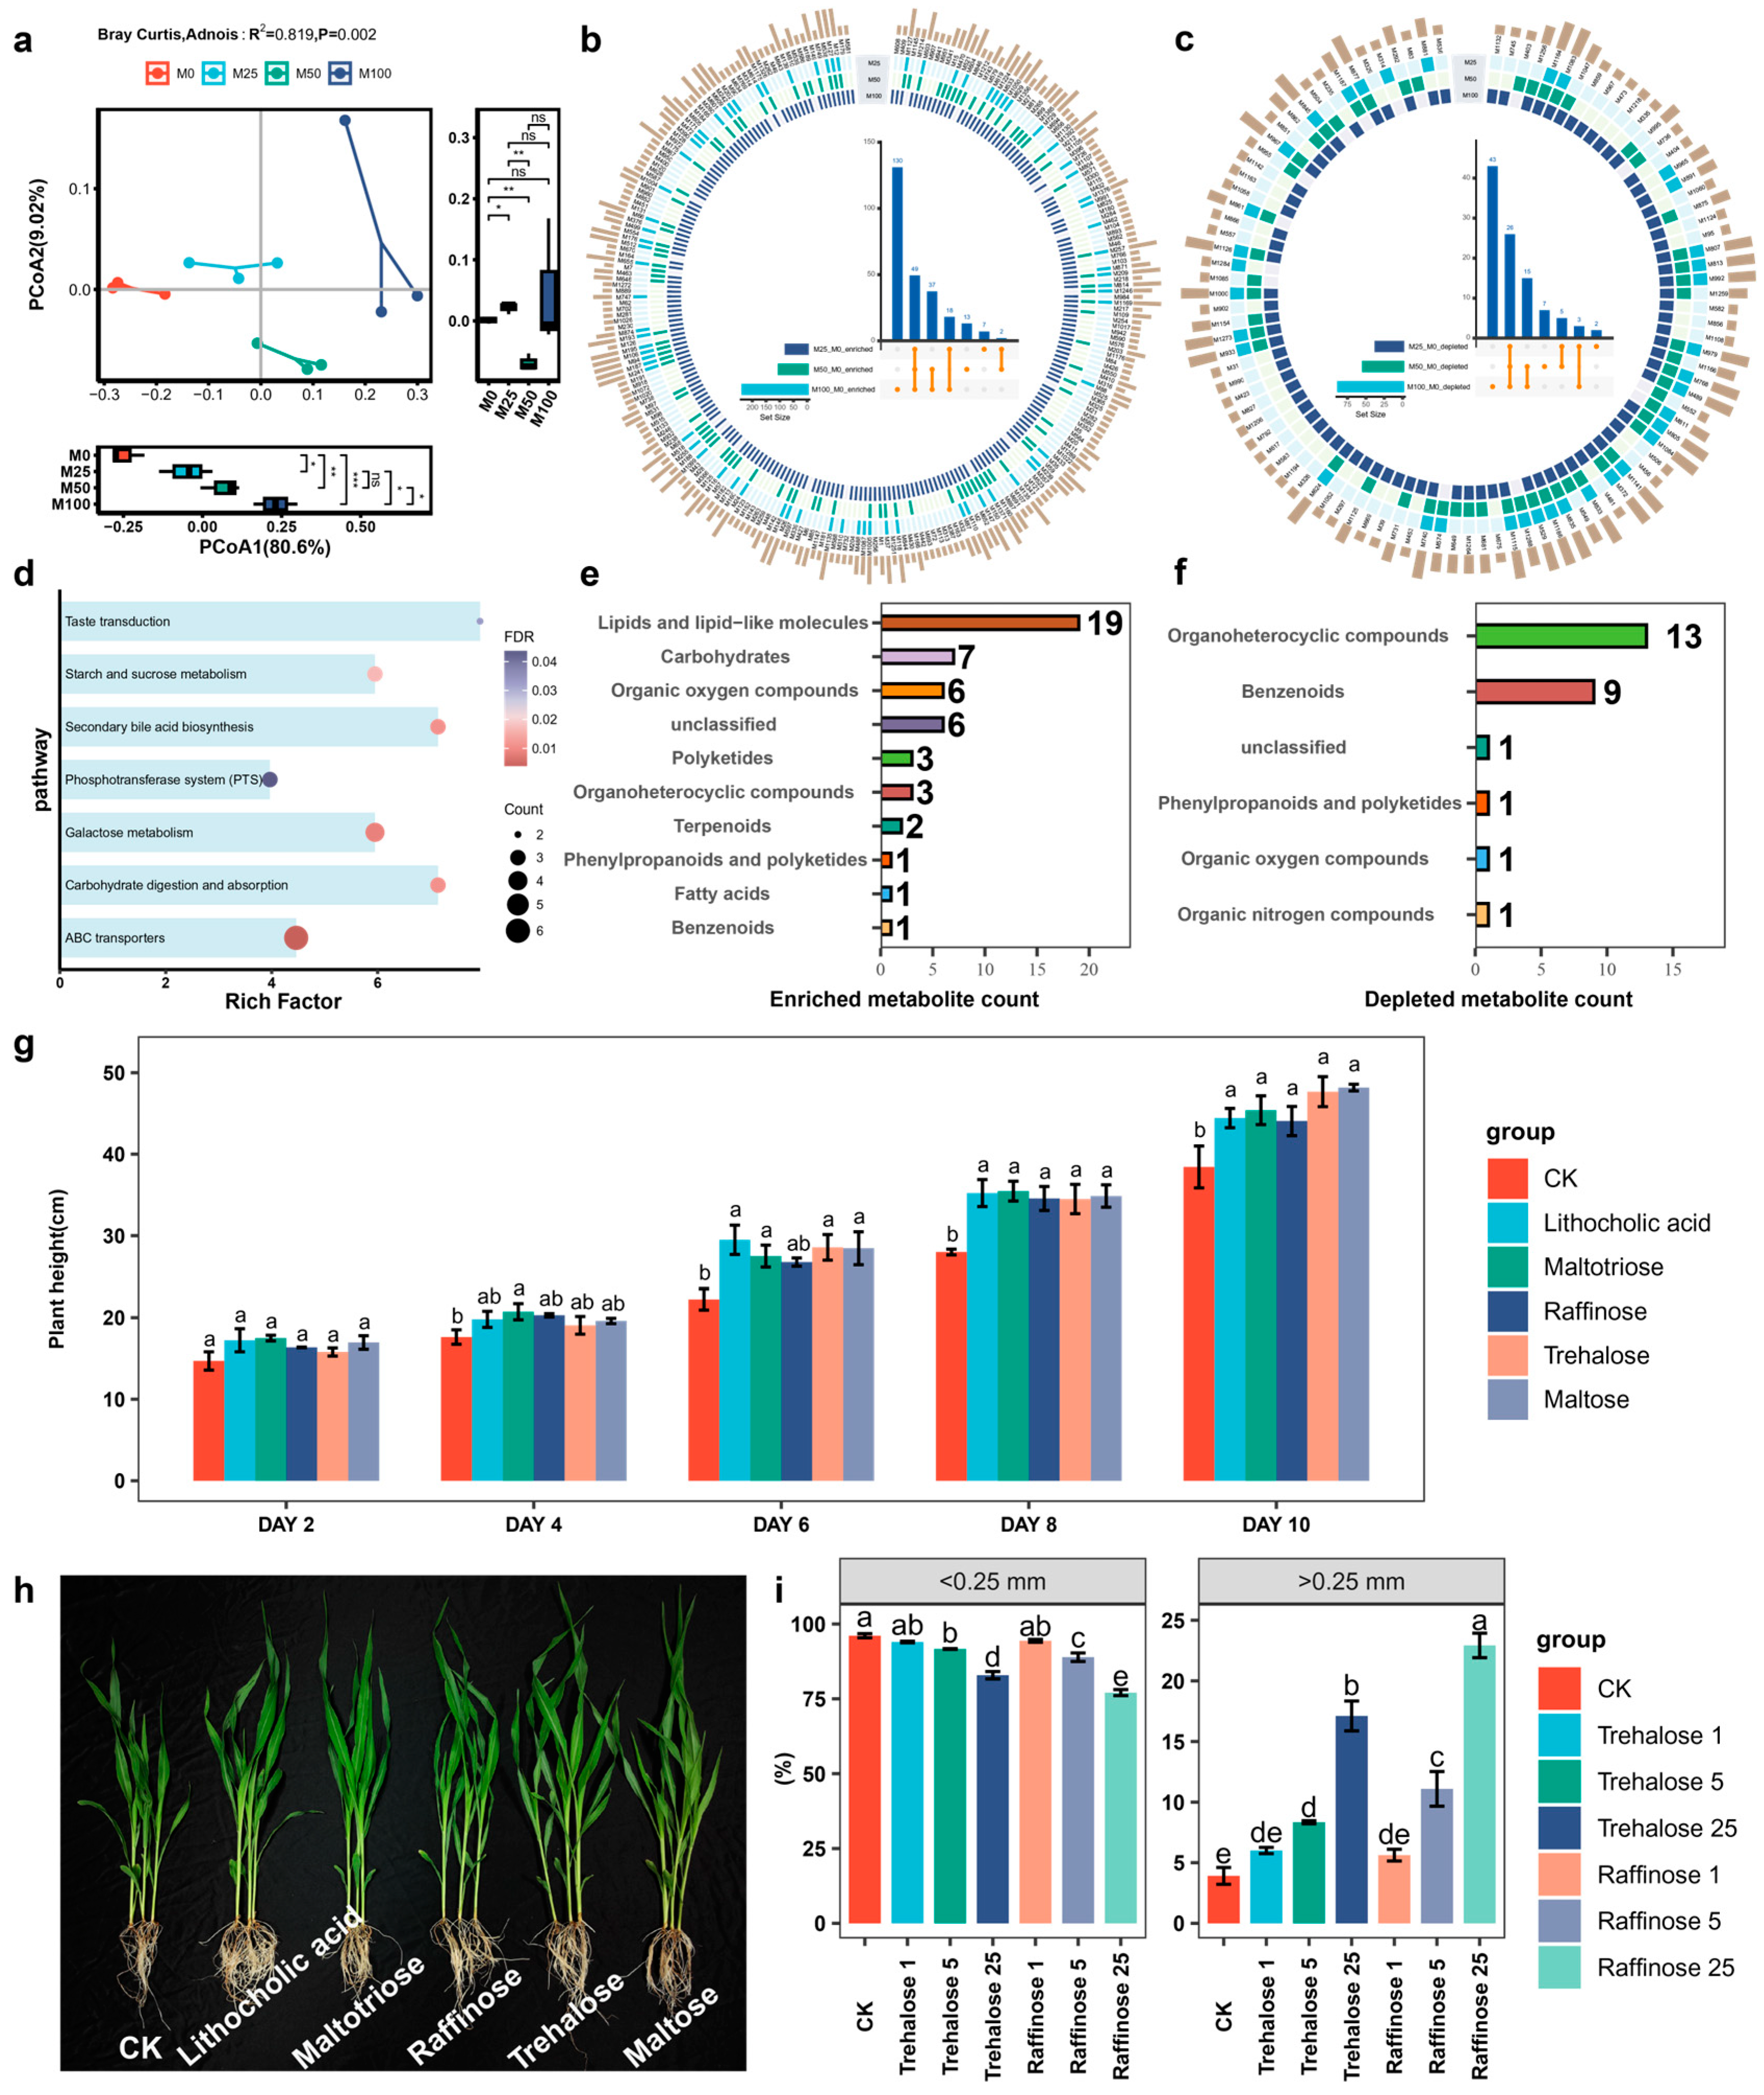
2.5. Validation Experiment for Beneficial Metabolites

After confirming that metabolites were significantly increased by organic amendments, we evaluated their effects on maize growth. Compared to chemical fertilizer treatments, metabolites in the three organic fertilizer treatments were generally upregulated, particularly in the categories of lipids and lipid-like molecules, carbohydrates, and organic oxygen compounds. Therefore, we selected representative bioactive compounds from each category: lithocholic acid (Shanghai Yuanye Bio-Technology Co., Ltd., Shanghai, China) from lipids and lipid-like molecules, raffinose (Shanghai Yuanye Bio-Technology Co., Ltd., Shanghai, China) and trehalose (Shanghai Yuanye Bio-Technology Co., Ltd., Shanghai, China) from carbohydrates, and maltose (Shanghai Yuanye Bio-Technology Co., Ltd., Shanghai, China) and maltotriose (Shanghai Yuanye Bio-Technology Co., Ltd., Shanghai, China) from organic oxygen compounds. First, maize seeds were sterilized in a 4% sodium hypochlorite solution for 10 min, rinsed five times with sterile water, and cultivated for one week. The seedlings were then transferred to hydroponic bottles containing half-strength Hoagland nutrient solution. Six treatments were established, namely CK (no metabolite addition), raffinose, trehalose, maltose, maltotriose, and lithocholic acid, each with three replicates. Based on prior studies investigating the effects of metabolites on plant growth and their concentrations in nutrient solutions, we determined a metabolite concentration of 0.05 mM for each treatment [39]. After the addition of metabolites, plant height was measured, and the nutrient solution was replaced every two days. After 10 days, the final plant height was measured, samples were collected, and phenotypes were photographed and recorded.
We found that organic amendments can increase the levels of certain sugars in the soil. Therefore, we selected trehalose (disaccharide) and raffinose (trisaccharide), which are widely present in soils, to assess their impact on soil aggregate formation. First, 40 g of soil passed through a 100-mesh sieve was incubated for three weeks at 60% of the maximum field capacity. To provide direct evidence that increased concentrations of these sugars contribute to the formation of larger soil aggregates, we set up three concentration gradients (1, 5, and 25 mmol/kg soil) and used a sterile water screening method to isolate soil aggregates [40]. Sieves with 0.25 mm apertures were used to separate the soil aggregates. Each 40 g soil sample was placed into each sieve, fully immersed in water, and oscillated for 30 min with an amplitude of 3 cm and a frequency of 30 times per minute. After oscillation, soil from each sieve was washed and placed into aluminum boxes, dried, and weighed to calculate the proportions of soil particles < 0.25 mm and >0.25 mm.

2.6. Soil Health Index Calculation

We selected the five most commonly used soil physicochemical indicators (TN, SOM, available P, available K, and pH) to assess the soil health index [8,41,42,43]. Each indicator was normalized according to a scoring function to eliminate the influence of different units (Table 1). Indicators were divided into two categories: (1) the “more is better” function (U) was applied to TN, SOM, available P, and available K as they have positive impacts on soil quality; (2) the “optimal range” function (P) was applied to pH, with scores depending on whether the indicator values fell within the optimal range. The scoring functions U (x) and P (x) are as follows:
U x =   0.1   ( x x 1 )   0.9 × x x 1 x 2 x 1   1   ( x x 2 ) + 0.1   ( x 1 < x < x 2 )
P x =   0.1   x x 1 ;   x x 4 0.9 × x x 1 x 2 x 1 + 0.1   x 1 < x < x 2 1 0.9 × x x 3 x 4 x 3   x 3 < x < x 4 1   x 2 x x 3
Subsequently, we conducted a principal component analysis (PCA) on all indicators to obtain the commonalities of each indicator, where higher commonality indicates greater contributions to the variance. The weight of each indicator was then calculated based on the commonalities using the following equation:
N i = h i 2 i = 1 n h i 2
where h2 is the commonality of each indicator, and Ni is the weight of each indicator.
Finally, we multiplied the score of each indicator by its respective weight and summed the values to obtain a final score for the soil health index, ranging from 0 to 1; higher soil health indices indicate better soil health. The soil health index was calculated as follows:
S o i l   H e a l t h   I n d e x = i = 1 n W i N i
where Wi is the score of each indicator, and Ni is the weight of each indicator.

2.7. Data Statistics and Analyses

All data analyses in this study were conducted using R 4.3.1 (https://www.r-project.org/ (accessed on 25 February 2024)). Values of all parameters are expressed as the average of three replicates with standard error. ANOVA was performed using the aov and duncan.test functions from the agricolae package (1.3.5). Visualization was performed with the ggplot2 package (3.5.1) and the ggsci package (3.0.0). The Shannon diversity index for bacteria and fungi was calculated using the diversity function of the vegan package (2.6.4). A t-test for the Shannon index was carried out using the t-test function of the rstatix package (0.7.2). Bray–Curtis distances were computed using the vegdist function in the vegan package (2.6.4). PCoA was conducted with the cmdscale function, and the Adonis test was performed with the adonis2 function, both from the vegan package (2.6.4). Differential analysis of microbial and metabolomic data was conducted with the glmLRT function of the edgeR package (3.42.4) in R.
Phylogenetic trees for fungi and bacteria were generated using the iTOL (https://itol.embl.de/ (accessed on 15 February 2024)). KEGG enrichment analysis for metabolomics data was performed using the enricher function of the clusterProfiler package (4.4.4). Variation partitioning and hierarchical partitioning, which assess the individual effects of soil physicochemical and enzymatic indicators on the variation in microbiota and metabolites, were conducted using the rdacca.hp function in the rdacca.hp package (1.1.0) [44]. Correlations between the soil health index and other key indicators were computed using the corr.test function in the psych package (2.4.6.26), with p-values corrected for false discovery rate (FDR). Finally, the correlation graph was plotted using the ggraph function from the ggraph package (2.1.0).

3. Results

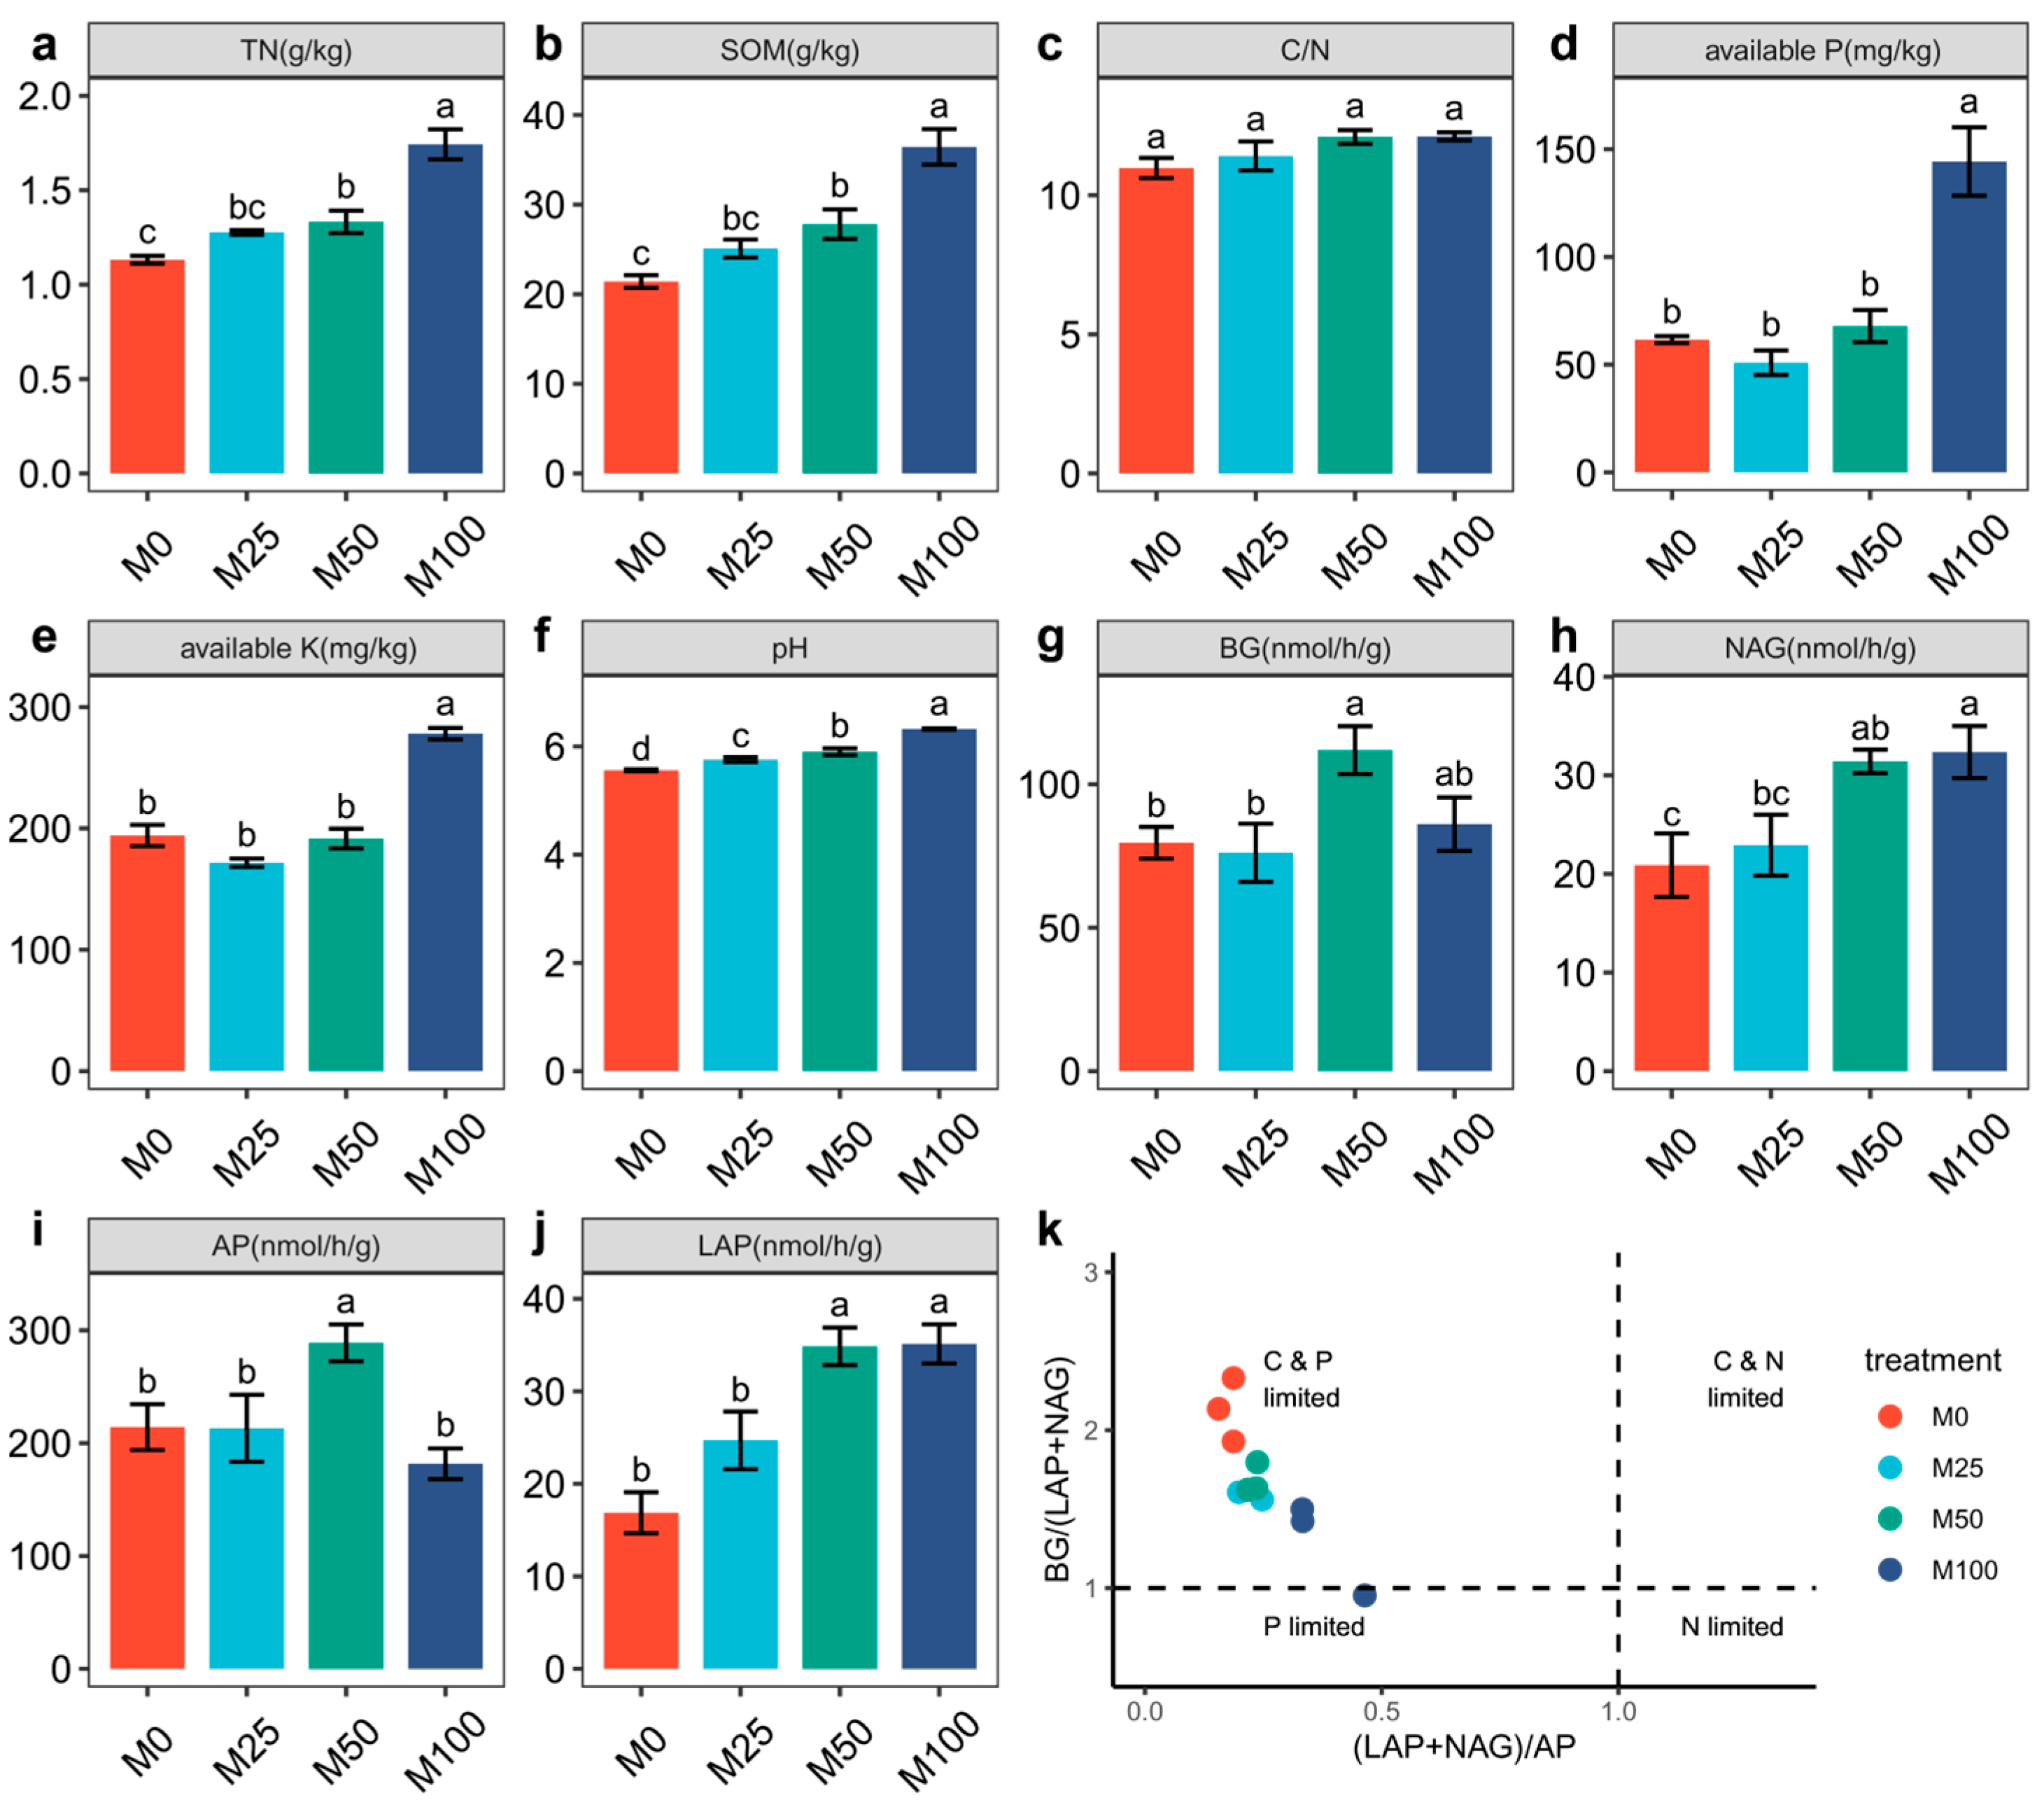
3.1. Effects of Organic Amendment on Soil Chemical Properties and Enzymatic Activity

Both the soil physicochemical properties and enzymatic activities increased with the rate of organic amendment in our continuous 9-year field experiment (Figure 1). Compared to M0, the M50 and M100 treatments significantly increased the TN and SOM (Figure 1). Compared to the TN content of 1.13 g/kg in the M0 treatment, the M25, M50, and M100 treatments were increased by 12.8%, 17.7%, and 54.0% (Figure 1). Similarly, compared to the SOM content of 21.4 g/kg in the M0 treatment, the M25, M50, and M100 treatments were increased by 17.2%, 29.9%, and 70.2%, respectively (Figure 1). Furthermore, the available P and available K in M100 exhibited significant increases compared to M0 (Figure 1). The pH levels in the M25, M50, and M100 treatments were also significantly higher than that in M0, increasing from 5.56 to 5.76, 5.90, and 6.32, respectively (Figure 1).
Additionally, M50 significantly enhanced BG, NAG, AP, and LAP activities (Figure 1). However, BG and AP activities in M100 did not show significant differences compared to M0. In contrast, M100 exhibited a notable increase in NAG and LAP activities (Figure 1). The enzymatic stoichiometry results suggest that M0 soils exhibited carbon and phosphorus limitations, which were alleviated as the proportion of organic fertilizer amendment increased (Figure 1).

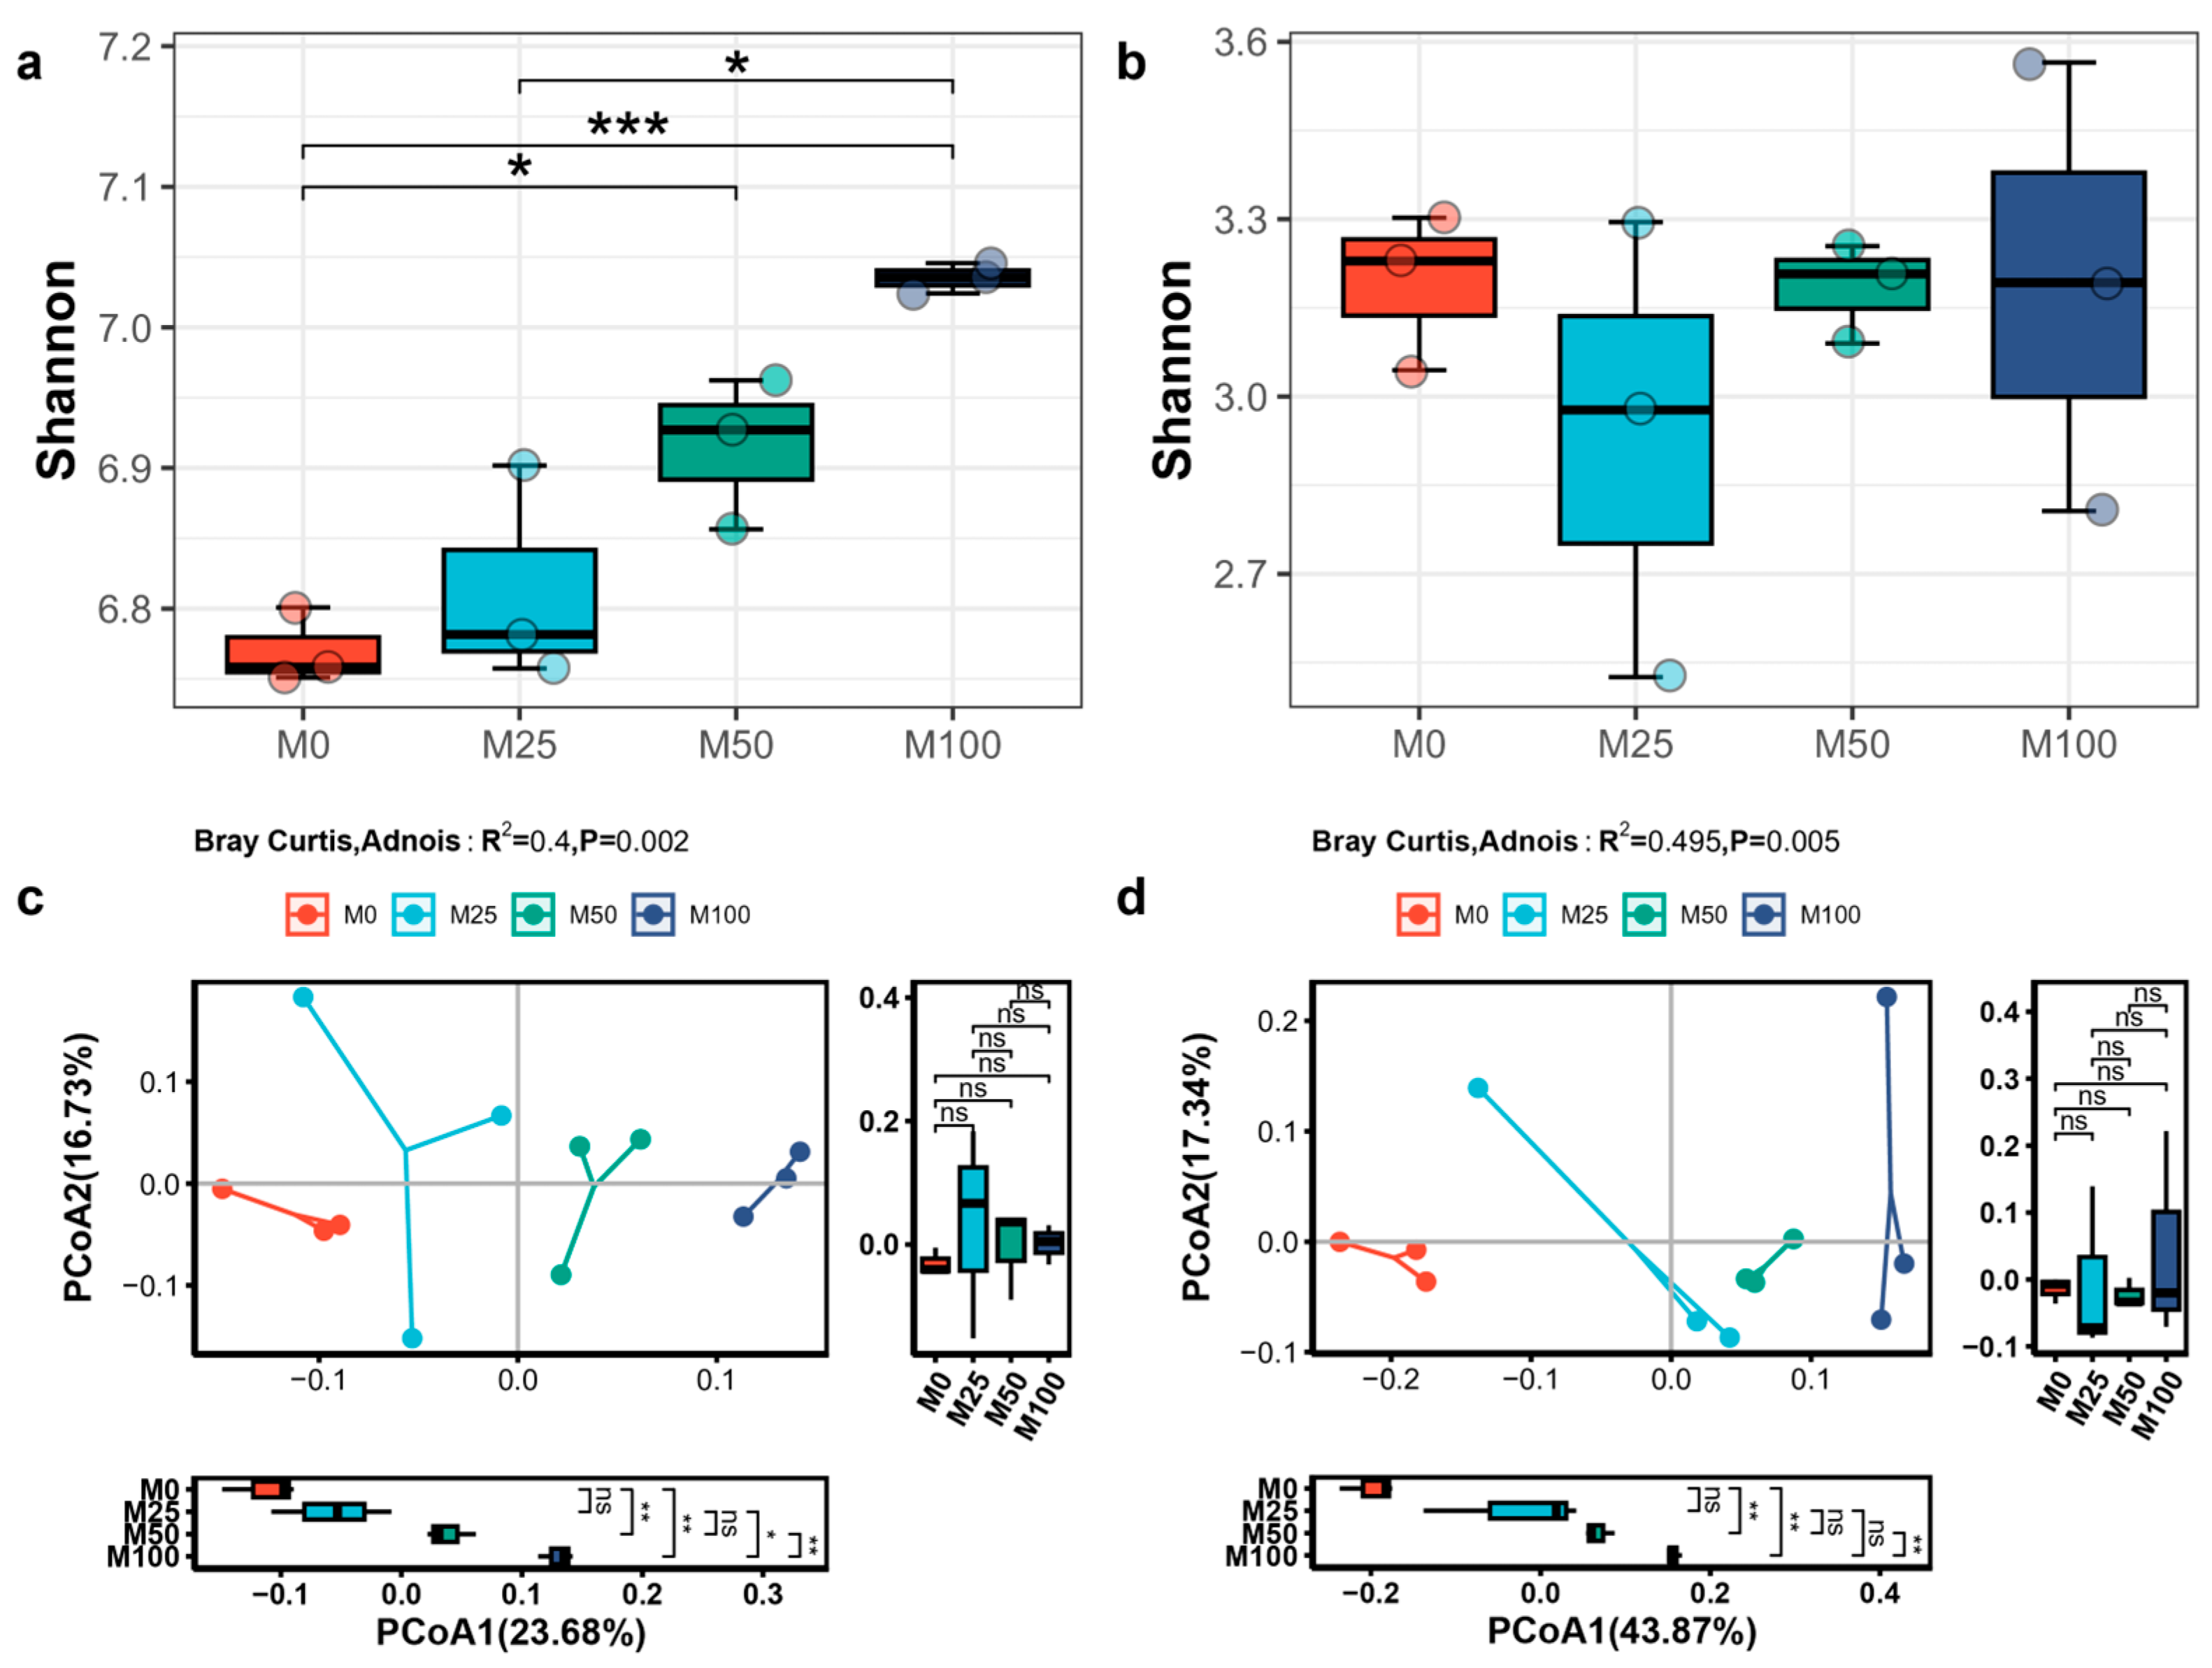
3.2. Effects of Organic Amendment on Microbial Communities

Compared to M0, the M50 and M100 treatments significantly enhanced the bacterial Shannon diversity index (Figure 2). In contrast, the fungal Shannon diversity index showed no significant differences among treatments (Figure 2). The PCoA and ADONIS analyses revealed significant differences among treatments (p < 0.05), with the organic fertilizer ratio accounting for 40% of the variation in bacterial communities (Figure 2). Similarly, for fungal communities, the PCoA and ADONIS analyses indicated significant differences among treatments (p < 0.05), with the grouping accounting for 49% of the variation (Figure 2).

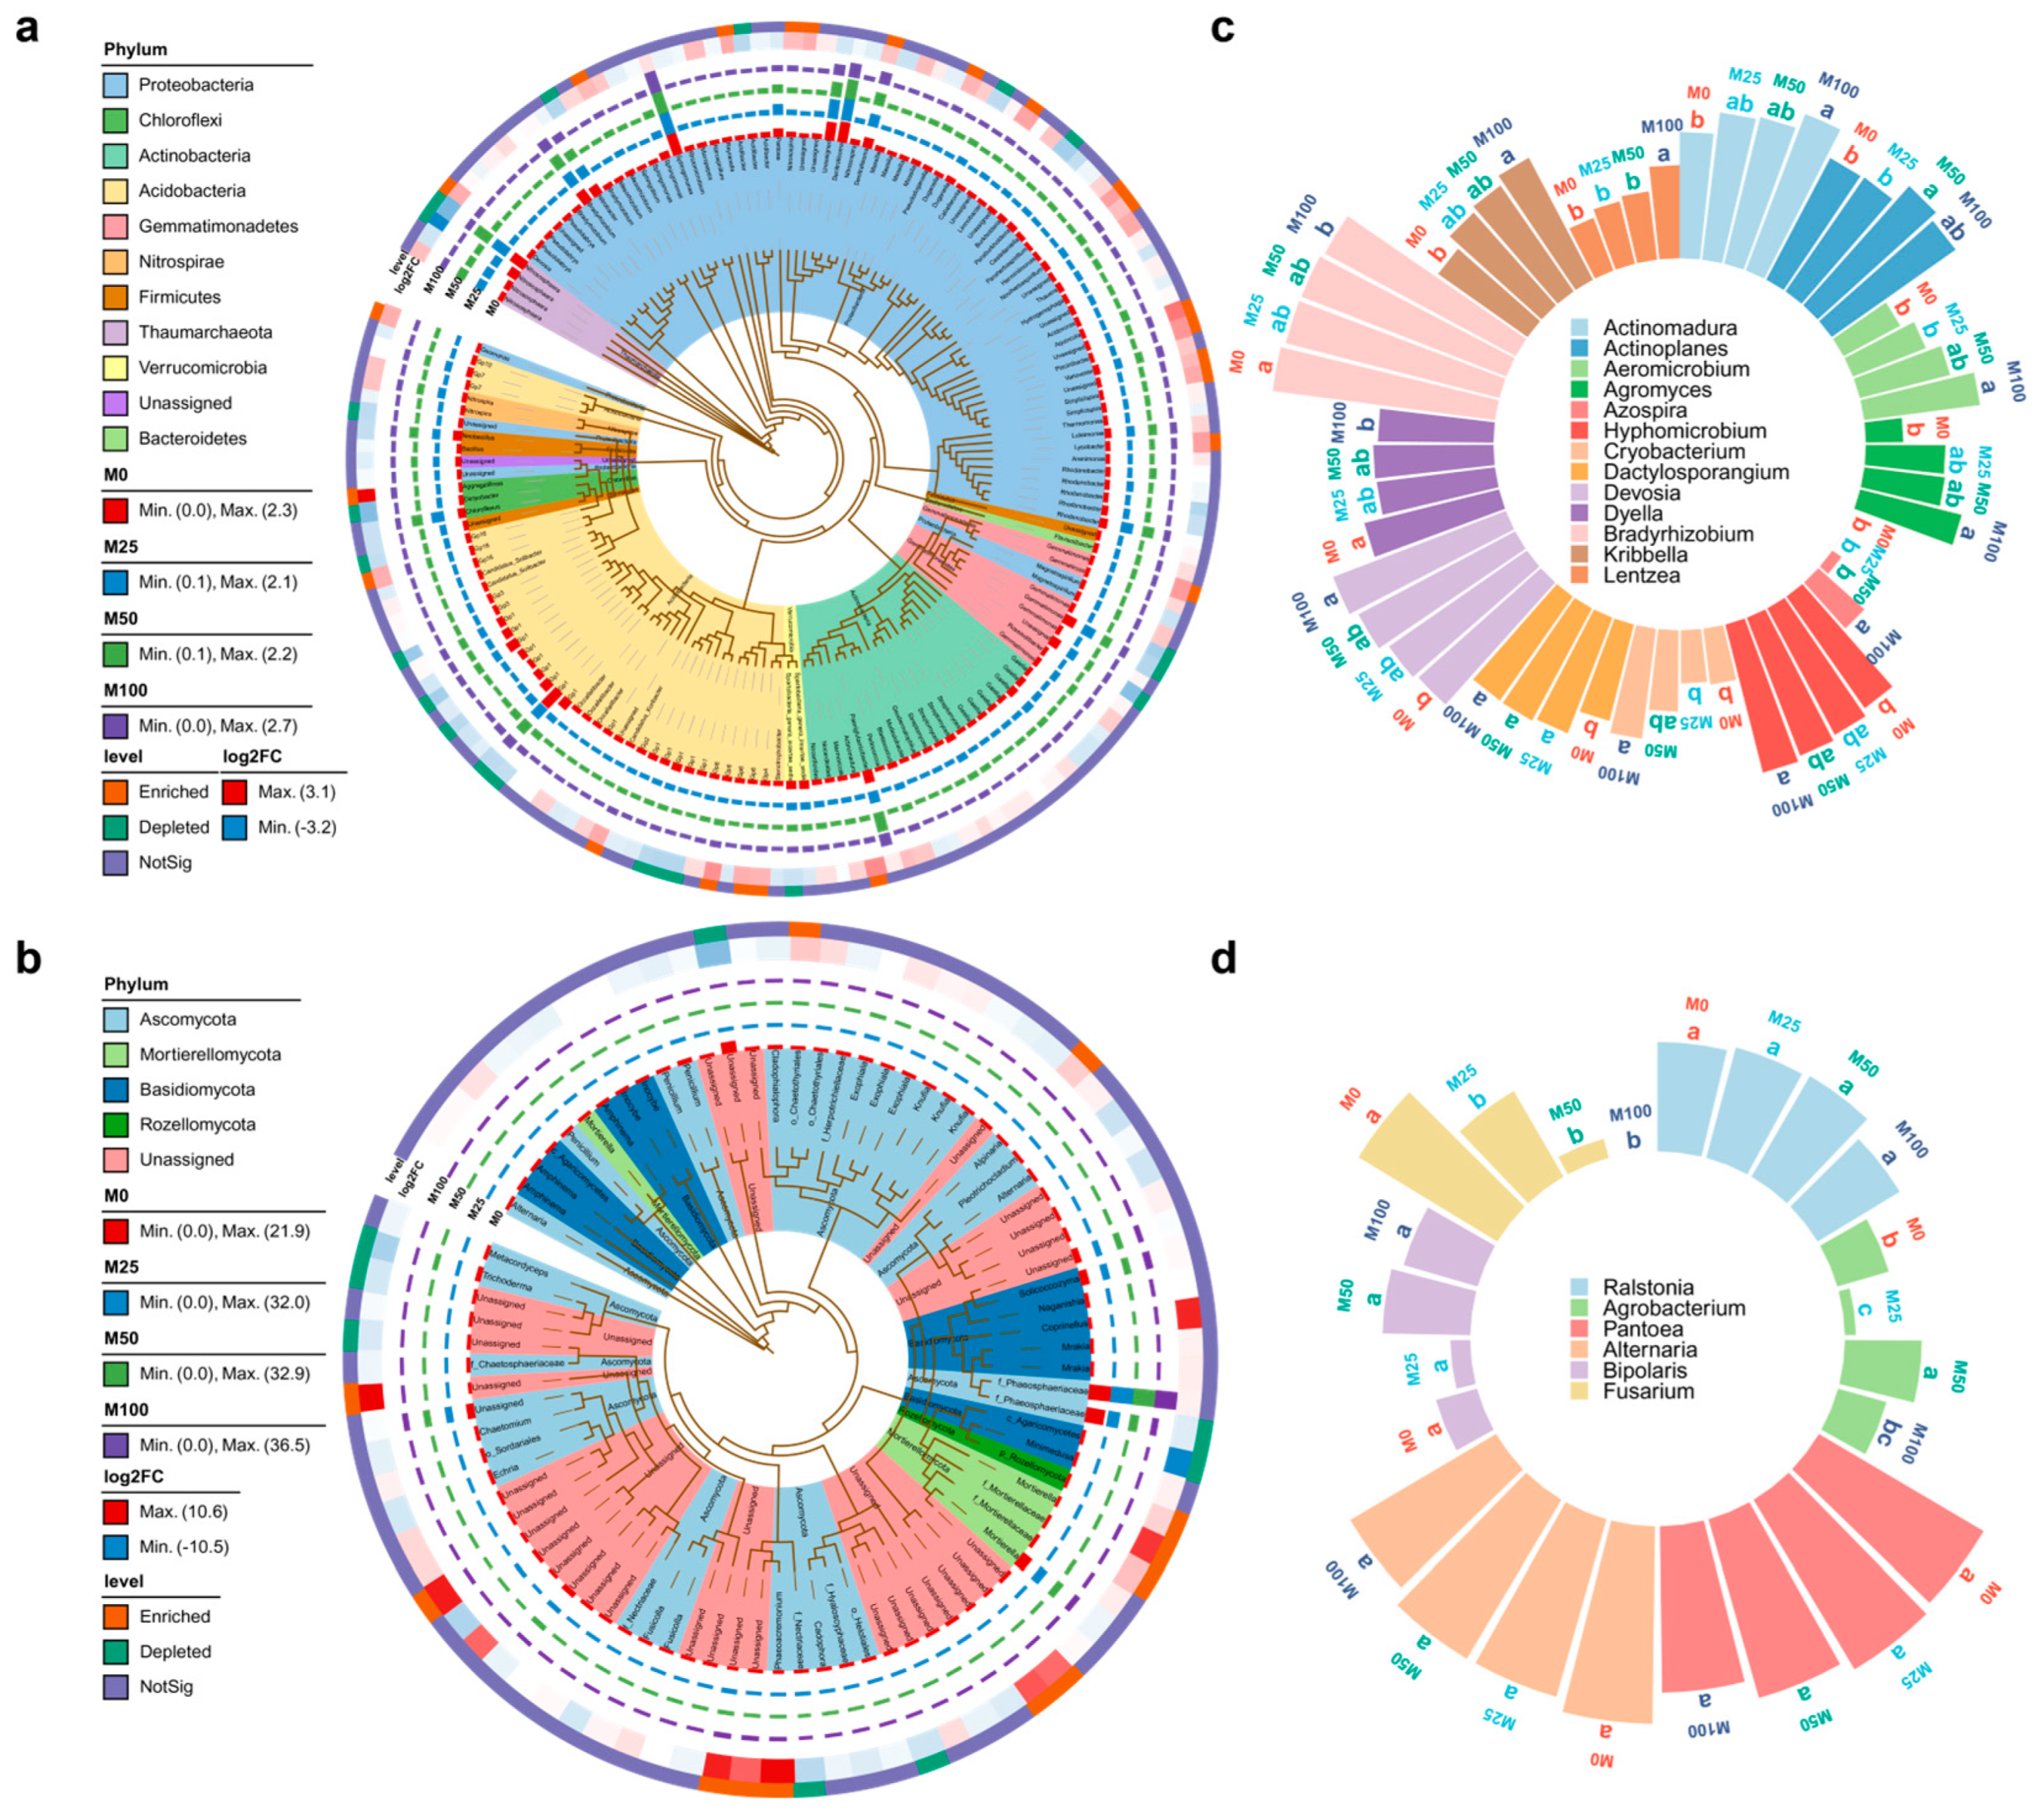
3.3. Effects of Organic Amendment on Beneficial Microorganisms and Pathogens

The bacterial phylogenetic tree displayed 155 ASVs with proportions greater than 0.1% (Figure 3). A differential analysis and FDR correction between the M100 and M0 treatments revealed 16 ASVs enriched in the Proteobacteria phylum and 9 ASVs depleted in the Acidobacteria phylum in the M100 treatment (Figure 3). The M100 treatment significantly enriched ASVs belonging to Aggregatilinea, Herminiimonas, Acidibacter, Simplicispira, Geomonas, Gp6, Noviherbaspirillum, Nitrosospira, Mesorhizobium, Gp2, Devosia, Pseudoduganella, Lysobacter, Gp16, Gp4, Piscinibacter, Denitratisoma, Actinomadura, Gemmatimonas, and unassigned taxa (Figure 3a). In contrast, the M0 treatment significantly enriched ASVs belonging to Gp1, Gp3, Acidibacter, Bradyrhizobium, Gemmatimonas, Nitrososphaera, Spartobacteria_genera_incertae_sedis, Gp16, Duganella, Burkholderia, Dictyobacter, and unassigned taxa (Figure 3).
The fungal phylogenetic tree displayed 84 ASVs with abundances greater than 0.1% (Figure 3). The M100 treatment significantly enriched ASVs belonging to Chaetothyriales, Rozellomycota, Alpinaria, Mortierella, Phaeoacremonium, Mortierellaceae, and unassigned taxa (Figure 3). The M0 treatment significantly enriched ASVs belonging to Nectriaceae, Agaricomycetes, Trichoderma, Phaeosphaeriaceae, and unassigned taxa (Figure 3).
By querying the PBB database, we found that the beneficial plant microorganisms Dyella and Bradyrhizobium decreased with increasing organic amendment ratios. However, the addition of organic fertilizer significantly increased the abundances of 11 beneficial microorganisms: Actinomadura, Actinoplanes, Aeromicrobium, Agromyces, Azospira, Cryobacterium, Dactylosporangium, Devosia, Hyphomicrobium, Kribbella, and Lentzea (Figure 3). Additionally, by reviewing the relevant literature and matching the FungalTraits database, our long-term experiment identified six plant pathogens with relatively high proportions, consisting of three bacteria, Ralstonia, Agrobacterium, and Pantoea, and three fungi, Alternaria, Bipolaris, and Fusarium. Among these, Ralstonia, Pantoea, Alternaria, and Bipolaris showed no significant changes after long-term organic fertilizer application. Agrobacterium significantly decreased after long-term amendment with 25% organic fertilizer. Notably, the abundance of the plant pathogen Fusarium significantly decreased with increasing organic fertilizer application, and its abundance was reduced to zero in the M100 treatment (Figure 3).

3.4. Effects of Organic Amendment on Soil Metabolite Composition

The metabolomic profiling of soil samples allowed us to detect a total of 1131 metabolites. The PCoA and ADONIS analyses indicated significant differences among treatments (p < 0.05), with the different proportions of organic fertilizer explaining 81.9% of the variations in metabolites, exhibiting clear separation along the PCoA1 axis (Figure 4). Using a false discovery rate (FDR) threshold set at less than 0.05 and a log2 fold change (log2FC) threshold of more than 1, a differential analysis of the metabolites in M25, M50, and M100 compared to M0 showed that 76, 101, and 234 metabolites were enriched in M25, M50, and M100, respectively (Figure 4). Among them, 49 metabolites were found to be significantly enriched across all organic fertilizer treatments (M25, M50, and M100) (Figure 4). When setting an FDR threshold at less than 0.05 and a log2FC threshold at less than −1, a differential analysis revealed that 36, 53, and 87 metabolites were depleted in M25, M50, and M100, respectively (Figure 4). Among all organic fertilizer treatments (M25, M50, and M100), 26 metabolites were consistently found to be significantly depleted (Figure 4).
Using an FDR threshold of less than 0.05, an enrichment analysis of upregulated metabolites revealed significant enrichment in metabolic pathways such as starch and sucrose metabolism, secondary bile acid biosynthesis, phosphotransferase system (PTS), galactose metabolism, carbohydrate digestion and absorption, and ABC transporters by organic fertilizer addition (Figure 4). The enriched metabolites mainly belonged to lipids and lipid-like molecules, carbohydrates, and organic oxygen compounds (Figure 4), while the depleted metabolites were primarily benzenoids and organoheterocyclic compounds (Figure 4).
We conducted a hydroponics culture experiment on maize, where metabolites significantly increased in the organic amendment treatment (e.g., lithocholic acid, maltotriose, maltose, trehalose, and raffinose) were added to different hydroponic bottles after the maize seedlings grew uniformly. Four days after adding the metabolites, the plant height of maize treated with maltotriose was significantly higher than that of the CK treatment (Figure 4). Six days after adding the metabolites, the plant height of maize treated with lithocholic acid, maltotriose, maltose, and trehalose was significantly higher than that of the CK treatment (Figure 4). By the 8th and 10th days, the plant height of maize in all other treatments surpassed that of the CK treatment (Figure 4).
Furthermore, we cultured the soil sieved through a 100-mesh sieve with solutions of trehalose (disaccharide) and raffinose (trisaccharide). Compared to the CK treatment, both 5 mmol/kg and 25 mmol/kg of trehalose and raffinose decreased (p < 0.05) the percentage of microaggregates (<0.25 mm) and increased (p < 0.05) the percentage of macroaggregates (>0.25 mm) (Figure 4). In addition, the treatment using 5 mmol/kg of raffinose had a higher content of macroaggregates compared to trehalose, with the treatment using 25 mmol/kg of raffinose and trehalose also exhibiting similar results (Figure 4).

3.5. The Soil Health Index and the Relationship Between Soil Properties, Enzymatic Activity, Soil Microbial Communities, and Metabolite Composition

The soil health index was calculated based on key physicochemical indicators: the TN, SOM, available P, available K, and pH. The analysis of variance results reveal that the soil health index values of M50 and M100 were significantly higher than that of M0. Compared to M0, the soil health index values of M50 and M100 increased by 19.3% and 72.6%, respectively (Figure 5). To further understand the influence of soil physicochemical properties and enzymatic activity on soil microbial communities and metabolite composition, we used hierarchical partitioning to estimate their explanatory power. We found that soil physicochemical properties and enzymatic activity can explain 28.4% of the variations in soil bacteria, fungi, and metabolites. Among these, the pH, TN, BG/(LAP + NAG), and SOM were the most influential, explaining 7.22%, 4.36%, 4.31%, and 4.21% of the variations, respectively (Figure 5). A correlation analysis between the soil health index and physicochemical properties, enzymatic activity, beneficial microorganisms, plant pathogens, and beneficial metabolites revealed that the soil health index was strongly and positively correlated with Hyphomicrobium, trehalose, maltose, and lithocholic acid. In addition, Fusarium was strongly and negatively correlated with the soil health index, Hyphomicrobium, trehalose, maltose, and lithocholic acid (Figure 5).

4. Discussion

Our study demonstrates that organic amendment enhances several key soil properties, including the TN, SOM, available P, available K, and pH (Figure 1). Correspondingly, the soil health index was also enhanced by manure application. The soil health index based on these properties reflects the widely observed improvements in soil nutrients [33,45,46]. These improvements in chemical indicators and the soil health index following manure application can be further strengthened by increasing the rate of manure application. Additionally, we found that organic fertilizer application significantly alters the soil microbial community (Figure 2). The microbial properties of manure-applied soil have become a hot topic in current research. However, most studies have focused on general changes in microbial diversity and function. It remains largely unexplored whether microbial traits, particularly those related to soil and plant health, vary in synchrony with changes in the soil health index.
To address this uncertainty, we evaluated the effect of organic amendment on the abundance of plant-beneficial microorganisms by matching the whole bacteria community to the PBB database (Figure 3). Of the 109 plant-beneficial microorganisms identified, Dyella and Bradyrhizobium decreased with higher organic amendment ratios, while 11 plant-beneficial microorganisms (i.e., Actinomadura, Actinoplanes, Aeromicrobium, Agromyces, Azospira, Cryobacterium, Dactylosporangium, Devosia, Hyphomicrobium, Kribbella, and Lentzea) significantly increased under organic amendment. These microbes are well known for their beneficial roles in biocontrol, IAA, nitrogen fixation, potassium solubilization, phosphorus solubilization, and in producing siderophores and phytohormones [23,47,48,49,50,51,52,53,54]. These significant changes in beneficial bacteria are primarily related to nutrient cycling in the soil. Therefore, we infer that the reason for these changes is the input of organic fertilizers, which provide abundant carbon sources and trace nutrients, thereby activating these beneficial bacteria and increasing their abundance. The synchronized increase in beneficial bacteria with organic fertilizer input further supports this hypothesis. Our findings represent a more thorough comparison of beneficial bacteria in soil with and without manure application than previous studies that only checked microbial identity at the genus level and detected fewer candidates [55,56,57,58,59,60]. It is interesting that the abundances of these beneficial microbes increased with manure substitution rate and soil health index-based chemical indicators, implying the solid role of manure in promoting the strength of soil and extending the dimension of soil health.
In our long-term experiment, the abundance of plant pathogens such as Ralstonia, Pantoea, and Alternaria exhibited a decreasing trend with increasing organic fertilizer proportions. However, no statistically significant differences were observed, which suggests that the growth of these pathogens may not be highly sensitive to external organic carbon inputs. Agrobacterium showed a significant decrease after substituting 25% of nitrogen fertilizer with organic fertilizer. However, when the organic fertilizer proportion reached 100%, the abundance of the pathogen returned to the original level. Therefore, organic fertilizer input should be kept within an optimal range, as excessive amounts may not necessarily provide additional benefits. In addition, our study demonstrates that organic amendment in black soil effectively suppresses Fusarium, a globally distributed and disastrous phytopathogen [61]. Similarly, long-term organic amendment in red soil for peanut cultivation can significantly inhibit Fusarium [26]. Significantly decreased Fusarium abundance after long-term organic fertilization was also observed in soil used for kiwifruit cultivation [62]. Additionally, partially replacing inorganic fertilizers with organic and bio-organic fertilizers can effectively suppress Fusarium, thus reducing the occurrence of root diseases in cotton [63]. The continuous application of organic amendments in soil subjected to successive tomato cultivation with Fusarium wilt disease can reduce Fusarium abundance, thereby alleviating tomato diseases [64]. This may be attributed to the relatively weak ability of Fusarium to utilize organic substrates or to changes in bacterial communities, such as Actinomadura and Actinoplanes, which belong to Actinobacteria and are capable of inhibiting Fusarium growth [26,65]. Additionally, when compared to the M0 treatment, we identified two upregulated ASVs in the M100 treatment, which were found to belong to Mortierella and Mortierellaceae (Figure 3). Previous studies have demonstrated that Mortierella, recognized as a biomarker of healthy soil, plays a significant role in inhibiting Fusarium. The application of organic fertilizer has been shown to increase the abundance of Mortierella, which may be a key reason for Fusarium suppression by organic inputs [66,67]. These results demonstrate the prevailing role of organic amendment in reducing plant disease risk when upgrading soil health.
Moreover, organic amendment can significantly alter the metabolite composition of soil (Figure 4), increasing the concentration of many lipids and lipid-like molecules, carbohydrates, and organic oxygen compounds. Few previous studies had attempted to explore the change in metabolite profile induced by organic fertilizer substitution [68]. However, it is unknown so far whether the enriched metabolite is related to soil health. Therefore, we tested the roles of lithocholic acid from lipids and lipid-like molecules, raffinose and trehalose from carbohydrates, and maltose and maltotriose from organic oxygen compounds in plant growth. We found that common sugars promoted the height growth of maize seedlings. Additionally, we demonstrated for the first time that lithocholic acid can promote the growth of maize. We also tested how the metabolites influence soil aggregate stability, a key indicator of soil quality. Our results demonstrate that both trehalose (a disaccharide) and raffinose (a trisaccharide) promoted the formation of soil macroaggregates, with the effect of trisaccharides being more pronounced. Collectively, organic amendment increases the levels of many metabolites that are beneficial for both soil health and plant health.
The mechanism governing manure-improved microbial health properties is currently unknown but may be related to the complex interaction among resource availability, pathogens, and beneficial microbes and metabolites (Figure 5). Manure inputs provide essential resources that support the growth of copiotrophic-beneficial microbes, such as Hyphomicrobium, which can potentially outcompete Fusarium for nitrogen and carbon sources in the soil. Additionally, Hyphomicrobium may inhibit Fusarium growth through the production of antimicrobial metabolites. The enrichment of beneficial metabolites such as lithocholic acid may also directly or indirectly be a result of manure application. These beneficial microbes and metabolites may further suppress pathogens. Organic fertilizer amendment can significantly improve soil health by enhancing beneficial microbial traits and suppressing harmful microbial traits. However, from a practical agricultural production perspective, excessive organic fertilizer input is prohibitively expensive, and a 25–50% amendment rate of organic fertilizer is more suitable. Replacing 25–50% of chemical fertilizers with organic fertilizers, such as composted cow manure, can significantly enhance soil health and promote crop growth. Future research should place greater emphasis on the role of microbial traits in soil health assessments, providing new theoretical insights and technical support for sustainable agriculture. The direct interactions between beneficial and pathogenic microorganisms require further investigation. Additionally, even beneficial microbes may pose potential pathogenic risks under certain conditions. Factors such as antibiotic and metal resistance genes are crucial for environmental health and food safety and should be further explored in future studies.

5. Conclusions

Our study examined the long-term effects of replacing chemical N fertilizers with organic fertilizers on physicochemical and microbial soil health indicators. Organic amendments significantly improved the soil health index, enhanced soil chemical properties by 5.2% to 72.6%, increased the abundance of 11 beneficial microorganisms, had a minimal impact on most pathogens but significantly reduced the pathogenic fungus Fusarium, and enriched 49 metabolites, which have been shown to promote plant growth and soil aggregate formation. Concurrently, these microbial and metabolite indicators demonstrated a strong correlation with soil health index based on physicochemical indicators. The use of 25–50% organic fertilizer to partially replace chemical fertilizers in agricultural production can significantly improve soil health and promote crop growth. Future research should further explore the crucial role of microbial traits in soil health assessments, particularly focusing on soil health indicator microorganisms and how they can be quantified and used as indicators to evaluate soil health.

Author Contributions

Conceptualization, A.S. and F.F.; Data Curation, X.Q., C.P. and E.W.; Formal Analysis, B.W., J.B. and M.S.; Funding Acquisition, A.S. and F.F.; Investigation, X.Q., C.P., X.L., X.Z. and H.F.; Methodology, E.W.; Project Administration, A.S. and F.F.; Resources, X.Q. and C.P.; Validation, B.W.; Visualization, B.W.; Writing—Original Draft, B.W., J.B., X.Q., C.P., M.S. and E.W.; Writing—Review and Editing, F.F., X.Q., B.W., A.S., J.B., X.L., X.Z. and H.F. All authors have read and agreed to the published version of the manuscript.

Funding

This research was funded by the National Key Research and Development Program of China (2022YFD1500300; 2021YFF1000404; and 2021YFD1901004), the Agricultural Science and Technology Innovation Program (ASTIP no. CAAS-ZDRW202202), the Innovation Program of Chinese Academy of Agricultural Sciences (CAAS-CSAL-202301), and Fundamental Research Funds for Central Non-profit Scientific Institution (no. 1610132024006).

Data Availability Statement

This study’s raw sequence data were archived in the National Center for Biotechnology Information (NCBI) Sequence Read Archive (SRA) under accession number PRJNA1124272.

Conflicts of Interest

The authors declare no conflicts of interest.

References

  1. Lehmann, J.; Bossio, D.A.; Kögel-Knabner, I.; Rillig, M.C. The concept and future prospects of soil health. Nat. Rev. Earth Environ. 2020, 1, 544–553. [Google Scholar] [CrossRef]
  2. Jansson, J.K.; Hofmockel, K.S. Soil microbiomes and climate change. Nat. Rev. Microbiol. 2020, 18, 35–46. [Google Scholar] [CrossRef]
  3. Philippot, L.; Chenu, C.; Kappler, A.; Rillig, M.C.; Fierer, N. The interplay between microbial communities and soil properties. Nat. Rev. Microbiol. 2024, 22, 226–239. [Google Scholar] [CrossRef]
  4. Bahram, M.; Hildebrand, F.; Forslund, S.K.; Anderson, J.L.; Soudzilovskaia, N.A.; Bodegom, P.M.; Bengtsson-Palme, J.; Anslan, S.; Coelho, L.P.; Harend, H.; et al. Structure and function of the global topsoil microbiome. Nature 2018, 560, 233–237. [Google Scholar] [CrossRef] [PubMed]
  5. Sokol, N.W.; Slessarev, E.; Marschmann, G.L.; Nicolas, A.; Blazewicz, S.J.; Brodie, E.L.; Firestone, M.K.; Foley, M.M.; Hestrin, R.; Hungate, B.A.; et al. Life and death in the soil microbiome: How ecological processes influence biogeochemistry. Nat. Rev. Microbiol. 2022, 20, 415–430. [Google Scholar] [CrossRef]
  6. Hartmann, M.; Six, J. Soil structure and microbiome functions in agroecosystems. Nat. Rev. Earth Environ. 2023, 4, 4–18. [Google Scholar] [CrossRef]
  7. Averill, C.; Anthony, M.A.; Baldrian, P.; Finkbeiner, F.; van den Hoogen, J.; Kiers, T.; Kohout, P.; Hirt, E.; Smith, G.R.; Crowther, T.W. Defending Earth’s terrestrial microbiome. Nat. Microbiol. 2022, 7, 1717–1725. [Google Scholar] [CrossRef]
  8. Bünemann, E.K.; Bongiorno, G.; Bai, Z.; Creamer, R.E.; De Deyn, G.; de Goede, R.; Fleskens, L.; Geissen, V.; Kuyper, T.W.; Mäder, P.; et al. Soil quality—A critical review. Soil Biol. Biochem. 2018, 120, 105–125. [Google Scholar] [CrossRef]
  9. Rinot, O.; Levy, G.J.; Steinberger, Y.; Svoray, T.; Eshel, G. Soil health assessment: A critical review of current methodologies and a proposed new approach. Sci. Total Environ. 2019, 648, 1484–1491. [Google Scholar] [CrossRef] [PubMed]
  10. Chatzimpiros, P.; Harchaoui, S. Sevenfold variation in global feeding capacity depends on diets, land use and nitrogen management. Nat. Food 2023, 4, 372–383. [Google Scholar] [CrossRef] [PubMed]
  11. Xue, R.; Wang, C.; Zhao, L.; Sun, B.; Wang, B. Agricultural intensification weakens the soil health index and stability of microbial networks. Agric. Ecosyst. Environ. 2022, 339, 108118. [Google Scholar] [CrossRef]
  12. Jiang, Y.; Zhang, J.; Manuel, D.-B.; Op de Beeck, M.; Shahbaz, M.; Chen, Y.; Deng, X.; Xu, Z.; Li, J.; Liu, Z. Rotation cropping and organic fertilizer jointly promote soil health and crop production. J. Environ. Manag. 2022, 315, 115190. [Google Scholar] [CrossRef]
  13. Wang, C.; Ma, Y.; He, W.; Kuzyakov, Y.; Bol, R.; Chen, H.; Fan, M. Soil quality and ecosystem multifunctionality after 13-year of organic and nitrogen fertilization. Sci. Total Environ. 2024, 931, 172789. [Google Scholar] [CrossRef]
  14. Zheng, X.; Wei, L.; Lv, W.; Zhang, H.; Zhang, Y.; Zhang, H.; Zhang, H.; Zhu, Z.; Ge, T.; Zhang, W. Long-term bioorganic and organic fertilization improved soil quality and multifunctionality under continuous cropping in watermelon. Agric. Ecosyst. Environ. 2024, 359, 108721. [Google Scholar] [CrossRef]
  15. Li, K.; Wang, C. Multiple soil quality assessment methods for evaluating effects of organic fertilization in wheat-maize rotation system. Eur. J. Agron. 2023, 150, 126929. [Google Scholar] [CrossRef]
  16. Walder, F.; Büchi, L.; Wagg, C.; Colombi, T.; Banerjee, S.; Hirte, J.; Mayer, J.; Six, J.; Keller, T.; Charles, R.; et al. Synergism between production and soil health through crop diversification, organic amendments and crop protection in wheat-based systems. J. Appl. Ecol. 2023, 60, 2091–2104. [Google Scholar] [CrossRef]
  17. Moorhead, D.; Cui, Y.; Sinsabaugh, R.; Schimel, J. Interpreting patterns of ecoenzymatic stoichiometry. Soil Biol. Biochem. 2023, 180, 108997. [Google Scholar] [CrossRef]
  18. Banerjee, S.; van der Heijden, M.G.A. Soil microbiomes and one health. Nat. Rev. Microbiol. 2023, 21, 6–20. [Google Scholar] [CrossRef]
  19. Mueller, U.G.; Sachs, J.L. Engineering Microbiomes to Improve Plant and Animal Health. Trends Microbiol. 2015, 23, 606–617. [Google Scholar] [CrossRef]
  20. Durán, P.; Thiergart, T.; Garrido-Oter, R.; Agler, M.; Kemen, E.; Schulze-Lefert, P.; Hacquard, S. Microbial Interkingdom Interactions in Roots Promote Arabidopsis Survival. Cell 2018, 175, 973–983.e14. [Google Scholar] [CrossRef]
  21. Thompson, L.R.; Sanders, J.G.; McDonald, D.; Amir, A.; Ladau, J.; Locey, K.J.; Prill, R.J.; Tripathi, A.; Gibbons, S.M.; Ackermann, G.; et al. A communal catalogue reveals Earth’s multiscale microbial diversity. Nature 2017, 551, 457–463. [Google Scholar] [CrossRef] [PubMed]
  22. Tang, S.; Ma, Q.; Marsden, K.A.; Chadwick, D.R.; Luo, Y.; Kuzyakov, Y.; Wu, L.; Jones, D.L. Microbial community succession in soil is mainly driven by carbon and nitrogen contents rather than phosphorus and sulphur contents. Soil Biol. Biochem. 2023, 180, 109019. [Google Scholar] [CrossRef]
  23. Li, P.; Tedersoo, L.; Crowther, T.W.; Dumbrell, A.J.; Dini-Andreote, F.; Bahram, M.; Kuang, L.; Li, T.; Wu, M.; Jiang, Y.; et al. Fossil-fuel-dependent scenarios could lead to a significant decline of global plant-beneficial bacteria abundance in soils by 2100. Nat. Food 2023, 4, 996–1006. [Google Scholar] [CrossRef]
  24. Põlme, S.; Abarenkov, K.; Henrik Nilsson, R.; Lindahl, B.D.; Clemmensen, K.E.; Kauserud, H.; Nguyen, N.; Kjøller, R.; Bates, S.T.; Baldrian, P.; et al. FungalTraits: A user-friendly traits database of fungi and fungus-like stramenopiles. Fungal Divers. 2020, 105, 1–16. [Google Scholar] [CrossRef]
  25. Bonanomi, G.; Lorito, M.; Vinale, F.; Woo, S.L. Organic Amendments, Beneficial Microbes, and Soil Microbiota: Toward a Unified Framework for Disease Suppression. Annu. Rev. Phytopathol. 2018, 56, 1–20. [Google Scholar] [CrossRef] [PubMed]
  26. Chen, D.; Wang, X.; Zhang, W.; Zhou, Z.; Ding, C.; Liao, Y.; Li, X. Persistent organic fertilization reinforces soil-borne disease suppressiveness of rhizosphere bacterial community. Plant Soil 2020, 452, 313–328. [Google Scholar] [CrossRef]
  27. Tao, C.; Li, R.; Xiong, W.; Shen, Z.; Liu, S.; Wang, B.; Ruan, Y.; Geisen, S.; Shen, Q.; Kowalchuk, G.A. Bio-organic fertilizers stimulate indigenous soil Pseudomonas populations to enhance plant disease suppression. Microbiome 2020, 8, 137. [Google Scholar] [CrossRef]
  28. Brown, R.W.; Reay, M.K.; Centler, F.; Chadwick, D.R.; Bull, I.D.; McDonald, J.E.; Evershed, R.P.; Jones, D.L. Soil metabolomics—Current challenges and future perspectives. Soil Biol. Biochem. 2024, 193, 109382. [Google Scholar] [CrossRef]
  29. Zhou, X.; Zhang, J.; Khashi u Rahman, M.; Gao, D.; Wei, Z.; Wu, F.; Dini-Andreote, F. Interspecific plant interaction via root exudates structures the disease suppressiveness of rhizosphere microbiomes. Mol. Plant 2023, 16, 849–864. [Google Scholar] [CrossRef] [PubMed]
  30. Wen, T.; Xie, P.; Liu, H.; Liu, T.; Zhao, M.; Yang, S.; Niu, G.; Hale, L.; Singh, B.K.; Kowalchuk, G.A.; et al. Tapping the rhizosphere metabolites for the prebiotic control of soil-borne bacterial wilt disease. Nat. Commun. 2023, 14, 4497. [Google Scholar] [CrossRef] [PubMed]
  31. Sánchez, Ó.J.; Ospina, D.A.; Montoya, S. Compost supplementation with nutrients and microorganisms in composting process. Waste Manag. 2017, 69, 136–153. [Google Scholar] [CrossRef] [PubMed]
  32. Matamoros, V.; Casas, M.E.; Mansilla, S.; Tadić, Đ.; Cañameras, N.; Carazo, N.; Portugal, J.; Piña, B.; Díez, S.; Bayona, J.M. Occurrence of antibiotics in Lettuce (Lactuca sativa L.) and Radish (Raphanus sativus L.) following organic soil fertilisation under plot-scale conditions: Crop and human health implications. J. Hazard. Mater. 2022, 436, 129044. [Google Scholar] [CrossRef]
  33. Liu, J.; Shu, A.; Song, W.; Shi, W.; Li, M.; Zhang, W.; Li, Z.; Liu, G.; Yuan, F.; Zhang, S.; et al. Long-term organic fertilizer substitution increases rice yield by improving soil properties and regulating soil bacteria. Geoderma 2021, 404, 115287. [Google Scholar] [CrossRef]
  34. Cui, J.; Song, D.; Dai, X.; Xu, X.; He, P.; Wang, X.; Liang, G.; Zhou, W.; Zhu, P. Effects of long-term cropping regimes on SOC stability, soil microbial community and enzyme activities in the Mollisol region of Northeast China. Appl. Soil Ecol. 2021, 164, 103941. [Google Scholar] [CrossRef]
  35. Fan, F.; Yu, B.; Wang, B.; George, T.S.; Yin, H.; Xu, D.; Li, D.; Song, A. Microbial mechanisms of the contrast residue decomposition and priming effect in soils with different organic and chemical fertilization histories. Soil Biol. Biochem. 2019, 135, 213–221. [Google Scholar] [CrossRef]
  36. Bi, J.; Song, A.; Li, S.; Chen, M.; Wang, Y.; Wang, S.; Si, Z.; Wang, E.; Zhang, J.; Asante-Badu, B.; et al. Plant physiology, microbial community, and risks of multiple fungal diseases along a soil nitrogen gradient. Appl. Soil Ecol. 2022, 175, 104445. [Google Scholar] [CrossRef]
  37. Liu, Y.-X.; Chen, L.; Ma, T.; Li, X.; Zheng, M.; Zhou, X.; Chen, L.; Qian, X.; Xi, J.; Lu, H.; et al. EasyAmplicon: An easy-to-use, open-source, reproducible, and community-based pipeline for amplicon data analysis in microbiome research. iMeta 2023, 2, e83. [Google Scholar] [CrossRef] [PubMed]
  38. Want, E.J.; Masson, P.; Michopoulos, F.; Wilson, I.D.; Theodoridis, G.; Plumb, R.S.; Shockcor, J.; Loftus, N.; Holmes, E.; Nicholson, J.K. Global metabolic profiling of animal and human tissues via UPLC-MS. Nat. Protoc. 2013, 8, 17–32. [Google Scholar] [CrossRef] [PubMed]
  39. Ichihashi, Y.; Date, Y.; Shino, A.; Shimizu, T.; Shibata, A.; Kumaishi, K.; Funahashi, F.; Wakayama, K.; Yamazaki, K.; Umezawa, A.; et al. Multi-omics analysis on an agroecosystem reveals the significant role of organic nitrogen to increase agricultural crop yield. Proc. Natl. Acad. Sci. USA 2020, 117, 14552–14560. [Google Scholar] [CrossRef] [PubMed]
  40. Lin, Y.; Ye, G.; Kuzyakov, Y.; Liu, D.; Fan, J.; Ding, W. Long-term manure application increases soil organic matter and aggregation, and alters microbial community structure and keystone taxa. Soil Biol. Biochem. 2019, 134, 187–196. [Google Scholar] [CrossRef]
  41. Sheng, Y.; He, P.; Xu, X.; Liu, Y. A large-scale assessment on spatial variability of potato yield and soil chemical properties in northern China. Soil Tillage Res. 2023, 231, 105743. [Google Scholar] [CrossRef]
  42. Li, X.; Wang, D.; Ren, Y.; Wang, Z.; Zhou, Y. Soil quality assessment of croplands in the black soil zone of Jilin Province, China: Establishing a minimum data set model. Ecol. Indic. 2019, 107, 105251. [Google Scholar] [CrossRef]
  43. Li, X.; Li, H.; Yang, L.; Ren, Y. Assessment of Soil Quality of Croplands in the Corn Belt of Northeast China. Sustainability 2018, 10, 248. [Google Scholar] [CrossRef]
  44. Lai, J.; Zou, Y.; Zhang, J.; Peres-Neto, P.R. Generalizing hierarchical and variation partitioning in multiple regression and canonical analyses using the rdacca.hp R package. Methods Ecol. Evol. 2022, 13, 782–788. [Google Scholar] [CrossRef]
  45. Ren, J.; Liu, X.; Yang, W.; Yang, X.; Li, W.; Xia, Q.; Li, J.; Gao, Z.; Yang, Z. Rhizosphere soil properties, microbial community, and enzyme activities: Short-term responses to partial substitution of chemical fertilizer with organic manure. J. Environ. Manag. 2021, 299, 113650. [Google Scholar] [CrossRef] [PubMed]
  46. Liu, Y.; Wang, P.; Yu, T.; Zang, H.; Zeng, Z.; Yang, Y. Manure replacement of chemical fertilizers can improve soil quality in the wheat-maize system. Appl. Soil Ecol. 2024, 200, 105453. [Google Scholar] [CrossRef]
  47. Hamedi, J.; Mohammadipanah, F. Biotechnological application and taxonomical distribution of plant growth promoting actinobacteria. J. Ind. Microbiol. Biotechnol. 2015, 42, 157–171. [Google Scholar] [CrossRef] [PubMed]
  48. Mehmood, M.A.; Fu, Y.; Zhao, H.; Cheng, J.; Xie, J.; Jiang, D. Enrichment of bacteria involved in the nitrogen cycle and plant growth promotion in soil by sclerotia of rice sheath blight fungus. Stress Biol. 2022, 2, 32. [Google Scholar] [CrossRef] [PubMed]
  49. Rani, V.; Bhatia, A.; Nain, L.; Tomar, G.S.; Kaushik, R. Methane utilizing plant growth-promoting microbial diversity analysis of flooded paddy ecosystem of India. World J. Microbiol. Biotechnol. 2021, 37, 56. [Google Scholar] [CrossRef]
  50. Chhetri, G.; Kim, I.; Kang, M.; Kim, J.; So, Y.; Seo, T. Devosia rhizoryzae sp. nov., and Devosia oryziradicis sp. nov., novel plant growth promoting members of the genus Devosia, isolated from the rhizosphere of rice plants. J. Microbiol. 2022, 60, 1–10. [Google Scholar] [CrossRef] [PubMed]
  51. Mukhia, S.; Kumar, A.; Kumari, P.; Kumar, R. Psychrotrophic plant beneficial bacteria from the glacial ecosystem of Sikkim Himalaya: Genomic evidence for the cold adaptation and plant growth promotion. Microbiol. Res. 2022, 260, 127049. [Google Scholar] [CrossRef] [PubMed]
  52. Sati, P.; Sharma, E.; Soni, R.; Dhyani, P.; Solanki, A.C.; Solanki, M.K.; Rai, S.; Malviya, M.K. Chapter 11—Bacterial endophytes as bioinoculant: Microbial functions and applications toward sustainable farming. In Microbial Endophytes and Plant Growth; Solanki, M.K., Yadav, M.K., Singh, B.P., Gupta, V.K., Eds.; Academic Press: New York, NY, USA, 2023; pp. 167–181. [Google Scholar]
  53. Palaniyandi, S.A.; Yang, S.H.; Zhang, L.; Suh, J.-W. Effects of actinobacteria on plant disease suppression and growth promotion. Appl. Microbiol. Biotechnol. 2013, 97, 9621–9636. [Google Scholar] [CrossRef] [PubMed]
  54. Yadav, A.N.; Sachan, S.G.; Verma, P.; Saxena, A.K. Prospecting cold deserts of north western Himalayas for microbial diversity and plant growth promoting attributes. J. Biosci. Bioeng. 2015, 119, 683–693. [Google Scholar] [CrossRef]
  55. Enebe, M.C.; Babalola, O.O. Functional diversity of bacterial communities in the rhizosphere of maize grown on a soil under organic and inorganic fertilization. Sci. Afr. 2022, 16, e01212. [Google Scholar] [CrossRef]
  56. Zhou, G.; Qiu, X.; Zhang, J.; Tao, C. Effects of seaweed fertilizer on enzyme activities, metabolic characteristics, and bacterial communities during maize straw composting. Bioresour. Technol. 2019, 286, 121375. [Google Scholar] [CrossRef]
  57. Tan, H.; Deng, Q.; Cao, L. Ruminant feces harbor diverse uncultured symbiotic actinobacteria. World J. Microbiol. Biotechnol. 2014, 30, 1093–1100. [Google Scholar] [CrossRef]
  58. de Gannes, V.; Eudoxie, G.; Hickey, W.J. Prokaryotic successions and diversity in composts as revealed by 454-pyrosequencing. Bioresour. Technol. 2013, 133, 573–580. [Google Scholar] [CrossRef] [PubMed]
  59. Awasthi, M.K.; Zhang, Z.; Wang, Q.; Shen, F.; Li, R.; Li, D.-S.; Ren, X.; Wang, M.; Chen, H.; Zhao, J. New insight with the effects of biochar amendment on bacterial diversity as indicators of biomarkers support the thermophilic phase during sewage sludge composting. Bioresour. Technol. 2017, 238, 589–601. [Google Scholar] [CrossRef] [PubMed]
  60. Yang, W.; Wang, S.; Ni, W.; Rensing, C.; Xing, S. Enhanced Cd-Zn-Pb-contaminated soil phytoextraction by Sedum alfredii and the rhizosphere bacterial community structure and function by applying organic amendments. Plant Soil 2019, 444, 101–118. [Google Scholar] [CrossRef]
  61. Ma, L.-J.; van der Does, H.C.; Borkovich, K.A.; Coleman, J.J.; Daboussi, M.-J.; Di Pietro, A.; Dufresne, M.; Freitag, M.; Grabherr, M.; Henrissat, B.; et al. Comparative genomics reveals mobile pathogenicity chromosomes in Fusarium. Nature 2010, 464, 367–373. [Google Scholar] [CrossRef]
  62. Liu, Z.; Guo, Q.; Feng, Z.; Liu, Z.; Li, H.; Sun, Y.; Liu, C.; Lai, H. Long-term organic fertilization improves the productivity of kiwifruit (Actinidia chinensis Planch.) through increasing rhizosphere microbial diversity and network complexity. Appl. Soil Ecol. 2020, 147, 103426. [Google Scholar] [CrossRef]
  63. Tao, R.; Liang, Y.; Wakelin, S.A.; Chu, G. Supplementing chemical fertilizer with an organic component increases soil biological function and quality. Appl. Soil Ecol. 2015, 96, 42–51. [Google Scholar] [CrossRef]
  64. Liu, H.; Xiong, W.; Zhang, R.; Hang, X.; Wang, D.; Li, R.; Shen, Q. Continuous application of different organic additives can suppress tomato disease by inducing the healthy rhizospheric microbiota through alterations to the bulk soil microflora. Plant Soil 2018, 423, 229–240. [Google Scholar] [CrossRef]
  65. Couteaudier, Y.; Alabouvette, C. Quantitative comparison of Fusarium oxysporum competitiveness in relation to carbon utilization. FEMS Microbiol. Lett. 1990, 74, 261–267. [Google Scholar] [CrossRef]
  66. Xiong, W.; Li, R.; Ren, Y.; Liu, C.; Zhao, Q.; Wu, H.; Jousset, A.; Shen, Q. Distinct roles for soil fungal and bacterial communities associated with the suppression of vanilla Fusarium wilt disease. Soil Biol. Biochem. 2017, 107, 198–207. [Google Scholar] [CrossRef]
  67. Du, T.; Hu, Q.; He, H.; Mao, W.; Yang, Z.; Chen, H.; Sun, L.; Zhai, M. Long-term organic fertilizer and biofertilizer application strengthens the associations between soil quality index, network complexity, and walnut yield. Eur. J. Soil Biol. 2023, 116, 103492. [Google Scholar] [CrossRef]
  68. Liu, X.; Liu, H.; Zhang, Y.; Liu, C.; Liu, Y.; Li, Z.; Zhang, M. Organic amendments alter microbiota assembly to stimulate soil metabolism for improving soil quality in wheat-maize rotation system. J. Environ. Manag. 2023, 339, 117927. [Google Scholar] [CrossRef]
Figure 1. TN (a), SOM (b), C/N (c), available P (d), available K (e), pH (f), BG (g), NAG (h), AP (i), and LAP (j) in soils with different levels of organic amendment. Enzyme stoichiometry is characterized by BG/(LAP + NAG) and (LAP + NAG)/AP (k). Fertilizer treatments include M0 (full chemical fertilizer), M25 (25% organic fertilizer amendment), M50 (50% organic amendment), and M100 (100% organic amendment). According to the one-way ANOVA and Duncan’s test, different letters indicate significant differences among treatments for the same indicator (p < 0.05). The vertical bars represent standard errors (n = 3).
Agronomy 15 00429 g001
Figure 2. Bacterial (a) and fungal (b) α-diversity (Shannon index) under different levels of organic amendment. Pairwise comparisons between treatments were performed using the t-test. A PCoA based on Bray–Curtis distances shows differences in soil bacterial (c) and fungal (d) compositions under long-term organic amendment, with PERMANOVA using the Adonis function permutation test. The significance levels are as follows: ns, p > 0.05; *, p ≤ 0.05; **, p ≤ 0.01; and ***, p ≤ 0.001.
Agronomy 15 00429 g002
Figure 3. Phylogenetic tree of bacterial (a) and fungal (b) ASVs with abundances greater than 0.1%. The inner ring color represents the phylum of each ASV. The middle ring shows the relative abundance of each ASV in each treatment. The outer ring color represents the differential analysis results after FDR (<0.05) correction: purple, orange, and green indicate no significant difference, significant upregulation, or significant downregulation in M100 compared to M0, respectively. The shades of red and blue represent the absolute value of log2FC. The abundance of plant-beneficial microorganisms (c) and plant pathogenic microorganisms (d) changes with the organic amendment gradient, as obtained by querying and matching the PBB and FungalTraits databases. According to the one-way ANOVA and Duncan’s test, different letters indicate significant differences among treatments for the same indicator (p < 0.05).
Agronomy 15 00429 g003
Figure 4. The PCoA performed based on Bray–Curtis distances shows differences in the soil metabolite composition under long-term organic amendment (a), with PERMANOVA carried out using the Adonis function permutation test. The results of metabolites upregulated (b) and downregulated (c) in M25, M50, and M100 relative to M0, with FDR > 0.05 as the standard. The internal upset plot shows the number of differential metabolites in M25, M50, and M100 relative to M0. The middle circle shows the number of all differential metabolites in M25, M50, and M100. The outer circle shows the total number of differential metabolites in the M25, M50, and M100 treatments. The KEGG pathway enrichment analysis results for metabolites commonly upregulated in M25, M50, and M100 compared to M0 with FDR > 0.05 (d). The enrichment factor (Rich Factor) represents the number of differential metabolites enriched in the pathway divided by the number of background metabolites enriched in the pathway. The classification of metabolites commonly upregulated (e) and downregulated (f) in M25, M50, and M100 relative to M0 based on the HMDB database. Changes in maize plant height after adding 0.05 mM of lithocholic acid, maltotriose, maltose, trehalose, and raffinose to the nutrient solution (g) and photos of maize plants 10 days after adding metabolites (h). Changes in the proportion of <0.25 mm and >0.25 mm aggregates in soil after adding 1, 5, and 25 mmol/kg of trehalose and raffinose and culturing for three weeks (i). The significance levels are as follows: ns, p > 0.05; *, p ≤ 0.05; **, p ≤ 0.01; and ***, p ≤ 0.001. Different letters indicate significant differences among treatments for the same indicator (p < 0.05).
Agronomy 15 00429 g004
Figure 5. Soil health index calculated from TN, SOM, pH, available P, and available K (a). According to one-way ANOVA and Duncan’s test, different letters indicate significant differences among treatments for same indicator (p < 0.05). Vertical bars represent standard errors (n = 3). Variation partitioning and hierarchical partitioning assess individual effects of soil chemical and enzymatic indicators on microbiota and metabolite variation, explaining separate explanatory power of these indicators (b). Correlation analysis of soil health index, chemical properties, enzymatic activity, beneficial microbes, plant pathogens, and beneficial metabolites with screening threshold of p < 0.05, R > 0.8, or R < −0.8 (c).
Agronomy 15 00429 g005
Table 1. Different membership functions and segmentation points of chemical indicators.
IndicatorWeightFunctionx1x2x3x4
total nitrogen0.201U (x)0.752.86
soil organic matter0.201U (x)1050
available phosphorus0.201U (x)1.40137.51
available potassium0.201U (x)20435
pH0.196P (x)4.56.57.09.0
U (x): The “more is better” function; P (x): the “optimal range” function.
Disclaimer/Publisher’s Note: The statements, opinions and data contained in all publications are solely those of the individual author(s) and contributor(s) and not of MDPI and/or the editor(s). MDPI and/or the editor(s) disclaim responsibility for any injury to people or property resulting from any ideas, methods, instructions or products referred to in the content.

