Article

Pastureland Soil Organic Carbon Storage Regulated by Pasture Species and Age Under Nitrogen and Water Addition in Northern China

1
State Key Laboratory of Efficient Utilization of Arable Land in China, The Institute of Agricultural Resources and Regional Planning, Chinese Academy of Agricultural Sciences, Beijing 100081, China
2
Hulunber Grassland Ecosystem National Observation and Research Station, Institute of Agricultural Resources and Regional Planning, Chinese Academy of Agricultural Sciences, Beijing 100081, China
3
College of Resources and Environment, Qingdao Agricultural University, Qingdao 266109, China
4
Foreign Studies College, Northeastern University, Shenyang 110057, China
*
Author to whom correspondence should be addressed.
Agronomy 2025, 15(2), 399; https://doi.org/10.3390/agronomy15020399
Submission received: 21 December 2024 / Revised: 26 January 2025 / Accepted: 31 January 2025 / Published: 2 February 2025
(This article belongs to the Section Grassland and Pasture Science)

Abstract

:
Soil organic carbon (SOC) is a key indicator of soil quality and an important component of the global carbon cycle. Enhancing SOC through crop rotation is a promising strategy; yet, the underlying mechanisms for SOC accumulation remain unclear. This study aimed to evaluate the effects of different pasture age, pasture species, irrigation, and nitrogen (N) fertilization treatments on SOC content and storage in pastureland, analyzing the SOC content and below-ground biomass (BGB) data of different soil layers (0–10 cm, 10–20 cm, 20–40 cm, 40–60 cm) of each treatment under three factors (pasture species (Bromus inermis, Medicago varia, the 1:1 mixture), irrigation (CK, dry-season supplementation), and N fertilization (0 kg N hm−2 y−1, 75 kg N hm−2 y−1, and 150 kg N hm−2 y−1)), as well as the interaction effects of these factors. Pasture species, water and N addition levels, and pasture age all had significant (p < 0.05) effects on BGB. At the age of 1–3, the SOC content of monocultured Bromus inermis was slightly higher than the monocultured Medicago varia and the mixture, and at the age of 4–5, monocultured Medicago varia and the mixture were slightly higher than the monocultured Bromus inermis. Among them, the mixture was the highest. At the age of 2–5, the BGB of pastureland was significantly influenced by pasture species, N and water addition, and pasture age. Over a 5-year period, SOCs in the surface layer of the fallowed cropland accumulated 32.35 Mg ha−1, showing a very good carbon sequestration effect; especially the planting of a mixed pasture had a more significant positive effect on the accumulation of SOC. Therefore, for the low and medium yielding fields in China, according to the crop utilization target and production cycle, the purpose of improving soil quality can be effectively achieved through crop and grass rotation.

1. Introduction

Soil organic carbon (SOC) is crucial for maintaining the material cycle and energy flow within ecosystems. It not only provides essential nutrients for plants but also plays a vital role in protecting the physical structure and chemical properties of soil. SOC is instrumental in enhancing crop quality, yield, and resilience to environmental stresses [1,2,3,4]. Higher SOC content in soil strengthens its carbon sequestration capacity [5]. Given its importance, the management of SOC has become a key strategy in the context of global climate change and sustainable agricultural development. Effective SOC management helps mitigate greenhouse gas (GHG) emissions, enhance soil fertility, and improve ecosystem services. Crop and grass rotation is an effective strategy to overcome barriers associated with monocropping, improve soil fertility, and make use of underutilized lands such as idle, fallow, saline, and marginal lands [6,7,8]. This practice not only alleviates soil pathogen buildup caused by continuous cropping [9,10,11] but also provides high-quality forage for livestock [6]. While numerous studies have focused on the effects of crop planting systems, fertilizer management, and soil management practices on SOC [12,13], research on pasturelands—particularly the role of high-quality leguminous and grass forages in enhancing soil quality—has been limited. Furthermore, the potential impacts of irrigation and nitrogen (N) fertilization on SOC under the interaction of pasture species and cropping years have not been thoroughly explored [14,15]. The distribution of SOC content is influenced by multiple factors, including vegetation type [16,17], soil management practices [18,19,20], and the physicochemical properties of the soil [21]. Different land use types exert varying impacts on SOC distribution. For agricultural land, implementing appropriate farming practices, along with effective fertilization and irrigation management, is essential to maintain soil fertility [22]. In pasturelands, proper management measures are necessary to support grassland growth and development [23]. In natural grasslands, protecting the ecological environment and carefully regulating human activities are critical to preserving SOC sequestration [24,25]. As early as 1996, a study found significant differences in the root structure and biomass output of different crops, which can affect the input and cycling of organic carbon [26]. N fertilization and irrigation are critical farmland management practices in agriculture, and the impact of N fertilization on SOC content has been a focal point of research. N fertilization has been shown to significantly influence SOC content [27,28,29]. It affects SOC by altering the dynamics of soil dissolved organic carbon (DOC) and microbial biomass carbon (MBC). N addition increases DOC and MBC by more than 110% and 10%, respectively [30]. DOC and MBC are rapidly cycling forms of stabilized carbon in soils and play a crucial role in the soil carbon cycle [31]. Long-term fertilization has been shown to significantly modify basic soil properties, increasing the accumulation of mineralized organic carbon and the potential mineralized carbon content [31]. Soil moisture is another critical environmental factor influencing SOC [32]. Irrigation promotes plant growth, boosts biomass production, and increases the input of crop residues and root exudates into the soil, which are important sources of SOC. Appropriate soil water content can also enhance soil biological activity, including microbial and enzyme activity, which accelerates the mineralization and decomposition of soil organic matter (SOM) [33]. However, prolonged excessive water conditions may reduce soil aeration, impairing the respiration of soil organisms and slowing down the decomposition rate of organic matter [34]. There is still a lack of systematic research on the effects of forage species, irrigation, and N fertilization strategies on SOC content in crop–grass rotation systems. Specifically, how these measures influence the distribution and dynamics of SOC across different ages of grasses and soil depths remains poorly understood. This study aims to investigate how different forage species and water–nitrogen addition strategies affect SOC content at different ages of grasses and soil depths, and the interactions between these factors.
This study employed a combination of field investigations, laboratory analyses, and statistical methods to (1) explore the dynamic changes in SOC content at different soil depths under varying irrigation and N fertilization treatments for legume and grass pastures of different ages, and (2) analyze the interactions of pasture species, irrigation, N fertilization, pasture age, and soil depth. The goal is to provide data that can support precision agriculture management and strategies for enhancing soil fertility.

2. Materials and Methods

2.1. Research Methodology

The experimental site is located at the Hulunber Grassland Ecosystem National Observation and Research Station in Inner Mongolia (N 49°6′–49°32′, E 119°32′–120°35′), China. The region experiences a semi-moist, semi-arid continental monsoon climate within the mesothermal zone. The average annual temperature is −2.4 °C, with an annual cumulative temperature of ≥10 °C ranging from 1580 to 1800 °C. The frost-free period lasts for approximately 110 days, and the average annual precipitation is 350 mm, mainly concentrated in the peak plant growth season (July–September).
The experiment selected perennial pastures with strong adaptability, high yield, and good palatability in the agricultural and pastoral intertwined area, which were perennial pastures such as alfalfa (Medicago varia) and smooth bromegrass (Bromus inermis). The experiment adopted a randomized block design, with pasture species as the main treatment, irrigation and fertilization as the sub-treatment, mechanical tilling, and strip sowing, with row spacing of 20 cm. The sowing rate was 15.0 kg ha−1 for Medicago varia sown singly, 30.0 kg ha−1 for Bromus inermis sown singly, 7.5 kg ha−1 for Medicago varia sown in a mix, and 15 kg ha−1 for Bromus inermis in a mix. Hand pulling of weeds after seedling formation was performed to protect seedlings. The nitrogen fertilizer applied was chemically pure urea. The grass was mowed twice a year for yield determination, once in June and once in August, leaving a stubble height of 5 cm. Regarding pasture species treatments (Bromus inermis, Medicago varia, Bromus inermis and Medicago varia mixture), nitrogen fertilization treatments (CK: 0 kg N hm−2 y−1, low nitrogen: 75 kg N hm−2 y−1, and high nitrogen: 150 kg N hm−2 y−1), and irrigation treatments (CK: 0 mm water supplementation, 60 mm water supplementation in the dry season (15% of the average annual precipitation)), each experimental plot was 7 m × 10 m, with 4 replications per treatment. Refer to Table 1 for the acronyms of all treatments. Starting the experiment in June 2016, the pasture was aged 1–5 in 2017–2021. The basic physical and chemical properties of the soil of the pastureland in 2016 are shown in Table 2, as well as the temperature and precipitation during 2016–2021 being shown in Figure 1.

2.2. Sample Collection

Soil samples for this study were collected in July each year from 2016 to 2021. Using a soil auger, samples were taken from four soil depths: 0–10 cm, 10–20 cm, 20–40 cm, and 40–60 cm. At each experimental plot, three random sampling points were selected, and the soil from each depth was pooled to form one composite sample. The samples were passed through a 2 mm sieve and mixed thoroughly. A portion of the fresh soil was used to determine soil moisture content, while the remainder was air-dried indoors and used for an analysis of soil physicochemical properties. Below-ground biomass (BGB) samples were collected using a diagonal sampling method. At each small area, three sampling points were selected, and a soil profile was dug to extract plant roots within a 30 cm × 30 cm × 30 cm sample cube. The roots were rinsed with water, dried in an oven, and weighed to determine the dry biomass.

2.3. Indicators and Their Methods

Three repeated measurements (in order to control the measurement error) were set for each plot, and the final data were obtained by averaging the values from each processed sample. After natural air drying, soil samples were subdivided by the tetrad method, then ground, and sieved through a 1 mm mesh to determine the organic matter content of the soil. The organic matter was determined by the potassium dichromate volumetric method with an external heating method.
Δ S O C % = S O C n S O C 0 S O C 0 × 100 %
S O C s = i = 1 n ρ i × c i × d i × 10 1
C V = S D M e a n × 100 %
ΔSOC%: the rate of change in SOC content (%);
SOCn: SOC content (g kg−1) in n years of cultivation;
SOC0: SOC content in 2016 (g kg−1);
SOCs: SOC stocks (Mg ha−1);
ρi: bulk weight of soil layer i (g cm−3);
ci: SOC content in soil layer i (g kg−1);
di: soil thickness of soil layer i (cm);
CV: coefficient of variation;
SD: standard deviation;
Mean: average.

2.4. Data Processing

Office 2021 was used to summarize and organize the collected data. Excel 2021 was employed to analyze the mean and standard deviation and coefficient of variation, as well as for graphing; SPSS Statistics 27 was used to analyze the data for significance of differences and a correlation analysis; Origin-Pro 2024 was used to prepare graphs.

3. Results

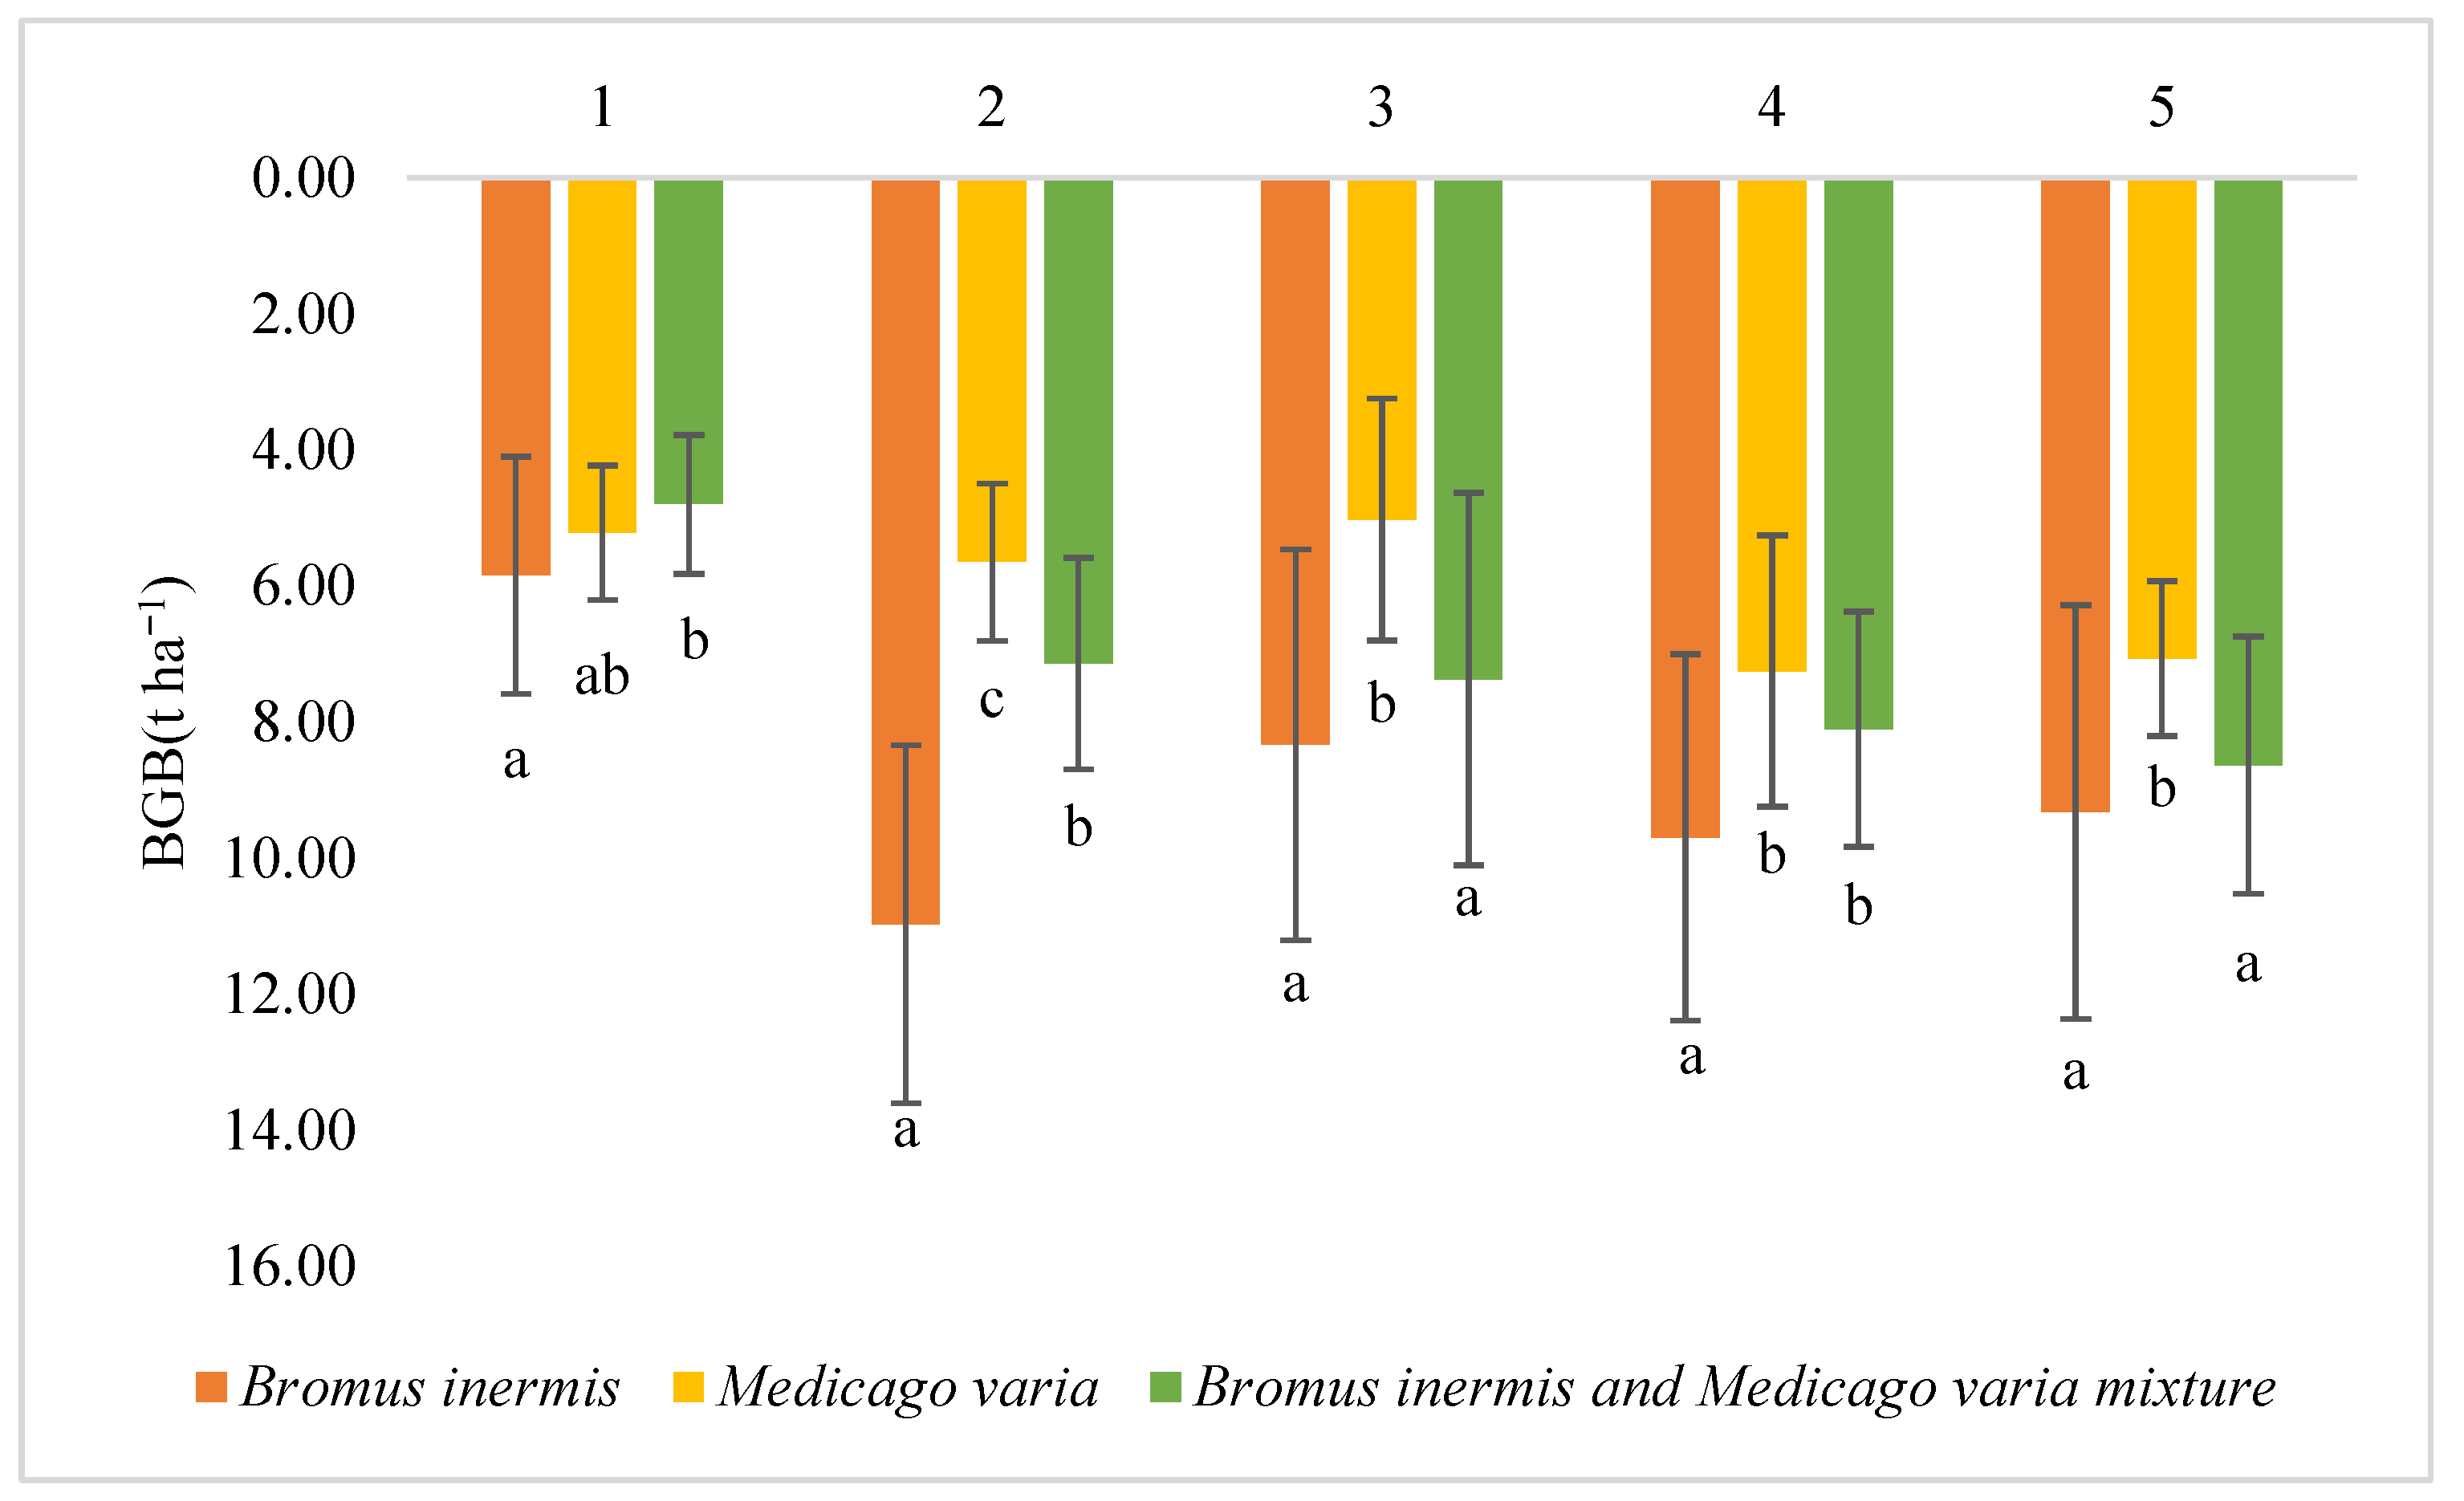
3.1. Below-Ground Biomass

Pasture species, N fertilization, irrigation, and pasture age all had significant effects (p < 0.05) on BGB, of which pasture species and pasture age showed highly significant effects (p < 0.001) on BGB. There were significant interactions (p < 0.05) between pasture species and N fertilization, and between pasture species and pasture age (p < 0.001) (Table 3). Under different pasture–nitrogen–water treatments, the BGB of pastureland had significant changes (p < 0.05) from age 1 to 5, and the highest values of BGB at each age were in the monocultured Bromus inermis (Figure 2). Overall, BGB showed an increasing trend with increasing age of grasses, and in monocultured Bromus inermis and mixed sowing treatments, the overall BGB of pastureland planted for 2 and more years was significantly higher than that of 1-year-old grassland (p < 0.05) (Figure 1).
Significant differences (p < 0.05) were found between the BGB of the pasture treatments of different ages (Figure 2). The BGB of the 1-year monocultured Bromus inermis was significantly higher than that of the mixed sowing treatment (p < 0.05). For the 2- to 5-year planting periods, the BGB of monocultured Bromus inermis were significantly higher than that of the mixed sowing treatment (p < 0.05). For the 2-year, 3-year, and 5-year planting periods, the BGB of monocultured Medicago varia was significantly lower than that of the mixed sowing (p < 0.05). The overall BGB among the pasture treatments was ranked as follows, monocultured Bromus inermis > mixed sowing Bromus inermis and Medicago varia > monocultured Medicago varia, and the difference was significant (p < 0.05). The BGB of monocultured Bromus inermis increased with pasture age, then decreased, and later increased and stabilized, peaking in the second year of planting at 11.00 t ha−1. The BGB of monocultured Medicago varia treatment showed a general increasing trend with a slight decreased in the third year of planting, reaching its highest value of 7.25 t ha−1 in the fourth year. For the mixed sown pastures, BGB continued to increase year by year, where the highest value was 8.63 kg ha−1 recorded in the fifth year of planting.

3.2. Changes in Soil Organic Carbon Content

Under irrigation and N fertilization conditions, the rate of change in SOC content for monocultured Bromus inermis, monocultured Medicago varia, and mixed sowing followed a similar pattern in the 0–10 cm and 10–20 cm soil depths, showing a trend of “increase-decrease-increase” as the pasture age increased (Figure 3). Specifically, in the 20–40 cm and 40–60 cm soil depths, the SOC content of monocultured Bromus inermis decreased with the increase in age, while the SOC content of both the monocultured Medicago varia and mixture followed a “bimodal” pattern of “increase-decrease-increase-decrease” (Figure 3). Overall, the rate of change in SOC content was lowest in the mixed sowing treatment. At the age of 1–3 years, monocultured Bromus inermis was slightly higher than that of monocultured Medicago varia and mixed sowing. At the age of 4–5 years, monocultured Medicago varia and mixed sowing were slightly higher than monocultured Bromus inermis, of which mixed sowing was the highest.
From Figure 3, in the treatments of monocultured Bromus inermis, the highest rate of change in SOC content was observed in BLN treatment planted for 5 years at 84.83%, and the lowest rate of change in SOC content was observed in BZY treatment planted for 3 years at 19.29% in the 0–10 cm soil layer. In the 10–20 cm soil layer, BLY treatment with 2 years of planting was the highest with 91.91%, and BHN with 3 years of planting was the lowest with 4.76%. In the 20–40 cm soil layer, BLY planted for 1 year was the highest at 114.18% and BZY planted for 5 years was the lowest at 12.67%. In the 40–60 cm soil layer, BLN with 1 year of planting was the highest at 214.40% and BLY with 5 years of planting was the lowest at 11.47%. The rate of change in SOC content in the top 0–10 cm and 10–20 cm soil depths was highest in BLY treatment planted for 2 years, which was 87.15% higher as compared to BHN treatment planted for 3 years (lowest).
As for the treatments of monocultured Medicago varia, in the 0–10 cm soil layer, the highest rate of change in SOC content was observed in MZY treatment planted for 2 years with a value of 81.60% and the lowest rate of change in SOC content was observed in MHY treatment planted for 3 years with a value of 11.53%. In the 10–20 cm soil depth, the highest value of 93.46% was recorded for MLY treatment planted for 5 years and the lowest value of 10.62% was recorded for MZY planted for 3 years. In the 20–40 cm soil layer, MZN with 3 years of planting was the highest at 82.46% and MHN with 3 years of planting was the lowest at −2.05%. In the 40–60 cm soil layer, MHN was highest with 236.66% for 2 years of planting and lowest with 9.52% for MLY for 5 years of planting. The rate of change in SOC content in the top 0–10 cm and 10–20 cm soil depths was highest in MLY treatment planted for 5 years, which was 82.84% higher as compared to MHY treatment planted for 3 years (lowest).
As for the treatments of the mixture, in the 0–10 cm soil layer, the highest rate of change in SOC content was 79.82% in BMZN treatment planted for 2 years and the lowest rate of change in SOC content was 0.04% in BMLY treatment planted for 3 years. In the 10–20 cm soil layer, it was highest in BMHN treatment planted for 2 years with 93.99% and lowest in BMLY planted for 3 years with 10.75%. In the 20–40 cm soil layer, BMHY with 1 year of planting was the highest at 105.13% and BMZY with 3 years of planting was the lowest at 19.14%. In the top 0–10 cm and 10–20 cm soil depths, the highest rate of change in SOC content was recorded in BMHN treatment planted for 2 years, which was 93.95% higher compared to BMLY treatment planted for 3 years (the lowest).

3.3. Changes in Soil Organic Carbon Storage

From Figure 4i, in the 0–10 cm soil layer, under the condition of the same treatment at different ages, the BHN SOCs were the highest at 38.20 Mg ha−1 for 5 years of planting, and the lowest at 22.29 Mg ha−1 for 3 years of planting. The BZN SOCs were the highest at 36.82 Mg ha−1 for 2 years of planting, and the lowest SOCs were found in BLN (20.45 Mg ha−1) planted for 3 years. In all the treatments with Bromus inermis, ages 1 to 5 years, the highest SOCs were found in treatment BHN (0–10 cm), which was 14.18% higher than that of BHY (the lowest), and the highest SOCs were found in treatment BLY (10–20 cm), which was 10.93% higher than that of BLN (the lowest).
From Figure 4ii, in the 0–10 cm soil layer, under the condition of the same treatment at different ages, MZY with 5 years of planting had the highest SOCs of 38.56 Mg ha−1, and MHN with 3 years of planting had the lowest SOCs of 21.37 Mg ha−1. In the 10–20 cm soil layer, the treatment MLY had the highest SOCs of 39.42 Mg ha−1 with 5 years of planting, and MZN with 3 years of planting had the lowest SOCs of 20.76 Mg ha−1. For the characteristics of SOC variations among different soil layers, SOCs were greater in the 0–10 cm soil layer. In all the treatments with Medicago varia aging 1 to 5 years, the surface layer 0–10 cm was highest in treatment MZY, which was 14.85% higher compared to MHN treatment (lowest), and 10–20 cm was highest in treatment MLY SOCs, which was 26.63% higher compared to MHN treatment (lowest).
From Figure 4iii, in the 0–10 cm soil layer, under the condition of the same treatment with different ages, BMZY with 5 years of planting had the highest SOCs of 39.15 Mg ha−1, and BMLY with 3 years of planting had the lowest SOCs of 19.08 Mg ha−1. In the 10–20 cm soil layer, BMHY with 2 years of planting had the highest SOCs of 37.06 Mg ha−1, and BMHN with 3 years of planting had the lowest SOCs of 20.90 Mg ha−1. For the characteristics of SOC changes among different soil layers, the SOCs of the 0–10 cm and 10–20 cm layers were close to each other, but with the increase in grasses’ age, the SOCs of the 0–10 cm layer were larger than those of the 10–20 cm layer. In all the treatments with the mixture of ages 1 to 5 years, the surface layer 0–10 cm was highest in treatment BMZY, which was 17.92% higher compared to BMHY treatment (lowest), and 10–20 cm was highest in treatment BMHN SOCs, which was 25.06% higher compared to BMZY treatment (lowest).
On the whole, the overall change rule of SOCs in 0–10 cm and 10–20 cm soil layers of monocultured Bromus inermis grassland under different water and N conditions was basically the same, showing the trend of “increase-decrease-increase” with the increase in grasses’ age. In the 0–10 cm soil layer, the SOCs of monocultured Medicago varia and mixed sowing were higher than those of monocultured Bromus inermis, with monocultured Medicago varia being the highest, in which monocultured Medicago varia and mixed sowing were optimized by MZY and BMZY treatments, which showed good performance in 2 and 5 years of planting; for monocultured Bromus inermis, the optimal treatment was planting BHN treatment for 5 years. In the 10–20 cm soil layer, SOCs showed that monocultured Medicago varia > mixed sowing > monocultured Bromus inermis, which was consistent with 0–10 cm, but there was no significant difference among the three. Monocultured Bromus inermis was optimized by BZN treatment for 2 years; monocultured Medicago varia was optimized by MLY for 5 years; and mixed sowing was optimized by BMHY for 2 years.
The change characteristics of SOCs in the 0–10 cm and 10–20 cm soil layers of pastureland with different ages were not completely consistent (Figure 5). In the 0–10 cm soil layer, the SOCs of the grassland planted for 5 years were 35.96 Mg ha−1, which was significantly higher than that of the grassland planted for 2, 3, and 4 years, and it was the highest value (p < 0.05); the SOCs of the grassland planted for 3 years were 22.78 Mg ha−1, the lowest value (p < 0.05). In the 10–20 cm soil layer, the SOCs of grassland planted for 2 years were 35.65 Mg ha−1, which was significantly higher than that of grassland planted for 3 years, 4 years, and 5 years, and was the highest value (p < 0.05); the SOCs of grassland planted for 3 years were 21.71 Mg ha−1, which was the lowest value (p < 0.05). In the 0–10 cm soil layer, the SOCs of pastureland with different ages were listed in the order of highest to lowest (p < 0.05): 5 years > 2 years > 4 years > 3 years; and the SOCs of pastureland with different ages in the 10–20 cm soil layer were ranked from highest to lowest (p < 0.05): 2 years > 5 years > 4 years > 3 years.
Figure 5. Changes in soil organic carbon storage in different soil layers of pastureland with different ages under different pasture–nitrogen–water treatments. Note: Different lowercase letters (a, b, c…) indicate that the SOCs in the same soil layer have a significant difference at different ages (p < 0.05).
Agronomy 15 00399 g005

3.4. Factor Interactions

Among the five factors of grass, N, water, age, and soil depth, age and soil depth had highly significant effects on the rate of change in SOC content (p < 0.001); there were significant two-by-two interactions between pasture species and N fertilization, and between pasture age and soil depth (p < 0.05); and there were significant (p < 0.05) three-way interactions between pasture species, N fertilization, and soil depth (p < 0.05), and between water, N application, and soil depth (p < 0.05); there was also a significant interaction (p < 0.05) between four factors: pasture species, N fertilization, water, and soil depth (Table 4). Among them, the age of cultivated grasses had a significant effect on SOCs (p < 0.05), and it had a significant two-by-two interaction with soil depth (p < 0.05).

4. Discussion

4.1. Effects of Pasture–Nitrogen–Water on Below-Ground Biomass of Pastureland with Different Ages

In this study, pasture species had a highly significant (p < 0.001) effect on BGB. It has been shown that different pastures may also exhibit varying potentials for accumulating BGB due to differences in their root system structure, growth habits, and environment adaptability [35]. The root system is a direct source of BGB; legume pasture Medicago varia has a taproot system, which results in a higher root–crown ratio compared to grass pastures. This allows Medicago varia to extend its root system into the root-deep soil layer. Bromus inermis is a grass species with a fibrous root system, primarily concentrated in the topsoil, which may explain why in this study the BGB of the monocultured Bromus inermis treatment was generally higher than that of the monocultured Medicago varia and mixed sowing treatments in the 0–30 cm soil layer; N is an essential element for plant growth, and appropriate N fertilizer supplementation can promote plant growth, thereby increasing BGB [36]. N fertilization had a significant (p < 0.05) effect on BGB. However, excessive N fertilization can lead to N loss, which hampers BGB accumulation. While moderate N fertilization significantly enhances BGB, the effect diminishes once a certain threshold is exceeded [37]. Moisture is a crucial factor in maintaining the health of grassland ecosystems, and timely irrigation during the dry season can alleviate water stress, thereby promoting the growth of BGB [38]. However, in this study, irrigation did not have a certain effect on the BGB. This may be due to the relatively arid climate and delayed rainfall in recent years, as well as the limited amount of experimental water supplementation, which was insufficient to counteract the drought-induced stress. A study on the resistance of pasture grasses to drought showed that pasture grasses grow better after drought stress than before, meaning that pasture grasses are inherently resistant to drought and compensate for the productivity lost during the drought period. In this case, dry-season rehydration seems to have little effect on BGB [38]. Meanwhile, pasture age had a highly significant effect (p < 0.001) on BGB [36]. BGB accumulation increased with pasture age, and different pasture species and planting patterns may affect it. According to an existing study, perennial crops have higher rates of BGB accumulation compared to annual crops, preventing soil erosion and adding carbon to the soil over the long term [35]. As plants grow, pasture grasses tend to dominate due to their rapid growth, and the development of the pasture root system gradually improves, forming a more developed underground network. However, at a later stage, this pattern may shift due to increased competitive pressure or changes in other environmental factors. Indirectly, it improves soil structure and enhances the water-holding capacity and nutrient cycling capacity of the soil. In turn, the availability of water and nutrients promotes the growth and development of the root system, which further stimulates BGB accumulation [23,37]. Therefore, effective grassland management should consider the dynamic changes throughout the pasture life cycle and adjust strategies accordingly. For example, a study in a semi-arid grassland located in northeastern China showed that long-term mowing increased pasture biomass, but temporarily halting mowing or fertilization can allow plant and soil nutrients to recover [39].

4.2. Effects of Pasture–Nitrogen–Water on Soil Organic Carbon Pools in Pastureland of Different Ages

The root structure and biomass of pasture species directly influence the physical structure of the soil, the input of organic matter, and differences in root exudates, which in turn affect SOC changes [40]. The accumulation and decomposition of SOC represent a dynamic equilibrium process, which is influenced by microbial activities, soil physicochemical properties, and other factors. In this study, SOC content in pastureland responded significantly to pasture age and soil depth (p < 0.05), but did not differ significantly under different pasture, N fertilization, and water replenishment treatment (p < 0.05). The overall SOC content change rate was higher in 2 years of planting and 1 year of planting, i.e., the rate of SOC accumulation was relatively faster and the increment was greater in the surface layer. This may be due to the fact that at the early stage of pasture planting, the above-ground and below-ground parts grow rapidly, and the growth and distribution of the root system directly affect the distribution of soil nutrients, especially the nutrients in the surface layer spreading downward with the root system, which has a significant effect on the rate of change in SOC content in the deeper soil layers [41]. With the increase in pasture age, the growth of the pasture root system becomes slower, the BGB tends to stabilize, and the ability to influence the SOC content decreases, so with the increase in age, the pasture species does not have a significant effect on the rate of change in SOC content (p < 0.05). In a long-term experiment with alfalfa in an arid region of a plateau, there is a decline in SOCs of the 0–100 cm soil layer in the early part of the successional period (9 years), while SOCs tended to recover in the late alfalfa succession (13 years), and then declined again after 16 years [37]. The long-term trend is similar to this short-term study trend, and the reasons may be mutual.
The long-term cultivation of Medicago varia contributed more to SOC content, particularly in deeper soil layers, compared to the long-term cultivation of Bromus inermis. The year-to-year trend of BGB showed that the BGB of Bromus inermis was significantly higher than that of Medicago varia. However, the higher BGB of Bromus inermis may consume more soil nutrients while contributing less to SOC accumulation [37]. Medicago varia has biological N fixation, which can play a certain role in promoting SOC accumulation [42]. As for legume and grass mixed sowing pastureland, its planting system is more superior in soil modification and fertilization; mainly, this may be because under the mixed sowing system, the spatial structure of the soil is optimized, and the two complement each other, so as to improve the N fixation, transfer, utilization pathway, and efficiency of the legume and grass mixed sowing pasture root system [43]. The mixed sowing model can effectively improve the soil nutrient status and enhance the production efficiency of vegetation [43]. However, in this study, the SOCs of mixed treatment were similar to that of monocultured Medicago varia, which may be due to the competition of pastures during mixed sowing, resulting in little improvement of soil nutrients. Even due to the increased consumption of soil nutrients due to competition, legume pastures had a competitive advantage over grass pastures, and in the study, the 5 years of planting of Bromus inermis showed obvious degradation [42,44].
A meta-analysis yielded a result that the average effect size of fertilization on SOC was 0.2707 and for PLUSMN, it was 0.0086 (95% confidence interval: 0.2539–0.2875, p < 0.0001), and both irrigation and fertilization have an effect on SOC accumulation [45]. Increases in fast-acting nutrients lead to the retention of organic carbon, limiting nutrient loss and thus increasing carbon sequestration [45]. N fertilization generally increases total soil N content and may cause changes in SOC content, especially when N additions promote plant above-ground biomass accumulation, which indirectly affects SOC inputs [46]. In this study, a low level of N fertilization/zero N and water supplementation promoted SOCs in Medicago varia, which has its own N fixation capacity and is not easily limited by the N content in the soil, whereas Bromus inermis may be limited by the N content, which may weaken its carbon sequestration capacity [47,48]. The results of an 8-year long-term positioning experiment by Li (2023) [15] showed that the SOC content increases with the increase in N fertilization, but the soil carbon sequestration capacity decreases when it exceeds 300 kg ha−1. In addition, soil microbial activity is limited by the availability of soil N, and N fertilization can reduce the decomposition rate of organic carbon, resulting in an increase in soil carbon content [14]. A previous meta-analysis reported that N addition increased DOC and MBC by more than 110% and 10%, respectively [30]. However, regarding the specific response of SOC content to N fertilization and irrigation, there are also relevant experimental results showing that they do not always produce significant differences [45,49]. The results of a global meta-analysis by Liu (2023) [45] indicated that the presence of N fertilization alone could significantly increase yield without altering organic carbon, suggesting that N is a major limiting factor for crop growth in agricultural dryland soils, but there is not necessarily a significant correlation between N fertilization and SOC. The study of Zhang (2023) [49] showed the result that N fertilization had no significant effect on SOC content. In the study of Cao (2021) [50] that compared with an unfertilized control group, the application of mineral fertilizer (NPK) had no significant effect on the contents of large aggregate organic carbon and TN in soil. In a study where the interaction of fertilization and irrigation on soil surface organic carbon content was quantified, soil surface (0–20 cm) organic carbon content increased by 30.5% and 20.8% with decreasing irrigation under both fertilization conditions [20]. The direct response of SOC content to N fertilization and irrigation is not obvious, which may also be because water recharge and N addition reached a saturation effect under specific conditions, or other factors (such as soil type, initial organic carbon level, plant species, etc.) have more limiting effects on organic carbon accumulation than the gain effects of fertilization and irrigation [51]. While N fertilization and rehydration can provide nutrients and water for plant growth, additional N and water may not further promote organic carbon accumulation if microbial activity is already saturated or if the decomposition rate of SOC has reached its upper limit or is insufficiently recharged [14,46]. In summary, N fertilization generally influences SOC content, but its effects, when combined with irrigation, can vary depending on specific conditions. In some cases, significant differences may not be observed, as the response is influenced by a combination of environmental and management factors. The relationship between the rate of change in SOC content and BGB was further analyzed, and the two were significantly correlated (p < 0.05). As shown in Table 3 pasture species, N fertilization, irrigation, and age of pastureland all had a significant effect on the BGB (p < 0.05). Three factors, pasture, N, and irrigation, may indirectly affect the changes in SOC content by influencing the changes in BGB.

4.3. Interaction Effects of Factors Influencing Soil Organic Carbon Pools

In this study, with the increase in soil depth, the SOC content decreases, which is related to a lot of different parameters, one of which is the distribution of the root system in the soil. The different responses of pasture species to N fertilization and irrigation can affect the growth of plant roots, which in turn affects BGB and indirectly affects SOC content. The area where plant roots are located can provide a good environment for soil microorganisms as well as raw materials for microorganisms to decompose and survive. Soil microbial activities are more frequent in areas with more root distribution [52,53]. Soil microorganisms mineralize and degrade SOC through metabolic activities, and mineralization affects the content and composition of SOC, which in turn affects the turnover rate and stability of SOC [54,55].
The plant years of grassland had a significant effect (p < 0.05) on SOCs. The trend of SOC content with age is complex, and there are various factors regulating SOC content in addition to the planting time scale, thus showing diversified change characteristics. This trend may be the result of the accumulation of plant root activities and their decomposition products over time. Regarding grassland with a lower age due to lower vegetation cover, the root system is not yet developed, the BGB is still in a relatively low stage, and its input of organic matter into the soil is also relatively small. With the increase in pasture age, the root system of pasture plants is more developed, the residue of the dead root system is also increased, and the root system is often accompanied by the inter-root microorganisms, and the change in the root system will lead to the microbial community changing, which will affect the SOC content [41].
There was a significant interaction (p < 0.05) between the age of grassland and the soil depth, and the distribution characteristics of SOCs in different soil depths differed in pastureland with different ages. In general, the top soil layer is more susceptible to plant residue input and microbial decomposition, thus presenting a higher level of SOCs, and with the increase in age of grassland, the deeper soil layer is gradually affected by plant residue input and microbial decomposition, and the SOCs will also show an increasing trend [22]. Factors such as N fertilization, irrigation, and pasture species may have indirect effects on SOCs, which is basically in line with the results of some studies, i.e., these factors may affect the trend of SOC changes through indirect pathways [33,56,57,58]. Different plant types may affect the SOC content and distribution pattern due to their different root characteristics [59]; moderate N fertilizer can indirectly increase the SOC input by promoting plant growth, while reasonable irrigation can improve the soil moisture condition, which is conducive to the microbial activities, and thus affect the formation and decomposition of SOC [22,55], but there are also some recent studies showing that carbon sequestration by N deposition capacity decreases with a growing pasture age [60].

5. Conclusions

The BGB of the pastureland was regulated by the combination of pasture species, N fertilization, irrigation, and the pasture age. In the 0–60 cm soil depth, the rate of change in SOC content only showed a sensitive response to pasture age and soil depth, which was significantly correlated with BGB (p < 0.05), which implies that the pasture species and N fertilization and irrigation may indirectly affect the change in SOC content by influencing BGB.
Meanwhile, there were some interaction effects among pasture species, N fertilization, irrigation, pasture age, and soil depth, which jointly accomplished the regulation of SOC pool distribution in pastureland at both temporal and spatial scales. In this particular ecosystem, the selection of pasture species was more effective in regulating SOC accumulation than exogenous nutrient and water management strategies. The SOCs in the 0–10 cm layer of fallow land accumulated close to 32.85 Mg ha−1, and the average annual carbon stock accumulated 6.59 Mg ha−1 in 3–5 years of planting; compared with the SOCs in the traditional planting of wheat, maize, etc. (the average annual carbon stock accumulated 0.94 Mg ha−1 in 3–5 years of planting), the SOC accumulation rate of the planting pasture was higher; especially the planting of Medicago varia had a more significant positive effect on the accumulation of soil SOC. So, crop rotation is one of the most important ways to improve soil quality and enhance soil fertility, especially Medicago varia planting for 2 or 5 years, or Bromus inermis and Medicago varia mixed planting for 5 years, and the soil will be improved significantly.
The results are crucial for understanding and predicting soil health and the carbon cycle. Especially in production, for large areas of idle farmland, fallow land, forest gap land, and other land resources, crop and grass rotations can be employed to rapidly improve soil fertility, aligning with goals for comprehensive land use and production cycles, but the relevant research has yet to be carried out further. The results provide an important theoretical foundation and data support for understanding the pathways of SOC enhancement and the accumulation mechanisms in the northern agricultural–pastoral transition zones.

Author Contributions

Conceptualization, M.C. and L.X.; formal analysis, M.C., B.Y., Y.N. and J.W.; investigation, M.C., B.Y. and Y.N.; resources, L.X.; data curation, M.C., B.Y., Y.N. and J.W.; writing—original draft preparation, M.C.; writing—review and editing, M.C., L.X., B.Y., Y.N. and J.W.; supervision, L.X.; project administration, L.X.; funding acquisition, L.X. All authors have read and agreed to the published version of the manuscript.

Funding

This study was funded by the National Natural Science Foundation of China, grant number 22378422; the National Nonprofit Institute Research Grant of CAAS, grant number G2024-01-14; and China Agriculture Research System, grant number CARS-34.

Data Availability Statement

The data presented in this study are available on request from the corresponding author due to that the data are derived from long-term experiments and will be used in ongoing studies.

Conflicts of Interest

The authors declare no conflicts of interest.

References

  1. Bronick, C.J.; Lal, R. Soil Structure and Management: A Review. Geoderma 2005, 124, 3–22. [Google Scholar] [CrossRef]
  2. Lehmann, J.; Kleber, M. The Contentious Nature of Soil Organic Matter. Nature 2015, 528, 60–68. [Google Scholar] [CrossRef] [PubMed]
  3. Hoffland, E.; Kuyper, T.W.; Comans, R.N.J.; Creamer, R.E. Eco-functionality of Organic Matter in Soils. Plant Soil 2020, 455, 1–22. [Google Scholar] [CrossRef]
  4. Alkharabsheh, H.M.; Seleiman, M.F.; Battaglia, M.L.; Shami, A.; Jalal, R.S.; Alhammad, B.A.; Almutairi, K.F.; Al-Saif, A.M. Biochar and Its Broad Impacts in Soil Quality and Fertility, Nutrient Leaching and Crop Productivity: A Review. Agronomy 2021, 11, 993. [Google Scholar] [CrossRef]
  5. Lal, R. Soil Carbon Sequestration Impacts on Global Climate Change and Food Security. Science 2004, 304, 1623–1627. [Google Scholar] [CrossRef] [PubMed]
  6. Kiyas, A.A. The Effectiveness of Perennial Grass in Crop Rotation. Sci. J. Saken Seifullin Kazakh Agrotech. Univ. 2020, 3, 83–90. [Google Scholar]
  7. He, Y.J.; Bi, Y.X.; Yu, H.Q.; Zhang, Y.J.; Struik, P.C.; Jing, J.Y. Positive Legacy Effects of Grass-Legume Mixture Leys on Phosphorus Uptake and Yield of Maize Weakened over the Growing Season. Field Crops Res. 2024, 314, 109434. [Google Scholar] [CrossRef]
  8. Malisch, C.S.; Finn, J.A.; Eriksen, J.; Loges, R.; Brophy, C.; Huguenin-Elie, O. The Importance of Multi-Species Grassland Leys to Enhance Ecosystem Services in Crop Rotations. Grass Forage Sci. 2024, 79, 120–134. [Google Scholar] [CrossRef]
  9. Tan, G.; Liu, Y.J.; Peng, S.G.; Yin, H.Q.; Meng, D.L.; Tao, J.M.; Gu, Y.B.; Li, J.; Yang, S.; Xiao, N.W.; et al. Soil potentials to resist continuous cropping obstacle: Three field cases. Environ. Res. 2021, 200, 111319. [Google Scholar] [CrossRef] [PubMed]
  10. Ma, L.; Ma, S.Y.; Chen, G.P.; Lu, X.; Chai, Q.; Li, S. Mechanisms and Mitigation Strategies for the Occurrence of Continuous Cropping Obstacles of Legumes in China. Agronomy 2024, 14, 104. [Google Scholar] [CrossRef]
  11. Ivanov, A.; Ivanova, Z. Efficiency of Precision Fertilization System in Grain-Grass Crop Rotation. Agronomy 2022, 12, 1381. [Google Scholar] [CrossRef]
  12. Kostensalo, J.; Hyväluoma, J.; Jauhiainen, L.; Keskinen, R.; Nuutinen, V.; Peltonen-Sainio, P.; Heikkinen, J. Diversification of Crop Rotations and Soil Carbon Balance: Impact Assessment Based on National-Scale Monitoring Data. Carbon Manag. 2024, 15, 2298373. [Google Scholar] [CrossRef]
  13. Yan, Y.F.; Li, H.Y.; Zhang, M.; Liu, X.W.; Zhang, L.X.; Wang, Y.K.; Yang, M.; Cai, R.G. Straw Return or No Tillage? Comprehensive Meta-Analysis Based on Soil Organic Carbon Contents, Carbon Emissions, and Crop Yields in China. Agronomy 2024, 14, 2263. [Google Scholar] [CrossRef]
  14. Yang, Y.; Chen, X.L.; Liu, L.X.; Li, T.; Dou, Y.X.; Qian, J.B.; Wang, Y.Q.; An, S.S.; Chang, S.X. Nitrogen Fertilization Weakens the Linkage Between Soil Carbon and Microbial Diversity: A Global Meta-Analysis. Glob. Change Biol. 2022, 28, 6446–6461. [Google Scholar] [CrossRef] [PubMed]
  15. Li, C.X.; Wang, G.S.; Han, Q.S.; Sun, J.S.; Ning, H.F.; Feng, D. Soil Moisture and Water-Nitrogen Synergy Dominate the Change of Soil Carbon Stock in Farmland. Agric. Water Manag. 2023, 287, 108424. [Google Scholar] [CrossRef]
  16. Post, W.M.; Kwon, K.C. Soil Carbon Sequestration and Land-Use Change: Processes and Potential. Glob. Change Biol. 2000, 6, 317–327. [Google Scholar] [CrossRef]
  17. Yang, T.; Adams, J.M.; Shi, Y.; He, J.S.; Jing, X.; Chen, L.T.; Tedersoo, L.; Chu, H.Y. Soil Fungal Diversity in Natural Grasslands of the Tibetan Plateau: Associations with Plant Diversity and Productivity. New Phytol. 2017, 215, 756–765. [Google Scholar] [CrossRef] [PubMed]
  18. Zhao, Y.C.; Wang, M.Y.; Hu, S.J.; Zhang, X.D.; Zhu, O.Y.; Zhang, G.L.; Huang, B.; Zhao, S.W.; Wu, J.S.; Xie, D.T.; et al. Economics and Policy-Driven Organic Carbon Input Enhancement Dominates Soil Organic Carbon Accumulation in Chinese Croplands. Proc. Natl. Acad. Sci. USA 2018, 115, 4045–4050. [Google Scholar] [CrossRef] [PubMed]
  19. Maenhout, P.; Di Bene, C.; Cayuela, M.L.; Diaz-Pines, E.; Govednik, A.; Keuper, F.; Mavsar, S.; Mihelic, R.; O’Toole, A.; Schwarzmann, A.; et al. Trade-Offs and Synergies of Soil Carbon Sequestration: Addressing Knowledge Gaps Related to Soil Management Strategies. Eur. J. Soil Sci. 2024, 75, e13515. [Google Scholar] [CrossRef]
  20. Calone, R.; Fiore, A.; Pellis, G.; Cayuela, M.L.; Mongiano, G.; Lagomarsino, A.; Bregaglio, S. A Fuzzy Logic Evaluation of Synergies and Trade-Offs between Agricultural Production and Climate Change Mitigation. J. Clean. Prod. 2024, 442, 140878. [Google Scholar] [CrossRef]
  21. Condron, L.M.; Hopkins, D.W.; Gregorich, E.G.; Black, A.; Wakelin, S.A. Long-Term Irrigation Effects on Soil Organic Matter under Temperate Grazed Pasture. Eur. J. Soil Sci. 2014, 65, 741–750. [Google Scholar] [CrossRef]
  22. Parijat, S.P.S.; Baruah, K.K. Carbon Fixation, Partitioning and Storage in Field Planted with Wheat (Triticum Aestivum) at Different Moisture Regimes. Clim. Change Environ. Sustain. 2014, 2, 39–47. [Google Scholar]
  23. Bai, Y.F.; Cotrufo, M.F. Grassland Soil Carbon Sequestration: Current Understanding, Challenges, and Solutions. Science 2022, 377, 603–608. [Google Scholar] [CrossRef]
  24. Six, J.; Elliott, E.T.; Paustian, K.; Doran, J.W. Aggregation and Soil Organic Matter Accumulation in Cultivated and Native Grassland Soils. Soil Sci. Soc. Am. J. 1998, 62, 1367–1377. [Google Scholar] [CrossRef]
  25. Sabanci, C.O. Role and Management of Permanent Grasslands. In New Approaches for Grassland Research in a Context of Climate and Socio-Economic Changes; Options Mediterraneennes Serie A, Seminaires Mediterraneens; CIHEAM: Zaragoza, Spain, 2012; pp. 285–293. [Google Scholar]
  26. Balesdent, J.; Balabane, M. Major Contribution of Roots to Soil Carbon Storage Inferred from Maize Cultivated Soils. Soil Biol. Biochem. 1996, 28, 1261–1263. [Google Scholar] [CrossRef]
  27. Yuan, Z.Y.; Chen, H.Y.H. Decoupling of Nitrogen and Phosphorus in Terrestrial Plants Associated with Global Changes. Nat. Clim. Change 2015, 5, 465–469. [Google Scholar] [CrossRef]
  28. Zhang, T.A.; Chen, H.Y.H.; Ruan, H.H. Global Negative Effects of Nitrogen Deposition on Soil Microbes. ISME J. 2018, 12, 1817–1825. [Google Scholar] [CrossRef] [PubMed]
  29. Wang, C.; Lu, X.K.; Mori, T.; Mao, Q.G.; Zhou, K.J.; Zhou, G.Y.; Nie, Y.X.; Mo, J.M. Responses of Soil Microbial Community to Continuous Experimental Nitrogen Additions for 13 Years in a Nitrogen-Rich Tropical Forest. Soil Biol. Biochem. 2018, 121, 103–112. [Google Scholar] [CrossRef]
  30. Zhou, Z.H.; Wang, C.K.; Zheng, M.H.; Jiang, L.F.; Luo, Y.Q. Patterns and Mechanisms of Responses by Soil Microbial Communities to Nitrogen Addition. Soil Biol. Biochem. 2017, 115, 433–441. [Google Scholar] [CrossRef]
  31. Francioli, D.; Schulz, E.; Lentendu, G.; Wubet, T.; Buscot, F.; Reitz, T. Mineral vs. Organic Amendments: Microbial Community Structure, Activity and Abundance of Agriculturally Relevant Microbes Are Driven by Long-Term Fertilization Strategies. Front. Microbiol. 2016, 7, 1446. [Google Scholar] [CrossRef]
  32. Brockett, B.F.T.; Prescott, C.E.; Grayston, S.J. Soil Moisture is the Major Factor Influencing Microbial Community Structure and Enzyme Activities across Seven Biogeoclimatic Zones in Western Canada. Soil Biol. Biochem. 2012, 44, 9–20. [Google Scholar] [CrossRef]
  33. Emde, D.; Hannam, K.D.; Most, I.; Nelson, L.M.; Jones, M.D. Soil Organic Carbon in Irrigated Agricultural Systems: A Meta-Analysis. Glob. Change Biol. 2021, 27, 3898–3910. [Google Scholar] [CrossRef] [PubMed]
  34. Cox, C.; Jin, L.X.; Ganjegunte, G.; Borrok, D.; Lougheed, V.; Ma, L. Soil Quality Changes due to Flood Irrigation in Agricultural Fields Along the Rio Grande in Western Texas. Appl. Geochem. 2018, 90, 87–100. [Google Scholar] [CrossRef]
  35. Hakala, K.; Keskitalo, M.; Eriksson, C.; Pitkänen, T. Nutrient uptake and biomass accumulation for eleven different field crops. Agric. Food Sci. 2009, 18, 366–387. [Google Scholar] [CrossRef]
  36. Singh, K.A. Effect of Age, Cutting Interval, Nitrogen and Farmyard Manure on Root-Growth Parameters of Forages in an Acid Inceptisol. Indian J. Agric. Sci. 1996, 66, 38–44. [Google Scholar]
  37. Deng, L.; Wang, K.B.; Li, J.P.; Shangguan, Z.P.; Sweeney, S. Carbon Storage Dynamics in Alfalfa (Medicago sativa) Fields in the Hilly-Gully Region of the Loess Plateau, China. Clean-Soil Air Water 2014, 42, 1253–1262. [Google Scholar] [CrossRef]
  38. Hahn, C.; Lüscher, A.; Ernst-Hasler, S.; Suter, M.; Kahmen, A. Timing of Drought in the Growing Season and Strong Legacy Effects Determine the Annual Productivity of Temperate Grasses in a Changing Climate. Biogeosciences 2021, 18, 585–604. [Google Scholar] [CrossRef]
  39. Hassan, N.; Zhong, Z.W.; Wang, D.L.; Zhu, Y.; Naeen, I.; Ahungu, A.B.; Wan, H.Y.; Li, X.F. Effects of Long-Term Mowing on Species Diversity, Biomass and Composition of Plant Community in a Semi-Arid Grassland in Northeastern China. Appl. Veg. Sci. 2023, 26, e12743. [Google Scholar] [CrossRef]
  40. Bama, K.S.; Babu, C. Perennial Forages as a Tool for Sequestering Atmospheric Carbon by Best Management Practices for Better Soil Quality and Environmental Safety. Forage Res. 2016, 42, 149–157. [Google Scholar]
  41. Somenahally, A.; Mclawrence, J.; DuPont, J.I.; Brady, J.; Sarkar, R.; Rouquette, M. Root-Mycorrhizae Interactions Contributed to Organic Carbon Density in the Sandy Soil Profiles of Adapted Grazing Lands. Appl. Soil Ecol. 2020, 154, 103656. [Google Scholar] [CrossRef]
  42. Cinar, S.; Hatipoglu, R. Forage Yield and Botanical Composition of Mixtures of Some Perennial Warm Season Grasses with Alfalfa (Medicago sativa) Under Mediterranean Conditions. Turk. J. Field Crops 2014, 19, 13–18. [Google Scholar] [CrossRef]
  43. Dang, P.F.; Zhang, M.M.; Chen, X.L.; Loreau, M.; Duffy, J.E.; Li, X.E.; Wen, S.Y.; Han, X.Q.; Liao, L.C.; Huang, T.T.; et al. Plant Diversity Decreases Greenhouse Gas Emissions by Increasing Soil and Plant Carbon Storage in Terrestrial Ecosystems. Ecol. Lett. 2024, 27, e14469. [Google Scholar] [CrossRef] [PubMed]
  44. Dhakal, D.; Islam, M.A. Grass-Legume Mixtures for Improved Soil Health in Cultivated Agroecosystem. Sustainability 2018, 10, 2718. [Google Scholar] [CrossRef]
  45. Liu, Y.H.; Li, C.; Cai, G.; Sauheitl, L.; Xiao, M.L.; Shibistova, O.; Ge, T.D.; Guggenberger, G. Meta-Analysis on the Effects of Types and Levels of N, P and K Fertilization on Organic Carbon in Cropland Soils. Geoderma 2023, 437, 116580. [Google Scholar] [CrossRef]
  46. Xu, C.H.; Xu, X.; Ju, C.H.; Chen, H.Y.H.; Wilsey, B.J.; Luo, Y.Q.; Fan, W. Long-Term, Amplified Responses of Soil Organic Carbon to Nitrogen Addition Worldwide. Glob. Change Biol. 2021, 27, 1170–1180. [Google Scholar] [CrossRef] [PubMed]
  47. Novais, S.V.; Zenero, M.D.O.; Frade, E.F., Jr.; Novais, R.F. Changes in Organic Matter of an Oxisol with the Addition of Soybean and Corn Residues, Nitrogen and Phosphorus. Commun. Soil Sci. Plant Anal. 2018, 49, 1208–1217. [Google Scholar] [CrossRef]
  48. Ugarte, C.M.; Kwon, H.; Andrews, S.S.; Wander, M.M. A Meta-Analysis of Soil Organic Matter Response to Soil Management Practices: An Approach to Evaluate Conservation Indicators. J. Soil Water Conserv. 2014, 69, 422–430. [Google Scholar] [CrossRef]
  49. Zhang, K.P.; Li, Z.X.; Li, Y.F.; Wan, P.X.; Chai, N.; Li, M.; Wei, H.H.; Kuzyakov, Y.; Filimonenko, E.; Alharbi, S.A.; et al. Contrasting Impact of Plastic Film Mulching and Nitrogen Fertilization on Soil Organic Matter Turnover. Geoderma 2023, 440, 116714. [Google Scholar] [CrossRef]
  50. Cao, H.B.; Xie, J.Y.; Hong, J.; Wang, X.; Hu, W.; Hong, J.P. Organic Matter Fractions within Macroaggregates in Response to Long-Term Fertilization in Calcareous Soil after Reclamation. J. Integr. Agric. 2021, 20, 1636–1648. [Google Scholar] [CrossRef]
  51. Dullau, S.; Kirmer, A.; Tischew, S.; Holz, F.; Meyer, M.H.; Schmidt, A. Effects of Fertilizer Levels and Drought Conditions on Species Assembly and Biomass Production in the Restoration of A Mesic Temperate Grassland on Ex-Arable Land. Glob. Ecol. Conserv. 2023, 48, e02730. [Google Scholar] [CrossRef]
  52. van der Wal, A.; Geydan, T.D.; Kuyper, T.W.; de Boer, W. A Thready Affair: Linking Fungal Diversity and Community Dynamics to Terrestrial Decomposition Processes. FEMS Microbiol. Rev. 2013, 37, 477–494. [Google Scholar] [CrossRef] [PubMed]
  53. Schimel, J.; Schaeffer, S. Microbial Control over Carbon Cycling in Soil. Front. Microbiol. 2012, 3, 348. [Google Scholar] [CrossRef] [PubMed]
  54. Domeignoz-Horta, L.A.; Pold, G.; Liu, X.J.A.; Frey, S.D.; Melillo, J.M.; DeAngelis, K.M. Microbial Diversity Drives Carbon Use Efficiency in a Model Soil. Nat. Commun. 2020, 11, 3684. [Google Scholar] [CrossRef] [PubMed]
  55. Ma, L.; Jiang, X.; Liu, G.; Yao, L.G.; Liu, W.Z.; Pan, Y.T.; Zuo, Y.X. Environmental Factors and Microbial Diversity and Abundance Jointly Regulate Soil Nitrogen and Carbon Biogeochemical Processes in Tibetan Wetlands. Environ. Sci. Technol. 2020, 54, 3267–3277. [Google Scholar] [CrossRef]
  56. Qiu, Q.Y.; Wu, L.F.; Ouyang, Z.; Li, B.B.; Xu, Y.Y. Different Effects of Plant-Derived Dissolved Organic Matter (DOM) and Urea on the Priming of Soil Organic Carbon. Environ. Sci. Process. Impacts 2016, 18, 330–341. [Google Scholar] [CrossRef]
  57. Dijkstra, F.A.; Zhu, B.; Cheng, W.X. Root Effects on Soil Organic Carbon: A Double-Edged Sword. New Phytol. 2021, 230, 60–65. [Google Scholar] [CrossRef] [PubMed]
  58. Luo, L.; Yu, J.L.; Zhu, L.Y.; Gikas, P.; He, Y.; Xiao, Y.L.; Deng, S.H.; Zhang, Y.Z.; Zhang, S.R.; Zhou, W.; et al. Nitrogen Addition may Promote Soil Organic Carbon Storage and CO2 Emission but Reduce Dissolved Organic Carbon in Zoige Peatland. J. Environ. Manag. 2022, 324, 116376. [Google Scholar] [CrossRef]
  59. Tripolskaja, L.; Toleikiene, M.; Skersiene, A.; Versuliene, A. Biomass of Shoots and Roots of Multicomponent Grasslands and Their Impact on Soil Carbon Accumulation in Arenosol Rich in Stones. Land 2024, 13, 1098. [Google Scholar] [CrossRef]
  60. Liu, M.X.; Shang, F.; Lu, X.J.; Huang, X.; Song, Y.; Liu, B.; Zhang, Q.; Liu, X.J.; Cao, J.J.; Xu, T.T.; et al. Unexpected Response of Nitrogen Deposition to Nitrogen Oxide Controls and Implications for Land Carbon Sink. Nat. Commun. 2022, 13, 3126. [Google Scholar] [CrossRef] [PubMed]
Figure 1. Annual average temperature and annual total precipitation of 2016–2021.
Agronomy 15 00399 g001
Figure 2. Changes in below-ground biomass of different pastures under different ages. Note: 1, 2, 3, 4, and 5 indicate the ages of pastureland, respectively. Different lowercase letters (a, b, c) indicate that there is a significant difference in BGB between different pasture treatments under the same age (p < 0.05).
Agronomy 15 00399 g002
Figure 3. Change rate of soil organic carbon in pastureland with different pasture ages under different pasture–nitrogen–water treatments. Note: 1, 2, 3, 4, and 5 indicate ages of grasses; 0–10 cm, 10–20 cm, 20–40 cm, and 40–60 cm indicate 0–10 cm soil layer, 10–20 cm soil layer, 20–40 cm soil layer, and 40–60 cm soil layer, respectively.
Agronomy 15 00399 g003
Figure 4. Changes in soil organic carbon storage in pastureland with different ages under different pasture–nitrogen–water treatments. Note: Figure 2, Figure 3, Figure 4 and Figure 5 indicate that the pasture ages are 2–5. Different uppercase letters (A, B, C…) indicate that the SOCs of the same treatment in the same soil layer have a significant difference at different ages, and different lowercase letters (a, b, c…) indicate that the SOCs of the same pasture in the same soil layer have a significant difference in different treatments at the same age (p < 0.05). (i) represents the data of monocultured Bromus inermis treatments; (ii) represents the data of monocultured Medicago varia treatments; (iii) represents the data of mixed sowing treatments.
Agronomy 15 00399 g004
Table 1. Treatments’ Acronyms.
FactorsAcronymsTreatments Represented
Pasture speciesBMonocultured Bromus inermis
MMonocultured Medicago varia
BMBromus inermis and Medicago varia mixed sowing (1:1)
Nitrogen additionHHigh nitrogen (150 kg N hm−2 y−1)
LLow nitrogen (75 kg N hm−2 y−1)
ZCK (0 kg N hm−2 y−1)
Water additionYDry-season supplementation
NNo supplementation
Table 2. The basic physical and chemical properties of the soil of the pastureland in 2016.
Soil
Layers
SOC
(g kg−1)
TN
(g kg−1)
TP
(g kg−1)
TK
(g kg−1)
AHN
(mg kg−1)
AP
(mg kg−1)
AK
(mg kg−1)
pH
0–10 cm13.622.200.5225.76207.0416.25315.966.77
10–20 cm13.342.190.4925.59219.8811.95249.496.79
20–40 cm10.231.700.4224.49161.258.89192.367.34
40–60 cm5.081.020.3523.59104.787.68148.777.94
Note: TN stands for Total Nitrogen, TP stands for Total Phosphorus, TK stands for Total Potassium, AHN stands for Alkali-Hydrolyzed Nitrogen, AP stands for Available Phosphorus, AK stands for Available Potassium.
Table 3. Interaction effect of below-ground biomass influencing factors in pastureland.
FactorsF (BGB)
Pasture58.596 ***
Nitrogen6.834 **
Water3.975 *
Age29.939 ***
Pasture × Nitrogen3.924 **
Pasture × Water2.023
Pasture × Age5.597 ***
Nitrogen × Water0.256
Nitrogen × Age1.76
Water × Age0.304
Pasture × Nitrogen × Water1.029
Pasture × Nitrogen × Age0.524
Pasture × Water × Age0.71
Nitrogen × Water × Age0.763
Pasture × Nitrogen × Water × Age0.801
Note: * denotes p < 0.05, ** denotes p < 0.01, and *** denotes p < 0.001.
Table 4. Interaction effect of soil organic carbon influencing factors in pastureland.
FactorsF (ΔSOC%)F (SOCs)
Pasture0.4692.06
Nitrogen2.4781.00
Water0.7460.10
Age45.185 ***222.26 ***
Soil Depth27.014 ***1.07
Pasture × Nitrogen2.921 *1.31
Pasture × Water0.0021.12
Pasture × Age0.8990.26
Pasture × Soil Depth1.3710.16
Nitrogen × Water0.1150.39
Nitrogen × Age1.7170.24
Nitrogen × Soil Depth0.760.10
Water × Age0.8251.71
Water × Soil Depth0.0240.62
Age × Soil Depth6.449 ***9.40 ***
Pasture × Nitrogen × Water2.31.19
Pasture × Nitrogen × Age1.1590.34
Pasture × Nitrogen × Soil Depth2.246 **0.54
Pasture × Water × Age0.5840.44
Pasture × Water × Soil Depth0.5640.41
Pasture × Age × Soil Depth0.5220.66
Nitrogen × Water × Age1.620.44
Nitrogen × Water × Soil Depth3.182 **0.32
Nitrogen × Age × Soil Depth0.480.39
Water × Age × Soil Depth0.3630.21
Pasture × Nitrogen × Water × Age0.4730.58
Pasture × Nitrogen × Water × Soil Depth2.284 **0.05
Pasture × Nitrogen × Age × Soil Depth0.5840.31
Pasture × Water × Age × Soil Depth0.4260.51
Nitrogen × Water × Age × Soil Depth0.1930.54
Pasture × Nitrogen × Water × Age × Soil Depth0.6190.46
Note: * denotes p < 0.05, ** denotes p < 0.01, and *** denotes p < 0.001.
Disclaimer/Publisher’s Note: The statements, opinions and data contained in all publications are solely those of the individual author(s) and contributor(s) and not of MDPI and/or the editor(s). MDPI and/or the editor(s) disclaim responsibility for any injury to people or property resulting from any ideas, methods, instructions or products referred to in the content.

