Article

Effect of Fungicide Application in Combination with Different Growth Regulators on Cotton Boll Quality and Yield in the Northwest Inland of China

1
College of Agronomy, Xinjiang Agricultural University, Ürümqi 830052, China
2
College of Plant Science & Technology, Huazhong Agricultural University, Wuhan 430070, China
*
Authors to whom correspondence should be addressed.
Agronomy 2025, 15(2), 394; https://doi.org/10.3390/agronomy15020394
Submission received: 7 January 2025 / Revised: 23 January 2025 / Accepted: 30 January 2025 / Published: 31 January 2025
(This article belongs to the Special Issue Innovations in Green and Efficient Cotton Cultivation)

Abstract

:
Cotton yield can be stabilized by regulating the number and weight of bolls through the application of growth regulators. A field experiment was conducted in Xiaya, Xinjiang, from 2021 to 2023. The primary treatment involved a 40% pyraclostrobin suspension (300 mL/ha) combined with different growth regulators: 14-hydroxylated brassinosteroid (150 mL/ha, M1), 0.1% thidiazuron (150 mL/ha, M2), or 8% diethyl aminoethyl hexanoate (150 g/ha, M3). Clear water (M0) was used as the control treatment. This study examined the interaction between year and treatment and analyzed key factors affecting cotton yield. The results indicated a significant interaction effect between chemical treatments and yield across the years. All treatments led to an increase in yield compared with the control, with notable improvements in the number of bolls per unit area, boll weight, leaf area index, and net photosynthesis rate of cotton leaves. From a spatial perspective, the treatments effectively enhanced the number of bolls in the upper part of the plant. A positive correlation was observed between the number of new bolls and seed cotton yield. Among the treatments, the M2 treatment proved to be the most effective, which substantially increased the number of bolls in the upper part of the plant, as well as the total number of bolls per unit area and boll weight, resulting in a significant yield improvement. These findings can guide the development of chemical regulation strategies for cotton production in the Aksu region of Xinjiang, China, providing a valuable reference for enhancing local cotton yield.

1. Introduction

Cotton is a vital economic and fiber crop in China, characterized by its preference for warm temperatures and abundant light, and its indeterminate growth habit. Among the cotton-producing regions in China, Xinjiang stands out due to its favorable meteorological conditions, including dry air, minimal cloud cover, frequent sunny days, and abundant sunshine. These factors promote the growth of high-quality cotton fibers, significantly reduce the incidence of rotten bolls, and enhance overall yield [1]. Thus, Xinjiang has become a critical cotton production base, with its production levels improving rapidly in recent years. However, challenges remain, as excessive cotton growth with an insufficient nutrient supply can lead to flower and boll loss, fewer bolls, and reduced boll weight, ultimately lowering yields [2,3]. To address these problems and further enhance cotton yields, the use of growth regulators is deemed essential. Establishing a high-quality cotton population with high reproductive transformation capacity is crucial for achieving high yields [4].
Thidiazuron can effectively enhance the fruit-setting rate, increase leaf SPAD values, boost photosynthetic intensity, and prolong photosynthesis duration, ultimately leading to increased crop yields [1,5,6]. Similarly, brassinolide promotes photosynthetic efficiency and nutrient accumulation in crops, contributing to an increased number of fruits [7,8]. Aminoethoxyvinylglycine reduces corn lodging rates, enhances fruit setting, increases grain weight, and improves overall crop yields [9,10]. These three growth regulators have been widely studied for their effects on agricultural production. In addition, pyraclostrobin (MC)—a novel fungicide with both preventive and curative properties—is extensively used to control fungal diseases in crops, such as rice blast disease, rice false smut, and root rot in rice [4]. Beyond disease control, pyraclostrobin has been proven to be beneficial for crop production, due to its promoting effects on plant health, cotton seed productivity, and overall crop yield. When combined with other growth regulators, pyraclostrobin exerts a synergistic effect, rather than interacting antagonistically, further improving crop outcomes [11]. Previous studies have demonstrated that the combination of soluble brassinolide and pyraclostrobin significantly enhances both nutritional and reproductive growth in cotton. This combination could increase the development rate, linting rate, plant height, fruiting node number, boll number, and linted boll number in cotton [12]. It has also been reported to enhance wheat canopy quality and leaf area index (LAI), leading to higher yields [8,13].
However, most studies have focused on the independent effects of growth regulators such as thidiazuron, brassinolide, and diethyl aminoethyl hexanoate, and limited studies have investigated the synergistic effects of pyraclostrobin in combination with other growth regulators, leaving its full potential untapped. This study addresses this gap by evaluating the effects of pyraclostrobin in combination with 14-hydroxylated brassinosteroid, thidiazuron, and diethyl aminoethyl hexanoate on cotton production in Xinjiang.
Specifically, this study examined the ability of these growth regulators to increase boll weight, reduce boll shedding and sterile bracts, improve the fruit set rate of upper branches, optimize the canopy structure, and enhance leaf photosynthesis characteristics. Through providing both protection and treatment, these approaches can improve crop yield and quality, offering technical support for cotton production in Xinjiang.

2. Materials and Methods

The experiment was conducted in a region located in the climatic zone at the edge of the warm temperate region that is characterized by abundant sunshine, low precipitation, and significant diurnal temperature variation. The period from sowing to harvest was marked by high daily maximum temperatures and minimal rainfall. Meteorological data for this study were provided by the agrometeorological bureau of the county where the experimental site was situated. Site layout and observation elements were set up with reference to the standards of international organizations, such as the World Meteorological Organization (WMO) (Figure 1). The cotton variety tested was Xinluzhong 84, with cotton Tahe2 as the previous crop at the site. Xinluzhong 84 is an early- and medium-mature variety with strong resistance to collapse, making it suitable for mechanical harvesting. We used a 40% pyraclostrobin suspension (Jiangxi Zhongxun Agrochemical Co., Nanchang, China, Gang Li), in combination with 0.01% 14-hydroxylated brassinosteroid (Chengdu Guanzhi Agricultural Technology Co., Chengdu, China, Pei Tian), 0.1% thidiazuron (Jiangsu WoYuTai Chemical Co., China, QianqianXing), and 8% diethyl aminoethyl hexanoate (Sichuan RUNR Science and Technology Co., Chengdu, China, Xiaoqiang Wang).

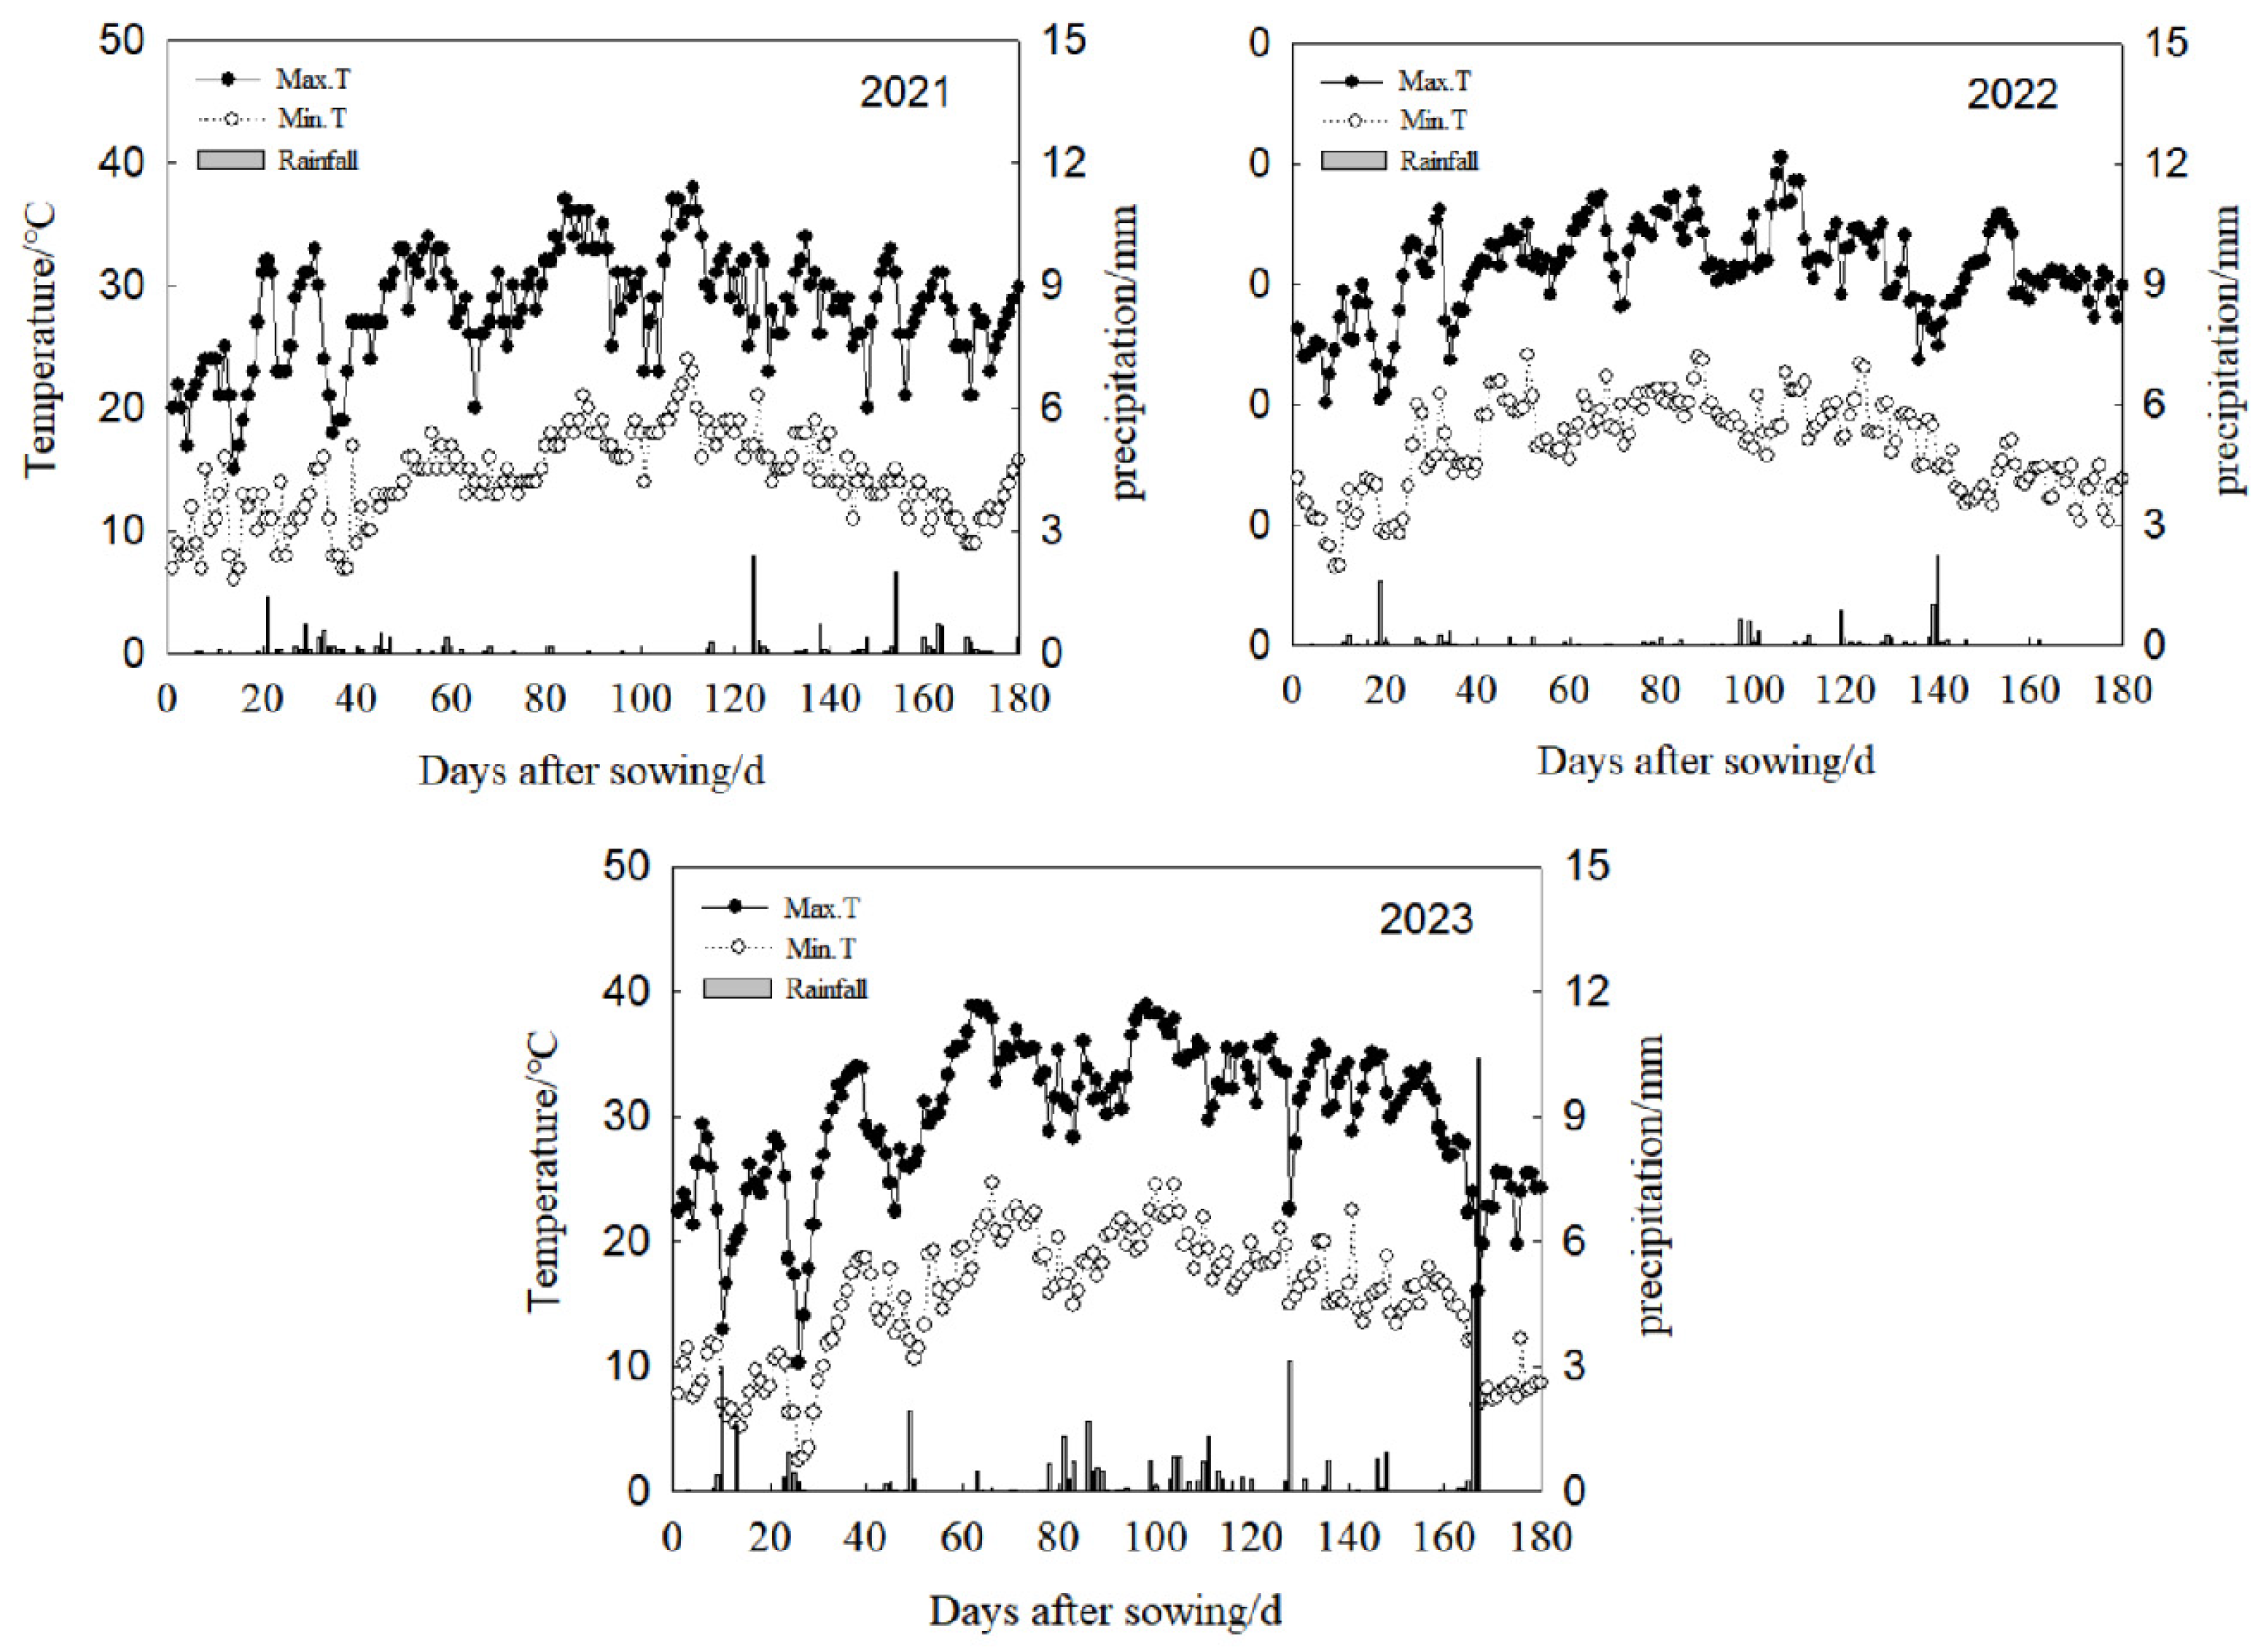
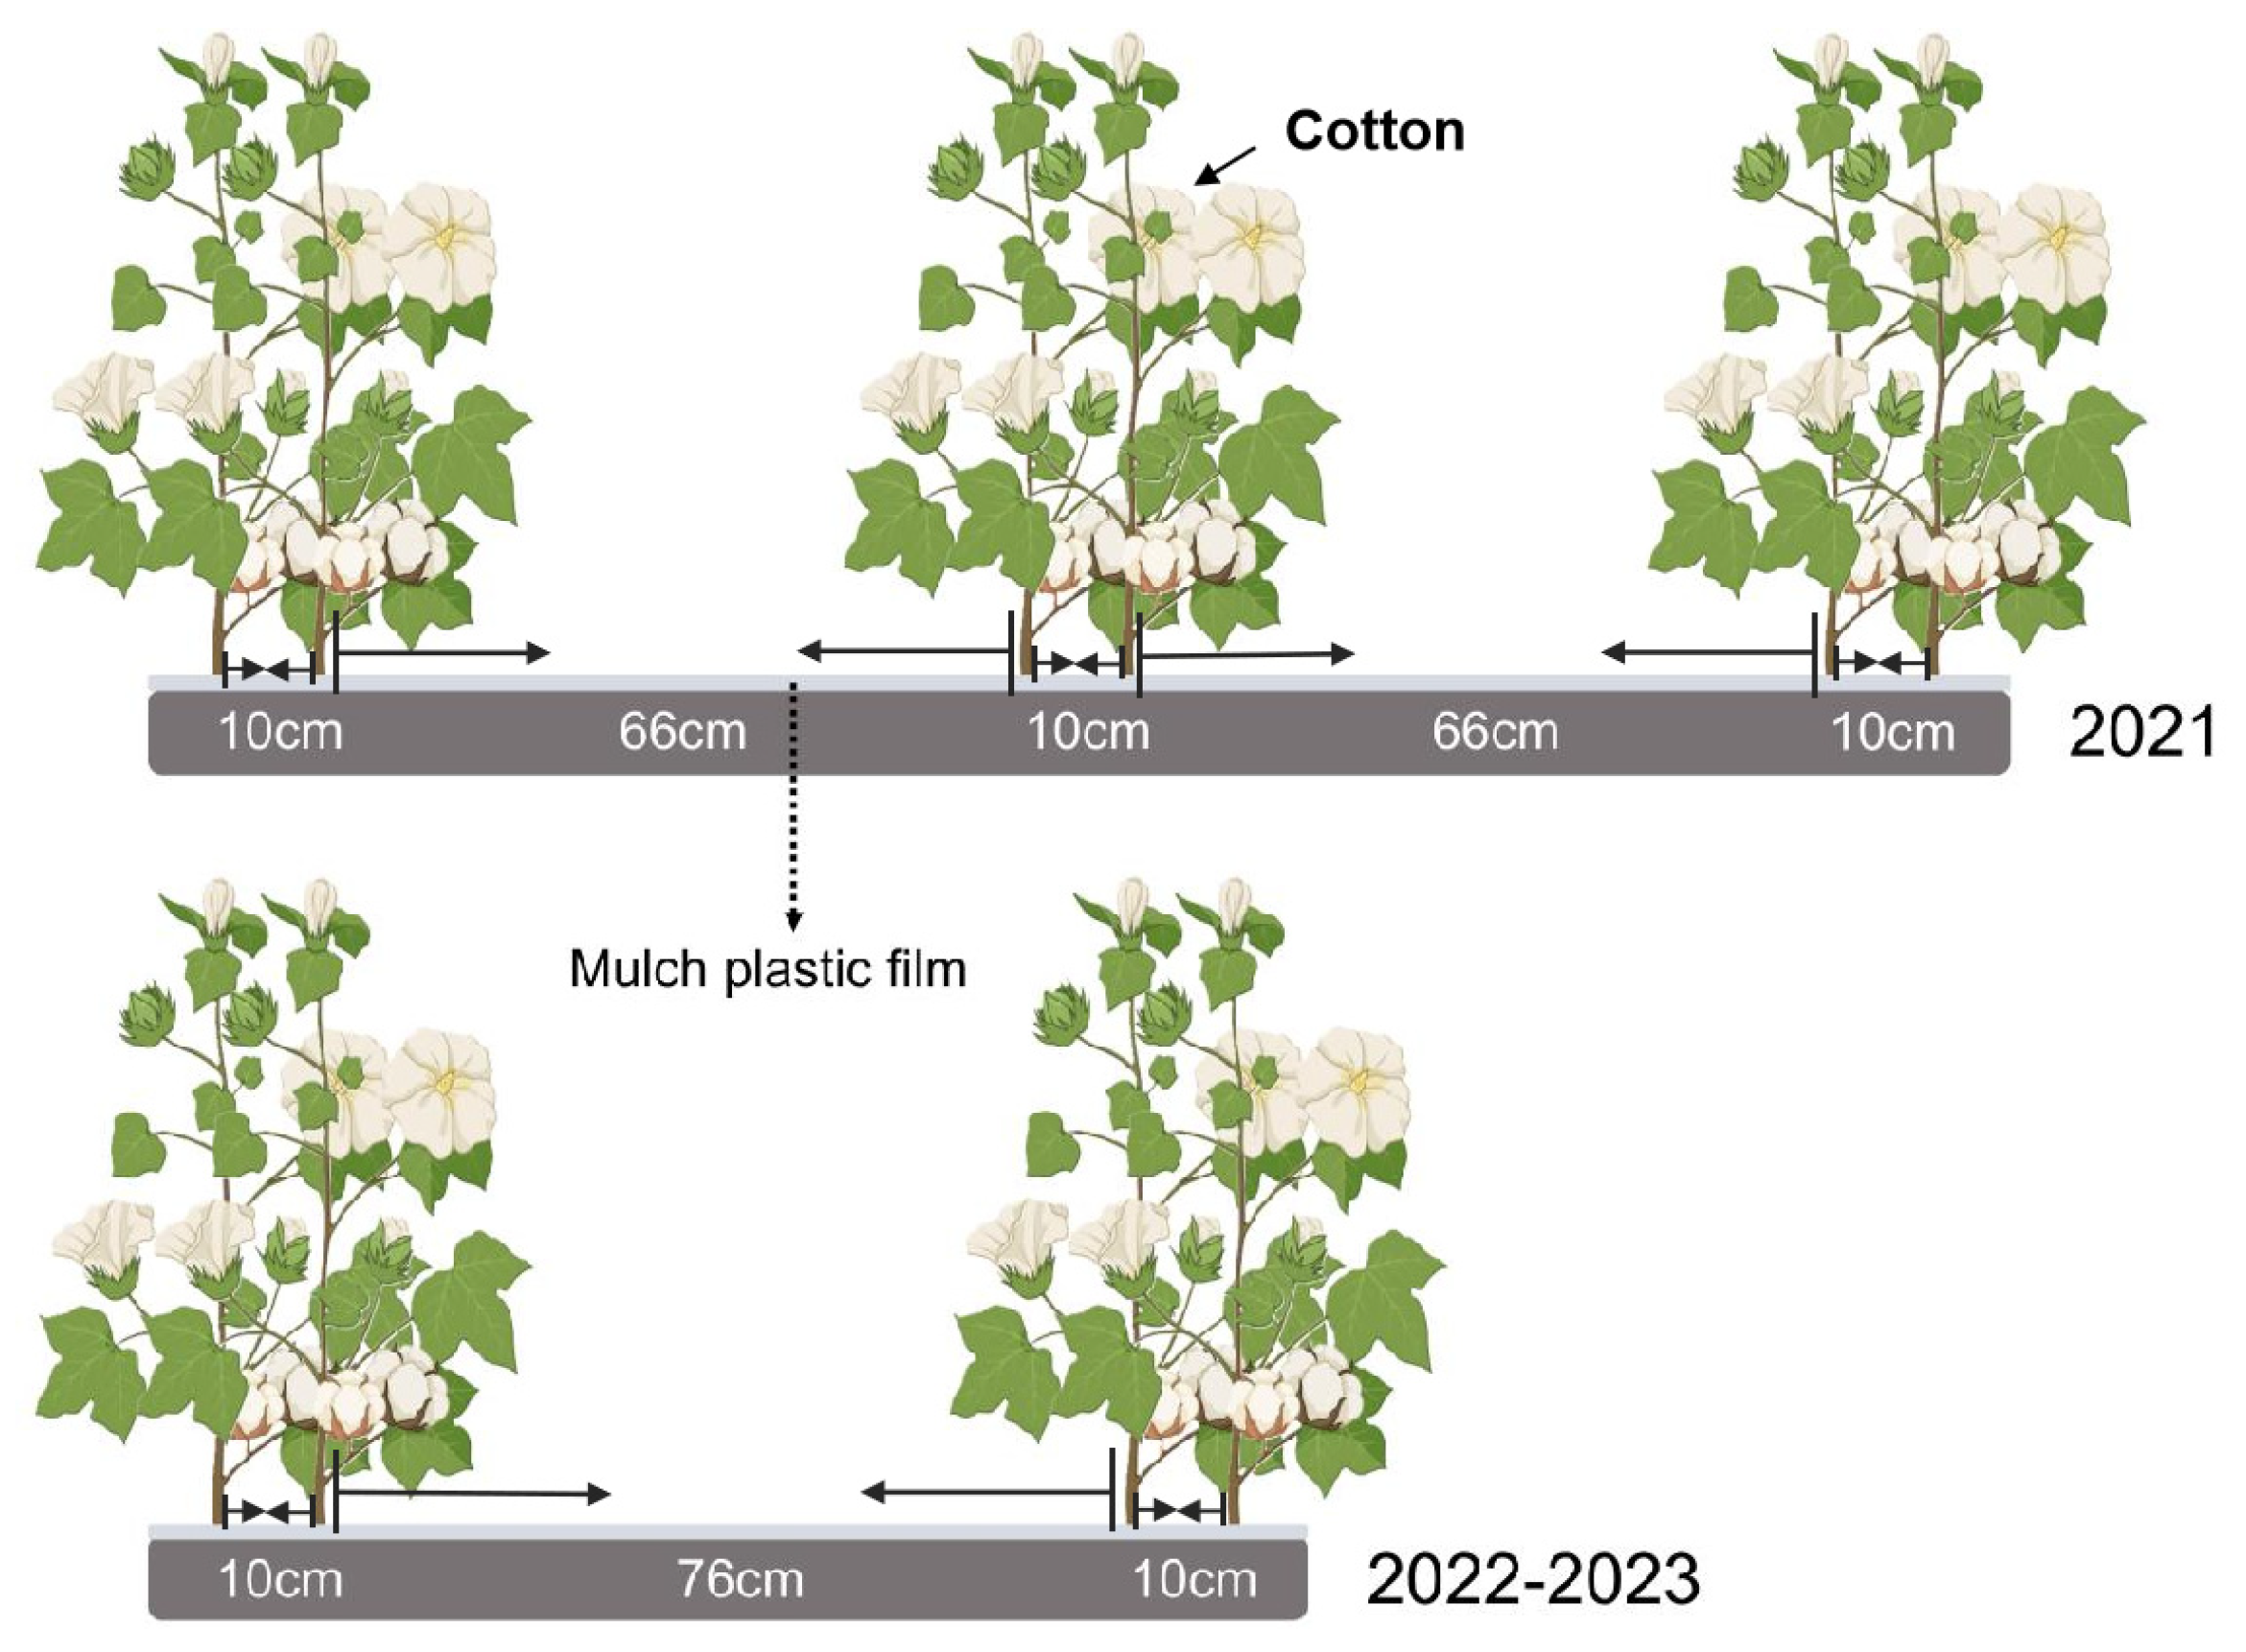
2.1. Experimental Design and Field Management

The field experiment employed two planting patterns: in 2021, one membrane had six rows, while in 2022–2023, one membrane had four rows. The plant distance was 10 cm (Figure 2). The 40% pyraclostrobin suspension (300 mL/ha) was combined with 0.01% 14-hydroxylated brassinosteroid, 0.1% thidiazuron soluble powder, and 8% diethyl aminoethyl hexanoate soluble powder (at dosages of 150 mL/ha or g/ha) to design the M1, M2, and M3 treatments, respectively. Water was used as the control (M0). The mixtures were applied using a manual sprayer, targeting the underside of the cotton leaves. Spraying was conducted twice during the growth period, first on July 5 during the topping stage (flowering stage), and then on July 12 during the re-control period (boll development stage). All other agricultural practices followed local cotton planting regulations. The experiment was arranged in a randomized complete block design with three replicates for each treatment.

2.2. Data Collection

2.2.1. Cotton Production and Yield Components

The determinants of cotton yield include plant number, boll number per plant, boll weight, and coat percentage. During the boll-setting period, sampling sites measuring 6.67 m² were selected within each plot in order to assess the total number of plants and bolls. These data were used to calculate the planting density and the average number of bolls per plant, as well as to estimate yield. Subsequently, 100 bolls were collected from different parts of plants in each plot as follows: 30 from the upper part, 40 from the middle part, and 30 from the lower part of the plants. These bolls were air-dried to measure the single-boll weight, 100-boll weight, and fiber fraction. A 15–20 g cotton sample was sent to the testing center to evaluate fiber quality parameters, including fiber uniformity, breaking strength, upper-half fiber length, and the Micronaire value.

2.2.2. Agronomic Traits Agronomic Traits Determination Indicators

Before the applications, 15 plants were consecutively marked in the center of each plot. One day prior to spraying, the growing point of each plant was marked with a red rope. In later stages, the nascent parts above the red rope were recorded. Bolls with a diameter greater than 2 cm that had not yet opened were documented, and the boll retention rate was calculated using the following formula: boll retention rate = boll number/total fruit node number. In addition, the first fruit node of the seventh fruit branch of 15 randomly selected cotton plants was assessed. Measurements included boll weight (combined weight of the boll shell and cotton fiber), boll diameter (measured at the longest position using a Vernier caliper), and boll volume (determined using the water displacement method).

2.2.3. Population Canopy Structure and Photosynthetic Characteristics

The leaf area index (LAI) in each part was determined using an LAI-2200C Plant Canopy Analyzer (LI-COR, Lincoln, NE, USA). On a sunny day between 11:30 and 13:30, the instrument probe was placed in the middle ground of the cotton row, kept horizontal, and three values were measured in each horizontal direction (i.e., middle row, edge row, bare row), from which the average was calculated. Vertical measurements in three parts were also recorded: the lower part (20–40 cm), the middle part (40–60 cm), and the upper part (above 60 cm). An SPAD-502 Plus chlorophyll meter (Konica Minolta, Tokyo, Japan) was used to determine the relative chlorophyll content (SPAD values) in the functional leaves (inverted trinomial mesophyll) of five cotton plants presenting uniform growth in each plot. The SPAD values were determined at five different locations of the leaf blade between the leaf margin and the midrib and lateral veins, and the average of values recorded at these locations was taken as the final SPAD value of the sample leaf. The net photosynthetic rate (Pn) of the marked functional leaves was measured using an LI-6400 portable photosynthesis meter (Ligaotai, Technology Co., Ltd. Beijing, China) between 11:00 and 13:30 on sunny days. Whether waiting for the measurement or during the measurement process, attention was paid to keeping the marked leaves exposed to direct sunlight while avoiding leaf veins.

2.3. Statistical Analysis

Experimental data were compiled using Microsoft Excel 2021 (Microsoft Corp., Redmond, WA, USA) and analyzed with SPSS 26.0 (version 26.0; SPSS Inc., Chicago, IL, USA). An analysis of variance was performed to evaluate the interaction effects of year and treatment on yield and yield component data. Pearson’s correlation analysis was conducted to examine the relationships between the number of newly formed bolls and seed cotton yield, as well as between cotton boll morphological indices and seed cotton yield. Figures illustrating the inner and outer bolls; upper, middle, and lower bolls; LAI; canopy openness; SPAD values; and Pn were created using Microsoft Excel 2021 and SigmaPlot 12.5 (Aspire Software Internationa l32-bit version).

3. Results

3.1. Yield and Yield Components

From 2021 to 2023, the yield and yield components under all treatments were significantly higher than those for the control group. The M2 treatment demonstrated the highest performance, with a significantly greater boll number per unit area, boll weight, and seed cotton yield, when compared with the other treatments. Both year (reflecting planting patterns and climatic conditions) and treatment significantly affected seed cotton yield during the 3-year period. In addition, the interaction between year and treatment significantly affected the boll number per unit area, boll weight, seed cotton yield, and lint percentage. Under the same planting pattern, the boll number, boll weight, and seed cotton yield per unit area in 2022 were lower than those in 2023. This difference was attributed to the adverse effects of high temperatures during the critical period of 20–25 days after application in 2022, when temperatures exceeded 40 °C, thus hindering cotton growth (Figure 1 and Table 1).

3.2. Agronomic Traits

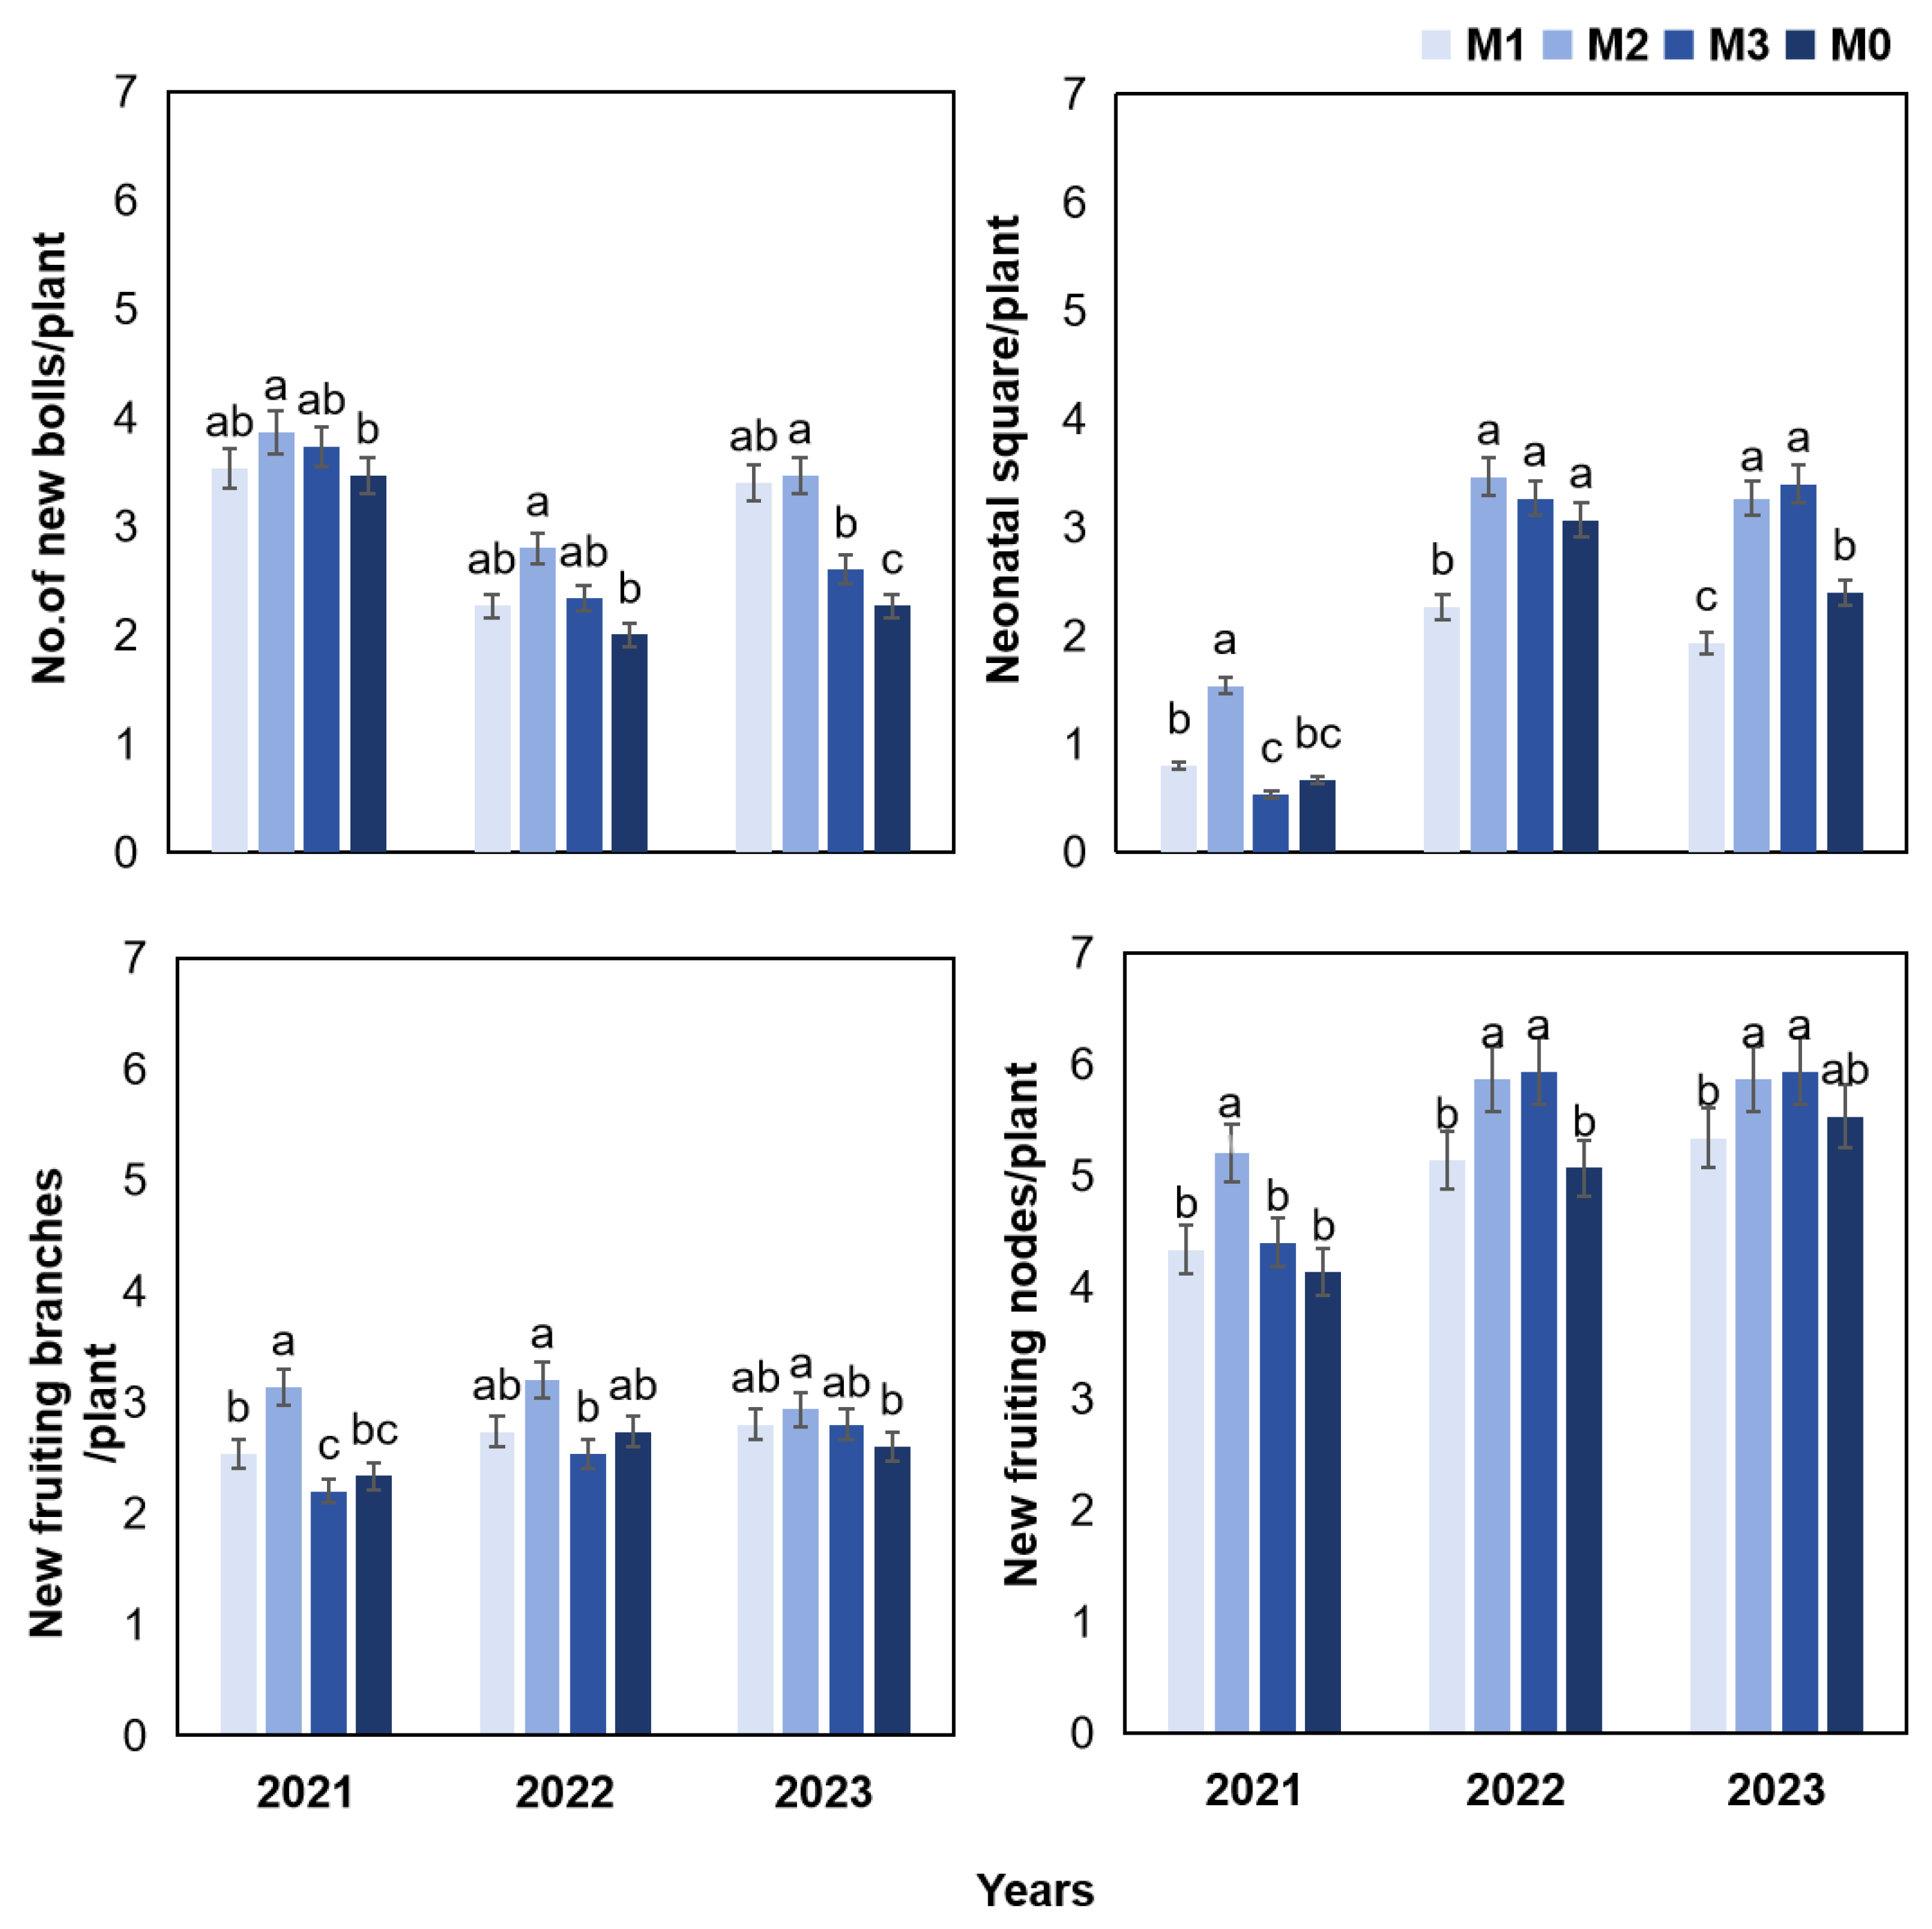
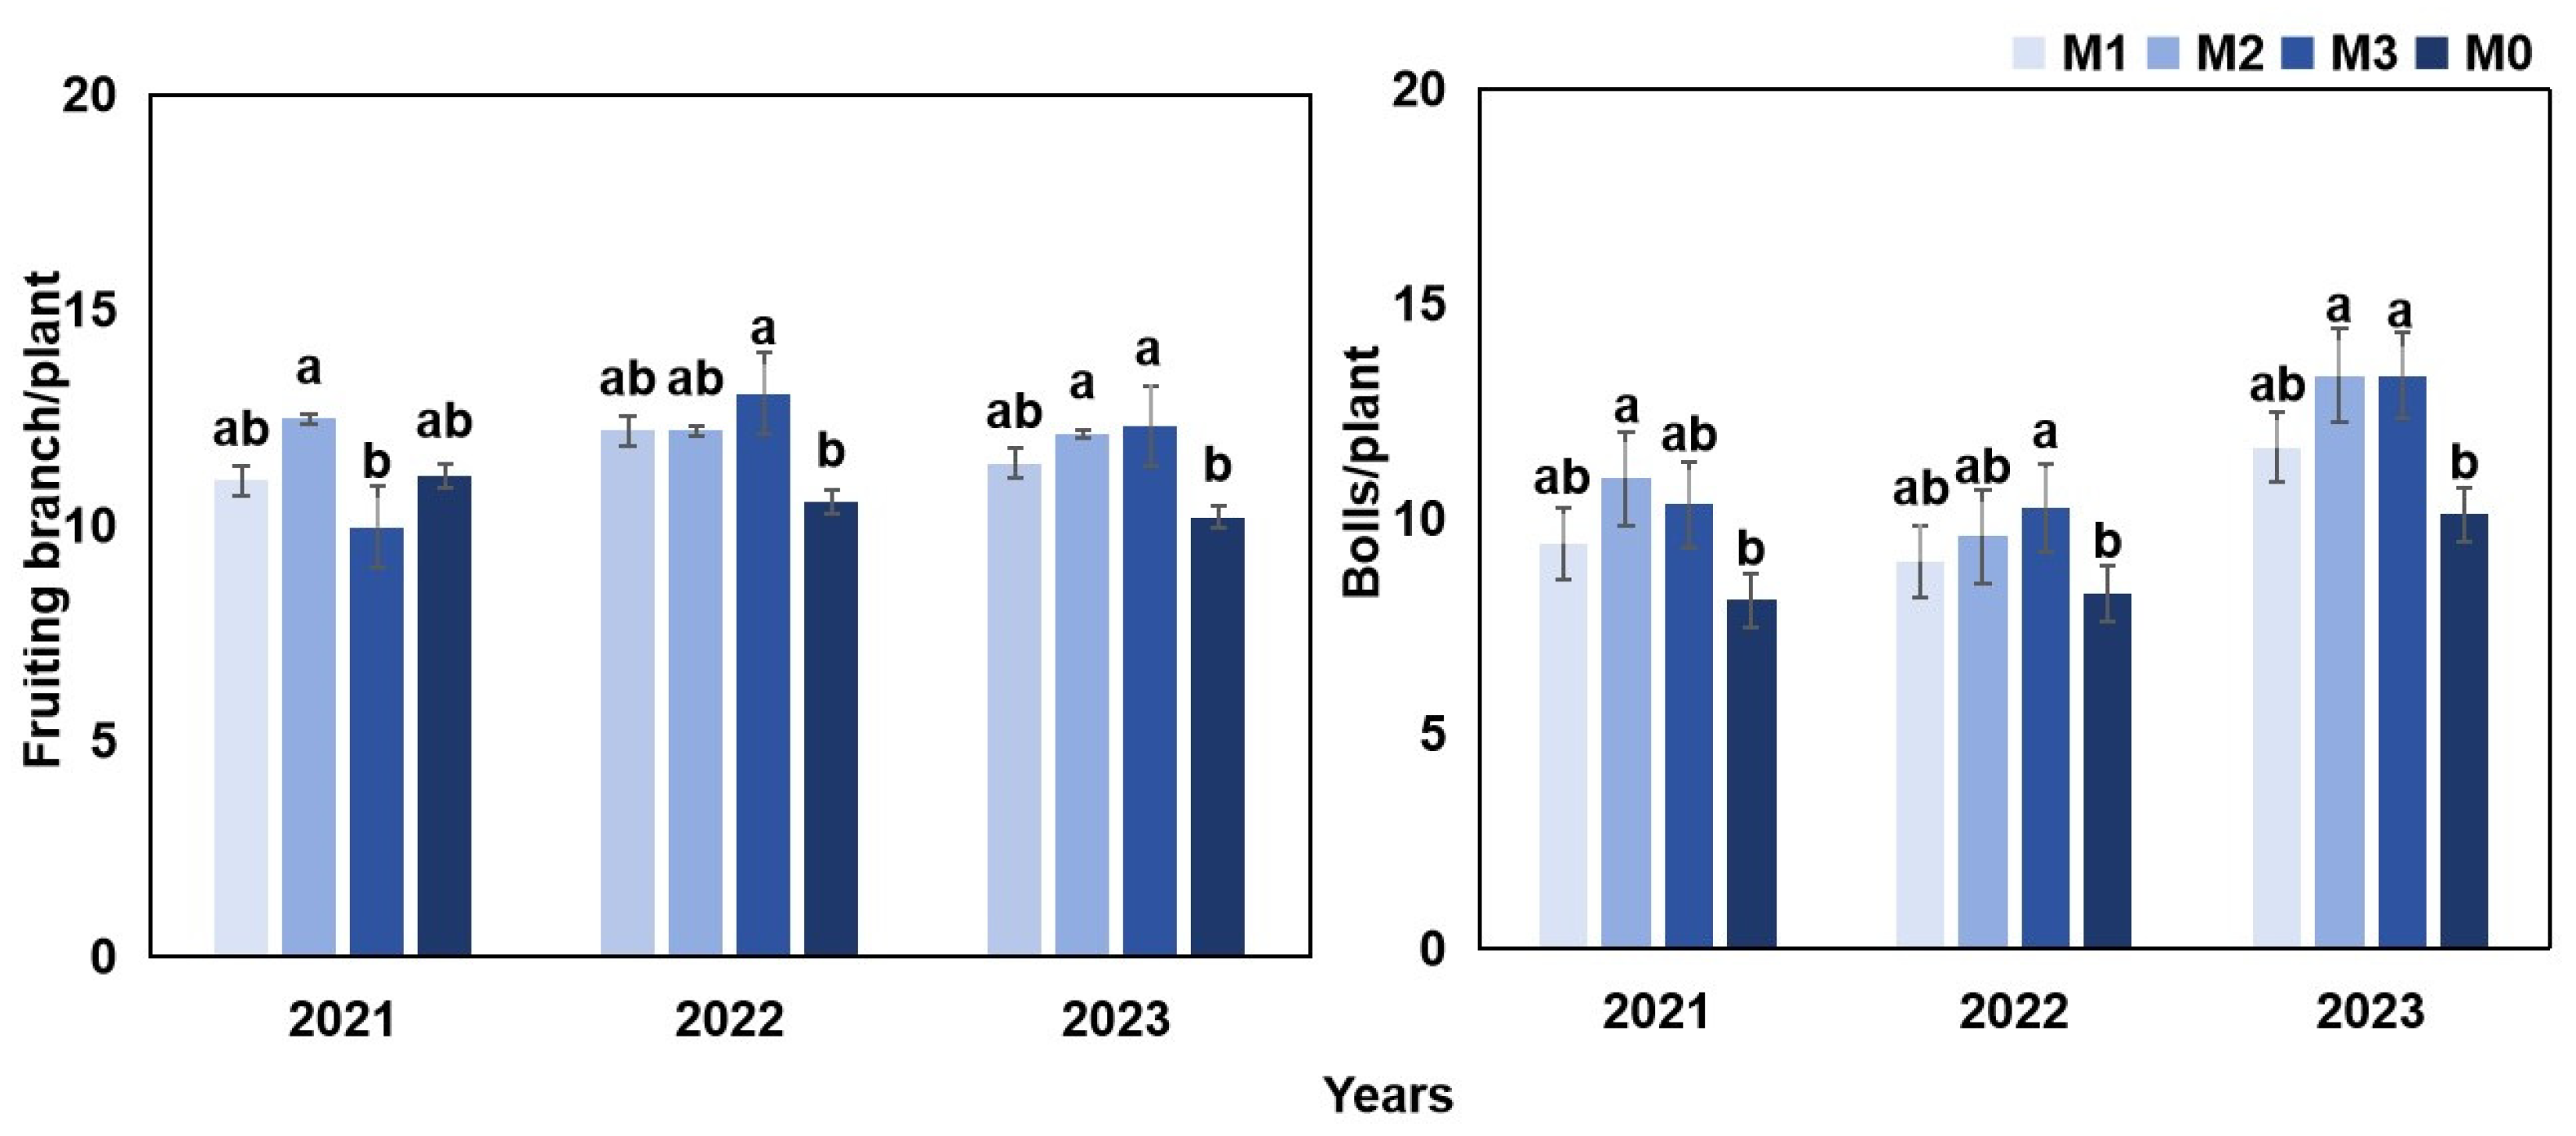
3.2.1. Effect of Combination Treatments on the New Parts

Following each treatment, varying degrees of growth were observed in the number of new bolls, neonatal buds, new fruiting joints, and new fruiting branches, with similar trends noted from 2021 to 2023. With the one-film, two-row planting mode, the neonatal buds, new fruiting branches, and new fruiting nodes in cotton plants were significantly higher than those under the one-film, three-row planting mode. In 2021, compared with the M0 treatment, the M2 treatment significantly increased the number of new fruiting branches and new bolls by 34.33% and 12.13%, respectively. Similarly, in 2022, the M2 treatment resulted in significant increases in new fruiting branches (by 36.08%) and new bolls (by 40%) when compared with the M0 treatment. No significant differences were observed between the M1 and M3 treatments (Figure 3). Through observation and analysis of the field schematic diagram, it can be clearly observed that there were significant differences in the top cotton bolls among the treatments. Specifically, the numbers of top cotton bolls under the M2 and M3 treatments were significantly higher than those under the M0 treatment; these cotton bolls were not only more numerous but also larger and fuller in size. The M2 treatment had the most pronounced effect on the growth of new bolls, which underscores its effectiveness in promoting the development of new cotton bolls (Figure 4).

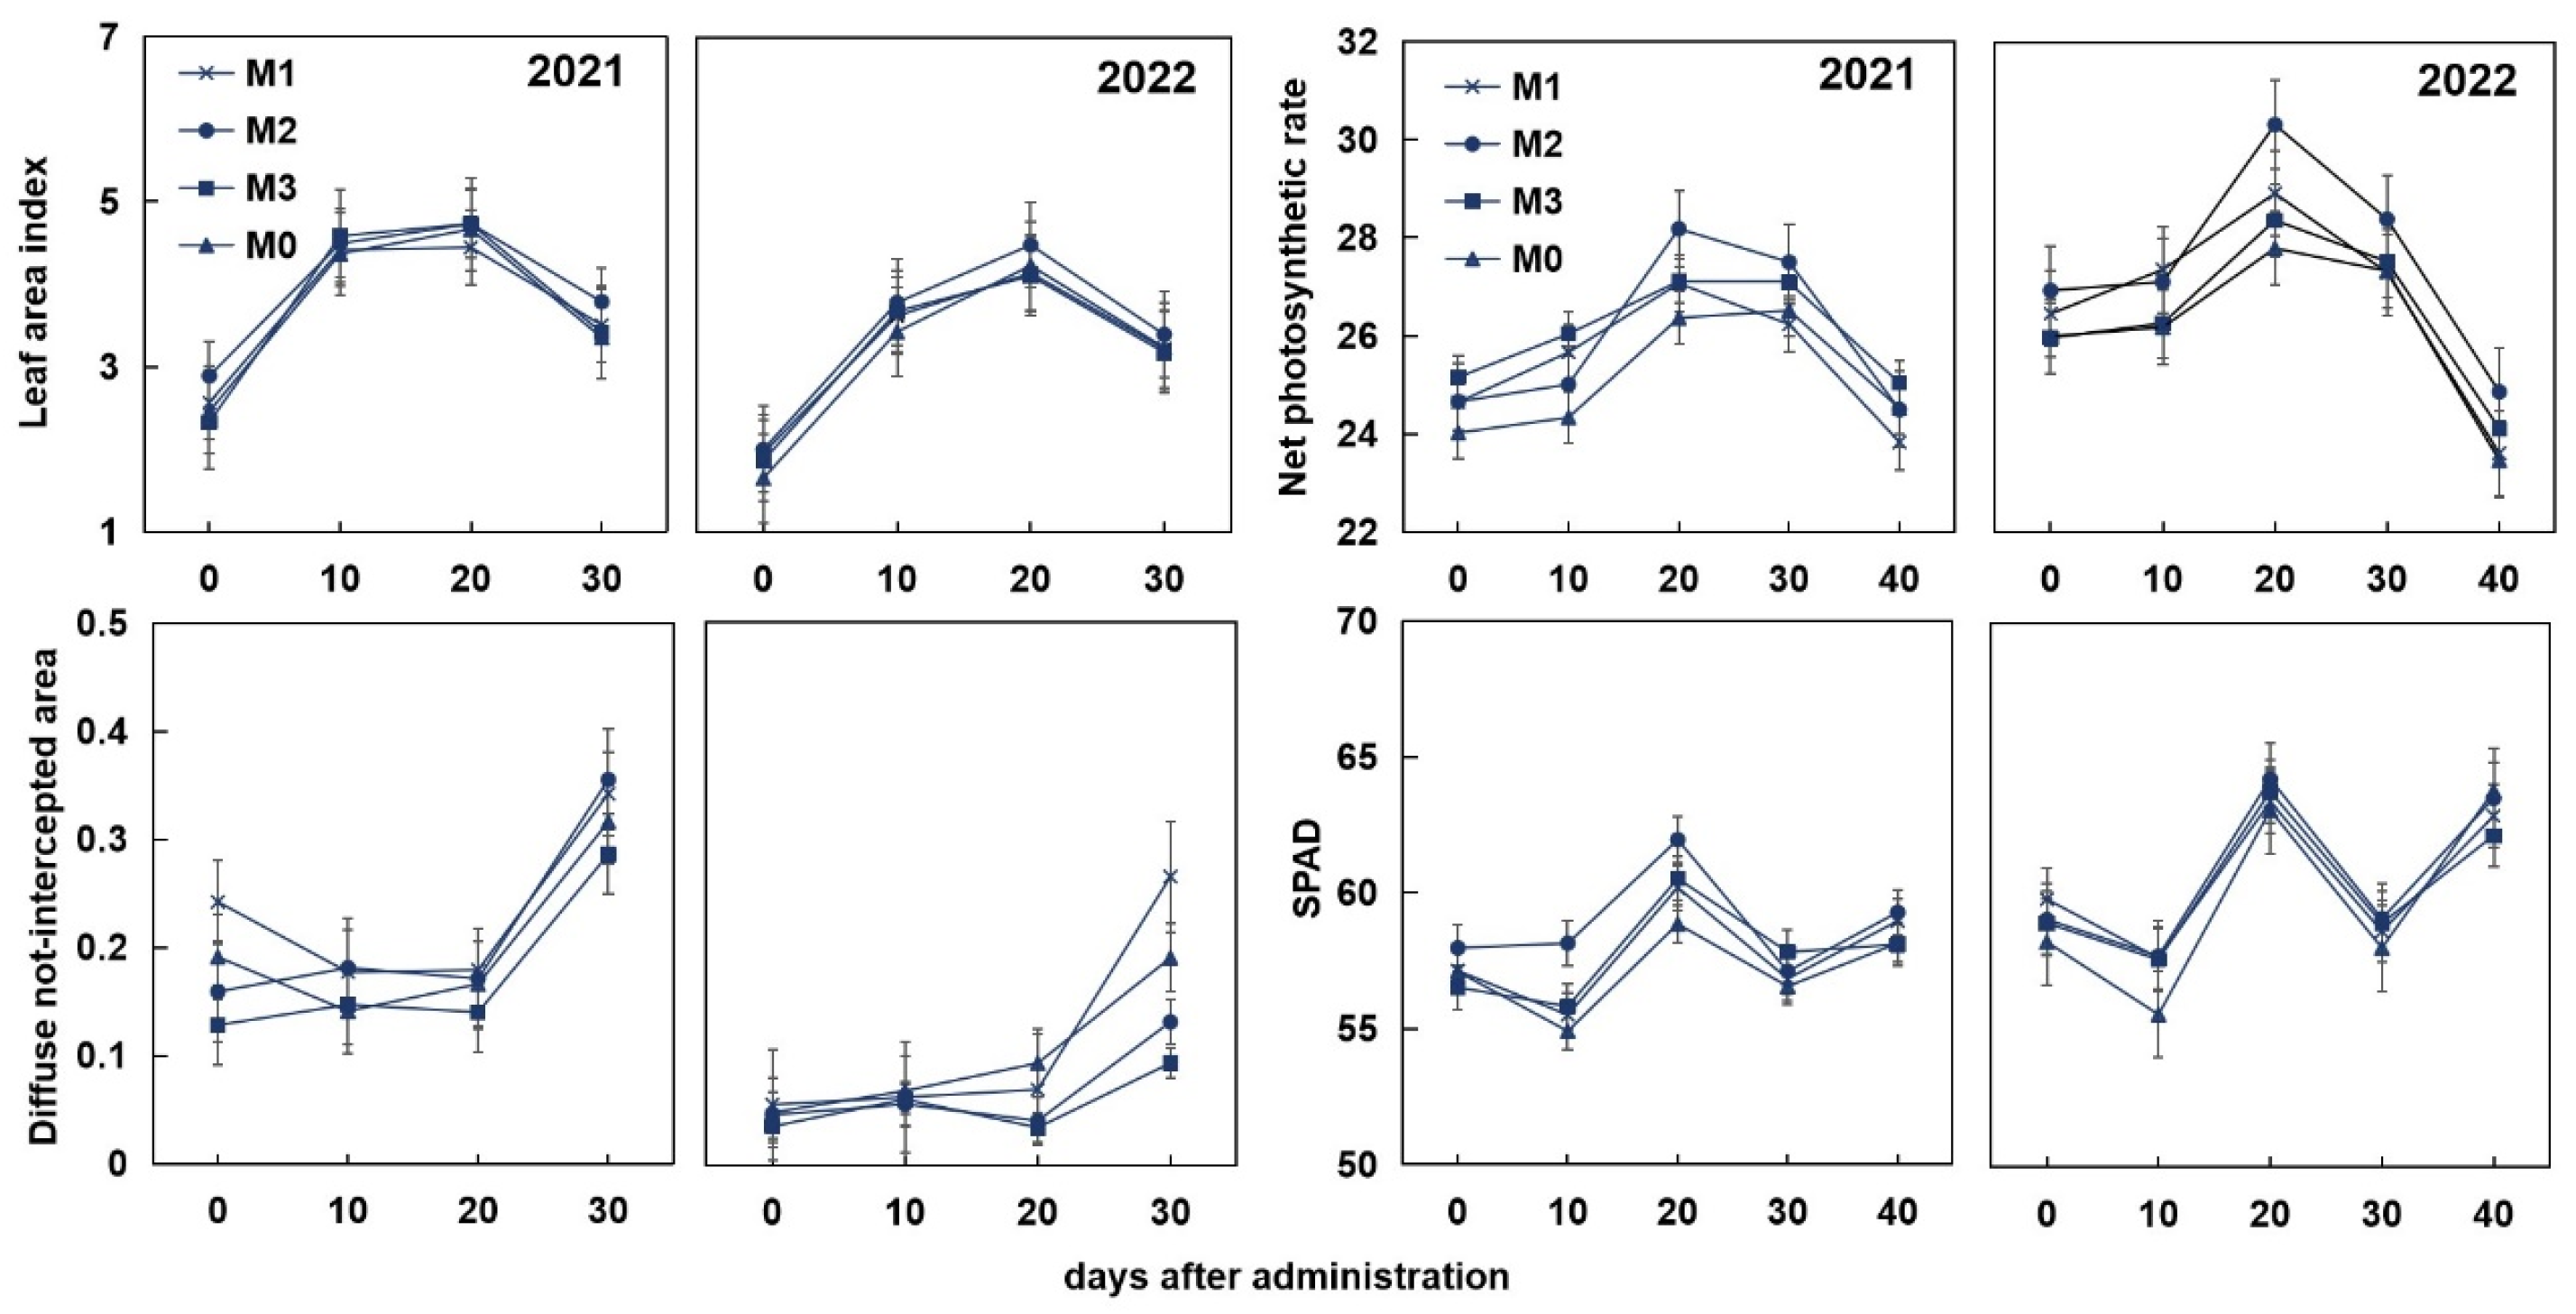
3.2.2. Canopy Structure and Photosynthetic Characteristics

The application of the considered fungicide in combination with different growth regulators enhanced the photosynthetic characteristics of the canopy, leading to varying degrees of increases in LAI values, canopy openness, SPAD value, and Pn. The results were consistent across 2021 and 2022. The trend of LAI from 0 to 30 days after the treatment followed a downward parabola as the growth process advanced, with the peak LAI value observed 20 days after treatment for all groups. In 2021, the LAI values of cotton treated with M2 was increased by 2.50% compared with that under the M0 treatment at 20 days after treatment, whereas in 2022, it was increased by 5.91%. Canopy openness gradually increased over time, with its peak observed 30 days after treatment. In 2022, the canopy openness under the M2 treatment was 10.98% higher than that under M0. The Pn showed a trend of initially increasing, peaking 20 days after treatment, and was followed by a decrease. In 2021, the Pn under the M2 treatment was 6.90% higher than that under M0 20 days after treatment, whereas in 2022, it was increased by 9.10%. Similarly, SPAD values peaked 20 days after treatment, displaying a trend that initially increased then decreased (Figure 5).

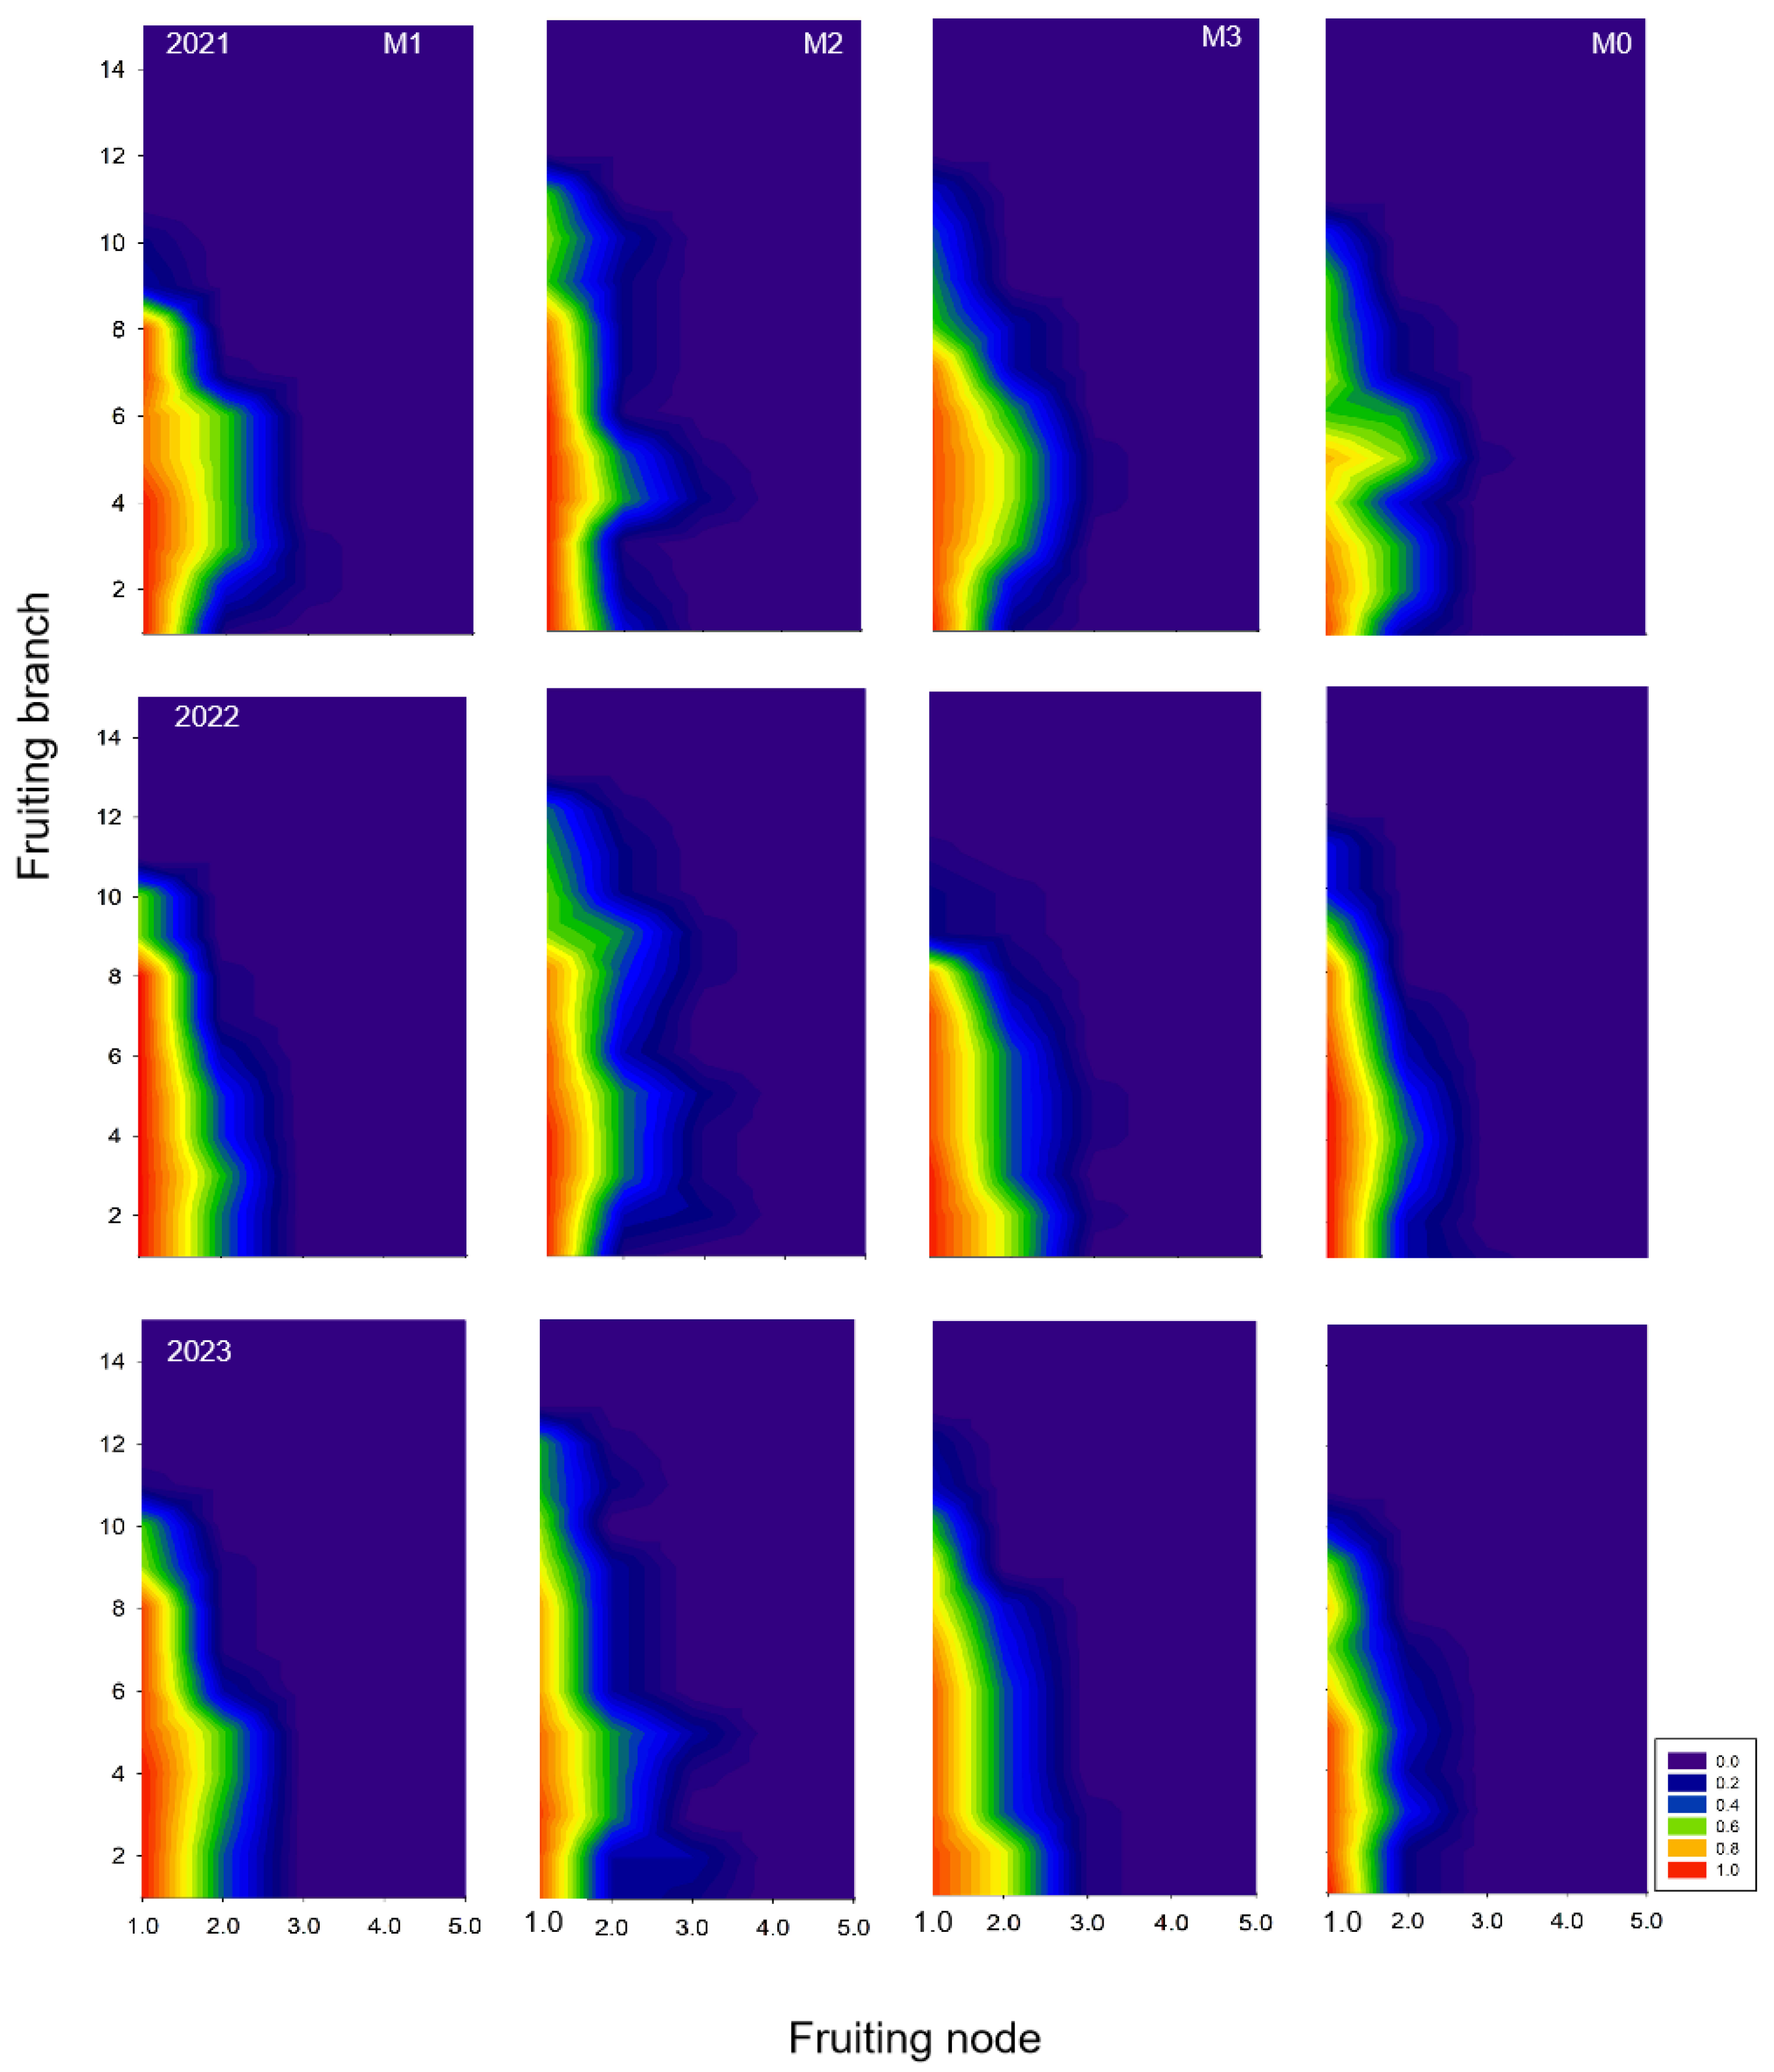
3.2.3. Spatial Distribution of Cotton Bolls

Following each treatment, the total number of bolls and fruit branches increased, with similar results observed in 2022 and 2023, except for the number of fruit branches in 2021. Notably, the M3 treatment increased the total number of bolls by 8.09% and 47.7%, respectively, compared with the control (Figure 6). The cotton yield mainly depends on the inner bolls in the middle and lower parts, but is still determined by a certain proportion of the lower outer boll and upper inner boll. We noticed significant differences in the distribution of cotton bolls among different treatments. Among all treatments, the M2 treatment had the highest proportion of inner bolls in the upper part of the plants, accounting for 40%. The M2 treatment resulted in vertical growth of cotton bolls to the 12th fruit branch, while other treatments had the highest vertical growth of cotton bolls, reaching the 10th fruit branch. At the same time, the M3 treatment resulted in a higher proportion of peripheral bolls setting in the lower half of cotton plants and horizontal growth reaching the third fruit node, contributing significantly to yield (Figure 7).

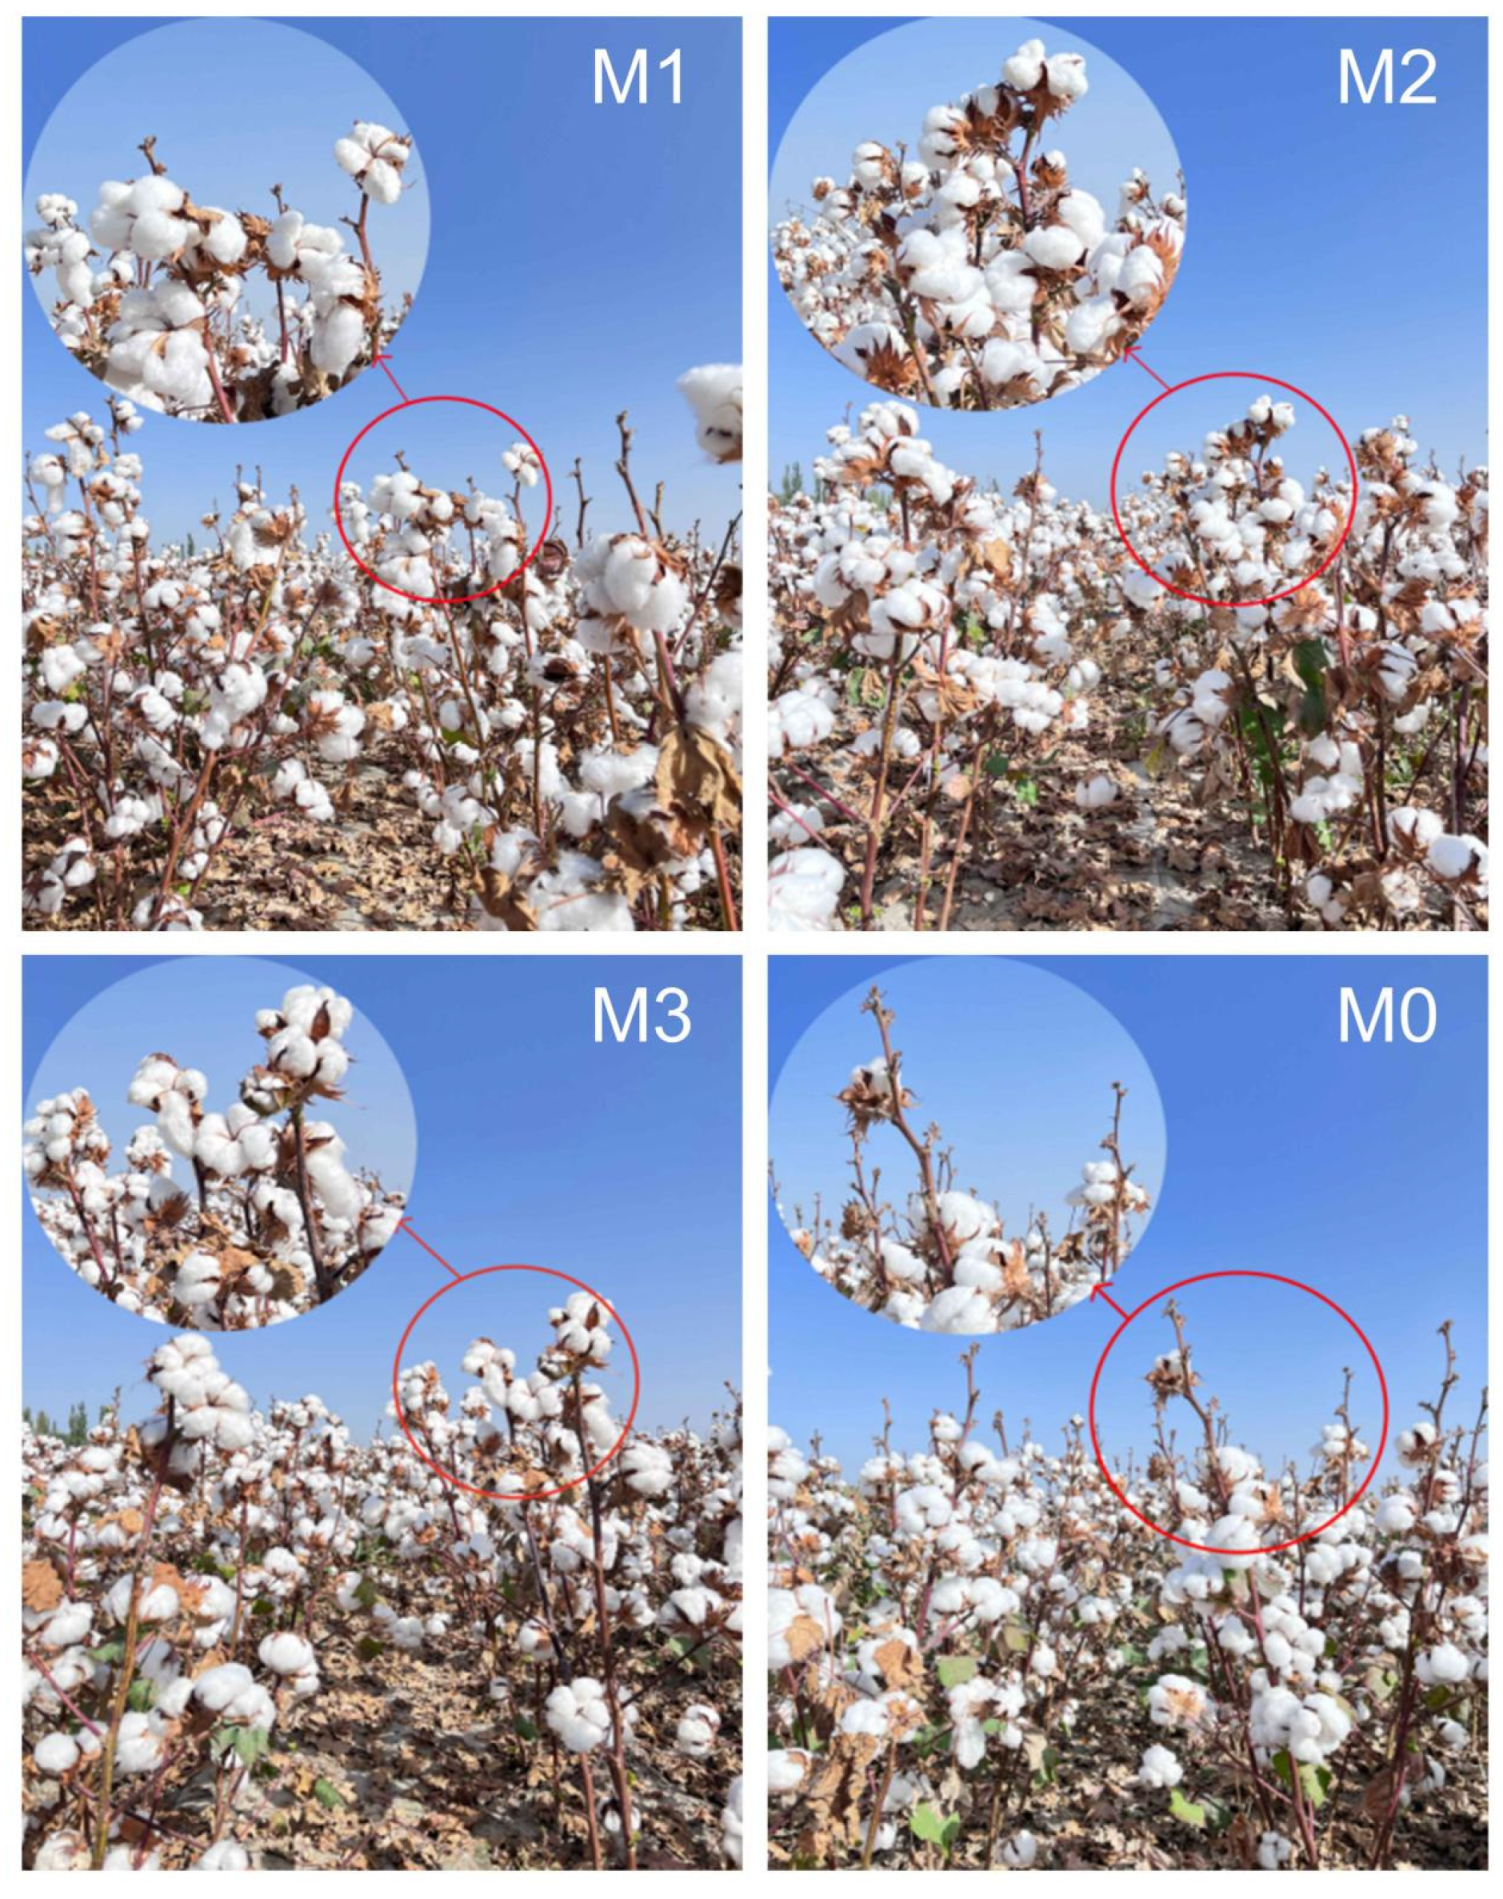
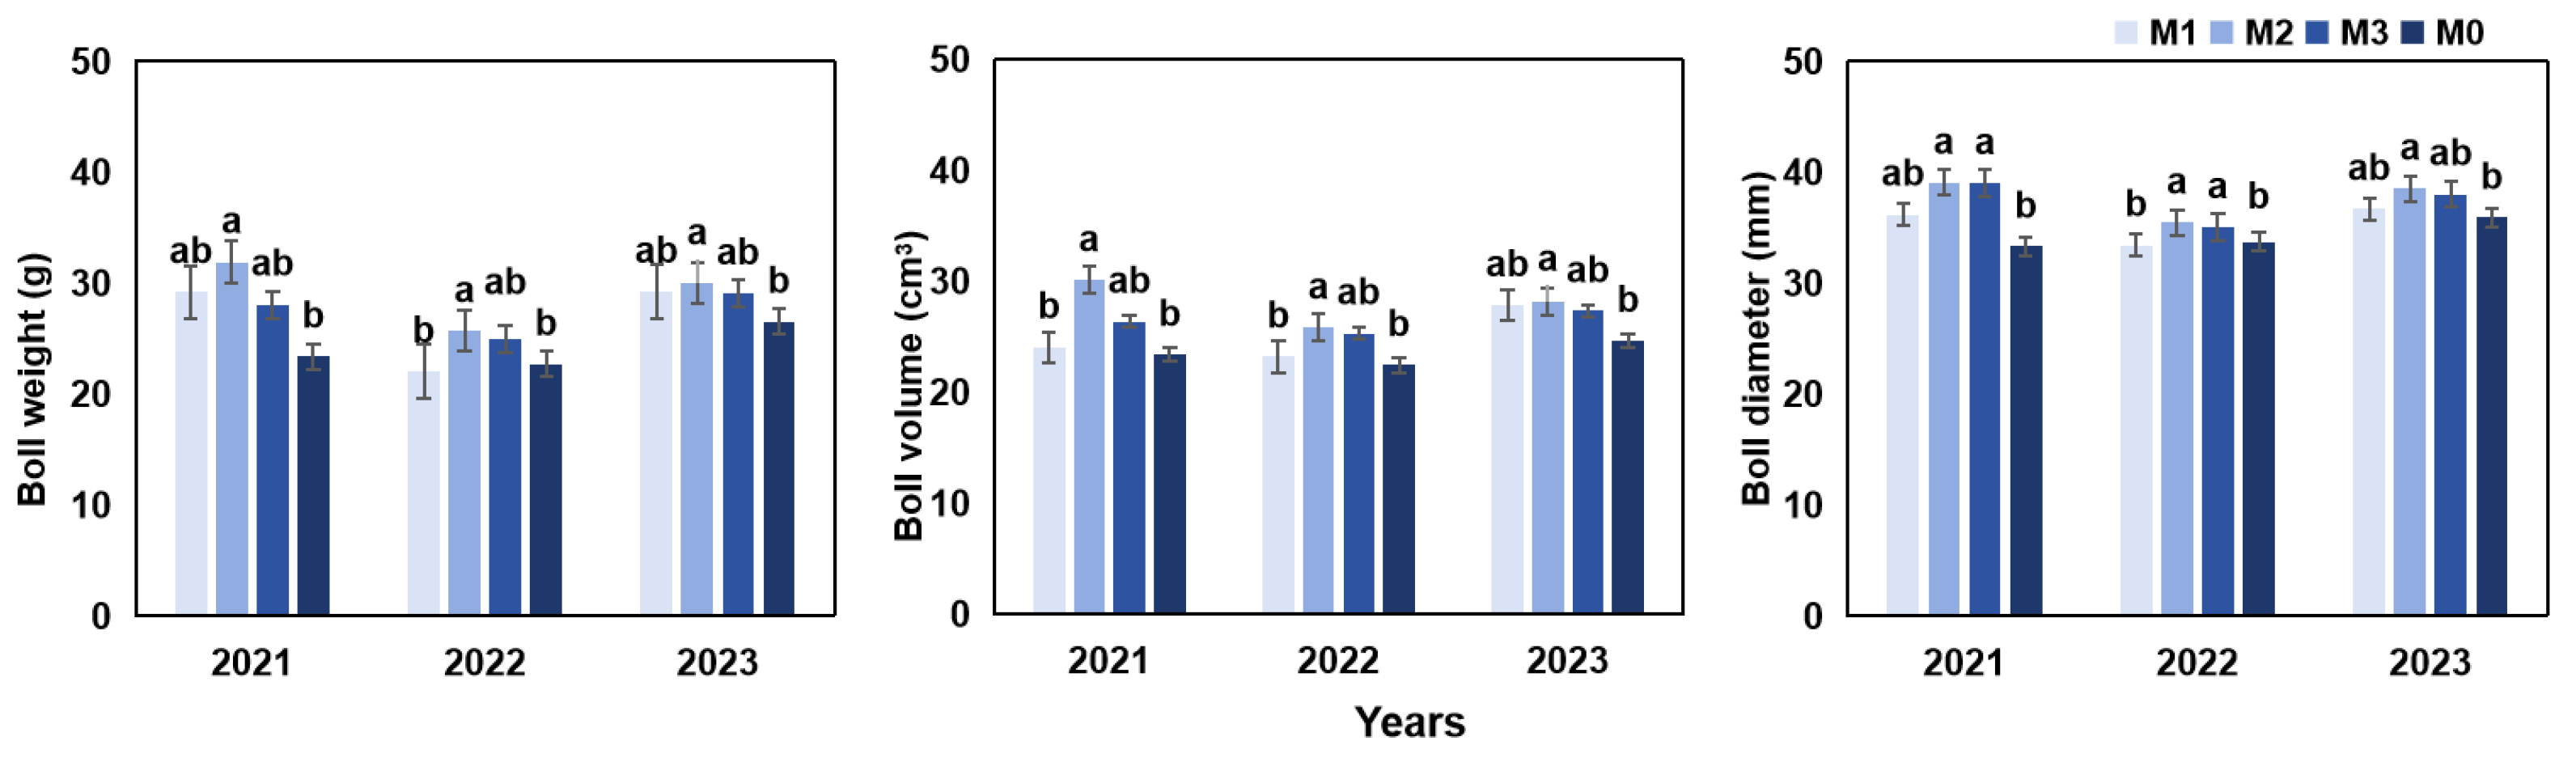
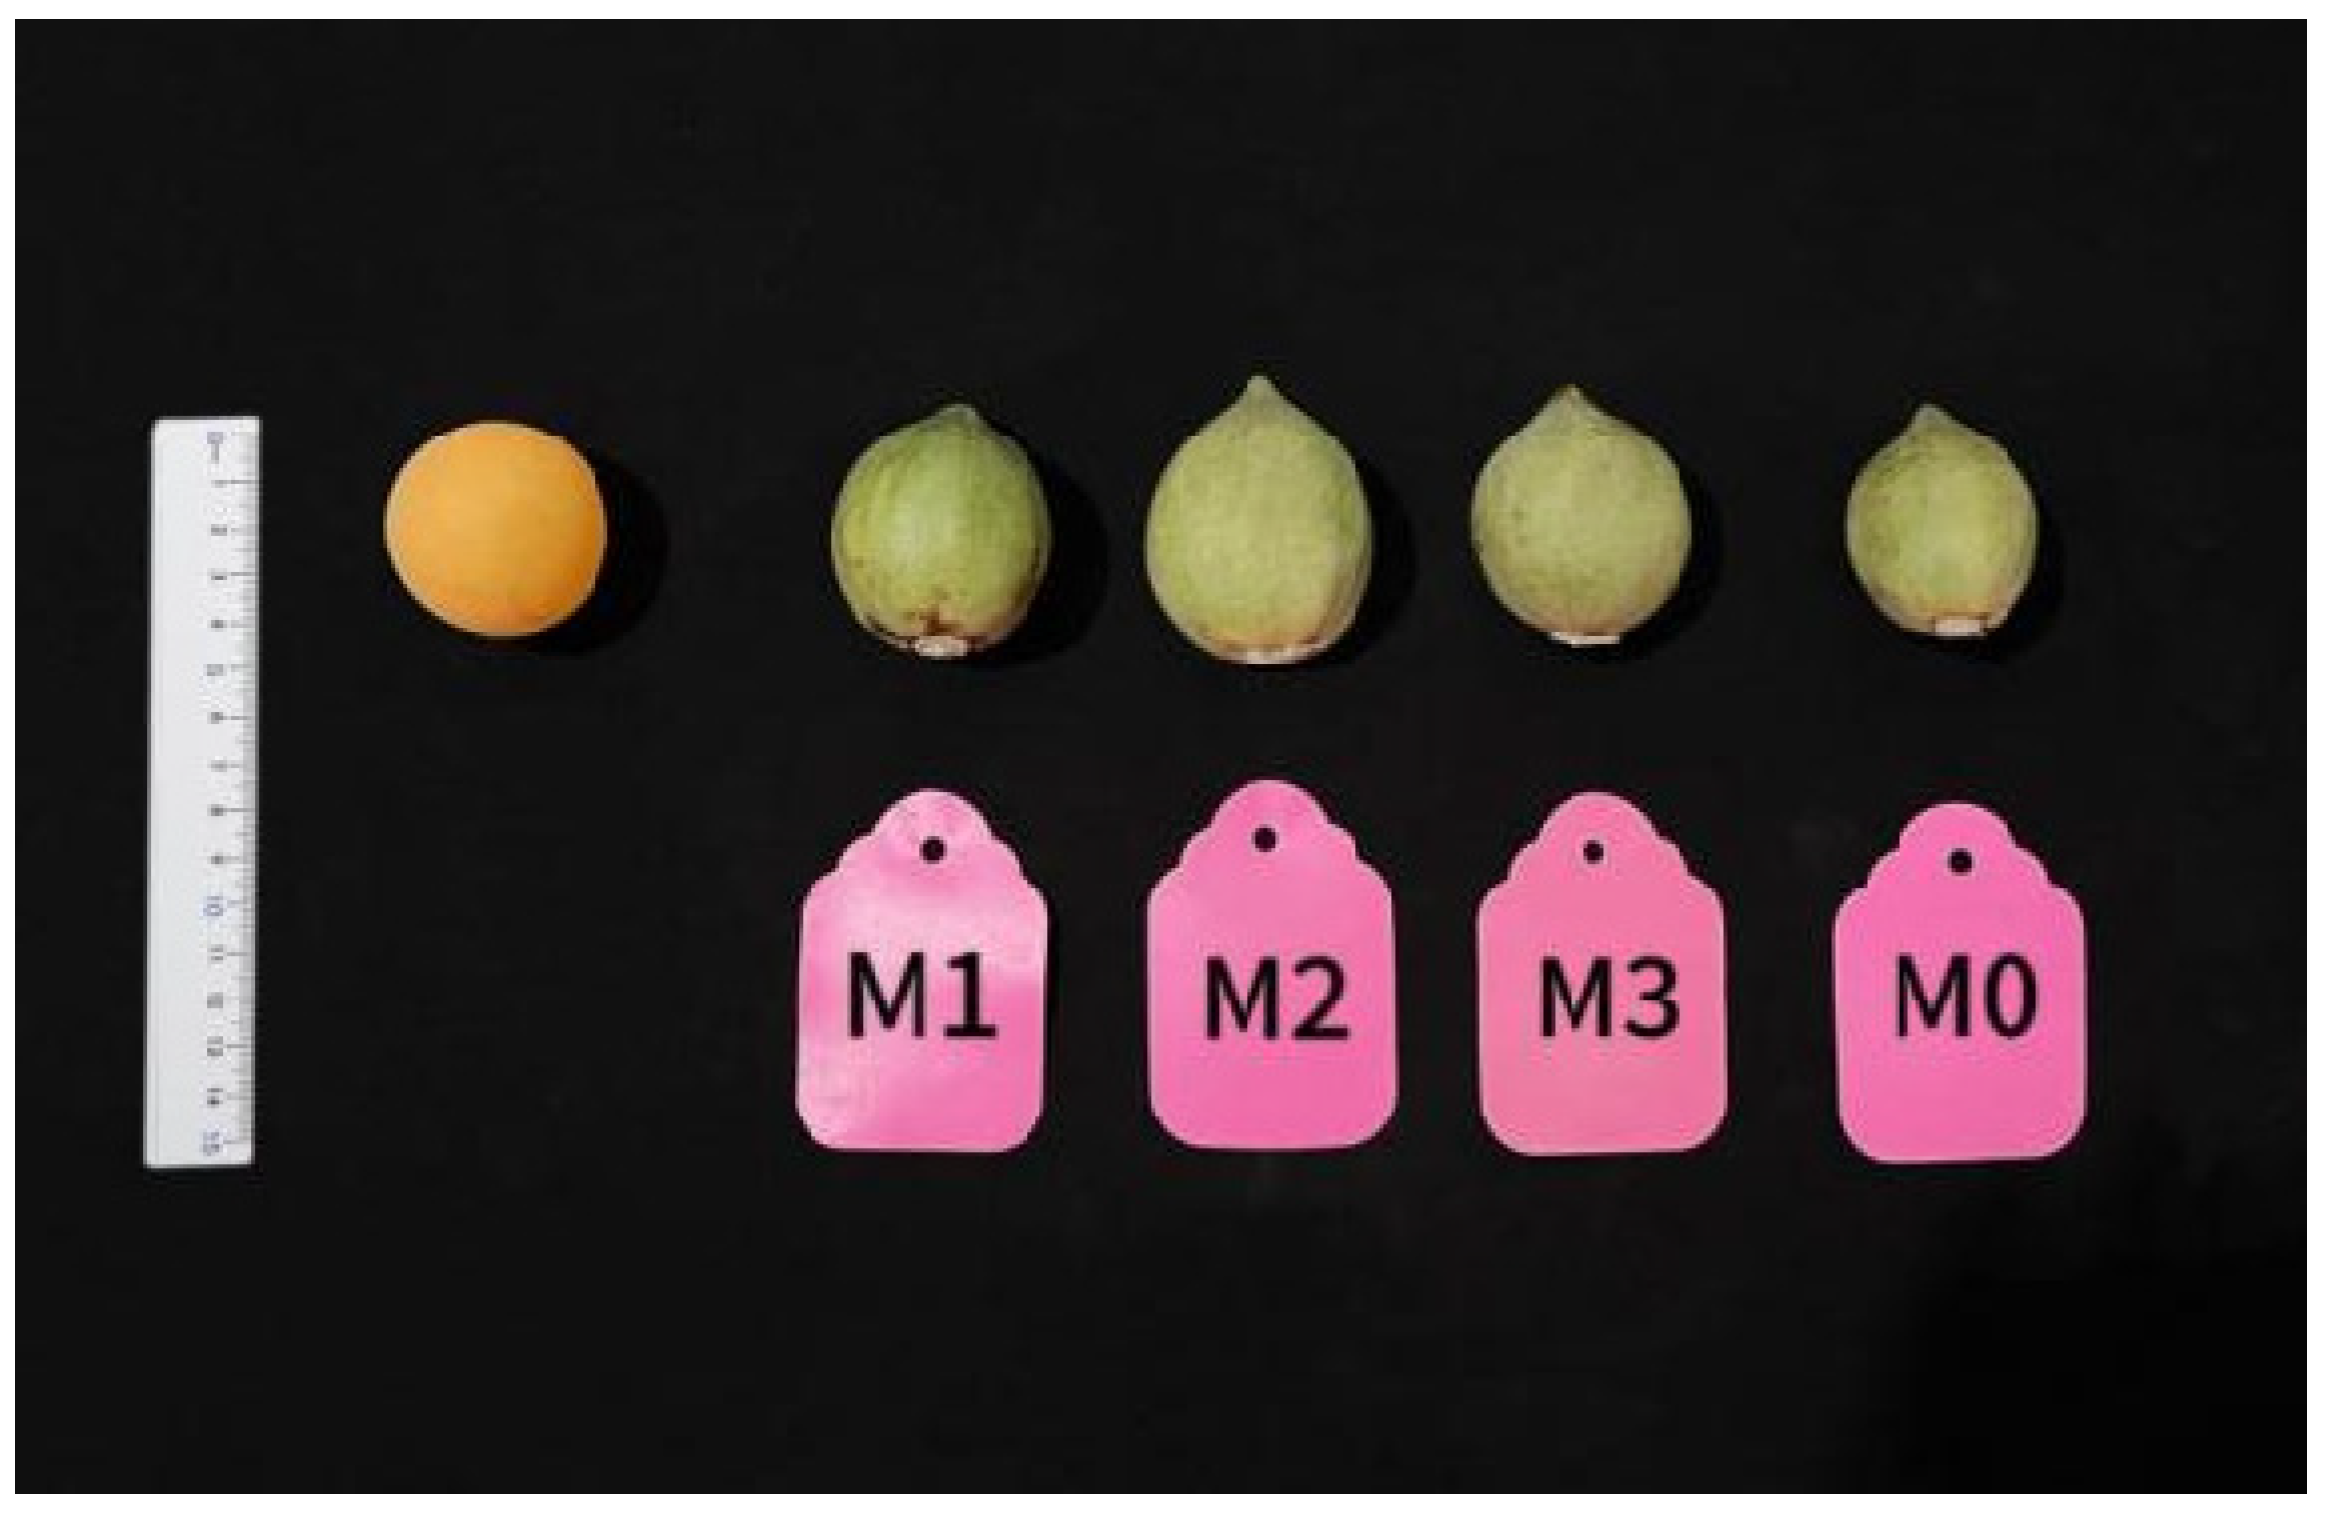
3.2.4. Cotton Boll Morphology

Each treatment led to increases in the boll weight, boll volume, and boll diameter to varying degrees, with consistent results observed from 2021 to 2023. In 2021, the M2 treatment showed significant improvements compared with the M0 treatment, with increases of 36.36% in boll weight, 17.27% in boll volume, and 28.72% in boll diameter. In 2022, no significant differences in these parameters were observed between the M1 and M0 treatments. Similarly, in 2023, no significant differences were noted among the M1, M3, and M0 treatments (Figure 8). The M2 treatment had a greater effect on boll shape than the M0 treatment (Figure 9).

3.3. Correlation Analysis

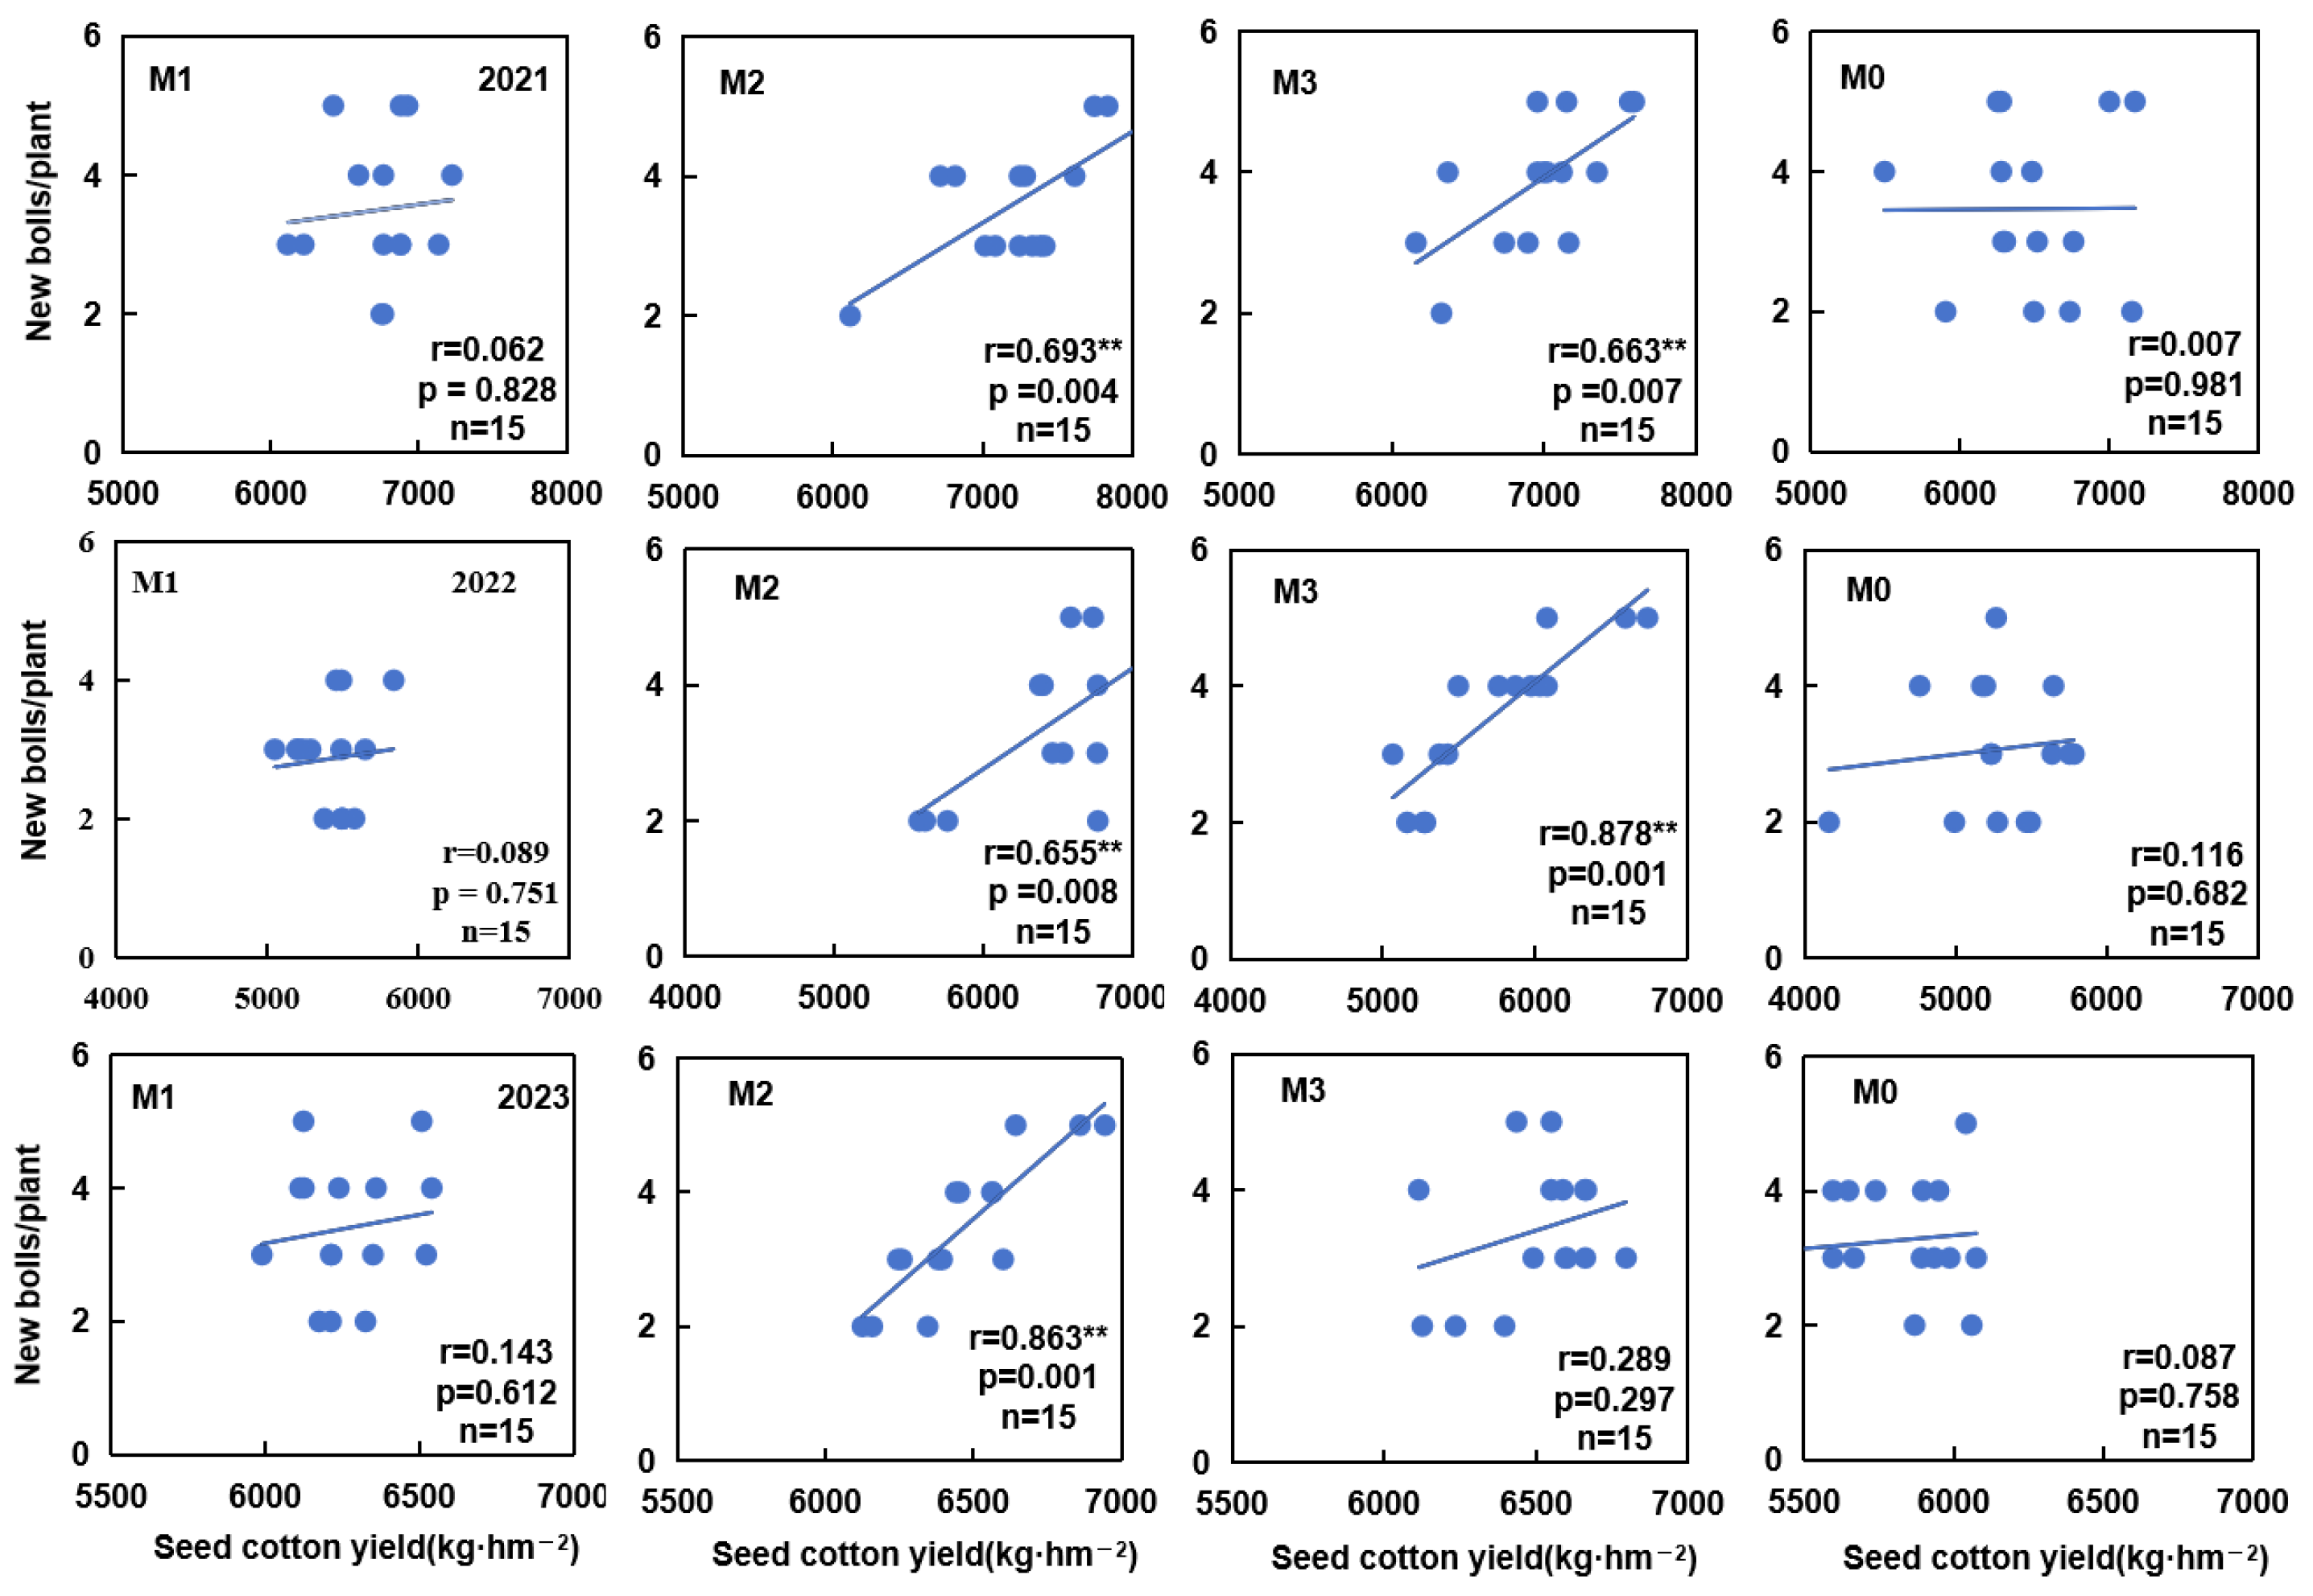
3.3.1. Correlation Between New Bolls and Seed Cotton Yield

The seed cotton yield exhibited a positive correlation with the number of new bolls during 2021–2023. In 2021, the seed cotton yield under the M2 and M3 treatments showed significant positive correlations, with correlation coefficients (r) of 0.693 and 0.663, respectively. In 2022, the correlation coefficients for the M2 and M3 treatments were also significantly positive, with r = 0.655 and 0.878, respectively. In 2023, the correlation coefficient for the M2 treatment (r = 0.663) indicated an extremely significant positive correlation between seed cotton yield and the number of new bolls (Figure 10), whereas those for the other treatments were not significant. Compared with other treatments, the M2 and M3 treatments resulted in more numerous, larger, and fuller new bolls at the top of the plants, aligning with the correlation analysis results (Figure 4 and Figure 10).

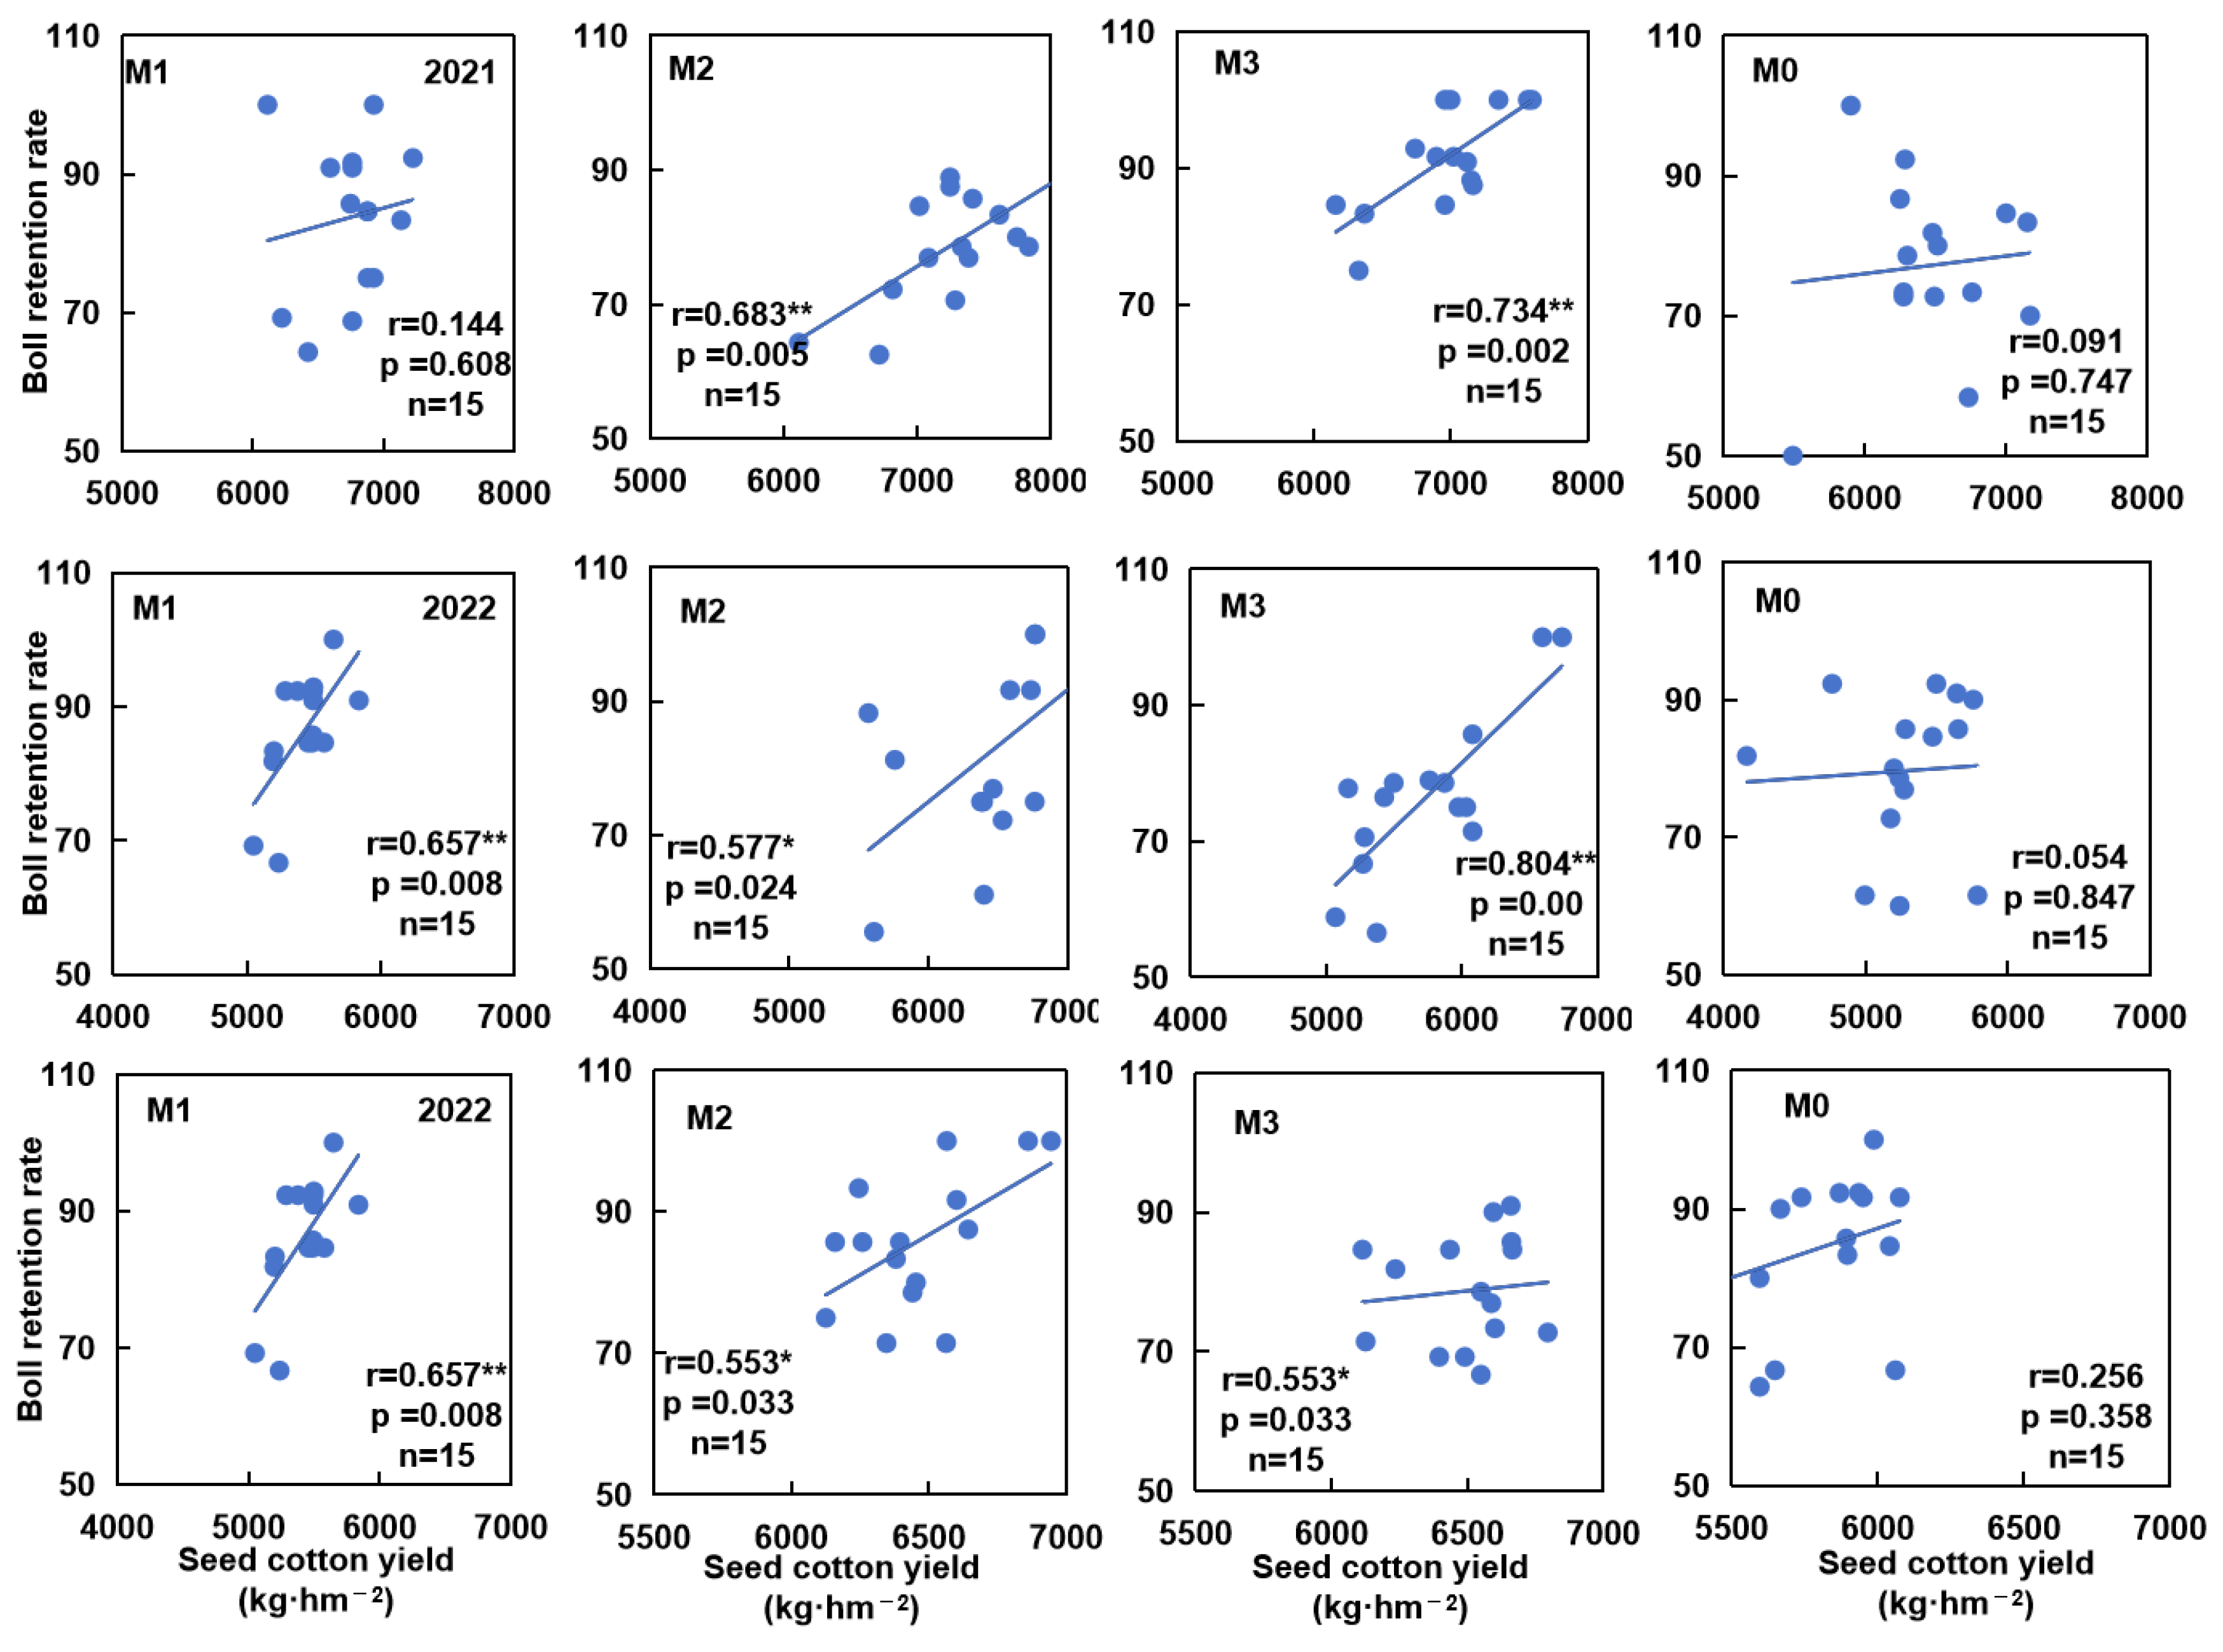
3.3.2. Correlation Between Boll Retention and Seed Cotton Yield

A positive correlation was observed between the boll retention rate and seed cotton yield across all treatments from 2021 to 2023. In 2021, the seed cotton yield for the M2 and M3 treatments showed significant positive correlations with the number of new bolls, with correlation coefficients (r) of 0.683 and 0.734, respectively. In 2022, these correlations were significant and positive for all treatments—that is, M1, M2, and M3—with correlation coefficients (r) of 0.657, 0.577, and 0.804, respectively. In 2023, the seed cotton yield remained significantly, positively correlated with the number of new bolls (r = 0.553) for the M2 and M3 treatments; however, the correlations were not significant for other treatments (Figure 11).

3.3.3. Correlations Among Boll Weight, Volume, Diameter and Seed Cotton Yield

In 2021, the correlation coefficients for boll volume (r = 0.574), boll weight (r = 0.515), and boll diameter (r = 0.594) with seed cotton yield under the M2 treatment were significant and positive. In 2022, the boll volume under the M1 treatment was positively correlated with seed cotton yield (r = 0.520). In addition, significant positive correlations were observed between the boll weight and seed cotton yield for the M2 and M3 treatments, with coefficients (r) of 0.592 and 0.580, respectively. In 2023, the boll volume under the M2 and M3 treatments exhibited significant positive correlations with seed cotton yield, with coefficients (r) of 0.642 and 0.740, respectively. The boll diameter under the M2 treatment also showed a strong positive correlation (r = 0.768). Similarly, the boll weight and seed cotton yield were positively correlated under the M2 (r = 0.733) and M3 (r = 0.633) treatments. However, a negative correlation was observed between seed cotton yield and boll volume under the M1 treatment (Table 2). These correlation analysis results align with the data presented in Figure 8 and Figure 9, confirming the trends observed in this study.

3.4. Cotton Fiber Quality

In 2023, we noted no significant difference in the specific fracture strength among different treatments. Except for the fiber-specific strength in the middle parts in 2022, the fiber specific strength under all the other treatments did not significantly differ. There was only a difference in uniformity in the middle and lower parts in 2022. Meanwhile, the average length in the lower half under the M1 treatment was 0.9 mm greater than that under the M0 treatment. The M2 and M3 treatments significantly improved the uniformity in the upper parts of the plants when compared to the M0 treatment, with increases of 1.18% and 1.45%, respectively. In 2023, we observed no significant differences in average length, uniformity index, or fiber strength values among the treatments. Overall, the Micronaire values in 2023 were lower than those in 2022. The quality of the middle and lower parts was the best in 2023, and in 2022, the quality under the M2 treatment was the best when compared to the other treatments (Table 3).

4. Discussion

Yield levels in cotton production are affected by various management factors, among which chemical regulation plays a particularly significant role [2,14]. This study conducted experiments involving spraying a fungicide in combination with different growth regulators for cotton cultivation, with the aim of exploring their effects on cotton yield and quality. In this experiment, with the one-film, two-row planting mode, the placement of neonatal buds, new fruiting branches, and new fruiting nodes in cotton plants was significantly higher than those under the one-film, three-row planting mode. A previous study has pointed out that, when planting two rows with one film, the individual cotton buds were relatively large, while the number of cotton buds per unit area was small; in contrast, under the one-film, three-row planting pattern, although the size of the cotton buds might decrease gradually, the number of cotton buds per unit area increased significantly [15,16]. This is consistent with the results of the experiment in this study. Previous studies have found that cotton production mainly relies on the middle and lower parts of the inner ring, while the proportion in the outer ring is relatively small; however, increasing the number of upper cotton bolls is a potential pathway for achieving higher yields [17]. In this study, the M2 treatment had the highest proportion of inner bolls in the upper part of the plants, accounting for 40%. The M2 treatment resulted in the vertical growth of cotton bolls to the 12th fruit branch, while other treatments led to the highest vertical growth of cotton bolls reaching the 10th fruit branch, which is consistent with the results of previous studies.
Previous studies have revealed a consistency between the boll weight and the percentage of clothing, with heavier cotton bolls resulting in a heavier clothing percentage [18]. However, there was some inconsistency between the weight of cotton bolls and the percentage of clothing in this experiment. This is inconsistent with previous results, which may be due to the different effects of the pesticides on different varieties, or because spraying pesticides enhances the stability and consistency of cotton populations. Furthermore, there were differences in the irrigation and fertilization of cotton fields in different years. The frost-free period in Xinjiang is relatively long. In the context of reducing planting density to achieve mechanical harvesting, cotton farmers often tend to increase irrigation and fertilization [19,20]. In this study, the application of growth regulators had an impact on both the Pn and LAI values, with all treatments leading to increases in the Pn and LAI values compared to the control. Both the Pn and LAI reached their peak values 20 days after treatment. Previous studies have shown that LAI and Pn values are influenced by growth regulators, and that all treatments led to improvements when compared with the control [21]. Both the LAI and canopy openness values were higher in 2021 than in 2022, corresponding to higher yields in 2021. Although the number of bolls per unit area was higher in 2021, the average boll weight was relatively low. At the same time, in 2022, the Pn showed a significant increase, likely due to the lower planting density that allowed for better light penetration and expansion of the cotton plant’s light-receiving surface [22,23]. Despite the lighter boll weight in 2021, overall production remained at the highest level. This suggests that a higher planting density, while reducing boll weight, does not compromise total yield. The reason for this phenomenon may be differences in planting patterns. To determine the specific reasons underlying this yield difference, it is still necessary to conduct further research.

5. Conclusions

All three combination treatments designed in this study demonstrated a strong potential to increase cotton yield, and showed promising application prospects in cotton production. Among these, the treatment with 40% pyrazoline (300 mL/ha) + 0.1% thiaphenone (150 g/ha) exhibited the strongest regulatory effect. Compared with the control, this treatment significantly increased the number of bolls per unit area and boll weight, thereby substantially improving seed cotton yield. This study also revealed a positive correlation between the number of new bolls and seed cotton yield, as well as between the boll retention rate and seed cotton yield. These findings provide valuable insights into the chemical regulation of cotton production in the Aksu region of Xinjiang, China, offering practical implications for improving yields in the context of cotton cultivation.

Author Contributions

M.A., Writing—original draft, Creating Charts, Visualization, Investigation Data, Data curation, Formal analysis, methodology, Conceptualization; H.C., Investigation Data, Creating Charts, Writing—review & editing, Visualization, literature search; X.S., Writing—review & editing, methodology, Conceptualization, Visualization; G.W., Investigation Data, Data curation, Formal analysis, methodology, literature search; X.L., Investigation Data, Data curation, Formal analysis, project management, literature search; Y.T., Investigation Data, Data curation, Formal analysis, Visualization, literature search; J.Z., Investigation Data, Data curation, Formal analysis, literature search; W.W., Investigation Data, Data curation, Formal analysis; S.Y., Data curation, Creating Charts, Visualization; Z.M., Investigation Data, Data curation, Creating Charts; F.Z., Investigation Data, Data curation; H.W., Writing—review & editing, Supervision, Methodology, Conceptualization, Visualization, Final approval of the version to be published; Q.Z., Writing—review & editing, Supervision, Methodology, Conceptualization, Visualization, Resources, Funding acquisition, Final approval of the version to be published. All authors have read and agreed to the published version of the manuscript.

Funding

This research was funded by the Xinjiang Uygur Autonomous Region Major Science and Technology Special Project on Research and the Demonstration of Plastic Topping, Defoliation and Maturation Technology for Machine-picked Cotton (22020A01002-2).

Institutional Review Board Statement

Not applicable.

Informed Consent Statement

Not applicable.

Data Availability Statement

The dataset is available upon request from the authors.

Conflicts of Interest

The authors declare no conflicts of interest.

References

  1. Ergin, N.; Kulan, E.G.; Harmanci, P.; Kaya, M.D. The ability of biostimulants and copper-containing fungicide to protect cotton against chilling stress. J. Cotton Res. 2024, 7, 21. [Google Scholar] [CrossRef]
  2. Cook, D.R.; Kennedy, C.W. Early flower bud loss and mepiquat chloride effects on cotton yield distribution. Crop Sci. 2000, 40, 1678–1684. [Google Scholar] [CrossRef]
  3. Echer, F.R.; Oosterhuis, D.M.; Loka, D.A.; Rosolem, C.A. High night temperatures during the floral bud stage increase the abscission of reproductive structures in cotton. J. Agron. Crop Sci. 2014, 200, 191–198. [Google Scholar] [CrossRef]
  4. Shu, H.; Sun, S.; Wang, X.; Chen, J.; Yang, C.; Zhang, G.; Liu, R. Thidiazuron combined with cyclanilide modulates hormone pathways and ROS systems in cotton, increasing defoliation at low temperatures. Front. Plant Sci. 2024, 15, 1333816. [Google Scholar] [CrossRef]
  5. Heitholt, J.J.; Sassenrath-Cole, G.F. Inter-plant competition: Growth responses to plant density and row spacing. Physiol. Cotton 2010, 17, 179–186. [Google Scholar]
  6. Liao, B.; Li, F.; Yi, F.; Du, M.; Tian, X.; Li, Z. Comparative physiological and transcriptomic mechanisms of defoliation in cotton in response to thidiazuron versus ethephon. Int. J. Mol. Sci. 2023, 24, 7590. [Google Scholar] [CrossRef] [PubMed]
  7. Song, X.; Zhang, L.; Zhao, W.; Xu, D.; Eneji, A.E.; Zhang, X.; Li, Z. The relationship between boll retention and defoliation of cotton at the fruiting site level. Crop Sci. 2022, 62, 1333–1347. [Google Scholar] [CrossRef]
  8. Li, Z.K.; Jiang, X.L.; Peng, T.; Shi, C.L.; Han, S.X.; Tian, B.; Zhu, Z.L.; Tian, J.C. Mapping quantitative trait loci with additive effects and additive x additive epistatic interactions for biomass yield, grain yield, and straw yield using a doubled haploid population of wheat (Triticum aestivum L.). Genet. Mol. Res. 2014, 13, 1412–1424. [Google Scholar] [CrossRef] [PubMed]
  9. Shu, H.; Ni, W.; Guo, S.; Gong, Y.; Shen, X.; Zhang, X.; Guo, Q. Root-applied brassinolide can alleviate the NaCl injuries on cotton. Acta Physiol. Plant. 2015, 37, 75. [Google Scholar] [CrossRef]
  10. Zhou, H.; Wang, L.; Su, J.; Xu, P.; Liu, D.; Hao, Y.; Fan, H. Combined application of silica nanoparticles and brassinolide promoted the growth of sugar beets under deficit irrigation. Plant Physiol. Biochem. 2024, 216, 109165. [Google Scholar] [CrossRef] [PubMed]
  11. Siebert, J.D.; Stewart, A.M.; Leonard, B.R. Comparative growth and yield of cotton planted at various densities and configurations. Agron. J. 2006, 98, 562–568. [Google Scholar] [CrossRef]
  12. Wang, L.; Mu, C.; Du, M.W.; Chen, Y.; Tian, X.L.; Zhang, M.C.; Li, Z.H. The effect of mepiquat chloride on elongation of cotton (Gossypium hirsutum L.) internode is associated with low concentration of gibberellic acid. Plant Sci. 2014, 225, 15–23. [Google Scholar] [CrossRef] [PubMed]
  13. Huang, C.; Liu, X.; Ma, S.; Qin, A.; Zhang, Y.; Liu, Z. Enhancement of Waterlogging Tolerance and Improvement of Grain Quality in Waxy Maize With Exogenous EDAH: A Mixture of Ethephon and Diethyl Aminoethyl Hexanoate. J. Agron. Crop Sci. 2024, 210, 12729. [Google Scholar] [CrossRef]
  14. Ren, J.; Tang, Q.; Niu, S.; Liu, S.; Wei, D.; Zhang, Y.; Gao, Z. High dose of plant growth regulator enhanced lodging resistance without grain yield reduction of maize under high density. Int. J. Plant Prod. 2022, 16, 329–339. [Google Scholar] [CrossRef]
  15. Chen, Y.; Li, Y.B.; Chen, Y.; Ming, Y.; Hu, D.P.; Li, Y.; Zhang, X.; Chen, D.H. Planting density and leaf—Square regulation affected square size and number contributing to altered insecticidal protein content in Bt cotton. J. Crop Res. 2017, 205, 14–22. [Google Scholar] [CrossRef]
  16. Liu, J.; Guo, W.; Wang, X.; Li, Y.; Lu, F. Influence of high temperature on Bt protein expression in transgenic Bt cotton. Field Crops Res. 2011, 124, 236–241. [Google Scholar]
  17. Wang, Y.; Shao, Y.; Zhao, X.; Pei, Q.; Nan, N.; Zhang, F.; Li, X. High-efficiency fungicide screening and field control efficacy of maize southern corn rust. Crop Prot. 2025, 187, 106997. [Google Scholar] [CrossRef]
  18. Liu, J.; Meng, Y.; Lv, F.; Chen, J.; Ma, Y.; Wang, Y.; Chen, B.; Zhang, L.; Zhou, Z. Photosynthetic characteristics of the subtending leaf of cotton boll at different fruiting branch nodes and their relationships with lint yield and fiber quality. Front. Plant Sci. 2015, 6, 747. [Google Scholar] [CrossRef]
  19. Zhang, Q.; Luo, D.; Sun, Y.; Li, P.; Xiang, D.; Zhang, Y.; Yang, M.; Gou, L.; Tian, J.; Zhang, W. Cotton harvest aids promote the translocation of bur-stored photoassimilates to enhance single boll weight. Ind. Crops Prod. 2023, 195, 116375. [Google Scholar] [CrossRef]
  20. Wang, P.; Chen, X.P.; Tian, C.Y.; Zhang, F.S. Effect of Different Irrigation and Fertilization Strategies on Yield, Fiber Quality and Nitrogen Balance of High-Yield Cotton System. Sci. Agric. Sin. 2005, 38, 761–769. [Google Scholar]
  21. Peloso, A.F.; Tatagiba, S.D.; Amaral, F.J.; Cavatte, P.C.; Pezzopane, J.E. Pyraclostrobin Preserves Photosynthesis In Arabica Coffee Plants Subjected To Water Deficit. Rev. Eng. Agric.-REVENG 2020, 28, 109–119. [Google Scholar] [CrossRef]
  22. Zhao, D.; Oosterhuis, D.M. Cotton responses to shade at different growth stages: Growth, lint yield and fibre quality. Exp. Agric. 2000, 36, 27–39. [Google Scholar] [CrossRef]
  23. Zhai, M.; Wei, X.; Pan, Z.; Xu, Q.; Qin, D.; Li, J.; Zhang, J.; Wang, L.; Wang, K.; Duan, X.; et al. Optimizing plant density and canopy structure to improve light use efficiency and cotton productivity: Two years of field evidence from two locations. Ind. Crops Prod. 2024, 222, 119946. [Google Scholar] [CrossRef]
Figure 1. Temperature and precipitation in the cotton growing season from 2021 to 2023.
Agronomy 15 00394 g001
Figure 2. Schematics of different planting patterns from 2021–2023.
Agronomy 15 00394 g002
Figure 3. Effect of combination treatments involving the fungicide pyraclostrobin and different growth regulators on new plant parts during 2021–2023. The various lowercase letters in the vertical direction imply significant differences between treatments at α = 0.05 level.
Agronomy 15 00394 g003
Figure 4. Effect of combination treatments involving the fungicide pyraclostrobin and growth regulators on the growth of new bolls.
Agronomy 15 00394 g004
Figure 5. Effects of fungicide application in combination with different growth regulators on the leaf area index, canopy opening, net photosynthesis rate, and SPAD value of cotton in 2021 and 2022.
Agronomy 15 00394 g005
Figure 6. Effects of the application of different growth regulators in combination with the fungicide on the boll number and fruit branch number from 2021 to 2023. The various lowercase letters in the vertical direction imply significant differences between treatments at α = 0.05 level.
Agronomy 15 00394 g006
Figure 7. Effect of the fungicide application in combination with different growth regulators on the spatial distribution of cotton bolls from 2021 to 2023.
Agronomy 15 00394 g007
Figure 8. Effects of different growth regulators applied in combination with the fungicide on cotton boll morphology during the peak boll period from 2022 to 2023. Please check if explanations are required for different letters.
Agronomy 15 00394 g008
Figure 9. Schematic of cotton boll morphology under different treatments involving the fungicide and growth regulators during the full boll period in 2023.
Agronomy 15 00394 g009
Figure 10. Correlation between new boll number and seed cotton yield from 2021 to 2023. p > 0.05 indicates no correlation between the number of new bolls and the seed cotton yield. ** p < 0.01.
Agronomy 15 00394 g010
Figure 11. Correlation between the boll retention rate and the seed cotton yield in 2021 and 2023. p > 0.05: no correlation between boll percentage retention and seed cotton yield. * p < 0.05, ** p < 0.01.
Agronomy 15 00394 g011
Table 1. Effects of fungicide application in combination with different growth regulators on yield and yield components.
YearsTreatmentsNo. of Bolls (m2)Boll Weight (g)Seed Cotton Yield (kg/ha)Lint Percentage (%)
2021M1127.32 ab5.30 b6745.89 b49.44 a
M2141.33 a5.83 a8239.19 a44.96 bc
M3121.45 b5.73 a6959.08 b46.62 b
M0116.52 b5.37 b6242.42 b44.51 c
Average126.65 A5.55 C7046.64 A46.38 C
2022M194.73 b5.78 ab5477.15 b50.98 ab
M2107.63 a5.97 a6436.84 a46.56 b
M399.67 ab5.79 ab5774.62 ab48.58 ab
M090.88 b5.71 b5184.48 b52.57 a
Average98.22 C5.81 B5718.27 C49.67 B
2023M1103.04 ab6.16 ba6349.81 ab55.47 ab
M2104.87 a6.34 a6656.46 a57.79 ab
M3108.32 a6.09 c6601.40 a54.51 b
M095.91 b6.23 b5979.11 b59.63 a
Average103.03 B6.20 A6396.69 B56.85 A
Source of variancep
Years (Y)<0.0001<0.0001<0.0001<0.0001
Treatments (T)<0.0001<0.0001<0.00010.0301
Y × T0.03330.00900.03330.0041
Means in a column followed by different letters are significantly different at p < 0.05.
Table 2. Correlations among boll weight, volume, and diameter in 2021 and 2023.
YearsTreatmentsBoll Volume (cm3)Boll Diameter (mm)Boll Weight (g)
nrpnrpnrp
2021M1150.4870.066150.3010.276150.4070.132
M2150.574 *0.025150.594 *0.020150.515 *0.050
M3150.0990.725150.2310.407150.4320.108
M0150.1540.583150.4280.112150.4020.137
2022M1150.520 *0.047150.2970.282150.2730.325
M2150.4690.078150.5060.054150.592 *0.020
M3150.2870.299150.2110.451150.580 *0.023
M015−0.0310.914150.1980.479150.1570.577
2023M1150.3640.18215−0.0700.805150.2800.312
M2150.642 **0.010150.768 **0.001150.733 **0.002
M3150.740 **0.002150.5080.053150.633 *0.011
M0150.2300.409150.0430.880150.0520.854
p > 0.05 indicates no correlation between seed cotton yield and the boll weight, boll volume, or boll diameter. * p < 0.05, ** p < 0.01.
Table 3. Effect of fungicide application in combination with different growth regulators on cotton fiber quality.
YearsPartsTreatmentsUpper Half Mean Length (mm)Uniformity Index (%)Fiber Strength
(cN tex−1)
Micronaire
2022UpperM129.70 ab85.30 a29.03 a4.76 a
M230.50 a85.43 a29.30 a4.33 a
M330.53 a84.80 a28.73 a4.63 a
M029.50 b85.03 a29.73 a4.96 a
MiddleM130.76 a85.23 ab29.46 a4.86 a
M230.76 a86.10 a28.33 b4.23 a
M330.50 a85.73 ab28.53 ab5.00 a
M029.70 b84.16 b28.56 ab5.13 a
LowerM130.40 a83.23 b29.20 a4.86 a
M230.26 ab84.33 a29.40 a4.80 a
M330.10 ab84.60 a28.93 a4.83 a
M029.65 b83.15 b28.60 a5.23 a
2023UpperM131.00 ab88.60 a32.33 a4.40 ab
M231.70 a89.43 a32.86 a4.20 a
M331.23 ab88.33 a33.03 a4.30 ab
M030.16 b87.63 a31.33 a4.53 a
MiddleM130.76 a87.63 a33.63 a4.36 a
M230.83 a88.50 a35.00 a4.20 a
M330.40 a88.36 a33.26 a4.26 a
M030.30 a87.70 a33.03 a4.66 a
LowerM131.56 a89.26 a32.80 a4.16 a
M232.20 a89.60 a35.23 a4.10 a
M331.33 ab89.26 a34.30 a4.33 a
M030.40 b88.93 a32.00 a4.53 a
Different letters in the same column on the same day indicate that the differences are significant at a level of 0.05.
Disclaimer/Publisher’s Note: The statements, opinions and data contained in all publications are solely those of the individual author(s) and contributor(s) and not of MDPI and/or the editor(s). MDPI and/or the editor(s) disclaim responsibility for any injury to people or property resulting from any ideas, methods, instructions or products referred to in the content.

