Abstract
The GRAS gene family encodes a group of plant-specific transcription factors essential for regulating plant growth, development and stress responses. While the GRAS gene family has been extensively studied in various plant species, a comprehensive characterization of the GRAS gene family in Medicago ruthenica has not yet been conducted. In this study, a total of 62 MrGRAS gene family members were identified through a comprehensive whole-genome analysis of M. ruthenica, and phylogenetic analysis categorized these 62 genes into 13 distinct groups. Gene structure and conserved domain analysis showed that MrGRAS genes from the same evolutionary branch share similar exon–intron architecture and conserved motifs. A large number of hormone-responsive, growth and development and stress-responsive cis-regulatory elements were detected in the upstream sequences of MrGRAS genes. RT-qPCR analysis showed that drought stress significantly induced the expression of nine selected MrGRAS genes. Overall, this study analyzed the phylogenetic relationships, conserved domains, cis-regulatory elements and expression patterns of the GRAS gene family in M. ruthenica, filling the gap in the identification of the MrGRAS gene family and laying the foundation for functional analysis of the MrGRAS gene family.
1. Introduction
Transcription factors are a type of protein that interacts with DNA and regulate the process transcription. By connecting to specific regions on DNA (cis-regulatory elements), they influence the transcription activity of nearby genes, thereby regulating gene expression [1]. Transcription factor families like GRAS, NAC, WOX, WRKY, MADS, MYB, and bZIP are known to play key roles in plant growth and development, hormone signaling and stress responses [2,3,4,5,6]. GRAS family members contain a conserved domain, known as the GRAS domain. GRAS is an acronym representing several representative members namely: Gibberellic Acid Insensitive (GAI), Repressor of GAI (RGA) and Scarecrow (SCR), respectively [7,8,9]. The GRAS domain consists mainly of five typical motif regions: LHR I, VHIID, LHR II, PFYRE, and SAW [10]. The VHIID is considered the fundamental structure of GRAS proteins, the PFYRE is associated with phosphorylation [11]. The SAW is situated at the C-terminus and consists of three conserved amino acid groups: R-E, W-G, and W-W [12]. The N-terminal amino acid sequence of GRAS proteins can fold into specific structures, enabling them to connect to target proteins and participate in multiple signal pathways [13]. Now, Arabidopsis GRAS transcription factors were further divided into ten subfamilies in studies of molecular signal recognition: DELLA, DLT, HAM, SCL4/7, SCR, PAT1, SCL3, LAS, LISCL, and SHR [14]. Liu and Widmer conducted a comparative analysis and identification of GRAS proteins in multiple species including Oryza sativa, Arabidopsis thaliana, Populus trichocarpa, Vitis vinifera, and Solanum lycopersicum. Their study categorized the O. sativa GRAS proteins into 13 subfamilies: DELLA, SCR, LISCL, PAT1, DLT, SCL3, Pt20, HAM, SCL4/7, LAS, SHR, Os19, and Os4 [15].
In Arabidopsis, the SHR and SCR subfamilies influence the establishment of the cortex/endodermis. These subfamily members are preferentially expressed in Triticum aestivum roots, exhibiting a similar pattern, indicating a conserved role in regulating radial growth [16]. The DoSCL3-1, 3-2, and 3-3 genes identified from the Dioscorea genome are homologous to SCL3, showing high transcripts in all tissues, suggesting their importance in plant development and growth [17]. In O. sativa, OsGRAS23, a homolog of SCL14, seems important for participating in the drought stress response [18]. GRAS genes exhibit tissue specificity, evident from differences in the transcript levels of FtGRAS in different tissues and fruit development stages in Fagopyrum tataricum, indicating their distinct functions in different tissue types [19]. Furthermore, GRAS genes are involved in responses to hormone signaling and stress responses. Some identified EgrGRAS genes in Eucalyptus grandis exhibit differential responses to gibberellin, abscisic acid, salt, drought, and temperature stresses. Additionally, there are expression differences among members of the same subfamily [20]. In Setaria italica, treatment with the exogenous regulator paclobutrazol alters the transcription levels of DELLA members, reducing plant height while increasing grain weight, corroborating their relationship with fruit development [21]. Drought, sodium chloride, and jasmonic acid induce the expression of the OsGRAS23 gene in O. sativa, which enhances drought tolerance [18]. In Brachypodium distachyon, BdGRAS genes show changes in expression levels after inoculation with O. sativa blast fungus [22]. To date, the expression patterns and evolutionary relationships of GRAS genes have been studied in various species, including Arabidopsis [23], Cucumis sativus [24], O. sativa [14], Brassia campestris [25], Triticum aestivum [26], Vitis vinifera [27], Fagopyrum tataricum [19], Secale cereal [28], Miscanthus sinensis [29], G. max [30], Musa nana [31], and Cymbidium [32]. However, there is currently no information on the characterization and functional analysis of the GRAS gene family in M. ruthenica.
Medicago ruthenica (2n = 2x = 16), belonging to the legume family (Leguminosae) in the subfamily Papilionoideae [33], is mainly distributed in northern China, Mongolia, and eastern Siberia. M. ruthenica is rich in protein, minerals, and other nutritional elements, making it palatable and easily digestible, and has been widely grown as a novel forage crop in recent years [34]. Due to its strong tolerance to drought, saline–alkali conditions, and cold snowy winters, it is considered a genetic resource for enhancing the abiotic stress tolerance in Medicago sativa [35]. However, information regarding GRAS genes and their functions in M. ruthenica remains unclear. Therefore, the identification and characterization of GRAS genes is crucial for understanding their roles in M. ruthenica towards stress tolerance, and plant growth and development. This study aims to identify members of the GRAS gene family in M. ruthenica and to study their response to drought stress. In this research, we first identified GRAS genes in M. ruthenica genome, followed by detailed bioinformatics studies (phylogenetic analysis, gene structure domains, conserved domains, collinearity, chromosome locations, and cis-regulatory elements). In addition, this study also explored the expression patterns of GRAS genes under drought stress, providing a foundation for further analysis of GRAS genes in M. ruthenica, to explore their potential applications in enhancing abiotic stress tolerance in leguminous plants.
2. Materials and Methods
2.1. Identification and Analysis of the MrGRAS Gene Family
To identify members of the M. ruthenica GRAS gene family, the M. ruthenica genome sequence data were downloaded from github (https://github.com/, accessed on 20 October 2024) [36]. Subsequently, 34 Arabidopsis GRAS protein sequences were used as reference sequences. The TBtools-Blast Compare Two Seq tool was utilized for the initial local blast analysis [36]. The HMM of the GRAS domain (PF03514) was acquired from the Pfam database (http://pfam-legacy.xfam.org/, accessed on 24 October 2024). First, the downloaded HMM files were used to search the M. ruthenica protein file using HMMER 3.4 (phmmer search|HMMER), with the E-value set to ≤0.01 [37]. To reduce redundancy, duplicate sequences were filtered out by merging the outcomes obtained from BLAST and HMM searches. Additionally, sequences lacking the PF03514 domain were also filtered out based on the analysis at NCBI conserved domain database (https://www.ncbi.nlm.nih.gov/Structure/bwrpsb/bwrpsb.cgi, accessed on 24 October 2024), Pfam database (http://pfam-legacy.xfam.org/, accessed on 24 October 2024) and SMART database (https://smart.embl.de/smart/batch.pl, accessed on 24 October 2024). Finally, all identified M. ruthenica GRAS genes were renamed as MrGRAS01-MrGRAS62. Additionally, we analyzed the physicochemical properties of the MrGRAS proteins using the TBtools-Proteion ProtParamCalc and predicted subcellular localization using Plant-mPLoc (http://www.csbio.sjtu.edu.cn/bioinf/plant-multi, accessed on 24 October 2024).
2.2. Evolutionary, Gene Structure, and Conserved Motif Analysis of MrGRAS Gene Family
For the evolutionary study of M. ruthenica and Arabidopsis members, all MrGRAS proteins were first subjected to multiple sequence alignment using ClustalW (http://www.clustal.org/clustal2/, accessed on 26 October 2024) [38]. Subsequently, an evolutionary tree was constructed by MEGA 11 software (https://www.megasoftware.net/docs, accessed on 26 October 2024) using the neighbor-joining (NJ) method with 1000 bootstrap replicates [38]. All the MsGRAS genes were classified according to their evolutionary relationships with GRAS genes in Arabidopsis. Additionally, the conserved motifs of all MrGRAS proteins were identified and analyzed using the MEME online platform (https://meme-suite.org/meme/, accessed on 26 October 2024) [39]. Using following parameters: length: 20 to 100, maximum no. of motifs to be identified: 10, repeat number: 0 or 1.
2.3. Prediction of Protein Secondary Structure and Modeling of MrGRAS Proteins’ 3D Structures
We utilized the SWISS-MODEL platform (https://swissmodel.expasy.org/, accessed on 27 October 2024) to predict the three-dimensional structures of MrGRAS proteins [37]. The quality of the predicted models was assessed using the Global Model Quality Estimation (GMQE) metric. Additionally, the secondary structure of the proteins was analyzed using SOPMA (https://npsa.lyon.inserm.fr/cgi-bin/npsa_automat.pl?page=/NPSA/npsa_server.html, accessed on 27 October 2024).
2.4. Promoter Cis-Regulatory Elements Analysis of MrGRAS Gene Family
The 2000 bp sequences of all MrGRAS gene promoters were analyzed for cis-regulatory elements using the PlantCARE database (https://bioinformatics.psb.ugent.be/webtools/plantcare/html/, accessed on 18 December 2024) [38].
2.5. Chromosomal Distribution, Gene Duplication and Collinearity Analyses of MrGRAS Genes
The location information and chromosome length of the MrGRAS genes were acquired from Ensembl Plants [40]. Next, visual analysis of the chromosome distribution of MrGRAS genes was conducted using the MapGene2Chrom (http://mg2c.iask.in/mg2c_v2.0/, accessed on 30 October 2024) [37]. Duplication events of GRAS genes in the M. ruthenica genome were analyzed using TBtools (v2.147) software, along with the collinearity relationships of GRAS genes within M. ruthenica species and between M. ruthenica and Arabidopsis, Glycine max, and M. sativa.
2.6. Analysis of the Expression Patterns of MrGRAS Genes Under Different Abiotic Stresses Treatments
The raw transcriptome sequencing data [41] of M. ruthenica under different abiotic stresses (ABA, Cold, Freezing, Osmotic, Salt, and Drought) were downloaded from Github. Firstly, FASTP (v0.19.4) software was utilized to perform quality control and filtering on the raw sequencing data to remove low-quality data. The quality-controlled data were aligned to the reference genome using HISAT2, then featureCounts tool was used for quantitative analysis of gene expression [25]. Subsequently, TBtools-BLAST alignment was performed on this transcriptome dataset [26]. The expression levels of these genes were visualized using TBtools-HeatMap. In addition, correlation analysis of MrGRAS gene expression under the six stress conditions was conducted using the Corrplot plugin in Origin.
2.7. Plant Material, Growth Conditions, and Stress Treatment
The “Zhongke” M. ruthenica variety was used as the experimental material (We started preparing the materials on 10 October 2024, and completed all experiments and analyses by 17 November 2024). Two thousand M. ruthenica seeds were subjected to abrasion treatment to break the hard coat. After disinfection with 5% sodium hypochlorite to remove surface contaminants, the seeds were spread in square petri dishes for germination. After inverted cultivation in a walk-in growth chamber for four days, healthy and robust seedlings were selected and transferred to hydroponic boxes. The seedlings were then grown hydroponically using MS nutrient solution for four days, with the solution replaced every two days. Subsequently, the seedlings were subjected to the following treatments:
- (A)
- Control treatment: Seedlings were transferred to hydroponic boxes, and starting from the 8th day, they were treated with MS solution daily until sampling on the 13th day.
- (B)
- Different concentrations of drought stress treatment: Seedlings were transferred to hydroponic boxes, and starting from the 8th day, they were treated daily with different concentrations of Mannitol (50 mM, 100 mM, 200 mM, 300 mM and 400 mM) and sampled.
- (C)
- Direct drought stress treatment: Seedlings were transferred to hydroponic boxes, and on the 12th day (The treatments at different time points were ultimately sampled at the same time), they were treated with 400 mM Mannitol for 1 h, 3 h, 6 h, 12 h, and 24 h, followed by sampling on the 13th day.
After every treatment, leaves were collected, rapidly frozen in liquid nitrogen, and then kept at −80 °C to extract total RNA. Three technical and three biological duplicates were employed.
2.8. RT-qPCR Analysis
The SPARKeasy Plant Extraction Kit (SparkJade, Jinan, China) was used to extract total, which was reverse transcribed into complementary DNA (cDNA) according to the instructions provided with the SPARKscript II All-in-one RT kit. The RT-qPCR reaction was conducted using Taq SYBr® Green qPCR Premix (Universal) Yugong Biotech, Nanjing, China with a reaction volume of 10 μL. Primers were designed using primer3plus (https://www.primer3plus.com/index.html, accessed on 1 November 2024) The qPCR reaction conditions were conducted as per the manufacturer’s instructions. Information on primers and the reference gene MrACTION [42] can be found in Supplementary Table S1.
3. Results
3.1. Identification of the MrGRAS Gene Family Members and Analysis of the Physicochemical Properties
In the M. ruthenica reference genome, overall, 62 MrGRAS genes were identified, which were designated as MrGRAS01 to MrGRAS62. The detailed information on the identified MrGRAS protein sequences is listed in Table S2. The physicochemical properties of the MrGRAS proteins are listed in Table S3. The MrGRAS proteins range in length from 93 (MrGRAS19) to 817 (MrGRAS48) amino acids, with molecular weights ranging from 65,919.79 (MrGRAS01) to 90,193.44 (MrGRAS48) Da, and isoelectric points (pI) ranging from 4.72 (MrGRAS52) to 9.33 (MrGRAS11). The instability index of all the MrGRAS proteins falls between 27 and 61, with average grand average of hydropathy (GRAVY) values below 0, indicating their instability, solubility, and hydrophilicity. Furthermore, based on subcellular localization predictions, we found that, except for genes MrGRAS16, MrGRAS 18 and MrGRAS19, which were predicted to be localized in the mitochondria, the remaining MrGRAS genes were predicted to be localized in the nucleus (Table S3).
3.2. Evolutionary, Gene Structure and Conserved Motif Analysis of MrGRAS Gene Family
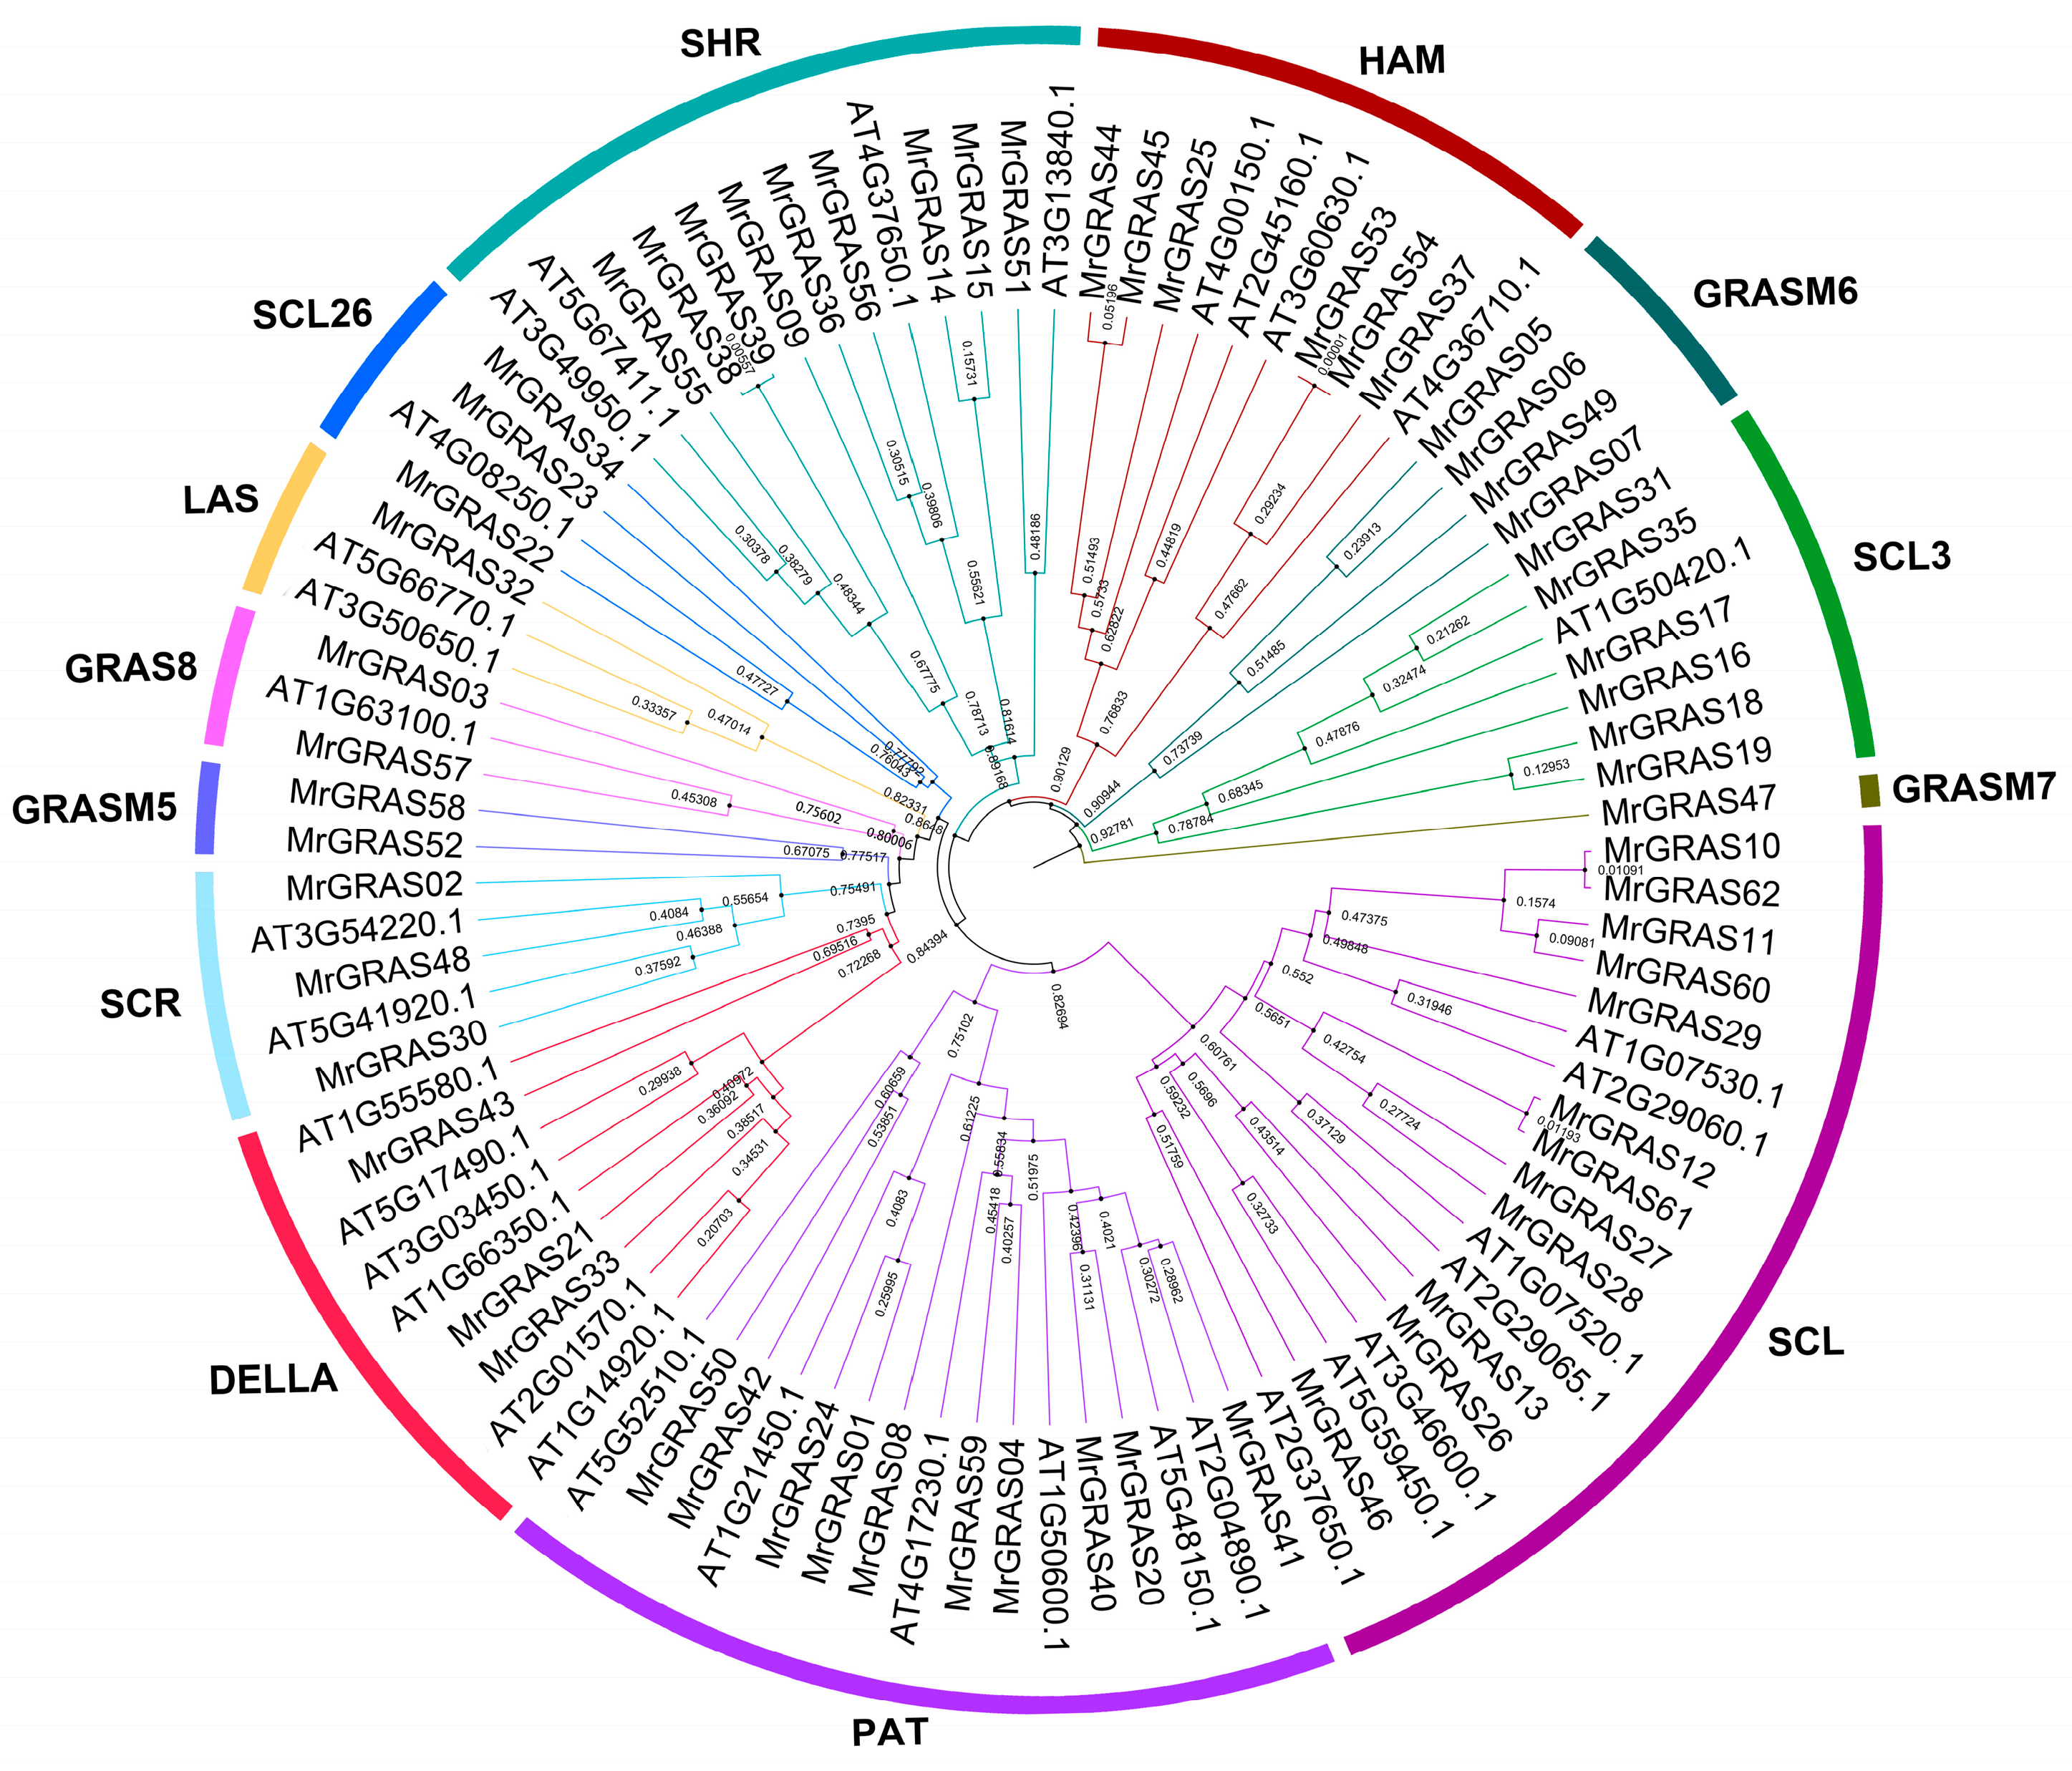
A Neighbor-Joining (NJ) method based on a phylogenetic tree (Figure 1 and Figure 2A) classified all the GRAS proteins into 13 subgroups, including SHR, HAN, GRASM6, GRASM7, SCL, PAT1, DELLA, SCR, GRASM5, GRAS8, LAS, and SCL26. The SCL subgroup contained the highest number of MrGRAS proteins, while GRASM7, GRASM5, and GRAS8 were newly identified families. The Gene Structure Display Server (GSDS) (http://gsds.cbi.pku.edu.cn, accessed on 1 November 2024). was used to investigate the gene structure features of MrGRAS genes. Most of the genes are primarily composed of exons (Figure 2B). Conserved motifs within the MrGRAS proteins and their distribution, discovered using the MEME tool, are listed in Table S4. GRAS proteins that gather within the same subfamily displayed comparable motif numbers and types, indicating potential functional similarities (Figure 2C).
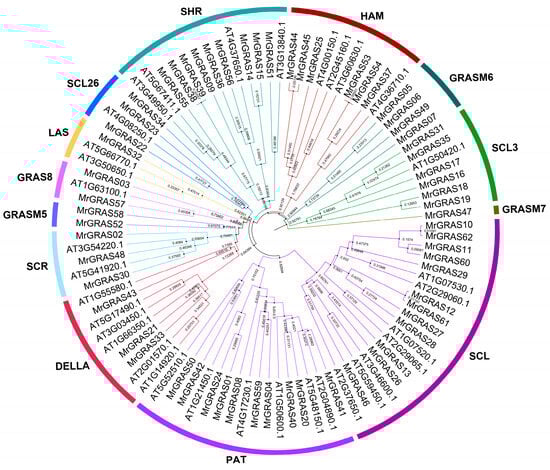
Figure 1.
The unrooted phylogenetic tree of GRAS proteins from M. ruthenica and Arabidopsis was constructed using the NJ method in MEGA 11. The tree categorizes the GRAS proteins into 13 distinct groups, each represented by different clade colors.
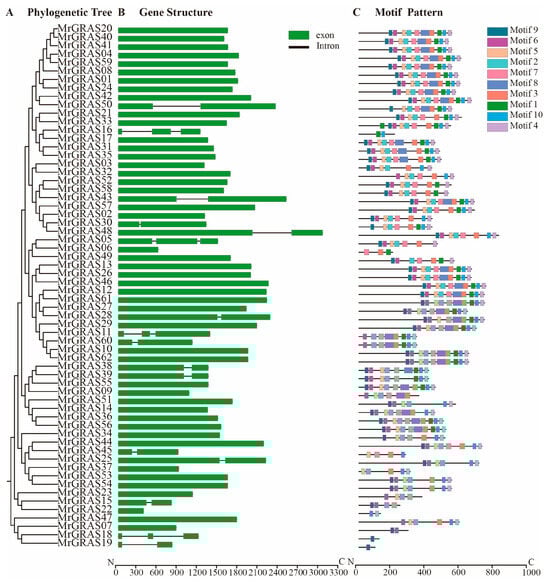
Figure 2.
Gene architecture, conserved motifs, and phylogenetic linkages: (A) MrGRAS gene phylogenetic relationships. The NJ method was used to generate the phylogenetic tree; (B) MrGRAS gene structures. Exon and intron are shown by the green boxes and black lines, respectively; (C) MrGRAS protein motif patterns. Colored boxes stand for various motifs.
3.3. Prediction of the Three-Dimensional Structure and Secondary Structure Analysis of MrGRAS Protein
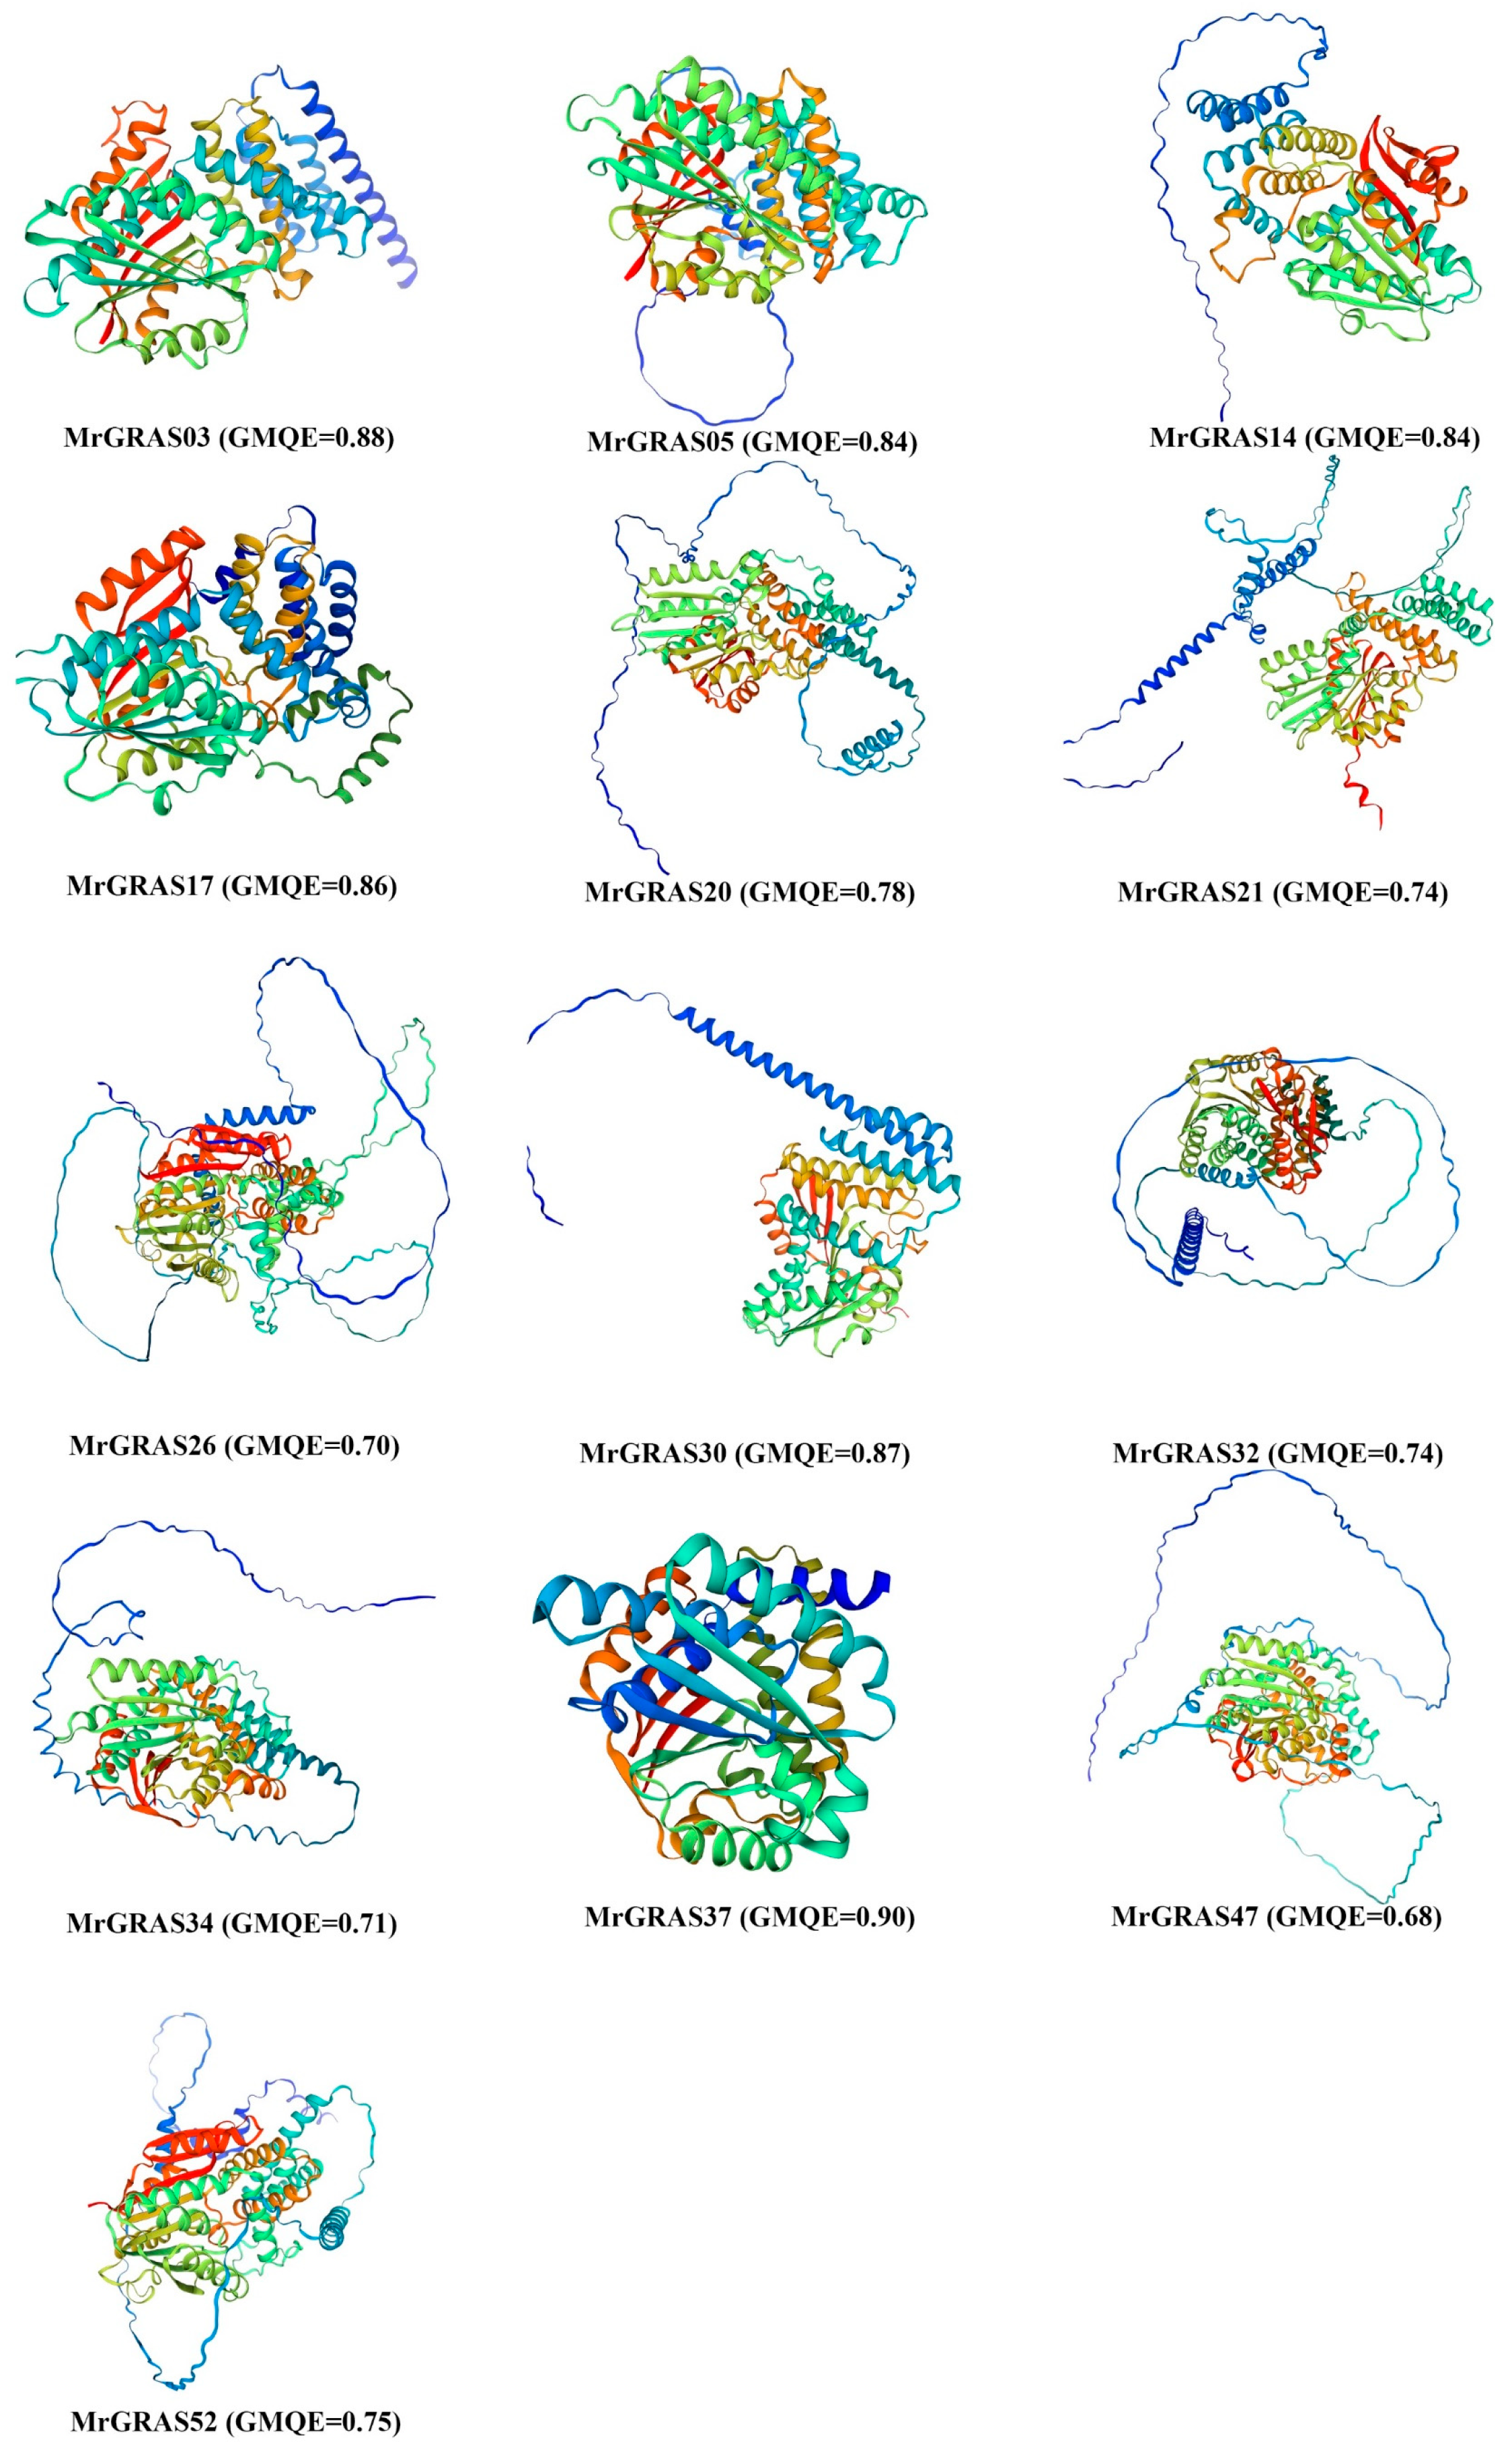
Understanding the three-dimensional structure of proteins is vital for unraveling their functions, and operational mechanisms in biological research. Protein three-dimensional structures generated using the Swiss Model were of good quality based on the GMQE score, which exceeded 0.7 (Figure 3). Upon delving into the prediction of secondary structures for all the MrGRAS proteins (refer to Table S3), it was revealed that random coil proteins comprised the largest proportion (ranging from 30.44% to 63.07%), trailed by α-helix structures (27.97–60.11%) and extended strand proteins (0.70–33.05%). The absence of β-turn protein structures was observed, aligning closely with the outcomes of the three-dimensional structure predictions. Additionally, we observed that the protein structures on the MrGRAS03, MrGRAS17, and MrGRAS37 branches exhibited similarities, suggesting that these proteins may have potential functional similarities.
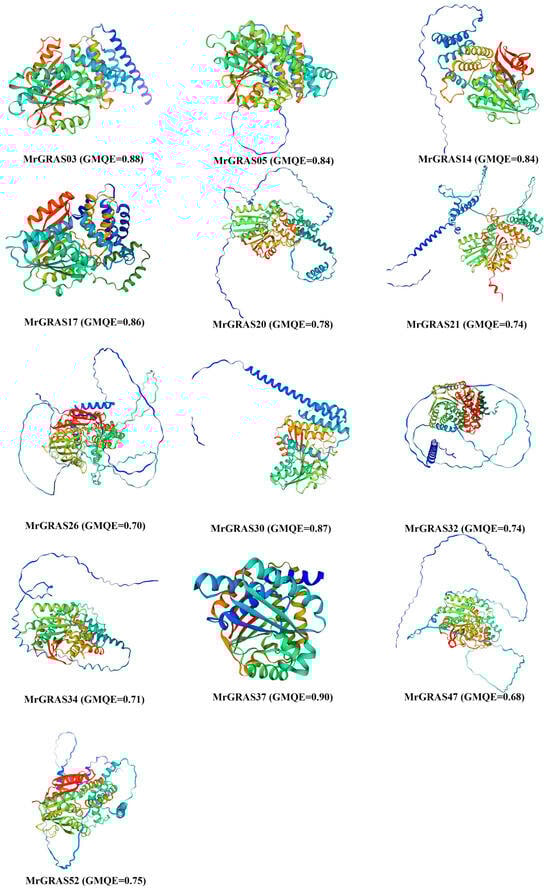
Figure 3.
The three-dimensional structure of the MrGRAS protein was predicted using homology modeling, and the model quality was evaluated using Global Model Quality Estimation (GMQE). The GMQE value ranges from 0 to 1, with values closer to 1 indicating a higher quality of the predicted model.
3.4. Promoter Cis-Regulatory Elements Analysis
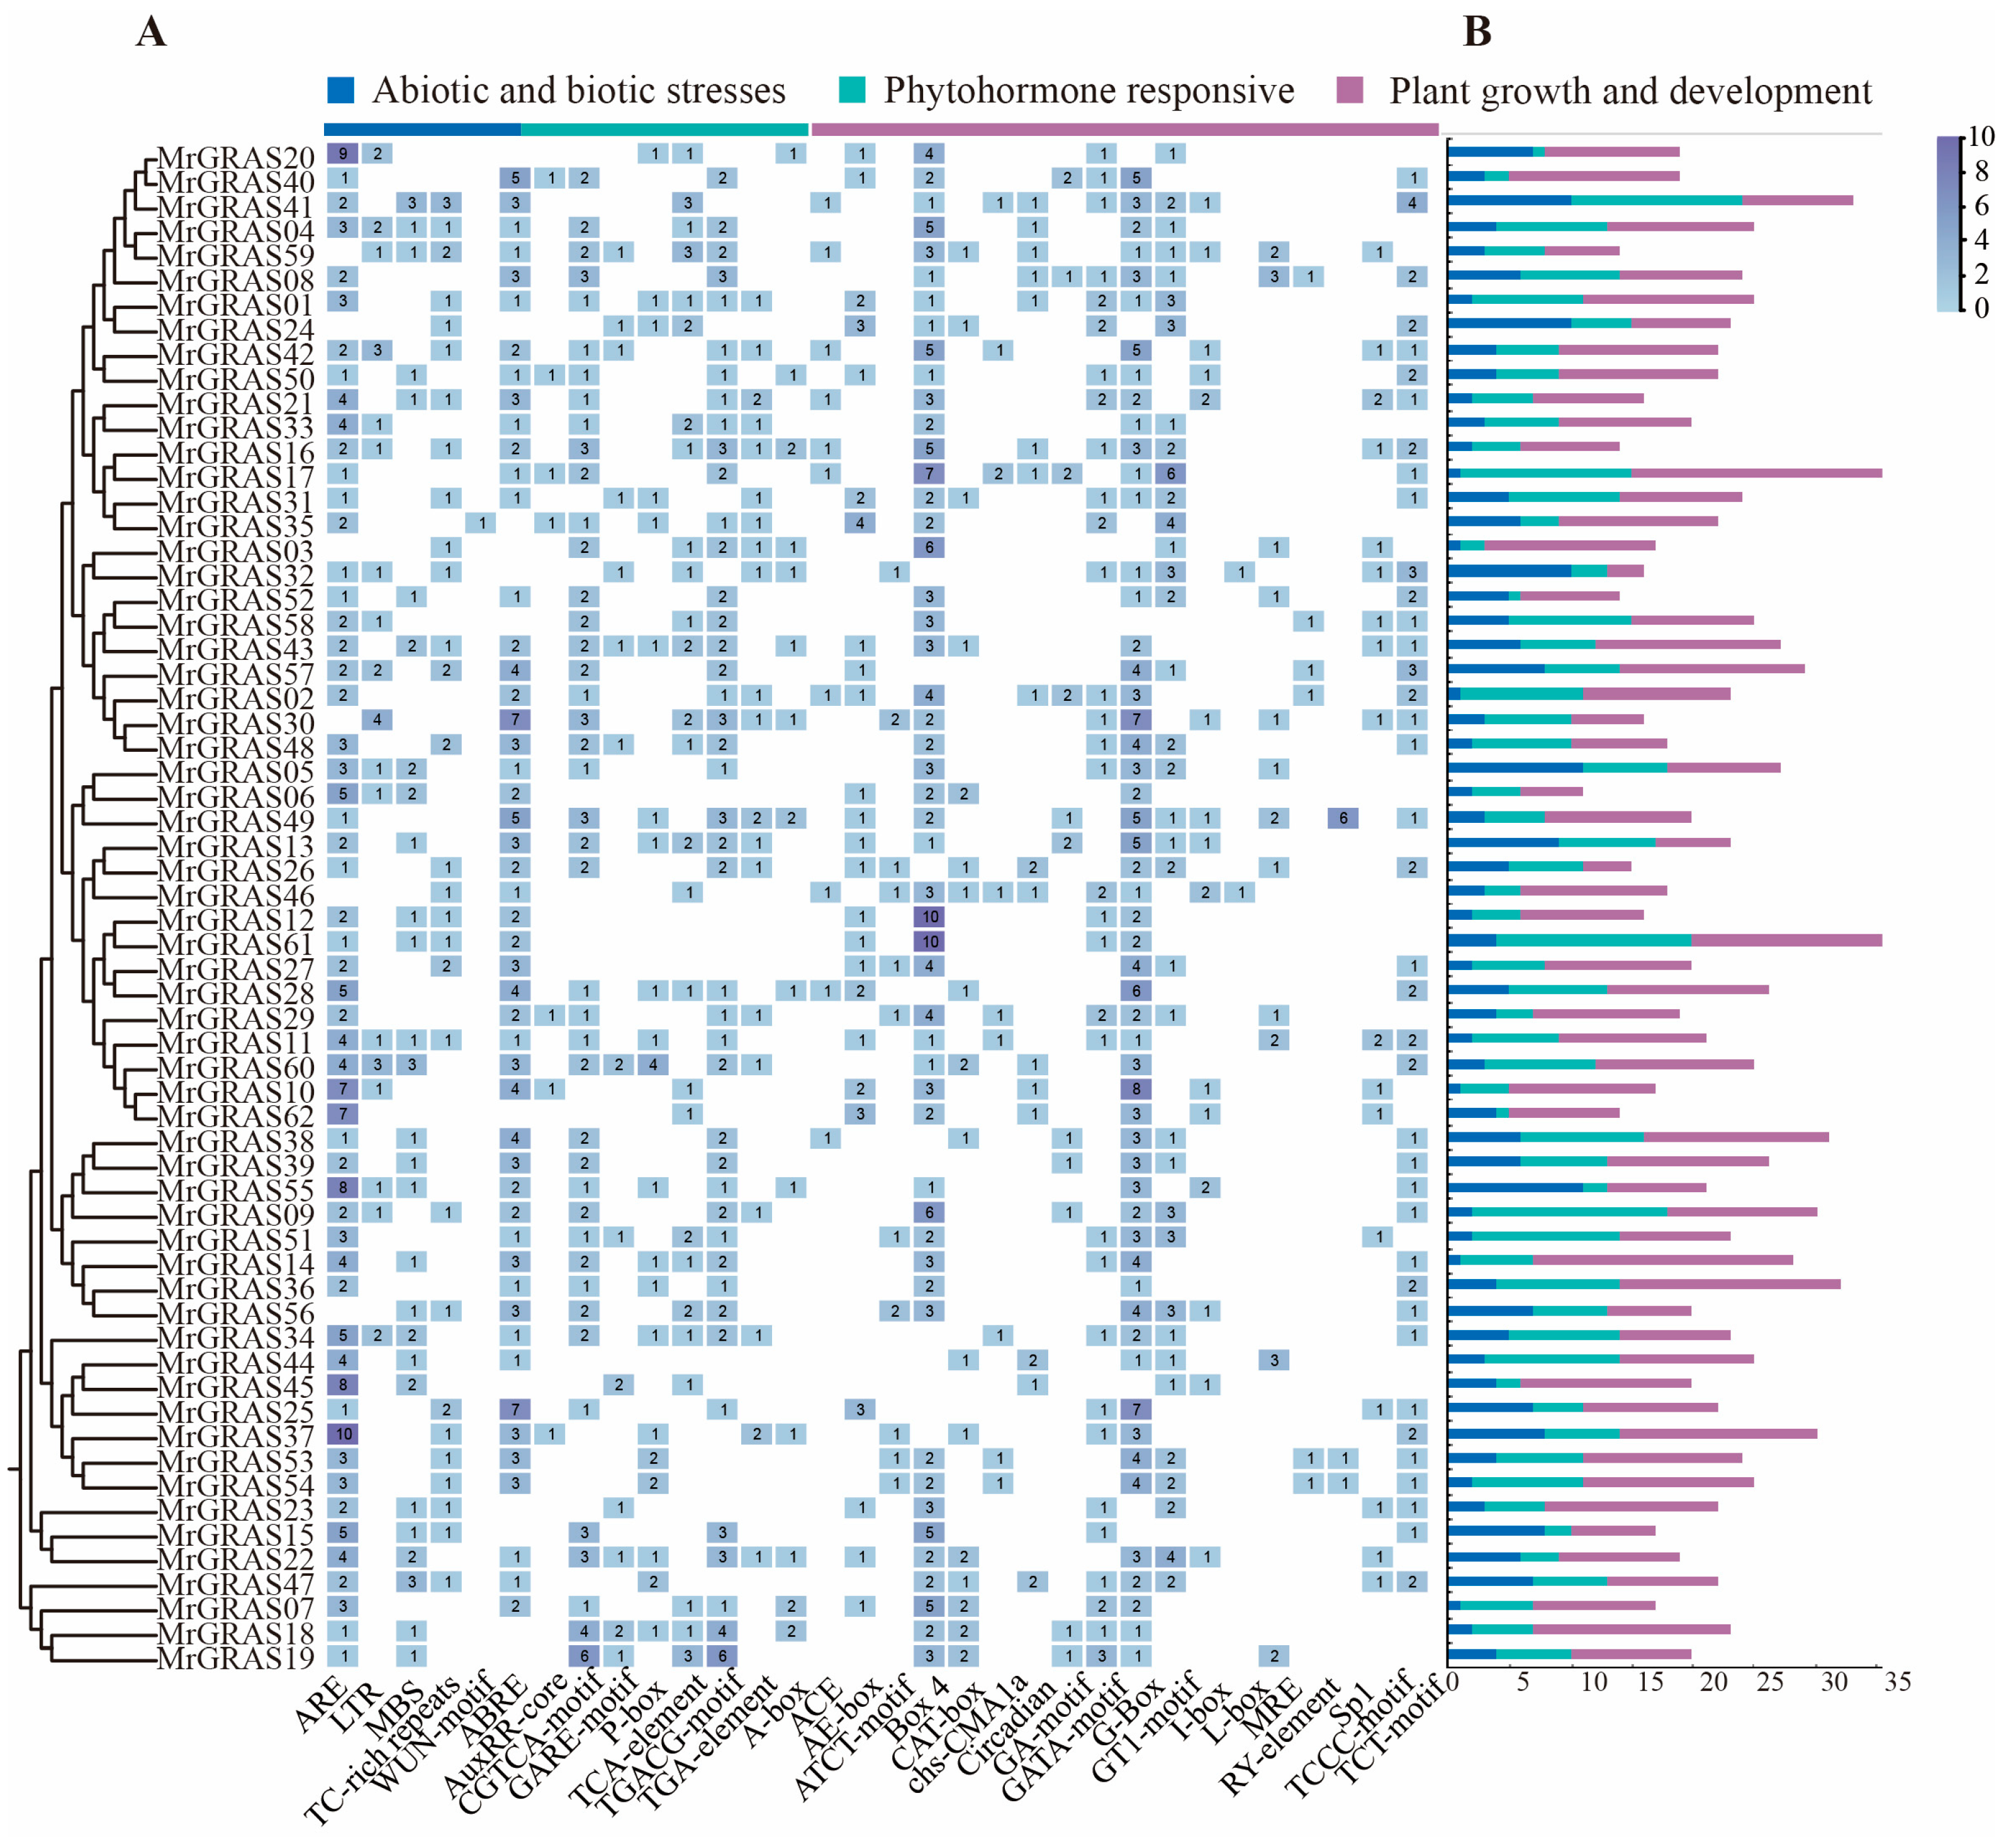
To investigate whether the MrGRAS genes participate in plant growth and development, hormone, and stress responses, we performed an analysis of the cis-regulatory elements within the 2000 bp upstream regions of the MrGRAS genes using PlantCARE (Figure 4). Several cis-regulatory elements were identified through these sequences, which were classified into three main categories based on their functional annotations: plant growth and development, phytohormone responsive, and abiotic/biotic stress response. Notably, regulatory elements, such as MBS, ABRE, and LRE, are involved in drought induction, stress responses and cold tolerance. Analysis revealed that 28 MrGRAS genes contain MBS elements, indicating their potential for drought response. Furthermore, the majority of MrGRAS genes contain multiple G-box, and Box-4, suggesting their significance in the regulation of gene transcription.
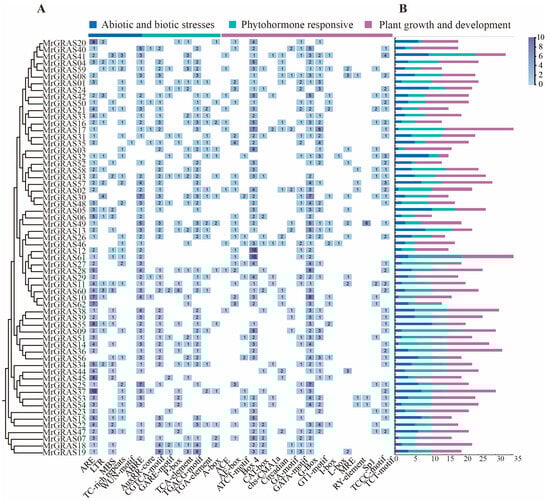
Figure 4.
Prediction of cis-acting elements in MrGRAS gene promoters: (A) the number of cis-regulatory elements in the 2000-bp upstream promoter region; (B) the number of plant hormone, plant growth, and stress response elements for each MrGRAS.
3.5. Chromosomal Distribution, Gene Duplication and Collinearity Analyses of MrGRAS Genes
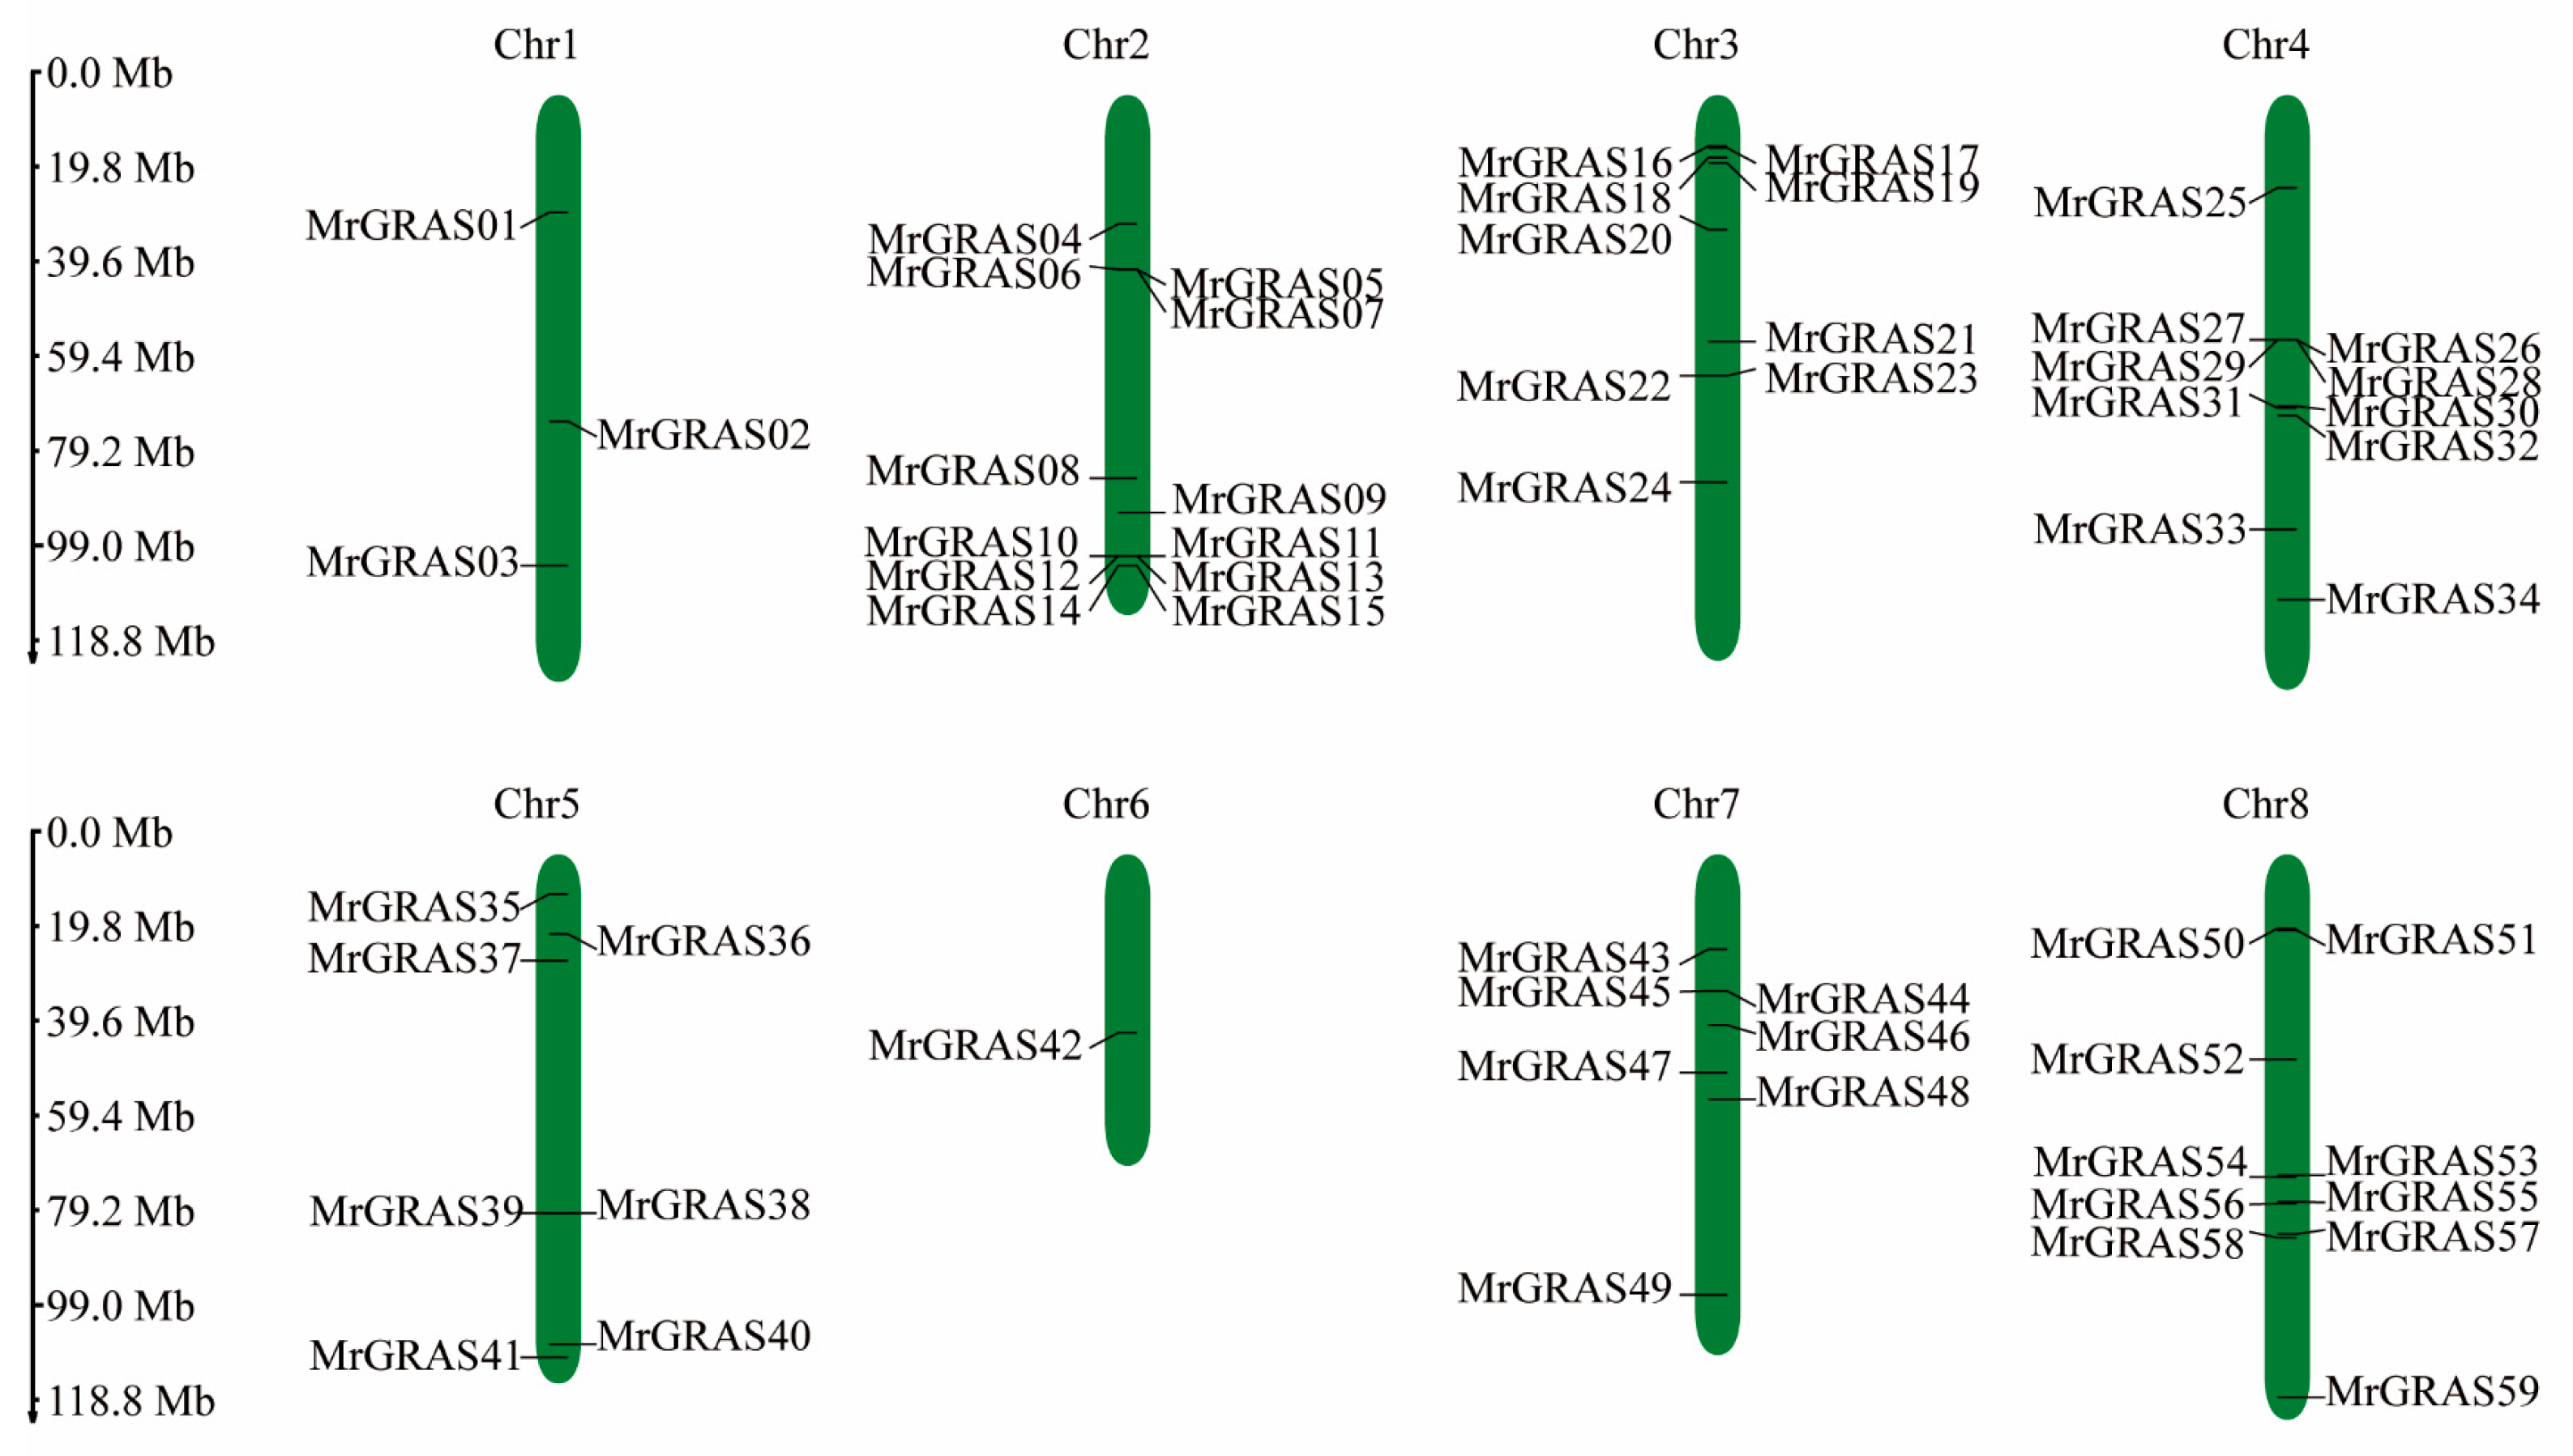
An analysis of gene distribution on the chromosomes revealed that 59 MrGRAS genes are distributed irregularly on the eight chromosomes of M. ruthenica (Figure 5), with 12, 9, 10 and 3 MrGRAS genes located on chromosomes Chr2, Chr4, Chr3, and Chr1, respectively. Additionally, seven MrGRAS genes are situated on chromosomes Chr5 and Chr7, while only one MrGRAS gene is found on chromosome Chr6. Tandem genes were identified on chromosomes Chr2, Chr3, Chr4, and Chr8.
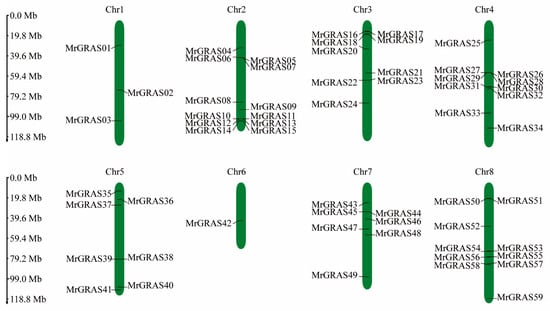
Figure 5.
The positions and distribution of the 59 members of the MrGRAS gene family across the eight chromosomes of M. ruthenica are shown. The chromosomes are depicted by the green bars, with the left scale indicating the chromosome lengths. Black lines mark the locations of each MrGRAS gene on the chromosomes.
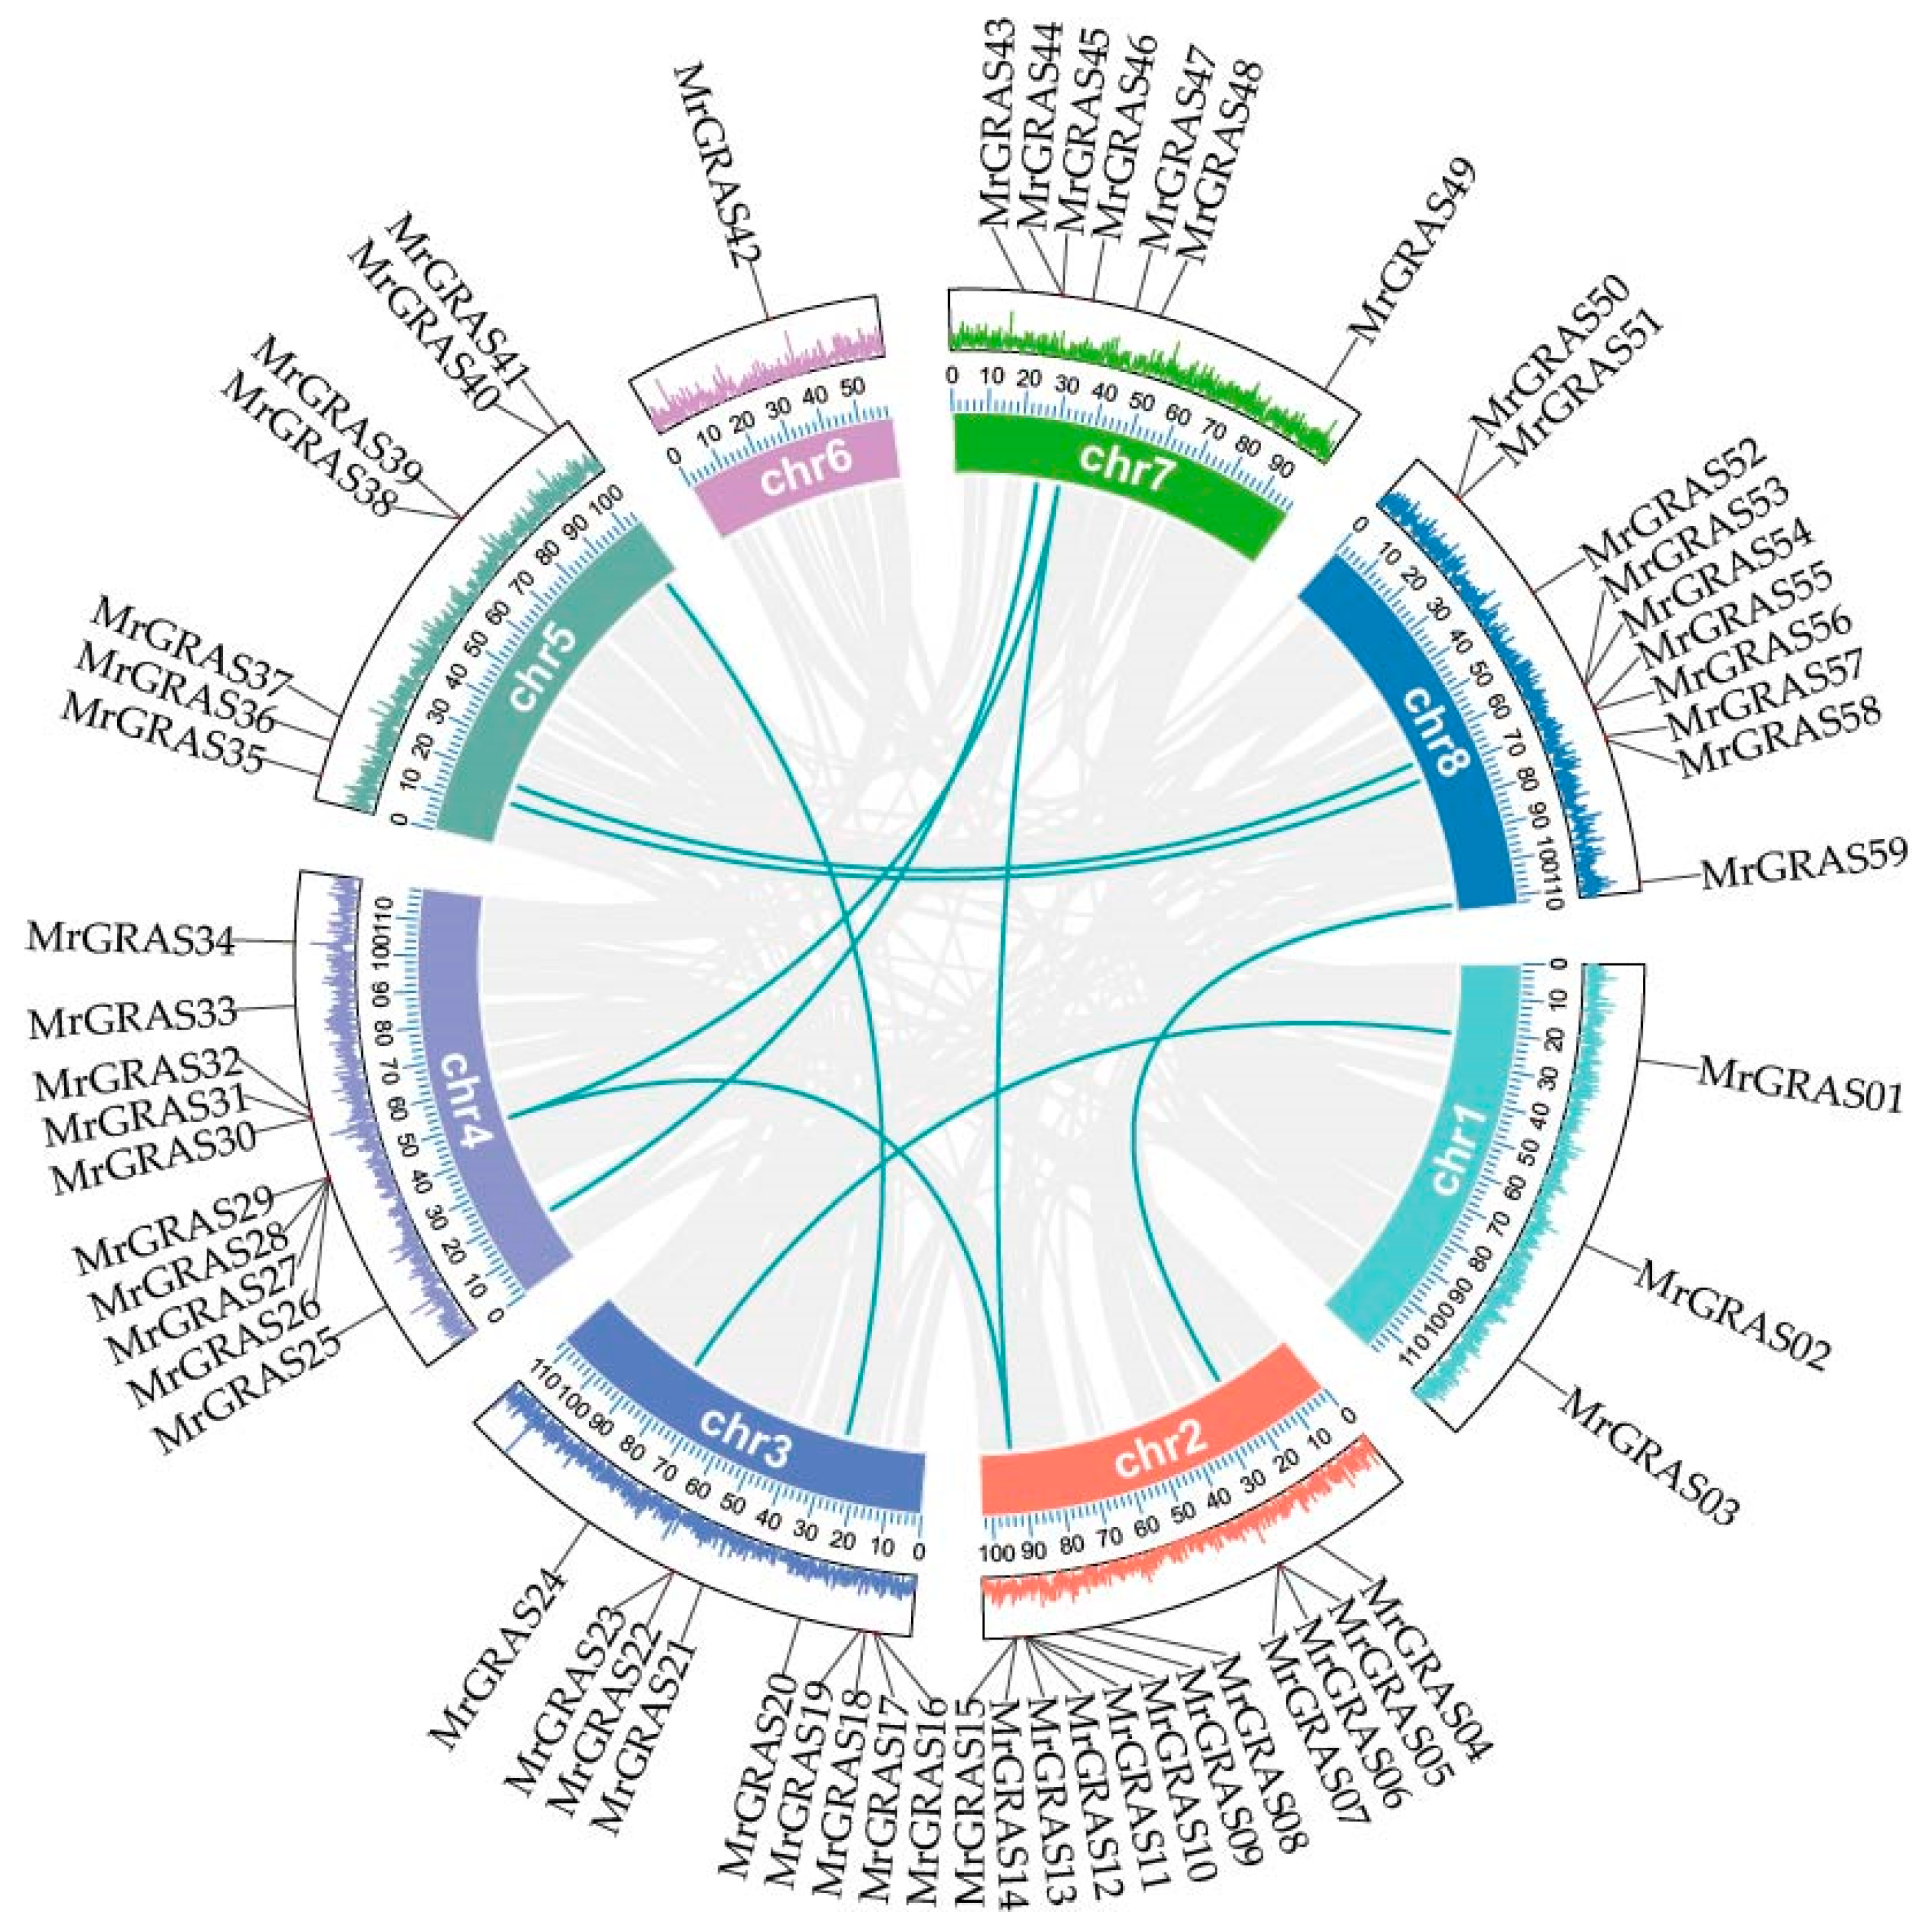
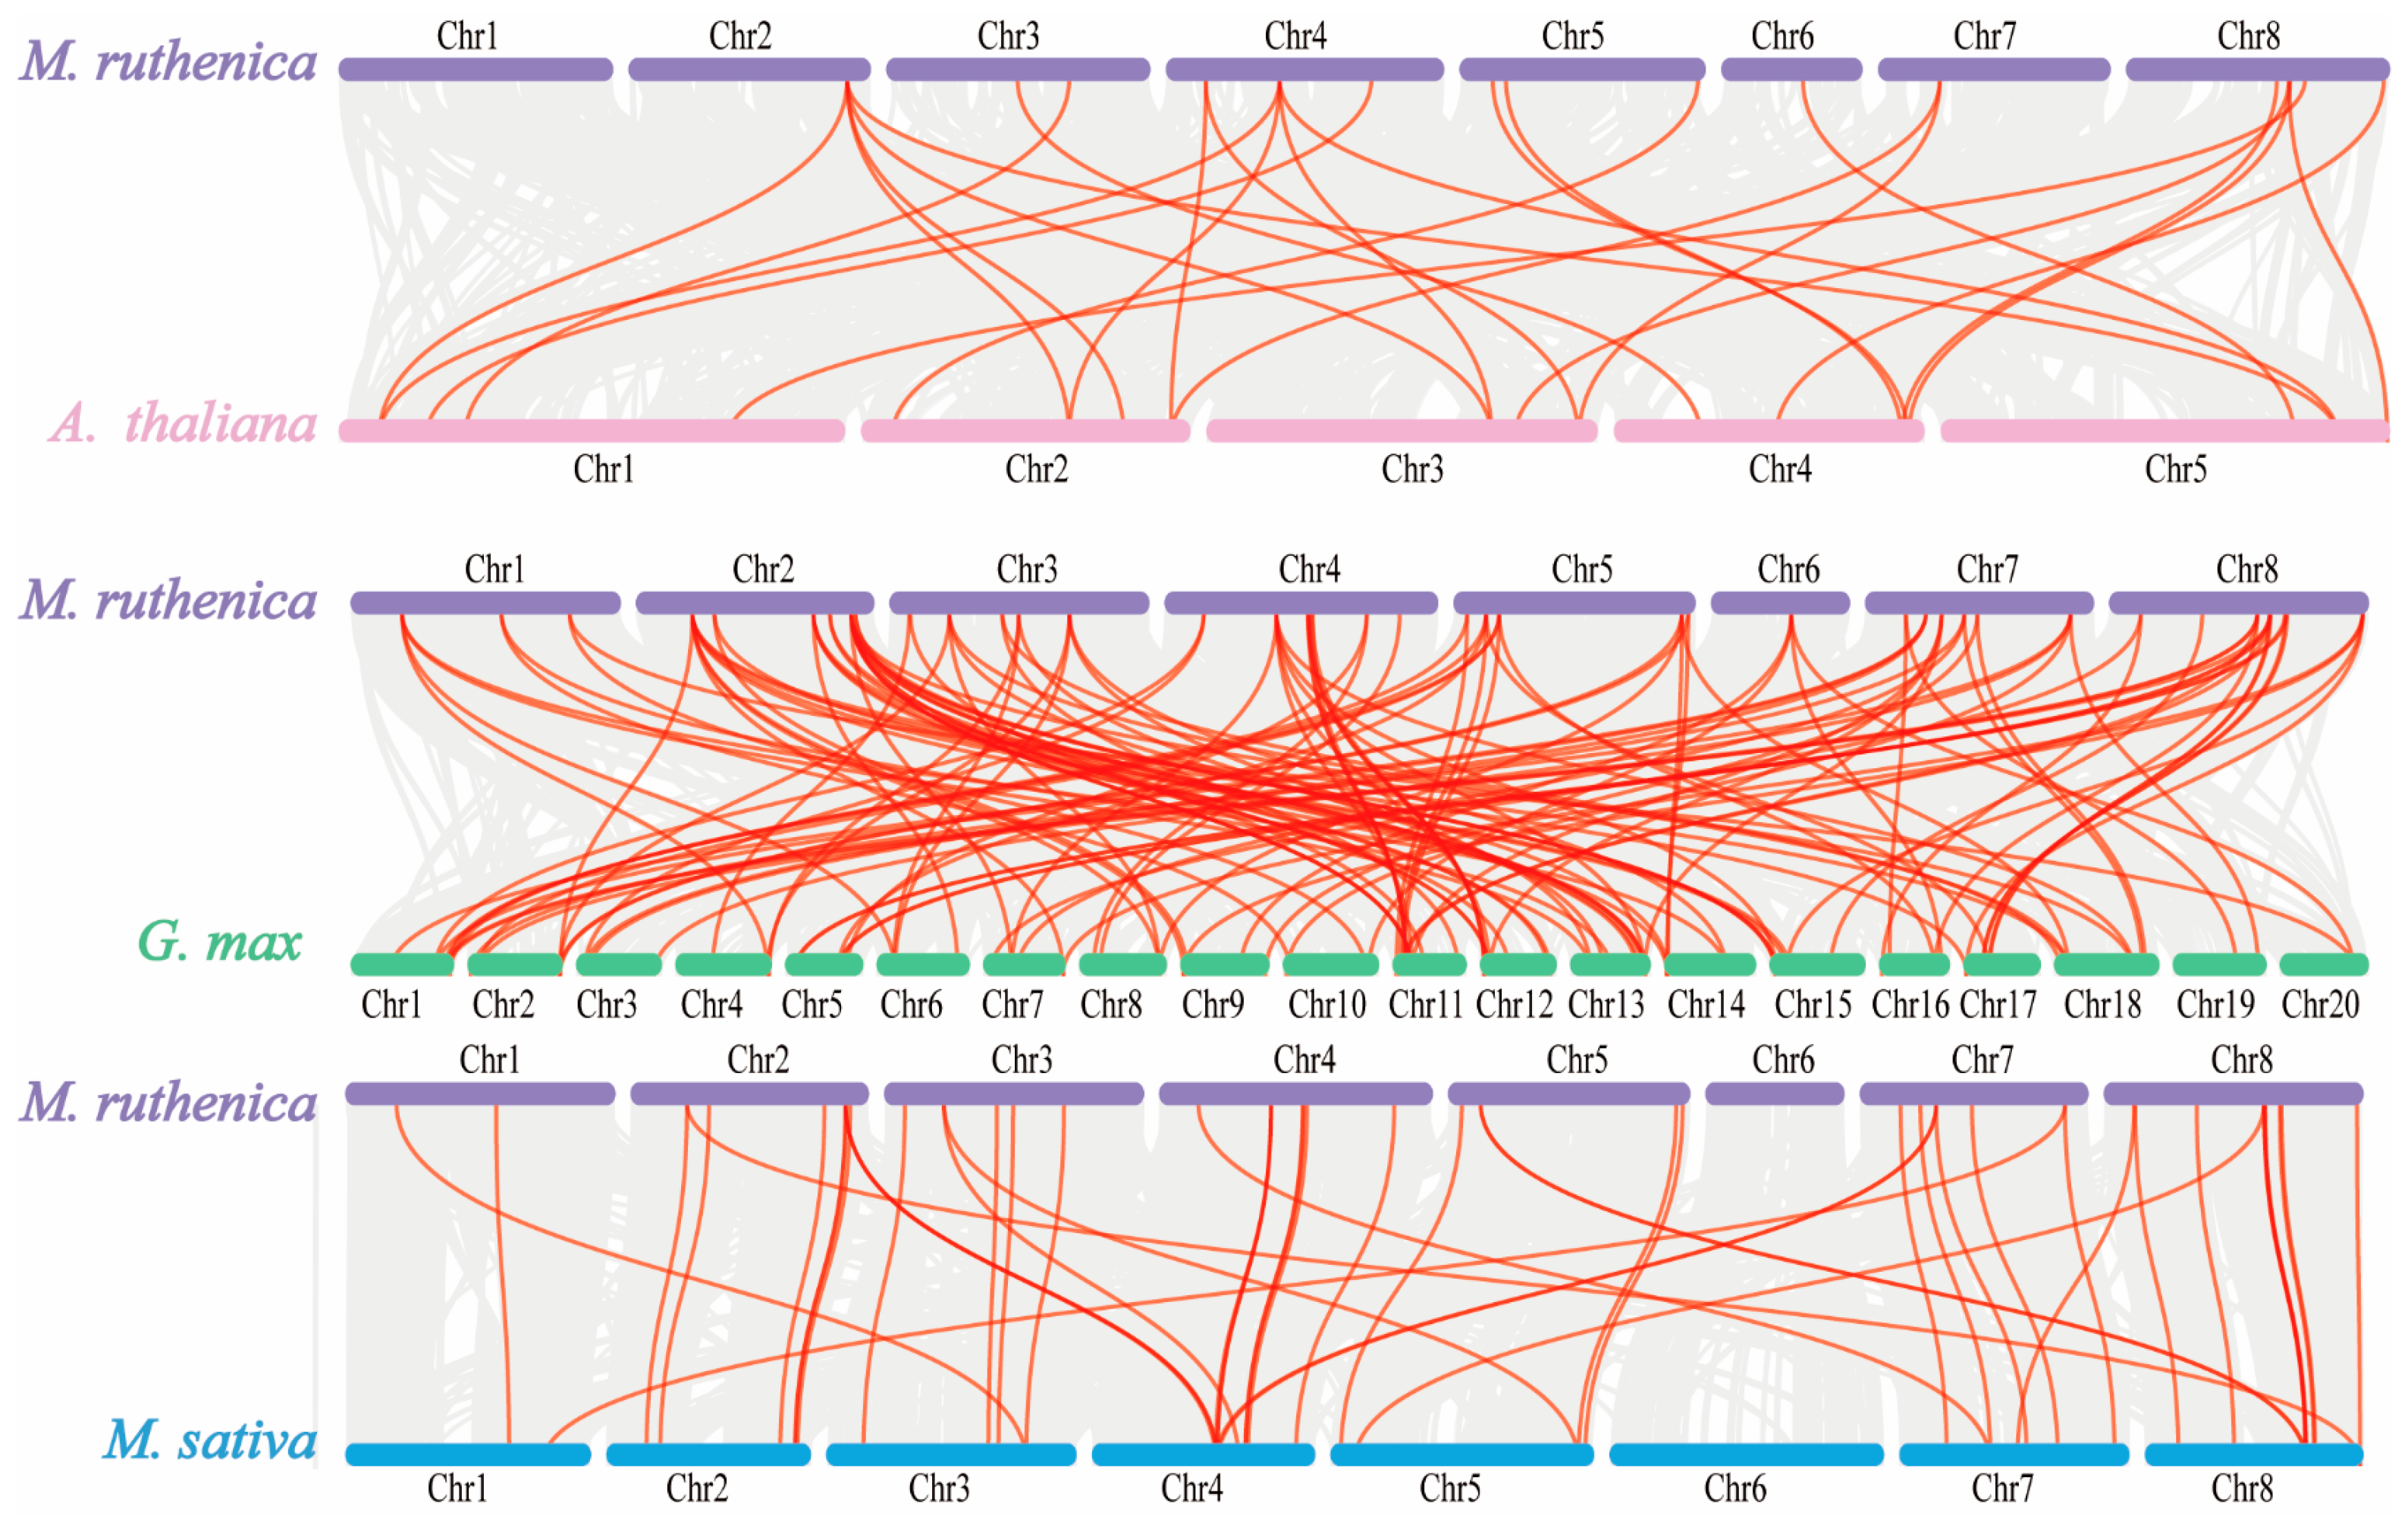
To identify gene duplication events, we performed collinearity analysis among these 59 MrGRAS genes. In our study, 10 pairs of segmental duplications in MrGRAS genes (MrGRAS1/MrGRAS24, MrGRAS10/MrGRAS26, MrGRAS10/MrGRAS46, MrGRAS4/MrGRAS59, MrGRAS10/MrGRAS62, MrGRAS20/MrGRAS40, MrGRAS25/MrGRAS44, MrGRAS26/MrGRAS46, MrGRAS36/MrGRAS56, and MrGRAS37/MrGRAS53) were identified. The results show that the MrGRAS gene family expansion in the M. ruthenica genome is primarily driven by segmental duplication events. To explore the potential evolutionary mechanisms underlying the MrGRAS gene family, we analyzed the collinearity relationships within the M. ruthenica species (Figure 6) and between M. ruthenica and other plants, including Arabidopsis, G. max, and M. sativa (Figure 7). The inter-species collinearity analysis reveals that the number of homologous events between MrGRAS and GmGRAS is significantly higher than those between MrGRAS and AtGRAS, MrGRAS and MsGRAS. This suggests a closer evolutionary relationship between M. ruthenica and G. max compared to M. ruthenica and the other three plant species (Arabidopsis and M. sativa).
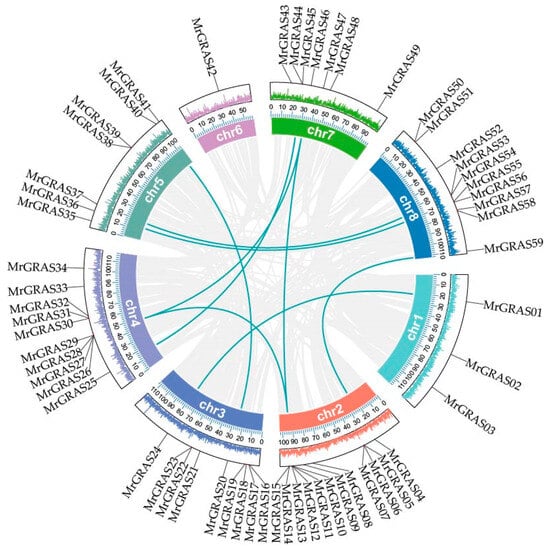
Figure 6.
The syntenic relationships of genes within the M. ruthenica. The grey lines in the background indicate all gene duplication events across the M. ruthenica genome, while the turquoise lines highlight segmental duplication events specific to GRAS genes. The outer circles, distinguished by different colors, illustrate the gene density distribution across the genome.
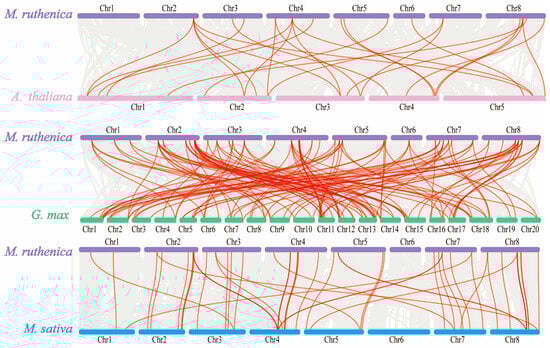
Figure 7.
Synteny analysis of GRAS genes between M. truncatula and three plant species, M. sativa, G. max and M. sativa. The gray lines in the background indicate all synteny blocks within the M. truncatula genome and the other genomes, and red lines indicate the duplicated GRAS gene pairs.
3.6. Expression Analysis of MrGRAS Genes Under Different Stress Conditions
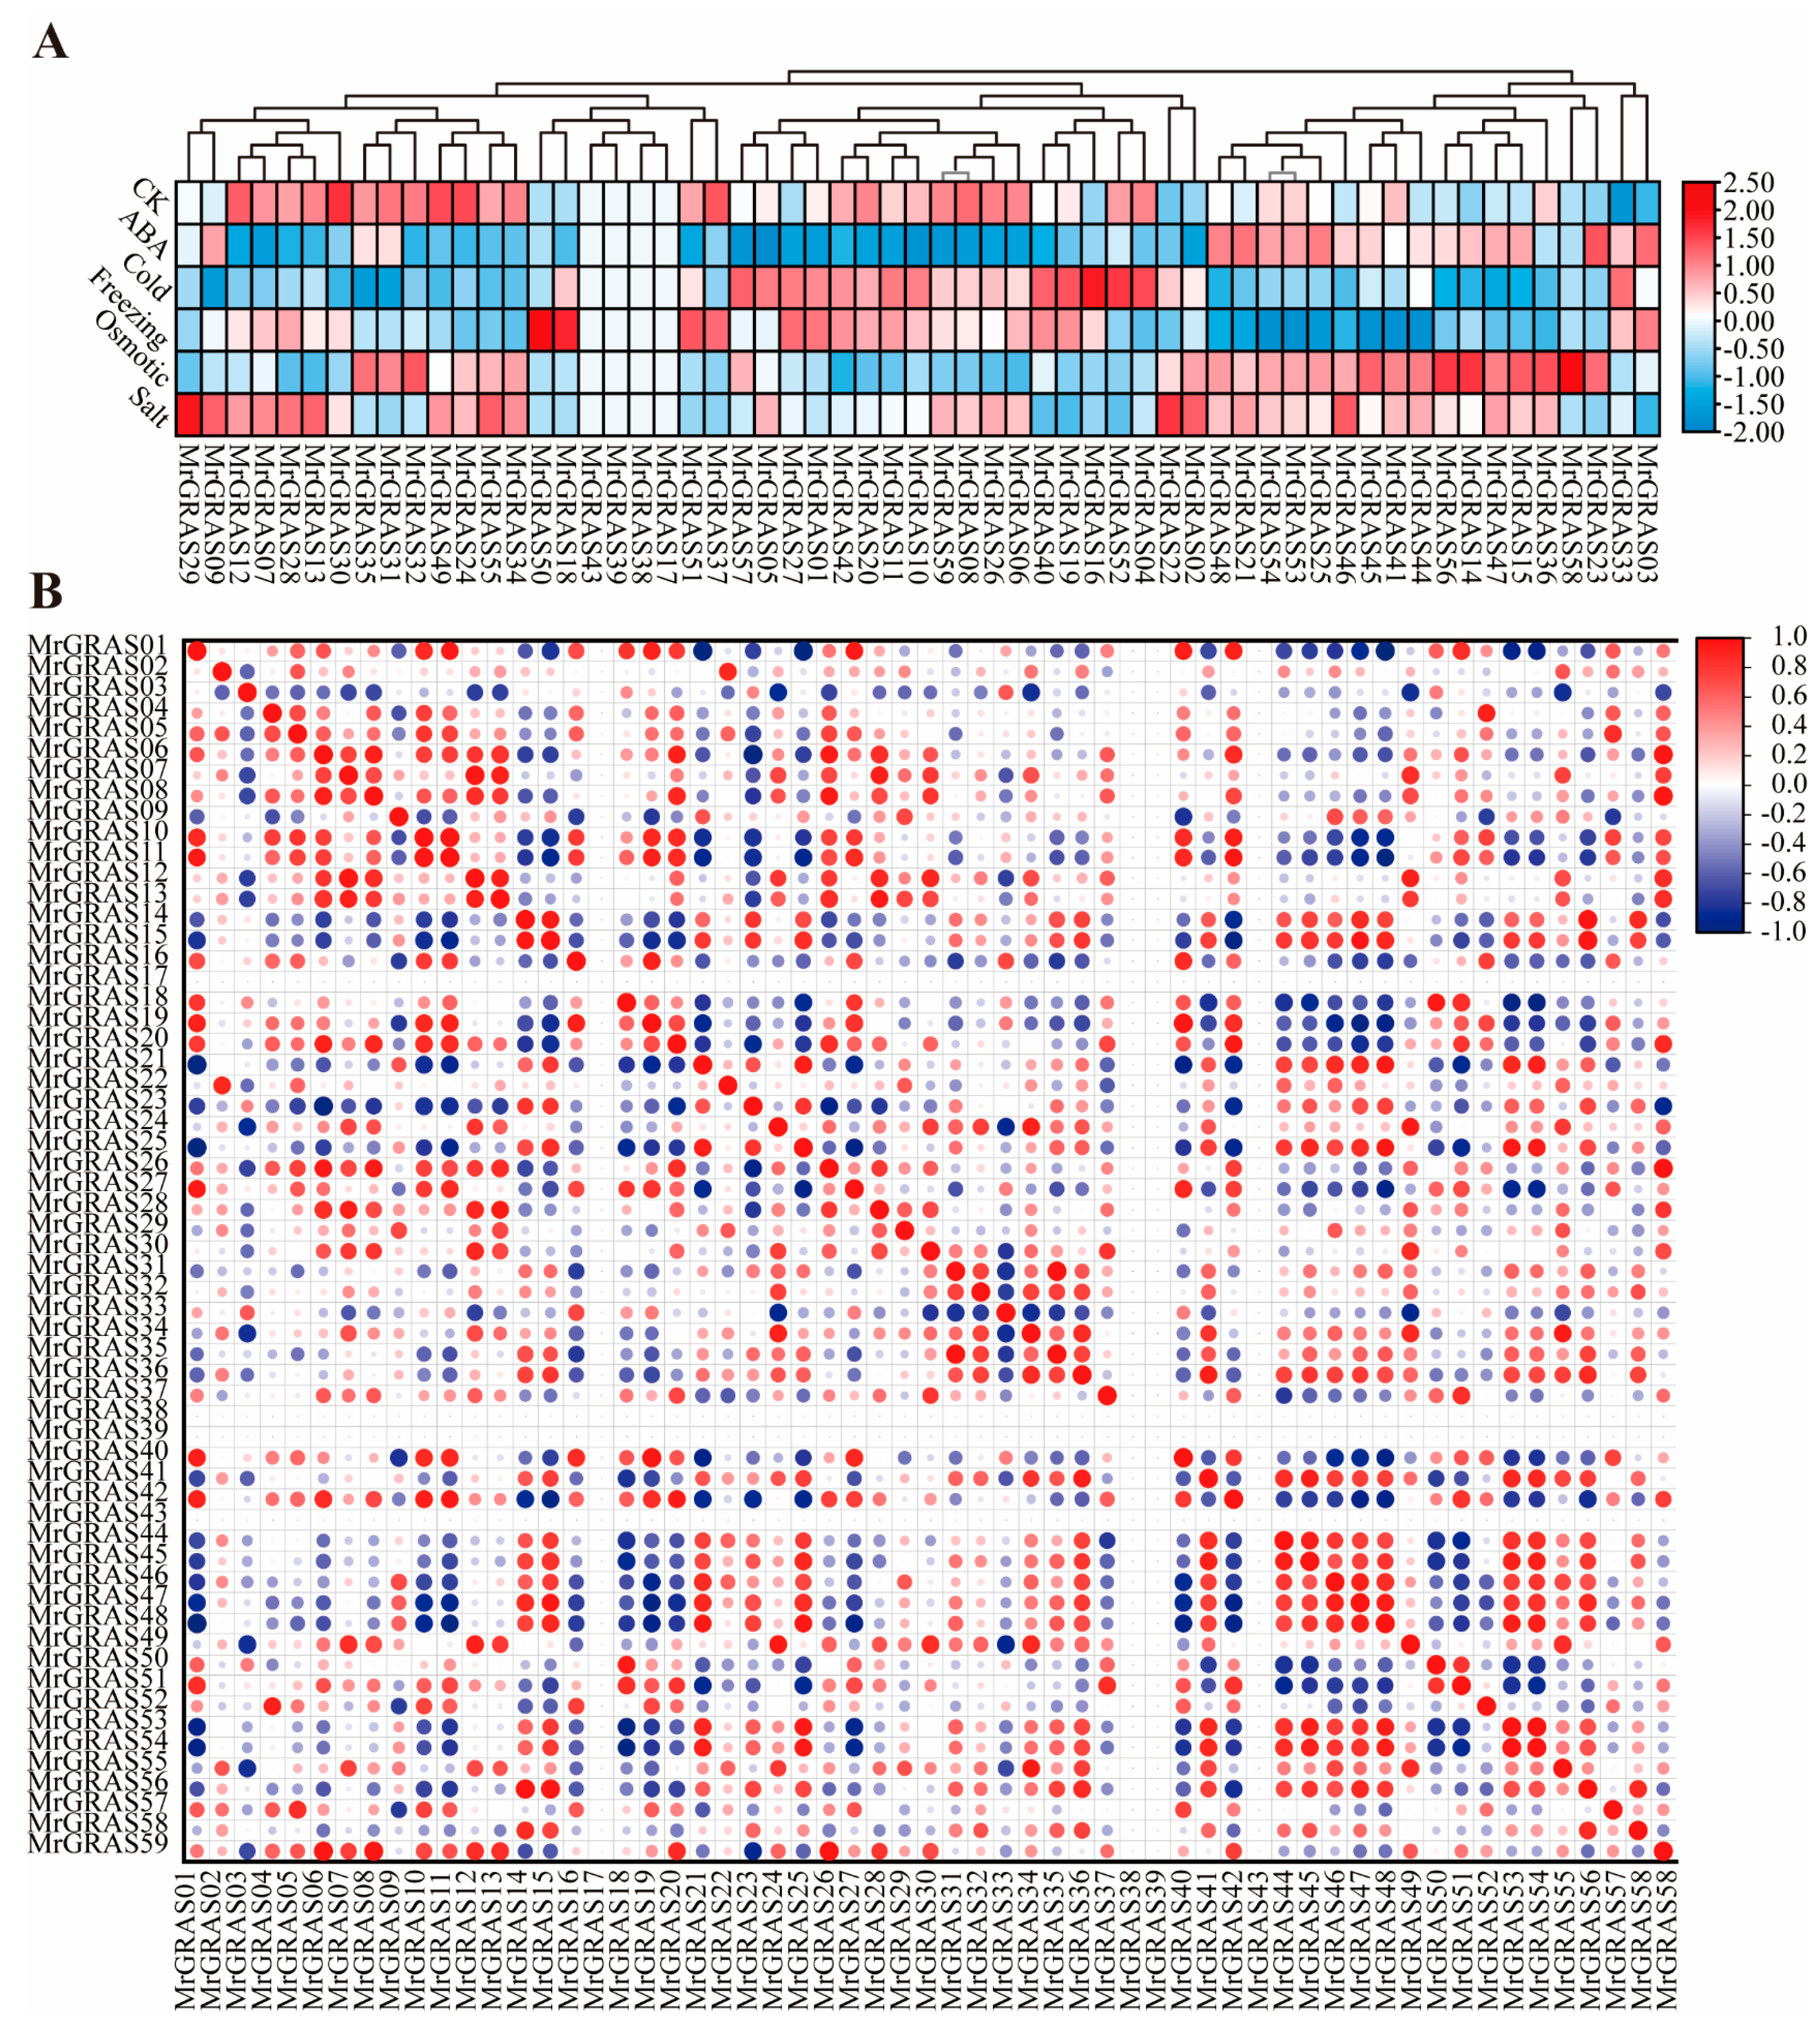
The GRAS gene family members possess the cis-elements associated with abiotic stresses. To understand the expression patterns of the MrGRAS gene family under different abiotic stress treatments, RNA-seq data [41] from six different treatments, including ABA phytohormone treatment, cold, freezing, osmotic, salt, and drought stress. The FPKM method was used to compare the expression levels of each gene. Among the 62 GRAS genes in M. ruthenica, the transcript levels of 59 genes could be determined in each tissue sample whereas expression of the other three genes (MrGRAS60, MrGRAS61, MrGRAS62) was not detected in the RNA-seq data, possibly due to lack of expression or temporal-spatial patterns. It was observed that under low temperature, ABA, and cold stress treatments, the expression level of most genes decreased, while under salt and osmotic stress treatments, the expression pattern of most genes increased. Except for MrGRAS17, MrGRAS38, MrGRAS39, and MrGRAS43, the remaining MrGRAS genes were induced to varying extent under these five abiotic stresses analyzed (Figure 8A). The correlation analysis of gene expression patterns under five different stress conditions indicating approximately 35% of MrGRAS genes exhibited a positive correlation in their expression patterns, while 8% showed a negative correlation, most of MrGRAS genes show no correlation (Figure 8B).

Figure 8.
Expression analysis of M. ruthenica GRAS genes in six different treatments, including ABA phytohormone treatment, cold, freezing, osmotic, and salt stress: (A) heatmap illustrating the differential expression of MrGRAS genes under these five abiotic stresses. The values are depicted after logarithmic conversions. Shades of red and blue indicate high and low expressions of MrGRAS genes, respectively; (B) Correlation analysis of the average gene expression levels under five different stress conditions. The correlations are visualized with red and blue colors, representing positive and negative correlations.
3.7. Expression Analysis of GRAS Genes Under Increasing Drought Stress
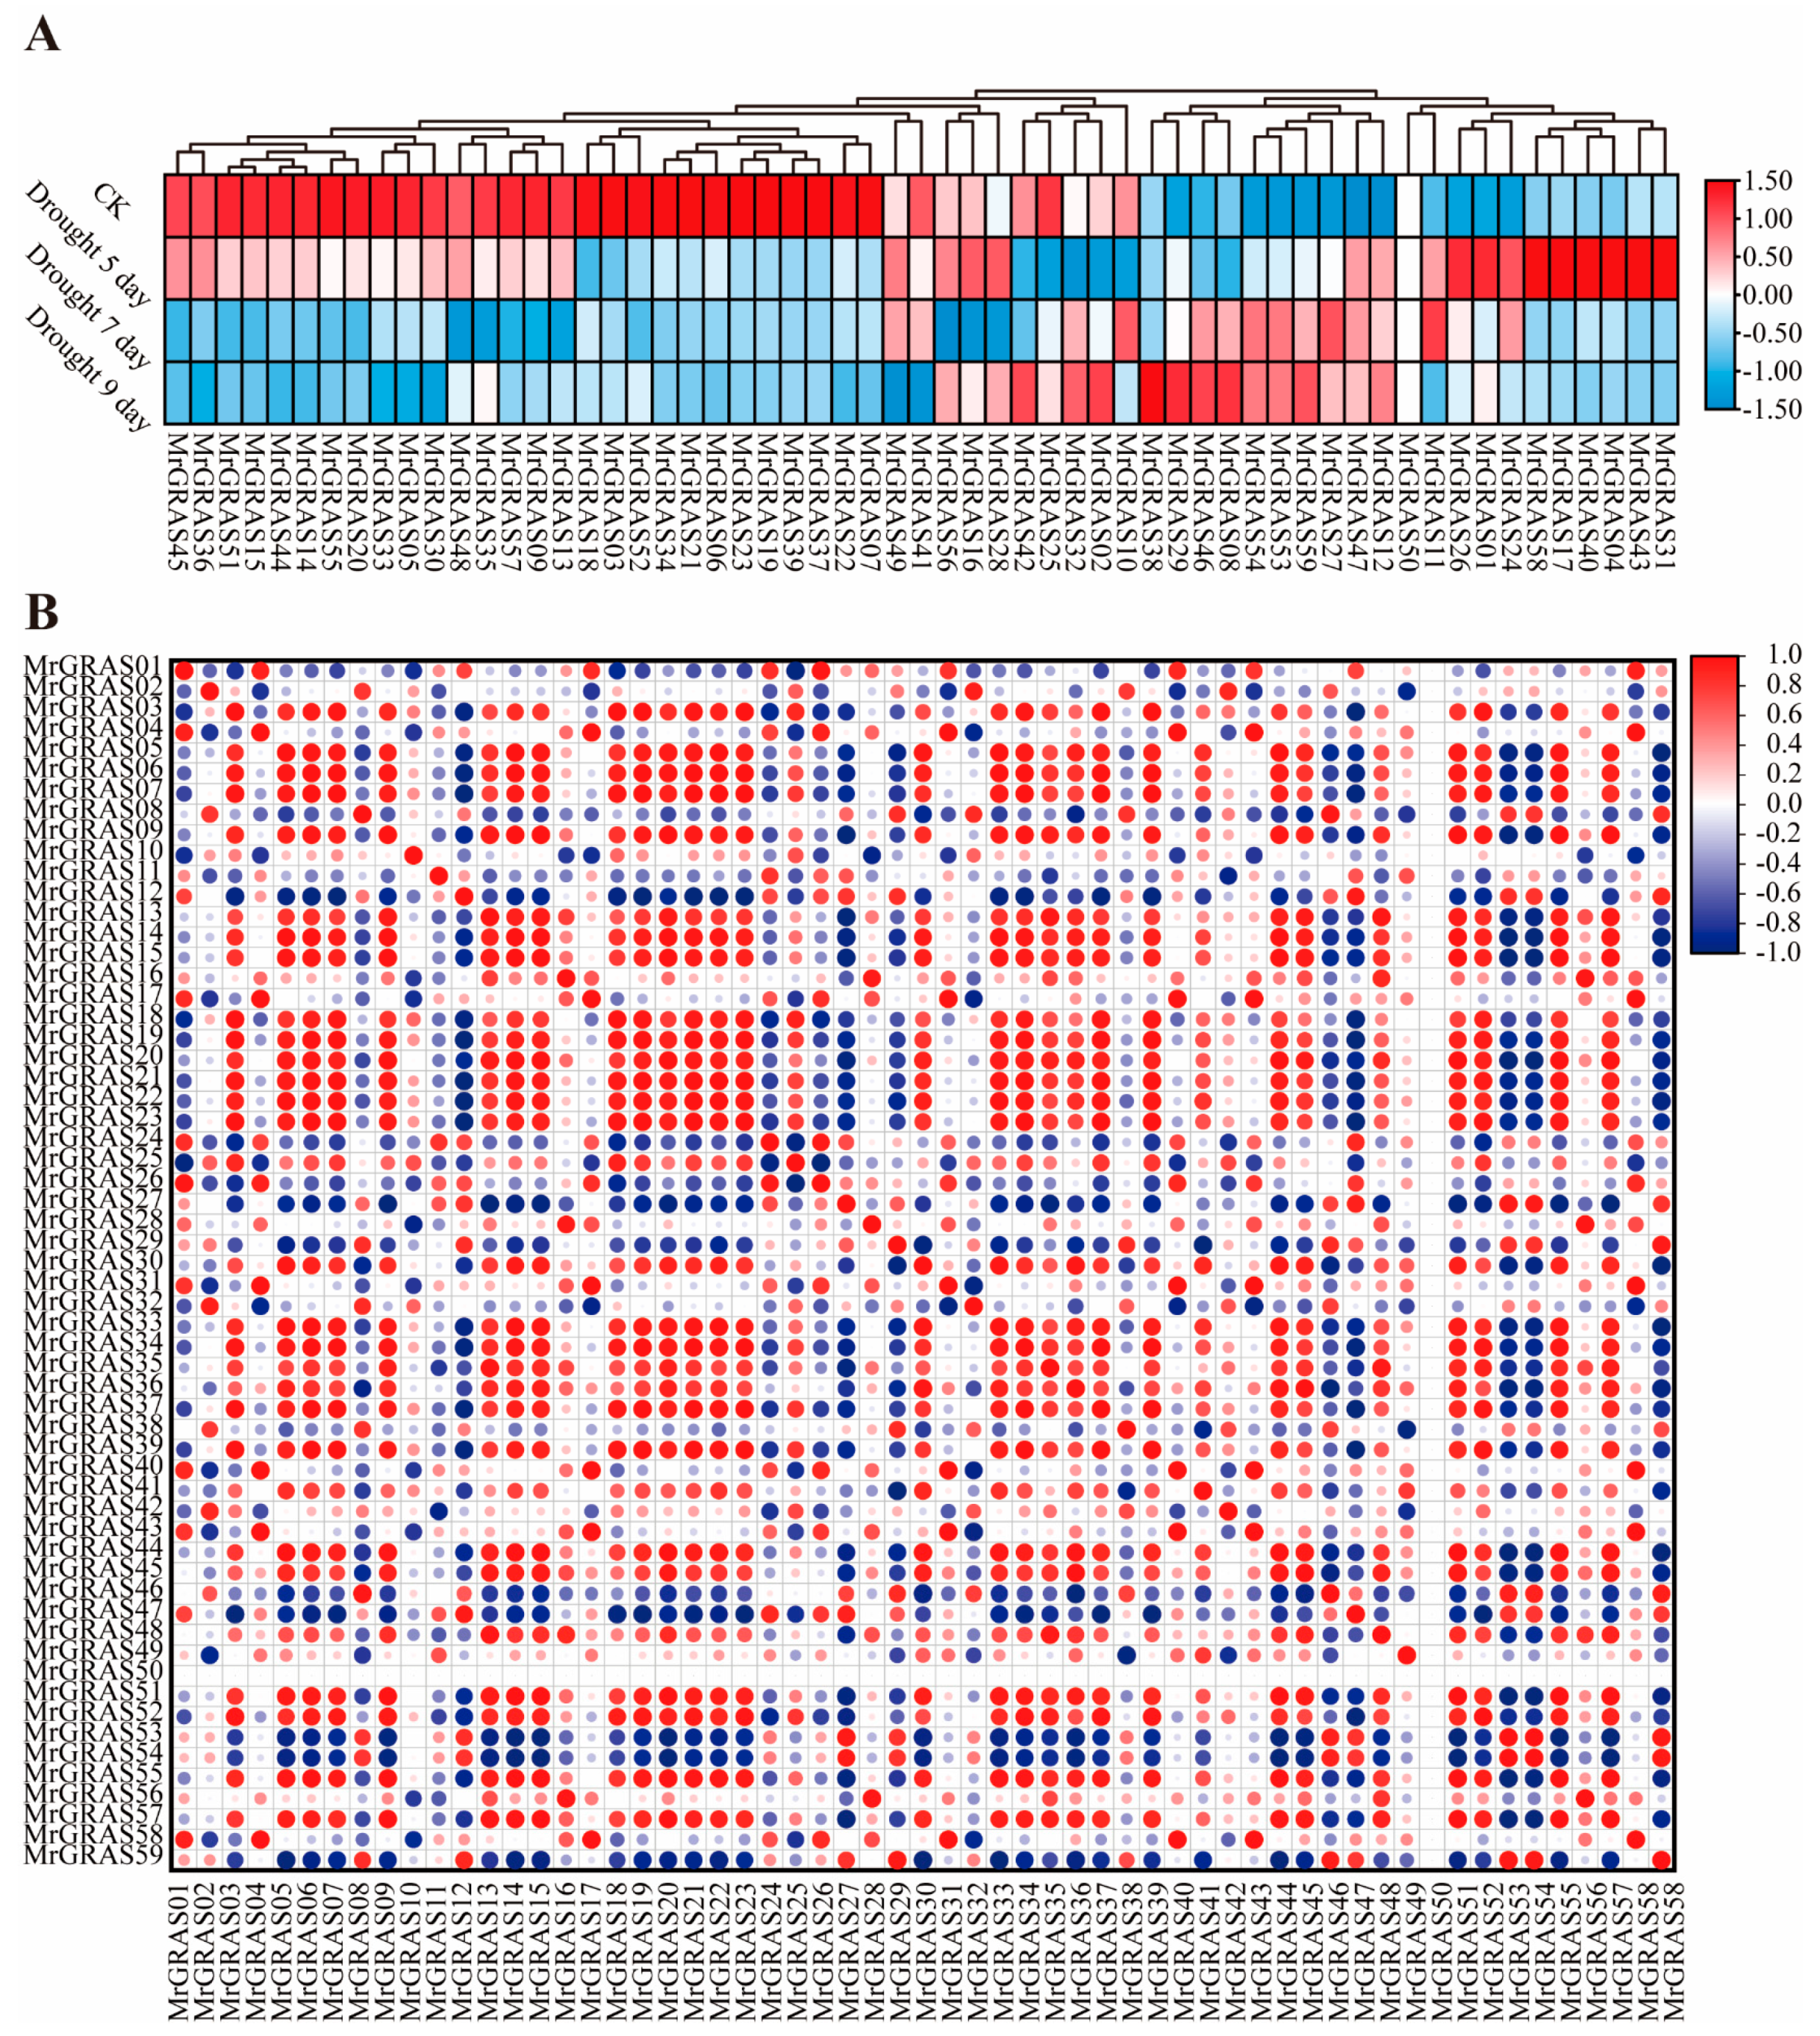
The expression patterns of MrGRAS genes were also investigated in depth, under mannitol treatment. The expression patterns of the 62 MrGRAS genes varied under drought stress and can be broadly categorized into two types; half of the genes showed a decreasing trend in expression levels with increased duration of stress, implying their roles as potential negative regulators of drought stress response. In particular, MrGRAS05, MrGRAS22, MrGRAS30, MrGRAS33, and MrGRAS36 exhibited the most significant down-regulation. In contrast, 10 MrGRAS genes exhibited a significant up-regulation under drought stress, implying their roles as positive regulators. The most prominent up-regulation was observed in MrGRAS08, MrGRAS29, MrGRAS38, and MrGRAS46 (Figure 9A). The correlation analysis of gene expression patterns under four different drought conditions indicated that approximately 76.9% of MrGRAS genes exhibited a positive correlation in their expression patterns, while 19.5% showed a negative correlation (Figure 9B).
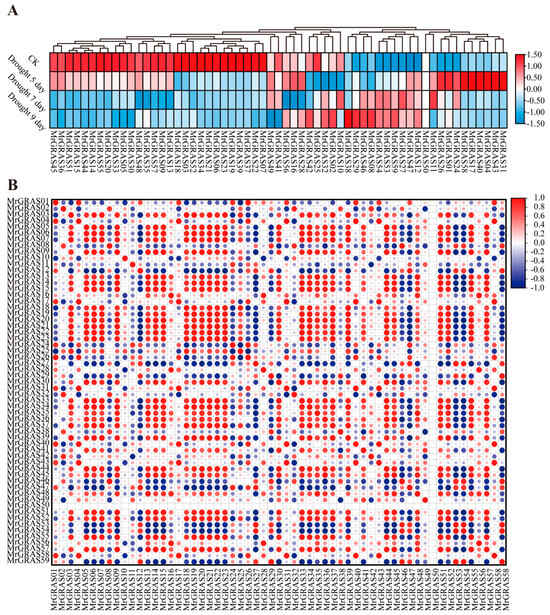
Figure 9.
Expression analysis of M. ruthenica GRAS genes under under 0, 5, 7, 9 d continuous mannitol treatment: (A) heatmap illustrating the differential expression of MrGRAS genes under these different mannitol treatments. The values are depicted after logarithmic conversions. Shades of red and blue indicate high and low expressions of MrGRAS genes, respectively; (B) the correlation heatmaps illustrate the expression patterns of the genes under four different drought stresses, positive correlations are represented in red, while negative correlations are shown in blue.
3.8. RT-qPCR Validation
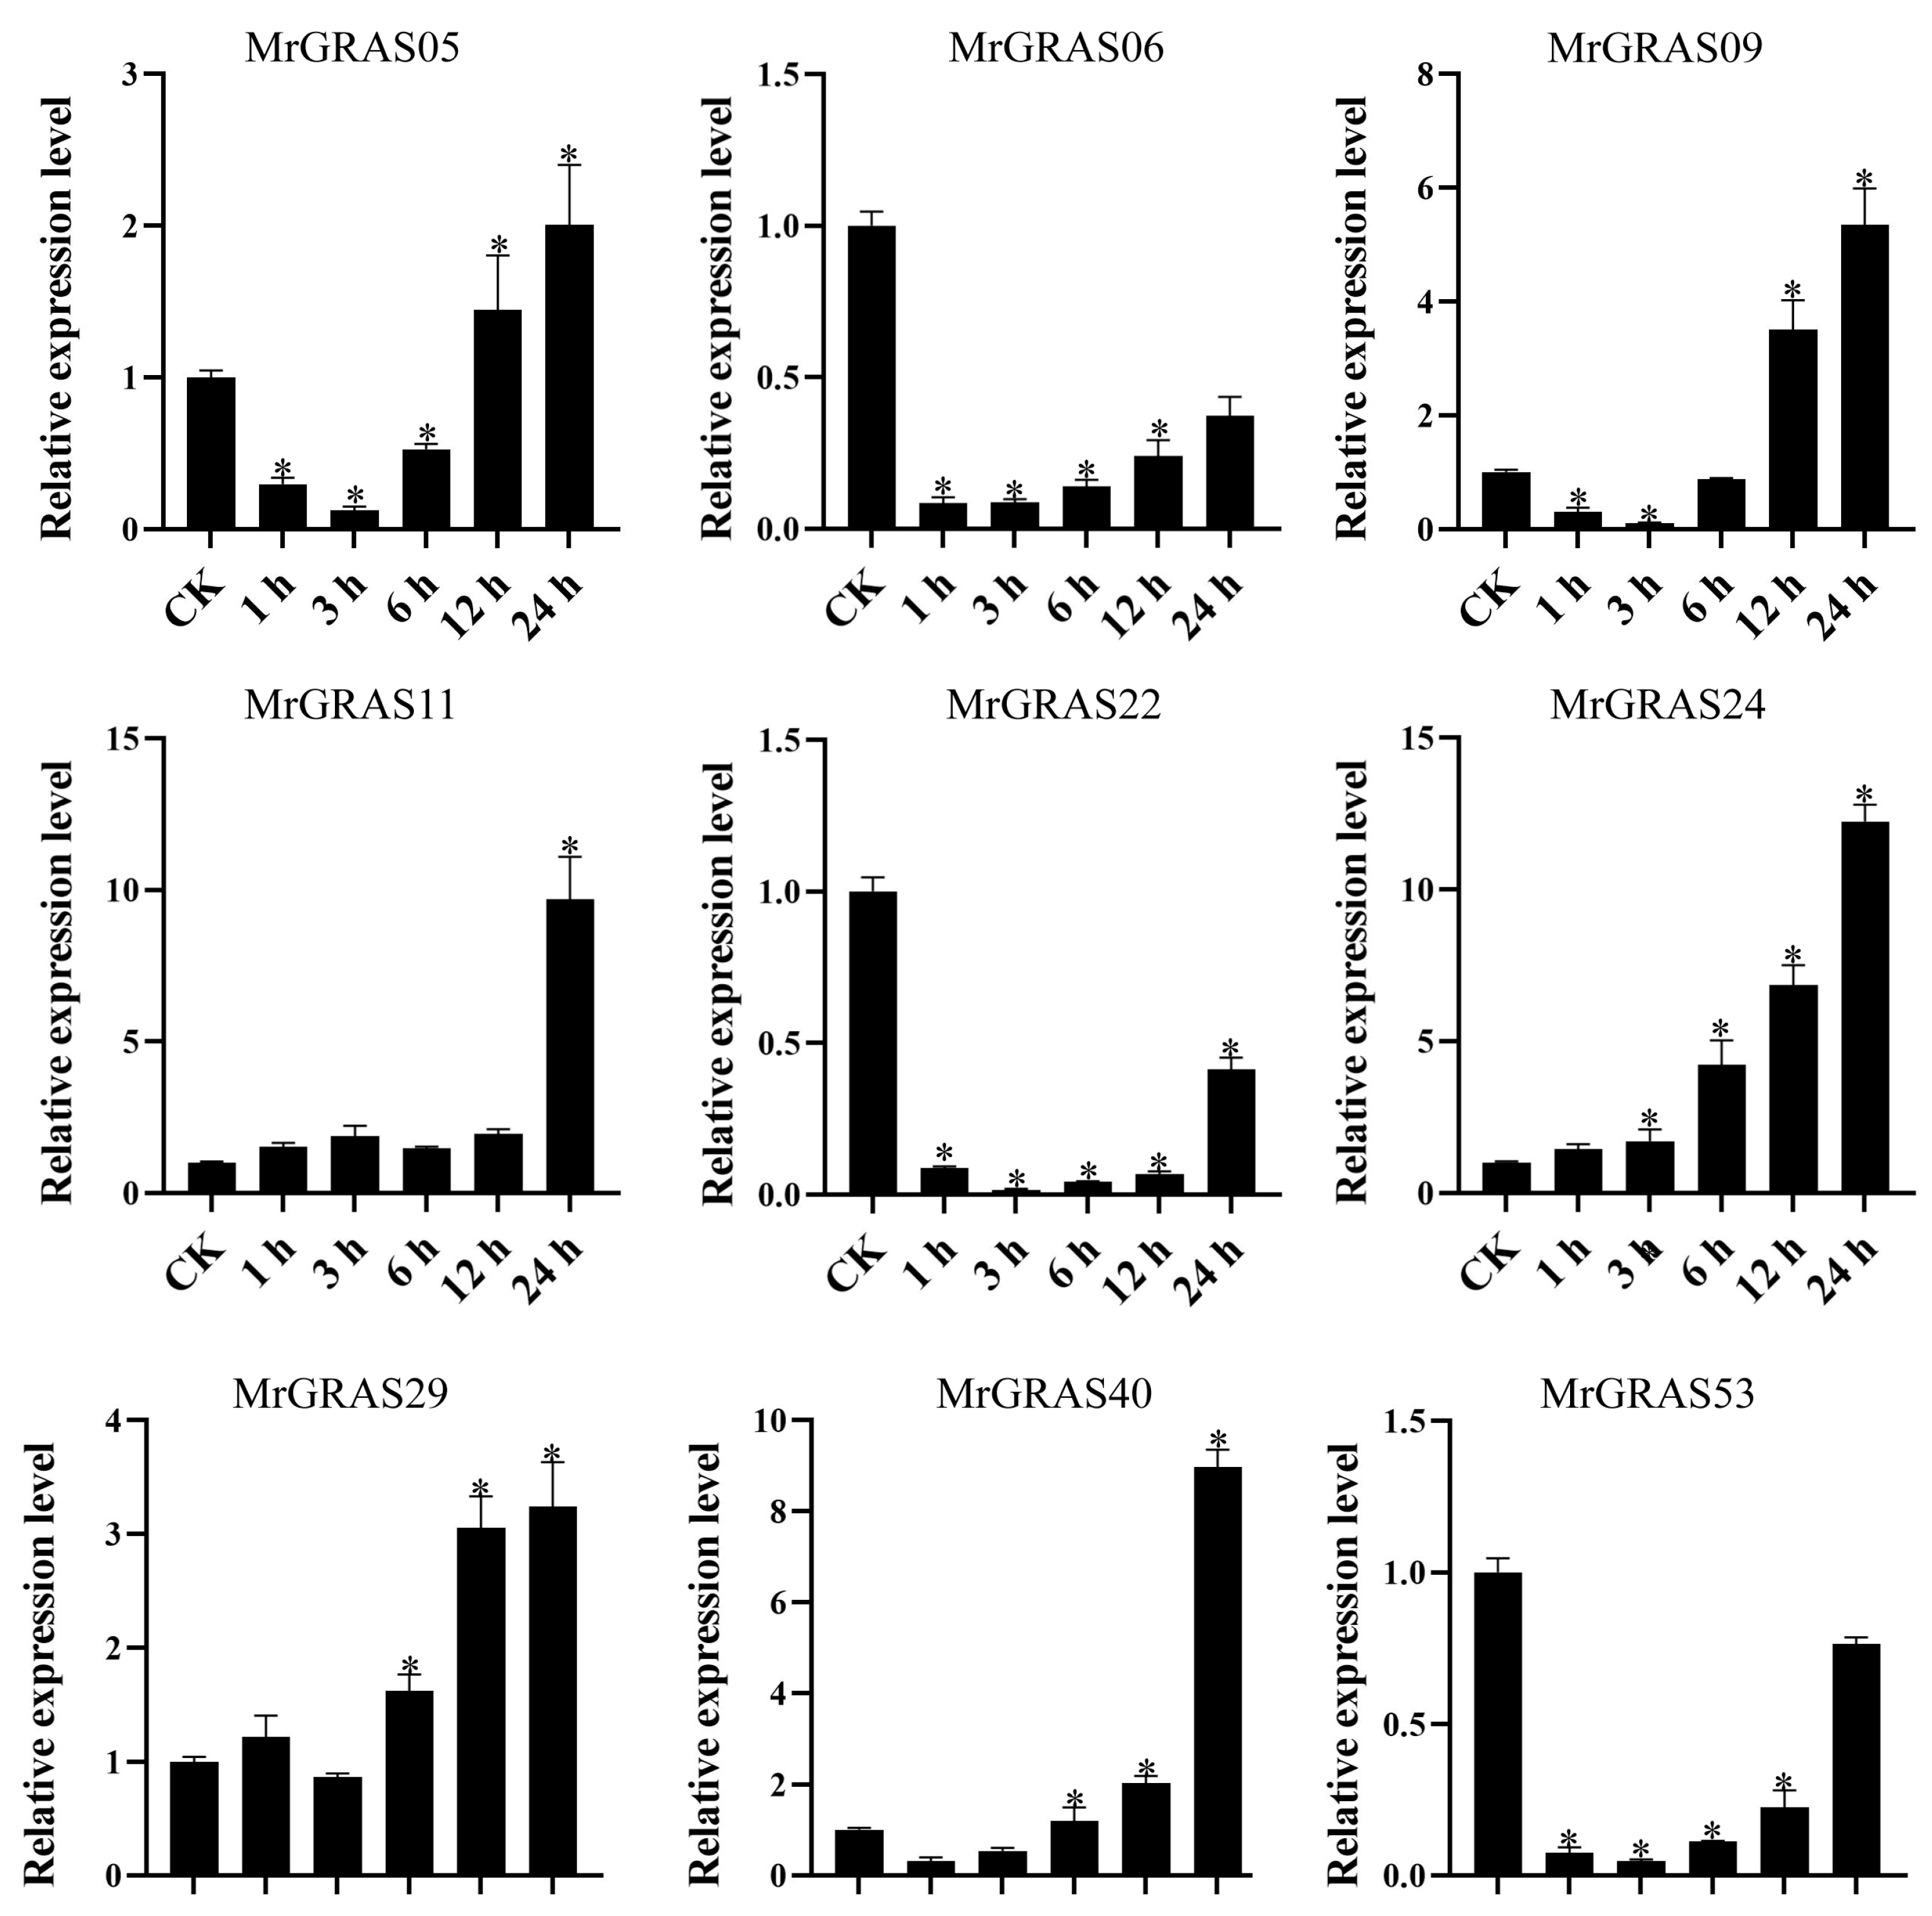
Nine selected genes (MrGRAS05, MrGRAS06, MrGRAS09, MrGRAS11, MrGRAS22, MrGRAS24, MrGRAS29, MrGRAS40, and MrGRAS53) were further subjected to RT-qPCR assay to understand their expression level of under different drought stress. Under short-term treatment (1 day) with different concentrations of mannitol, the expression levels of MrGRAS06 and MrGRAS09 decreased compared to the control group. The expression levels of MrGRAS11, MrGRAS22, MrGRAS24 and MrGRAS40 showed an initial increase followed by a subsequent decrease, while MrGRAS29 and MrGRAS53 exhibited an upward trend in expression levels in comparison to the control (Figure 10). Under treatment with 400 mM mannitol for different durations, only the expression levels of MrGRAS06, MrGRAS05, MrGRAS22, and MrGRAS53 decreased. The expression levels of the other genes showed an up-regulation trend, with MrGRAS11, MrGRAS24, and MrGRAS29 exhibiting the most significant changes in expression levels (Figure 11).
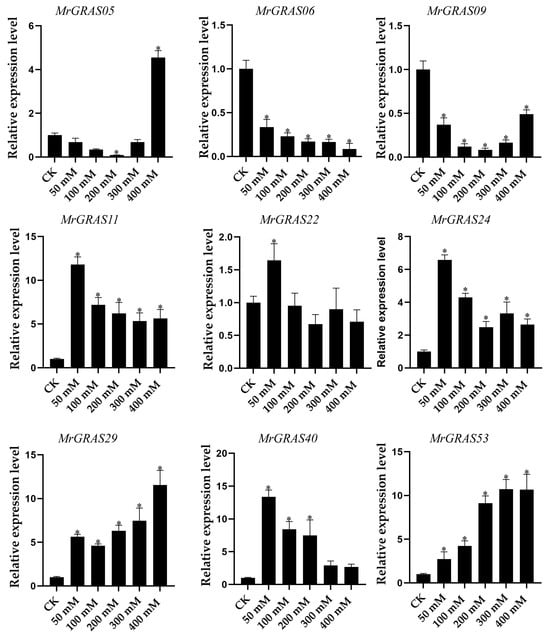
Figure 10.
Expression analysis of f MrGRAS gene under 0 (CK), 50 mM, 100 mM, 200 mM, 300 mM and 400 mM mannitol treatment for 1 d, respectively. Note: * represents the significant difference in the relative expression levels at different times of drought stress compared with CK (p < 0.05).

Figure 11.
Expression analysis of MrGRAS gene under 400 mM mannitol treatment for 0 (CK), 1, 3, 6, 12, and 24 h. Note: * represents the significant difference in the relative expression levels at different times of drought stress compared with CK (p < 0.05).
4. Discussion
GRAS transcription factors are now widely found in plants and can not only phytohormone signal transduction during plant growth and development but also play important roles in biotic and abiotic stresses [43]. In this study, we identified 62 MrGRAS genes from the M. ruthenica genome and analyzed their characteristics. Despite similar instability, MrGRAS proteins exhibit differences in protein length, molecular weight, and theoretical isoelectric point. Subcellular localization studies showed that most MrGRAS proteins are located in the nucleus, as seen in other species [3]. The 62 M. ruthenica GRAS genes and Arabidopsis GRAS genes were divided into 13 subfamilies. As genes within the same evolutionary clade are likely to have similar functions, we can infer the potential functions of MrGRAS genes based on their homology with other species [44]. For instance, overexpression of the PtSCL7 gene from poplar in Arabidopsis improved its resistance to salt and drought stress [45]. The OsGRAS23 gene, a homolog of the SCL14 subfamily, is involved in regulating the drought stress response in O. sativa. This suggests that the 13 M. ruthenica genes identified in the SCL subfamily may also play a role in drought resistance [46]. The intron–exon structure analysis revealed that approximately 88.7% of the MrGRAS genes (55 out 62) are primarily composed of exons, the diversity in intron deletions in these species showed that the GRAS gene is species-specific and has a high proportion of intron-free genes, indicating a close evolutionary relationship between GRAS proteins [47].
Gene replication plays a very important role in the evolutionary expansion of all gene families in plants [48]. In our study, except for chromosomes Chr1 and 6, the members of the M. ruthenica gene family cluster together on the remaining chromosomes, indicating gene duplication events within the MrGRAS genes. Similar situations have been observed in O. sativa and Arabidopsis [14], suggesting that segmental repeats are the main mechanism of gene amplification for the MrGRAS genes during their evolution and expansion. Moreover, the identification of homologous genes across species helps in elucidating gene and plant evolution through phylogenetic analysis [49]. We conducted a comparative analysis of orthologous genes among M. ruthenica, Arabidopsis, and G. max. Structural analysis data revealed that M. ruthenica and G. max share the highest number of orthologous genes, indicating a close evolutionary relationship. Similar characteristics were also reported in Brassica rapa [25].
By identifying the cis-regulatory elements in genes and combining them with existing transcription factor and expression profile data, the regulatory roles of genes in response to abiotic stresses can be inferred [50]. Many regulatory elements, such as ABRE, DRE, TC-rich repeat, and LRE play a role in the plant’s response to abiotic stresses such as drought, low temperature, and salinity [19]. These elements were identified in the GRAS family in Arabidopsis [51], Cicer arietinum [52], and M. sativa [3]. The ABRE cis-regulatory elements, associated with ABA response, are typically found in genes that react to drought or salt stress [53]. On the other hand, cis-regulatory elements such as DER, LRE, and TC-rich repeats are located in the promoter regions of genes and serve as key regulatory factors in plant responses to drought, low temperature, and other abiotic stresses [19]. The existence of these cis-regulatory elements in MrGRAS genes suggests that they may be crucial in the plant’s stress tolerance mechanisms [54]. The GRAS genes in the PAT1 family contain the highest number of these cis-regulatory elements, which indirectly suggests their potential for stress tolerance. For example, in cotton, two genes, Gh_D01G0564 and Gh_A04G0196, were identified from the PAT1 subfamily, which was up-regulated under abiotic stress conditions, including cold, salt, drought, and heat [55]. In Avena sativa, members of the PAT1 subfamily, such as AsGRAS16, can regulate the plant’s response to low (8 °C) and freezing (4 °C) temperatures, while AsGRAS14 is induced under salt and alkali stress [56]. This suggests that the PAT1 subfamily proteins in the GRAS gene family play essential roles and potentially exert key functions in abiotic stress through complex regulatory networks [51]. Analyzing the transcriptional patterns of the MrGRAS gene family under different stress conditions revealed that several genes belonging to the PAT subfamily in M. ruthenica, such as MrGRAS01, MrGRAS04, MrGRAS20, MrGRAS24, MrGRAS40, MrGRAS41, MrGRAS42, MrGRAS50, and MrGRAS59, showed altered expression patterns under cold, ABA, freezing, osmotic a, salt stress, and mannitol treatments, suggesting their ability to respond to abiotic stresses.
Numerous studies indicate that GRAS genes play a crucial role in conferring drought resistance in plants [52]. Such expression analysis of C. arietinum GRAS genes revealed that members of the PAT1, SCR, SCL3, and SHR GRAS subfamilies have the potential to respond to drought. CaGRAS12 (SCR) is considered a drought-responsive GRAS transcription factor gene and a candidate gene for developing drought-tolerant C. arietinum varieties [56]. GRAS genes identified in white-flowered wax mallow showed an up-regulation trend under ABA, drought, and salt stress, indicating their significant role in responding to abiotic stress. Furthermore, MaGRAS12, MaGRAS34, and MaGRAS33 were also found to enhance yeast cell drought or salt tolerance [57]. In a study involving GRAS genes identified from roses, most genes were significantly down-regulated after exogenous GA application, the SCR, RAM1, and PAT1 subfamilies exhibited significant down-regulation under drought stress conditions, suggesting their important roles in GA and drought stress signal regulation [58]. In Arabidopsis, overexpressing the SCL14 gene from the GRAS family resulted in enhanced drought tolerance under stress, demonstrating the potential application of GRAS genes in drought resistance [59]. Sami et al. utilized CRISPR/Cas9 technology to target multiple GRAS genes in Arabidopsis and analyzed their responses to drought stress. The results showed that the knockout of specific GRAS genes significantly improved drought tolerance, highlighting the potential of gene editing to regulate GRAS genes and enhance crop water retention ability [60]. Currently, precise regulation of the GRAS gene family through gene editing technologies has not been extensively studied. Moving forward, research should focus on this direction to enhance crop stress tolerance, accelerate plant growth, increase yields, or improve other agricultural traits. In this study, a total of 62 MrGRAS genes were identified, of which most genes showed significant expression differences under drought stress, suggesting their crucial roles in drought stress responses and these genes can serve as candidates for future research. Additionally, we validated using RT-qPCR experiments the significant induction of nine genes by drought stress (identified through RNA-Seq analysis). While some expression patterns were consistent with those observed in the RNA-Seq analysis, the fold changes in gene expression levels differed. This variation could be due to the biological diversity observed among different genotypes of M. ruthenica [61].
5. Conclusions
In this study, a total of 62 members of the M. ruthenica GRAS gene family were identified, which were analyzed for physicochemical properties, evolutionary relationships, gene structures, protein motif compositions, three-dimensional protein structures, gene duplication events, chromosomal distributions, cis-regulatory elements, and expression patterns under abiotic stress conditions. RT-qPCR experiments revealed that the relative expression levels of three genes—MrGRAS11, MrGRAS24 and MrGRAS29—showed significant changes under various drought stress treatments. Overall, this study compiles the first thorough identification and analysis of the GRAS gene family in M. ruthenica, providing a solid foundation for further investigation into the functions and molecular mechanisms of GRAS genes in response to drought stress in this species.
Supplementary Materials
The following supporting information can be downloaded at: https://www.mdpi.com/article/10.3390/agronomy15020306/s1, Supplementary Table S1: qRT-PCR primers; Supplementary Table S2: The protein sequence of 62 MrGRAS genes; Supplementary Table S3: The physicochemical properties of 62 MrGRAS genes; Supplementary Table S4: Sequence and logo of motif1-10.
Author Contributions
Conceptualization: L.Y. and Z.L.; methodology: P.L. and Q.Z.; software: X.D.; validation: X.D. and M.L.; formal analysis: M.L.; investigation: P.L. and Q.Z.; resources: P.L.; data curation: M.L. and X.D.; writing—original draft preparation: X.W.; writing—review and editing: X.W.; visualization: Z.W.; supervision: L.Y. and Z.L.; project administration: L.Y.; funding acquisition: Z.W. All authors have read and agreed to the published version of the manuscript.
Funding
Inner Mongolia Seed Industry Science and Technology Innovation Major Demonstration Project: 2022JBGS0040; National Center of Pratacultural Technology Innovation (under preparation) Special fund for innovation platform construction: CCPTZX2023N04; Leading Scientist Project of Gansu Province: 23ZDKA013; the earmarked fund for CARS (CARS-34).
Data Availability Statement
The data supporting the findings of this study are available from the corresponding author upon reasonable request.
Conflicts of Interest
The authors declare no conflicts of interest.
References
- Pratyusha, D.S.; Sarada, D.V.L. MYB transcription factors-master regulators of phenylpropanoid biosynthesis and diverse developmental and stress responses. Plant Cell Rep. 2022, 41, 2245–2260. [Google Scholar] [CrossRef] [PubMed]
- Arce-Rodríguez, M.L.; Martínez, O.; Ochoa-Alejo, N. Genome-Wide Identification and Analysis of the MYB Transcription Factor Gene Family in Chili Pepper (Capsicum spp.). Int. J. Mol. Sci. 2021, 22, 2229. [Google Scholar] [CrossRef]
- Dong, X.M.; Deng, H.; Ma, W.X.; Zhou, Q.; Liu, Z.P. Genome-wide identification of the MADS-box transcription factor family in autotetraploid cultivated alfalfa (Medicago sativa L.) and expression analysis under abiotic stress. BMC Genom. 2021, 22, 603. [Google Scholar] [CrossRef] [PubMed]
- Dudhate, A.; Shinde, H.; Yu, P.; Tsugama, D.; Gupta, S.K.; Liu, S.; Takano, T. Comprehensive analysis of NAC transcription factor family uncovers drought and salinity stress response in pearl millet (Pennisetum glaucum). BMC Genom. 2021, 22, 70. [Google Scholar] [CrossRef] [PubMed]
- Vodiasova, E.; Sinchenko, A.; Khvatkov, P.; Dolgov, S. Genome-Wide Identification, Characterisation, and Evolution of the Transcription Factor WRKY in Grapevine (Vitis vinifera): New View and Update. Int. J. Mol. Sci. 2024, 25, 6241. [Google Scholar] [CrossRef] [PubMed]
- Alves, M.S.; Dadalto, S.P.; Gonçalves, A.B.; De Souza, G.B.; Barros, V.A.; Fietto, L.G. Plant bZIP Transcription Factors responsive to pathogens: A Review. Int. J. Mol. Sci. 2013, 14, 7815–7828. [Google Scholar] [CrossRef]
- Laurenzio, L.; Wysocka-Diller, J.; Malamy, J.E.; Pysh, L.; Helariutta, Y.; Freshour, G. The SCARECROW gene regulates an asymmetric cell division that is essential for generating the radial organization of the Arabidopsis root. Cell 1996, 86, 423–433. [Google Scholar] [CrossRef]
- Peng, J.; Carol, P.; Richards, D.E.; King, K.E.; Cowling, R.J.; Murphy, G.P.; Harberd, N.P. The Arabidopsis GAI gene defines a signaling pathway that negatively regulates gibberellin responses. Genes Dev. 1997, 11, 3194–3205. [Google Scholar] [CrossRef]
- Silverstone, A.L.; Ciampaglio, C.N.; Sun, T. The Arabidopsis RGA gene encodes a transcriptional regulator repressing the gibberellin signal transduction pathway. Plant Cell 1998, 10, 155–169. [Google Scholar] [CrossRef]
- Hakoshima, T. Structural basis of the specific interactions of GRAS family proteins. FEBS Lett. 2018, 592, 489–501. [Google Scholar] [CrossRef]
- Li, S.P.; Zhao, Y.H.; Wu, Y.K. Expression and Purification of the GRAS Domain of Os-SCL7 from Rice for Structural Studies. Bio-Protocol 2017, 7, e2122. [Google Scholar] [CrossRef] [PubMed]
- Bolle, C. The role of GRAS proteins in plant signal transduction and development. Planta 2004, 218, 683–692. [Google Scholar] [CrossRef] [PubMed]
- Sun, X.; Xue, B.; Jones, W.T.; Rikkerink, E.; Dunker, A.K.; Uversky, V.N. A functionally required unfoldome from the plant kingdom: Intrinsically disordered N-terminal domains of GRAS proteins are involved in molecular recognition during plant development. Plant Mol. Biol. 2011, 77, 205–223. [Google Scholar] [CrossRef] [PubMed]
- Tian, G.; Wan, P.; Sun, S.H.; Li, J.; Chen, M. Genome-wide analysis of the GRAS gene family in Rice and Arabidopsis. Plant Mol. Biol. 2004, 54, 519–532. [Google Scholar] [CrossRef]
- Liu, X.; Widmer, A. Genome-wide comparative analysis of the GRAS gene family in populus, Arabidopsis and rice. Plant Mol. Biol. Rep. 2014, 32, 1129–1145. [Google Scholar] [CrossRef]
- Liu, Y.F.; Wang, W. Characterization of the GRAS gene family reveals their contribution to the high adaptability of wheat. PeerJ 2021, 9, 10811. [Google Scholar] [CrossRef]
- Zeng, X.; Ling, H.; Chen, X.M.; Guo, S.X. Genome-wide identification, phylogeny and function analysis of GRAS gene family in Dendrobium catenatum (Orchidaceae). Gene 2019, 705, 5–15. [Google Scholar] [CrossRef]
- Xu, K.; Chen, S.J.; Li, T.F.; Ma, X.S.; Liang, X.H.; Ding, X.F.; Liu, H.Y.; Luo, L. OsGRAS23, a rice GRAS transcription factor gene, is involved in drought stress response through regulating expression of stress-responsive genes. BMC Plant Biol. 2015, 15, 141. [Google Scholar] [CrossRef]
- Liu, M.Y.; Huang, L.; Ma, Z.T.; Sun, W.J.; Wu, Q.; Tang, Z.; Bu, T.L.; Li, C.L.; Chen, H. Genome-wide identification, expression analysis and functional study of the GRAS gene family in Tartary buckwheat (Fagopyrum tataricum). BMC Plant Biol. 2019, 19, 342. [Google Scholar] [CrossRef]
- Liu, H.F.; Xu, J.M.; Li, G.Y.; Zhong, T.L.; Chen, D.W.; Lv, J.B. Genome-wide identification and expression analysis of GRAS gene family in Eucalyptus grandis. BMC Plant Biol. 2024, 18, 573. [Google Scholar] [CrossRef]
- Fan, Y.; Wei, X.B.; Lai, D.L.; Yang, H.; Feng, L.; Li, L.; Niu, K.; Chen, L.; Xiang, D.B.; Ruan, J.J.; et al. Genome-wide investigation of the GRAS transcription factor family in foxtail millet (Setaria italica L.). BMC Plant Biol. 2021, 21, 508. [Google Scholar] [CrossRef] [PubMed]
- Tang, Z.; Song, N.; Peng, W.; Yang, Y.; Qiu, T.; Huang, C.; Wang, B. Genome identification and expression analysis of GRAS family related to development, hormone and pathogen stress in Brachypodium distachyon. Front. Sustain. Food Syst. 2021, 5, 675177. [Google Scholar] [CrossRef]
- Lee, M.H.; Kim, B.; Song, S.K.; Heo, J.O.; Yu, N.I.; Lee, S.A.; Kim, M.; Kim, D.G.; Sohn, S.O.; Lim, C.E.; et al. Large-scale analysis of the GRAS gene family in Arabidopsis thaliana. Plant Mol Biol. 2008, 67, 659–670. [Google Scholar] [CrossRef] [PubMed]
- Lu, X.H.; Liu, W.Q.; Xiang, C.G.; Li, X.; Wang, Q.; Wang, T.; Liu, Z.; Zhang, J.; Gao, L.H.; Zhang, W.N. Genome-Wide characterization of GRAS family and their potential roles in cold tolerance of Cucumber (Cucumis sativus L.). Int. J. Mol. Sci. 2020, 21, 3857. [Google Scholar] [CrossRef] [PubMed]
- Song, X.M.; Liu, T.K.; Duan, W.K.; Ma, Q.H.; Ren, J.; Wang, Z.; Li, Y.; Hou, X.L. Genome-wide analysis of the GRAS gene family in Chinese cabbage (Brassica rapa ssp. pekinensis). Genomics 2014, 103, 135–146. [Google Scholar] [CrossRef] [PubMed]
- Mishra, S.; Chaudhary, R.; Pandey, B.; Singh, G.; Sharma, P. Genome-wide identification and expression analysis of the GRAS gene family under abiotic stresses in wheat (Triticum aestivum L.). Sci. Rep. 2023, 13, 18705. [Google Scholar] [CrossRef]
- Grimplet, J.; Agudelo-Romero, P.; Teixeira, R.T.; Martinez-Zapater, J.M.; Fortes, A.M. Structural and Functional Analysis of the GRAS Gene Family in Grapevine Indicates a Role of GRAS Proteins in the Control of Development and Stress Responses. Front. Plant Sci. 2016, 7, 353. [Google Scholar] [CrossRef]
- Fan, Y.; Wan, X.; Zhang, X.; Zhang, J.; Zheng, C.; Yang, Q.; Yang, L.; Li, X.; Feng, L.; Zou, L.; et al. GRAS gene family in rye (Secale cereale L.): Genome-wide identification, phylogeny, evolutionary expansion and expression analyses. BMC Plant Biol. 2024, 24, 4. [Google Scholar] [CrossRef]
- Zhao, X.H.; Xu, Y.; He, G.; He, K.; Xiao, L.; Hu, R.B.; Li, S.J. Genome-Wide characterization and expression profiling of the GRAS gene family in salt and Alkali Stresses inmiscanthus sinensis. Int. J. Mol. Sci. 2022, 23, 14521. [Google Scholar] [CrossRef]
- Wang, L.; Ding, X.D.; Gao, Y.Q.; Yang, S.P. Genome-wide identification and characterization of GRAS genes in soybean (Glycine max). BMC Plant Biol. 2020, 20, 415. [Google Scholar] [CrossRef]
- Tong, N.; Li, D.; Zhang, S.T.; Tang, M.J.; Chen, Y.K.; Zhang, Z.H.; Huang, Y.J.; Lin, Y.L.; Cheng, Z.G.; Lai, Z.X. Genome-wide identification and expression analysis of the GRAS family under low-temperature stress in Bananas. Front. Plant Sci. 2023, 14, 1216070. [Google Scholar] [CrossRef] [PubMed]
- Huang, Y.; Zheng, Q.Y.; Zhang, M.M.; He, X.; Zhao, X.; Wang, L.; Lan, S.; Liu, Z.J. Genome-Wide identification and expression analysis of the GRAS gene family and their responses to heat stress in Cymbidium goeringii. Int. J. Mol. Sci. 2024, 25, 6363. [Google Scholar] [CrossRef] [PubMed]
- Small, E.; Jomphe, M. A synopsis of the genus Medicago (Leguminosae). Can. J Bot. 1989, 67, 3260–3294. [Google Scholar] [CrossRef]
- Wang, D.K.; Li, H.; Luo, X.Y. Crossbreeding of Melilotoides ruthenicus and Medicago sativa. Acta Agrestia Sin. 2008, 16, 458–465. [Google Scholar]
- Quaye, Y.; Lauce, K.Q.; Susan, M.C.; Jeff, J.V.; Joyce, A.J. Expression of RootCAR1 in seedlings of alfalfa (Medicago sativa L.) exposed to exogenous ABA, cold, dehydration, and salinity. Plant Biol. 2005, 2005, 129–130. [Google Scholar]
- Yin, M.; Zhang, S.; Du, X.; Mateo, R.G.; Guo, W.; Li, A.; Wang, Z.; Wu, S.; Chen, J.; Liu, J.; et al. Genomic analysis of Medicago ruthenica provides insights into its tolerance to abiotic stress and demographic history. Mol. Ecol. Resour. 2021, 21, 1641–1657. [Google Scholar] [CrossRef]
- Yan, W.; Dong, X.M.; Li, R.; Zhao, X.L.; Zhou, Q.; Luo, D.; Liu, Z.P. Genome-wide identification of JAZ gene family members in autotetraploid cultivated alfalfa (Medicago sativa subsp. sativa) and expression analysis under salt stress. BMC Genom. 2023, 25, 636. [Google Scholar]
- Larkin, M.A.; Blackshields, G.; Brown, N.P.; Chenna, R.; McGettigan, P.A.; McWilliam, H.; Valentin, F.; Wallace, I.M.; Wilm, A.; Lopez, R.; et al. Clustal W and Clustal X version 2.0. Bioinformatics 2007, 23, 2947–2948. [Google Scholar] [CrossRef]
- Bailey, T.L.; Boden, M.; Buske, F.A.; Frith, M.; Grant, C.E.; Clementi, L.; Ren, J.; Li, W.W.; Noble, W.S. MEME suite: Tools for motif discovery and searching. Nucleic Acids Res. 2009, 37, W202–W208. [Google Scholar] [CrossRef]
- Steige, K.A.; Laenen, B.; Reimegard, J.; Scofield, D.G.; Slotte, T. Genomic analysis reveals major determinants of cis-regulatory variation in Capsella grandiflora. Proc. Natl. Acad. Sci. USA 2017, 114, 1087–1092. [Google Scholar] [CrossRef]
- Wang, T.Z.; Ren, L.F.; Li, C.H.; Zhang, D.; Zhang, X.X.; Zhou, G.; Gao, D.; Chen, R.J.; Chen, Y.H.; Wang, Z.L.; et al. The genome of a wild Medicago species provides insights into the tolerant mechanisms of legume forage to environmental stress. BMC Biol. 2021, 19, 96. [Google Scholar] [CrossRef]
- Shi, R. Study on Drought Resistance of Medicago ruthenica Based on Transcriptome and Small RNA Analysis. Master’s Thesis, Inner Mongolia Agricultural University, Hohhot, China, 2022. [Google Scholar]
- Cannon, S.B.; Mitra, A.; Baumgarten, A.; Young, N.D.; May, G. The roles of segmental and tandem gene duplication in the evolution of large gene families in Arabidopsis thaliana. BMC Plant Biol. 2004, 4, 10. [Google Scholar] [CrossRef]
- Kapli, P.; Yang, Z.; Telford, M.J. Phylogenetic tree building in the genomic age. Nat. Rev. Genet. 2020, 21, 428–444. [Google Scholar] [CrossRef]
- Ma, H.S.; Liang, D.; Shuai, P.; Xia, X.L.; Yin, W.L. The salt- and drought-inducible poplar GRAS protein SCL7 confers salt and drought tolerance in Arabidopsis thaliana. J. Exp. Bot. 2010, 61, 4011–4019. [Google Scholar] [CrossRef]
- Habib, S.; Waseem, M.; Li, N.; Yang, L.; Li, Z. Over expression of SlGRAS7 affects multiple behaviors leading to confer abiotic stresses tolerance and impacts Gibberellin and Auxin signaling in tomato. Int. J. Genom. 2019, 2019, 4051981. [Google Scholar]
- Cenci, A.; Rouard, M. Evolutionary analyses of GRAS transcription factors in angiosperms. Front. Plant Sci. 2017, 8, 273. [Google Scholar] [CrossRef]
- Magadum, S.; Banerjee, U.; Murugan, P.; Gangapur, D.; Ravikesavan, R. Gene duplication as a major force in evolution. J. Genet. 2013, 92, 155–161. [Google Scholar] [CrossRef]
- Ming, R.; VanBuren, R.; Liu, Y.; Yang, M.; Han, Y.; Li, L.T.; Zhang, Q.; Kim, M.J.; Schatz, M.C.; Campbell, M.; et al. Genome of the long-living sacred lotus (Nelumbo nucifera Gaertn.). Genome Biol. 2013, 14, R41. [Google Scholar] [CrossRef]
- Ma, Y.T.; Wei, N.; Wang, Q.X.; Liu, Z.P.; Liu, W.X. Genome-wide identification and characterization of the heavy metal ATPase (HMA) gene family in Medicago truncatula under copper stress. Int. J. Biol. Macromol. 2021, 193, 893–902. [Google Scholar] [CrossRef]
- Ni, L.; Wang, Z.; Liu, X.; Wu, S.; Hua, J.; Liu, L.; Yin, Y.; Li, H.; Gu, C. Genome-wide study of the GRAS gene family in Hibiscus hamabo Sieb. et Zucc and analysis of HhGRAS14-induced drought and salt stress tolerance in Arabidopsis. Plant Sci. 2022, 319, 111260. [Google Scholar] [CrossRef]
- Yadav, S.; Yadava, Y.K.; Kohli, D.; Meena, S.; Paul, V.; Jain, P.K. Genome-wide identification and expression analysis of the GRAS gene family in response to drought stress in chickpea (Cicer arietinum L.). 3 Biotech 2022, 12, 64. [Google Scholar] [CrossRef]
- Song, H.; Wang, Q.; Zhang, Z.H.; Lin, K.; Pang, E. Identification of clade-wide putative cis-regulatory elements from conserved non-coding sequences in Cucurbitaceae genomes. Hort. Res. 2023, 10, uhad038. [Google Scholar] [CrossRef]
- Yamaguchi-Shinozaki, K.; Shinozaki, K. Transcriptional regulatory networks in cellular responses and tolerance to dehydration and cold stresses. Annu. Rev. Plant Biol. 2006, 57, 781–803. [Google Scholar] [CrossRef]
- Zhang, B.; Liu, J.; Yang, Z.E.; Chen, E.Y.; Zhang, C.J.; Zhang, X.Y.; Li, F.G. Genome-wide analysis of GRAS transcription factor gene family in Gossypium hirsutum L. BMC Genom. 2018, 19, 348. [Google Scholar] [CrossRef]
- Ling, L.; Li, M.; Chen, N.; Ren, G.; Qu, L.; Yue, H.; Wu, X.; Zhao, J. Genome-Wide analysis and expression of the GRAS transcription factor family in Avena sativa. Genes 2023, 14, 164. [Google Scholar] [CrossRef]
- Wang, S.S.; Duan, Z.; Yan, Q.; Wu, F.; Zhou, P.; Zhang, J. Genome-Wide Identification of the GRAS family genes in Melilotus albus and expression analysis under various tissues and abiotic stresses. Int. J. Mol. Sci. 2022, 23, 7403. [Google Scholar] [CrossRef]
- Kumari, P.; Gahlaut, V.; Kaur, E.; Singh, S.; Kumar, S.; Jaiswal, V. Genome-wide identification of GRAS transcription factors and their potential roles in growth and development of rose (Rosa chinensis). J. Plant Growth Regul. 2023, 42, 1505–1521. [Google Scholar] [CrossRef]
- Zhang, S.; Li, X.W.; Fan, S.D.; Zhou, L.J.; Wang, Y. Overexpression of HcSCL13, a Halostachys caspica GRAS transcription factor, enhances plant growth and salt stress tolerance in transgenic Arabidopsis. Plant Physiol. Biochem. 2020, 151, 243–254. [Google Scholar] [CrossRef]
- Sami, A.; Xue, Z.; Tazein, S.; Arshad, A.; Zhu, Z.H.; Chen, P.Y.; Hong, Y.; Zhu, T.X.; Zhou, K.J. CRISPR-Cas9-based genetic engineering for crop improvement under drought stress. Bioengineered 2021, 12, 5814–5829. [Google Scholar] [CrossRef]
- Zhou, Q.; Che, T.L.; Wang, Y.R.; Liu, Z.P. The development of 204 novel EST-SSRs and their use for genetic diversity analyses in cultivated alfalfa. Biochem. Syst. Ecol. 2014, 57, 227–230. [Google Scholar] [CrossRef]


Disclaimer/Publisher’s Note: The statements, opinions and data contained in all publications are solely those of the individual author(s) and contributor(s) and not of MDPI and/or the editor(s). MDPI and/or the editor(s) disclaim responsibility for any injury to people or property resulting from any ideas, methods, instructions or products referred to in the content. |
© 2025 by the authors. Licensee MDPI, Basel, Switzerland. This article is an open access article distributed under the terms and conditions of the Creative Commons Attribution (CC BY) license (https://creativecommons.org/licenses/by/4.0/).