Article

Early-Stage Impacts of Irrigated Conservation Agriculture on Soil Physical Properties and Crop Performance in a French Mediterranean System

1
G-EAU, INRAE, AgroParisTech, BRGM, CIRAD, Institute Agro, IRD, University of Montpellier, 34000 Montpellier, France
2
Société du Canal de Provence (SCP), Le Tholonet, 13182 Aix-en-Provence, France
*
Author to whom correspondence should be addressed.
Agronomy 2025, 15(2), 299; https://doi.org/10.3390/agronomy15020299
Submission received: 20 December 2024 / Revised: 21 January 2025 / Accepted: 23 January 2025 / Published: 25 January 2025

Abstract

:
The Mediterranean region faces intensified climate change effects, increasing irrigation demands to sustain crop yields and increasing pressure on water resources. Adaptive management strategies such as conservation agriculture (CA) offer potential benefits for soil quality and water use efficiency. However, there is limited research on the short-term effects of this farming system under irrigated Mediterranean climatic conditions. This study aimed to explore the short-term impacts of conservation agriculture (no tillage, cover crops and crop rotation) on the soil properties, water flows and crop and water productivity in a French Mediterranean agrosystem of irrigated field crops, using a multifactorial approach. From 2021 to 2023, maize, sorghum and soybean were grown successively under either conventional tillage (CT) or conservation agriculture (CA), combined with sprinkler irrigation, subsurface drip irrigation or non-irrigated conditions. The dynamics of the surface soil properties (bulk density, penetration resistance, soil temperature), water flows (infiltration, soil evaporation) and agronomic indicators (leaf area index, crop yield, water productivity) were measured across the three cropping seasons. In the pedoclimatic conditions of the study, CA was shown to clearly impact the soil properties, water flows and crop yields, from the first year of adoption. CA practices caused an increased bulk density and soil resistance penetration, leading to decreased quasi-steady ponded infiltration in the surface horizon, particularly in the CA–subsurface drip and CA–non-irrigated conditions. These effects were also reflected in the leaf area index, crop yield and water productivity, with CA showing lower values compared to CT. Crop residues in CA reduced soil evaporation, particularly under sprinkler irrigation. However, this benefit diminished as the residues decomposed, leading to soil evaporation rates comparable to those observed in CT. Agronomic indicators were better under sprinkler irrigation than under subsurface drip irrigation. Overall, compaction emerged as a significant challenge in the adoption of CA, considering its negative impact on crop yields.

1. Introduction

Climate change has led to significant increases in temperature on both global and regional scales, while also amplifying the spatial and temporal variability in the rain amounts and intensity at very local scales. The Mediterranean climate, characterized by warm and rainy winters and hot and dry summers [1], is particularly vulnerable to these impacts. Mediterranean regions experience frequent droughts and rising temperatures together with occasional rainstorms, which have overall negative effects on both water resource availability and soil conservation and quality [2]. In Montpellier (Southern France), the 30-year mean annual precipitation is 730 mm, while the mean potential evapotranspiration is 930 mm, resulting in an annual deficit of −200 mm. During the summer crop period (April to September), the mean deficit intensifies to −450 mm, leading to severe drought. Irrigation has become crucial in mitigating these adverse effects on crop yields overall and for summer crops in this context. However, it often leads to conflicts among different water users. In 2016, Southern France accounted for 46% of the total water withdrawn for irrigation in the country [3]. Projections suggest that, solely due to climate change, the irrigation demand in the Mediterranean region could rise by 4 to 18% by 2100 [4,5].
To address this issue and mitigate the impacts of climate change, it is essential to implement adaptive strategies in agrosystem management. One such approach is the adoption of conservation agriculture (CA), which focuses on preserving soil health and fertility [6,7] through practices encompassing three principles: (1) reduced or zero tillage, (2) crop residue or cover crop mulching and (3) diversified crop rotation [8]. The long-term adoption of CA has demonstrated numerous benefits, including an improved soil structure (better aggregate stability and continuity in microporosity), reduced erosion risks and increased water storage capacities (minimized soil evaporation and facilitated water infiltration and retention) [9,10].
Given its potential to improve the soil water dynamics by reducing runoff, enhancing the water use efficiency and mitigating drought conditions, CA is particularly relevant for Mediterranean temperate climates [11,12,13]. A meta-analysis conducted by Lee et al. [14] confirms that CA can lead to more efficient water use in Mediterranean regions, particularly in rainfed semi-arid contexts. As a result, CA has emerged as a realistic and effective tool to sustainably intensify agricultural production in these regions [15].
However, the effectiveness of CA can widely vary depending on the specific combination of CA practices implemented, the pedoclimatic conditions [16,17] and the duration after adoption. As presented in Table 1, the implemented CA practices differ from one system to another, with some systems adopting one, two or all three CA principles, while others adapt these principles to the local conditions (e.g., mulch till, strip till, occasional crop rotation). This diversity of practices, along with various pedoclimatic factors, results in variable outcomes regarding the soil properties, which affect soil functions and crop performance [13]. For example, depending on soil type, studies generally report an increase in bulk density (3–19%) and higher penetration resistance (25–56%) alongside reduced infiltration rates (13–40%) during the first three years of CA adoption [17,18,19,20,21,22,23,24,25]. Similar trends were observed even after 6 years of CA adoption [26]. Additionally, these studies often report a decrease in grain yield with considerable variability (15–72%). Some studies have found similar results even after more than ten years [11,27,28]. Over time, however, there is a tendency toward favorable trends, such as reduced penetration resistance, increased water infiltration and enhanced crop and water productivity by up to +94% [29,30,31]. The literature also indicates that CA systems reduce fluctuations in soil temperature, as well as mean soil temperatures, with a drop of up to 3 °C [17,32,33]. Notably, soil evaporation remains a relatively underexplored aspect.
Focusing on Mediterranean conditions, the short-term effects of CA can be highly variable. Some research shows positive outcomes, similar to the long term, including increased infiltration, higher yields and improved water productivity, despite rises in bulk density and penetration resistance [11,33,34,35]. In contrast, other studies describe reduced infiltration, an increased bulk density and penetration resistance, accompanied sometimes by declines in yield and water productivity [22,23,36]. These inconsistencies highlight the complexity of CA adoption and underscore the importance of considering local factors such as the soil type, climate and irrigation practices.
Despite extensive research on CA’s effects on the soil properties and water dynamics [37,38,39,40,41,42], relatively few studies have focused on the short-term effects following CA adoption in irrigated Mediterranean agrosystems [43,44], with even fewer in the context of Southern France. Additionally, limited research has explored the interaction between CA and different irrigation systems. Furthermore, there is a lack of studies providing a comprehensive overview of the simultaneous evolution in the short term of the soil properties, water dynamics and agronomic performance, which may differ from the long term (as highlighted in Table 1) and can present real challenges for CA adoption. Evaluating these early-stage effects is crucial, as it can help farmers to anticipate potential obstacles during the transition and ensure that they realize the full benefits of CA over time.
The present study aims to fill the gap in the literature by assessing the effects of CA (three principles implemented simultaneously: zero tillage, cover crops, diversified crop rotation) on the soil hydrodynamic properties and crop productivity, during the short-term period following its adoption in a French Mediterranean irrigated agrosystem. It consists of the experimental assessment of the physical soil properties (bulk density, penetration resistance, temperature), water fluxes (quasi-steady ponded infiltration rate and soil evaporation), crop development (leaf area index) and crop performance (grain yield and water productivity). The investigation was conducted over a three-year period (2021 to 2023) to compare the outcomes of two farming approaches, conservation agriculture (CA) and conventional tillage (CT), both combined with sprinkler (S) irrigation, subsurface drip (SSD) irrigation or non-irrigated (NI) conditions. Although some properties have been evaluated at slightly greater depths, this study focused mainly on the surface soil layer, which is the most relevant as the surface part of the soil is the most affected by tillage and organic matter enrichment.
Table 1. Effects of conservation agriculture practices on some soil properties, water fluxes, grain yield and water productivity across diverse geographical contexts, compared to conventional tillage. Positioning of the results of the present study (grey line). “CA”: conservation agriculture with the three principles (no tillage, cover crops and crop rotation). “ND”: not determined. Symbols: ↑ increase, ↓ decrease, ≈ no significant difference.
ReferenceTime of PracticeCA
Practices
Climate
(Country)
Soil
Type (Texture)
IrrigationSoil
Temperature
Bulk DensityPenetration ResistanceInfiltrationSoil
Evaporation
Grain YieldWater
Productivity
[24]1 yearCASemi-arid continental (Spain)Vertic Luvisol
(Loam)
Sprinkler ↓ fluctuations, ↓ 1.9–2.5 °C ↑ 12–19% ↑ 25–33% NDND↓ 15.4% ↓ 15.4%
(crop yield/irrigation applied)
[45]1 yearCASub-tropical (Cuba)Red FerraliticNot irrigatedND↓ 7% ND↑ 20% NDNDND
[18]2 yearsCASub-tropical
(Nepal)
(Silt–Loam)Not irrigatedND↑ 5% NDSoil sorptivity about three times slower ND≈ in the first year,
↓ 72% second year
ND
[21]2 yearsNo tillageSemi-arid
(Iran)
(Silty Clay Loam)Sprinkler ND↑ 6% ↑ 37%NDND↓ 18% ND
[19]2 or 5 yearsNo tillage and cover cropSemi-arid (Southern Malawi)Chromic Luvisols and Chromic Cambisols—(Clay Loams to Clay)Not irrigatedND↑ 5% ND↓ 13% of hydraulic conductivity after 2 years,
≈ after 5 years
NDNDND
This study3 yearsCAMediterranean (France)Fluvisol-
(Loam)
Sprinkler, subsurface drip and not irrigated -------
[22,23]3 yearsCAMediterranean (Turkey)Haploxererts (Heavy Clay)Sprinkler ND↑ 1–12% ↑ 7–56% ↓ 20–40% of saturated hydraulic conductivityNDNDND
[11]3 yearsCAMediterranean (Spain)Xerofluvent, (Loamy Alluvial)Sprinkler ND↑ 2–6% ↓ 3–41% ↑ soil water storage ND↑ 8–24% ↑ 11–31%
[32]3 yearsNo tillage and cover cropsSemi-humid, monsoon
(China)
Hepludolls
(Clay Loam)
Not irrigated↓ 0.5–0.9 °C NDNDNDNDNDND
[46]3 yearsPermanent beds, permanent beds with short-duration pulse cropSemi-arid
(India)
(Clay Loam)FloodNDNDNDNDND↑ 4.2–13.5% ↑ 28–40%
(grain yield/crop evapotranspiration)
[20]3 yearsCATropical
(Ghana)
Ferric Lixisols
(Sandy with Low Clay Content)
Not irrigatedND↑ 10–15% NDNDND↓ 23–37% ND
[24]3 yearsNo tillage and cover cropSub-humid mediterranean (Chile)Ultic Palexerals (Sandy Loam and Clay)Not irrigatedNDND↑ 25% in the first 20 cm depthNDND↓ 29–35% ND
[47]3 yearsNo tillage and cover cropSub-humid
(Italy)
Fluvi-Calcaric Cambisol
(Silty Loam)
Not irrigatedND↑ 6.5% ↑ 31–36% ↑ more than twice NDNDND
[25]3 to 5 yearsNo tillage, cover crop (mulch)Semi-arid
(Iran)
Haploxerepts (Silty Clay Loam)FloodND↑ 7–11%ND↓ 13% of cumulative water infiltrationND↓ 11–31% ↑ 8%
(crop yield/total water applied)
[48]3, 6 and 9 yearsNo tillage and cover cropSub-tropical continental monsoon
(India)
Alluvium (Sandy Clay Loam and Clay Loam)FloodND↑ 7%, 2% and 3% after 3, 6 and 9 years, respectivelyNDNDNDNDND
[33]3 and 6 yearsNo tillage and cover cropMediterranean (Spain)VertisolNot irrigated ↓ of fluctuations NDNDNDNDNDND
[34]3 and 9 yearsNo tillage and cover cropsMediterranean (Spain)Stony District Luvisol
(Loam)
SprinklerNDND↓ 60% ↑ 26–44% of soil water contentNDNDND
[35]3 and 7 yearsNo tillage and cover cropsMediterranean (Spain)Hydragic Anthrosol Sprinkler and flood NDND↑ in the 0–25 cm layer
≈ for deeper layers
NDND↑ 7–70% for the first 3 years and ↑ 50–170% after 7 years ↑ 10–70% for the first 3 years
↑ 50–170% after 7 years
(grain yield/irrigation water)
[49]4 yearsNo tillage, permanent beds, residue retention, crop rotationSub-tropical (India)(Silty Loam)FloodNDNDNDNDND↑ 12–16% for maize and ↑ 5–9% for wheat↑ 35–94%
(grain yield/irrigation water applied)
[36]5 to 10 yearsCAMediterranean (Spain)Xerofluvent (Sandy Clay Loam)Not irrigated (winter season)NDND↑ 10–15 timesNDND↓ 97% ND
[28]5 to 7 yearsNo tillage, organic amendmentsMoist Mediterranean (Spain)Clay-Skeletal, Kaolinitic, Acid, Thermic Plinthoc PalexerultsNot irrigated (winter season)ND↓ 12% ND↑ 56–59% of hydraulic conductivity ND↑ 3–4 timesND
[50]5 to 8 yearsMulch till and cover crop and crop rotationOceanic with both Atlantic and Mediterranean influences (Southwestern France)Gleyic Luvisol (Loamy, Illuvial Clay and Alluvial Pebbly) Center pivot↓ 0.8–2.8 °C at sowingNDNDNDNDNDND
[51]5 to 7 yearsCASemi-arid
(India)
Alluvium (Sandy Clay Loam)Flood↓ 1.3 °CNDNDNDND↑ 12% ↑ 15% (grain yield/irrigation applied)
[52]6 yearsNo tillage, cover crop and occasional crop rotationSemi-arid (United States)Abilene
(Clay Loam)
Subsurface dripNDNDNDNDND↑ 9% ↑ 9–11%
(grain yield/irrigation applied)
[26]6 yearsCASub-humid and cool temperate (Canada)Gray LuvisolNot irrigatedND↑ 9% ↑ 10–79% ↓ 33% NDNDND
[31]6 yearsCA in monocropping and intercroppingTropical wet and savanna
(Malawi)
Ferric/Orthic Acrisol and Ferric Luvisol (Sandy Clay Loam)Not irrigatedNDNDND↑ 18–42% ND↑ 30–133% ND
[53]7 yearsCASemi-arid
(India)
Typic Haplustept (Clay Loam)FloodND↓ 20–41% ND↑ 13–21% ND
[27]7 yearsCASemi-arid
(India)
Haplustept (Sandy Loam)FloodNS↓ 4–7% ↓ 16–27% ↑ 11–12%NDNDND
[7]7 yearsNo tillage and crop rotationMediterranean (Italy)(Clay Loam)Not irrigated (winter season)↑ 0.3 °CNDNDNDNDNDND
[54]7 to 9 yearsNo tillage, crop rotationHumid temperate (Argentina)Argiaquoll
(Clay Loam, Clayey, Silty Clay)
Not irrigatedND↑ 5% NDNDNDND
[28]8 yearsCAMediterranean (Spain)Parexerults
(Sandy Loam, Sandy Clay and Sandy Clay Loam)
Not irrigated (winter season)ND↓ 13% ND↑ 120% of mean infiltration ↑ 140% of hydraulic conductivity ND↑ 3 timesND
[41]9 to 28 yearsNo till, strip till, crop rotationOceanic
(Southwestern France)
Calcisols, Umbrisols and LuvisolsSprinkler and not irrigatedNDNDND↑ 1.5–3 times of mean hydraulic conductivity NDNDND
[55]10 yearsNo tillage and crop rotationTemperate semi-humid continental monsoon
(China)
Dark Loessial Soil
(Middle Loam)
Not irrigatedND↓ 7.7%NDNDNDND
[56]10–12 yearsCA in monocropping and intercroppingTropical wet and savanna
(Malawi)
Chromic Luvisol, Haplic Lixisols
(Sandy Clay Loam and Sandy Loam)
Not irrigatedNDNDND↑ 44–450% of hydraulic conductivityNDNDND
[57]12 yearsCAHumid continental (Canada)Dystric Gleysol (Loamy Sand)Not irrigatedND↑ 10%NDNDNDND
[29]14 yearsCAHumid sub-tropical (Zambia)Ferric LixisolsNot irrigatedNDNDND↑ 74% of mean infiltration rates ND↑ 64%ND
[58]15 yearsNo tillage and crop rotationSemi-arid
(India)
(Loam, Sandy Loam and Clay Loam)FloodND↑ on the topsoil and ≈ after 10 cm ND↑ 38–51% of saturated hydraulic conductivity
↑ 28% of water intake rate
NDND
[59]16 yearsCA and differentiated fertilizationMediterranean (Italy)Typic Xerofluvent (Loam)Not irrigatedND↓ 3% in the 0–10 cm layer ↑ 5% in the lower layersNDNDND↓ 17% of total biomass yieldND
[33]20 yearsNo tillage and crop rotationMediterranean (Spain)VertisolNot irrigated↓ 0.7–2.6 °C NDNDNDNDNDND
[44]20 yearsNo tillage and barley monocroppingSemiarid Mediterranean (Spain)XerofluventSolid setND↑ 2–12% ↑ 17% ↑ 45%NDSlight ↑ND
[60]21 yearsNo tillage, differentiated fertilizationHumid sub-tropical
(USA)
Typic Paleudalf—Maury
(Silt Loam)
Not irrigatedNDNDNDNDND
[30]22 yearsCACold semi-arid (Mexico)Feozem
(Sandy Clay Loam)
FloodND↓ 20% ↓ 92% ↑ 95% ND↑ 52%ND
[61]26 yearsCASemiarid Mediterranean (Spain)Xerofluvent
(Silt Loam)
Solid setND↑ 6% ND↑ 33%NDNDND

2. Materials and Methods

2.1. Site Description

This study was conducted in Southern France, in Montpellier, at the INRAE experimental platform (43.647° N, 3.871° E) over three years (2021–2023). Specific plots were allocated for the transition from 20 years of conventional homogeneous tillage, primarily for maize production, to conservation agriculture. The adoption began in autumn 2020 by implementing soil conservation practices with, simultaneously, (i) no tillage, (ii) direct seeded winter cover crops and (iii) diversified crop rotation. The soil was classified as a Fluvisol [62] of colluvio-alluvial origin, with a texture comprising 43% silt, 36% sand and 21% clay and displaying few spatial heterogeneities [63]. The pH was alkaline at approximately 8.5. The organic matter content for the 0–20 cm soil layer was 1.6%. The total available water capacity was 150 mm per 100 cm soil depth, determined using a soil water retention curve obtained with pressure chambers.

2.2. Climatic Data

Local climatic data were collected daily at a height of 1–2 m using a Cimel data acquisition system, model 516i, which transmitted the data via a GPRS link. The measured variables included the wind speed, which was measured with a digital wind vane (Cimel model CE 157 N, Cimel, Paris, France) and a cup anemometer (Cimel model CE 155 N). The air temperature was recorded using waterproof PT100 probes (Priggen Special Electronic GmbH, Wettringen, Germany) with a 4-wire system. The air humidity was assessed using a Vaisala capacitive hygrometer (HMP110, Vaisala, Vantaa, Finland). Precipitation was measured with a tipping bucket rain gauge from Precis Mécanique (Bezons, France). Global radiation was quantified with a CMP6 pyranometer. All measurements were conducted on a nearby plot approximately 100 m away from the experimental plot in the absence of any obstacles or significant disturbances of any kind.
The climatic conditions for each cropping season (from sowing to harvest) were determined by following the daily average values of four significant meteorological variables: the air temperature, global radiation, reference evapotranspiration (ETo) and rainfall (R) (Figure 1). In the 2021 cropping season, the mean air temperature ranged between 9.0 and 28.0 °C; in 2022, it was between 17.0 and 30.0 °C; and in 2023, it was between 16.2 and 29.9 °C. The average cumulative daily global radiation (Rg) recorded was 2600 W·m−2 in 2021, 2192 W·m−2 in 2022 and 2229 W·m−2 in 2023. The precipitation (R) during the cropping season totaled 390 mm in 2021, 115 mm in 2022 and 158 mm in 2023. Additionally, the cumulative reference evapotranspiration (ETo) for the same periods reached 726 mm in 2021, 642 mm in 2022 and 660 mm in 2023. The drought intensity was characterized by assessing the drought indicator calculated over the cropping season as cumulative ETo/cumulative R and comparing it with the same ratio calculated over the period of April to September from 1991 to 2023. Based on this assessment, the years 2021 (2.37) and 2023 (3.84) were categorized as “average”, while 2022 (5.14) was categorized as “dry”.

2.3. Experimental Design

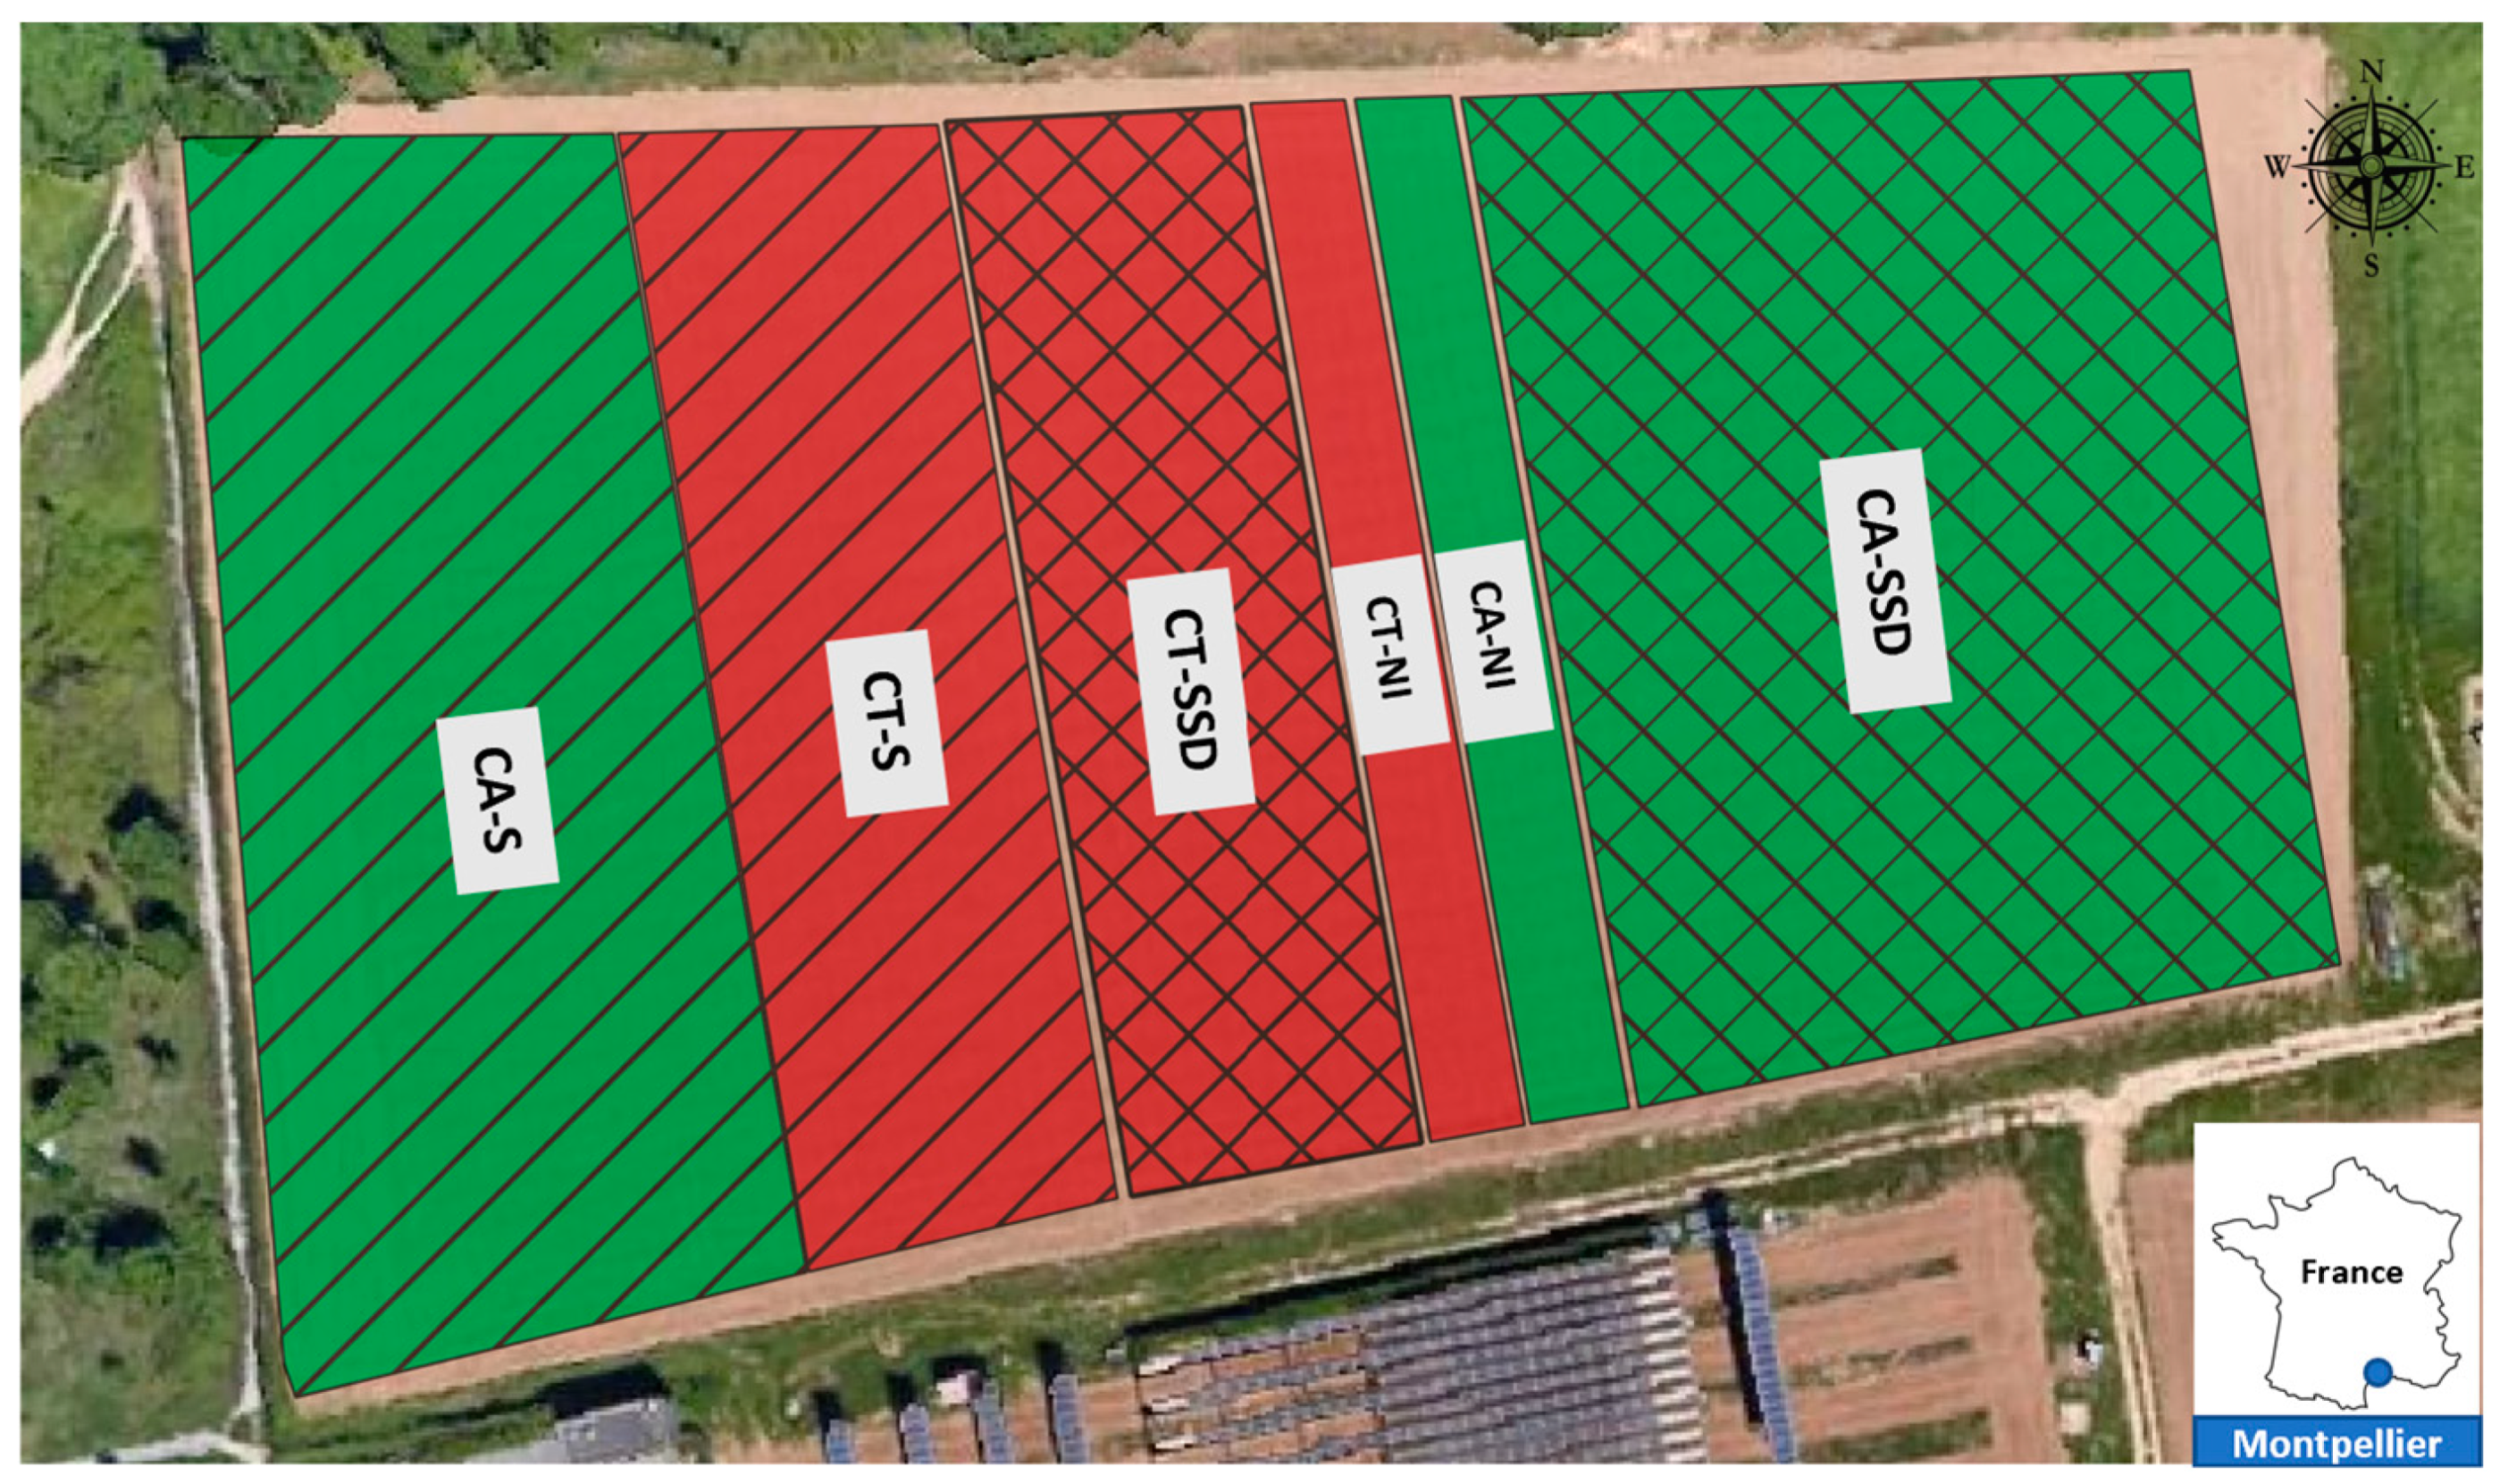
Maize (Zea mays L., RAGT IXABEL), sorghum (Sorghum bicolor L., HUGGO) and soybean (Glycine max L., RGT SPEEDA) crops were cultivated under either conventional tillage (CT) or conservation agriculture (CA). In CA plots, (1) zero tillage, (2) winter cover cropping (direct seeded) with residue-covered soil and (3) crop rotation were simultaneously implemented. CT plots involved conventional tillage and bare soil in winter. Both CT and CA were followed under sprinkler (S) irrigation, subsurface drip (SSD) irrigation or no irrigation (NI), leading to an experimental agronomic set-up in large strips with six treatments in total, covering an area of 1.5 ha (Figure 2). SSD irrigation was installed in 2019 at a depth of 35 cm, which represented a constraint regarding the layout of the treatments from the start of the experiment in 2021. Consequently, it was not possible to randomize the treatments as shown Figure 2: SSD irrigation covered the eastern part of the plot, while S irrigation covered the western part. Previous studies, however, indicated few spatial heterogeneities within the top 30 cm of soil [63], supporting the suitability of this layout.

2.4. Farming Practices

Table 2 lists the practices adopted during the three cropping seasons, for summer and winter cover crops, under CA and CT.

2.5. Irrigation

The system employed for sprinkler (S) irrigation was the solid set for 2021 and the hose reel for 2022 and 2023. Irrigation inputs were monitored by reading rain gauges placed in the plot in a grid pattern. This allowed the determination of the actual irrigation amount reaching the soil in comparison to the scheduled setpoint dose fed to the system. The subsurface drip (SSD) irrigation system comprised buried drip lines, NAAN HYDRO PC (diameter 16 mm), spaced at intervals of 80 cm, with pressure-compensating drippers, for a nominal flow rate of 1.6 L·h−1, positioned at every 50 cm along the drip tapes. This system was positioned at a 35 cm soil depth to avoid damage-related problems due to tillage before CA adoption. The monitoring of the irrigation water supply with SSD was allowed by individual volumetric meters installed at the terminals. Initial irrigation was applied to ensure seed germination for all treatments using sprinkler irrigation in 2022 and 2023. The irrigation schedule was based on weekly doses programmed to ensure hydric comfort and provide the same amount of water for all treatments.
In 2021 (maize), ten irrigation applications were performed, with measured volumes of 210 mm for CA-S, 240 mm for CT-S and 250 mm for both the CA-SSD and CT-SSD treatments. In 2022 (sorghum), eight applications were performed, with CA-S receiving 240 mm, CA-SSD receiving 260 mm and both CT-S and CT-SSD receiving 260 mm. In 2023 (soybean), eight applications were performed, with CA-S receiving 300 mm, while CA-SSD, CT-S and CT-SSD all received 270 mm. As can be seen, some variability in the irrigation volumes was observed in sprinkler irrigation, primarily due to wind-induced drift losses during irrigation. However, soil moisture monitoring at different depths confirmed that the soil moisture levels remained consistently above the permanent wilting point throughout the growing season, ensuring adequate water availability for crop development.

2.6. Soil Monitoring

2.6.1. Soil Temperature

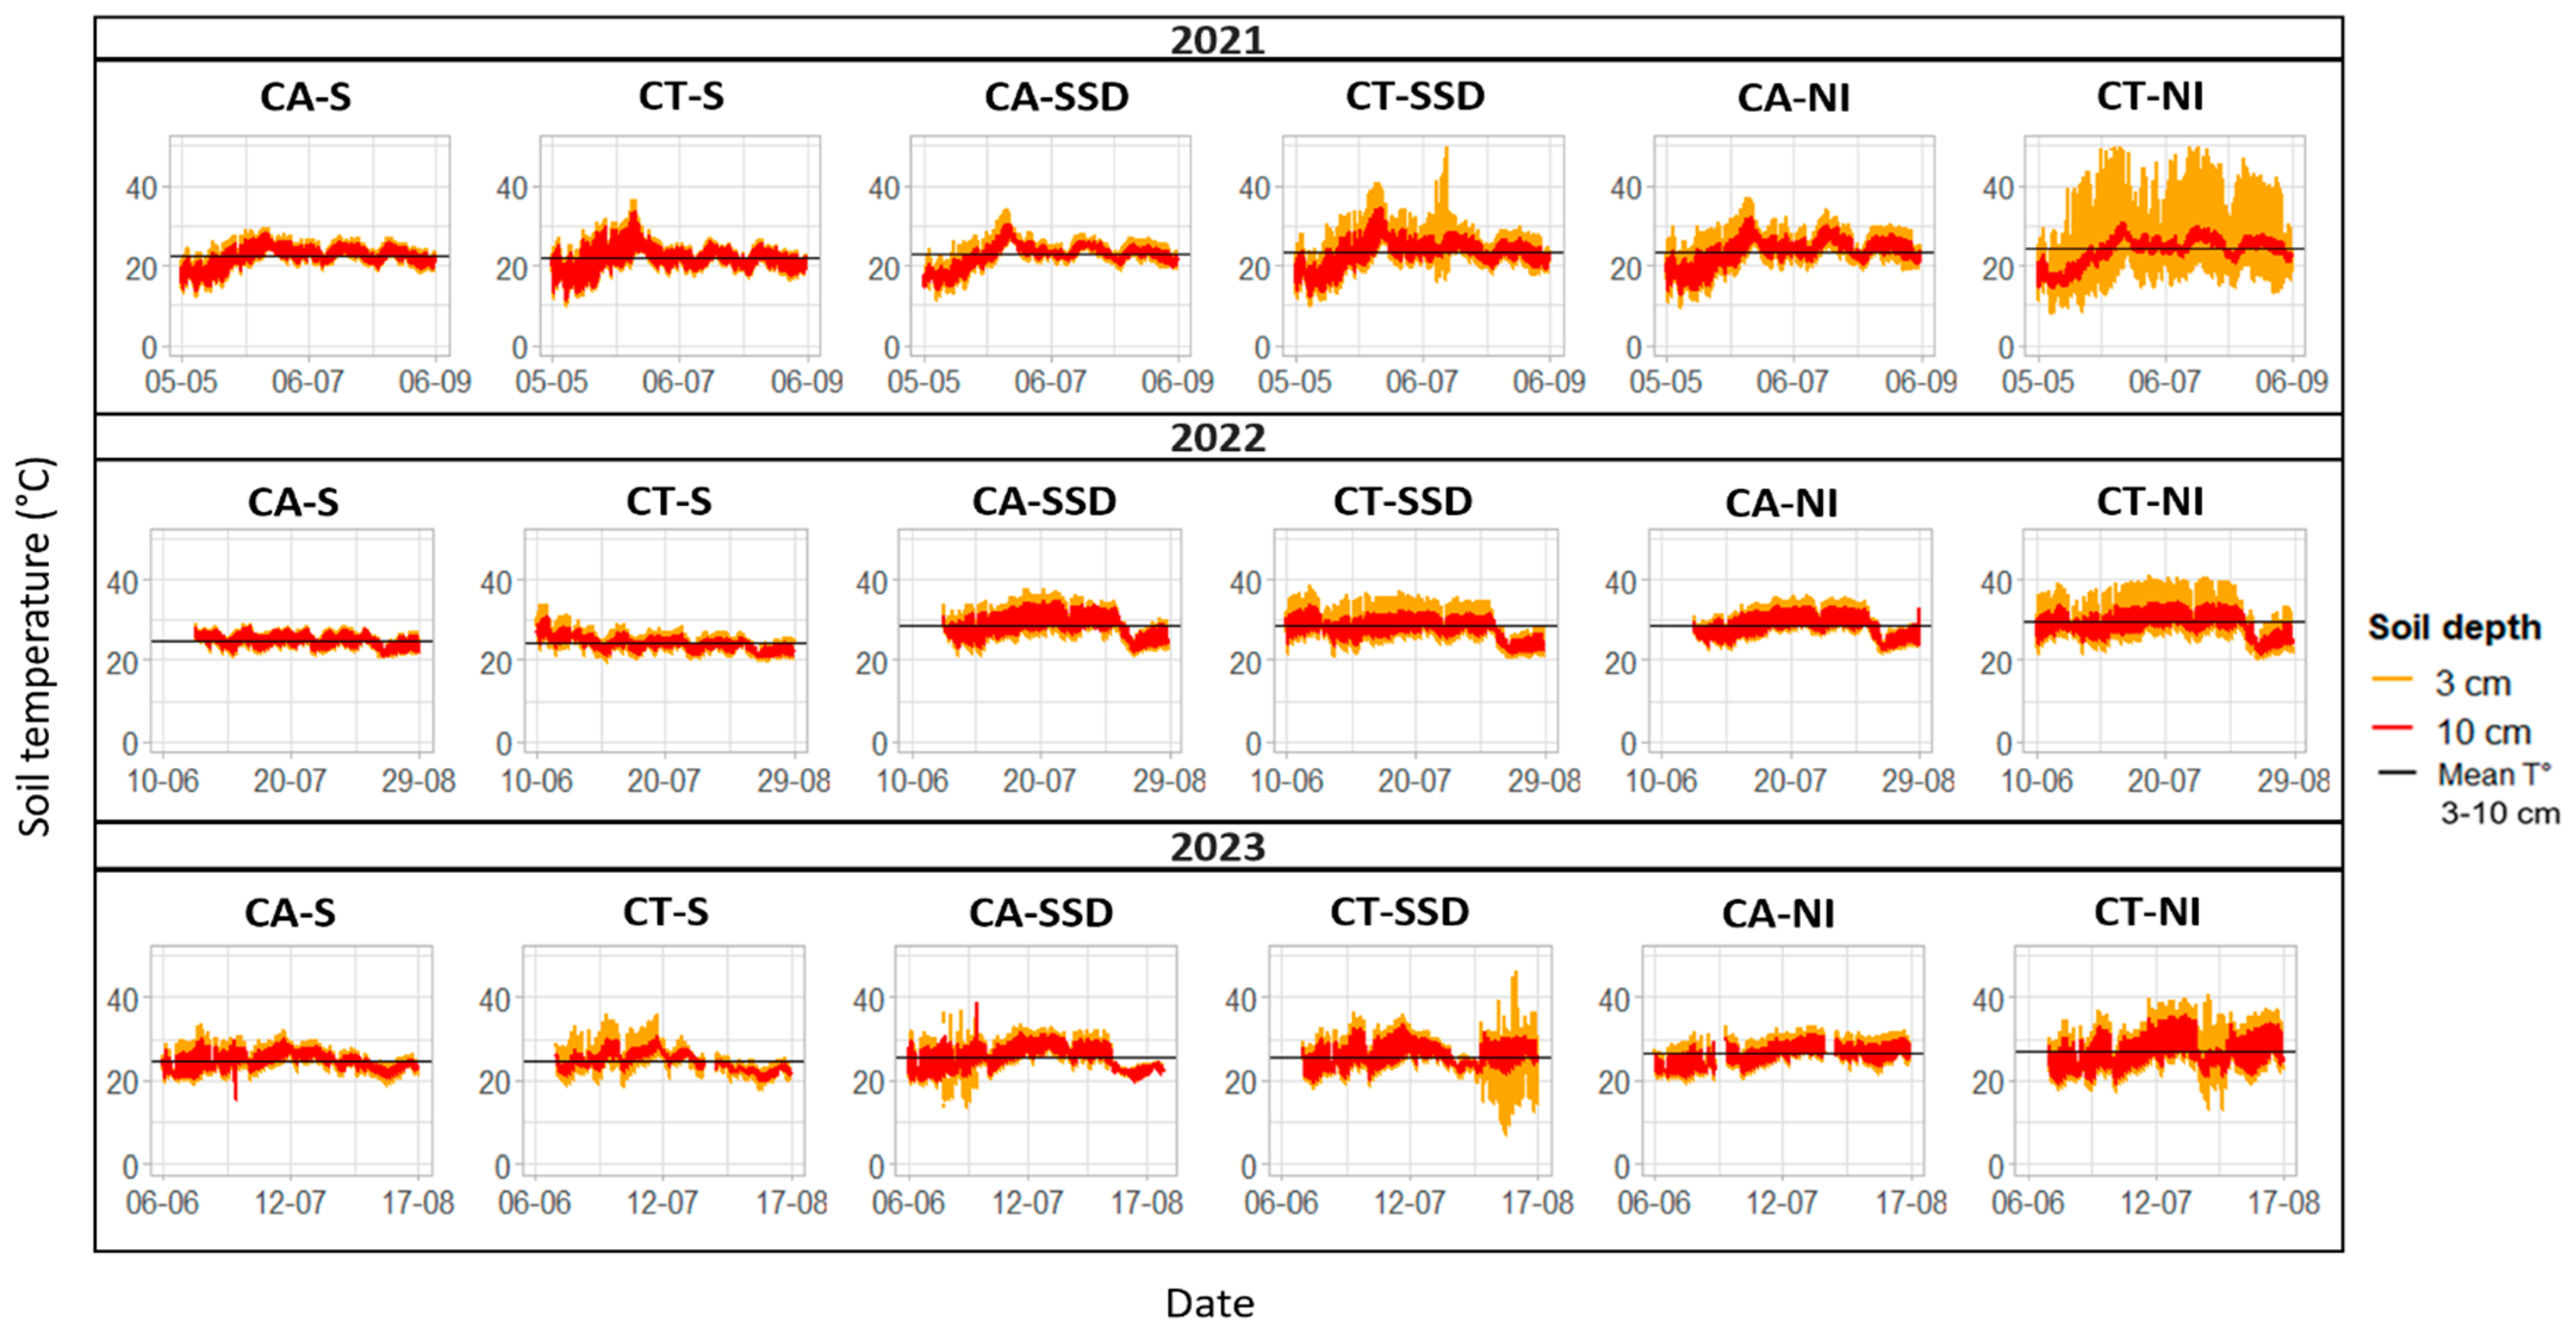
The soil temperature was assessed using T-type thermocouples, commonly known as Copper/Constantan, connected to a Campbell Scientific data logger (CR100) recording temperature values every 20 min. In the central area of each treatment, one thermocouple was placed at a depth of 3 cm and another one at a depth of 10 cm. This device allowed the evaluation of temperature fluctuations in the soil upper layer and the assessment of their correlations with soil evaporation.

2.6.2. Bulk Density

Soil sampling was realized using the cylindrical core method with stainless-steel cylinders (Eijkelkamp—E53 model https://www.royaleijkelkamp.com/products/augers-samplers/soil-samplers/undisturbed-core-samplers/soil-sampling-ring-kit-model-e53-heavy/ (accessed on 6 June 2024)). The cylinders were inserted into the soil to collect representative soil samples (three repetitions at each soil depth by treatment). After retrieval, they were immediately covered with plastic film to preserve their integrity.
In the laboratory, the collected soil samples were weighed to obtain the individual initial weights and subsequently placed in an oven at 105 °C for 48 h, ensuring complete drying regardless of their soil texture. After drying, the samples were weighed again to determine their total dry weight. The dry bulk density ρ d (g·cm−3) was calculated as
ρ d = W d W c V c  
where W d is the weight of the dry sample (g), W c is the weight of the steel cylinder (g) and V c is the volume of the cylinder (cm3).

2.6.3. Soil Penetration Resistance

In 2021, the soil penetration resistance was evaluated using the Eijkelkamp IB model hand penetrometer (Giesbeek, The Netherlands) [64]. Subsequently, for 2022 and 2023, Field Scout’s shaft-mounted digital probe SC900 (FieldScout) (Spectrum Technologies, Inc., Aurora, IL, USA) was used, aiming to enhance the measurement convenience and data accuracy. Random measurements with at least 10 repetitions per treatment were realized. Using a half-inch-diameter cone, the penetrometer provided continuous readings up to a depth of 40 cm for every 2.5 cm depth.

2.7. Soil Water Flux Monitoring

2.7.1. Soil Infiltration

Soil infiltration was characterized by measuring the quasi-steady ponded infiltration rate using the double Müntz ring method. This approach implies vertically infiltrating a uniform layer of water into the soil for a defined period until a constant infiltration rate is attained [65]. An automated device, based on the Müntz method developed by Garnier and Elamri [66], was employed to facilitate the systematic recording of infiltration data. Automation consisted of a controlled filling process for both the measurement and guard rings, ensuring a constant uniform water height during infiltration events. The system included sensors for precise water level management in the rings, enabling the filling of a specific ring from a designated reservoir. Throughout the measurement period, a Diver® probe, positioned at the base of the reservoir supplying the central cylinder, autonomously acquired the infiltrated water heights. In the central zone of each treatment, after sowing, four infiltration device replicates were used, spaced at 5 m intervals. The experiment spanned over two hours to ensure a steady-state infiltration rate. Following the approach defined by Vinatier et al. [67], the quasi-steady ponded infiltration rate was determined as the change in the infiltrated water volume per unit area of the measurement cylinder during the final 30 min of steady-state conditions.

2.7.2. Soil Evaporation

Soil evaporation was monitored using field mini-lysimeters adapted from some experimental designs [68,69,70], constructed on PVC material with dimensions of 20 cm in length and 10 cm in diameter, with a geotextile placed at the bottom. In this study, each mini-lysimeter was filled with undisturbed soil by sinking the mini-lysimeter directly into the soil to obtain representative soil conditions. The method implied monitoring the variation in the mini-lysimeter weight to assess the evaporation rate ( E R ) as follows:
E R = R M S
where R denotes the amount of rainfall or irrigation (mm), M represents the mass variation converted into water loss in mm3 (e.g., grams of water associated with each cubic millimeter) and S represents the evaporating surface area of the lysimeter (mm2). As indicated by Trambouze [69], this methodology has a limitation, because, when a water input occurs through rainfall or irrigation, the mini-lysimeter gains weight, making it difficult to differentiate the actual amount of water evaporated. Consequently, in our experiment, only the data collected during periods without rainfall or irrigation were considered.
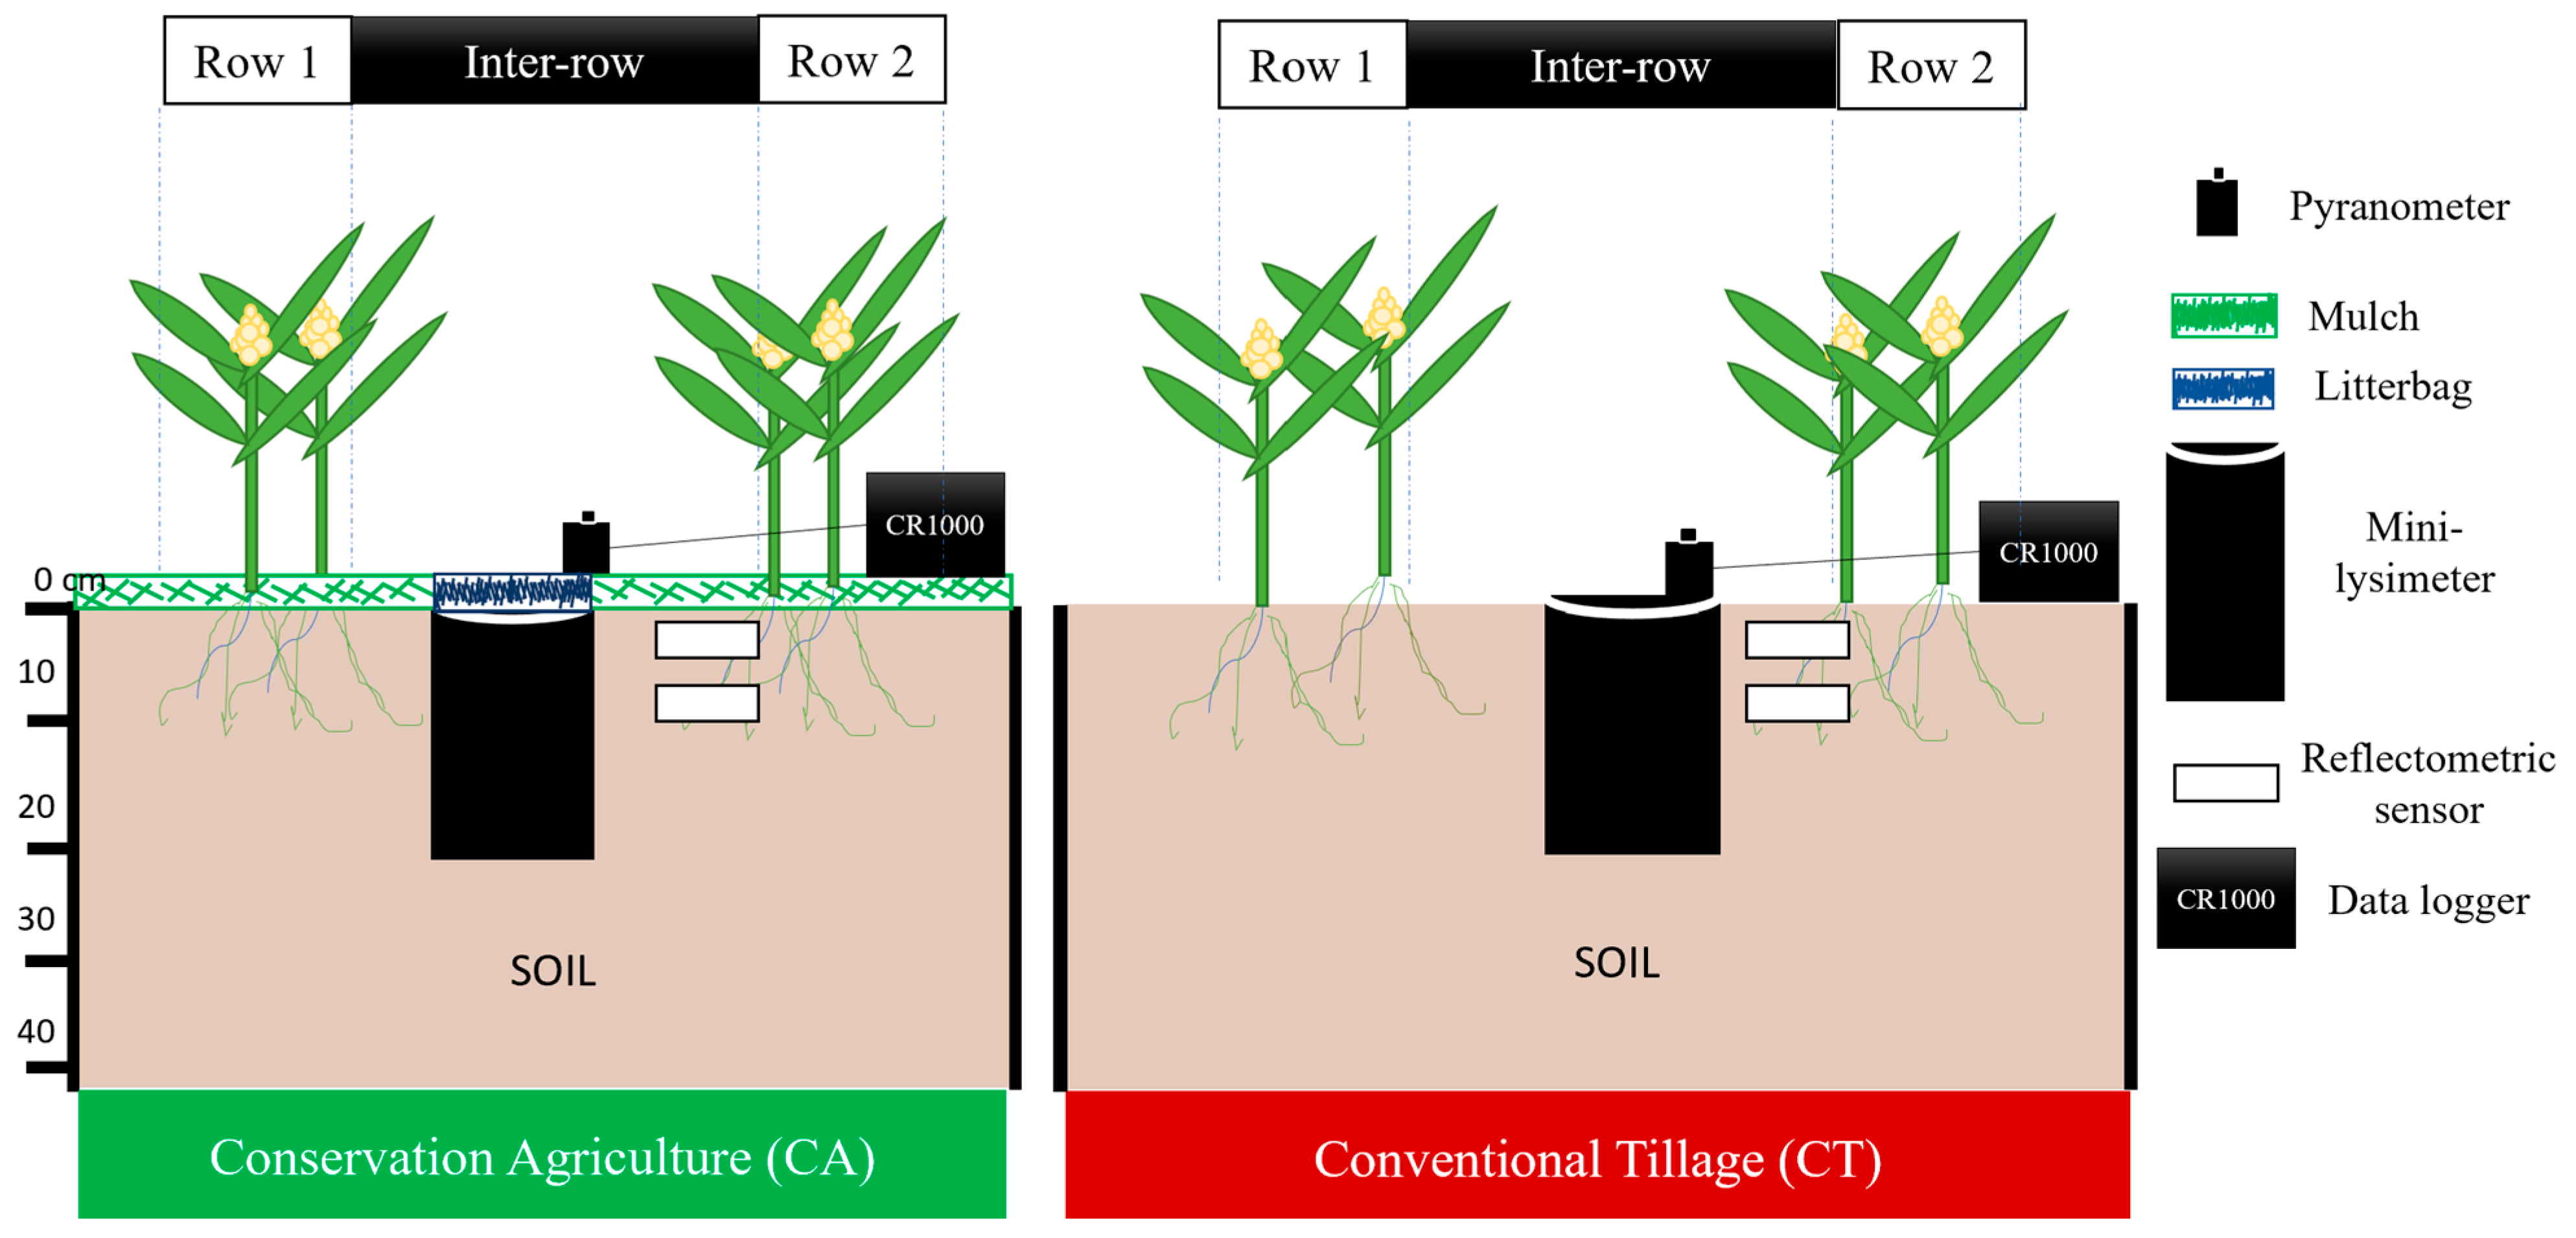
In 2021, two mini-lysimeters with undisturbed soil were placed along the crop inter-row in the central area of each of the six treatments (Figure 3). To simulate the conditions of CA with mulch at the soil surface, cover crop residues (equivalent to 3 t·ha−1 in 2021 and 6 t·ha−1 in 2022 and 2023) were laid directly onto the surface of each mini-lysimeter. In 2022 and 2023, further improvements were made to this device. Net global radiation probes (pyranometers Skye, Campbell Scientific SP1110) were placed on the soil surface of each mini-lysimeter (Figure 4). These pyranometers were used to better understand soil evaporation by measuring the net radiation arriving at the soil surface. The pyranometers were connected to the same data logger used for the soil temperature measurements, recording data every 20 min. To prevent the loss of surface mulch and its impact on soil evaporation, plant residues equivalent to the total biomass of the winter crop (6 t·ha−1 annually) were placed in litterbags. These litterbags were positioned on the surface of each mini-lysimeter (Figure 3 and Figure 4).

2.7.3. Surface Soil Water Content

The surface soil water content of each treatment was measured to evaluate its impact on soil evaporation, using CS650 reflectometric sensors (Campbell Scientific, https://www.campbellsci.fr/cs650 (accessed on 6 June 2024): Campbell Scientific France S.A.S. 41 Rue Périer, 92120 Montrouge, France), with one sensor positioned at a 3 cm depth and one placed at a 10 cm depth (Figure 3). These sensors were connected to the data logger (CR1000) used for temperature assessment, with continuous measurements at 20 min intervals throughout the cropping season.

2.8. Crop Monitoring

2.8.1. Leaf Area Index (LAI)

The leaf area index (LAI) is an indicator expressed in square meters of leaves per square meter of soil, representing crop canopy development and thus the ability to intercept light and radiation use for photosynthesis [71]. Throughout the three years of experimentation, the vegetative growth of the main crops was assessed by weekly measurements of the LAI (ten spatial repetitions per treatment to assess potentially uneven distributions of the LAI values) using the LAI-2200C plant canopy analyzer (LI-COR, Inc., Lincoln, NE, USA) from the LI-COR system [72]. Measurements were conducted during the late hours of the day to avoid direct sunlight, which is known to impact the accuracy of such measurements. These non-destructive measurements were conducted from the initial stages of crop vegetative development until the beginning of the crop senescence phase, when a decrease in the LAI values was observed, shortly after the maximum LAI values (LAImax) were reached.

2.8.2. Grain Yield (GY)

The dry grain yield was determined at harvest by calculating the average of five random samples taken from the aboveground components of the plants, including the leaves, stems and cobs, within an area of 1.44 m2. The plants were meticulously separated into individual vegetative components, weighed and subsequently dried in laboratory ovens at a constant temperature of 65 °C for 48 h, until the grain reached stable moisture content of 12–15%. Following the drying process, the kernels were separated from the corncobs, sorghum panicles or soybean pods to estimate the grain yield.

2.9. Total Water Productivity and Irrigation Water Productivity

The total water productivity and irrigation water productivity were calculated for each cropping season as practical, straightforward indicators of the water use efficiency in crop production. The total water productivity ( T W P ), expressed in kg·m−3, can be defined as follows [73]:
T W P = G Y I + R
where G Y is the grain yield in kg·ha−1, and I and R denote the water application depths from irrigation and rainfall, respectively, measured in m3·ha−1.
The irrigation water productivity ( I W P ), also expressed in kg·m−3, can be defined [74] as
I W P = G Y i G Y r I
where G Y i and G Y r are the grain yields in kg·ha−1 under irrigated and rainfed conditions, respectively.

2.10. Dates of Measurement

Table 3 shows the measurement dates for the period 2021–2023. All measurements were performed in the middle of each treatment plot.

2.11. Statistical Analysis

This study employed a factorial design to investigate the effects of two categorical variables (“practice” and “irrigation system”) on a set of continuous responses. Practice was divided into two levels (CA and CT) and irrigation system into three levels (S, SSD and NI), resulting in a total of six experimental treatments. To assess the main effects of each variable independently, the Kruskal–Wallis test was employed to ensure robustness against violations of parametric assumptions (normality and variance homogeneity). To evaluate interactions, two linear models were constructed to assess the joint and individual effects of the practice and irrigation system and their interactions on a continuous response variable. The first model exclusively considered the main individual effects, expressed as
Y = β 0 + β 1 X 1 + β 2 X 2 + ϵ
where Y is the so-called “dependent variable” (the effect), and X 1 and X 2 denote the “categorical independent variables” (practice and irrigation system, respectively). Here, β 0 is the “intercept”, which represents the residual value of Y when all independent variables are zero—in other words, the part of the effect that is unexplained by the variables accounted for. The coefficients β 1   and   β 2 are the “regression coefficients” denoting the strength of the effects associated with X 1 and X 2 , respectively, and ϵ represents the error. The second model considered both the main individual effects and interactions:
Y = β 0 + β 1 X 1 + β 2 X 2 + β 3 X 1 × X 2 + ϵ
where β 3 is the coefficient associated with the interaction term X 1 × X 2 . The significance of the interaction term was assessed using an ANOVA or analysis of variance. The null hypothesis stated that the inclusion of the interaction terms did not significantly improve the overall fit of the model. A p-value below the pre-specified significance level (typically 0.05) indicated a significant interaction effect. This analytical procedure was applied to a larger set of response variables, handled separately, allowing for a systematic assessment of the impact of the tested factors. To conduct these statistical analyses, the R package (r-stats) version 2.0 was employed, ensuring the accuracy and reproducibility of the results.
A principal component analysis (PCA) was conducted specifically for soil evaporation assessment, to evaluate the correlation between soil evaporation and other variables, including the soil moisture (taking the average value between a 3 and 10 cm soil depth), net global radiation at the soil surface, LAI and soil temperature (also taking the average value between a 3 and 10 cm soil depth), which are also thought to control evaporation. The analysis was limited to the days on which all variables were measured in the field, during the 2022 and 2023 cropping seasons.

3. Results

3.1. Soil Temperature

The seasonal mean soil temperatures, between a 3 and 10 cm depth (horizontal black line in each sketch in Figure 5), presented comparable values for most of the CA and CT treatments, with the differences remaining below 5%. However, significant variations appeared between the irrigation systems, notably in 2022, where treatments with S irrigation resulted in mean soil temperatures that were up to 4 °C lower than in the SSD and NI treatments.
In CA, the soil temperature fluctuations were notably damped in comparison with CT (the envelopes of the red and orange curves are narrower for CA), especially during periods of high temperatures early in the crop cycle, when residues remained on the soil surface (Figure 5). Across all cropping cycles, CA consistently led to lower maximum soil temperatures and higher minimum soil temperatures than CT. For example, during the S cropping cycle in 2021, the seasonal mean of the maximum soil temperatures at the 3 and 10 cm depths was 6 °C lower under CA, while the seasonal mean of the minimum soil temperatures was 2 °C higher. This trend persisted across the years and cropping cycles, highlighting the insulating effect of residues under CA practices.

3.2. Bulk Density

Figure 6 presents the soil bulk density profiles across the three experimental years. In 2021, measurements were only performed on the CA-S, CA-SSD and CT-SSD treatments, for the 0–20 cm horizon. The bulk density ranged from approximately 1.35 g·cm−3 for CT to 1.55 g·cm−3, with CA exceeding CT by 11–14%. During 2022, the bulk density evaluations were extended to the 0–60 cm depth for all treatments, with values ranging from 1.48 g·cm−3 to 1.75 g·cm−3. Treatments irrigated with SSD showed the highest density values, particularly beyond the 15 cm depth, surpassing 1.70 g·cm−3. While the mean bulk density varied between CA and CT at different soil depths, the differences remained below 6% across the 0–60 horizon, except for the S treatments at 5 cm (15%). In 2023, the measurements were limited to the 0–30 cm horizon, with the mean values ranging from 1.4 g·cm−3 to 1.68 g·cm−3. The CA mean values surpassed those of CT, especially at 5 cm (15%) and 15 cm (up to 10%), with minimal differences at 25 cm (<5%).
Between 2021 and 2022, there was a 4.5% increase in the mean bulk density (between all depths) for CA and a 20% increase for CT. However, these values declined in 2023, by 2.5% for CA and 4.8% for CT, in comparison to 2022. The bulk densities for CA appeared roughly stable across all depths for all years, while the bulk density values for CT decreased near the soil surface as a direct consequence of ploughing. Notably, CT showed lower values in 2021 compared to subsequent years, likely due to the measurements being taken shortly after seedbed preparation, in contrast to 2022 (1 month later) and 2023 (3 months later), allowing more time for natural soil consolidation and the formation of surface crusts as a result of rainfall and sprinkler irrigation.

3.3. Soil Penetration Resistance

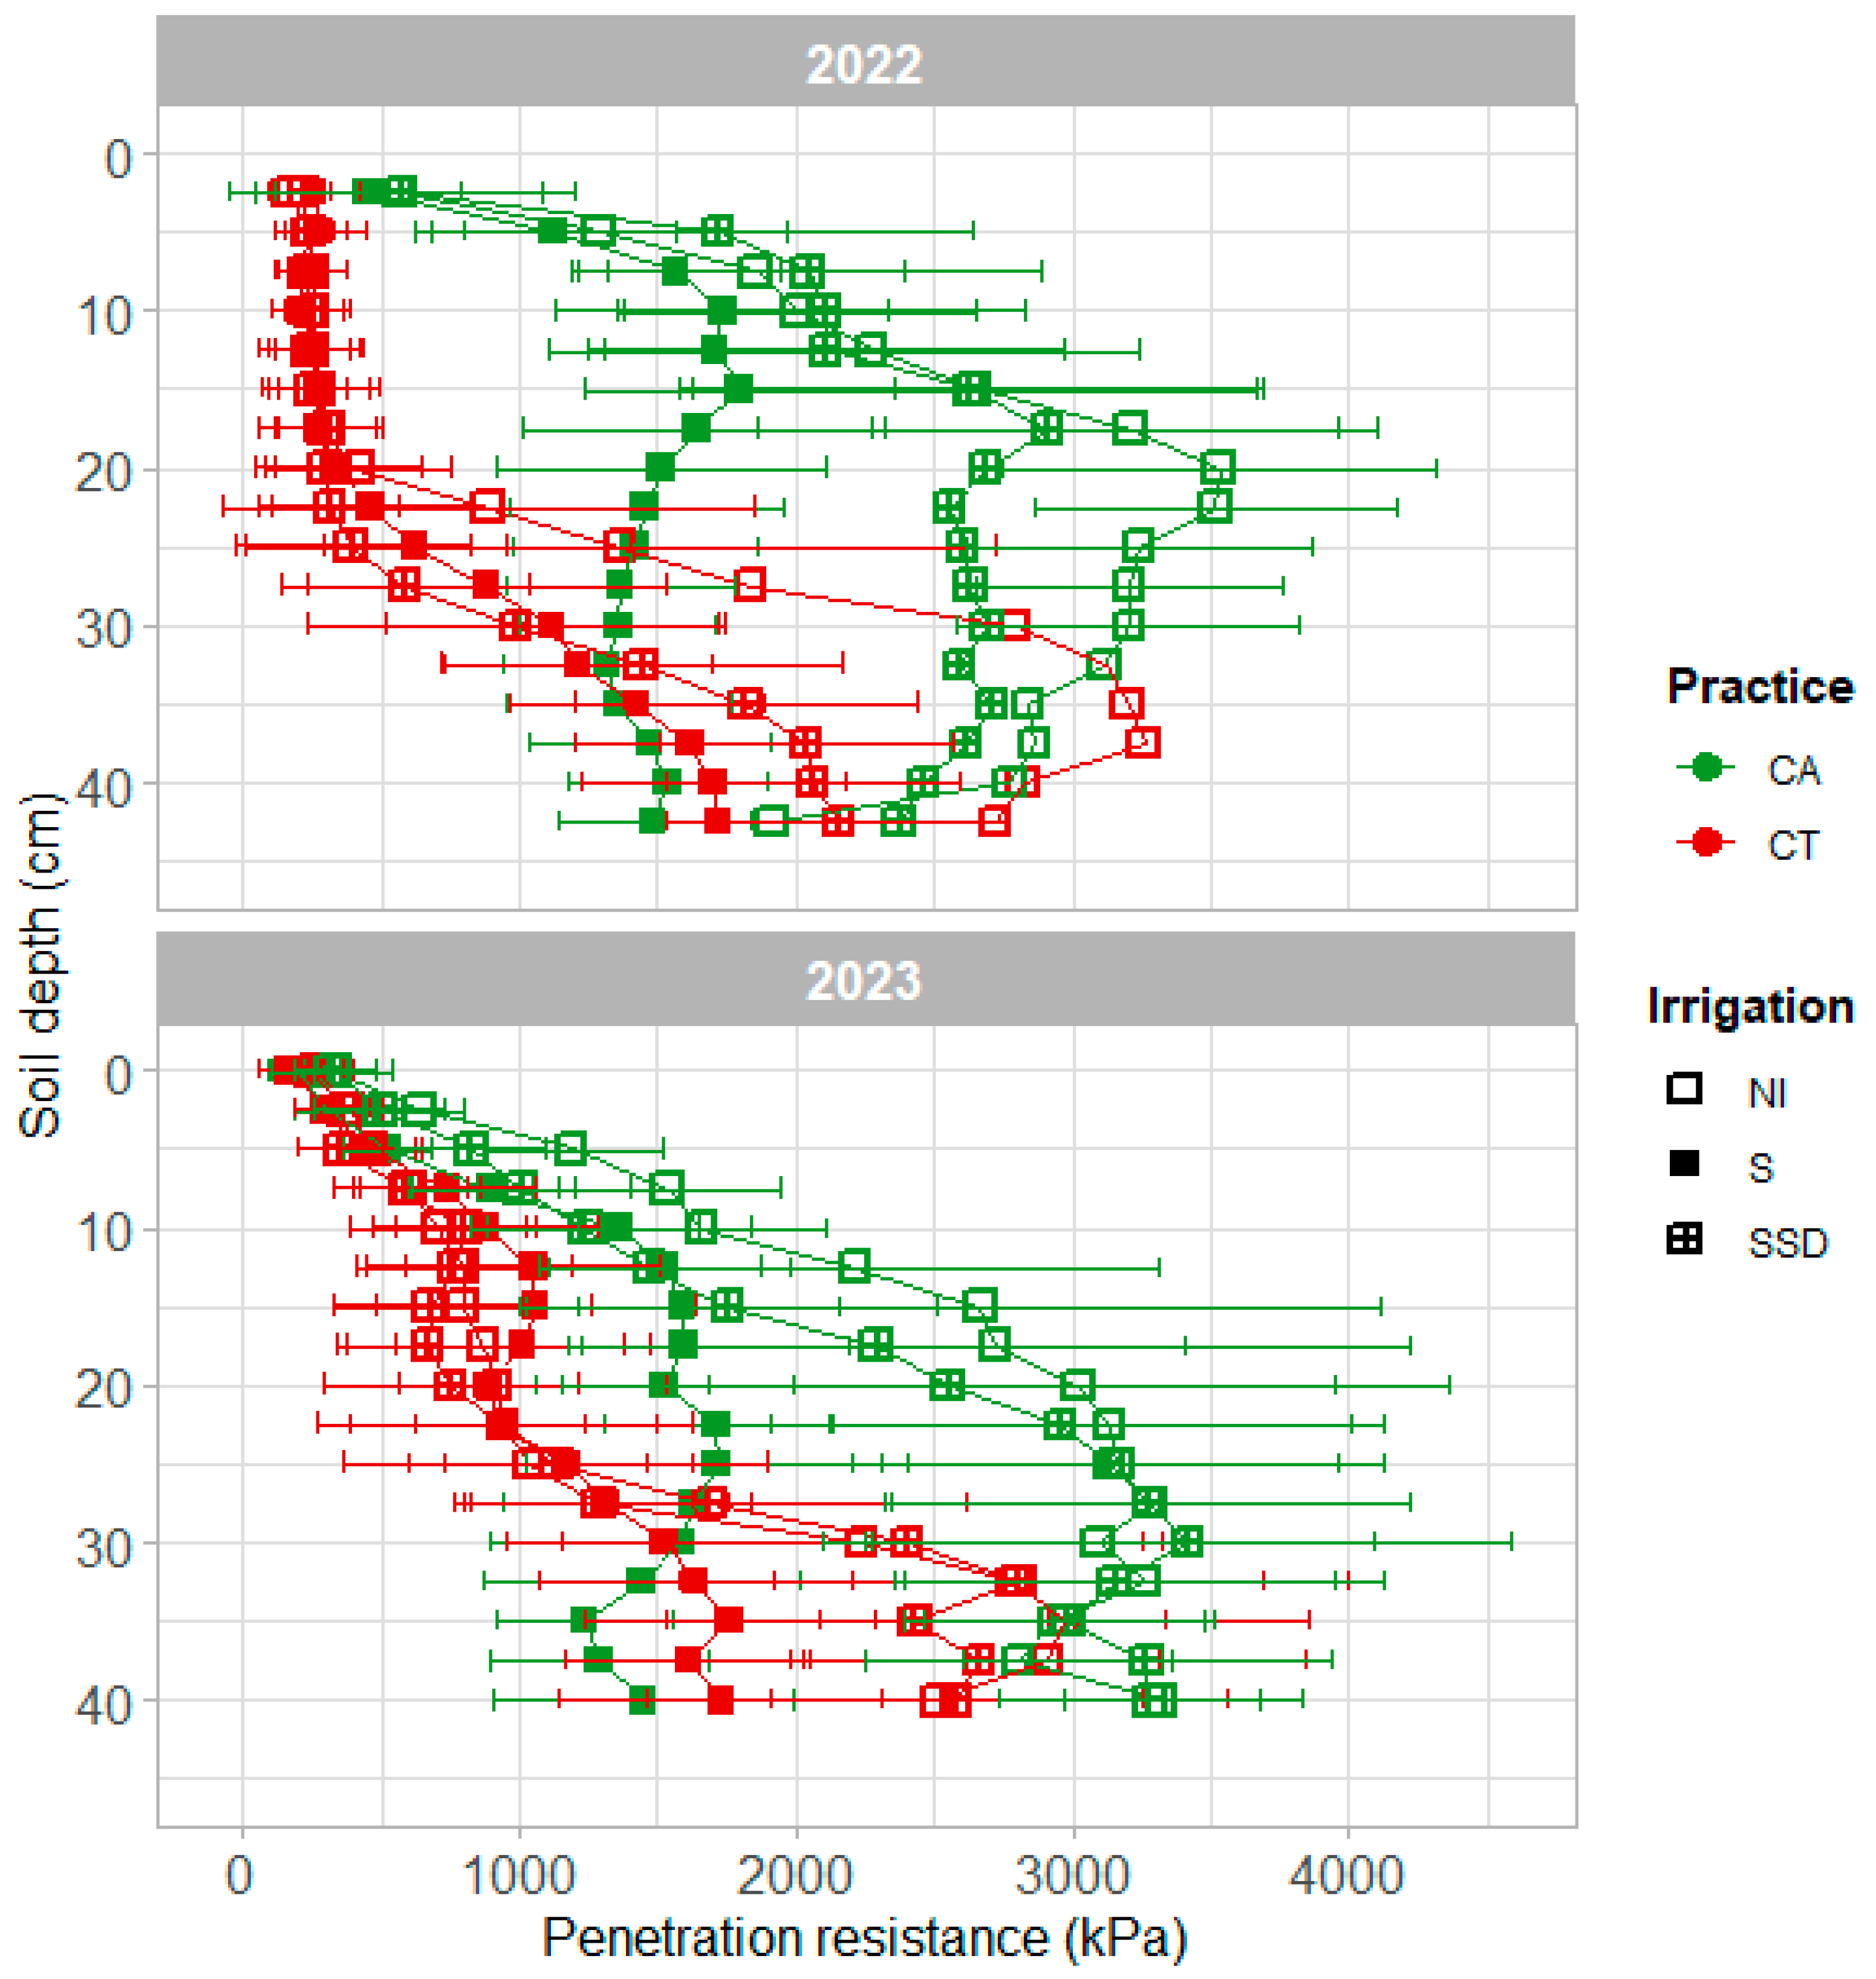
Measurements performed in 2021 suggested that CA exhibited higher penetration resistance compared to CT. However, the manual method employed, lacking precision, was finally discarded. An improved methodology was implemented from 2022 onwards, using a digital penetrometer. In 2022 and 2023, along the soil profile, with soil volumetric water content of approximately 20%, the penetration resistance tended to be higher in CA by 33–47% compared to CT, and there was a common trend toward increasing penetration resistance with increasing depth (Figure 7). Specifically, the CA-NI and CA-SSD treatments showed penetration resistance values exceeding 2500 kPa below 10 cm, which then further increased with the depth. In 2023, these treatments resulted in increased resistance by more than 50%, particularly below 20 cm. In contrast, the CA-S treatment demonstrated lower and stable values, around 1500 kPa for both years. Finally, CT showed low penetration resistance at the surface (<1000 kPa), which increased abruptly for the SSD and NI treatments below 30 cm, surpassing 2000 kPa.

3.4. Quasi-Steady Ponded Infiltration

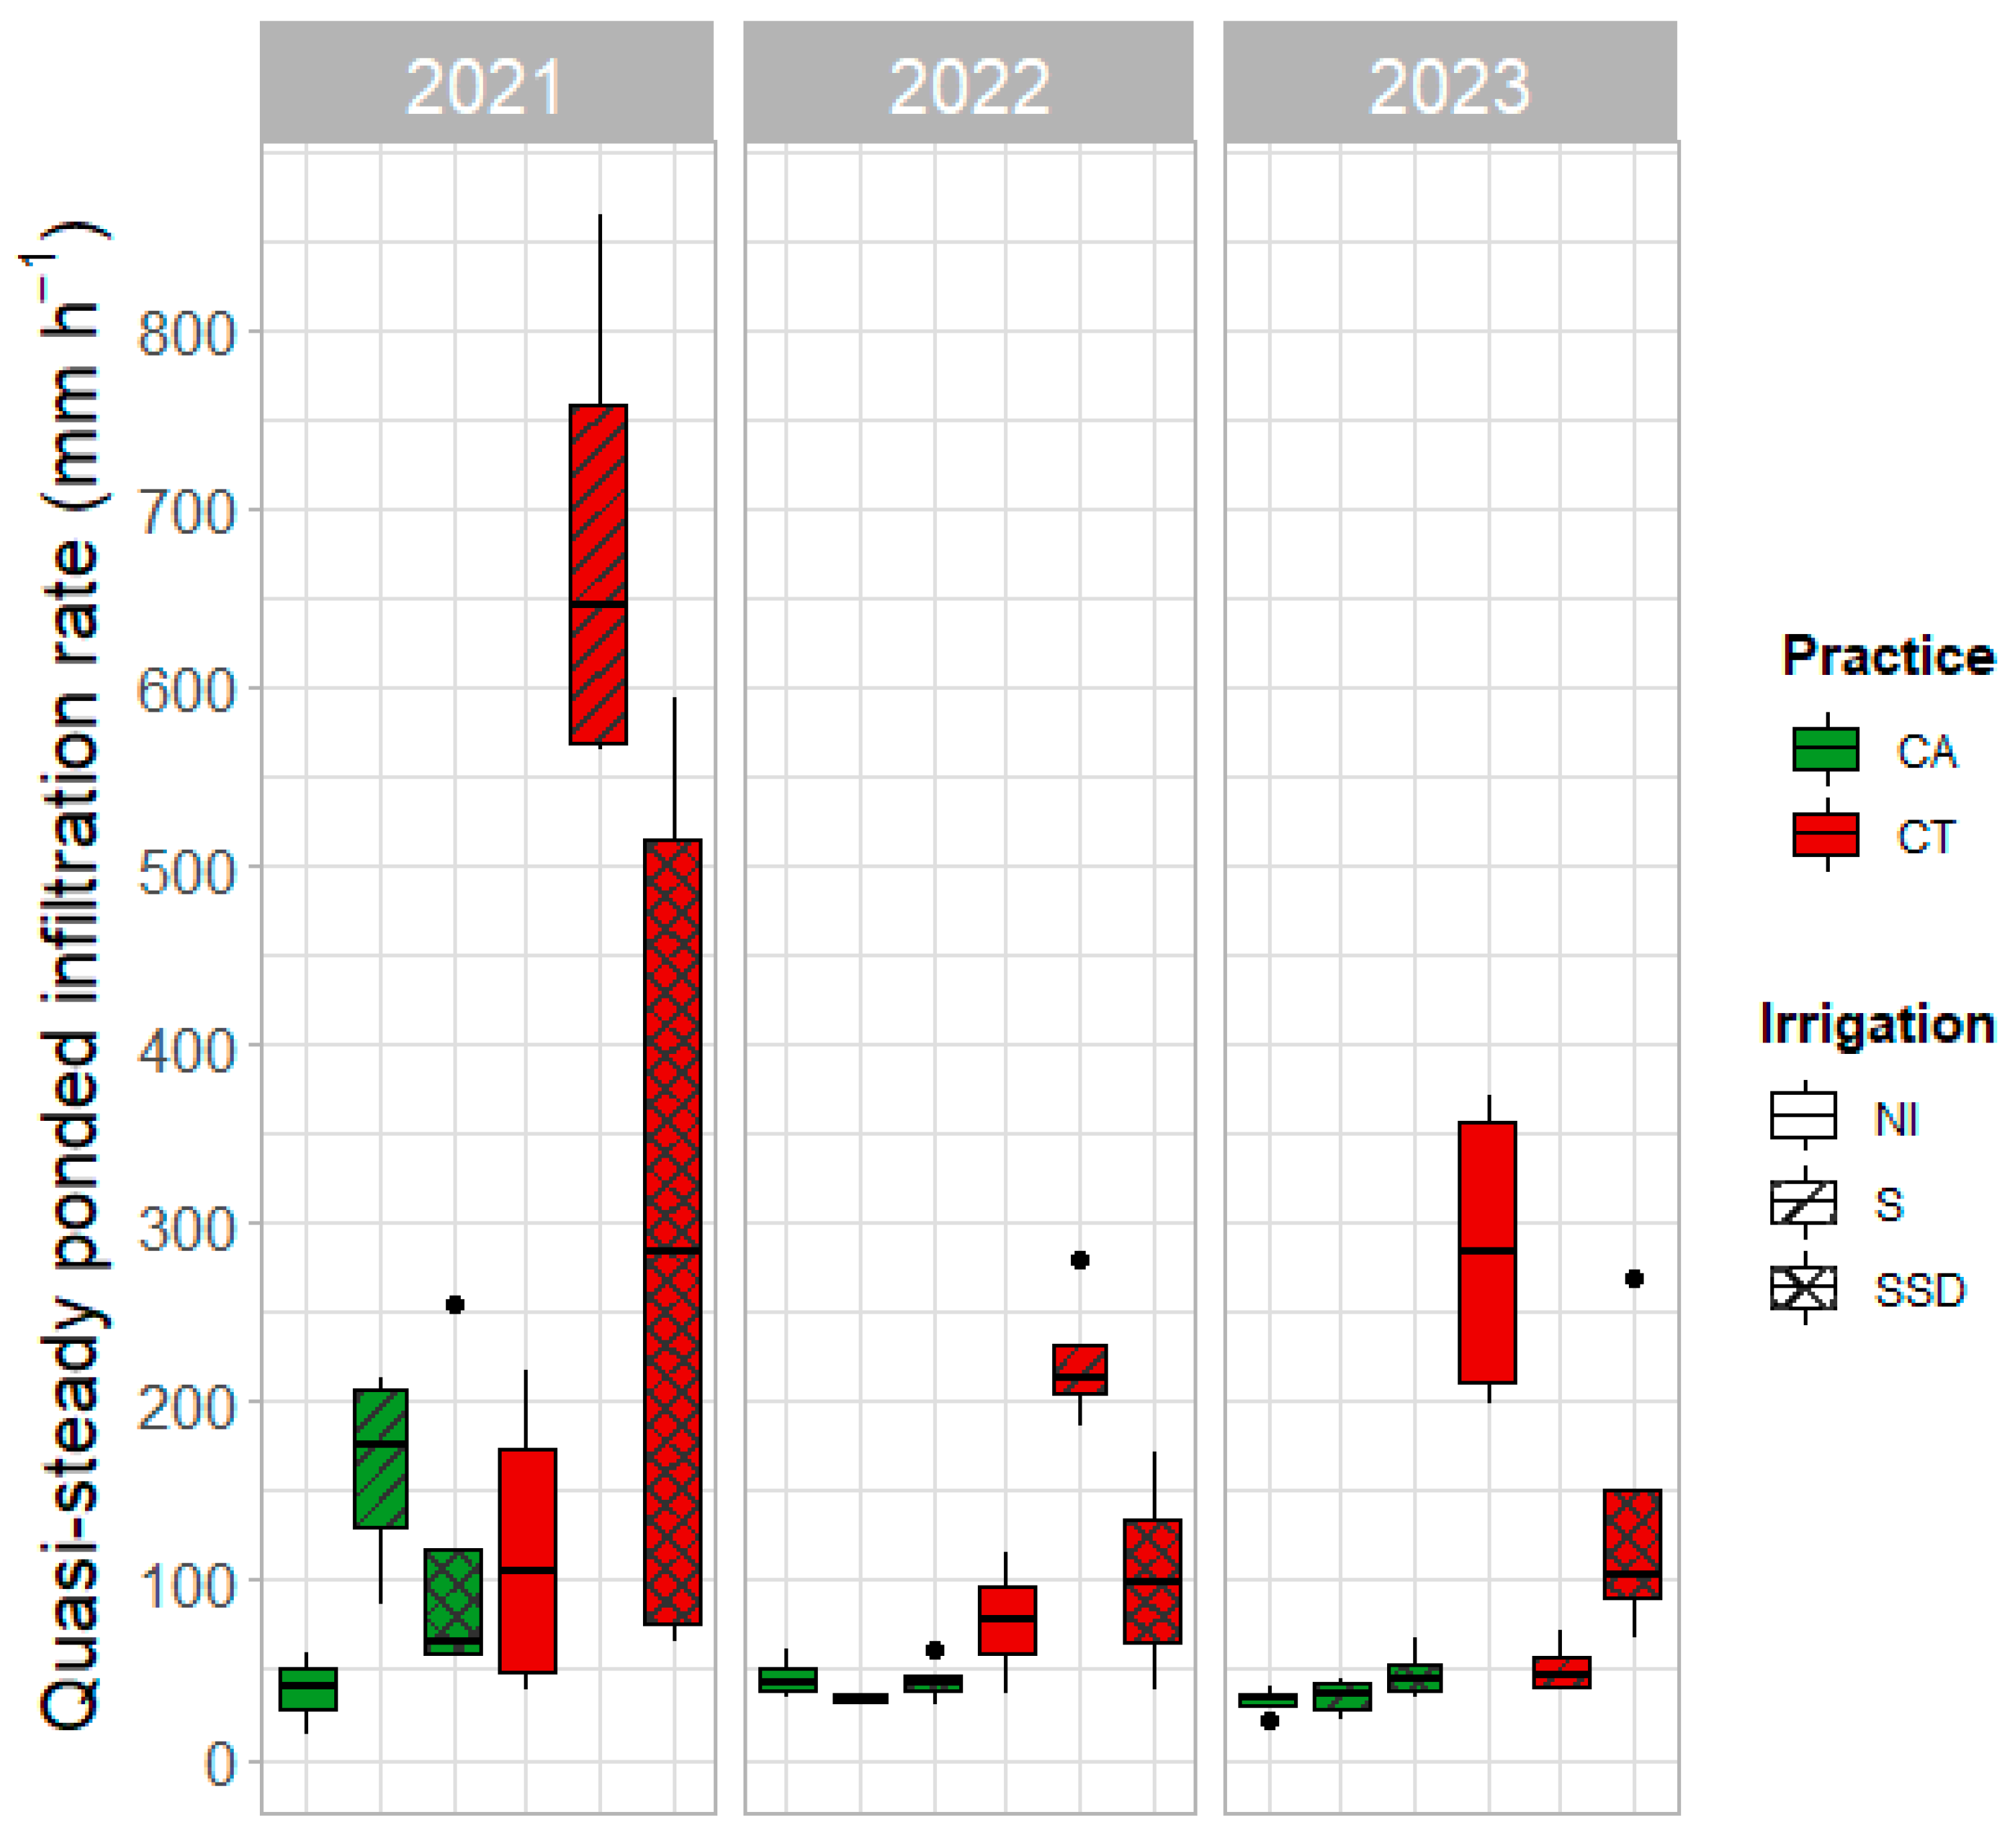
The quasi-steady ponded infiltration values exhibited clear differences between CA and CT (Figure 8). In 2021, the standard deviations for CA ranged from 23 mm·h−1 to 96 mm·h−1, while, for CT, they ranged from 86 mm·h−1 to 274 mm·h−1. These deviations decreased in 2022, with CA showing values ranging from 3 mm·h−1 to 13 mm·h−1 and CT from 40 mm·h−1 to 58 mm·h−1. By 2023, the standard deviations were further reduced to 7 mm·h−1 to 14 mm·h−1 for CA and 15 mm·h−1 to 90 mm·h−1 for CT. These variations highlight the small-scale heterogeneity in the soil properties despite the relatively short distance between the measurement points (5 m).
Throughout all three years, CT consistently displayed higher infiltration rates compared to CA, regardless of the irrigation system. In 2021, CT-S gave the highest value at 680 mm·h−1, followed by CT-SSD at 306 mm·h−1. CA-S followed with 162 mm·h−1, while CT-NI and CA-SSD were close at 117 mm·h−1 and 111 mm·h−1, respectively. The lowest value was observed for CA-NI at 38 mm·h−1. In 2022, the infiltration rates decreased across all treatments, compared to 2021. CT-S led with 223 mm·h−1, followed by CT-SSD at 101 mm·h−1 and CT-NI at 77 mm·h−1; then, CA-SSD, CA-NI and CA-S followed at 46 mm·h−1, 44 mm·h−1 and 34 mm·h−1, respectively. In 2023, CT-NI gave the highest rate at 284 mm·h−1, followed by CT-SSD at 136 mm·h−1 and CT-S at 51 mm·h−1. CA showed lower rates between 33 and 48 mm·h−1.
Moreover, within CA, the infiltration rates decreased with the time that had elapsed since the last tillage (spring 2020). Additionally, CA exhibited less temporal variability in the infiltration rates compared to CT.

3.5. Soil Evaporation

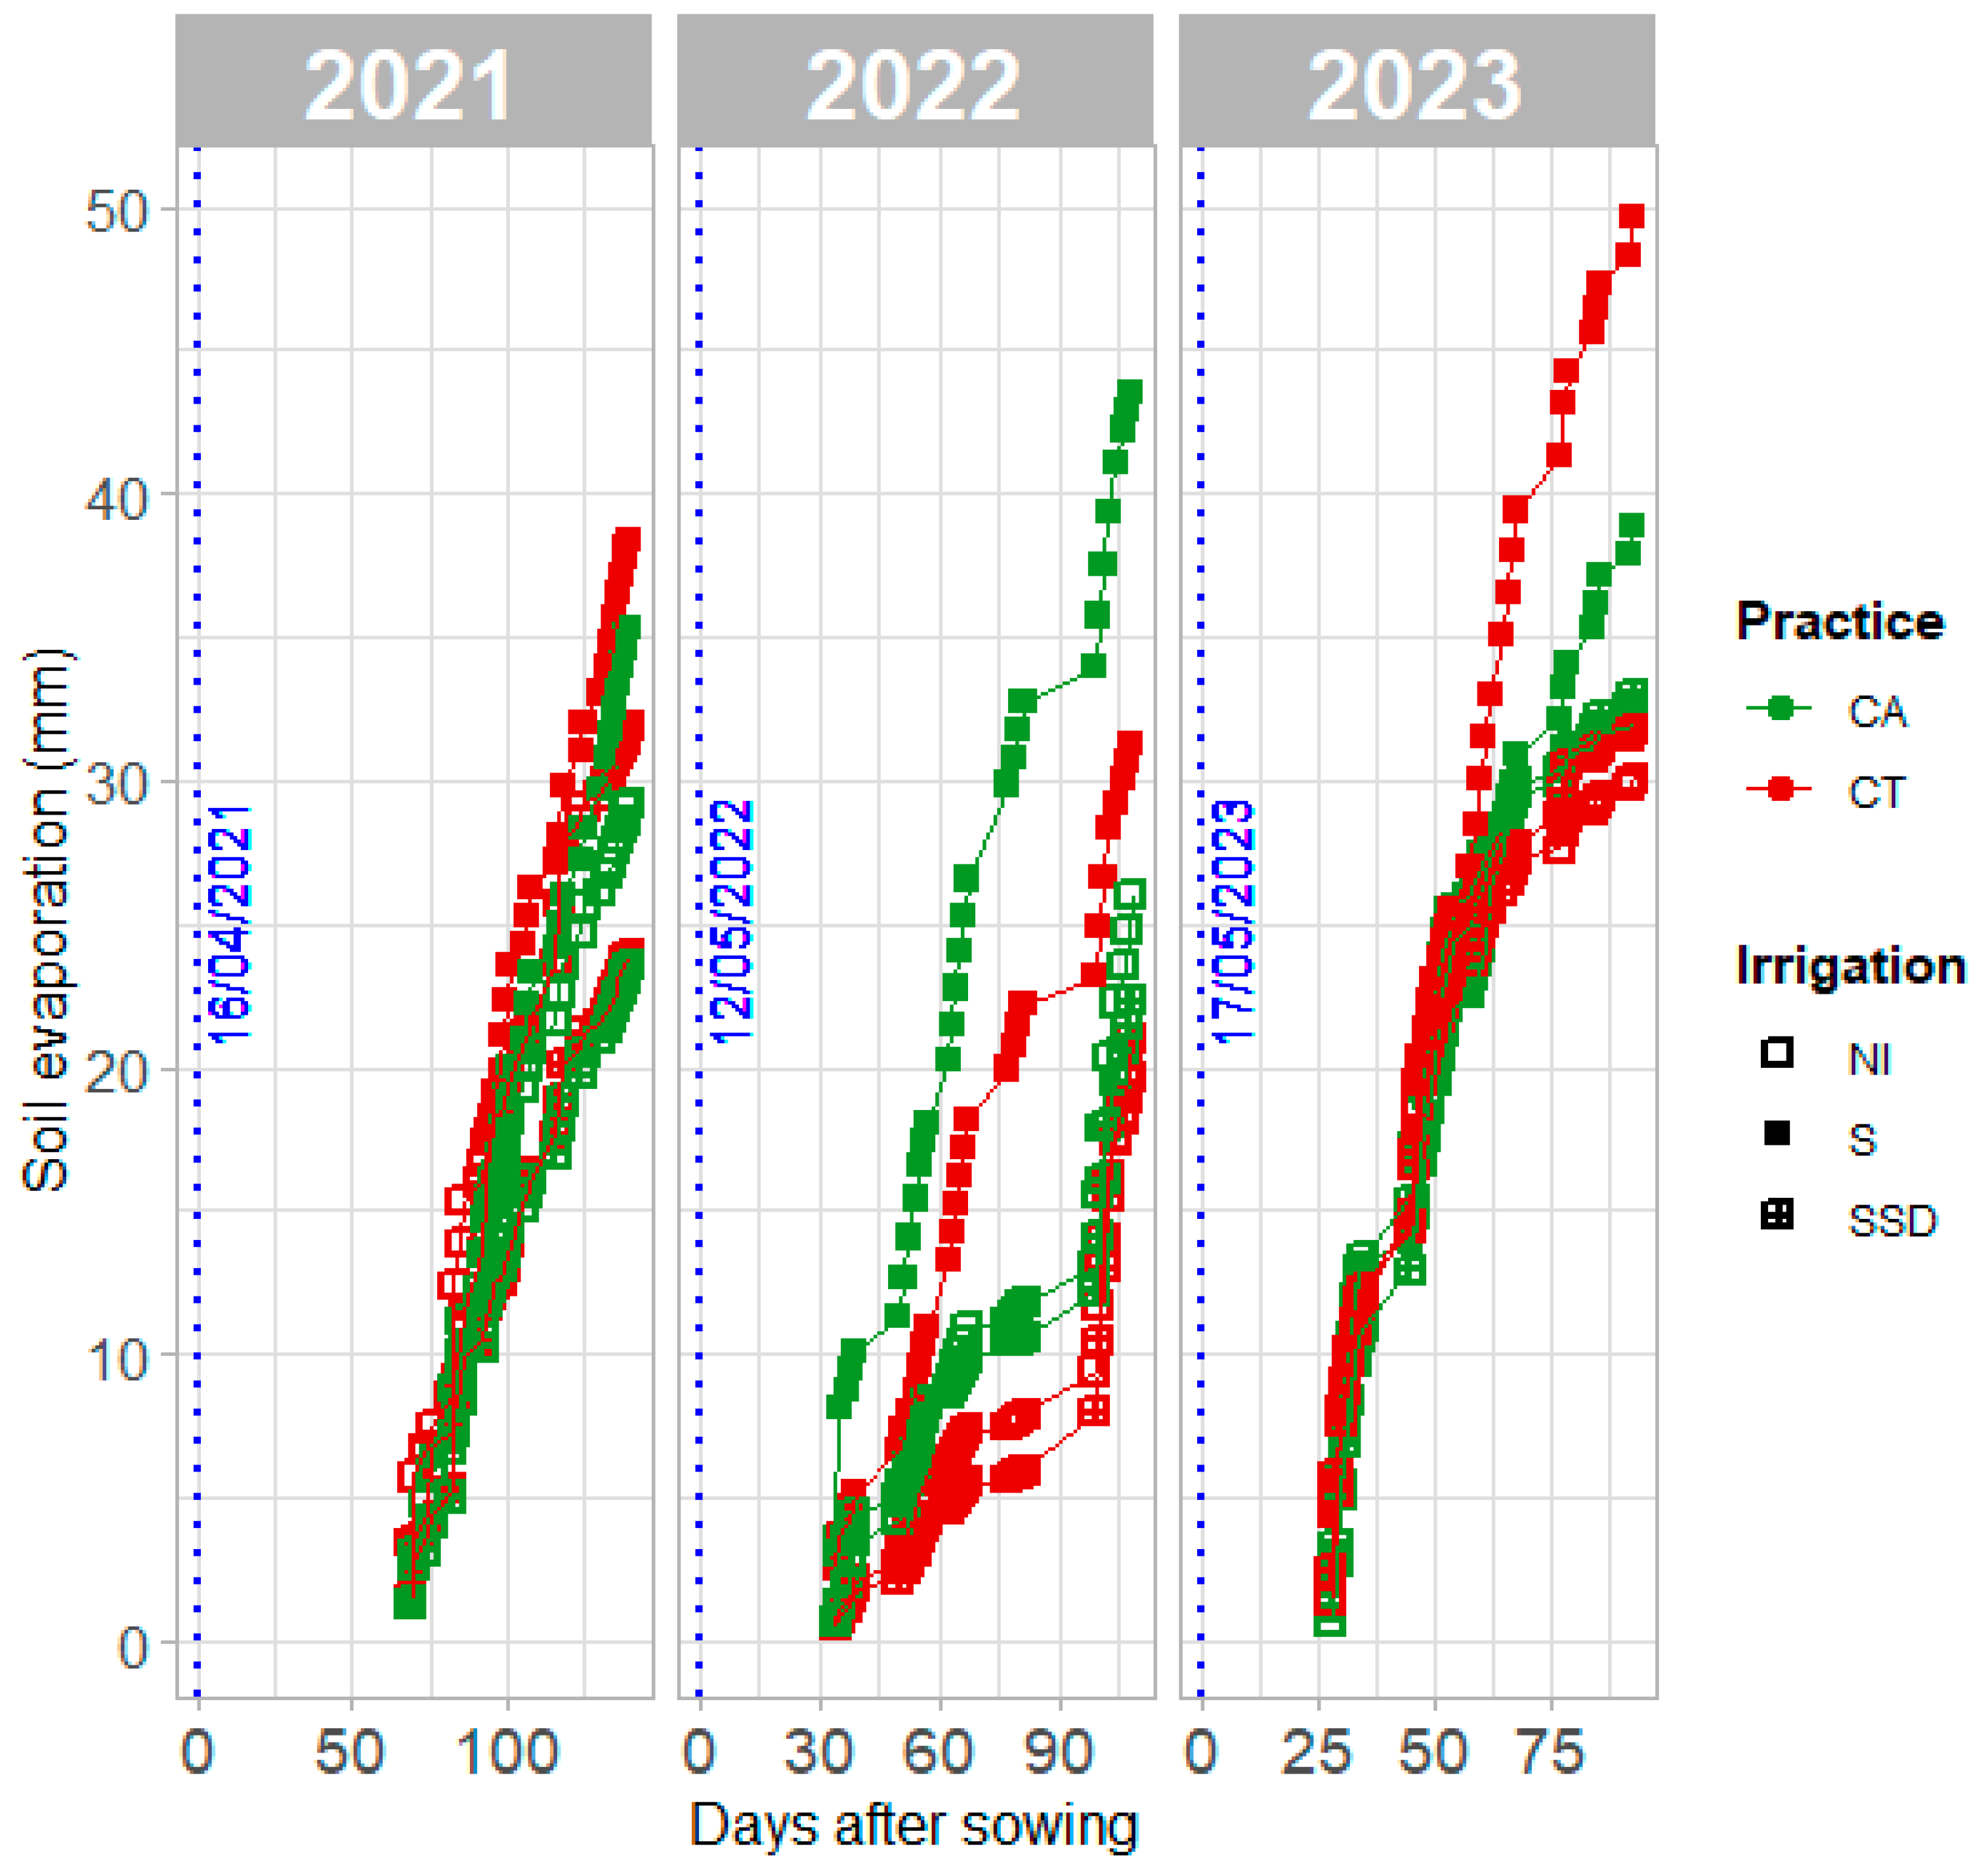
The cumulative soil evaporation curves represent measurements taken outside of rainy or irrigated periods (Figure 9). The soil evaporation measurements began 69 days after sowing in 2021, 34 days in 2022 and 28 days in 2023. In 2021, CA exhibited lower cumulative soil evaporation values compared to CT, with differences of −8%, −2% and −8% for S, SSD and NI, respectively. However, in 2022, CA showed higher values, with differences of +28%, +6% and +24% for S, SSD and NI, respectively. In 2023, CA demonstrated lower values than CT for S irrigation, with a difference of −22%, while presenting higher values with differences of +4% and +6% for SSD and NI, respectively. Hence, all trends were present, meaning that multiple factors likely intervene and may be challenging to identify and even more so to isolate. Nevertheless, clear variations were noted between the irrigation systems: the S treatments displayed higher cumulative soil evaporation values compared to SSD and NI, with differences of 36% and 17% for 2021, 42% and 39% for 2022 and 27% and 16% for 2023 for SSD and NI, respectively.
The impact of cover crop residues left on the soil surface in CA was not clearly discernible across all years of observation. This was due to the quick degradation (a few weeks at the very most) of most cover crop residues with a predominance of legumes during the soil evaporation study periods in 2021 and 2022, resulting in minimal global effects on the cumulative evaporation. Additionally, noticeable differences in vegetative growth, between treatments and during the same periods, were expected to have a strong influence on the net soil evaporation dynamics.
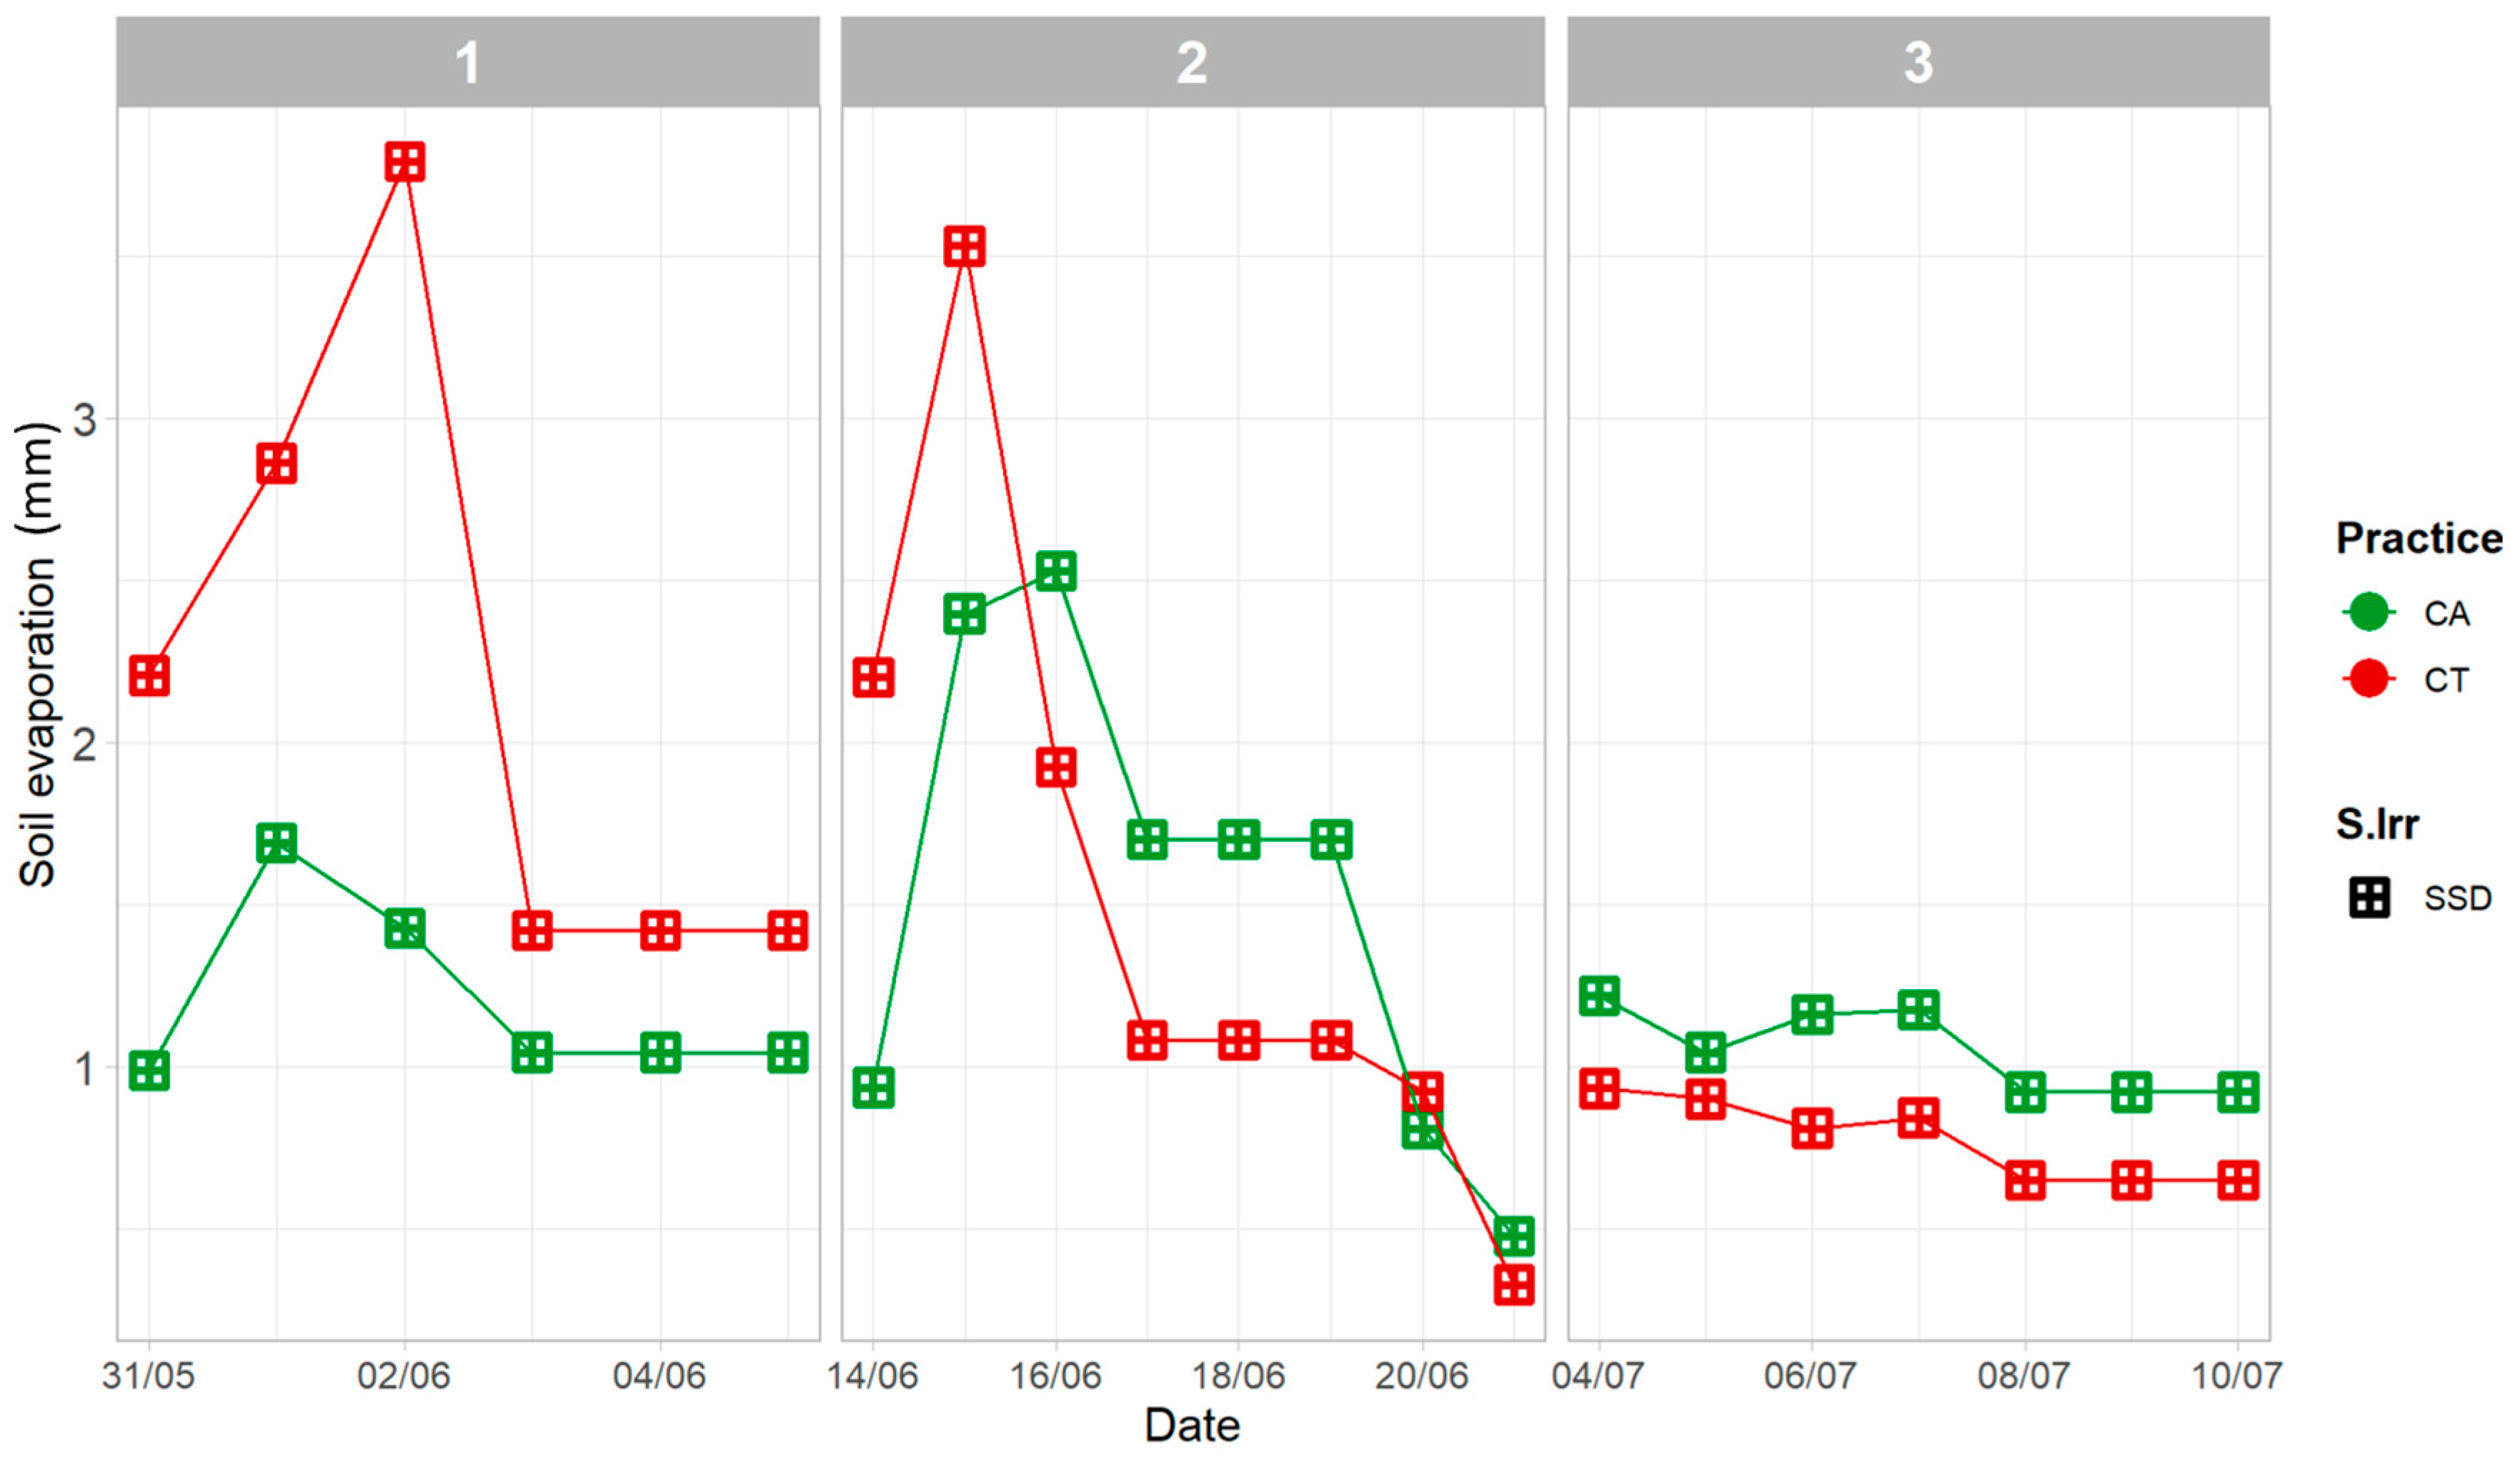
To clarify these points, a more detailed examination was conducted in 2023, focusing on three specific periods along the crop cycle, following rainfall or irrigation events for the SSD treatment under CA and CT (Figure 10). During the first period (May 31 to June 5), the LAI of the main crop was 0 m2·m−2 and the cover crop residues on the soil surface in CA had a mass of 421 g of dry matter per m2. This resulted in lower evaporation rates for CA compared to CT. By the second period (June 14 to 21), the LAI was 0.2 m2·m−2 and the residue mass in CA had decreased to 248 g of dry matter per m2, leading to slightly higher evaporation rates in CA compared to CT. As for the third period (July 4 to 10), the LAI values increased to 1.1 m2·m−2 for CT and 0.8 m2·m−2 for CA, with the residues in CA further degraded to 200 g of dry matter per m2. At this point, the evaporation rates between the two treatments were nearly identical, with less than a 0.5 mm difference, suggesting that both the residue mass and LAI influenced soil evaporation. However, by this stage of crop growth, additional factors may also have contributed to the observed evaporation rates.
To further investigate the multiple determinants of the soil evaporation dynamics, a principal component analysis (PCA) was conducted using data from 2022 and 2023 (Figure 11). This dataset included variables such as the LAI, net global radiation at the soil surface, soil surface temperature (averaged from 3 to 10 cm) and soil surface moisture (averaged from 3 to 10 cm).
The analysis reveals that the first two principal components together capture approximately 80% of the total variance in the data (Figure 11a), providing a comprehensive understanding of the factors driving soil evaporation. Dimension 1 (Dim 1, 53.9% of the variance) highlights soil moisture as the dominant factor controlling soil evaporation, as demonstrated by their strong positive correlation. This indicates that water availability is the primary constraint on evaporation within the dataset. Conversely, the soil temperature exhibits a negative correlation with evaporation, suggesting that limited moisture availability may inhibit evaporation, even when the soil temperature is elevated. This inverse relationship implies that the temperature alone is not a sufficient driver of evaporation without enough soil moisture. Additionally, the LAI shows a negative correlation with the net global radiation, indicating that the increased interception of solar radiation by the canopy reduces the radiation reaching the soil surface. This shading effect plays a critical role in moderating both the soil temperature and moisture retention.
Dimension 1 clearly separates the treatments based on their moisture availability and evaporation patterns (Figure 11b). The S treatments are clustered on one side of Dim1, reflecting higher water availability and evaporation rates, while the NI and SSD treatments are grouped on the opposite side, indicating lower moisture levels and reduced evaporation. In contrast, Dimension 2 (Dim 2, 25.3% of the variance) reveals only slight differences between CA and CT. In CA systems, soil evaporation appears to be more influenced by the interaction between soil moisture and global radiation, whereas, in CT systems, factors such as the LAI and soil temperature seem to exert a stronger influence on the evaporation dynamics.

3.6. Leaf Area Index (LAI) and Grain Yield (GY)

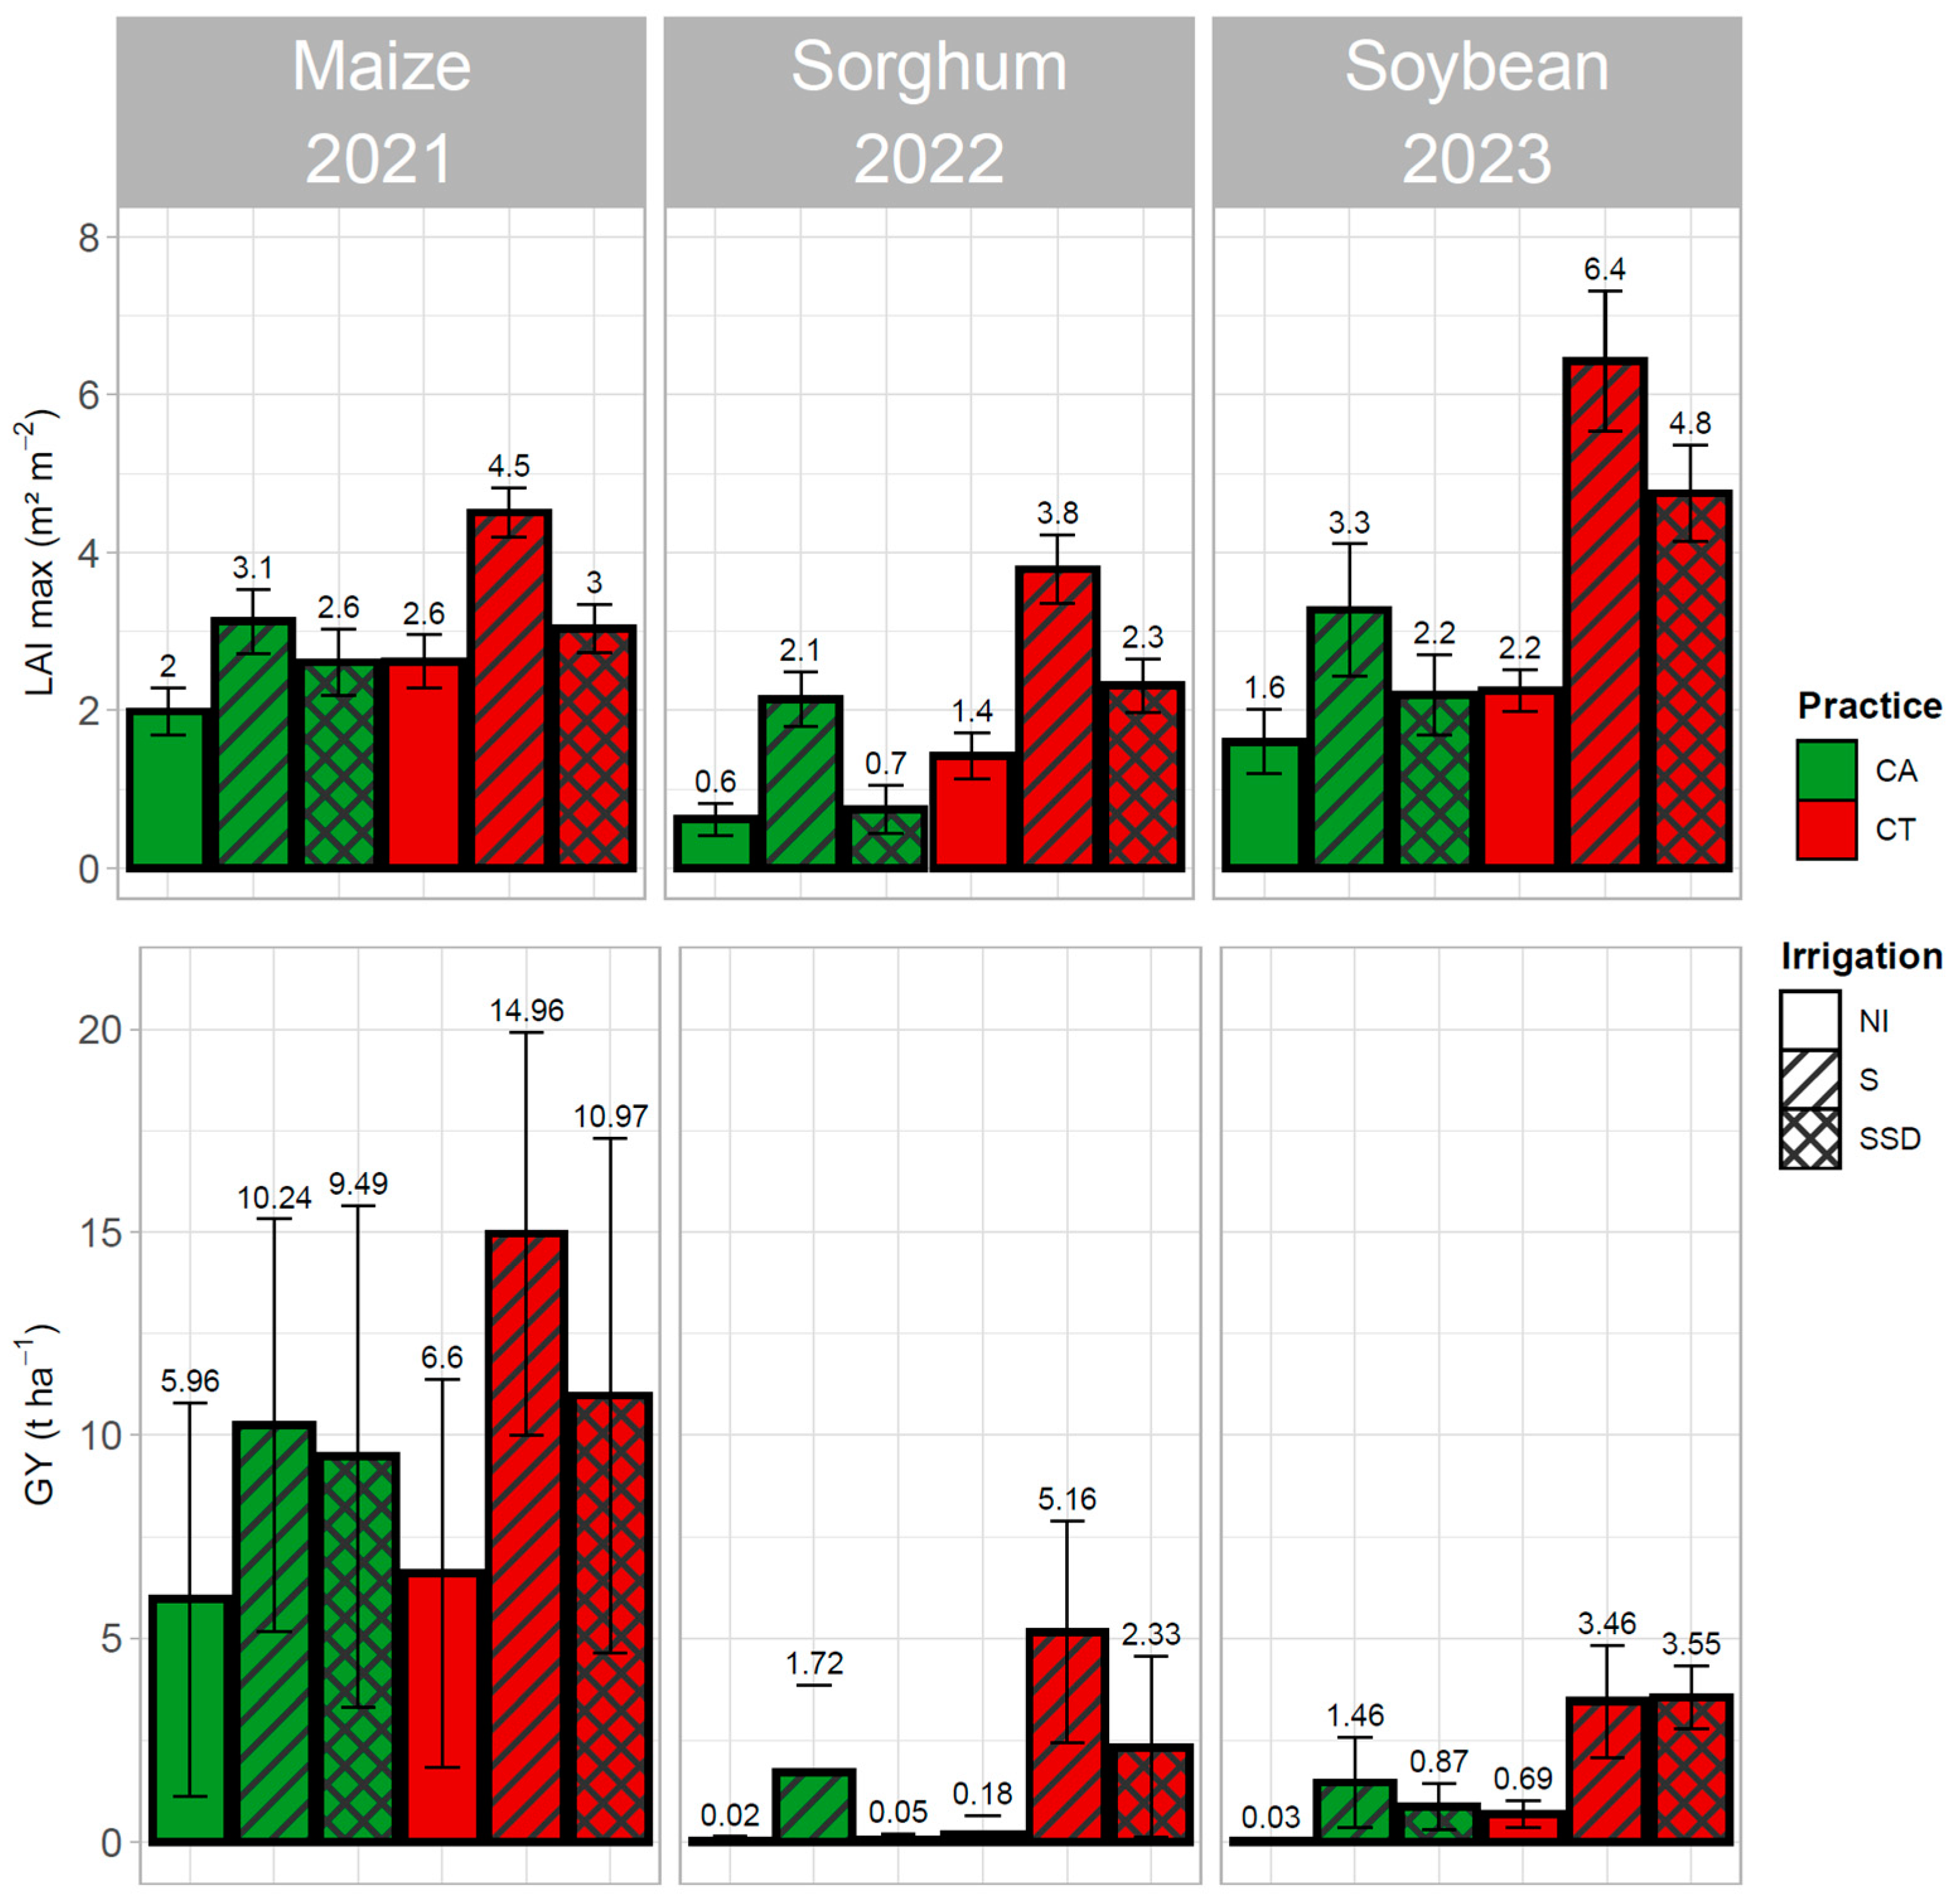
The maximum leaf area index (LAImax) and total grain yield (GY) values are indicated in Figure 12. They followed a similar trend throughout the three years, with CA consistently showing lower values than CT, regardless of the irrigation method, indicating reduced crop development in CA. In 2021, the LAImax values for CA were 31%, 14% and 24% lower than CT for S, SSD and NI, respectively. The differences became more pronounced in 2022, with reductions of 44%, 68% and 56% for S, SSD and NI, respectively, and with 49%, 54% and 29% reductions in 2023 for S, SSD and NI, respectively. Among the irrigation methods, S consistently produced the highest LAImax, followed by SSD and NI.
Similarly, in 2021, the GY was lower in CA by 28%, 15% and 9% for S, SSD and NI, respectively, compared to CT. These differences widened significantly in subsequent years. In 2022, the GY in CA was 65%, 98% and 88% lower than in CT for S, SSD and NI, respectively. In 2023, the reductions were 65%, 76% and 95%. Across all years, the S irrigation method always resulted in the highest GY, followed by SSD irrigation and NI.

3.7. Water Productivity

The trends in the total water productivity (TWP) and irrigation water productivity (IWP) matched the observed grain yield patterns over the three years (Table 4). Specifically, higher values of TWP and IWP were constantly observed in CT compared to CA, and the values for S-irrigated treatments were higher compared to the SSD and NI treatments. This was expected as the water productivity is closely linked to the yield. In 2021, the TWP in CA was reduced by 40%, 16% and 11% compared to CT for the S, SSD and NI treatments, respectively. These differences became more pronounced in 2022, where the reductions in TWP reached 65%, 97% and 89% for S, SSD and NI, respectively. In 2023, the gaps changed, with reductions of 61%, 75% and 96% for S, SSD and NI, respectively.
A similar trend was observed for IWP. In 2021, the IWP in CA was lower than that in CT by 42% and 20% for the S and SSD irrigation treatments, respectively. These gaps increased significantly in 2022, reaching reductions of 63% and 99% for S and SSD. By 2023, the IWP reductions were 60% and 72% for S and SSD, respectively. Across most scenarios, IWP consistently outperformed TWP, except in the CA-SSD treatment in 2021.

3.8. Effect of Practice and Irrigation System on Dependent Variables

Table 5 presents the statistical results for each cropping season, examining the effect of the “practice” (CT or CA), “irrigation system” (S, SSD, or NI) or their interaction on various dependent variables. This section includes the Kruskal–Wallis p-values. Subsequently, p-values derived from linear models for the interactions are also provided, indicating the statistical significance of the factors.
In 2021, the practice significantly influenced most variables, except soil evaporation and the bulk density. Similarly, the irrigation systems had notable effects on the variables, except the bulk density. The interaction between these factors notably affected the soil temperature and marginally impacted the quasi-steady ponded infiltration and grain yield. In 2022, the practice continued to exert a significant influence, impacting most variables except the bulk density. The irrigation system also showed substantial effects across the variables, except the quasi-steady ponded infiltration. The interaction effects were significant, notably on the grain yield, soil temperature and quasi-steady ponded infiltration. By 2023, the practice significantly influenced the grain yield, soil temperature, soil penetration resistance and quasi-steady ponded infiltration. The irrigation system also had substantial impacts, particularly on the grain yield, soil temperature and soil evaporation. The interaction effects were notable, especially on the soil temperature and quasi-steady ponded infiltration, with marginal significance for the grain yield.
The grain yield, soil temperature and quasi-steady ponded infiltration rate remained constantly sensitive variables affected by interactions between the practice and the irrigation system across all years. The soil penetration resistance was significantly influenced by the agricultural practices, while the irrigation system notably affected soil evaporation.

4. Discussion

4.1. Effects of CA and Irrigation System on Soil Physical Properties

In the present study, significant effects of both the agricultural practice (CA or CT) and the irrigation system (S, SSD or NI) were observed from the first year of the experiment.

4.1.1. Temperature

In CA, smaller temperature fluctuations were noted (Figure 5), attributed to the buffering effect of cover crop residues. Even in low quantities, these residues reduce the direct radiation on the soil surface, leading to more stable temperatures [75]. Similar findings have been reported in several studies (Table 1), including those by Shen et al. [32], Alletto et al. [50] and Meena et al. [51]. The irrigation method also played a role in temperature regulation. Sprinkler (S) irrigation resulted in soil surface temperatures that were up to 4 °C lower than in SSD and NI. On the one hand, S treatments are characterized by higher surface humidity, contributing to lower temperatures by cooling the soil surface, especially during hot days under a strong evaporative demand. This cooling effect occurs as liquid vapor absorbs heat from the surrounding air and evaporates, lowering the temperatures via phase changes [76]; however, it is generally limited to the top few centimeters of the soil, where the evaporative front takes place. A few centimeters below this, another effect takes over: the infiltration of water at temperatures lower than the soil’s has a direct cooling effect. Moreover, the higher the water content, the more efficiently the cooling effect propagates downwards; this is due to convection but also because the thermal conductivity of water is at least twice that of soil particles [77]. On the other hand, the SSD and NI treatments, characterized by dry surface conditions, displayed stronger temperatures due to reduced moisture levels, which limit the soil’s capacity to absorb and retain heat.
These temperature fluctuations are influenced not only by crop residues and the soil characteristics but also by the developmental stage of the crops [78]. While the sun’s warming effect on the soil surface is prone to increasing from spring to summer, the growing canopy intercepts progressively more radiation.
The higher LAI values observed for S irrigation indicate better radiation interception, leading to less radiation reaching the soil surface, in comparison with SSD and NI, exhibiting lower LAI values. In Mediterranean climates, reduced soil temperatures may help to mitigate the effects of wider daily temperature fluctuations and increased drought frequencies [33,79]. Moreover, cooler soil temperatures in summer can create a more stable environment for crops, enhancing water retention, nutrient availability and microbial activity, as lower temperatures reduce evaporation and help to maintain the optimal conditions for soil organisms, which collectively support crop growth.

4.1.2. Bulk Density

The bulk density, an indicator of soil health and compaction and affected by the soil structure, texture, climatic conditions and agricultural practices [80], showed no significant differences across the years (Figure 6). In general, in CT, the bulk density values were lower than those in CA (5–15%) due to the effect of tillage in loosening soil packing and particle arrangement [81]. The values found in this study are similar to those also observed by [47] for a silty soil in CT. Particularly high values (>1.7 g·cm−3) were observed in CA. According to the USDA guidelines (2019) for loam soils, bulk densities exceeding 1.7 g·cm−3 may hinder root development. Nevertheless, the “ideal” bulk density for optimal plant growth (i.e., adequate pore space, optimal water retention, good support for root development, sufficient nutrient availability, etc.) varies depending on the soil type and crop variety [82]. Research suggests that adopting CA can lead to an increase in bulk density in many cases [83,84], which often implies a reduction in micro-, meso- and macroporosity, thereby reducing the hydraulic conductivity [85].

4.1.3. Penetration Resistance

By contrast, the soil penetration resistance, which is a proxy for soil compaction [86] and represents the difficulty with which the roots will develop throughout the crop cycle [82], was significantly influenced by the farming practice (Table 5), with higher values observed in CA compared to CT, from the first year (Figure 7). The difference between CA and CT was observed in the upper soil layers and could be mainly attributed to the tillage practice in CT, which mechanically allows the loosening and restoration of the initial soil conditions for root development. Conversely, in CA, the absence of tillage, combined with the repeated use of agricultural machinery for sowing, weed control and harvesting [87], likely contributed to higher surface compaction.
In CT, however, the penetration resistance values significantly increased at depths of 25 to 30 cm, exceeding the critical threshold of 2000 kPa recommended for optimal root growth in the literature [87,88]. This increase suggests the presence of a plough pan, a compacted layer formed during tillage that can raise the bulk density in the deeper soil layers, negatively impacting root penetration and overall crop development [89]. In CA, the penetration resistance values also generally exceeded 2000 kPa, indicating surface compaction issues. Similar trends have already been observed in different short-term studies, as shown in Table 1 [17,21,22,23,36]. Additionally, Peigné et al. [90] emphasize that, even with conservation practices, compaction is reinforced by the soil’s susceptibility to compaction, particularly in soils with high silt and clay content, as observed in our study.
Notably, the highest resistance values in CA were observed in the NI treatments, followed by the SSD-irrigated treatments, with the lowest values recorded in the S-irrigated treatments. Since the soil moisture levels during penetration resistance measurement were equivalent across the treatments (approximately 20%), these resistance differences directly reflect the impacts of the irrigation systems on the soil structure. For the SSD and NI treatments, the drying cycles and localized water distribution patterns likely exacerbated surface compaction. In the SSD system, where the driplines were buried at a depth of 35 cm, the frequent dry conditions in the surface layers may have increased the friction between the soil particles, strengthened the soil structure and shrunk the pores [91], even though sufficient moisture was maintained at the depth of the driplines. Particularly in SSD, Lamm [92] has observed potential challenges, where driplines may encounter deformation due to vertical soil compaction or lateral overburden. This deformation can result in reduced flow rates and compromised distribution uniformity, affecting, in turn, the irrigation efficiency.

4.2. Effect of CA and Irrigation System on Water Flux

4.2.1. Infiltration

The quasi-steady ponded infiltration values were significantly lower in CA (three to four times) compared to CT (Figure 8), due to soil compaction in CA, as indicated by the elevated penetration resistance, especially in the SSD and NI treatments. This trend, related to the higher bulk density and penetration resistance in the topsoil under CA, is also noted in previous studies [26,93] (see Table 1). The difference is also attributed to greater small-scale soil heterogeneity in the conventionally tilled plots, in coherence with observations made by Vinatier et al. [67], who attribute this dynamic to preferential flows through cracks or macropores that are unevenly distributed. This soil heterogeneity was consistent across all CT repetitions, likely influenced by factors such as the soil structure, the presence of compacted layers or aggregates and prior tillage conditions [94]. However, some authors [41,61,95] indicate that the infiltration rates in tilled systems may decrease rapidly due to post-tillage soil reconsolidation. Finally, the infiltration rates in CA decreased after the first year, because of the progressive soil compaction with the passage of heavy machinery for agricultural operations, known to affect the soil structure and decrease the soil porosity [96]. Moreover, Esser and Roua et al. [97,98] suggest that CA practices may have different effects on the soil infiltration rates according to specific practices (minimum tillage, no tillage, etc.) and the initial or local soil conditions (soil texture, organic matter content, compaction level, etc.). Finally, numerous authors report that CA practices may lead, in the long term, to an improved soil structure, increased soil organic matter content and enhanced soil biota, which overall favor infiltration [29,41,56,58,99,100,101,102].

4.2.2. Evaporation

According to the literature, surface residues in CA practices reduce soil evaporation by creating a physical barrier, often referred to as mulch, which shields the soil surface underneath from direct exposure to sunlight and air, minimizing water loss [103]. The observations in 2023 (Figure 10) showed a more pronounced effect during the initial phases of the crop cycle, before the decomposition of the residues. Later on, when the surface gradually dries out over time and the residues naturally degrade, the decrease in evaporation in CA becomes less pronounced. In fact, water located deeper in the soil does not reach the surface rapidly enough to sustain the rate of evaporation from moist soil. As the surface soil surface dries out, it begins to impede the transport of water [102]. Additionally, the thickness of the mulch, which limits the lateral movement of humid air at the surface [104], decreases as the residues decompose, reducing the mulch’s efficacy in dampening soil evaporation.
Treatments irrigated by S had significantly higher soil evaporation (Table 5) compared to SSD and NI, because, when the soil surface is wet, the evaporation rates are primarily driven by atmospheric energy. As the surface dries out, the evaporation rates are constrained by water movement from the soil to the surface. In the case of the SSD (buried at 35 cm) and NI treatments, the increase in soil surface moisture was only due to precipitation, which results in lower evaporation values when compared to S irrigation. This trend was corroborated by the principal component analysis (PCA) shown in Figure 11, highlighting the surface soil moisture as a principal variable affecting soil evaporation. However, the methodology used to evaluate soil evaporation may present a limitation. Rainwater may drain out quickly from lysimeters, preventing water redistribution through capillarity, which would normally occur. This likely results in lower evaporation from lysimeters [105] than from the soil volume that they aim to monitor.

4.3. Effect of CA and Irrigation System on LAI, GY, TWP and IWP

It was constantly observed that the LAI values remained lower in CA compared to CT, regardless of the irrigation system employed (Figure 12). Moreover, the S irrigation system consistently gave the highest values of all indicators. In 2022, the LAI and GY values for the CA-SSD and CA-NI treatments were far lower than those obtained for all other combinations. Several interdependent factors may have contributed to these poor results—most likely soil compaction, low infiltration rates and high bulk densities. These factors are closely linked to vegetative growth and, when unfavorable, they can hinder root development and water uptake, limiting plant growth and productivity. Indeed, Chen et al. [106] and Cárceles Rodríguez et al. [107] mentioned that the main challenge in CA is root growth limitation due to compaction and poor water infiltration. Some authors observed also lower yields in CA [21,36], attributed to poor seedling emergence due to soil compaction and low soil temperatures in the no-till system (see other examples in Table 1). In a meta-analysis, Van den Putte et al. [108] confirmed that no tillage results in lower yields under drier climatic conditions compared to CT and other conservation tillage techniques that do not involve soil inversion.
Regarding water productivity, similar patterns could be observed as in the crop yield. The treatments in CT exhibited higher values of total water productivity (TWP) and irrigation water productivity (IWP), indicating more efficient water use (rainfall and irrigation) by the crops under these conditions. On the contrary, CA may face challenges in maintaining water productivity, potentially due to factors such as soil compaction or changes in soil moisture dynamics that can affect root development and water uptake. Generally, S-irrigated systems allowed better TWP and IWP than SSD-irrigated systems for both CA and CT. In particular, the IWP values surpassed the TWP values, suggesting that using irrigation is more effective in enhancing crop yields than relying only on rainwater, although both remained relatively low for the CA-SSD treatments. For comparison, Rana et al. [109] reported that an SSD system, buried at a 0.15 m depth with spacing of 0.67 m under CA for 8 years, allowed two times less water use (increase of 1.8% in total water productivity) compared to flood irrigation under semi-arid to sub-humid conditions. Sánchez-Llerena et al. [35] reported an important increase in total water productivity, with water savings of up to 75% when using sprinkler irrigation with no tillage compared to flood irrigation under Mediterranean conditions.
It is important to note that the TWP and IWP have limitations, as they do not account for the timing of rainfall or irrigation, which affects the water availability. More detailed approaches, such as daily water balance models or models with a frequency sufficient to capture temporal variations, may be needed, especially in CA systems, where the soil structure and water retention can vary.

4.4. Challenges of CA Adoption

Our study identified significant challenges in the initial years following CA adoption, particularly high soil compaction, in irrigated systems under a Mediterranean climate. It is hypothesized that, before transitioning to CA (before distinguishing CA and CT plots prior to winter crop sowing in 2020 under CA), a “plough pan” was already established at our experimental site, down to a depth of about 30 cm, as evidenced in the literature and confirmed by the results regarding soil penetration resistance. Additionally, compaction in the shallower soil horizon may have been intensified by machinery passage and the impact of raindrops during the preceding crop period. After transitioning to CA, soil compaction, as indicated by the penetration resistance values, became more evident in CA compared to CT, primarily in the first 30 cm, owing to the absence of tillage. In CT, the tillage annually reconditions the soil, alleviating compaction. Therefore, reconditioning measures to address soil compaction in CA systems may be necessary, as persistent compaction can affect other critical soil physical properties, ultimately hindering crop performance and irrigation water productivity, even if the irrigation system is recognized as efficient. Martínez et al. [24] propose that adopting no tillage with subsoiling before sowing may be especially relevant in Mediterranean areas affected by soil compaction. Similarly, Salem et al. [17] recommend exploring alternative forms of conservation tillage, like reservoir and minimum tillage, in specific scenarios to mitigate compaction without sacrificing the benefits of CA. Special attention needs to be given to SSD-irrigated plots, ensuring that these measures are applied to an optimal depth, preferably not exceeding 30 cm, to prevent any damage to the irrigation system buried at a depth of 35 cm.
Despite the agronomic challenges associated with the adoption of CA, it is feasible to address them through the more tailored adaptation of CA principles to the local conditions, such as adapted machinery or agricultural practices adapted to the climatic conditions [10]. Moreover, as observed in Table 1, the temporal dimension of CA has diverse and varying effects on the observed properties [13], with expectations for their evolution to benefit crop productivity over the long term [110,111], underscoring the interest in monitoring these properties over the long term.

4.5. Subsurface Drip Irrigation in CA

In the Mediterranean climate, irrigation is essential to maintain productivity and enhance the regulating services improved by CA, especially during dry seasons [14]. This study aimed to explore how different irrigation systems influence the outcomes (and diagnostic) of CA, with a particular focus on subsurface drip irrigation (SSD), recognized for its efficiency in water delivery.
The combination of SSD with CA offers a compelling strategy, as it enables direct, localized water delivery to the root zone, minimizing soil evaporation [112,113]. However, despite the potential benefits of SSD irrigation in improving the water use efficiency and mitigating environmental impacts [114,115], this irrigation system may be unable to deliver water in the shallow soil layers. This issue is particularly critical during the early stages of crop growth, when insufficient surface moisture can lead to water stress, lessened seed emergence, reduced vegetative growth and lower yields, particularly in the absence of sufficient rainfall [116]. Consequently, SSD-irrigated systems may face disadvantages compared to sprinkler irrigation (S), which consistently maintains the soil moisture throughout the profile from the beginning of the crop cycle. To address SSD’s limitations, supplementary irrigation with an alternative system, such as sprinklers, may be necessary during the initial growth stages to ensure proper crop establishment and root access to moisture provided by SSD at deeper levels [92]. This strategy could be especially crucial in Mediterranean climates, with low initial soil moisture and extended summer droughts. However, the success of this approach depends heavily on favorable soil conditions that support root growth and development [117]. Further research is needed to optimize SSD systems for Mediterranean crops under CA practices, including determining the ideal drip line depth, spacing and emitter discharge rates to ensure that the water delivery aligns with the crop needs and environmental conditions.

5. Conclusions

This study presents the impacts of conservation agriculture (CA), over a three-year period following adoption, and compares it to conventional tillage (CT), with different irrigation systems (sprinkler (S), subsurface drip (SSD)) and under non-irrigated conditions (NI). The physical soil properties, water fluxes, vegetative growth, crop yields and water productivity were studied in the Mediterranean French context, likely to be extrapolated to other Mediterranean systems.
The results show that the short-term effects of CA differ significantly from those seen in long-term studies reported in the literature, with initial challenges observed in the soil properties, water fluxes, crop development, yields and water productivity. CA treatments exhibited higher soil penetration resistance and lower infiltration rates, particularly the CA-SSD and CA-NI treatments, leading to reduced crop performance. Sprinkler irrigation produced the best crop results across all systems. In CA, mulch initially reduced soil evaporation, but this effect diminished over time as the residue decomposed, and crop development lagged. Soil temperature fluctuations were moderated by surface residues, especially in S-irrigated plots.
Addressing soil compaction is vital when implementing CA, especially in soils that are sensitive to compaction, as it can severely hinder crop yields and water productivity, even with efficient irrigation systems. Our findings suggest that mid- and long-term studies in irrigated Mediterranean systems are needed to assess whether the initial challenges of CA can be mitigated through improvements in the soil structure and system adaptation. Additionally, the water consumption of winter crops should be considered, as they help to maintain soil cover but also use rain or irrigation water (commonly applied in Mediterranean conditions), affecting the water reserves for summer crops. Future research should focus on the optimal irrigation strategies under varying water deficit scenarios and explore how combining conservation practices and irrigation systems can enhance the water use efficiency and provide other ecosystemic benefits.

Author Contributions

Conceptualization, J.D.D.-B. and C.W.; methodology, J.D.D.-B. and C.W.; validation, J.D.D.-B., C.W., S.B. and N.U.; formal analysis, J.D.D.-B. and C.W.; investigation, J.D.D.-B. and C.W.; resources, C.W. and N.U.; data curation, J.D.D.-B., C.W., J.-M.L. and C.D.; writing—original draft preparation, J.D.D.-B.; writing—review and editing, J.D.D.-B., C.W., S.B., N.U., J.-M.L., C.D. and B.C.; visualization, J.D.D.-B. and C.W.; supervision, C.W. and S.B.; project administration, C.W.; funding acquisition, C.W. and N.U. All authors have read and agreed to the published version of the manuscript.

Funding

This project is part of the PRIMA programme supported by the European Union, under grant agreement number PRIMA 2020 Section 1 Water IA 2022 MAGO. This work was also supported by INRAE and the Région Occitanie in the framework of the TETRAE program. Additional support was provided by ANRT (Association Nationale de la Recherche et de la Technologie) under convention 2021/0835 and the Société du Canal de Provence (SCP).

Data Availability Statement

The original contributions presented in the study are included in the article; further inquiries can be directed to the corresponding author.

Acknowledgments

The authors wish to extend their sincere appreciation to the PRESTI (G-EAU) experimental team, comprising Gaël Hermet, Marine Muffat-Jeandet and Geoffrey Froment, for their invaluable support in the installation and ongoing management of the field experiment. Special recognition goes to Milancha Babity, Lucas Schwartz, Julien Chabat, Feriel Gheboub and Rami Ben-Moussa for their dedicated contributions to the experimental follow-up during their internships. Gratitude is also extended to the LISAH experimental team for providing the necessary materials for this experimental setup. Finally, heartfelt thanks are extended to the reviewers for their meticulous proofreading of the manuscript.

Conflicts of Interest

Juan David Dominguez-Bohorquez and Nicolas Urruty were employed by the company Société du Canal de Provence (SCP). The remaining authors declare that the research was conducted in the absence of any commercial or financial relationships that could be construed as a potential conflict of interest.

Abbreviations

The following abbreviations are used in this manuscript:
CAConservation Agriculture
CTConventional Tillage
SSprinkler
SSDSubsurface Drip
NINo Irrigation
GYGrain Yield
LAILeaf Area Index
TWPTotal Water Productivity
IWPIrrigation Water Productivity

References

  1. Morugán-Coronado, A.; Linares, C.; Gómez-López, M.D.; Faz, Á.; Zornoza, R. The Impact of Intercropping, Tillage and Fertilizer Type on Soil and Crop Yield in Fruit Orchards under Mediterranean Conditions: A Meta-Analysis of Field Studies. Agric. Syst. 2020, 178, 102736. [Google Scholar] [CrossRef]
  2. Ferreira, C.S.S.; Seifollahi-Aghmiuni, S.; Destouni, G.; Ghajarnia, N.; Kalantari, Z. Soil Degradation in the European Mediterranean Region: Processes, Status and Consequences. Sci. Total Environ. 2022, 805, 150106. [Google Scholar] [CrossRef]
  3. Eaufrance Bulletin N°5: Prélèvements Quantitatifs sur la Ressource en Eau. Available online: https://www.eaufrance.fr/publications/prelevements-quantitatifs-sur-la-ressource-en-eau-donnees-2016 (accessed on 15 November 2024).
  4. Fader, M.; Shi, S.; von Bloh, W.; Bondeau, A.; Cramer, W. Mediterranean Irrigation under Climate Change: More Efficient Irrigation Needed to Compensate for Increases in Irrigation Water Requirements. Hydrol. Earth Syst. Sci. 2016, 20, 953–973. [Google Scholar] [CrossRef]
  5. Galeotti, M. The Economic Impacts of Climate Change in the Mediterranean. In IEMed Mediterranean Yearbook; IEMed: Barcelona, Spain, 2020. [Google Scholar]
  6. Busari, M.A.; Kukal, S.S.; Kaur, A.; Bhatt, R.; Dulazi, A.A. Conservation Tillage Impacts on Soil, Crop and the Environment. Int. Soil Water Conserv. Res. 2015, 3, 119–129. [Google Scholar] [CrossRef]
  7. Stagnari, F.; Pagnani, G.; Galieni, A.; D’Egidio, S.; Matteucci, F.; Pisante, M. Effects of Conservation Agriculture Practices on Soil Quality Indicators: A Case-Study in a Wheat-Based Cropping Systems of Mediterranean Areas. Soil Sci. Plant Nutr. 2020, 66, 624–635. [Google Scholar] [CrossRef]
  8. FAO Conservation Agriculture. Available online: https://www.fao.org/conservation-agriculture/en/ (accessed on 6 June 2024).
  9. Jat, R.K.; Sapkota, T.B.; Singh, R.G.; Jat, M.L.; Kumar, M.; Gupta, R.K. Seven Years of Conservation Agriculture in a Rice-Wheat Rotation of Eastern Gangetic Plains of South Asia: Yield Trends and Economic Profitability. Field Crops Res. 2014, 164, 199–210. [Google Scholar] [CrossRef]
  10. Page, K.L.; Dang, Y.P.; Dalal, R.C. The Ability of Conservation Agriculture to Conserve Soil Organic Carbon and the Subsequent Impact on Soil Physical, Chemical, and Biological Properties and Yield. Front. Sustain. Food Syst. 2020, 4, 31. [Google Scholar] [CrossRef]
  11. Boulal, H.; Gómez-Macpherson, H.; Villalobos, F.J. Permanent Bed Planting in Irrigated Mediterranean Conditions: Short-Term Effects on Soil Quality, Crop Yield and Water Use Efficiency. Field Crops Res. 2012, 130, 120–127. [Google Scholar] [CrossRef]
  12. Kassam, A.; Friedrich, T.; Derpsch, R.; Lahmar, R.; Mrabet, R.; Basch, G.; González-Sánchez, E.J.; Serraj, R. Conservation Agriculture in the Dry Mediterranean Climate. Field Crops Res. 2012, 132, 7–17. [Google Scholar] [CrossRef]
  13. Ghaley, B.B.; Rusu, T.; Sandén, T.; Spiegel, H.; Menta, C.; Visioli, G.; O’Sullivan, L.; Gattin, I.T.; Delgado, A.; Liebig, M.A.; et al. Assessment of Benefits of Conservation Agriculture on Soil Functions in Arable Production Systems in Europe. Sustainability 2018, 10, 794. [Google Scholar] [CrossRef]
  14. Lee, H.; Lautenbach, S.; García-Nieto, A.P.; Bondeau, A.; Cramer, W.; Geijzendorffer, I.; García-Nieto, A. The Impact of Conservation Farming Practices on Mediterranean Agro-Ecosystem Services Provisioning-a Meta-Analysis. Reg. Environ. Change 2019, 19, 2187–2202. [Google Scholar] [CrossRef]
  15. Mastrorilli, M.; Zucaro, R. Towards Sustainable Use of Water in Rainfed and Irrigated Cropping Systems: Review of Some Technical and Policy Issues. AIMS Agric. Food 2016, 1, 294–314. [Google Scholar] [CrossRef]
  16. Giller, K.E.; Witter, E.; Corbeels, M.; Tittonell, P. Conservation Agriculture and Smallholder Farming in Africa: The Heretics’ View. Field Crops Res. 2009, 114, 23–34. [Google Scholar] [CrossRef]
  17. Salem, H.M.; Valero, C.; Muñoz, M.Á.; Rodríguez, M.G.; Silva, L.L. Short-Term Effects of Four Tillage Practices on Soil Physical Properties, Soil Water Potential, and Maize Yield. Geoderma 2015, 237–238, 60–70. [Google Scholar] [CrossRef]
  18. Laborde, J.P.; Wortmann, C.S.; Blanco-Canqui, H.; McDonald, A.J.; Baigorria, G.A.; Lindquist, J.L. Short-Term Impacts of Conservation Agriculture on Soil Physical Properties and Productivity in the Midhills of Nepal. Agron. J. 2019, 111, 2128–2139. [Google Scholar] [CrossRef]
  19. Mloza-Banda, H.R.; Makwiza, C.N.; Mloza-Banda, M.L. Soil Properties after Conversion to Conservation Agriculture from Ridge Tillage in Southern Malawi. J. Arid. Environ. 2016, 127, 7–16. [Google Scholar] [CrossRef]
  20. Naab, J.B.; Mahama, G.Y.; Yahaya, I.; Prasad, P.V.V. Conservation Agriculture Improves Soil Quality, Crop Yield, and Incomes of Smallholder Farmers in North Western Ghana. Front. Plant Sci. 2017, 8, 996. [Google Scholar] [CrossRef] [PubMed]
  21. Afzalinia, S.; Zabihi, J. Soil Compaction Variation during Corn Growing Season under Conservation Tillage. Soil Tillage Res. 2014, 137, 1–6. [Google Scholar] [CrossRef]
  22. Celik, I. Effects of Tillage Methods on Penetration Resistance, Bulk Density and Saturated Hydraulic Conductivity in a Clayey Soil Conditions. Tarim Bilimleri Dergisi 2011, 17, 143–156. [Google Scholar]
  23. Celik, I.; Turgut, M.M.; Acir, N. Crop Rotation and Tillage Effects on Selected Soil Physical Properties of a Typic Haploxerert in an Irrigated Semi-Arid Mediterranean Region. Int. J. Plant Prod. 2012, 6, 157–480. [Google Scholar]
  24. Martínez, I.; Ovalle, C.; Del Pozo, A.; Uribe, H.; Natalia Valderrama, V.; Prat, C.; Sandoval, M.; Fernández, F.; Zagal, E. Influence of Conservation Tillage and Soil Water Content on Crop Yield in Dryland Compacted Alfisol of Central Chile. Chil. J. Agric. Res. 2011, 71, 615–622. [Google Scholar] [CrossRef]
  25. Khorami, S.S.; Kazemeini, S.A.; Afzalinia, S.; Gathala, M.K. Changes in Soil Properties and Productivity under Different Tillage Practices and Wheat Genotypes: A Short-Term Study in Iran. Sustainability 2018, 10, 3273. [Google Scholar] [CrossRef]
  26. Singh, B.; Malhi, S.S. Response of Soil Physical Properties to Tillage and Residue Management on Two Soils in a Cool Temperate Environment. Soil Tillage Res. 2006, 85, 143–153. [Google Scholar] [CrossRef]
  27. Parihar, C.M.; Yadav, M.R.; Jat, S.L.; Singh, A.K.; Kumar, B.; Pradhan, S.; Chakraborty, D.; Jat, M.L.; Jat, R.K.; Saharawat, Y.S.; et al. Long Term Effect of Conservation Agriculture in Maize Rotations on Total Organic Carbon, Physical and Biological Properties of a Sandy Loam Soil in North-Western Indo-Gangetic Plains. Soil Tillage Res. 2016, 161, 116–128. [Google Scholar] [CrossRef]
  28. Gómez-Paccard, C.; Hontoria, C.; Mariscal-Sancho, I.; Pérez, J.; León, P.; González, P.; Espejo, R. Soil–Water Relationships in the Upper Soil Layer in a Mediterranean Palexerult as Affected by No-Tillage under Excess Water Conditions—Influence on Crop Yield. Soil Tillage Res. 2015, 146, 303–312. [Google Scholar] [CrossRef]
  29. Mhlanga, B.; Thierfelder, C. Long-Term Conservation Agriculture Improves Water Properties and Crop Productivity in a Lixisol. Geoderma 2021, 398, 115107. [Google Scholar] [CrossRef]
  30. Martínez, M.; Salvador, E.; Ceja, O.; Espinosa Ramírez, M. Accumulated Impact of Conservation Agriculture on Soil Properties and Corn Yield; Instituto Nacional de Investigaciones Forestales, Agrícolas y Pecuarias (INIFAP): Mexico City, Mexico, 2019; Volume 10. [Google Scholar]
  31. Ngwira, A.R.; Thierfelder, C.; Lambert, D.M. Conservation Agriculture Systems for Malawian Smallholder Farmers: Long-Term Effects on Crop Productivity, Profitability and Soil Quality. Renew. Agric. Food Syst. 2013, 28, 350–363. [Google Scholar] [CrossRef]
  32. Shen, Y.; McLaughlin, N.; Zhang, X.; Xu, M.; Liang, A. Effect of Tillage and Crop Residue on Soil Temperature Following Planting for a Black Soil in Northeast China. Sci. Rep. 2018, 8, 4500. [Google Scholar] [CrossRef]
  33. Muñoz, V.; Lopez, L.; Lopez, R. Effect of Tillage System on Soil Temperature in a Rainfed Mediterranean Vertisol. Int. Agrophys. 2015, 29, 467–473. [Google Scholar] [CrossRef]
  34. Muñoz, A.; López-Piñeiro, A.; Ramírez, M. Soil Quality Attributes of Conservation Management Regimes in a Semi-Arid Region of South Western Spain. Soil Tillage Res. 2007, 95, 255–265. [Google Scholar] [CrossRef]
  35. Sánchez-Llerena, J.; López-Piñeiro, A.; Albarrán, Á.; Peña, D.; Becerra, D.; Rato-Nunes, J.M. Short and Long-Term Effects of Different Irrigation and Tillage Systems on Soil Properties and Rice Productivity under Mediterranean Conditions. Eur. J. Agron. 2016, 77, 101–110. [Google Scholar] [CrossRef]
  36. López-Garrido, R.; Madejón, E.; León-Camacho, M.; Girón, I.; Moreno, F.; Murillo, J.M. Reduced Tillage as an Alternative to No-Tillage under Mediterranean Conditions: A Case Study. Soil Tillage Res. 2014, 140, 40–47. [Google Scholar] [CrossRef]
  37. Gabriel, J.L.; Muñoz-Carpena, R.; Quemada, M. The Role of Cover Crops in Irrigated Systems: Water Balance, Nitrate Leaching and Soil Mineral Nitrogen Accumulation. Agric. Ecosyst. Environ. 2012, 155, 50–61. [Google Scholar] [CrossRef]
  38. Aguilera, E.; Lassaletta, L.; Gattinger, A.; Gimeno, B. Managing Soil Carbon for Climate Change Mitigation and Adaptation in Mediterranean Cropping Systems: A Meta-Analysis. Agric. Ecosyst. Environ. 2013, 168, 25–36. [Google Scholar] [CrossRef]
  39. Francaviglia, R.; Di Bene, C.; Farina, R.; Salvati, L. Soil Organic Carbon Sequestration and Tillage Systems in the Mediterranean Basin: A Data Mining Approach. Nutr. Cycl. Agroecosyst. 2017, 107, 125–137. [Google Scholar] [CrossRef]
  40. Vastola, A.; Zdruli, P.; D’Amico, M.; Pappalardo, G.; Viccaro, M.; Di Napoli, F.; Cozzi, M.; Romano, S. A Comparative Multidimensional Evaluation of Conservation Agriculture Systems: A Case Study from a Mediterranean Area of Southern Italy. Land. Use Policy 2017, 68, 326–333. [Google Scholar] [CrossRef]
  41. Alletto, L.; Cueff, S.; Bréchemier, J.; Lachaussée, M.; Derrouch, D.; Page, A.; Gleizes, B.; Perrin, P.; Bustillo, V. Physical Properties of Soils under Conservation Agriculture: A Multi-Site Experiment on Five Soil Types in South-Western France. Geoderma 2022, 428, 116228. [Google Scholar] [CrossRef]
  42. Blanco-Canqui, H.; Ruis, S.J. No-Tillage and Soil Physical Environment. Geoderma 2018, 326, 164–200. [Google Scholar] [CrossRef]
  43. Panettieri, M.; Carmona, I.; Melero, S.; Madejón, E.; Gómez-Macpherson, H. Effect of Permanent Bed Planting Combined with Controlled Traffic on Soil Chemical and Biochemical Properties in Irrigated Semi-Arid Mediterranean Conditions. Catena 2013, 107, 103–109. [Google Scholar] [CrossRef]
  44. Pareja-Sánchez, E.; Plaza-Bonilla, D.; Ramos, M.C.; Lampurlanés, J.; Álvaro-Fuentes, J.; Cantero-Martínez, C. Long-Term No-till as a Means to Maintain Soil Surface Structure in an Agroecosystem Transformed into Irrigation. Soil Tillage Res. 2017, 174, 221–230. [Google Scholar] [CrossRef]
  45. Rodríguez González, A.; Arcia Porrúa, J.; Antonio Martínez Cañizares, J.; Domínguez Vento, C.; Herrera Puebla, J.; Miranda Caballero, A.; González, R. Influence of Conservation Agriculture on Some Physical Properties of a Red Ferra-Litic Soil. Int. J. Food Sci. Agric. 2022, 2022, 320–326. [Google Scholar] [CrossRef]
  46. Jat, R.D.; Jat, H.S.; Nanwal, R.K.; Yadav, A.K.; Bana, A.; Choudhary, K.M.; Kakraliya, S.K.; Sutaliya, J.M.; Sapkota, T.B.; Jat, M.L. Conservation Agriculture and Precision Nutrient Management Practices in Maize-Wheat System: Effects on Crop and Water Productivity and Economic Profitability. Field Crops Res. 2018, 222, 111–120. [Google Scholar] [CrossRef]
  47. Sartori, F.; Piccoli, I.; Polese, R.; Berti, A. Transition to Conservation Agriculture: How Tillage Intensity and Covering Affect Soil Physical Parameters. Soil 2022, 8, 213–222. [Google Scholar] [CrossRef]
  48. Bhattacharya, P.; Maity, P.P.; Mowrer, J.; Maity, A.; Ray, M.; Das, S.; Chakrabarti, B.; Ghosh, T.; Krishnan, P. Assessment of Soil Health Parameters and Application of the Sustainability Index to Fields under Conservation Agriculture for 3, 6, and 9 Years in India. Heliyon 2020, 6, e05640. [Google Scholar] [CrossRef] [PubMed]
  49. Jat, H.S.; Kumar, V.; Datta, A.; Choudhary, M.; Yadvinder-Singh; Kakraliya, S.K.; Poonia, T.; McDonald, A.J.; Jat, M.L.; Sharma, P.C. Designing Profitable, Resource Use Efficient and Environmentally Sound Cereal Based Systems for the Western Indo-Gangetic Plains. Sci. Rep. 2020, 10, 19267. [Google Scholar] [CrossRef] [PubMed]
  50. Alletto, L.; Coquet, Y.; Justes, E. Effects of Tillage and Fallow Period Management on Soil Physical Behaviour and Maize Development. Agric. Water Manag. 2011, 102, 74–85. [Google Scholar] [CrossRef]
  51. Meena, R.; Vashisth, A.; Das, T.K. Effect of Conservation Agriculture on Soil Hydrothermal Regimes, Crop Evapo-Transpiration and Water Productivity of Wheat Crop in the Semi-Arid Region of North-Western India. J. Soil Water Conserv. 2021, 20, 424–430. [Google Scholar] [CrossRef]
  52. DeLaune, P.B.; Mubvumba, P.; Ale, S.; Kimura, E. Impact of No-till, Cover Crop, and Irrigation on Cotton Yield. Agric. Water Manag. 2020, 232, 106038. [Google Scholar] [CrossRef]
  53. Mondal, S.; Chakraborty, D.; Das, T.K.; Shrivastava, M.; Mishra, A.K.; Bandyopadhyay, K.K.; Aggarwal, P.; Chaudhari, S.K. Conservation Agriculture Had a Strong Impact on the Sub-Surface Soil Strength and Root Growth in Wheat after a 7-Year Transition Period. Soil Tillage Res. 2019, 195, 104385. [Google Scholar] [CrossRef]
  54. Sokolowski, A.C.; Prack McCormick, B.; De Grazia, J.; Wolski, J.E.; Rodríguez, H.A.; Rodríguez-Frers, E.P.; Gagey, M.C.; Debelis, S.P.; Paladino, I.R.; Barrios, M.B. Tillage and No-Tillage Effects on Physical and Chemical Properties of an Argiaquoll Soil under Long-Term Crop Rotation in Buenos Aires, Argentina. Int. Soil. Water Conserv. Res. 2020, 8, 185–194. [Google Scholar] [CrossRef]
  55. Zhang, Y.; Tan, C.; Wang, R.; Li, J.; Wang, X. Conservation Tillage Rotation Enhanced Soil Structure and Soil Nutrients in Long-Term Dryland Agriculture. Eur. J. Agron. 2021, 131, 126379. [Google Scholar] [CrossRef]
  56. Eze, S.; Dougill, A.J.; Banwart, S.A.; Hermans, T.D.G.; Ligowe, I.S.; Thierfelder, C. Impacts of Conservation Agriculture on Soil Structure and Hydraulic Properties of Malawian Agricultural Systems. Soil Tillage Res. 2020, 201, 104639. [Google Scholar] [CrossRef] [PubMed]
  57. Dam, R.F.; Mehdi, B.B.; Burgess, M.S.E.; Madramootoo, C.A.; Mehuys, G.R.; Callum, I.R. Soil Bulk Density and Crop Yield under Eleven Consecutive Years of Corn with Different Tillage and Residue Practices in a Sandy Loam Soil in Central Canada. Soil Tillage Res. 2005, 84, 41–53. [Google Scholar] [CrossRef]
  58. Singh, A.; Phogat, V.K.; Dahiya, R.; Batra, S.D. Impact of Long-Term Zero till Wheat on Soil Physical Properties and Wheat Productivity under Rice–Wheat Cropping System. Soil Tillage Res. 2014, 140, 98–105. [Google Scholar] [CrossRef]
  59. Mazzoncini, M.; Sapkota, T.B.; Bàrberi, P.; Antichi, D.; Risaliti, R. Long-Term Effect of Tillage, Nitrogen Fertilization and Cover Crops on Soil Organic Carbon and Total Nitrogen Content. Soil Tillage Res. 2011, 114, 165–174. [Google Scholar] [CrossRef]
  60. Ismail, I.; Blevins, R.L.; Frye, W.W. Long-Term No-Tillage Effects on Soil Properties and Continuous Corn Yields. Soil Sci. Soc. Am. J. 1994, 58, 193–198. [Google Scholar] [CrossRef]
  61. Talukder, R.; Plaza-Bonilla, D.; Cantero-Martínez, C.; Di Prima, S.; Lampurlanés, J. Spatio-Temporal Variation of Surface Soil Hydraulic Properties under Different Tillage and Maize-Based Crop Sequences in a Mediterranean Area. Plant Soil 2024, 500, 263–277. [Google Scholar] [CrossRef]
  62. IUSS Working Group WRB International Soil Classification System for Naming Soils and Creating Legends for Soil Maps. World Soil. Resour. Rep. 2015, 106, 166–168.
  63. Albasha, R.; Thiesson, J.; Buvat, S.; Lopez, J.M.; Cheviron, B. Prospection Géophysique Dans Le Cadre d’une Étude de La Variabilité Spatiale Des Rendements Agricoles. In Proceedings of the GEOFCAN, Orsay, France, 13–14 November 2014; UMR GEOPS: Orsay, France, 2014. [Google Scholar]
  64. Eijkelkamp, R. Hand-Penetrometer for Top Layers, Type IB Meet the Difference Operating Instructions; Royal Eijkelkamp: Giesbeek, The Netherlands, 2022. [Google Scholar]
  65. Yolcubal, I.; Brusseau, M.L.; Artiola, J.F.; Wierenga, P.J.; Wilson, L.G. Environmental physical properties and processes. Environ. Monit. Charact. 2004, 207–239. [Google Scholar] [CrossRef]
  66. Garnier, F.; Elamri, Y. Le Cahier des Techniques de l’INRA 2014 (83) n°3 Automatisation du Dispositif de Müntz Pour la Détermination In Situ de la Conductivité Hydraulique à Saturation, 84th ed.; 2014; Volume 83, 12p, hal-04632381. [Google Scholar]
  67. Vinatier, F.; Rudi, G.; Coulouma, G.; Dagès, C.; Bailly, J.-S. Dynamics of Quasi-Steady Ponded Infiltration under Contrasting Plant Cover and Management Strategies. Soil Tillage Res. 2024, 237, 105985. [Google Scholar] [CrossRef]
  68. Bhatt, R.; Singh, P. Evaporation Trends on Intervening Period for Different Wheat Establishments under Soils of Semi-Arid Tropics. J. Soil Water Conserv. 2018, 17, 41. [Google Scholar] [CrossRef]
  69. Trambouze, W. Caractérisation et Eléments de Modelisation de L’évapotranspiration Réelle de la Vigne à L’échelle de la Parcelle; Ecole Nationale Supérieure Agronomique de Montpellier: Montpellier, France, 1996. [Google Scholar]
  70. Flumignan, D.L.; de Faria, R.T.; Lena, B.P. Test of a Microlysimeter for Measurement of Soil Evaporation. Eng. Agrícola 2012, 32, 80–90. [Google Scholar] [CrossRef]
  71. Fang, H.; Liang, S. Leaf Area Index Models. In Encyclopedia of Ecology; Elsevier: Oxford, UK, 2014. [Google Scholar] [CrossRef]
  72. LI-COR LAI-2200C Plant Canopy Analyzer. Available online: https://www.licor.com/env/products/leaf-area/LAI-2200C/ (accessed on 15 November 2024).
  73. Shaheen, T.; Riaz, M.S.; Zafar, Y. Soybean Production and Drought Stress. In Abiotic and Biotic Stresses in Soybean Production; Academic Press: San Diego, CA, USA, 2016; pp. 177–196. [Google Scholar] [CrossRef]
  74. Mailhol, J.C.; Ruelle, P.; Walser, S.; Schütze, N.; Dejean, C. Analysis of AET and Yield Predictions under Surface and Buried Drip Irrigation Systems Using the Crop Model PILOTE and Hydrus-2D. Agric Water Manag. 2011, 98, 1033–1044. [Google Scholar] [CrossRef]
  75. Bussière, F.; Cellier, P. Modification of the Soil Temperature and Water Content Regimes by a Crop Residue Mulch: Experiment and Modelling. Agric. For. Meteorol. 1994, 68, 1–28. [Google Scholar] [CrossRef]
  76. Wang, D.; Shannon, M.C.; Grieve, C.M.; Yates, S.R. Soil Water and Temperature Regimes in Drip and Sprinkler Irrigation, and Implications to Soybean Emergence. Agric. Water Manag. 2000, 43, 15–28. [Google Scholar] [CrossRef]
  77. Abu-Hamdeh, N.H. SW—Soil and Water: Measurement of the Thermal Conductivity of Sandy Loam and Clay Loam Soils Using Single and Dual Probes. J. Agric. Eng. Res. 2001, 80, 209–216. [Google Scholar] [CrossRef]
  78. Sándor, R.; Fodor, N. Simulation of Soil Temperature Dynamics with Models Using Different Concepts. Sci. World J. 2012, 2012, 590287. [Google Scholar] [CrossRef]
  79. Kassam, A.; Friedrich, T.; Shaxson, F.; Pretty, J. The Spread of Conservation Agriculture: Justification, Sustainability and Uptake. Int. J. Agric. Sustain. 2009, 7, 292–320. [Google Scholar] [CrossRef]
  80. Özdemir, N.; Demir, Z.; Bülbül, E. Relationships between Some Soil Properties and Bulk Density under Different Land Use. Soil Stud. 2022, 11, 43–50. [Google Scholar] [CrossRef]
  81. Rahimi, A.A.; Sepaskhah, A.R.; Ahmadi, S.H. Evaluation of Different Methods for the Prediction of Saturated Hydraulic Conductivity in Tilled and Untilled Soils. Arch. Agron. Soil Sci. 2011, 57, 899–914. [Google Scholar] [CrossRef]
  82. Nyeki, A.; Milics, G.; Kovacs, A.J.; Neményi, M. Effects of Soil Compaction on Cereal Yield: A Review. Cereal Res. Commun. 2017, 45, 1–22. [Google Scholar] [CrossRef]
  83. Zhou, H.; LÜ, Y.; YANG, Z.; LI, B. Influence of Conservation Tillage on Soil Aggregates Features in North China Plain. Agric. Sci. China 2007, 6, 1099–1106. [Google Scholar] [CrossRef]
  84. Taser, O.; Metinoglu, F. Physical and Mechanical Properties of a Clayey Soil as Affected by Tillage Systems for Wheat Growth. Acta Agric. Scand. Sect. B-Soil Plant Sci. 2007, 55, 186–191. [Google Scholar] [CrossRef]
  85. Indoria, A.K.; Sharma, K.L.; Reddy, K.S. Hydraulic Properties of Soil under Warming Climate. In Climate Change and Soil Interactions; Elsevier: Amsterdam, The Netherlands, 2020; Chapter 18; pp. 473–508. [Google Scholar] [CrossRef]
  86. Souza, R.; Hartzell, S.; Freire Ferraz, A.P.; de Almeida, A.Q.; de Sousa Lima, J.R.; Dantas Antonino, A.C.; de Souza, E.S. Dynamics of Soil Penetration Resistance in Water-Controlled Environments. Soil Tillage Res. 2021, 205, 104768. [Google Scholar] [CrossRef]
  87. Hamza, M.A.; Anderson, W.K. Soil Compaction in Cropping Systems: A Review of the Nature, Causes and Possible Solutions. Soil Tillage Res. 2005, 82, 121–145. [Google Scholar] [CrossRef]
  88. Aase, J.K.; Bjorneberg, D.L.; Sojka, R.E. Zone-Subsoiling Relationships to Bulk Density and Cone Index on a Furrow-Irrigated Soil. Trans. Am. Soc. Agric. Eng. 2001, 44, 577. [Google Scholar] [CrossRef]
  89. Jeřábek, J.; Zumr, D.; Dostál, T. Identifying the Plough Pan Position on Cultivated Soils by Measurements of Electrical Resistivity and Penetration Resistance. Soil Tillage Res. 2017, 174, 231–240. [Google Scholar] [CrossRef]
  90. Peigné, J.; Vian, J.-F.; Payet, V.; Saby, N.P.A. Soil Fertility after 10 Years of Conservation Tillage in Organic Farming. Soil Tillage Res. 2018, 175, 194–204. [Google Scholar] [CrossRef]
  91. da Silva, V.R.; Reinert, D.J.; Reichert, J.M. Resistência Mecânica Do Solo à Penetração Influenciada Pelo Tráfego de Uma Colhedora Em Dois Sistemas de Manejo Do Solo. Ciência Rural 2000, 30, 795–801. [Google Scholar] [CrossRef]
  92. Lamm, F.R. Managing the Challenges of Subsurface Drip Irrigation. In Proceedings of the Irrigation Association Technical Conference, San Antonio, TX, USA, 2–5 December 2009. [Google Scholar]
  93. Materechera, S.A.; Mloza-Banda, H.R. Soil Penetration Resistance, Root Growth and Yield of Maize as Influenced by Tillage System on Ridges in Malawi. Soil Tillage Res. 1997, 41, 13–24. [Google Scholar] [CrossRef]
  94. Coulouma, G.; Boizard, H.; Trotoux, G.; Lagacherie, P.; Richard, G. Effect of Deep Tillage for Vineyard Establishment on Soil Structure: A Case Study in Southern France. Soil Tillage Res. 2006, 88, 132–143. [Google Scholar] [CrossRef]
  95. Mubarak, I.; Mailhol, J.C.; Angulo-Jaramillo, R.; Ruelle, P.; Boivin, P.; Khaledian, M. Temporal Variability in Soil Hydraulic Properties under Drip Irrigation. Geoderma 2009, 150, 158–165. [Google Scholar] [CrossRef]
  96. Horn, R.; Way, T.; Rostek, J. Effect of Repeated Tractor Wheeling on Stress/Strain Properties and Consequences on Physical Properties in Structured Arable Soils. Soil Tillage Res. 2003, 73, 101–106. [Google Scholar] [CrossRef]
  97. Esser, K.B. Water Infiltration and Moisture in Soils under Conservation and Conventional Agriculture in Agro-Ecological Zone IIa, Zambia. Agronomy 2017, 7, 40. [Google Scholar] [CrossRef]
  98. Roua, A.; Ibrahimi, K.; Sher, F.; Milham, P.; Ghazouani, H.; Chehaibi, S.; Hussain, Z.; Iqbal, H. Impacts of Different Tillage Practices on Soil Water Infiltration for Sustainable Agriculture. Sustainability 2021, 13, 3155. [Google Scholar] [CrossRef]
  99. Azooz, R.H.; Arshad, M.A. Soil Infiltration and Hydraulic Conductivity under Long-Term No-Tillage and Conventional Tillage Systems. Can. J. Soil Sci. 1996, 76, 143–152. [Google Scholar] [CrossRef]
  100. Lipiec, J.; Kuś, J.; Słowińska-Jurkiewicz, A.; Nosalewicz, A. Soil Porosity and Water Infiltration as Influenced by Tillage Methods. Soil Tillage Res. 2006, 89, 210–220. [Google Scholar] [CrossRef]
  101. Thierfelder, C.; Wall, P.C. Effects of Conservation Agriculture Techniques on Infiltration and Soil Water Content in Zambia and Zimbabwe. Soil Tillage Res. 2009, 105, 217–227. [Google Scholar] [CrossRef]
  102. Van Donk, S.J.; Martin, D.L.; Irmak, S.; Melvin, S.R.; Petersen, J.L.; Davison, D.R. Crop Residue Cover Effects on Evaporation, Soil Water Content, and Yield of Deficit-Irrigated Corn in West-Central Nebraska. Trans. ASABE 2010, 53, 1787–1797. [Google Scholar] [CrossRef]
  103. Horton, R.; Bristow, K.L.; Kluitenberg, G.J.; Sauer, T.J. Crop Residue Effects on Surface Radiation and Energy Balance—Review. Theor. Appl. Clim. 1996, 54, 27–37. [Google Scholar] [CrossRef]
  104. Fuchs, M.; Hadas, A. Mulch Resistance to Water Vapor Transport. Agric. Water Manag. 2011, 98, 990–998. [Google Scholar] [CrossRef]
  105. Baalousha, H.M.; Ramasomanana, F.; Fahs, M.; Seers, T.D. Measuring and Validating the Actual Evaporation and Soil Moisture Dynamic in Arid Regions under Unirrigated Land Using Smart Field Lysimeters and Numerical Modeling. Water 2022, 14, 2787. [Google Scholar] [CrossRef]
  106. Chen, Y.; Cavers, C.; Tessier, S.; Monero, F.; Lobb, D. Short-Term Tillage Effects on Soil Cone Index and Plant Development in a Poorly Drained, Heavy Clay Soil. Soil Tillage Res. 2005, 82, 161–171. [Google Scholar] [CrossRef]
  107. Cárceles Rodríguez, B.; Durán-Zuazo, V.H.; Soriano Rodríguez, M.; García-Tejero, I.F.; Gálvez Ruiz, B.; Cuadros Tavira, S. Conservation Agriculture as a Sustainable System for Soil Health: A Review. Soil Syst. 2022, 6, 87. [Google Scholar] [CrossRef]
  108. Van den Putte, A.; Govers, G.; Diels, J.; Gillijns, K.; Demuzere, M. Assessing the Effect of Soil Tillage on Crop Growth: A Meta-Regression Analysis on European Crop Yields under Conservation Agriculture. Eur. J. Agron. 2010, 33, 231–241. [Google Scholar] [CrossRef]
  109. Rana, B.; Parihar, C.M.; Jat, M.L.; Patra, K.; Nayak, H.S.; Reddy, K.S.; Sarkar, A.; Anand, A.; Naguib, W.; Gupta, N.; et al. Combining Sub-Surface Fertigation with Conservation Agriculture in Intensively Irrigated Rice under Rice-Wheat System Can Be an Option for Sustainably Improving Water and Nitrogen Use-Efficiency. Field Crops Res. 2023, 302, 109074. [Google Scholar] [CrossRef]
  110. Martínez Gamiño, M.Á.; Osuna Ceja, E.S.; Espinosa Ramírez, M.; Martínez-Gamiño, M.Á.; Osuna Ceja, E.S.; Espinosa Ramírez, M. Impacto Acumulado de La Agricultura de Conservación En Propiedades Del Suelo y Rendimiento de Maíz. Rev. Mex. Cienc. Agric. 2019, 10, 765–778. [Google Scholar] [CrossRef]
  111. Abdallah, A.M.; Jat, H.S.; Choudhary, M.; Abdelaty, E.F.; Sharma, P.C.; Jat, M.L. Conservation Agriculture Effects on Soil Water Holding Capacity and Water-Saving Varied with Management Practices and Agroecological Conditions: A Review. Agronomy 2021, 11, 1681. [Google Scholar] [CrossRef]
  112. Serra-Wittling, C.; Molle, B.; Cheviron, B. Plot Level Assessment of Irrigation Water Savings Due to the Shift from Sprinkler to Localized Irrigation Systems or to the Use of Soil Hydric Status Probes. Application in the French Context. Agric. Water Manag. 2019, 223, 105682. [Google Scholar] [CrossRef]
  113. Umair, M.; Hussain, T.; Jiang, H.; Ahmad, A.; Yao, J.; Qi, Y.; Zhang, Y.; Min, L.; Shen, Y. Water-Saving Potential of Subsurface Drip Irrigation for Winter Wheat. Sustainability 2019, 11, 2978. [Google Scholar] [CrossRef]
  114. Jacobsen, S.E.; Jensen, C.R.; Liu, F. Improving Crop Production in the Arid Mediterranean Climate. Field Crops Res. 2012, 128, 34–47. [Google Scholar] [CrossRef]
  115. Sidhu, H.S.; Jat, M.L.; Singh, Y.; Sidhu, R.K.; Gupta, N.; Singh, P.; Singh, P.; Jat, H.S.; Gerard, B. Sub-Surface Drip Fertigation with Conservation Agriculture in a Rice-Wheat System: A Breakthrough for Addressing Water and Nitrogen Use Efficiency. Agric. Water Manag. 2019, 216, 273–283. [Google Scholar] [CrossRef]
  116. Cakir, R. Effect of Water Stress at Different Development Stages on Vegetative and Reproductive Growth of Corn. Field Crops Res. 2004, 89, 1–16. [Google Scholar] [CrossRef]
  117. Wang, H.; Wang, N.; Quan, H.; Zhang, F.; Fan, J.; Feng, H.; Cheng, M.; Liao, Z.; Wang, X.; Xiang, Y. Yield and Water Productivity of Crops, Vegetables and Fruits under Subsurface Drip Irrigation: A Global Meta-Analysis. Agric. Water Manag. 2022, 269, 107645. [Google Scholar] [CrossRef]
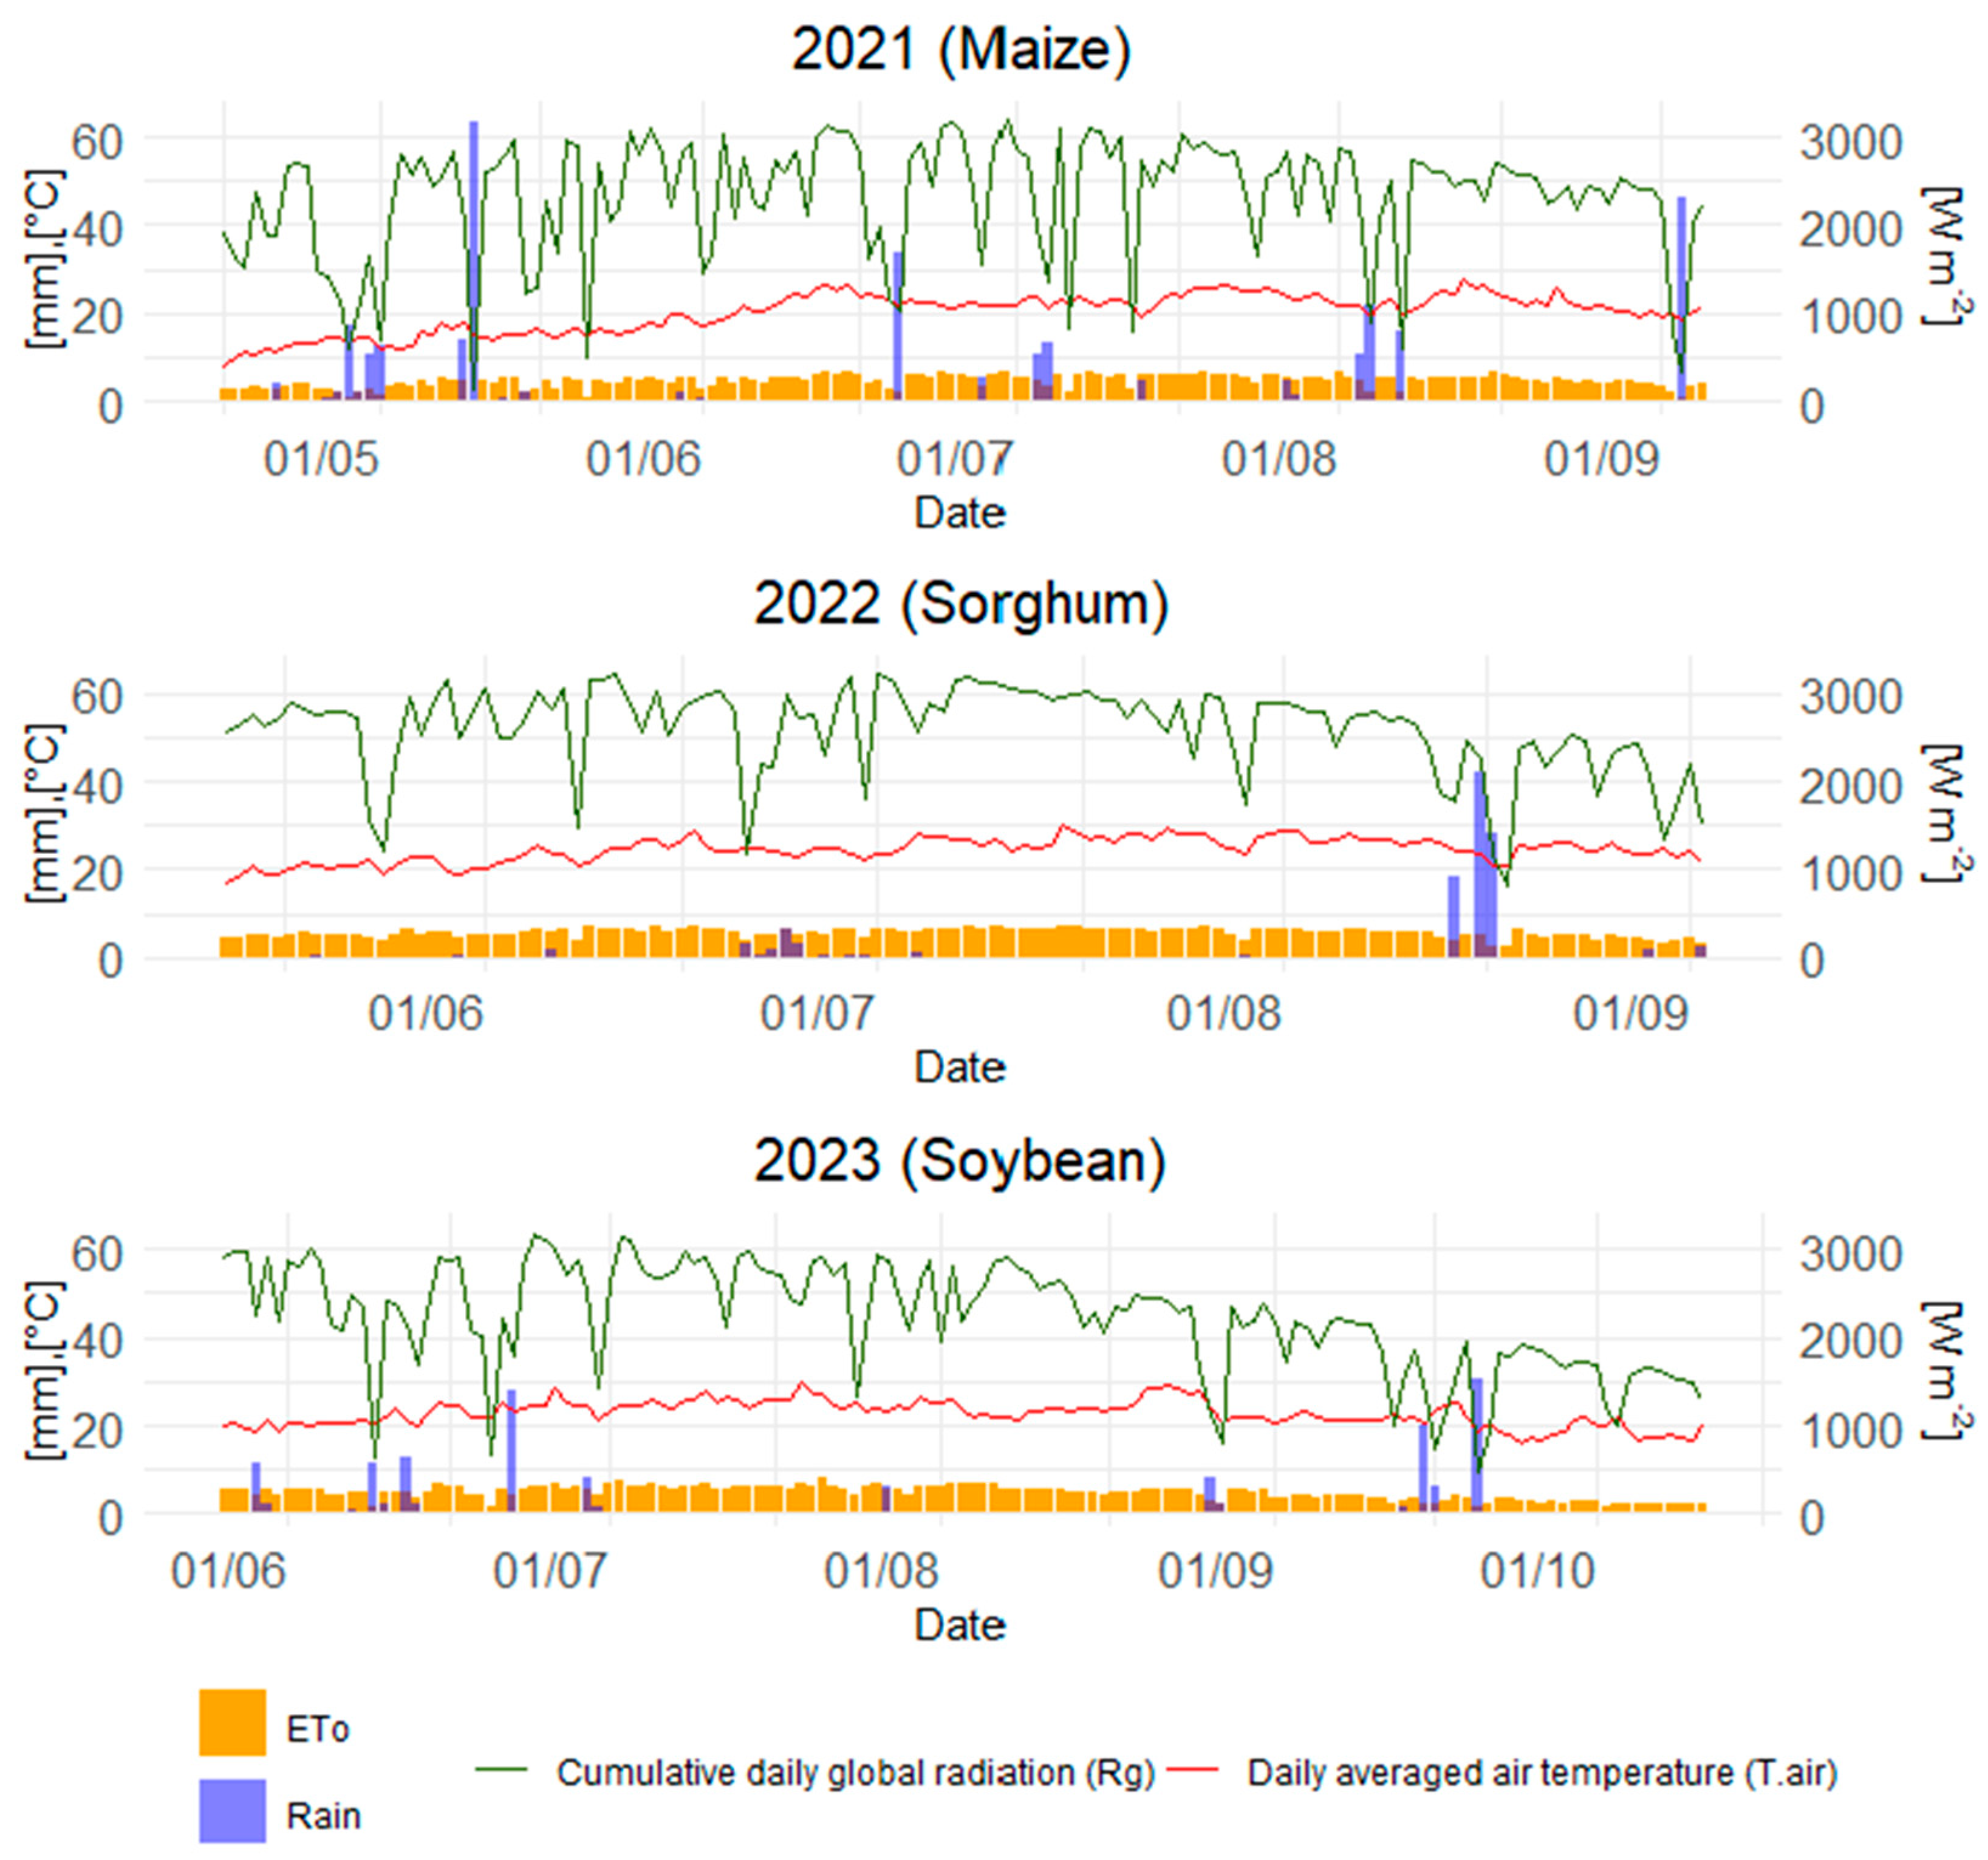
Figure 1. Daily meteorological variables observed during each cropping season from sowing to harvest. Averaged air temperature (°C), reference evapotranspiration ETo (mm) and rain (mm) on the left axis and cumulative daily global radiation (W·m−2) on the right axis.
Agronomy 15 00299 g001
Figure 2. Treatments on the experimental site (Montpellier, France). From left to right: conservation agriculture irrigated by sprinkler irrigation (CA-S), conventional tillage irrigated by sprinkler irrigation (CT-S), conventional tillage irrigated by subsurface drip irrigation (CT-SSD), conventional tillage not irrigated (CT-NI), conservation agriculture not irrigated (CA-NI) and conservation agriculture irrigated by subsurface drip irrigation (CA-SSD).
Agronomy 15 00299 g002
Figure 3. Spatial configuration of mini-lysimeters in conservation agriculture (CA) and conventional tillage (CT) field treatments.
Agronomy 15 00299 g003
Figure 4. Weighing process of mini-lysimeter without mulch (left); pyranometer and litterbag added to mini-lysimeter (right).
Agronomy 15 00299 g004
Figure 5. Temporal variation in soil temperature across different depths and mean soil temperature (3 and 10 cm) for each crop cycle under different agricultural practices (conservation agriculture—CA and conventional tillage—CT) combined with different irrigation systems (non-irrigated—NI, sprinkler—S and subsurface drip—SSD).
Agronomy 15 00299 g005
Figure 6. Soil bulk density profile for different agricultural practices (conservation agriculture—CA and conventional tillage—CT) combined with different irrigation systems (not irrigated—NI, sprinkler—S and subsurface drip—SSD). Error bars indicate standard deviations.
Agronomy 15 00299 g006
Figure 7. Soil penetration resistance profile in 2022 and 2023 under different agricultural practices (conservation agriculture—CA and conventional tillage—CT) combined with different irrigation systems (not irrigated—NI, sprinkler—S and subsurface drip—SSD). Error bars indicate standard deviations. Measurements were realized after the sowing date of the main crop (CT and CA) and before the tillage date (CT).
Agronomy 15 00299 g007
Figure 8. Quasi-steady ponded infiltration rates under different agricultural practices (conservation agriculture—CA and conventional tillage—CT) combined with different irrigation systems (not irrigated—NI, sprinkler—S and subsurface drip—SSD). Error bars indicate standard deviations.
Agronomy 15 00299 g008
Figure 9. Cumulative soil evaporation for each cropping season (2021, 2022 and 2023) under different agricultural practices (conservation agriculture—CA and conventional tillage—CT) combined with different irrigation systems (not irrigated—NI, sprinkler—S and subsurface drip—SSD). Dotted blue lines indicate the sowing dates.
Agronomy 15 00299 g009
Figure 10. Daily soil evaporation observations periods in 2023 under different agricultural practices (conservation agriculture—CA and conventional tillage—CT) irrigated by subsurface drip (SSD): (1) May 31 to June 5, (2) June 14 to 21 and (3) July 4 to 10.
Agronomy 15 00299 g010
Figure 11. Principal component analysis (PCA) of the 2022 and 2023 dataset for soil evaporation assessment. (a) Correlation circle displaying vectors for explanatory variable scores; (b) graph of individuals illustrating the distribution of treatments. Each point represents an agricultural practice (conservation agriculture—CA and conventional tillage—CT) and an irrigation system (not irrigated—NI, sprinkler—S and subsurface drip—SSD).
Agronomy 15 00299 g011
Figure 12. Maximum leaf area index (LAImax) and grain yield (GY) values across cropping seasons (2021, 2022, 2023) under different agricultural practices (conservation agriculture—CA and conventional tillage—CT) combined with different irrigation systems (not irrigated—NI, sprinkler—S and subsurface drip—SSD). Error bars indicate standard deviations.
Agronomy 15 00299 g012
Table 2. Cultural practices implemented for the three cropping seasons.
Practice202120222023
Winter cover crop sown in CA Faba beanMixture of mustard, phacelia and vetchMixture of faba bean and oat
Sowing date of winter cover crop12 September 202017 November 202120 September 2022
Dry biomass of winter cover crop in CA 3 t·ha−16 t·ha−16 t·ha−1
Main crop: varietyMaize: IXABELSorghum: HUGGOSoybean: SPEEDA
Date of tillage in CT with plow Huard (30 cm)10 October 2020
23 November 2021
22 October 202220 January 2024
Date of ground fertilizer application for CA and CT18 March 2021 (K: 120U)
09 April 2021 (N: 180U)
11 April 2022
(N: 90U, P: 70U,
K: 150U)
-
Date of seedbed preparation in CT (rotary harrow)15 April 20219 May 20229 May 2023
Date of winter cover crop termination in CA (farming tool used)15 April 2021
(FACA roller)
11 May 2022
(Roll’ N’ Sem ROLLS)
17 May 2023
(Roll’ N’ Sem ROLLS)
Date of main crop sowing (direct seeding in CA)16 April 202112 May 202217 May 2023
Seeding density of main crop8.3 seeds·m−231.5 seeds·m−233 seeds·m−2
Date and type of weed control27 May 2021: Hoeing on the CT plots
1 June 2021: Pass of the flail mower on CA plots
4 June 2021: Selective herbicide application on CA plots
10 May 2022: Herbicide application on CA plots
11 May 2022: Pass of “Roll N Sem” roller on CA plots
30 May 2022: Hoeing on the CT plots
27 June 2023: Hoeing on the CT plots
Date of main crop harvest6 September 20213 September 202212 October 2023
Duration of main crop cycle (days)143113139
Table 3. Summary of measurement dates for variables across three crop cycles.
Measurement202120222023
Bulk densityApril 22ndJune 15thSeptember 8th
Soil temperatureFrom May 5th to September 3rdFrom June 10th to August 29thFrom June 6th to October 19th
Soil penetration resistanceApril 22ndSeptember 27thDecember 7th
Quasi-steady ponded infiltration rateMay 6thMay 30thJune 28th
Soil evaporationFrom June 21st to September 3rdFrom June 14th to August 30thFrom May 26th to August 18th
Leaf area index (LAI)From June 10th to September 2ndFrom July 1st to August 18thFrom June 20th to September 18th
Grain yield and water productivitySeptember 6thSeptember 3rdOctober 12th
Table 4. Summary of real irrigation volumes (I), total water input (rainfall R + irrigation I), total water productivity (TWP) and irrigation water productivity (IWP) across cropping seasons under different agricultural practices (conservation agriculture—CA and conventional tillage—CT) combined with different irrigation systems (not irrigated—NI, sprinkler—S and subsurface drip—SSD).
2021 (Maize)2022 (Sorghum)2023 (Soybean)
TreatmentI
(m3·ha−1)
R + I
(m3·ha−1)
TWP
(kg·m−3)
IWP
(kg·m−3)
I
(m3·ha−1)
R + I
(m3·ha−1)
TWP
(kg·m−3)
IWP
(kg·m−3)
I
(m3·ha−1)
R + I
(m3·ha−1)
TWP
(kg·m−3)
IWP
(kg·m−3)
CA-S210060001.702.02240035500.480.71300045700.320.48
CA-SSD250064001.481.41260037500.010.01270038700.200.31
CA-NI-39001.53--11500.02--15700.02-
CT-S240063002.373.48260037501.381.92270042700.811.02
CT-SSD250064001.711.75260037500.620.83270042700.831.06
CT-NI-39001.69--11500.16--15700.44-
Table 5. Statistical comparison of effects of practice (CA and CT), irrigation system (S, SSD and NI) and their interaction on variables measured for all cropping seasons. Kruskal–Wallis p-values for main effects “practice” and “irrigation system” and linear model p-values for interaction are shown. ‘***’ indicates highly significant (p < 0.001). ‘**’ indicates moderately significant (0.001 ≤ p < 0.01). ‘*’ indicates marginally significant (0.01 ≤ p < 0.05). (ns) indicates not statistically significant (p ≥ 0.05). ‘-’ indicates that p-values were not assessed.
202120222023
VariablePractice (CA, CT)Irrigation System
(S, SSD, NI)
Practice and Irrigation SystemPractice (CA, CT)Irrigation System
(S, SSD, NI)
Practice and Irrigation SystemPractice (CA, CT)Irrigation System
(S, SSD, NI)
Practice and Irrigation System
LAI****ns*****nsnsnsns
Grain Yield***********************
Bulk densitynsnsnsns**nsnsnsns
Soil temperature (mean between 3 and 10 cm depth)**********************
Soil penetration resistance---****ns***nsns
Quasi-steady ponded infiltration******ns******ns**
Soil evaporationns***ns****nsns***ns
Disclaimer/Publisher’s Note: The statements, opinions and data contained in all publications are solely those of the individual author(s) and contributor(s) and not of MDPI and/or the editor(s). MDPI and/or the editor(s) disclaim responsibility for any injury to people or property resulting from any ideas, methods, instructions or products referred to in the content.