Article

Climate Change and Its Impacts on the Planting Regionalization of Potato in Gansu Province, China

1
College of Information Science and Technology, Gansu Agricultural University, Lanzhou 730070, China
2
College of Forestry, Gansu Agricultural University, Lanzhou 730070, China
*
Author to whom correspondence should be addressed.
Agronomy 2025, 15(2), 257; https://doi.org/10.3390/agronomy15020257
Submission received: 19 December 2024 / Revised: 14 January 2025 / Accepted: 19 January 2025 / Published: 21 January 2025
(This article belongs to the Section Agroecology Innovation: Achieving System Resilience)

Abstract

:
This study aims to explore the impacts of climate change on potato planting in Gansu Province so as to be able to adjust potato planting pattern scientifically and rationally. (1) Air precipitation and temperature time-series datasets were obtained from 87 meteorological stations in the study area over the past 50 years. The backpropagation neural network was employed to interpolate irregular and missing data in the time-series data. The altitude, the precipitation from June to July, the average temperature in July and the accumulated temperature above 10 °C were selected as the agricultural zoning indicators for the regionalization of potato planting. (2) The linear propensity rate method, cumulative anomaly method, ArcGIS technology and the Mann–Kendall mutation test were employed to examine the spatial–temporal variation in and mutation testing of the three zoning indicators. (3) The experimental results demonstrated that the amount of precipitation from June to July was registered at 139.94 mm, indicating a slight humidifying trend characterized by an annual increase rate of approximately 1.81 mm/10 a. Furthermore, a significant abrupt change was observed in 1998. The average temperature in July was registered at 20.53 °C, which showed an increasing trend at a rate of 0.55 °C/10 a, marked by a sudden shift in 1998. Lastly, the accumulated temperature above 10 °C was registered at 2917.05 °C, manifesting a significant warming trend at a rate of 161.96 °C/10 a, without any abrupt changes. For spatial distribution, the precipitation from June to July showed a decreasing spatial distribution pattern from south to north and from east to west, while its tendency rate showed a gradually decreasing trend from north to south and from east to west. The average temperature in July showed a decreasing spatial pattern from northeast to southwest, while its tendency rate showed a decreasing trend from west to east and from north to south. The accumulated temperature above 10 °C showed a spatial pattern of high accumulated temperatures in the northwestern and southeastern regions and low accumulated temperatures in the remaining regions, while its tendency rate showed a decreasing trend from west to east and from north to south. (4) The impacts of climate change on potato planting in Gansu Province were mainly manifested as a decrease of 0.30 × 10⁶ hm2 in the cultivated land area in the most suitable region for potato planting post-1998, while the suitable area diminished by 0.96 × 10⁶ hm2, the sub-suitable area expanded by 0.47 × 10⁶ hm2, and the plantable area increased by 0.79 × 10⁶ hm2. However, the unsuitable area experienced a reduction of 0.30 × 10⁴ hm2. The findings of this study can provide a scientific foundation for optimizing and adjusting the potato planting structure, considering the backdrop of climate change. Moreover, they contribute to regional decision-making, thereby promoting sustainable agricultural development as well as enhancing both the yield and quality of potato in Gansu Province.

1. Introduction

Climate change can cause extreme weather conditions such as droughts and floods [1], leading to spatiotemporal changes in climate factors such as the heat, temperature and water required for crop growth, which, in turn, affect the nutritional quality, growth period, yield and planting pattern of crops [2,3,4]. Potato is one of the most promising high-yield economic crops in China, playing an important role in ensuring national food security. Gansu Province is one of the main potato production areas in China, and the growth and development of potatoes are highly dependent on meteorological conditions [5]. Huang Na et al. [6] conducted a study assessing the impact of climate change on potato production, and concluded that warming and drying have had adverse effects on potato production in the past 40 years. If the trend of warming and drying continues, the adverse effects of climate change on potato production will also continue. Therefore, identifying the characteristics of climatic suitability in planting regionalization for potato in Gansu is an effective approach to climate change adaptation.
In China, the impacts of climate change on potato production have been a major cause of concern [7,8,9,10]. He et al. [11] used a temperature thermal response coefficient model to calculate a temperature suitability value for potato phenology, conducting precise temporal and spatial evaluations on temperature suitability for potato growth in China. Wang [7] found that global climate warming had adverse effects on the potato yield in semi-arid regions of northwestern China from 1961 to 2010 based on the WOFOST crop model. Zhao et al. [10] adopted the first-difference method to disentangle the contributions of climate change to potato yield in northern China. However, the above research mainly focused on the relationship between climate change and potato yield at a small scale. To date, the impacts of climate change on potato suitability and planting regionalization in Gansu at a regional scale have not been thoroughly evaluated. Understanding how different climate factors interact and impact potato suitability and regionalization is essential when making decisions on how to adapt to the effects of climate change.
Gansu Province has a large east–west span, a diverse climate and significant regional differences in climate change [12]; 70% of the cultivated land is mountain dry land, and 70% of the precipitation is concentrated in July, August and September. The seasonal distribution of rain and heat resources is highly consistent with the potato yield formation period, which is conducive to the expansion of potato blocks, and it is the best potato planting area in China. Its annual potato production amount and quality are at the forefront for the country, not only to meet the needs of the domestic market but also to supply a large number of exports to overseas markets. Agricultural water in this region mainly relies on natural precipitation, and climate change has a profound impact on the planting regionalization of potato. Therefore, studying potato planting zoning in Gansu Province within the background of climate change has important practical significance for guiding agricultural production. Based on the observational data from 1971 to 2020 collected at 87 meteorological stations, this study employs linear trend analysis, ArcGIS technology and the Mann–Kendall mutation test to examine the temporal and spatial characteristics as well as mutation patterns of selected climate factors for classifying potato planting suitability in Gansu Province. The maximum membership degree fuzzy evaluation model is utilized to assess the climatic suitability for potato cultivation, aiming to provide scientific guidance for optimizing and adjusting the structure of potato planting, ensuring stable and high yields and promoting the rational utilization of climate resources in the study area amidst ongoing climate change. Furthermore, based on these findings, comprehensive measures are proposed to offer scientific insights into the agricultural production layout in arid areas worldwide.

2. Materials and Methods

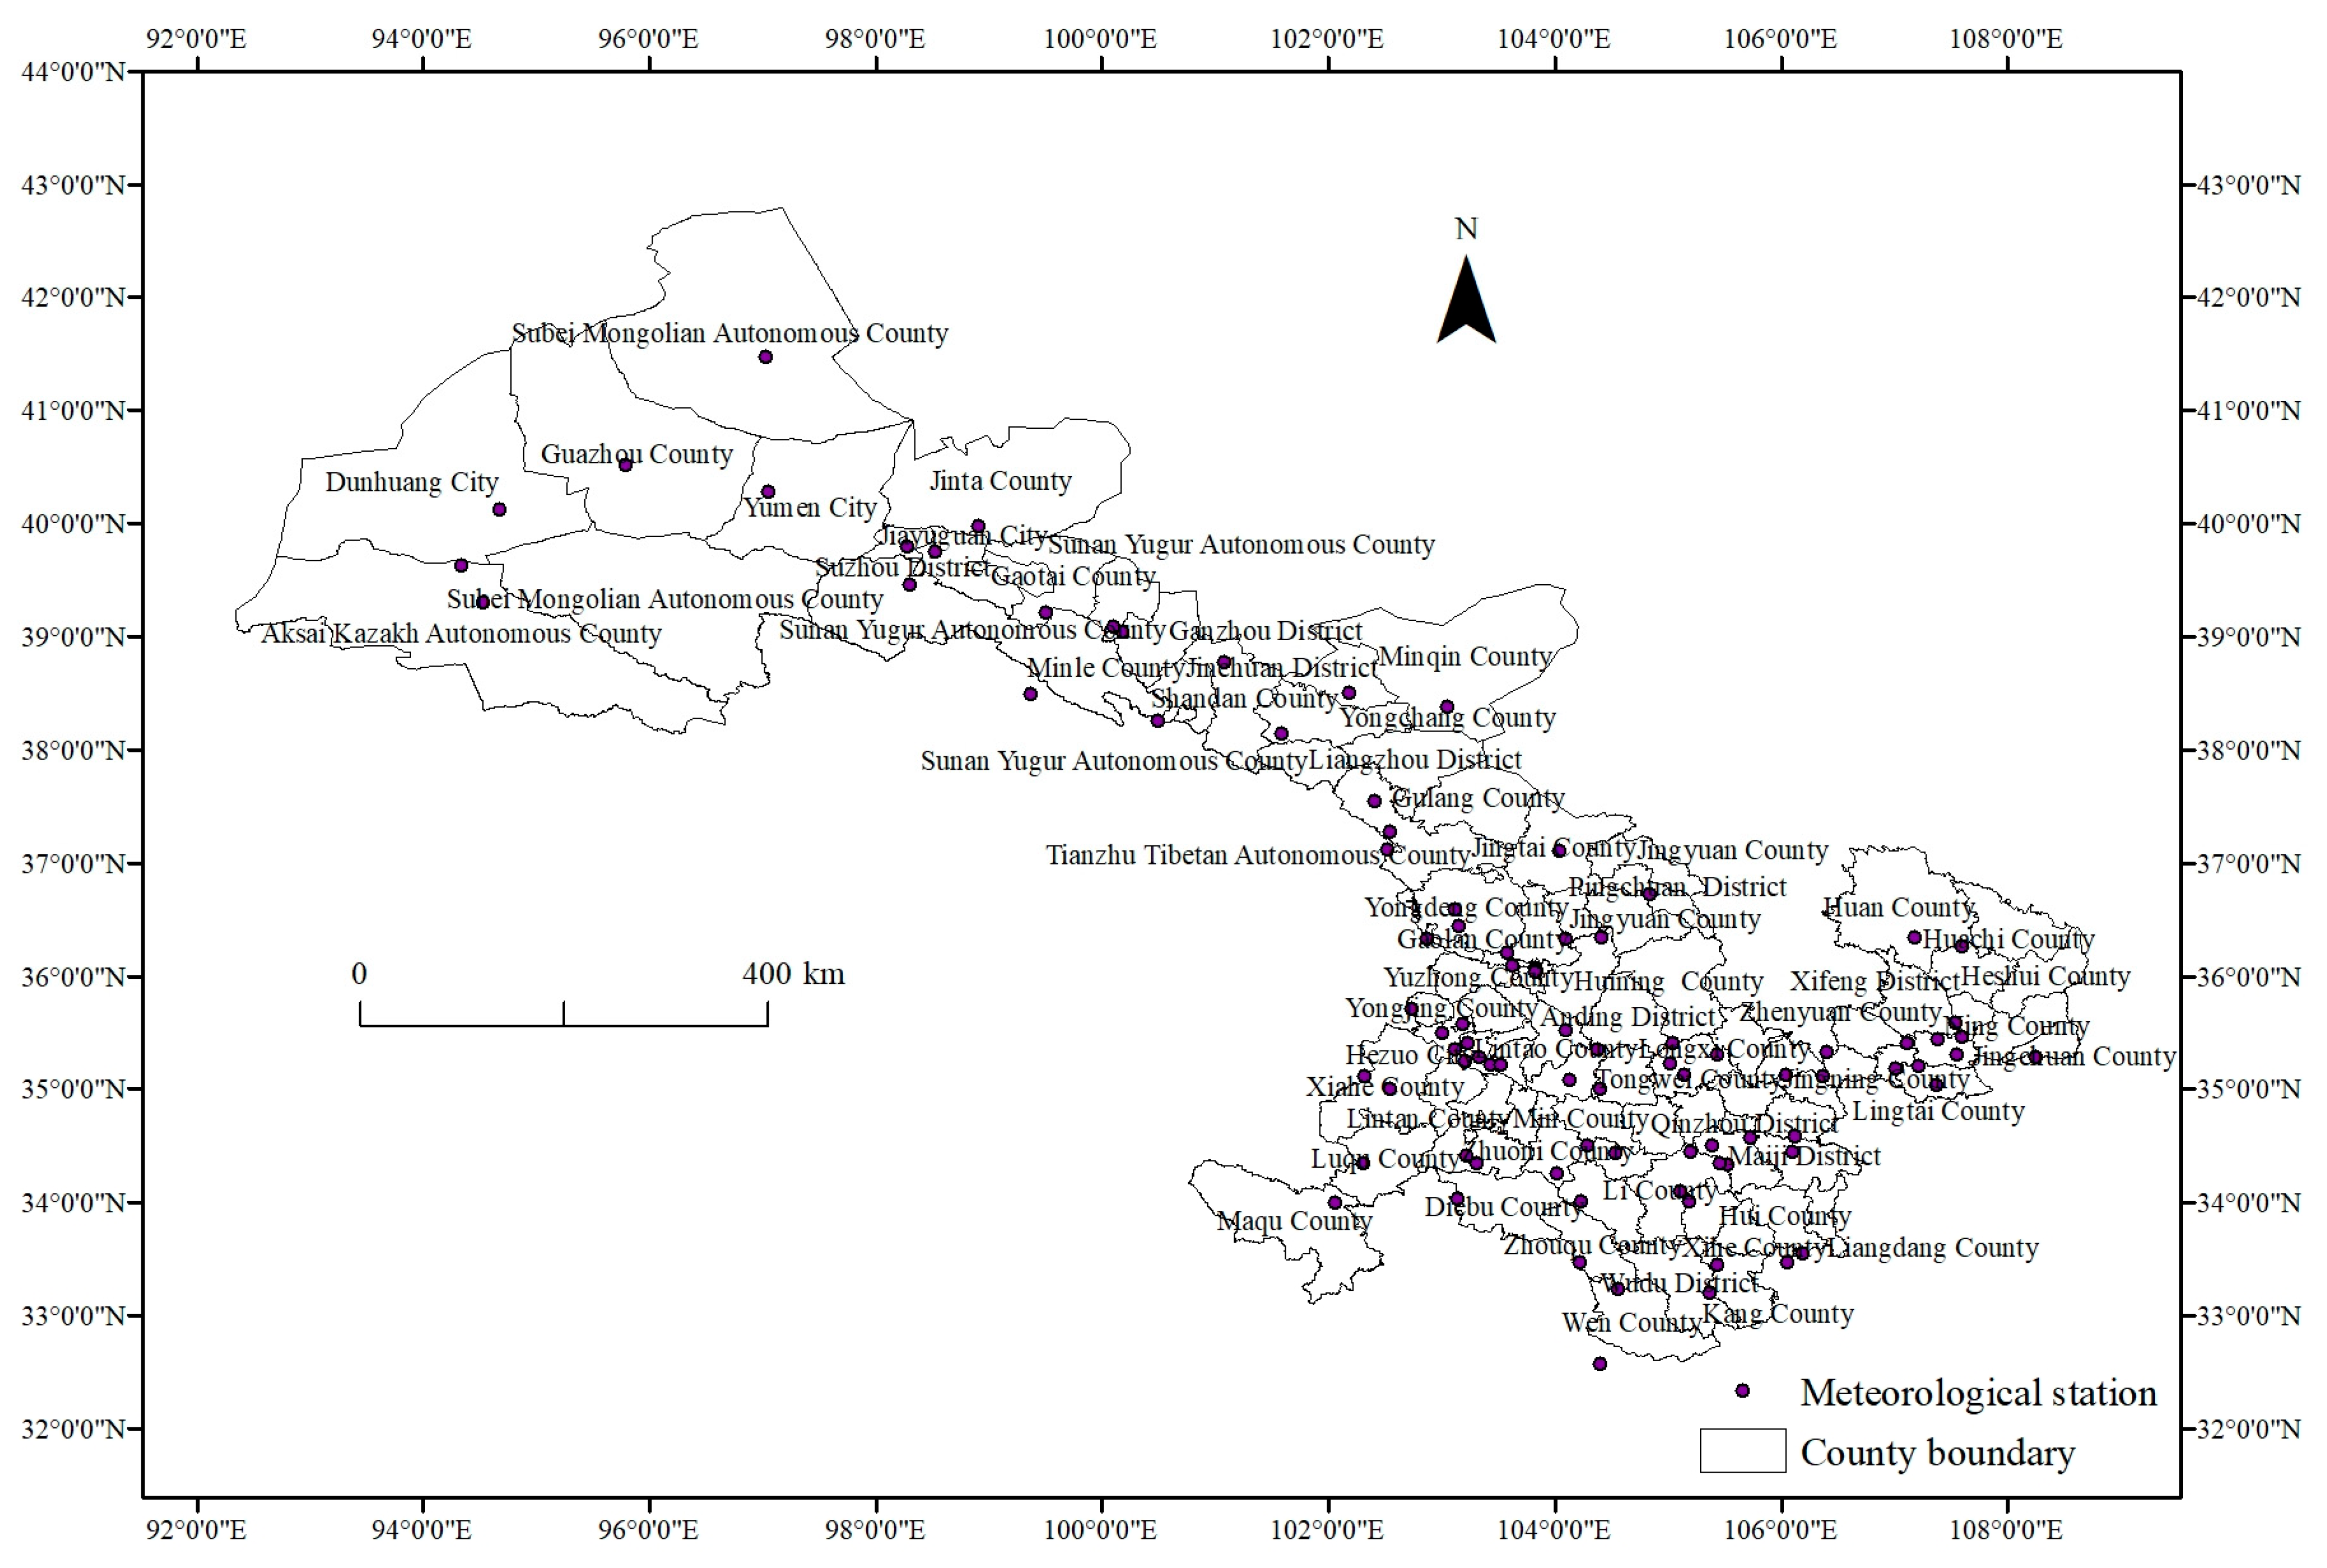
2.1. Regional Overview and Data Sources

Gansu Province is an inland region, ranging from 32°31′—42°57′ N and 92°13′—108°46′ E and with a total area of 4.537 × 10⁶ hm2. Gansu has complex and diverse landforms, including mountains, plateaus, plains, valleys and deserts. The terrain slopes from the southwest to the northeast, and the terrain is narrow and long, with a length of 1655 km from east to west and a width of 530 km from north to south. Gansu Province has a dry climate with a large daily temperature range, and the average annual temperature is 0~14 °C. The average annual precipitation is about 300 mm, but the precipitation varies greatly in different places, ranging from 42~760 mm, and decreases from the southeast to the northwest. Gansu Province is rich in light energy resources, with a long sunshine duration and strong solar radiation; the annual sunshine duration is 1700~3300 h, increasing from the southeast to the northwest. The distribution of precipitation is uneven in each season but is mainly concentrated between June and September. From southeast to northwest, it includes various climate types, from the north subtropical humid region to the high cold region and the arid region. The distribution of meteorological stations in the study area is shown in Figure 1.

2.2. Data Source

The meteorological observation data, including the daily average temperature, maximum temperature, minimum temperature, precipitation and sunshine duration were collected from 87 ground meteorological observation stations in Gansu Province from 1971 to 2020. The geographical data were derived from the 1:500,000 scale topographic dataset provided by the China Meteorological Administration.

2.3. Data Processing

Based on 50 years of daily meteorological data from 1971 to 2020, collected from 87 surface meteorological observation stations in Gansu Province, it was observed that approximately 6% of the data exhibited abnormalities or were missing. These anomalies were addressed through interpolation using a BP neural network. Subsequently, the unitary linear regression model fitting method was employed to calculate the inclination rate for the zoning factors. The Mann–Kendall mutation test method was utilized to examine the mutability of the regionalization factors, while ArcGIS 10.8 facilitated the analysis of spatial changes in these factors. Finally, the maximum membership degree fuzzy evaluation method was employed to divide the climate suitability of potato planting areas.

2.4. Research Technique

2.4.1. BP Neural Network Interpolation Method

The backpropagation neural network is a feedforward neural network that can effectively restore the intricate relationship between various environmental factors through forward propagation and error reverse propagation under the guidance of a supervised training program [13]. The core of the BP neural network involves training the network by the error backpropagation algorithm so that the output of the network gradually approaches the expected output. The BP network is composed of several layers, including the input layer, hidden layer (there can be more than one) and output layer. Each layer contains multiple neurons that are connected to each other through weighted connections to form a complex network structure. The training process of the BP network is mainly based on the error backpropagation algorithm. By constantly adjusting the weight and threshold of the network, the output error of the network is gradually reduced so as to realize the learning and solving of complex problems. By utilizing 60% of the data for training, 20% for verification, and another 20% for testing purposes, we constructed a BP neural network with 200 hidden layer neurons using MATLAB 2023 b’s neural network toolbox to accurately interpolate abnormal and missing data.

2.4.2. The Mann–Kendall Mutation Test Method

The Mann–Kendall method is a non-parametric statistical testing method, which has the advantage of not requiring samples to follow a certain distribution and not being affected by a few outliers. It is more suitable for categorical and ordinal variables, has strong applicability, and is relatively easy to calculate. This method can not only verify the trend of changes in time series but also check whether there has been a sudden change in the time series. The Mann–Kendall (M-K) mutation test was used to test the significance of the mutation characteristics and trends of climate factors. If the two statistical curves of M-K test intersect, the intersection point is the time when the mutation begins. When the absolute value of the M-K test statistic is less than 1.96, it indicates that the trend of climate factor change is not significant (p ≥ 0.05). Conversely, when the absolute value of the M-K test statistic is greater than 1.96, it indicates that the trend of climate factor change is significant (p < 0.05) [14,15].

2.4.3. Maximum Membership Degree Fuzzy Evaluation Method

The maximum membership degree fuzzy evaluation method is a widely employed decision-making approach that determines the set to which an element should be assigned based on its degree of belonging to various sets. Specifically, consider an element, x, and three sets, A, B, and C. If x exhibits the highest degree of membership in set A compared with sets B and C, then x is classified as belonging to set A. The climate zoning factors that affect potato growth and development were selected, and a semi-trapezoidal membership function was used to conduct fuzzy comprehensive evaluation of the zoning indicators of 87 meteorological stations in order to divide suitable areas. The use of the maximum membership degree fuzzy evaluation method makes the evaluation results more scientific and objective [16].
(1)
Selection of climatic zoning factors
Temperature, precipitation and heat are the main meteorological factors affecting the growth and development of potatoes [17,18]. Based on the demand for light, heat and water during the critical growth period and the entire growth period of potatoes, and by drawing on previous research results [12], the altitude, the precipitation from June to July, the average temperature in July and the accumulated temperature above 10 °C were selected as zoning indicators.
According to the ecological conditions of Gansu Province and considering the membership functions of each regional factor as well as the ecological characteristics of potato, and by referring to previous research results [12], this study classified Gansu Province into five distinct climatic regionalization areas: the most suitable areas, the suitable areas, the sub-suitable areas, the plantable areas and the unsuitable areas. The specific scope of each partition is shown in Table 1.
(2)
Fuzzy comprehensive evaluation of zoning factors
Establishment of the factor set and evaluation set for zoning factors
The factor set U = { u 1 ,   u 2 , u i } of climatic suitability zoning for potato planting was established. Here, u i represents the i-th zoning factor (i = 4). In this study, four factors were selected for zoning elevation: altitude, the precipitation from June to July, the average temperature in July and the accumulated temperature above 10 °C. The evaluation set V = { v 1 ,   v 2 ,   v j } was determined for assessing the climatic suitability of potato planting, with v j representing the j-th evaluation grade. We divided suitable zones for potato planting into five grades.
Determination of weight coefficients for zoning factors
The weight of each zoning factor was calculated according to meteorological data, and the calculation formula is as follows:
g i = 1 ,     x i s i , 1 g i = j + s i , j x i s i , j s i , j + 1 ,     s i , j + 1 x i < s i , j g i = n ,     x i s i , n
where gi represents the absolute weight of the i division factor; xi represents the arithmetic average of the division factor i; si,j represents the j-level standard value of the i-type zoning factor; and n is the last rating level.
Then, standardize the absolute weight to obtain the final weight value.
Determination of membership function
According to the specific situation of the influence of each regional factor on potato growth and development and the regional index of the eco-climate and suitable planting (Table 1), the semi-ladder membership function was used to establish the evaluation model.
Calculation of the fuzzy evaluation matrix
The single-factor evaluation matrix for each division factor was obtained by the membership function, and then the fuzzy evaluation matrix was obtained.
Comprehensive evaluation
The comprehensive evaluation set was derived by integrating the weights of the regionalization factors and the fuzzy evaluation matrix. Based on the principle of maximum membership degree, the final evaluation level was determined by selecting the highest membership degree from the comprehensive evaluation set.

3. Results

3.1. The Temporal Variation Characteristics and Mutation Testing of Zoning Factors

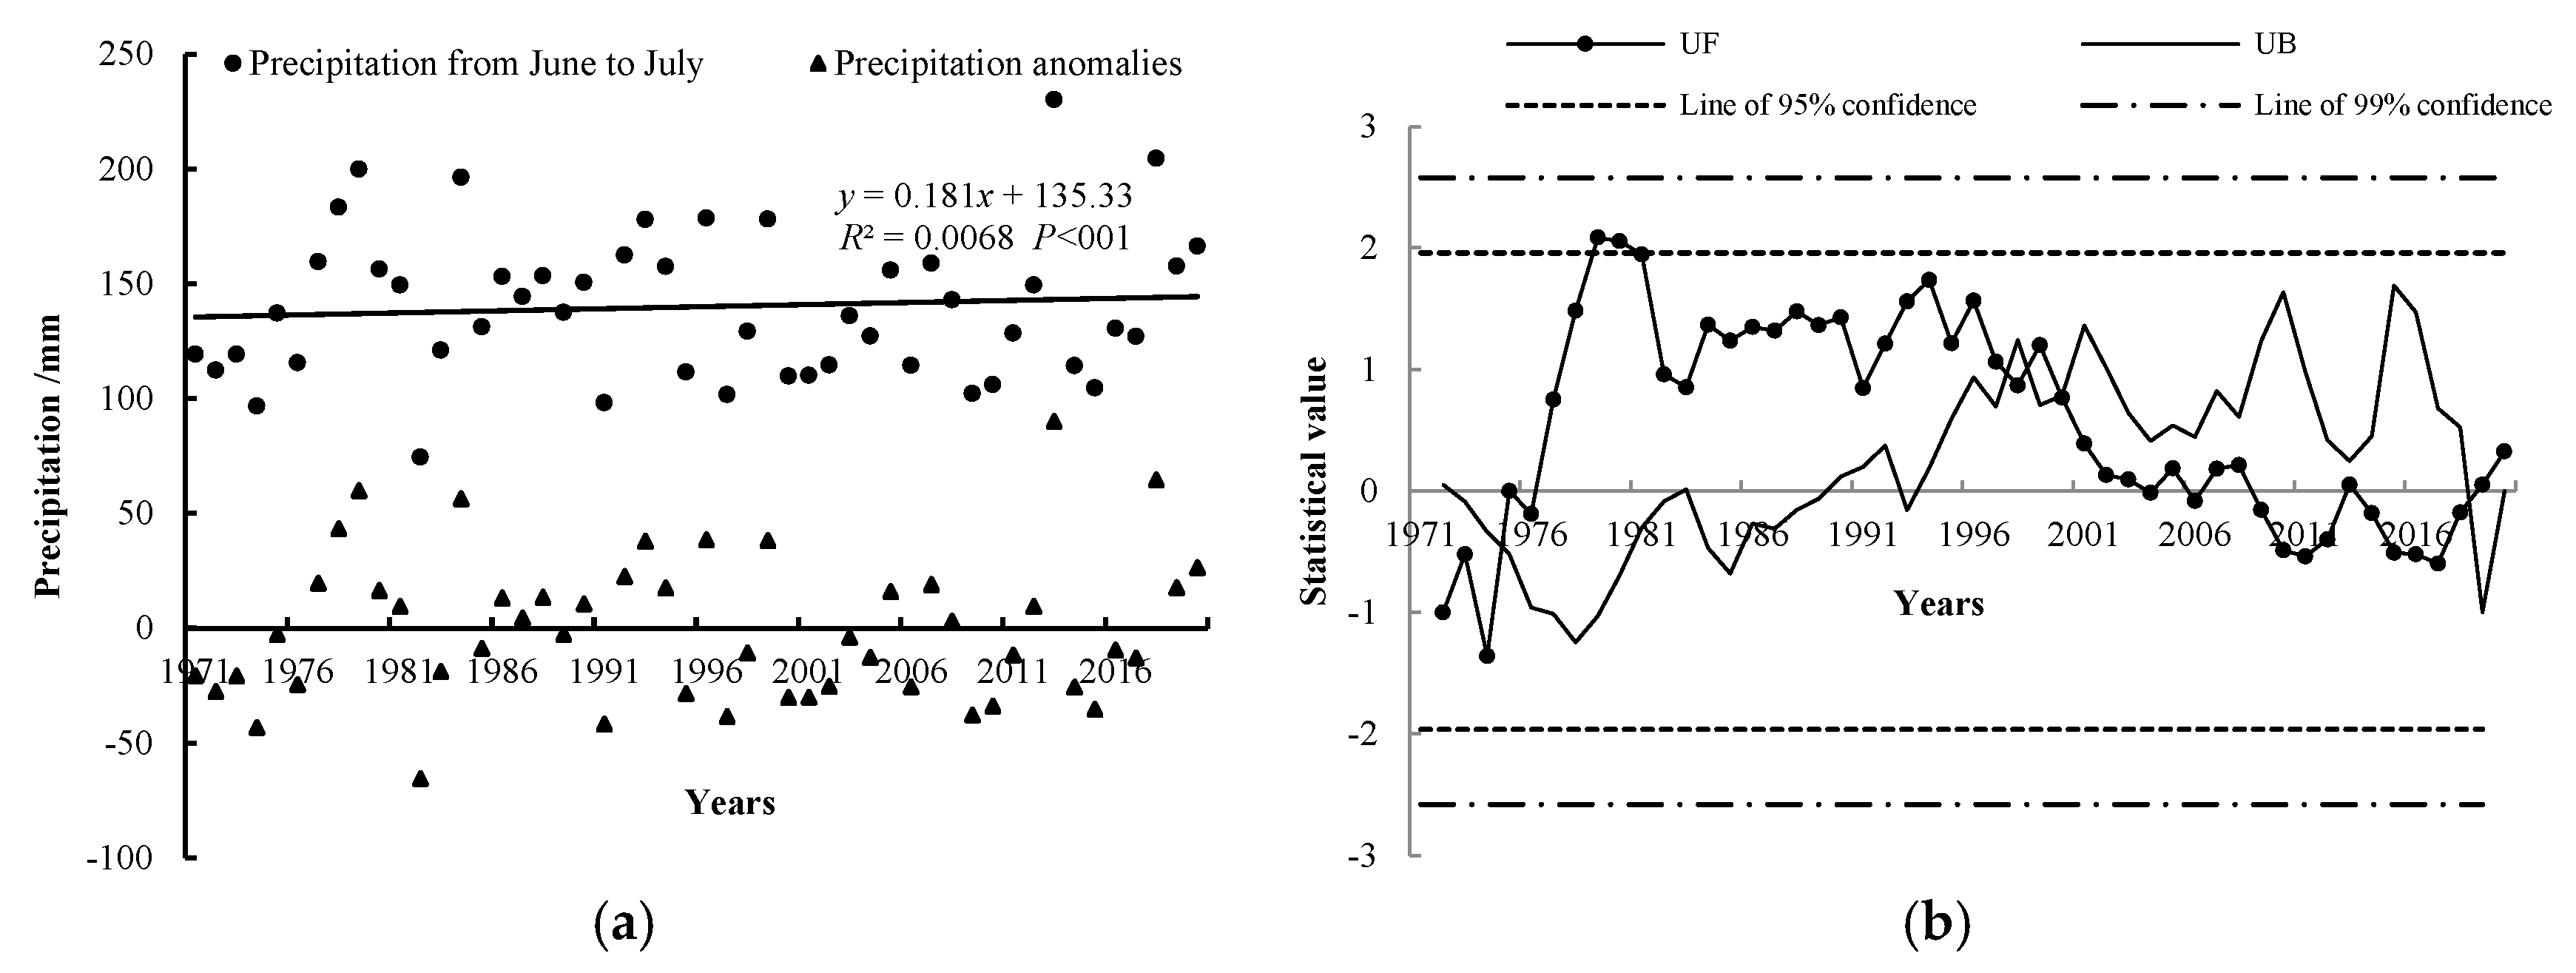
3.1.1. Amount of Precipitation from June to July

Over the past 50 years, the average amount of precipitation from June and July in the study area was recorded at 139.94 mm. The lowest and highest values of the average amount of precipitation during this period occurred in 1982 and 2013, respectively, measuring 74.48 mm and 230.10 mm, resulting in an amplitude of 155.62 mm. The inter-annual variation in the average amount of precipitation from June and July exhibited significant fluctuations; however, there was a slight increasing trend with an overall rate of 1.81 mm/10 a (Figure 2a), meaning that it increased by 1.81 mm every 10 years, leading to a total increase of 9.05 mm over the course of five decades. From the anomaly in the average amount of precipitation from June to July, it can be seen that the amount of precipitation shows an overall upward trend in the inter-annual fluctuation. In the 1970s, the precipitation showed a trend of decreasing first and then increasing. In the 1980s, except for 1982 and 1984, the amount of precipitation fluctuated up and down relative to the average value of the past years, but the overall increase or decrease was not large. During the first 10 years of the 21st century, the amount of precipitation decreased significantly, and the average amount of precipitation from 2018 to 2020 reached 176.18 mm, which was 36.24 mm higher than the annual average. According to the UF trend line of the M-K mutation test of the amount of precipitation from June to July (Figure 2b), the UF statistical value during 1971–1976 was less than 0, but the statistical value did not reach the level of the 95% confidence line, indicating that while the amount of precipitation showed a downward trend during this period, the decline was not significant. The increasing trend in the precipitation from 1977 to 2008 was not obvious. The decreasing trend in the precipitation from 2009 to 2018 was not significant either. The intersection points of the UF and UB curves appeared in 1975, 1998, 1999, 2000 and 2019, respectively. Further t tests showed that 1998 was the mutation point of the average amount of precipitation from June to July (p < 0.05).

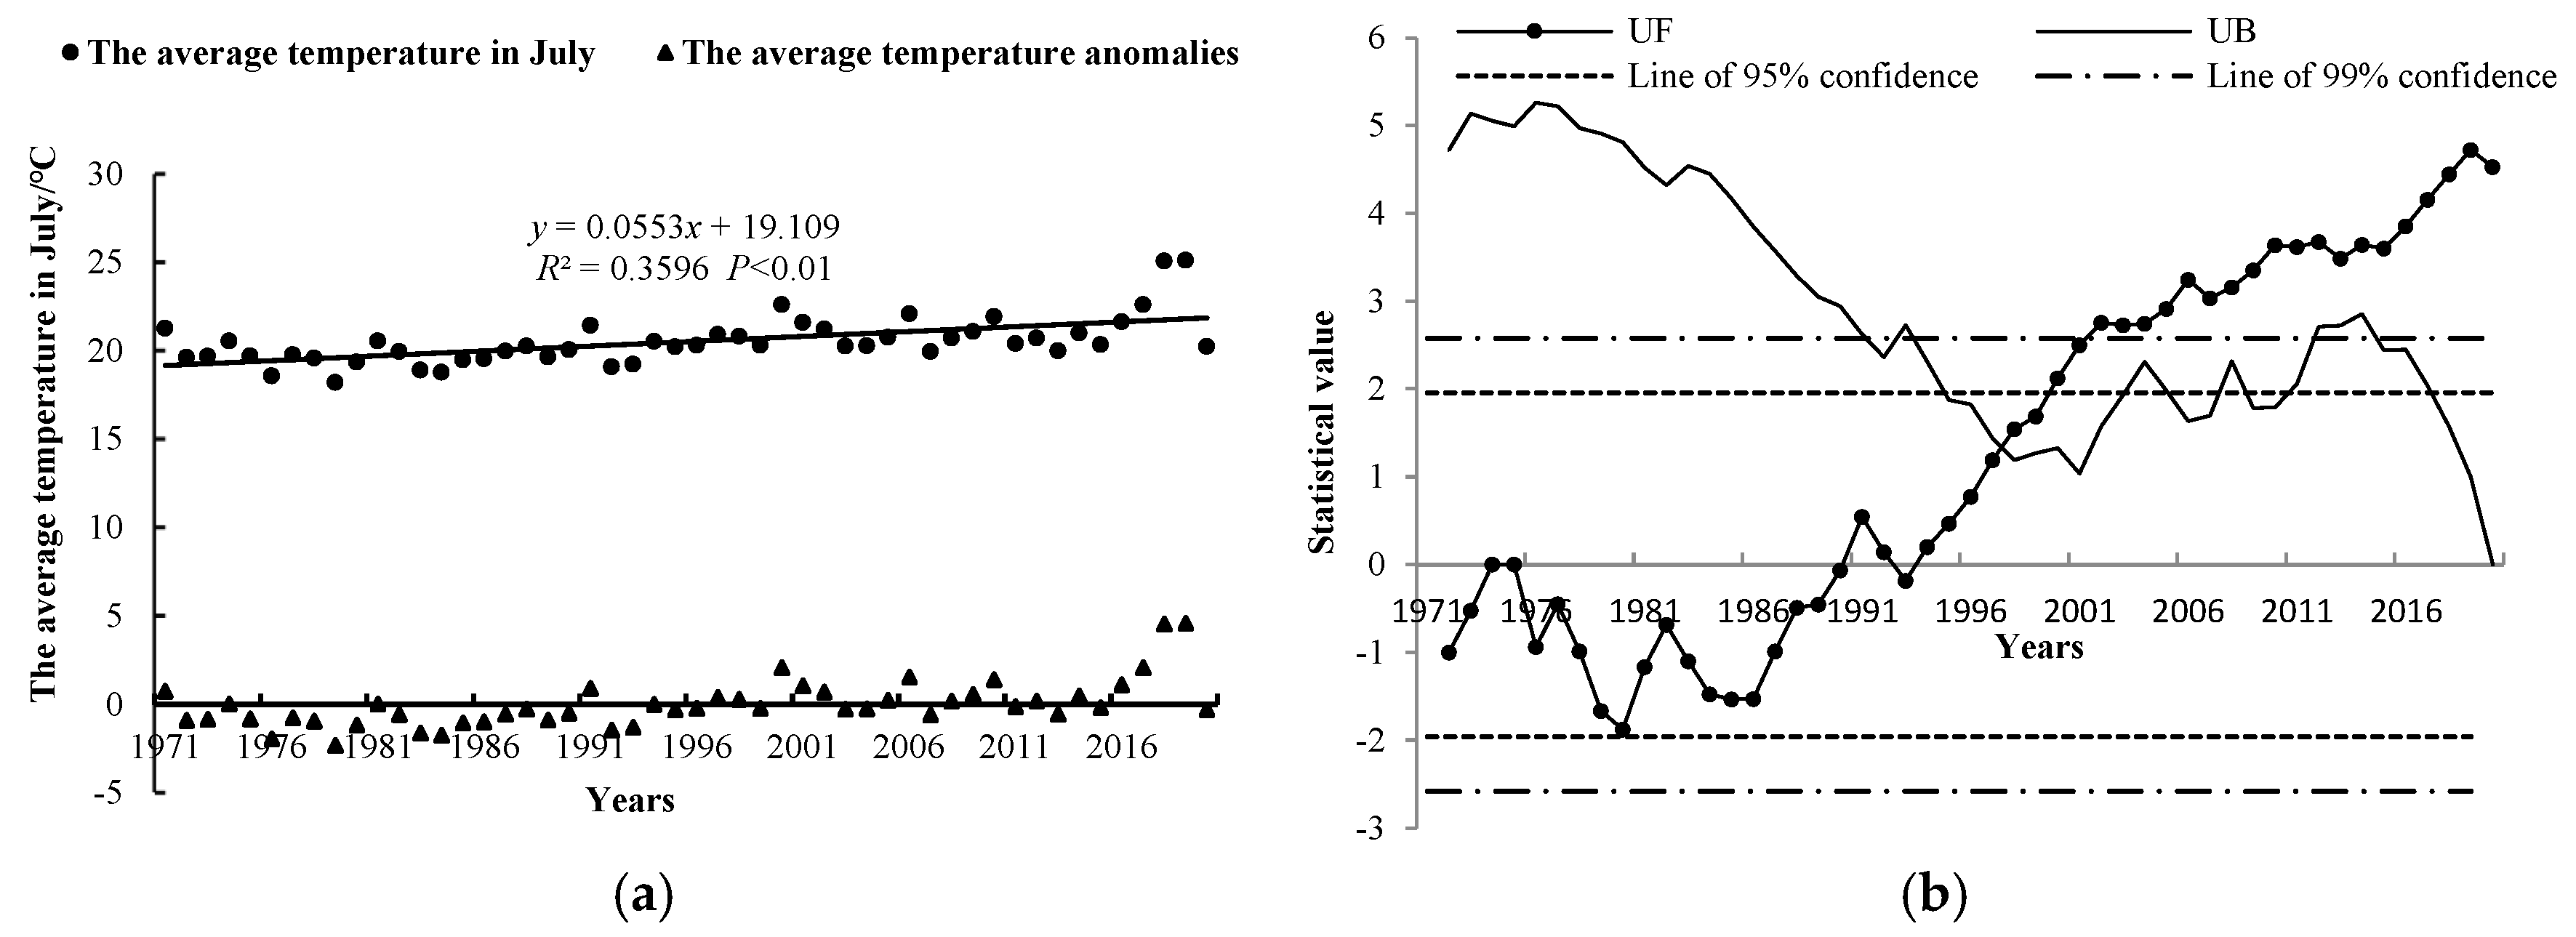
3.1.2. The Average Temperature in July

The average temperature in July within the study area was 20.53 °C from 1971 to 2020. The minimum and maximum values of the average temperature in July appeared at 18.21 and 25.11 °C in 1979 and 2019, respectively, with an amplitude of 6.90 °C. The average temperature in July fluctuated, but overall, it showed an increasing trend at a rate of 0.55 °C/10 a (Figure 3a), with an increase of 2.75 °C over 50 years, which was significantly higher than the global trend rate of 0.12 °C/10 a from 1960 to 2010 [19] and the national trend rate of 0.25 °C/10 a from 1955 to 2010 [20]. It can be seen that the study area is very sensitive to global temperature changes. From the average temperature anomaly in July, it can be seen that the average temperature generally showed an upward trend in inter-annual fluctuations. Before 1996 (except for 1971, 1981 and 1999), the average temperature in July was below the average value. From 1997, it entered a warm period, with the average temperature anomaly turning from negative to positive, showing a rapid warming trend, with the maximum temperature increase reaching 2.47 °C. From an interdecadal perspective, the temperature anomaly in the 1970s and 1980s remained relatively consistent. However, there was a notable increase of 0.64 °C in temperatures during the 1990s compared with those in the previous decade, and the temperature increased significantly after entering the 21st century, which was 1.12 °C higher than that in the 1990s. Through the M-K mutation test on the average temperature in July from 1971 to 2020, it was found (Figure 3b) that the average temperature in July showed obvious mutation. There was no warming trend in the 20 years from 1971 to 1990. However, the UF statistical curve consistently remained above the zero boundary from 1991 to 2020 (excluding 1993), indicating a discernible warming trend from 1991 and a notably significant warming trend post-2000 (with the UF surpassing the 95% confidence line level). Notably, since 2002, there has been a highly significant increase in the average temperature in July within our study area (as evidenced by a UF statistical value reaching a significance level of 0.01). The intersection point of the two statistical curves of UF and UB appeared in 1998, and the intersection point was between the 95% critical boundaries, indicating that the average temperature in July had a sudden change in 1998, which was consistent with the results of previous studies [21]. Gansu Province is one of the most sensitive regions to global climate change, and the temperature increase rate in the region is higher than the national and global levels [22]. According to the Second National Assessment Report on Climate Change [23], the role of human emissions of sulfate aerosols and greenhouse gases in China’s climate warming has been very obvious in the last 60 years.

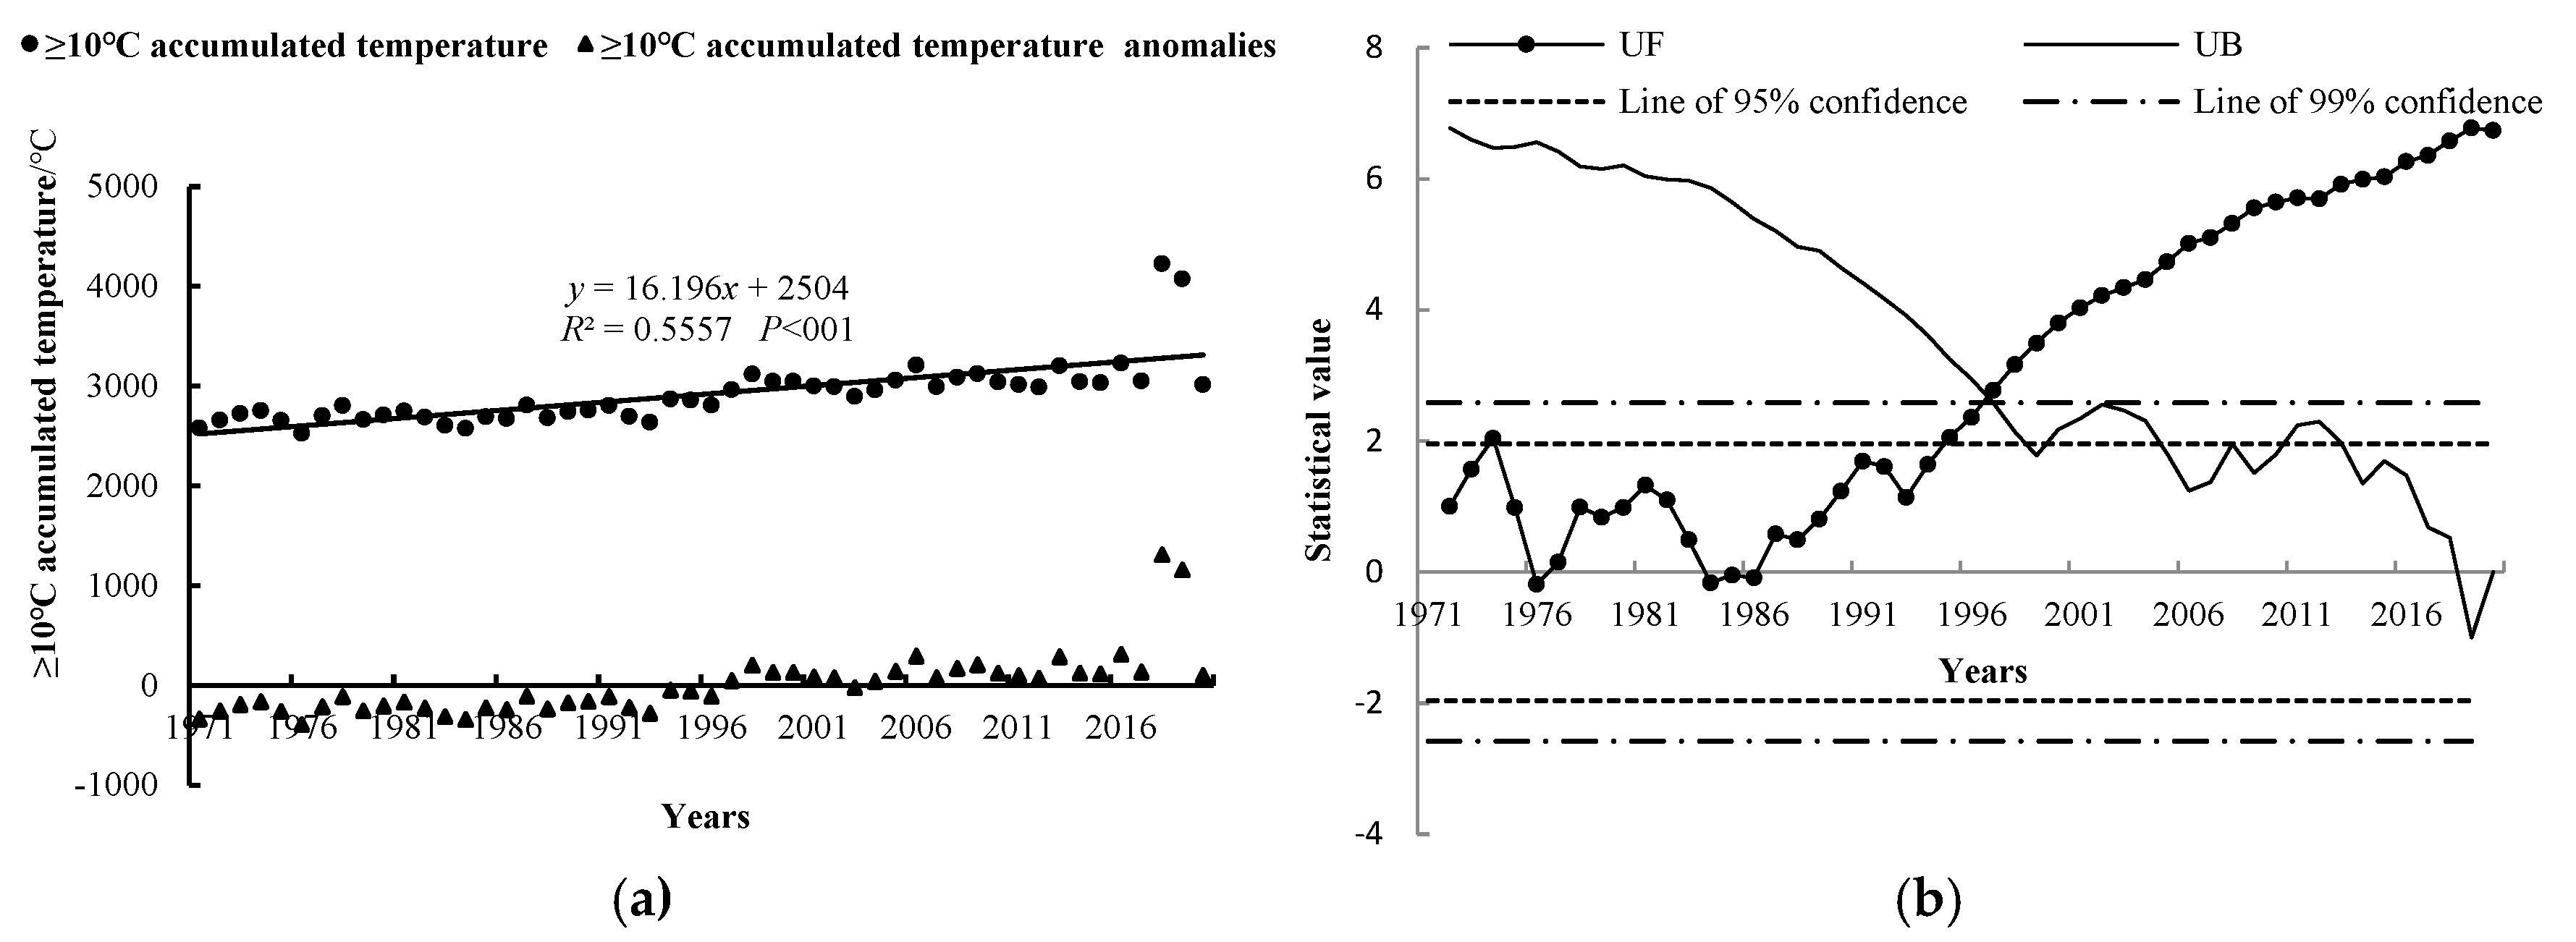
3.1.3. The Accumulated Temperature Above 10 °C

According to Figure 4a, from 1971 to 2020, the accumulated temperature above 10 °C in the study area showed a significant warming trend at a rate of 161.96 °C/10 a. The average accumulated temperature above 10 °C was 2917.05 °C, which was an increase of 809.80 °C in the past 50 years. The accumulated temperature above 10 °C exhibited a clear warming trend between decades, with the accumulated temperature anomaly above 10 °C being less than 0 prior to 1996. In the 1970s, the average accumulated temperature above 10 °C was recorded at 2674.38 °C, which was significantly lower than the annual average. A slight warming change occurred in the 1980s, reaching an average accumulated temperature of 2692.95 °C. During the 1990s, the average accumulated temperature rose to 2856.33 °C. Since entering the 21st century, there has been a continuous rise in temperatures; in particular, the average accumulated temperature reached 3287.98 °C from 2011 to 2020, marking an increase of 613.60 °C compared with that observed in the1970s. The M-K mutation test of the accumulated temperature above 10 °C in the study area revealed an increasing trend from 1971. The UF exceeded the significance level of 0.05 starting from 1995, indicating a significant warming trend after that year. Furthermore, the statistical value of UF reached a significance level of 0.01 from 1997, demonstrating a highly significant trend in accumulated temperature above 10 °C within the study area since then. Although the intersection point between the UF and UB curves occurred in 1997, it did not fall within the critical boundary, suggesting no abrupt change in the accumulated temperature above10 °C within the study area.

3.2. The Spatial Variation Characteristics of Zoning Factors

By taking 1998 as the pivotal year in which there was an abrupt change in precipitation from June to July and average temperature in July, this study divided the study period into two periods: 1971–1998 and 1999–2020, with the aim of investigating the disparity in ecological climate suitability for potato planting before and after the abrupt change.

3.2.1. The Spatial Variation Characteristics of Precipitation from June to July

The spatial distribution of precipitation from June to July in Gansu Province exhibited distinct regional variations (Figure 5a,b), characterized by a gradual decrease in precipitation from south to north and from east to west. Specifically, Jiuquan, Jiayuguan and Zhangye in the west of Gansu Province and Baiyin in the central part of Gansu Province experienced less than 82 mm of rainfall, forming a low-value area. Conversely, Longnan and Gannan in the southeast of Gansu, Linxia in the central part of Gansu, as well as Qingyang and Pingliang in the eastern part of Gansu witnessed precipitation exceeding 184 mm, constituting a high-value region. The precipitation in the southeastern and eastern regions of Gansu Province is much higher than the average for the whole region. The central part of Gansu Province experienced slightly higher precipitation, which is on par with the overall average for the whole region. Conversely, there was a lower amount of precipitation in western Gansu. The highest precipitation from June to July occurred in Kang County in southeastern Gansu, reaching 237.04 mm, while the lowest, only 21.35 mm, occurred in Guazhou in western Gansu, representing a difference of 215.69 mm. The highest value was 11.10 times that of the lowest value. The precipitation from June and July in Gansu Province ranged from 23.45 mm to 231.48 mm during the period of 1971–1998 and from 18.33 mm to 244.12 mm during the period of 1999–2020, with average values of 138.69 mm and 137.86 mm, respectively. The two periods were basically the same. The regional distribution characteristics of precipitation from June to July during the periods of 1971–1998 and 1999–2020 were basically the same, but there were some differences in the area of precipitation at different levels. In comparison with the period of 1971–1998, there had been a significant reduction in the area, which experienced precipitation levels ranging from 159.93 mm to 184.20 mm during the years of 1999–2020, while other areas had shown no substantial changes. The spatial variation in the precipitation tendency rate from June to July exhibited a decreasing trend from north to south and from east to west (Figure 5c). The region with the lowest value was observed in Diebu in southeastern Gansu (−6.05 mm/10 a), while the highest value occurred in Chongxin in eastern Gansu (11.52 mm/10 a).

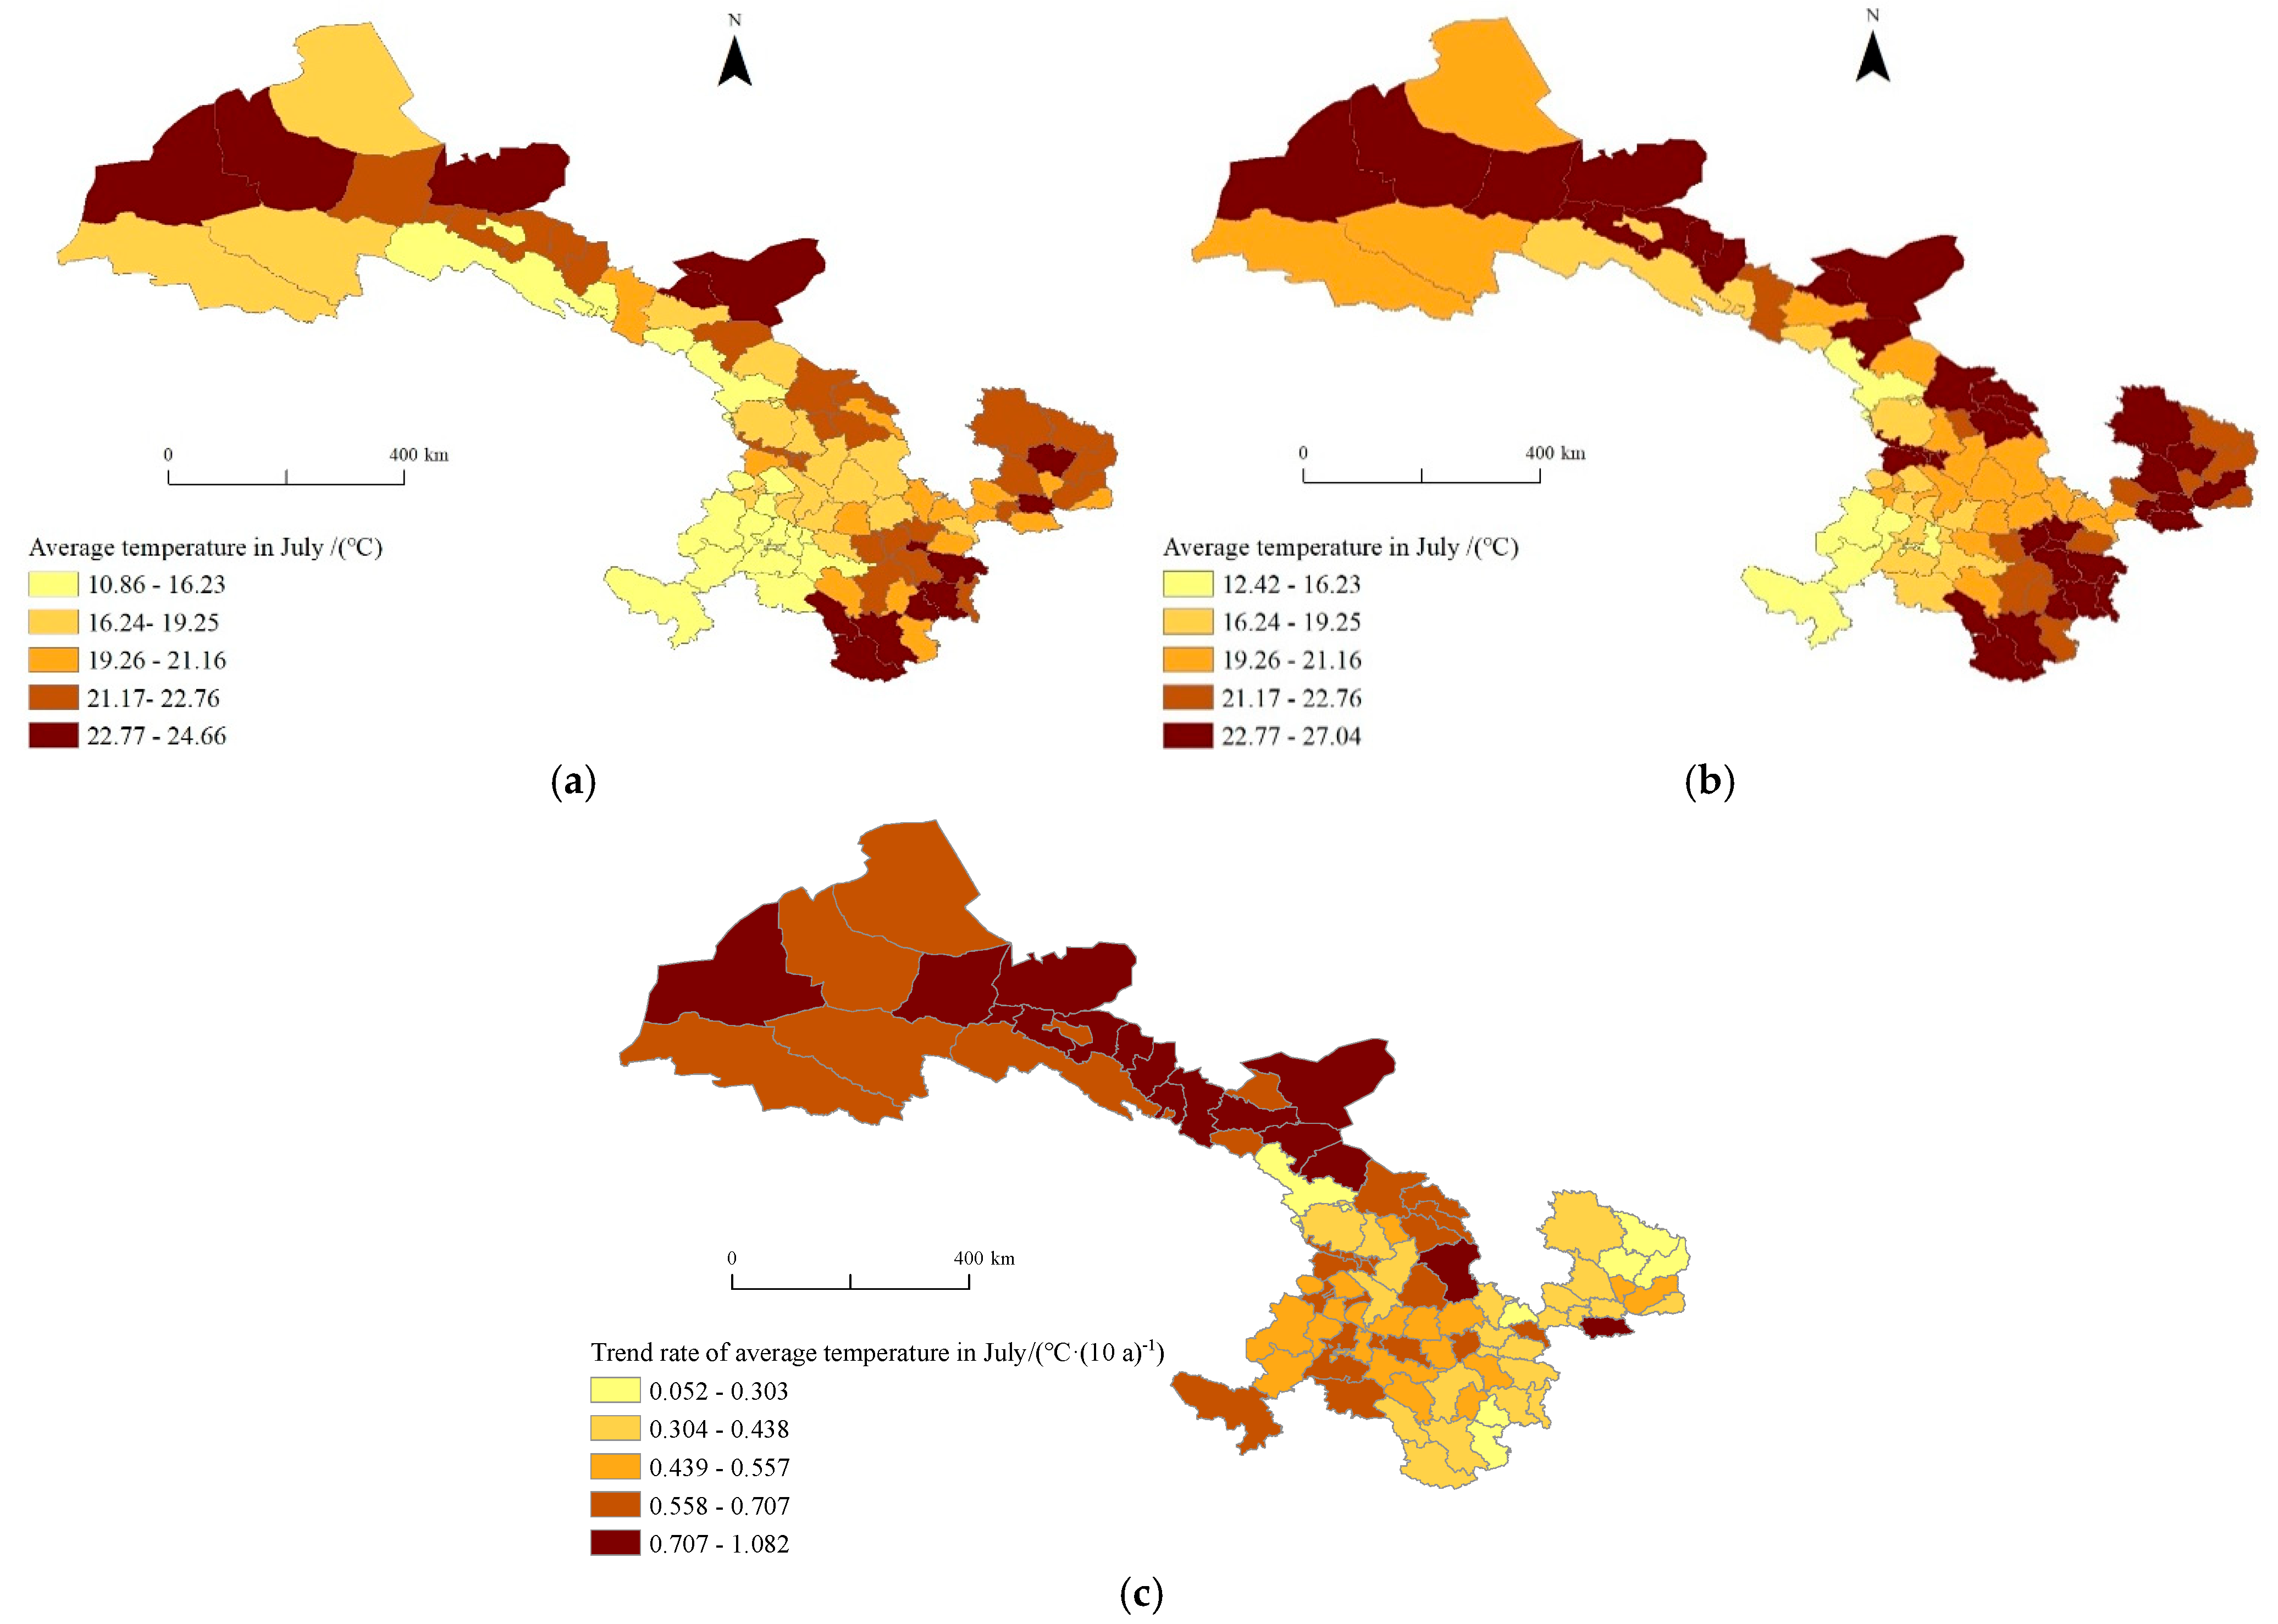
3.2.2. The Spatial Variation Characteristics of the Average Temperature in July

The spatial distribution pattern of the average temperature in July from 1971 to 2020 (Figure 6a,b) revealed a consistent warming trend across all stations over the past five decades, albeit with varying magnitudes. The average temperature in July showed a decreasing spatial pattern from northeast to southwest. The average temperature in July exceeded 22.77 °C in most areas of Longnan and Jiuquan, thus forming a region with high temperature values. Conversely, Sunan and Minle in Zhangye, Tianzhu in Wuwei and most regions of Gannan and Linxia witnessed average temperatures in July that were lower than 16.23 °C, creating low-temperature zones. The lowest average temperature in July appeared in Maqu of Gannan, with a multi-year average of only 11.55 °C, while the highest value, with a difference of 13.95 °C, appeared in Dunhuang of Jiuquan, reaching 25.50 °C. The average temperature in July ranged from 10.86 °C to 24.66 °C between 1971 and 1998 and from 12.42 °C to 27.04 °C between 1999 and 2020, with an overall average of 19.96 °C and 21.46 °C, respectively. The latter period showed an average increase of 1.50 °C compared with the previous period. The regional distribution characteristics of the average temperature in July during the periods of 1971–1998 and 1999–2020 were basically the same, but there were some differences in the area of precipitation at different levels. Compared with the period of 1971–1998, there was a significant decrease in the extent of the areas with a mean temperature in July ranging from 10.86 °C to 19.25 °C and a notable expansion in the areas where the mean temperature in July ranged from 19.26 °C to 21.16 °C and from 22.77 °C to 24.66 °C during the years of 1999–2020. The trend rate for the average temperature in July showed a gradual decreasing trend from west to east and from north to south (Figure 6c). The eastern part of Gansu exhibited a relatively low trend rate, with Qingcheng experiencing the slowest warming rate, characterized by a trend rate for the average temperature in July of merely 0.25 °C/10 a. In contrast, the central part of Gansu Province demonstrated a comparatively rapid warming rate, as all stations recorded a trend rate for the average temperature in July surpassing 0.60 °C/10 a. Amongst these regions, the west of Gansu Province displayed the largest amplitude of warming, with Zhangye witnessing the swiftest increase in temperature during July at an average temperature trend rate of 1.08 °C/10 a. Notably, the maximum trend rate for the average temperature in July in the region was 4.32 times that of the minimum value.

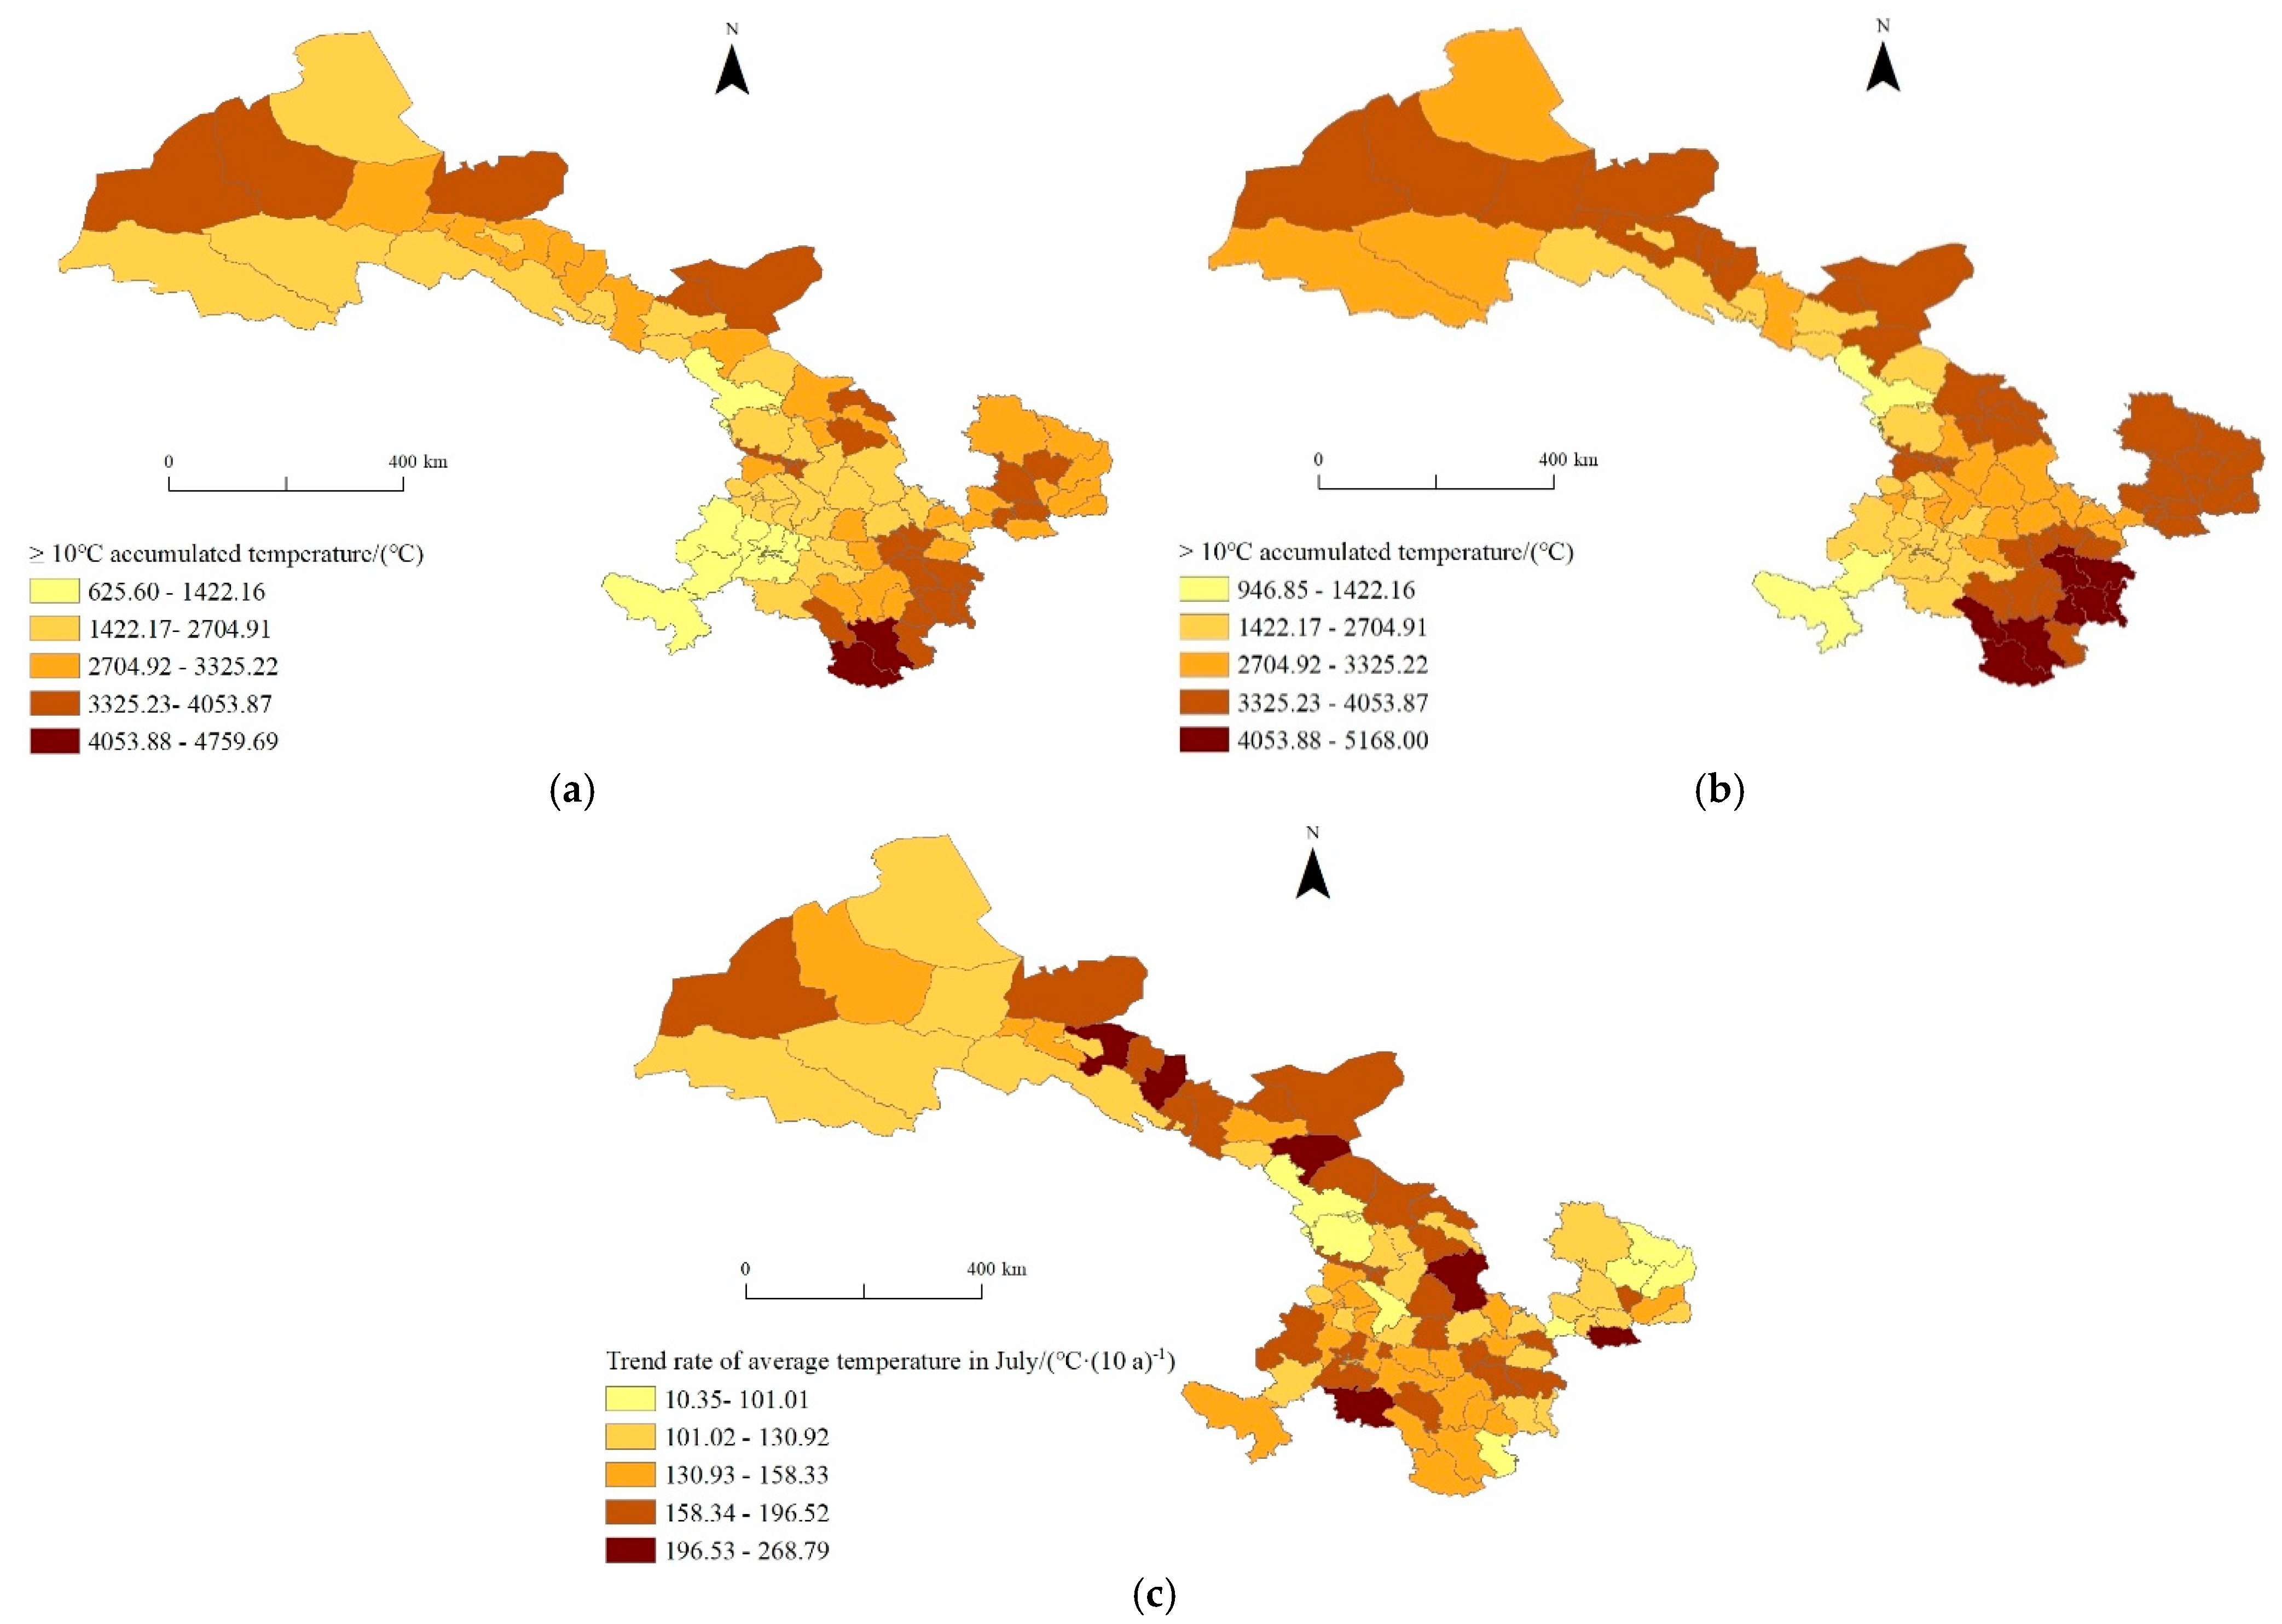
3.2.3. The Spatial Variation Characteristics of the Accumulated Temperature Above 10 °C

The spatial variation of the accumulated temperature above 10 °C in the study area showed a spatial pattern of higher accumulated temperatures in the northwestern and southeastern regions and lower accumulated temperatures in other regions (Figure 7a,b). Specifically, the middle part of the Hexi Corridor and Gannan Plateau experienced relatively lower accumulated temperatures, whereas the Longnan region and the northwest of Hexi Corridor exhibited higher accumulated temperatures. Regional differences in the accumulated temperature above 10 °C were very significant, with the highest value occurring in Wenxian of Longnan, reaching 4939.35 °C, and the lowest value occurring in Maqu of Gannan with only 788.49 °C, representing a difference of 4150.86 °C. The highest value was 6.26 times that of the lowest value. The accumulated temperature above 10 °C ranged from 625.60 °C to 4759.69 °C between 1971 and 1998 and from 946.85 °C to 5168.00 °C between 1999 and 2020, with an overall average of 2874.53 °C and 3265.24 °C, respectively. The latter period showed an average increase of 390.71 °C compared with the previous period. The low-value area of accumulated temperature above 10 °C showed a significant decrease during 1999–2020 compared with the period of 1971–1998, while the high-value area of 3325.23~4053.87 °C exhibited a notable expansion. The trend rate for the accumulated temperature above 10 °C showed a gradual decreasing trend from west to east and from north to south (Figure 7c). However, the regional variation in the tendency rate for the accumulated temperature was very obvious. The tendency rate for the accumulated temperature above 10 °C in Qingcheng, which had the slowest warming rate, was only 81.04 °C/10 a, while in Diebu, which had the fastest warming rate, it reached 268.79 °C/10 a. Notably, the maximum trend rate for the accumulated temperature above 10 °C in the region was 3.32 times that of the minimum value.

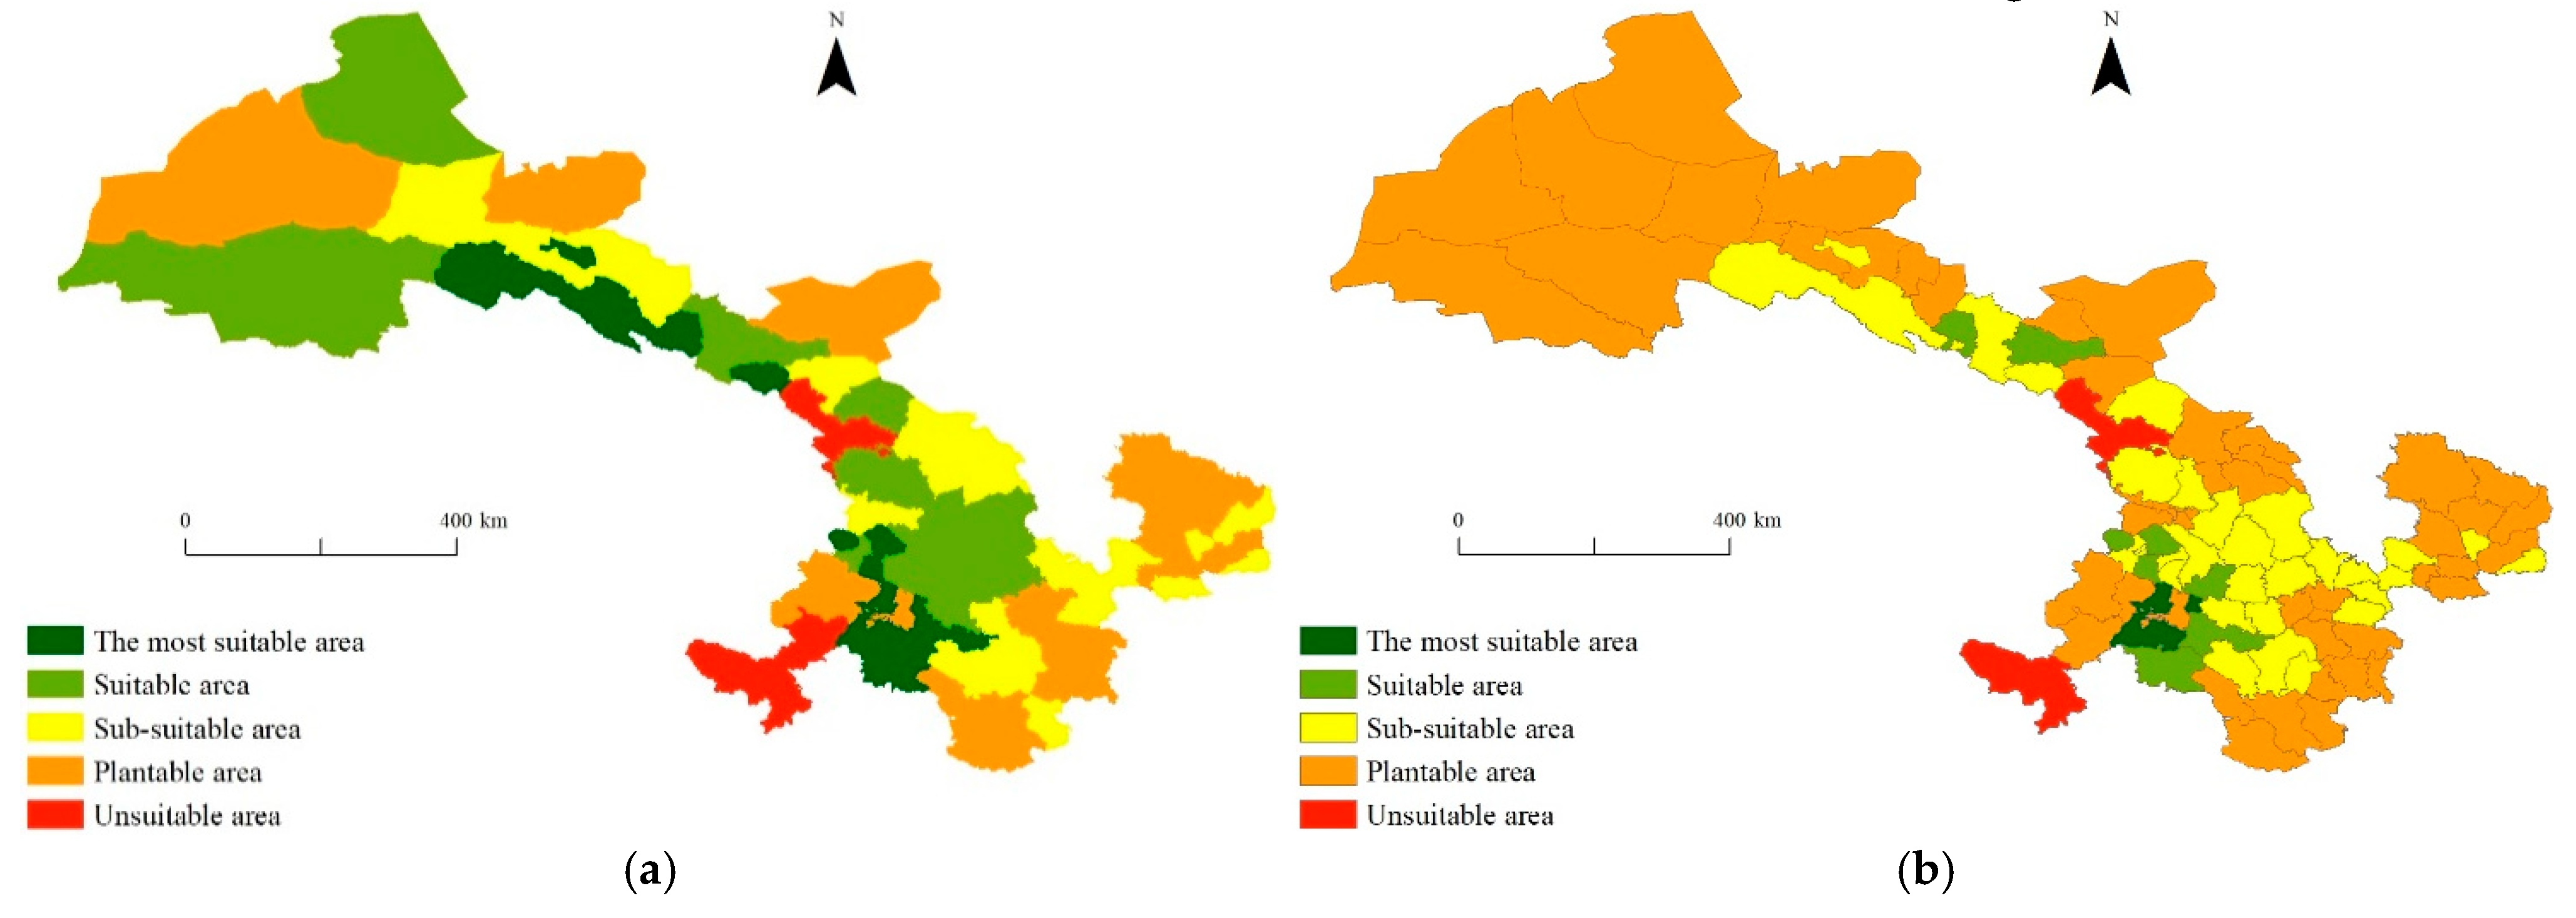
3.3. The Spatial Changes in Potato Planting Areas

According to the results of a comprehensive evaluation employing the semi-trapezoidal membership function as a tool, a fuzzy comprehensive evaluation was conducted on the zoning indicators of 87 meteorological stations, with the abrupt change year 1998 serving as the temporal reference point. This study aimed to investigate the disparities in ecologically and climatologically suitable potato planting regionalization before and after this abrupt change event. The regionalization outcomes for two distinct periods, namely from 1971 to 1998 and from 1999 to 2020, are illustrated in Figure 8.

3.3.1. The Spatial Changes in the Most Suitable Areas

The most suitable areas for potatoes exhibited a general trend of contraction. Before 1998, the most suitable planting areas for potato in Gansu Province were mainly distributed in Minle and Sunan in western Gansu, Minxian, Dongxiang, Hezheng, Jishishan and other areas in central Gansu, as well as in Diebu, Zhuoni and other areas in southeastern Gansu. The cultivated land area of the most suitable areas, at an altitude of 2163~2541 m, was 3.26 × 10⁵ hm2, accounting for 7.19% of the total cultivated land area in Gansu Province. After 1998, there was a noticeable reduction in the most suitable potato cultivation areas, manifested by the disappearance of the most suitable areas such as in Sunan in western Gansu and Dongxiang, Hezheng and Jishishan in central Gansu. Additionally, the southeast region of Gansu also experienced a decrease in the most suitable areas, resulting in a significant overall regional decline. After 1998, the cultivated land area of the most suitable potato region decreased to 2.64 × 10⁴ hm2, representing a decline of 6.61 percentage points. The most suitable area has a warm and cool climate, suitable heat and no high-temperature weather during the tuber expansion period. It facilitates nutrient accumulation, rapid tuber growth, ample precipitation, resulting in high yield and superior-quality potatoes. Therefore, it is considered the ideal area for potato cultivation promotion.
The findings indicated that July was the period for tuber formation and expansion, with potato starch content primarily influenced by the daily temperature difference during this stage. Moreover, there was a negative correlation between the July temperature and yield. In comparison with 1971–1998, the average temperature in July from 1999 to 2020 exhibited two distinct characteristics: firstly, the temperature threshold shifted toward higher-altitude regions; secondly, there was a significant increase in the area experiencing high temperatures above 22 °C (Figure 6). High-altitude areas displayed favorable conditions, with a suitable average temperature in July and a warm–cool climate conducive to dry matter accumulation.

3.3.2. The Spatial Changes in the Suitable Areas

The suitable areas for potato also exhibited a declining trend. Before 1998, the suitable planting areas for potato in Gansu Province were mainly distributed in Gulang, Shandan, Akesai, Subei and Yongchang in western Gansu and in Anding, Gaolan, Guanghe, Huining, Kangle, Lintao, Linxia, Longxi, Tongwei, Yongdeng, Yuzhong, Zhangxian, Weiyuan and other areas in central Gansu. The cultivated land area of the suitable areas, at an altitude of 1669~2138 m, was 1.41 × 10⁶ hm2, accounting for 31.12% of the total cultivated land area in Gansu Province. After 1998, the suitable area for potato tended to shrink, which was manifested by the disappearance of all the original suitable areas except for Yongchang in western Gansu and Weiyuan in central Gansu and the transformation of Minle in western Gansu and Diebu in southeastern Gansu, while Dongxiang, Hezheng, Jishishan and Minxian in central Gansu changed from being the most suitable areas to suitable areas. Consequently, there was a significant decrease in the overall cultivated land. After 1998, the cultivated land area of the suitable potato region decreased to 4.53 × 10⁵ hm2, representing a decline of 21.13 percentage points.
The analysis showed that June and July are the branching and flowering periods for potato, which are the key periods of water demand, especially in the semi-arid Longzhong region, where the yield increases by 30~60 kg·hm−2 for every 1 mm increase in precipitation. After 1998, the precipitation in June and July in the study area decreased (Figure 5) and was mainly distributed in southeastern, central and western Gansu, which was not conducive to high yields of potato.

3.3.3. The Spatial Changes in the Sub-Suitable Areas

The sub-suitable areas showed an expanding trend. Before 1998, the sub-suitable areas for potato in Gansu Province were mainly distributed in Tanchang, Lixian, Xihe, Kangxian, Qingshui, Wushan and Zhangjiachuan in southeastern Gansu, Huating, Jingning, Kongtong, Xifeng, Zhengning, Zhuanglang, Heshui and Lingtai in eastern Gansu, Baiyin, Lanzhou, Jingtai and Jingyuan in central Gansu and Ganzhou, Gaotai, Jiayuguan, Liangzhou, Linze, Suzhou and Yumen in western Gansu. The cultivated land area of the sub-suitable areas, at an altitude of 966~1754 m, was 1.45 × 10⁶ hm2, accounting for 32.00% of the total cultivated land area in Gansu Province. The precipitation and light in this region were sufficient to meet the growing demand of potato cultivation; however, the high temperature adversely affected the tuber yield. After 1998, the potato sub-suitable areas tended to expand, mainly because the suitable area of Longzhong was developed into a sub-suitable area, resulting in a rise in the cultivated land area to 1.92 × 10⁶ hm2, representing an increase of 10.32 percentage points.

3.3.4. The Spatial Changes in the Plantable Areas

The plantable areas also exhibited an expanding trend. Before 1998, the plantable areas for potato in Gansu Province were mainly distributed in Chengxian, Gangu, Hezuo, Huixian, Liangdang, Lintan, Maiji, Qinan, Qinzhou, Wenxian, Wudu, Xiahe and Zhouqu in southeastern Gansu, Chongxin, Huachi, Huanxian, Jingchuan, Ningxian, Qingcheng and Zhenyuan in eastern Gansu and Dunhuang, Guazhou, Jinta and Minqin in western Gansu. The cultivated land area of the sub-suitable areas was 1.29 × 10⁶ hm2, accounting for 28.40% of the total cultivated land area in Gansu Province. In the later stage of growth in southeastern Gansu, it was mostly cloudy with less sunlight and more precipitation, which affected the content and yield of potato. The high temperature in western Gansu directly affected tuber enlargement, resulting in smaller tubers and lower yields. After 1998, the potato plantable areas tended to expand, mainly because most of the sub-suitable areas of Ganzhou, Gaotai, Jiayuguan, Liangzhou, Linze, Jiuquan and Yumen in western Gansu were developed into plantable areas, resulting in a rise in the cultivated land area to 2.08 × 10⁶ hm2, representing an increase of 17.48 percentage points.

3.3.5. The Spatial Changes in the Unsuitable Areas

The unsuitable areas were gradually narrowed. From 1971 to 1998, the unsuitable areas were primarily concentrated in Maqu and Luqu within the Gannan Plateau, with an elevation exceeding 2900 m, as well as in Tianzhu in the eastern Qilian Mountains. The cultivated land area covered 5.86 × 10⁴ hm2, accounting for 1.30% of the total cultivated land area in Gansu Province. The high altitude and low temperature in this region rendered it inhospitable for potato planting. However, due to climate warming, the high-altitude regions had progressively transformed from being unsuitable to becoming plantable; consequently, after 1998, the unsuitable areas diminished, and the cultivated land area decreased to 5.56 × 10⁴ hm2—a decline of only 0.07 percentage points.

4. Discussion

Gansu Province is very sensitive to global warming. During the study period, the amount of precipitation from June to July fluctuated; however, there was a slight increasing trend with an overall rate of 1.81 mm/10 a. The average temperature in July showed a general warming trend at a rate of 0.55 °C/10 a, and the regional warming rate was significantly higher than the national and global levels. This would result in a positive impact on potato production at higher latitudes in the absence of improvements in cultivars, cultivation and management [9]. Moreover, the accumulated temperature above 10 °C showed a significant warming trend at a rate of 161.96 °C/10 a, especially after entering the 21st century, and is continuing to rise. Due to the extensive distribution of farmland, grassland and forest land in Gansu, the surface heat capacity of this region is significantly lower compared with that of other regions. Consequently, this promotes enhanced surface heating within Gansu and leads to an accelerated rate of temperature increase [24]. The warming and humidification in Gansu are associated with the ecological project of land restoration to forest and grassland, which was initiated in 2000. The temperature changes are also influenced by human activities and large-scale circulation patterns [25,26]. Through their combined impact, phenomena such as soil erosion and grassland degradation have emerged, altering the underlying surface conditions to a certain extent and further accelerating regional warming. From the perspective of spatial distribution, the regional characteristics of climate change in Gansu Province were evident. The spatial distribution of precipitation from June to July in Gansu Province exhibited distinct regional variations (Figure 5a) characterized by a gradual decrease in precipitation from south to north and from east to west. Additionally, the spatial change in the precipitation tendency rate during this period showed a gradual decrease from north to south and from east to west. The average temperature in July showed a decreasing spatial pattern from northeast to southwest. Furthermore, the trend rate for the average temperature in July exhibited a decreasing trend from west to east and from north to south. The spatial variation in the accumulated temperature above 10 °C in the study area showed a spatial pattern of higher accumulated temperatures in the northwest and southeast regions and lower accumulated temperatures in other regions, while the trend rate for the accumulated temperature above 10 °C displayed a decreasing trend from west to east and from north to south. Differences in the underlying surface, distribution of population, landforms and geomorphology have a significant impact on the energy and material balance as well as on the atmospheric circulation in various regions. As a result, there are distinct regional disparities in the spatial and temporal distribution of air temperatures.
Under the premise of a slight increase in precipitation and climate warming, this study utilized the maximum membership degree fuzzy evaluation method to categorize potato planting regions in Gansu province into five grades: the most suitable areas, the suitable areas, the sub-suitable areas, the plantable areas and the unsuitable areas. By taking 1998 as the pivotal year, when there was an abrupt change in the precipitation from June to July and in the average temperature in July, this study investigated the disparity in ecological climate suitability for potato planting before and after the abrupt change. The growth of potato is favored by cool humid climates, while they are not resistant to high temperature. The tuber expansion period is susceptible to high temperatures, so as the temperature rises, this results in smaller tubers and lower yield [27,28]. Consequently, the suitable climate area for potato planting is shrinking. Zhao et al. [17] found that climate change was most negative to potato cultivation in northwest China, where the middle suitable areas had receded. For farmers and advisors, it is critically important to understand these changes in order to develop short-term and long-term adaptation strategies with limited resources [29]. The division results in this article are basically consistent with the actual planting zoning of potato in Gansu Province. The increase in heat conditions in climate-suitable areas has led to a reduction in the planting range of potato [10,30]; similar phenomena also exist in similar regions around the world. Each climate region should fully leverage the advantages of ecological climate resources, scientifically and reasonably adjust crop planting patterns, and propose characteristic crops suitable for planting in this climate region. The increasing climate warming in western Gansu has a negative effect on potato, and the most suitable and suitable growing areas of the potato along the inland river of western Gansu have been reduced. Therefore, it is advisable to stabilize the potato planting area while increasing the cultivation area for corn, appropriately decrease the spring wheat area, and expand the acreage dedicated to cash crops in western Gansu. The Loess Plateau region in central Gansu is a typical rainfed agricultural area and the main area suitable for potato planting. It is necessary to develop the potato planting area and to stabilize the winter wheat planting area. The mountainous region of Longnan falls within the semi-humid to humid climatic zone, predominantly supporting rainfed agriculture. It is recommended to expand the cultivation ratio of potato and corn, stabilize the planting proportion of winter wheat, and broaden the cultivation area for specialty crops such as olives, oranges, chestnuts, Sichuan pepper and tea. The Gannan region should attach equal importance to agriculture, forestry and animal husbandry, actively develop local characteristic crops, establish a forage base and develop animal husbandry.

5. Conclusions

Through rigorous analysis, this paper arrives at the following conclusions:
(1)
During the study period, the amount of precipitation from June to July fluctuated; however, there was a slight increasing trend with an overall rate of 1.81 mm/10 a. The average temperature in July showed a general warming trend at a rate of 0.55 °C/10 a. Moreover, the accumulated temperature above 10 °C showed a significant warming trend at a rate of 161.96 °C/10 a. The abrupt change in precipitation from June to July and in the average temperature for July occurred in 1998. However, no sudden alteration was observed for the accumulated temperature above 10 °C.
(2)
The spatial distribution of potato regionalization indexes has exhibited significant regional disparities in Gansu Province over the past 50 years. The spatial distribution of precipitation from June to July exhibited distinct regional variations, characterized by a gradual decrease from south to north and from east to west. Additionally, the spatial change in the precipitation tendency rate during this period showed a gradual decrease from north to south and from east to west. The average temperature in July showed a decreasing spatial pattern from northeast to southwest. Furthermore, the trend rate for the average temperature in July exhibited a decreasing trend from west to east and from north to south. The accumulated temperature above 10 °C in the study area showed a spatial pattern of higher accumulated temperatures in the northwestern and southeastern regions and lower accumulated temperatures in other regions, while the trend rate for the accumulated temperature above 10 °C displayed a decreasing trend from west to east and from north to south.
(3)
The impact of climate change on potato planting in Gansu Province was primarily characterized by a reduction in the most suitable areas and suitable areas, an expansion of the sub-suitable areas and plantable areas, as well as a decrease in the unsuitable areas. Compared with before 1998, the arable land area for planting potato had increased by 2.96 × 10³ hm2, an increase of 0.065% in proportion, and the altitude of potato planting areas had moved up by 176.3 m. After 1998, the cultivated land area of the most suitable areas for potato decreased by 0.30 × 10⁶ hm2, while the suitable area experienced a reduction of 0.96 × 10⁶ hm2. Conversely, the sub-suitable area witnessed an increase of 0.47 × 10⁶ hm2, and the plantable area expanded by 0.79 × 10⁶ hm2. Moreover, there was a decrease in the unsuitable area of 0.30 × 10⁴ hm2. In the future, a more scientific and comprehensive potato planting plan should be formulated by considering the influence of climate resources, the economy and human factors on the zoning for potato planting. The results of the study will contribute to regional decision-making and the development of strategies for the rational utilization of climate resources, thereby promoting sustainable agricultural development as well as achieving high yields and quality potatoes in Gansu Province. Furthermore, comprehensive measures are proposed based on these findings to offer scientific insights into the agricultural production layout in arid areas worldwide.

Author Contributions

Conceptualization and methodology, Y.L. and J.H.; validation and data curation, G.L. and Q.L.; writing—original draft preparation, Y.L.; review L.D., Z.Y., J.H. and Z.N.; funding acquisition, J.H., Z.Y. and G.L. All authors have read and agreed to the published version of the manuscript.

Funding

This research was funded by National Natural Science Foundation of China (32360438, 32160416) and the top leading talents project in Gansu Province (GSBJLJ-2023-09).

Data Availability Statement

The raw data supporting the conclusions of this article will be made available by the authors on request.

Conflicts of Interest

The authors declare no conflicts of interest.

References

  1. Wu, X.S.; Wang, Z.L.; Zhou, X.W.; Lai, C.G.; Lin, W.X.; Chen, X.H. Observed changes in precipitation extremes across 11 basins in China during 1961–2013. Int. J. Climatol. 2016, 36, 2866–2885. [Google Scholar] [CrossRef]
  2. Ma, Z.H.; Wang, Y.B.; Zhang, Z.Y. Climatic characteristics of precipitation change and its multiscale causes over Central Qinghai-Tibet Plateau. Int. J. Climatol. 2023, 43, 7966–7986. [Google Scholar] [CrossRef]
  3. Zhou, W.M.; Liu, Y.J.; Ata-Ul-Karim, S.T.; Ge, Q.S. Spatial difference of climate change effects on wheat protein concentration in China. Environ. Res. Lett. 2021, 16, 124011. [Google Scholar] [CrossRef]
  4. Yang, X.J.; Sun, J.Y.; Gao, J.L.; Qiao, S.S.; Zhang, B.L.; Bao, H.Z.; Feng, X.W.; Wang, S.Y. Effects of Climate Change on Cultivation Patterns and Climate Suitability of Spring Maize in Inner Mongolia. Sustainability 2021, 13, 8072. [Google Scholar] [CrossRef]
  5. Bak, G.R.; Lee, K.K.; Clark, I.M.; Mauchline, T.H.; Kavamura, V.N.; Lund, G.; Jee, S.; Lee, J.T.; Kim, H.; Lee, Y.H. The potato rhizosphere microbiota correlated to the yield of three different regions in Korea. Sci. Rep. 2024, 14, 4536. [Google Scholar] [CrossRef]
  6. Huang, N.; Wang, J.; Song, Y.; Pan, Y.Y.; Han, G.L.; Zhang, Z.Y.; Ma, S.Q.; Sun, G.F.; Liu, C.; Pan, Z.H. The adaptation mechanism based on an integrated vulnerability assessment of potato production to climate change in Inner Mongolia, China. Mitig. Adapt. Strateg. Glob. Chang. 2022, 27, 24. [Google Scholar] [CrossRef]
  7. Wang, C.L. Impacts of Climate Change on Potato Production in the Northwest Semi-Arid Region. Ph.D. Thesis, Nanjing University of Information Science & Technology, Nanjing, China, 2015. (In Chinese). [Google Scholar]
  8. Xie, K.Y.; Wang, X.X.; Zhang, R.F.; Gong, X.F.; Zhang, S.B.; Mares, V. Partial root-zone drying irrigation and water utilization efficiency by the potato crop in semi-arid regions in China. Sci. Hortic. 2012, 134, 20–25. [Google Scholar] [CrossRef]
  9. Xiao, G.J.; Zheng, F.J.; Qiu, Z.J.; Yao, Y.B. Impact of climate change on water use efficiency by wheat, potato and corn in semiarid areas of China. Agric. Ecosyst. Environ. 2013, 181, 108–114. [Google Scholar] [CrossRef]
  10. Zhao, J.F.; Zhang, Y.H.; Qian, Y.L.; Pan, Z.H.; Zhu, Y.J.; Zhang, Y. Coincidence of variation in potato yield and climate in northern China. Sci. Total Environ. 2016, 573, 965–973. [Google Scholar] [CrossRef]
  11. He, Y.B.; Zhou, Y.F.; Cai, W.M.; Wang, Z.Z.; Duan, D.D.; Luo, S.J. Using a process-oriented methodology to precisely evaluate temperature suitability for potato growth in China using GIS. J. Integr. Agric. 2017, 16, 1520–1529. [Google Scholar] [CrossRef]
  12. Wang, H.L.; Zhang, Q.; Wang, R.Y.; Lv, X.D.; Wang, L.; Zhang, L.; Qi, Y. Effects of climate change on agro climatic resources and potential primary cropping patterns in Gansu Province. Acta Ecol. Sin. 2017, 37, 6099–6110. (In Chinese) [Google Scholar]
  13. Hong, W.X.; Zheng, N.N.; Xiong, Z.A.; Hu, Z.Q. A Parallel Deep Neural Network Using Reviews and Item Metadata for Cross-Domain Recommendation. IEEE Access 2020, 8, 41774–41783. [Google Scholar] [CrossRef]
  14. Zhou, Y.S.; Tong, X.X.; Gan, R.; Liu, P.F.; Guo, L.; Zhao, S.S. Distribution characteristics and influencing factors of water resources in Henan Province. Hydrol. Res. 2023, 54, 508–522. [Google Scholar] [CrossRef]
  15. Zhang, H.D.; Wei, W.; Xue, S. Analysis on the variation of temperature and precipitation in Dingxi based on R/S and Mann-Kendall Test. Res. Soil Water Conserv. 2015, 22, 183–189. [Google Scholar]
  16. Liu, H.; Wang, S.H.; Qiao, L.P. Cloud Model Membership Degree of Rock Slope Stability Evaluation: Method and a Case Study. Pol. J. Environ. Stud. 2022, 31, 3181–3193. [Google Scholar] [CrossRef] [PubMed]
  17. Zhao, J.F.; Zhan, X.; Jiang, Y.Q.; Xu, J.W. Variations in climatic suitability and planting regionalization for potato in northern China under climate change. PLoS ONE 2018, 13, e0203538. [Google Scholar] [CrossRef]
  18. Wei, T.Y.; Cherry, T.L.; GlomrØd, S.; Zhang, T.Y. Climate change impacts on crop yield: Evidence from China. Sci. Total Environ. 2014, 499, 133–140. [Google Scholar] [CrossRef]
  19. Liu, L.L.; Zhang, X.Y.; Donnelly, A.; Liu, X.J. Interannual variations in spring phenology and their response to climate change across the Tibetan Plateau from 1982 to 2013. Int. J. Biometeorol. 2016, 60, 1563–1575. [Google Scholar] [CrossRef]
  20. Chen, X.W.; Niu, J.Z. Evaluating the Adaptation of Chinese Torreya Plantations to Climate Change. Atmosphere 2020, 11, 176. [Google Scholar] [CrossRef]
  21. Huang, X.; Ma, L.; Liu, T.X.; Sun, B.L.; Chen, Y.; Qiao, Z.X.; Liang, L.T. Response relationship between the abrupt temperature change-climate warming hiatus and changes in influencing factors in China. Int. J. Climatol. 2021, 41, 5178–5200. [Google Scholar] [CrossRef]
  22. Akiyama, T.; Kawamura, K. Grassland degradation in China: Methods of monitoring, management and restoration. Grassl. Sci. 2007, 53, 1–17. [Google Scholar] [CrossRef]
  23. Committee for the preparation of the Second National Assessment Report on Climate Change. In The Second National Assessment Report on Climate Change; Science Press: Beijing, China, 2011. (In Chinese)
  24. Huang, D.; Wang, K.; Wu, W. Problems and strategies for sustainable development of farming and animal husbandry in the agro-pastoral transition zone in Northern China (APTZNC). Int. J. Sustain. Dev. World Ecol. 2007, 14, 391–399. [Google Scholar] [CrossRef]
  25. Zeng, W.J.; Chen, J.B.; Liu, H.Y. Soil respiration and its autotrophic and heterotrophic components in response to nitrogen addition among different degraded temperate grasslands. Soil Biol. Biochem. 2018, 124, 255–265. [Google Scholar] [CrossRef]
  26. Tian, Q.; Yang, S.L. Regional climatic response to global warming: Trends in temperature and precipitation in the Yellow, Yangtze and Pearl River basins since the 1950s. Quat. Int. 2017, 440, 1–11. [Google Scholar] [CrossRef]
  27. Daccache, A.; Weatherhead, E.K.; Stalham, M.A.; Knox, J.W. Impacts of climate change on irrigated potato production in a humid climate. Agric. For. Meteorol. 2011, 151, 1641–1653. [Google Scholar] [CrossRef]
  28. Hijmans, R.J. The effect of climate change on global potato production. Am. J. Potato Res. 2003, 80, 271–280. [Google Scholar] [CrossRef]
  29. HolzkaÈmper, A.; Calanca, P.; Fuhrer, J. Identifying climatic limitations to grain maize yield potentials using a suitability evaluation approach. Agric. For. Meteorol. 2013, 168, 149–159. [Google Scholar] [CrossRef]
  30. Tang, J.Z.; Wang, J.; Wang, E.L.; Yu, Q.; Yin, H.; He, D.; Pan, X.B. Identifying key meteorological factors to yield variation of potato and the optimal planting date in the agro-pastoral ecotone in North China. Agric. For. Meteorol. 2018, 256, 283–291. [Google Scholar] [CrossRef]
Figure 1. Spatial distribution of meteorological stations within the study area.
Agronomy 15 00257 g001
Figure 2. Change trend in the amount of precipitation from June to July and its M-K mutation test. (a) Change trend; (b) M-K mutation test.
Agronomy 15 00257 g002
Figure 3. Change trend in the average temperature in July and its M-K mutation test. (a) Change trend; (b) M-K mutation test.
Agronomy 15 00257 g003
Figure 4. Change trend of ≥10 °C accumulated temperature change and its M-K mutation test. (a) Change trend; (b) M-K mutation test.
Agronomy 15 00257 g004
Figure 5. Spatial distribution of precipitation from June to July. (a) Precipitation in June and July from 1971 to 1998; (b) Precipitation in June and July from 1999 to 2020; (c) Trend rate for the precipitation from June to July.
Agronomy 15 00257 g005
Figure 6. Spatial distribution of the average temperature in July. (a) Average temperature in July from 1971 to 1998; (b) Average temperature in July from 1999 to 2020; (c) Trend rate for the average temperature in July.
Agronomy 15 00257 g006
Figure 7. Spatial distribution of accumulated temperature above 10 °C. (a) Accumulated temperature above 10 °C from 1971 to 1998; (b) Accumulated temperature above 10 °C from 1999 to 2020; (c) Trend rate for the accumulated temperature above 10 °C.
Agronomy 15 00257 g007
Figure 8. Map of suitability for potato planting. (a) From 1971 to 1998; (b) From 1999 to 2020.
Agronomy 15 00257 g008
Table 1. Index for climatic regionalization of potato planting from 1971 to 2020.
IndexAltitude/mPrecipitation in June and July/mmAverage Temperature in July/°CAccumulated Temperature Above 10 °C/°C
The most suitable area2000~2600130~14014~161500~2200
The suitable area1700~200060~13016~182200~3000
The sub-suitable area1300~170040~6018~223000~3500
The plantable area2600~2900
<1300
140~180
20~40
12~14
>22
1000~1500
>3500
The unsuitable area>2900>180<12<1000
Disclaimer/Publisher’s Note: The statements, opinions and data contained in all publications are solely those of the individual author(s) and contributor(s) and not of MDPI and/or the editor(s). MDPI and/or the editor(s) disclaim responsibility for any injury to people or property resulting from any ideas, methods, instructions or products referred to in the content.

