Article

Orchard Variable-Rate Sprayer Using LiDAR-Based Canopy Volume Measurement

1
College of Intelligent Manufacturing, Anhui Science and Technology University, Chuzhou 233100, China
2
College of Mechanical and Electronic Engineering, Nanjing Forestry University, Nanjing 210037, China
*
Author to whom correspondence should be addressed.
Agronomy 2025, 15(12), 2709; https://doi.org/10.3390/agronomy15122709
Submission received: 30 October 2025 / Revised: 22 November 2025 / Accepted: 23 November 2025 / Published: 25 November 2025
(This article belongs to the Special Issue Advances in Precision Pesticide Spraying Technology and Equipment)

Abstract

This study developed and evaluated a LiDAR-based variable-rate orchard sprayer to address the inefficiency of traditional constant-rate application. The system dynamically adjusts pesticide output in real-time using a canopy volume calculation model and an adaptive delayed-spray mechanism, synchronized with LiDAR scans and travel speed. Experimental results demonstrated effective performance: the canopy volume estimation achieved a low overall error of 2.84%, enabling precise spray decision-making. The dosage control system showed an average error of 8.78%, and the adaptive system responded within 160 ms, distinguishing target gaps as small as 75 mm. Deposition tests confirmed uniform coverage within the canopy and minimal drift. The system proves to be a practical solution for significantly reducing pesticide use, operational costs, and environmental impact, marking a substantial advancement in precision orchard management.

1. Introduction

With the increasing global demand for food safety and environmental sustainability, modern agriculture is facing unprecedented challenges to enhance production efficiency while minimizing ecological impact. Plant protection, as a crucial measure to ensure orchard yield and fruit quality, plays a vital role in this process. However, traditional orchard sprayers typically operate with a constant application rate, disregarding the significant variations in canopy structure, density, and size among individual trees [1,2]. This “one-size-fits-all” approach often leads to substantial pesticide waste due to spray drift and runoff, resulting in environmental pollution, potential food safety hazards, and increased economic costs for growers [3].
To address these issues, Precision Agriculture technology offers a promising solution through variable-rate sprayers. The core concept is to sense crop variability and perform targeted operations accordingly [4]. For orchard spraying, this entails real-time detection of canopy characteristics to dynamically adjust spray output, achieving “spray-on-demand” [5]. The key to realizing this technology lies in the rapid and accurate acquisition of canopy structural parameters. Among these parameters, canopy volume is widely recognized as a comprehensive metric that reflects both canopy size and density, and is highly correlated with pesticide requirement [6,7].
Among various sensing technologies for canopy detection, LiDAR (Light Detection and Ranging) has proven to be particularly suited for variable-rate spraying [8,9,10]. By actively capturing high-resolution, three-dimensional point clouds of the canopy, LiDAR operates reliably under varying light conditions. This capability for real-time, precise canopy volume mapping enables the direct and accurate adjustment of spray output, forming the core of effective target-oriented application [11,12,13].
Substantial research has demonstrated the feasibility of LiDAR-based variable spraying [14]. Polo et al. conducted tests on apple tree canopies using a scanning LiDAR system mounted on a tractor and developed an algorithm for calculating canopy volume and leaf area that showed strong correlation with manual measurements [15]. Subsequently, numerous researchers have designed methods for measuring canopy characteristics based on laser sensors to guide spraying operations. For instance, Chen et al. employed a high-speed laser scanning sensor (LIDAR) to develop a variable-rate sprayer based on canopy volume [16]. This system adjusts the spray output of each nozzle in real time according to target presence and canopy features—such as height, width, and foliage density measured by LiDAR—to meet the specific needs of target trees. Osterman proposed a positioning algorithm for variable-geometry pneumatic-assisted orchard sprayer booms based on measurements from a laser scanner. This more targeted spraying approach shows potential for reducing pesticide drift and ground deposition [17]. Li Longlong et al. introduced a canopy segmentation model based on laser sensors and designed an automatic profiling sprayer capable of adjusting both air volume and pesticide application rate. Compared with conventional spraying methods, their system achieved pesticide savings of up to 45.7% [18,19]. While previous studies established the feasibility of LiDAR-based canopy volume measurement, key challenges persist in real-time point cloud processing for instantaneous spray decisions. Many current systems also lack an adaptive delayed-spray model that dynamically compensates for both system latency and vehicle speed to ensure accurate spray-to-target alignment. Furthermore, robust field operation requires better integration of multi-threaded software for seamless data acquisition, computation, and control.
In summary, LiDAR demonstrates significant advantages in obtaining characteristic information of fruit trees, contributing to effective reductions in pesticide usage, application time, labor input, and chemical fuel consumption. However, due to the large volume of point cloud data acquired by LiDAR and the need for rapid extraction of tree features in real-time variable-rate spraying, higher demands are placed on online data processing algorithms. In this study, a self-propelled multi-channel sprayer equipped with a LiDAR sensor and a real-time control system is developed. The main objectives are: (1) to propose an online canopy volume calculation method and an adaptive delayed-spray model for real-time target-oriented spraying; (2) to design a multi-threaded upper-computer control system and a PWM-based solenoid valve control strategy; and (3) to evaluate the system’s performance in terms of volume measurement accuracy, spray dosage control, real-time response, and deposition uniformity. The primary contribution of this work lies in the integration of a speed-adaptive delay compensation mechanism and a multi-threaded software architecture, enabling robust and precise variable-rate spraying under real orchard conditions.

2. Development Plan for the Sprayer

2.1. Test Equipment

The prototype used in this study was a GY-8 crawler-type orchard sprayer (as shown in Figure 1), manufactured by Nantong Guangyi Electromechanical Co., Ltd. (Nantong, China). It was equipped with a 50 L chemical tank and a centrifugal fan operating at 2500 rpm. An air flow splitter evenly distributed the generated airflow to eight air outlets on both sides of the sprayer. Each outlet was fitted with a five-finger spray header. Each header contained five air outlets, and each outlet was connected via a brass hollow bend pipe to a flat fan nozzle (TPC 80015, Dongguan Boyuan Spraying & Purification Equipment Co., Ltd., Guangzhou, China). The bend pipe was coupled with a solenoid valve (V025-08, Airtac Automation Industrial Co., Ltd., Ningbo, China). Under an operating pressure of 0.3 MPa, each nozzle delivered a flow rate of 0.59 L/min.

2.2. Canopy Volume Calculate Model

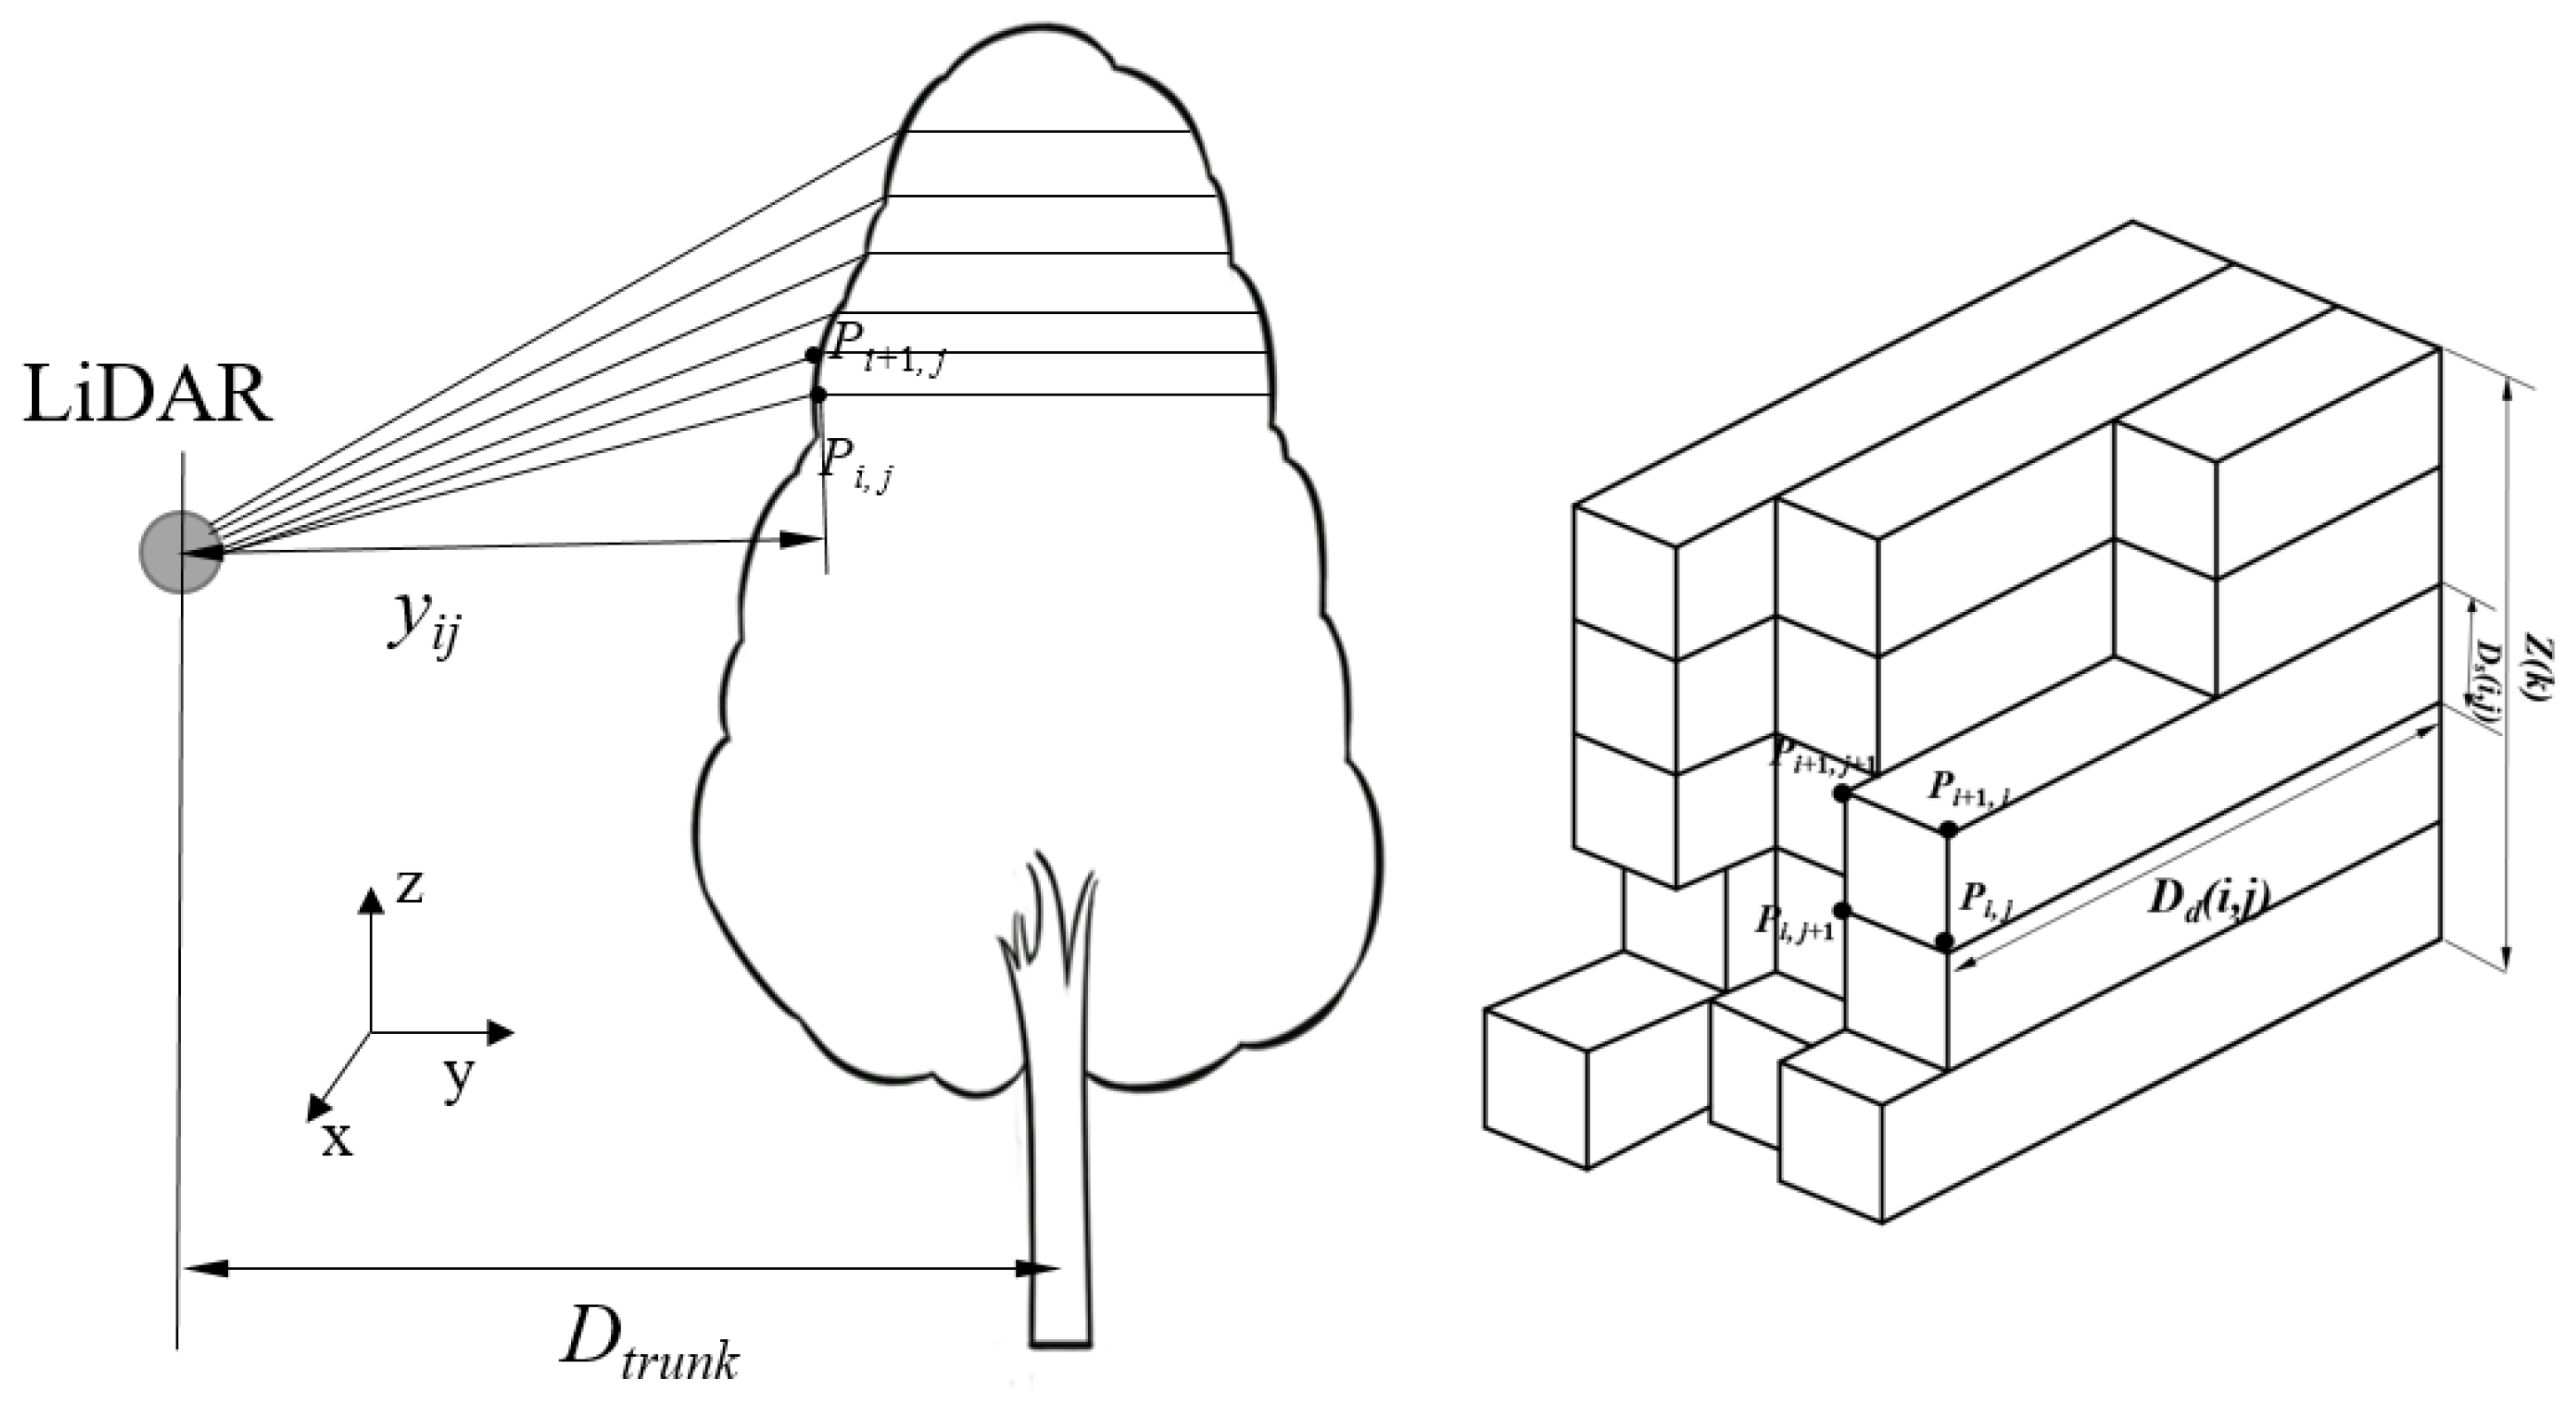
Variable-rate target-oriented spraying technology generates spray prescription maps based on the real-time volume of the tree canopy to adjust spray dosage. A LiDAR (UTM-30LX-EW, Hokuyo Automatic Co., Ltd., Osaka, Japan) is used to acquire point cloud data of trees. After coordinate transformation, trees are detected by setting a region of interest. The measurement principle is illustrated in Figure 2: the x-axis represents the direction of vehicle movement, the y-axis represents the measurement direction, and the z-axis is vertically upward. Every sampling period ∆t, the LiDAR completes one scan to obtain a frame of data, with the scanning plane parallel to the yz-plane. Point cloud coordinates are transformed from polar coordinates (ρij, θij) to planar Cartesian coordinates using Equation (1).
In this study, the LiDAR captures target data every 25 ms. When calculating the spray volume for the corresponding nozzle area, the canopy volume within that area accumulated over four consecutive frames is treated as one dataset. To calculate the spray volume for a specific nozzle, we first determine the canopy thickness Dd(i, j) in its spray zone. This is done by comparing the canopy contour to the trunk distance in the j-th frame, as defined in Equation (2). The distance in the Z-direction between two detection points in the j-th frame, Ds(i, j), is calculated using Equation (3).
Equation (4) defines the spray region, Z(k), for the k-th nozzle. It includes all points from the j-th frame scan where the average height between two consecutive scan points falls within the nozzle’s operating range. Based on this height-based segmentation, Equation (5) is then used to calculate the canopy volume for each nozzle’s specific spray area. As the sprayer moves forward, the 2D LiDAR continuously scans the canopy. This allows the system to fully compute the volume of one side of the canopy and precisely assign it to the corresponding nozzles V4│k.
y i j = ρ i j cos θ i j z i j = ρ i j sin θ i j ,
D d i , j = m a x D t r u n k y i , j , 0 ,
D s i , j = z i , j z i + 1 , j ,
zone = i | 1 2 D d i , j + D d i + 1 , j Z k ,
V 4 | k = v Δ t · j = 1 n zone 1 2 ( D d ( i , j ) + D d ( i + 1 , j ) ) D s ( i , j ) ,
where ρij is the distance measurement from the LiDAR for the i-th point in the j-th frame (m); θij is the vertical angle for the i-th point in the j-th frame (rad); yij, zij are the Cartesian coordinates in the measurement plane (y-axis) and height (z-axis), respectively; Dd(i, j) is the canopy thickness at position (i, j) (m); Dtrunk is the reference distance to the tree trunk (m); Ds(i, j) is the vertical distance between two consecutive laser points (m); Z(k) defines the vertical spray zone for the k-th nozzle; V4│k. is the calculated canopy volume for a single unit (m3).
While the LiDAR-based system performs robustly under most conditions, certain environmental factors may influence performance. Strong wind may cause canopy movement, leading to slight overestimation of volume. Direct sunlight or wet leaf surfaces may occasionally cause spurious LiDAR returns. The system’s performance in very dense canopies may be affected by signal attenuation. Future work will include environmental adaptability enhancements such as multi-sensor fusion and adaptive filtering.

2.3. Variable-Rate Spray Model

This study employs a canopy volume-based spray decision model to determine the spraying dosage according to the measured canopy volume. A spray rate of 0.1 L/m3 was adopted in the design, following the approach by Furness et al. [20]. Since the spray volume is proportional to the canopy volume in the corresponding nozzle’s spray zone, the system converts the canopy volume in each zone into a spray dosage value, as expressed in Equation (6). This spray volume is then translated into a PWM (Pulse-width modulation) duty cycle, which is sent to the lower computer. Based on the received PWM signal, the lower computer controls the solenoid valves to turn on or off, thereby regulating the spray output of the respective nozzles. In the spraying system, the solenoid valves govern the on/off operation of the nozzles. Therefore, the duty cycle of the PWM signal determines the flow rate of the corresponding nozzle. A linear relationship is assumed between the nozzle flow rate and the solenoid valve duty cycle, defined by Equation (7). By combining Equations (6) and (7), the relationship between the solenoid valve’s duty cycle and the canopy cross-sectional area within the corresponding nozzle’s spray zone can be derived, as presented in Equation (8).
Q k = V 4 | k ,
q k = a D C k + b ,
D Ck = V 4 | k b / a ,
In the equation, a represents the slope between the flow rate and the duty cycle, while b denotes the intercept. Both a and b are constants, determined by conducting a spray experiment in which a single solenoid valve controls a single nozzle. During the experiment, corresponding data points between the flow rate qk and the duty cycle (DCk) were collected, and the values of a and b were obtained through curve fitting. In this study, an AirTAC 2V025-06 solenoid valve was used, and the experimentally determined values were a = 0.343 and b = 0.72.

2.4. Hardware Design of the Spray System

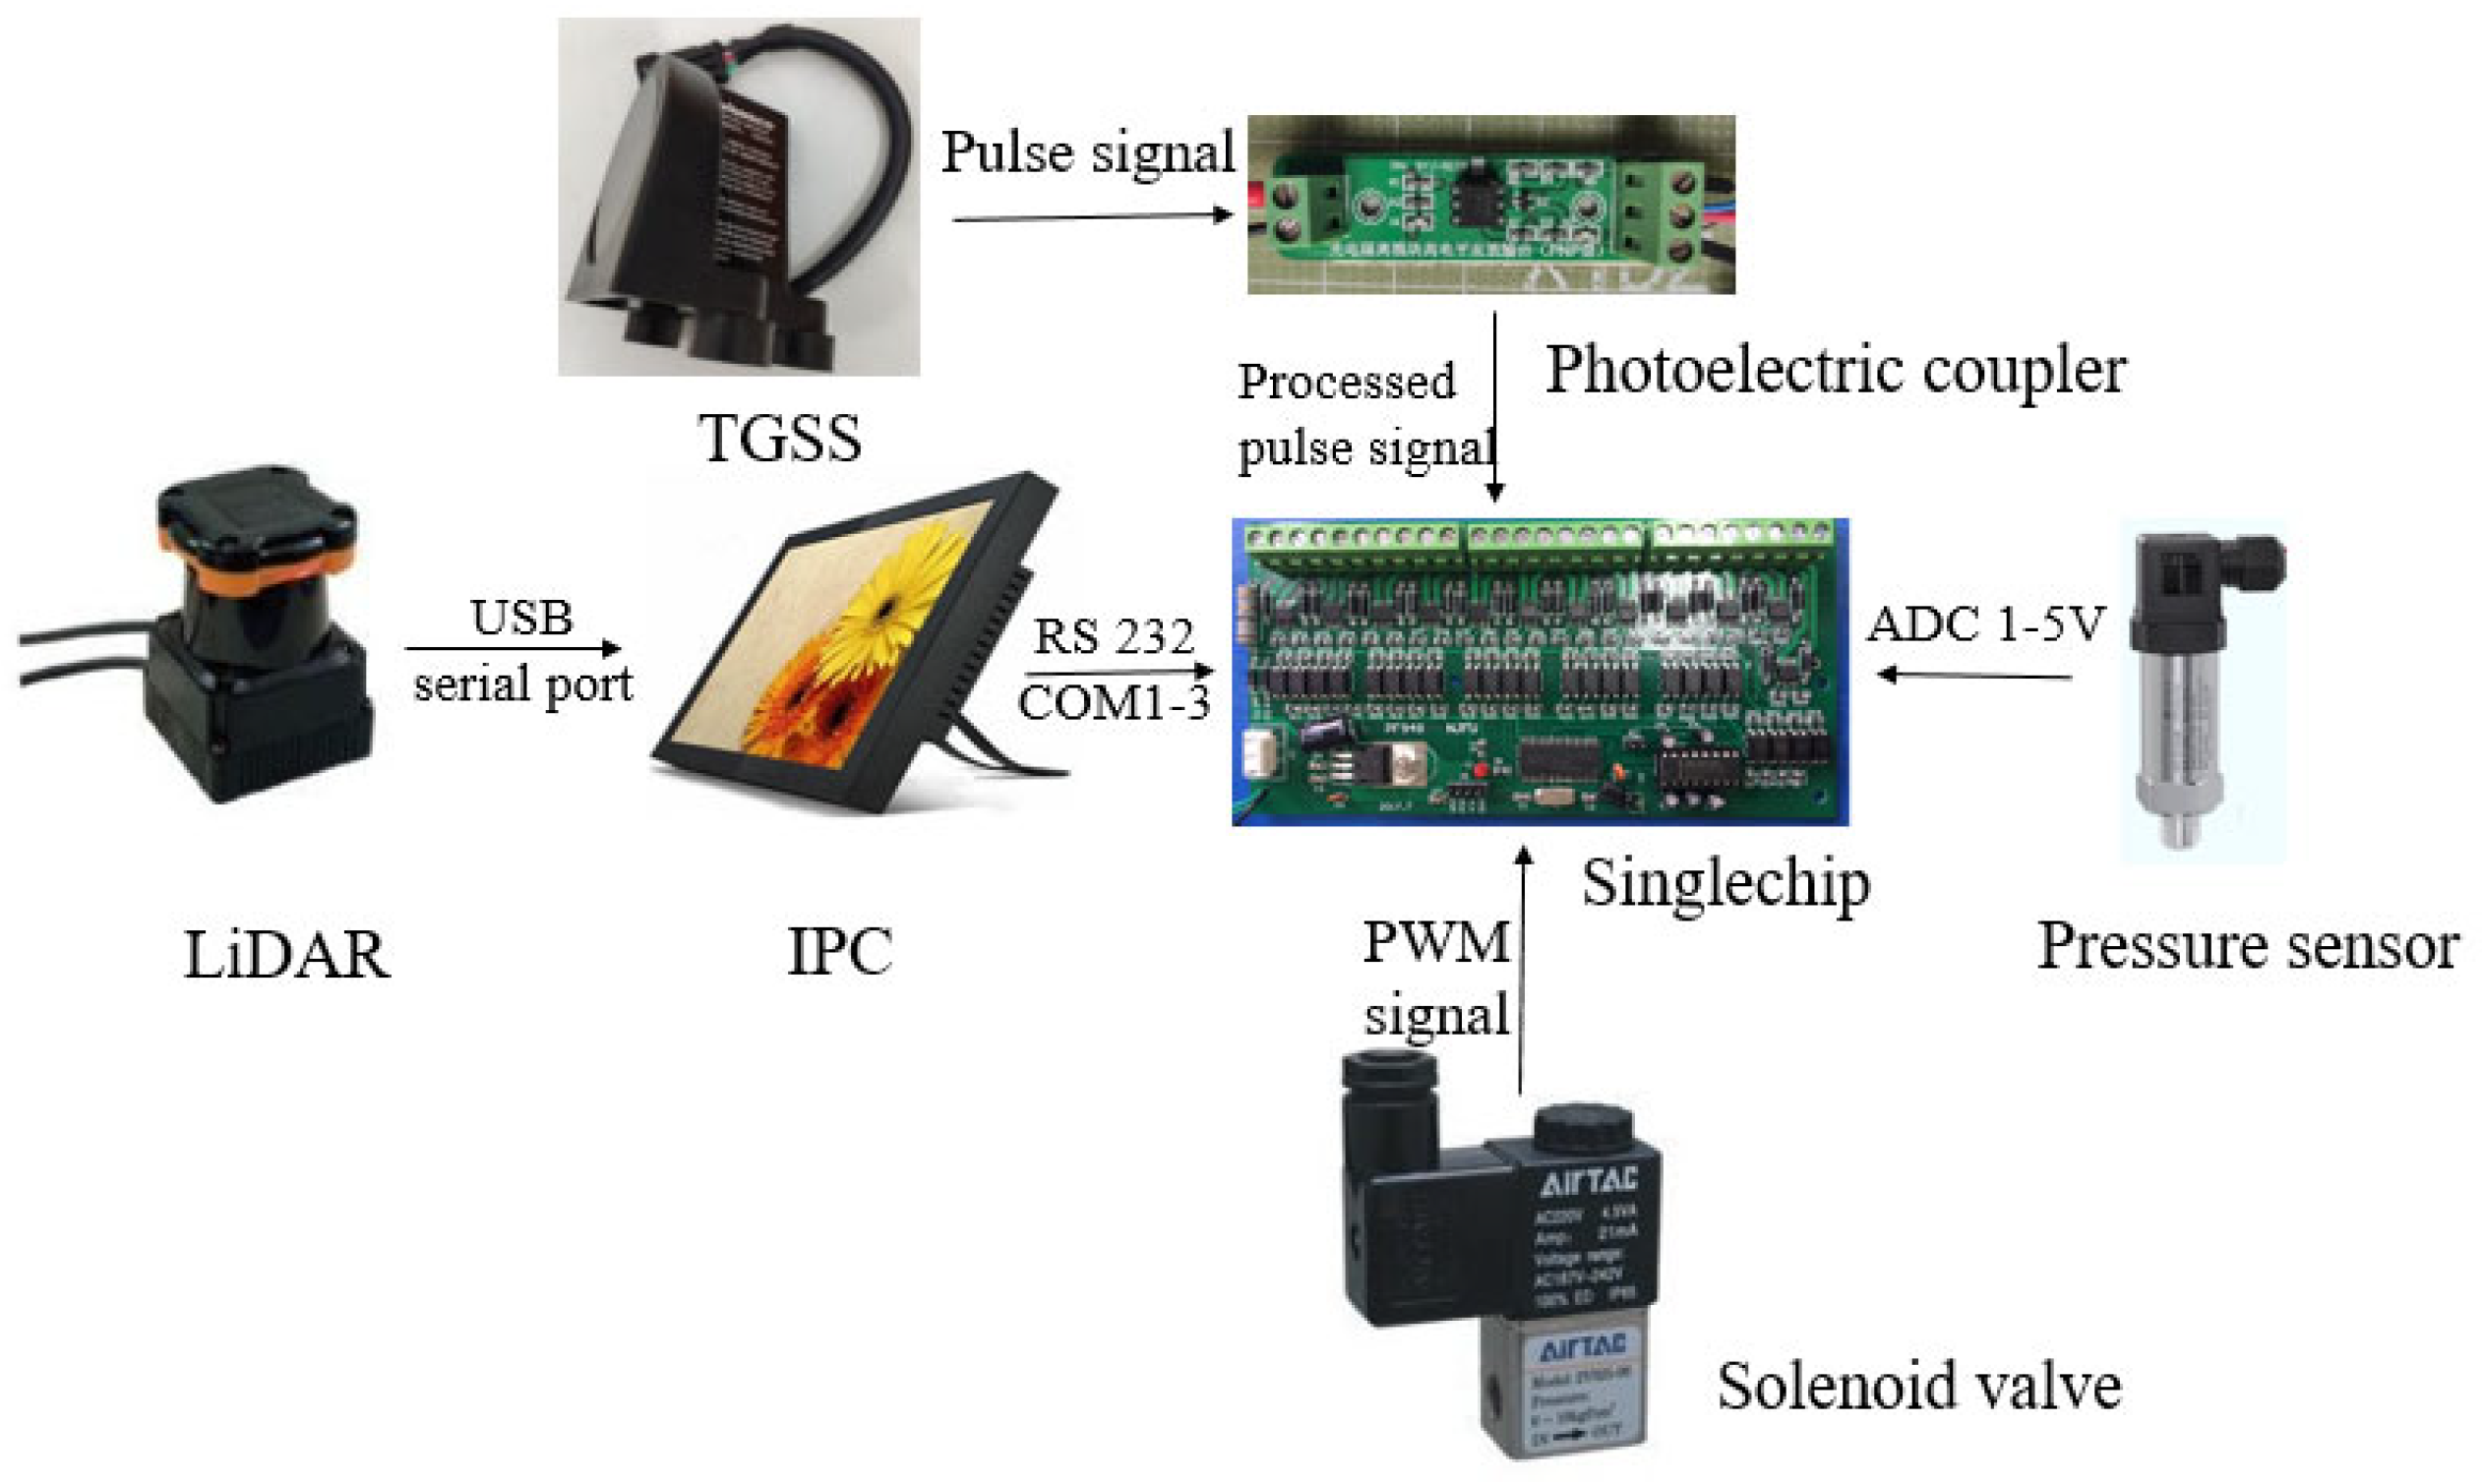
Figure 3 illustrates the configuration of the variable-rate spraying system, which comprises a LiDAR, a true ground speed sensor (TGSS), an optocoupler isolation module, a microcontroller, an industrial computer, solenoid valves, and a pressure sensor.
The lower computer uses an STC12C5604AD microcontroller (STC12C series) as the main control unit and communicates with the upper computer via RS232. To mitigate electrical interference between high-power and low-power circuits, the EL817 optocoupler (Everlight Electronics, Taiwan, China) was employed for signal isolation. The DC solenoid valves are driven by IRF7103 MOSFETs packaged in SO-8.
The industrial computer (IPC) is connected to the LiDAR, TGSS, and microcontroller through serial ports. COM1 and COM2 are configured to handle data updates: when a distance-based interrupt is triggered, the lower computer sends a request to the upper computer, which replies with processed canopy volume data derived from LiDAR and GNSS measurements via COM1 and COM2, respectively. COM3 is dedicated to unidirectional transmission of operational data from the lower computer to the IPC for logging and monitoring.
Timer TIM2 generates eight channels of pulse-width modulation (PWM) signals to control the solenoid valves via a digital I/O module and relays, enabling high-speed switching. Timer TIM3 captures pulse signals from the TGSS receiver to calculate the sprayer’s travel speed. An analog-to-digital converter (ADC) module acquires pressure readings from the pressure sensor in the spray circuit. The entire control system is powered by battery from the sprayer’s onboard electrical system.
Synchronization between LiDAR measurement and spray actuation is achieved through the adaptive delayed-spray model (Section 2.5). The control center continuously reads LiDAR data and calculates spray commands, which are stored in a FIFO buffer. A delay counter, indexed by the current travel speed (obtained from the speed sensor), retrieves the appropriate command from the buffer after a computed compensation time tcomp. This ensures that the spray command is executed precisely when the target reaches the nozzle position, achieving real-time target-oriented spraying.

2.5. Sprayer Control System Design

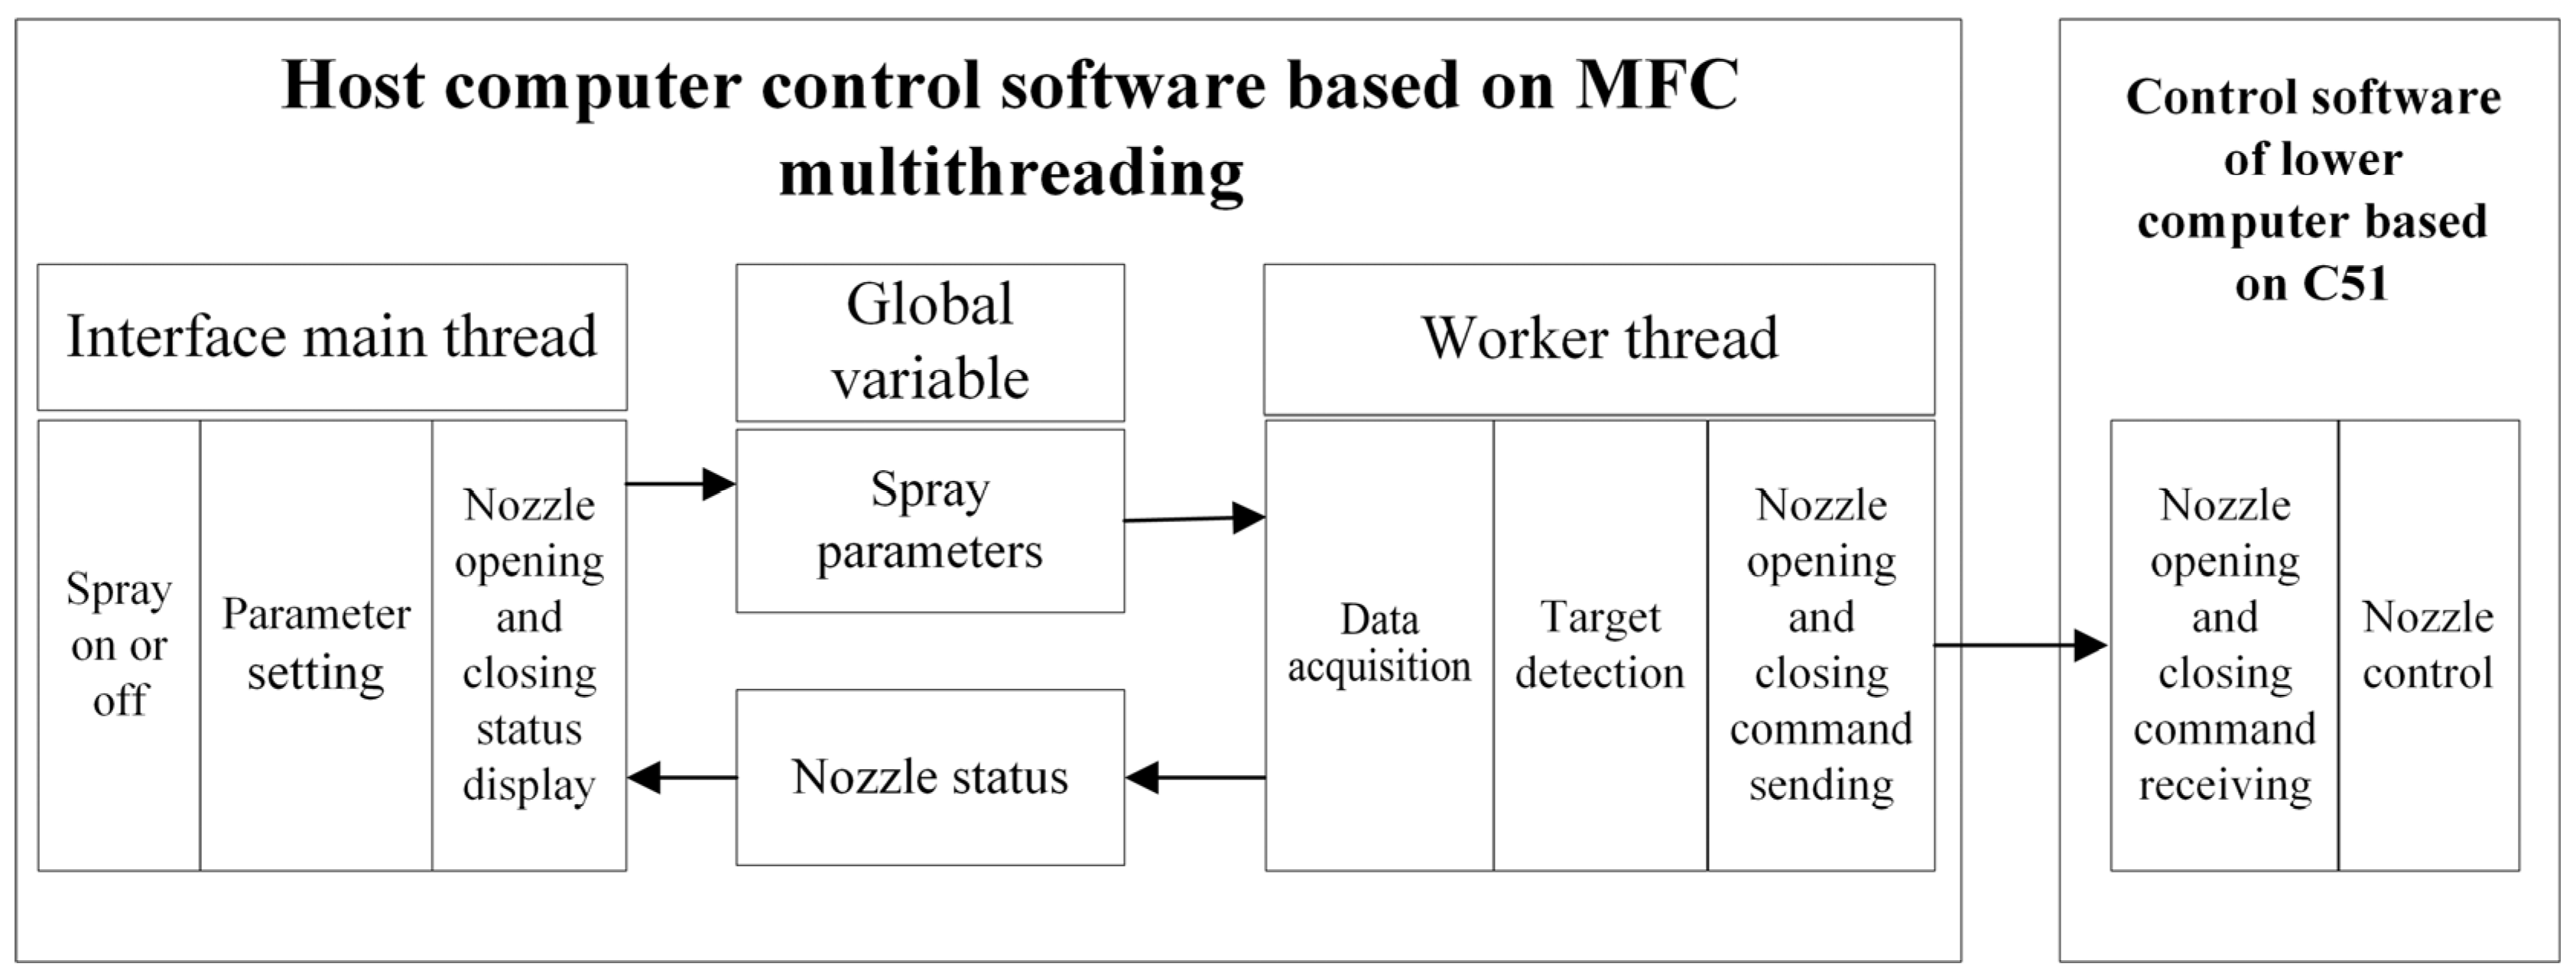
The upper-computer control software was developed using Microsoft Foundation Classes (MFCs) with a multi-threaded architecture, and its visual interface is shown in the accompanying figure. The main thread handles spray start/stop operations, parameter setting, nozzle status display, and system shutdown. A worker thread is responsible for acquiring data from the LiDAR, performing target detection and processing, and issuing nozzle on/off commands. Spray parameters and nozzle status are shared between the upper-computer threads via global variables.
For the lower computer, software was written in C51 and uses interrupt-driven routines to receive nozzle control commands and operate the corresponding solenoid valves. The overall architecture of the system software is depicted in Figure 4.
The variable-rate control system employs a centralized control and execution scheme. During operation, the laser sensor captures canopy information, and the ground speed sensor measures the sprayer’s travel velocity. These data are transmitted to the industrial computer, which processes them using a canopy segmentation model to calculate the volume of canopy units. Based on Equation (6), the required spray volume for each unit is determined and converted into the corresponding PWM duty cycle for the solenoid valves. A timer interrupt is set to retrieve the updated PWM duty cycle from the upper computer every 0.1 s, enabling precise and responsive valve control.

2.6. Adaptive Real-Time Target-Based Spray Control

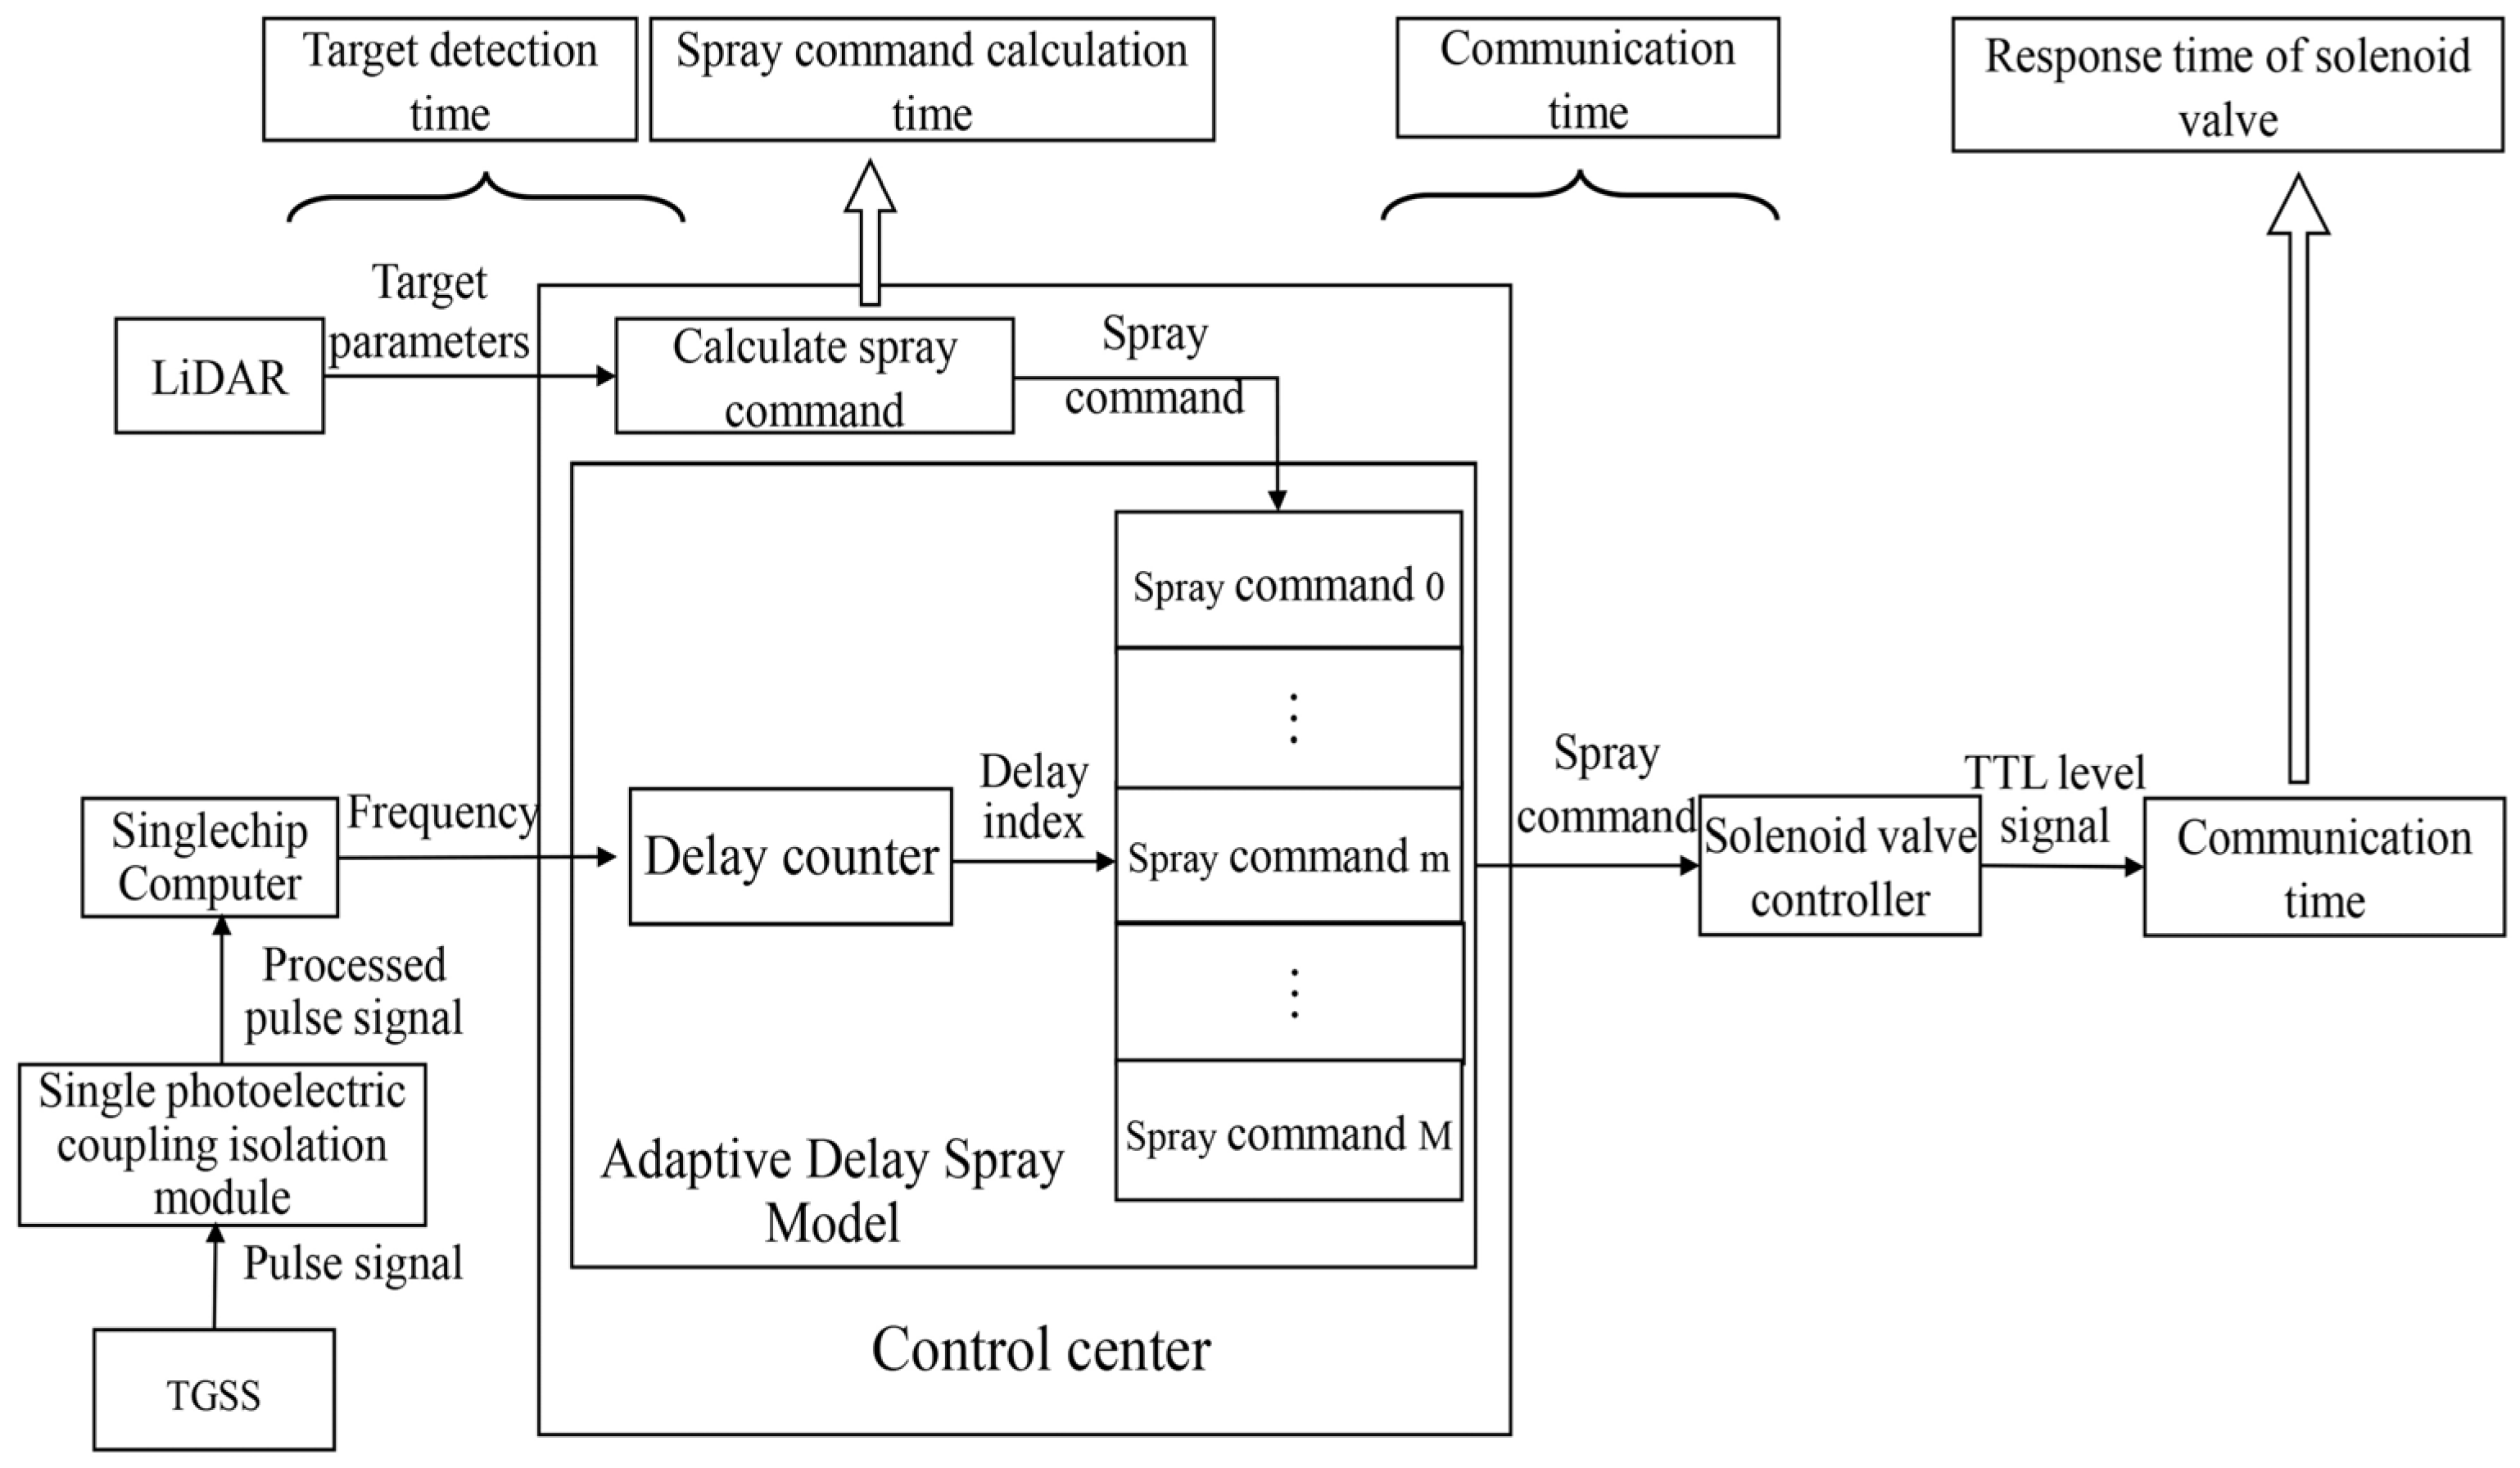
Figure 5 illustrates the schematic diagram of the automatic variable-rate target spray system. The control center reads the target point cloud data acquired by the LiDAR via USB, computes the corresponding spray commands, and stores them in an adaptive delayed-spray model. This model consists of two components: a delay counter and a delay memory. The computer calculates the real-time speed of the sprayer based on the frequency signal received from the microcontroller and then determines the delay index according to the current speed. The delay counter retrieves the corresponding spray command from the delay memory at the specified delay index, and the control center sends this command to the solenoid valve controller. The controller converts the command into a TTL (Transistor–Transistor Logic) level signal to open or close the solenoid valves, thereby achieving real-time target-oriented spraying.
To ensure precise alignment between spray output and target presence, the adaptive delayed-spray model incorporates a time compensation mechanism. The required compensation time is determined by the system response time, the horizontal distance between the LiDAR and the spray nozzles, and the current travel speed of the sprayer, as expressed in Equation (9):
t comp = L v t sys
where tcomp is the compensation time (s), tsys is the total system response time (s), L is the horizontal distance between the LiDAR and the nozzles (m), with Lvmax·tsys, and v is the current travel speed of the sprayer (m·s−1).
The delay memory is implemented using a FIFO (First-In-First-Out) buffer. Multiple buffers form a single delay memory unit, each capable of storing one set of spray commands. A command set is generated by the control center based on target information collected by the LiDAR over n scanning cycles. To prevent loss of spray commands while avoiding memory overflow, the size of the delay memory is defined as the ratio of the maximum delay time (at minimum sprayer speed) to the time required to compute one set of spray commands:
M = L v min t s y s n Δ t
where ⌈ ⌉ denotes the ceiling function, M is the number of delay memory units, vmin is the minimum travel speed of the sprayer (m·s−1), and Δt is the LiDAR scanning period (s).
The total system response time tsys comprises four components: target detection time ttar, spray command computation time tcal, communication time tcom, and solenoid valve response time tvalve. To ensure sufficient valve response time, the target detection time must be no less than the valve response time. The solenoid valve used in the sprayer prototype has a rated frequency of 10 Hz, requiring a minimum detection time of ttar = 100 ms, equivalent to four LiDAR scanning cycles. The computation time tcal was measured using the clock function from the time.h library and found to be less than 1 ms and was therefore neglected. The communication time, denoted as tcom, refers to the duration required for the control center to transmit spray commands to the solenoid valve controller. In this system, communication between the control center and the solenoid valve controller is implemented via an asynchronous RS232 serial interface, with a single spray command comprising 24 bytes of data. Due to the number of solenoid valves exceeding the capacity of a single microcontroller board, two such boards are connected in parallel to receive data from the industrial computer and control the opening and closing of the valves. The control center transmits spray commands separately for the 20 nozzles on the left and right sides, resulting in a total data length of 48 bytes per transmission. With a serial port baud rate of 9600 bit/s, the resulting communication time is tcom = 40 ms.
In summary, the total system response time is tsys = 160 ms. Given an actual horizontal distance of L = 1.5 m between the LiDAR and the nozzles and a minimum travel speed of vmin = 0.35 m·s−1, the number of delay memory units is determined from Equation (10) as M = 42.

3. Materials and Methods

3.1. Spray Volume Calculation and Dosage Experiment

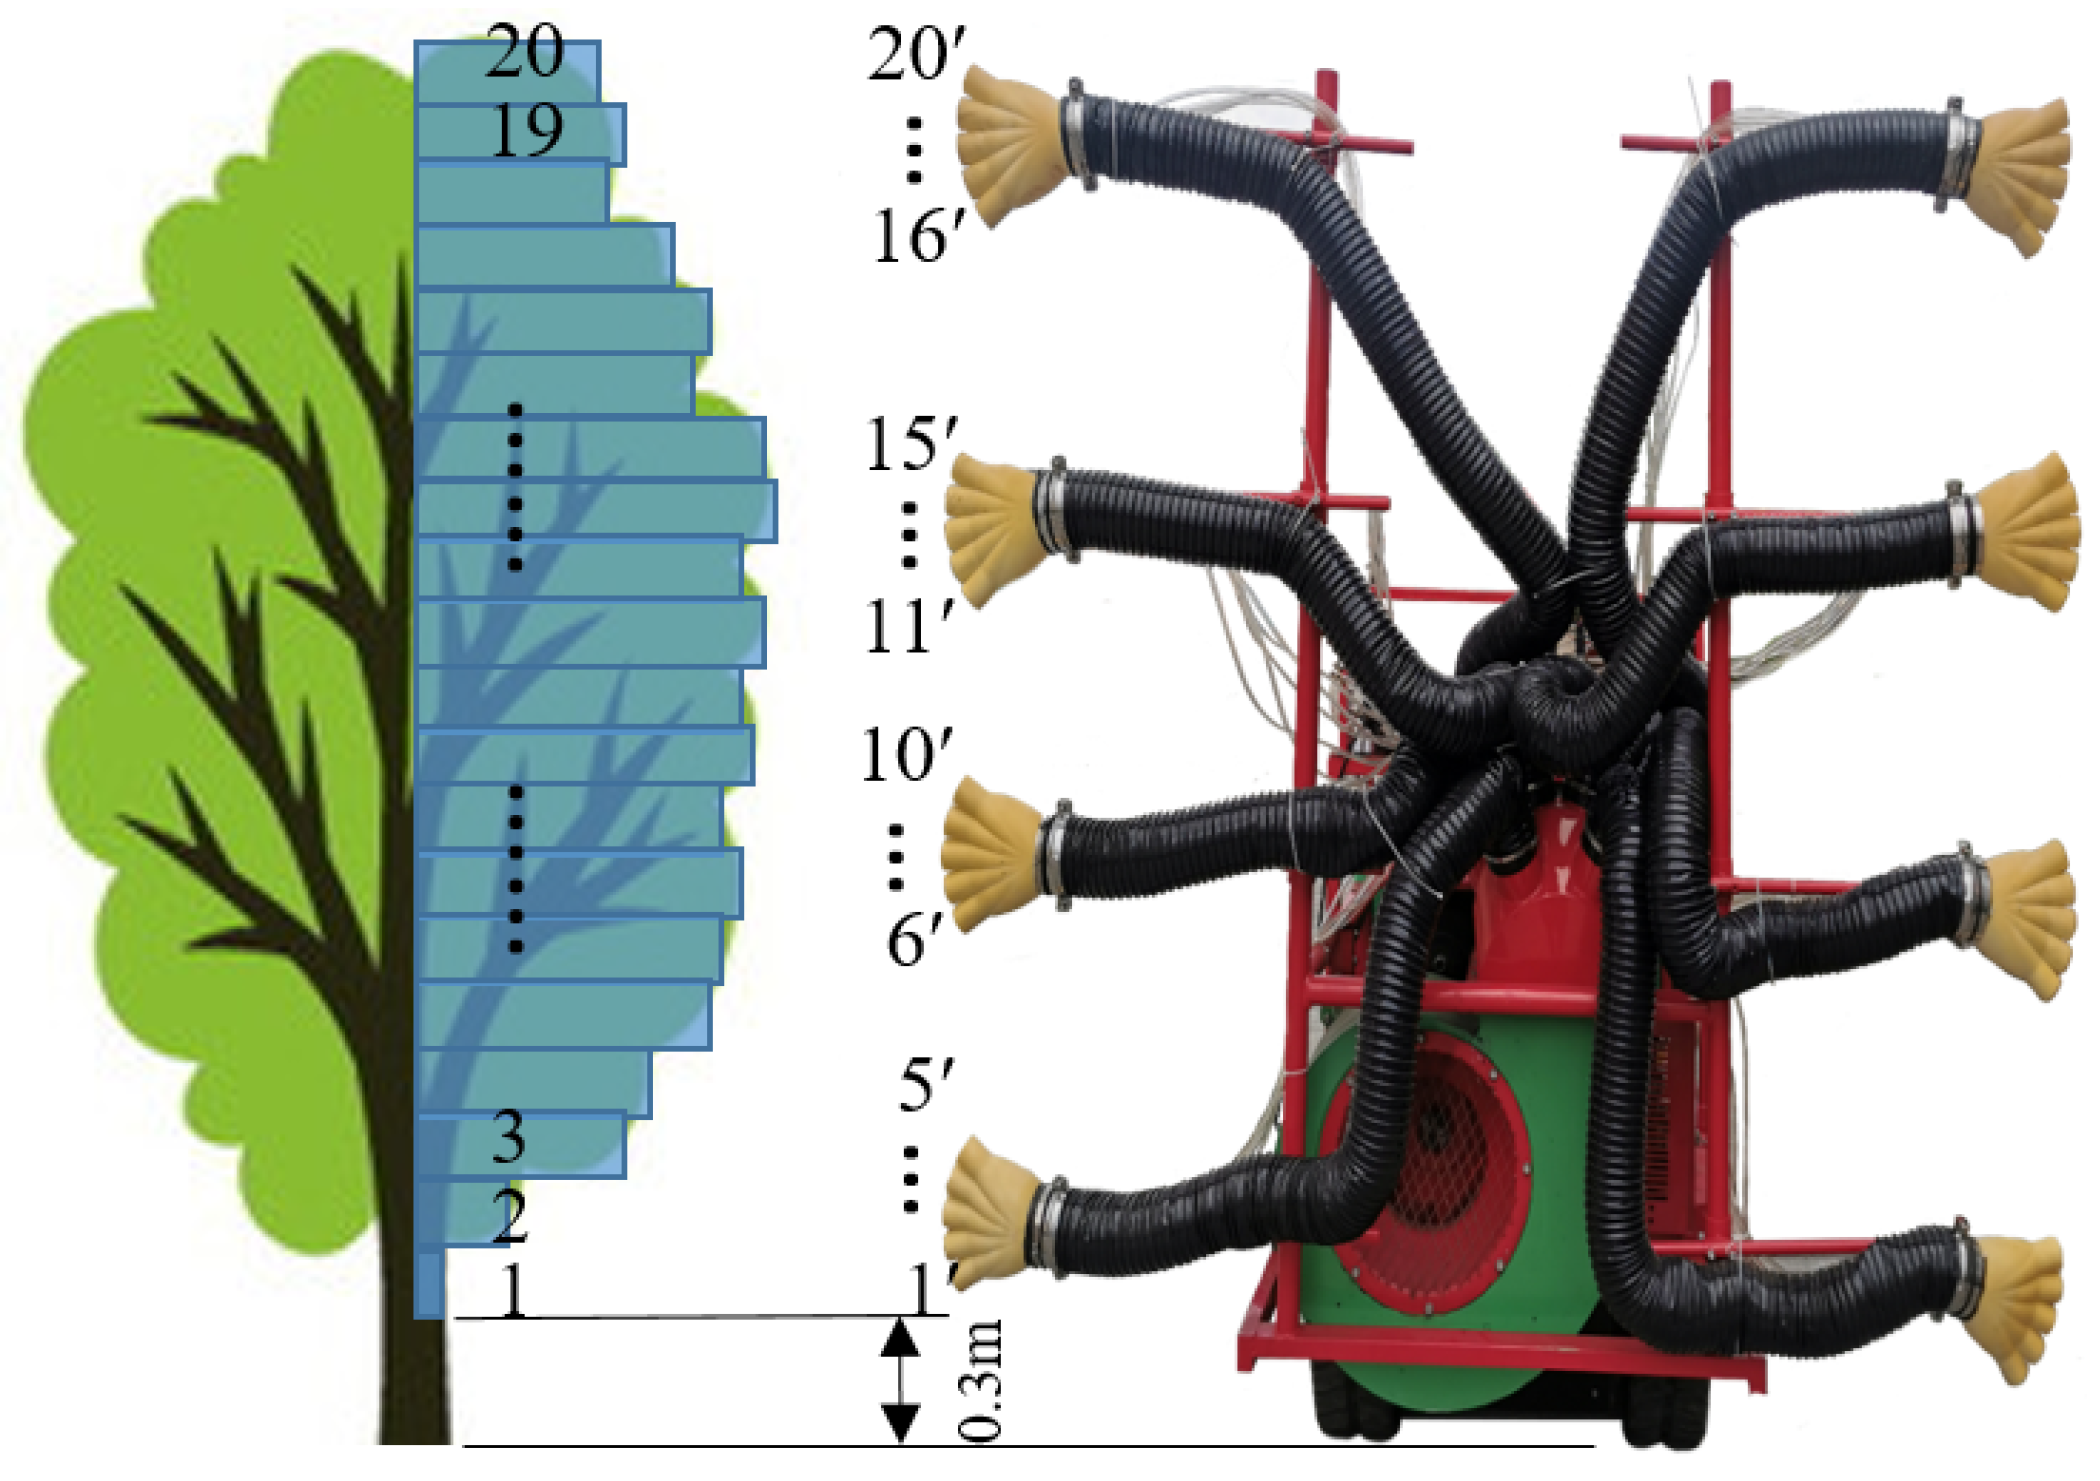
To evaluate the accuracy of the laser-based canopy volume measurement algorithm used by the sprayer, point cloud data and computed volume values from pear trees were recorded and exported during operation via a dedicated executable program. As illustrated in Figure 6, the canopy was divided vertically into 20 zones according to the sprayer’s nozzle arrangement, with each zone corresponding to one nozzle. During the experiment, the sprayer traveled at a constant speed of 1.5 m·s−1, and the canopy volume algorithm processed data in successive 15 cm segments. For manual validation, the canopy was subdivided into 15 cm × 15 cm units. The volume of each unit was determined by measuring the distance from the canopy center to its outer boundaries. The accuracy of the real-time volume estimation was assessed by calculating the mean relative error between the algorithm-generated results and the manually measured reference volumes.
The experiments were conducted in a pear orchard located in Taizhou Yejia Pear Orchard Development Co., Ltd. (Taizhou, Jiangsu, China), with traditionally free-growing trees. The average tree height was 3.6 m, and the canopy diameter was approximately 2.8 m. The tests were performed on clear days with wind speeds below 2 m/s to minimize environmental interference. The pear trees were approximately 8 years old, with a planting spacing of 4 m between rows and 3 m between trees.
To assess the precision of spray dosage control, a field test was performed on a pear tree in the orchard. Each nozzle was fitted with a tightly sealed transparent plastic bag during spraying. After the test, each bag—containing the collected spray liquid—was weighed using an electronic balance (LQ-C5001, accuracy 0.001 g, Rui’an Lenqi Trading Co., Ltd., Guangzhou, China). Given the known mass of an empty bag and the density of pure water (ρ = 1 × 10³ kg·m−3), the volume of liquid sprayed by each nozzle was calculated from the mass measurement.

3.2. Real-Time Spray Control Test

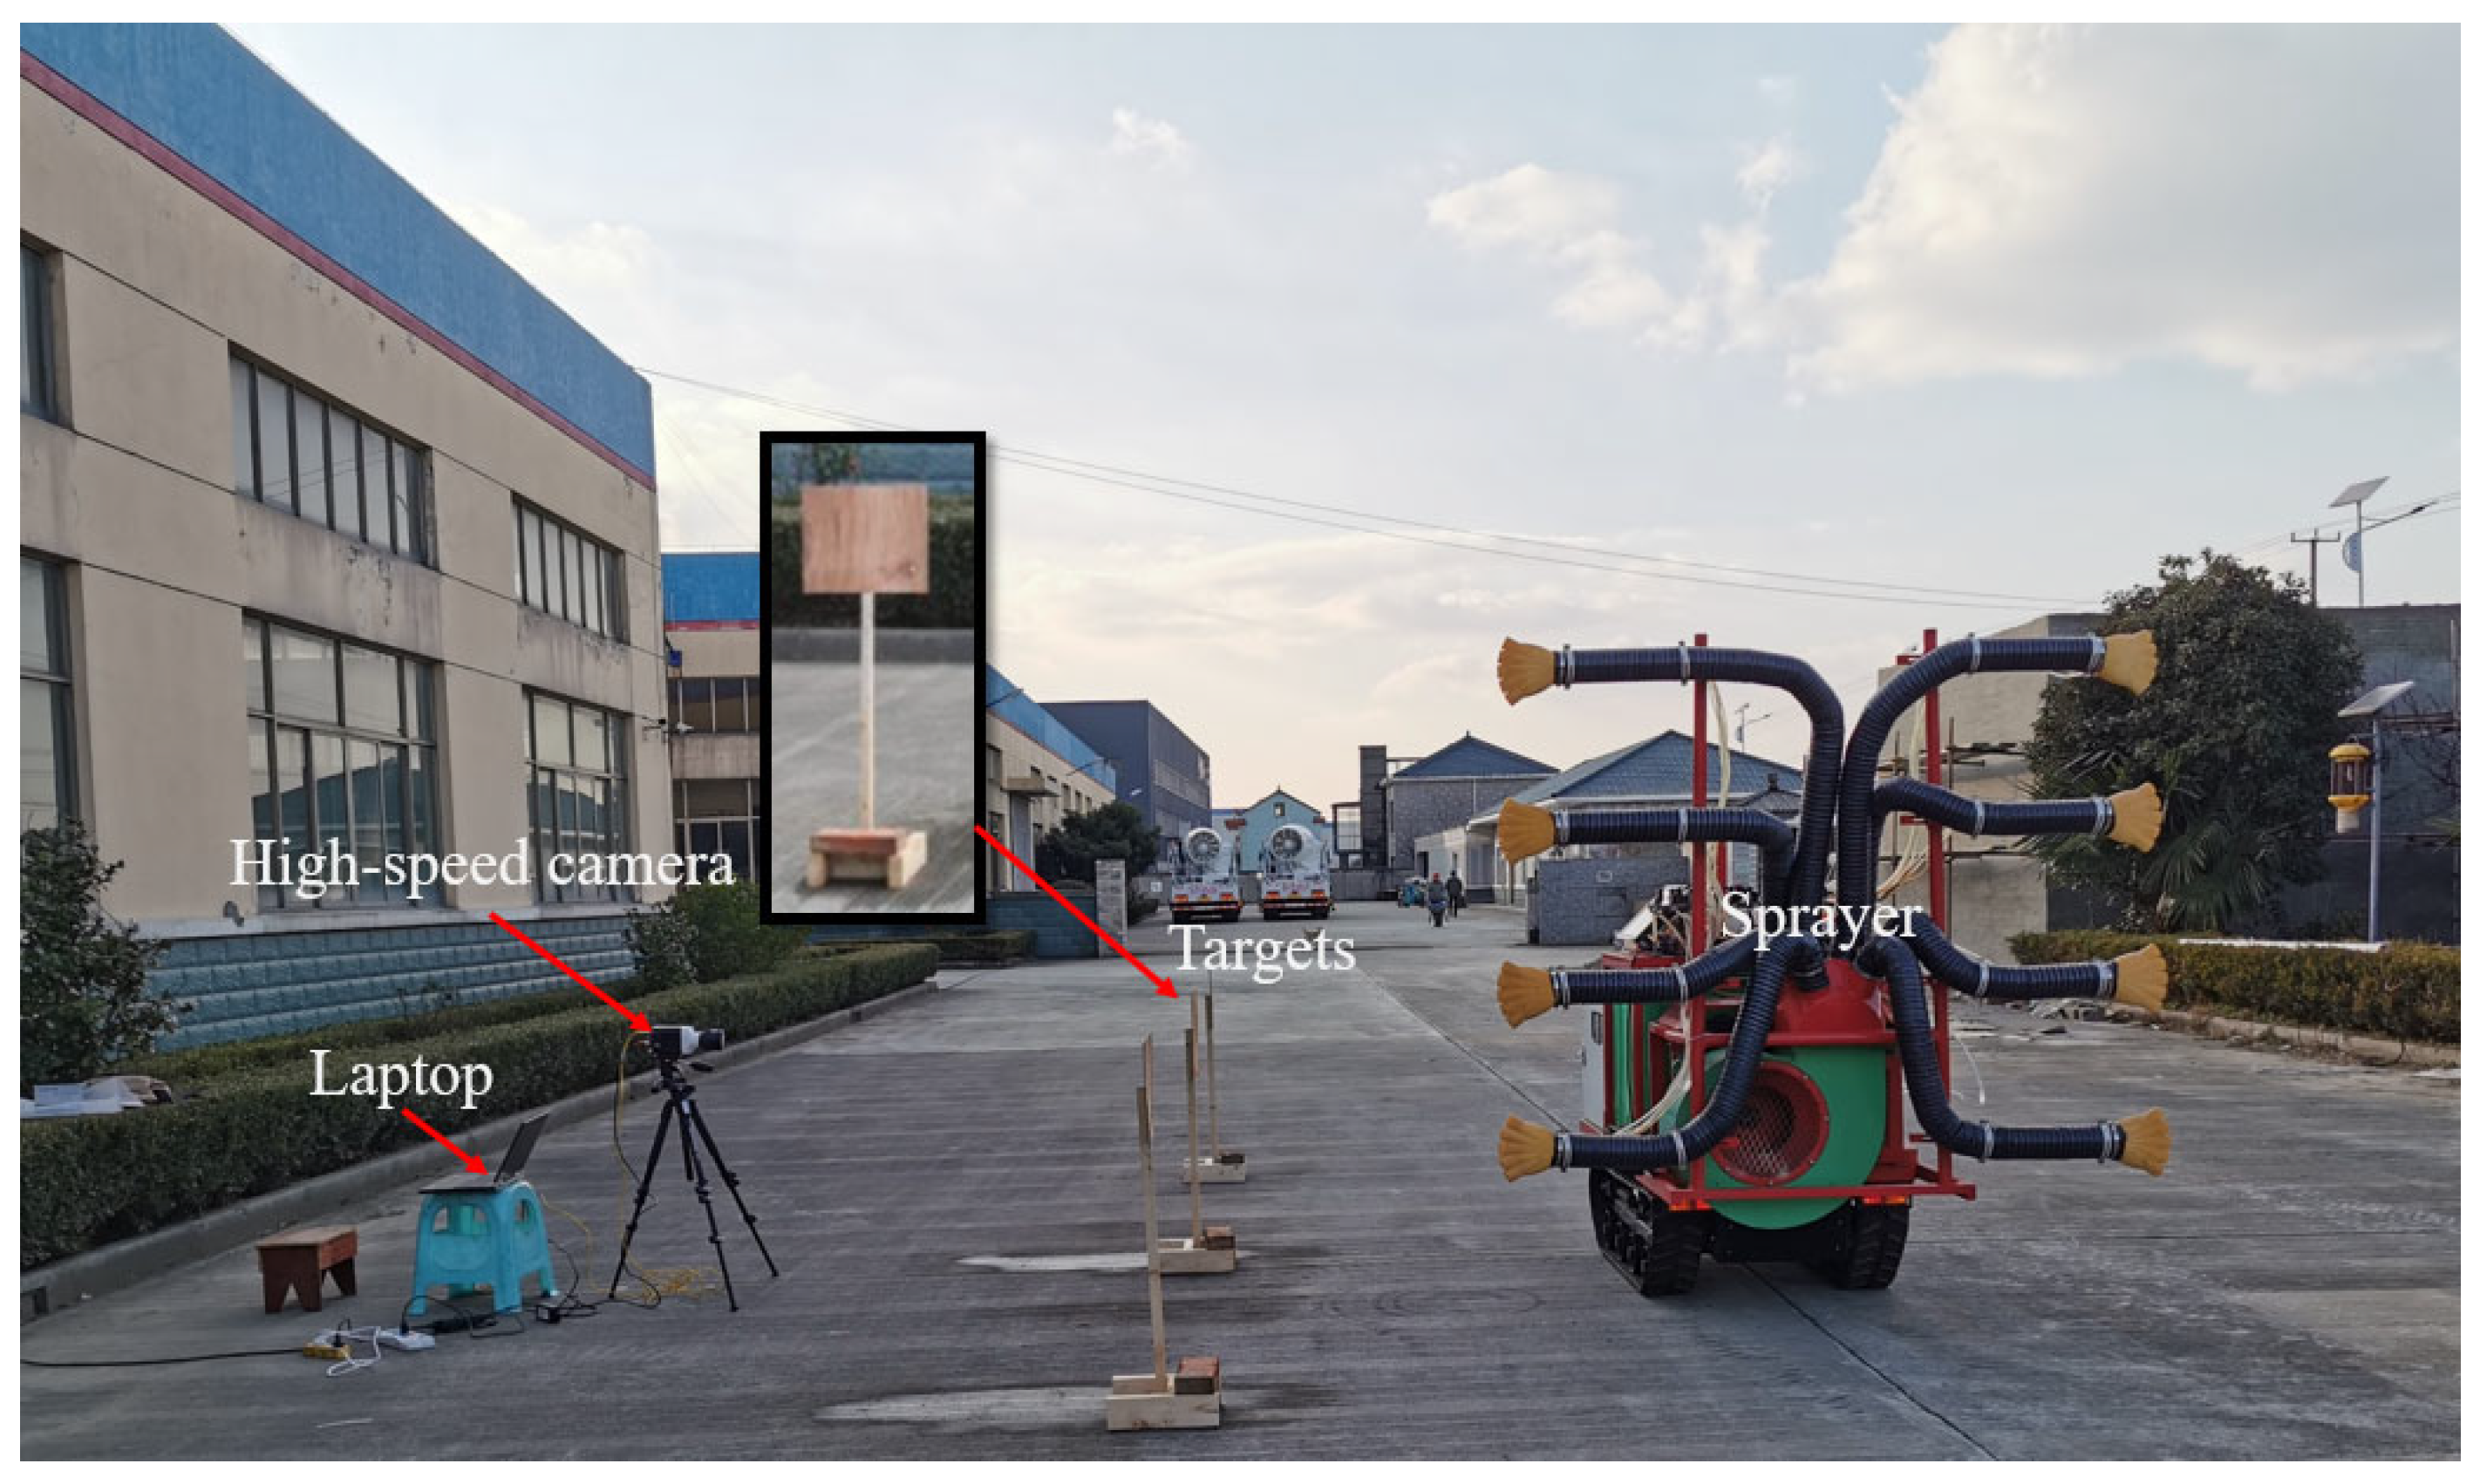
The targets consisted of six wooden boards measuring 0.3 m × 0.3 m, each mounted on a 1 m high wooden stand with the center of the board aligned with the top of the stand. The targets were arranged in a straight line, forming five gaps between them. The sprayer traveled parallel to the target line at low (0.3–0.55 m/s), medium (0.55–0.8 m/s), and high (0.8–1.05 m/s) speeds. The experimental layout is shown in Figure 7.
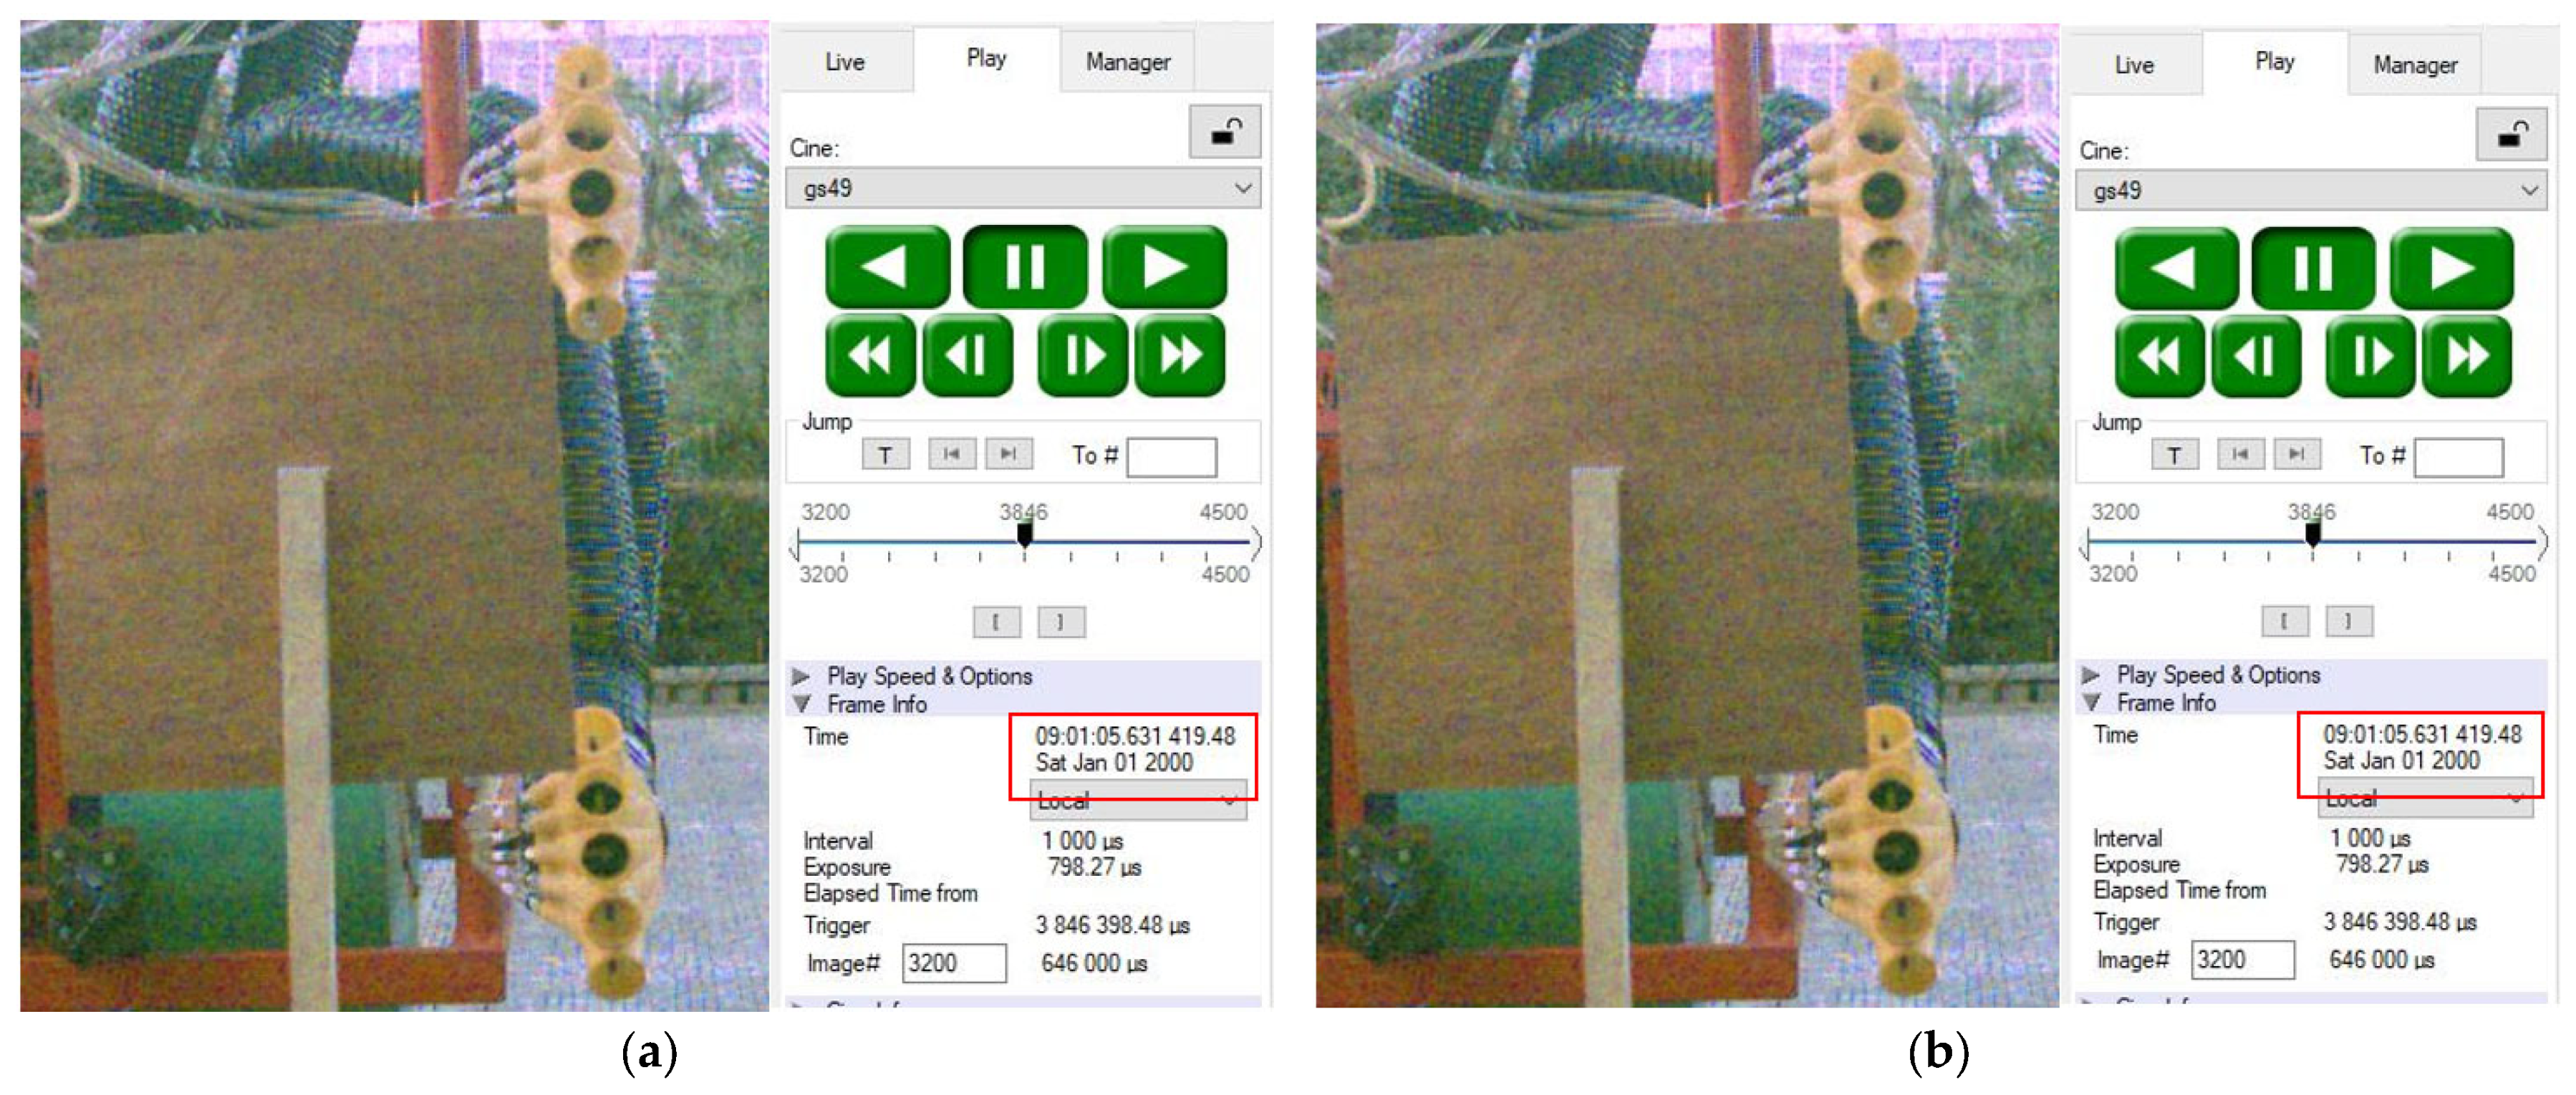
To evaluate the real-time performance of the adaptive delayed-spray model-based target spraying system, the nozzle core was removed from one nozzle closest to the targets, allowing it to emit a thin water jet aimed directly at the wooden boards, while all other nozzles were turned off. A high-speed camera was positioned behind the targets, with its lens focused on the edge of a board to capture the moment when water was emitted and the moment when the water jet aligned with the target edge (as shown in Figure 8). The lead spray time was calculated from these recordings. To minimize errors, each speed level was tested three times, and the average value was taken. To ensure that the high-speed camera (VEO410, Vision Research, Inc., Wayne, NJ, USA) could fully capture the water emission process, the spray activation time was advanced by 40 ms in the upper-computer program. This adjustment is also commonly applied in actual spraying operations to prevent missed sprays due to delayed solenoid valve response.
The minimum recognizable spacing of the real-time target spray control system was investigated, defined as the smallest distance between targets that the system can effectively distinguish. Below this threshold, the system fails to identify individual targets, resulting in continuous spraying and loss of precise targeting. Spacings of 50, 75, 100, 125, 150, and 175 mm were tested between targets, with the LiDAR positioned 2 m horizontally from the target line. The nozzle core was removed from the lowest nozzle on the target-facing side, directing a water jet toward the ground while other nozzles were closed. By observing the water traces, the minimum recognizable spacing was determined. During the tests, the actual travel speed of the sprayer was recorded and stored by the automatic variable-rate target spray control system.

3.3. Spray Deposition Test

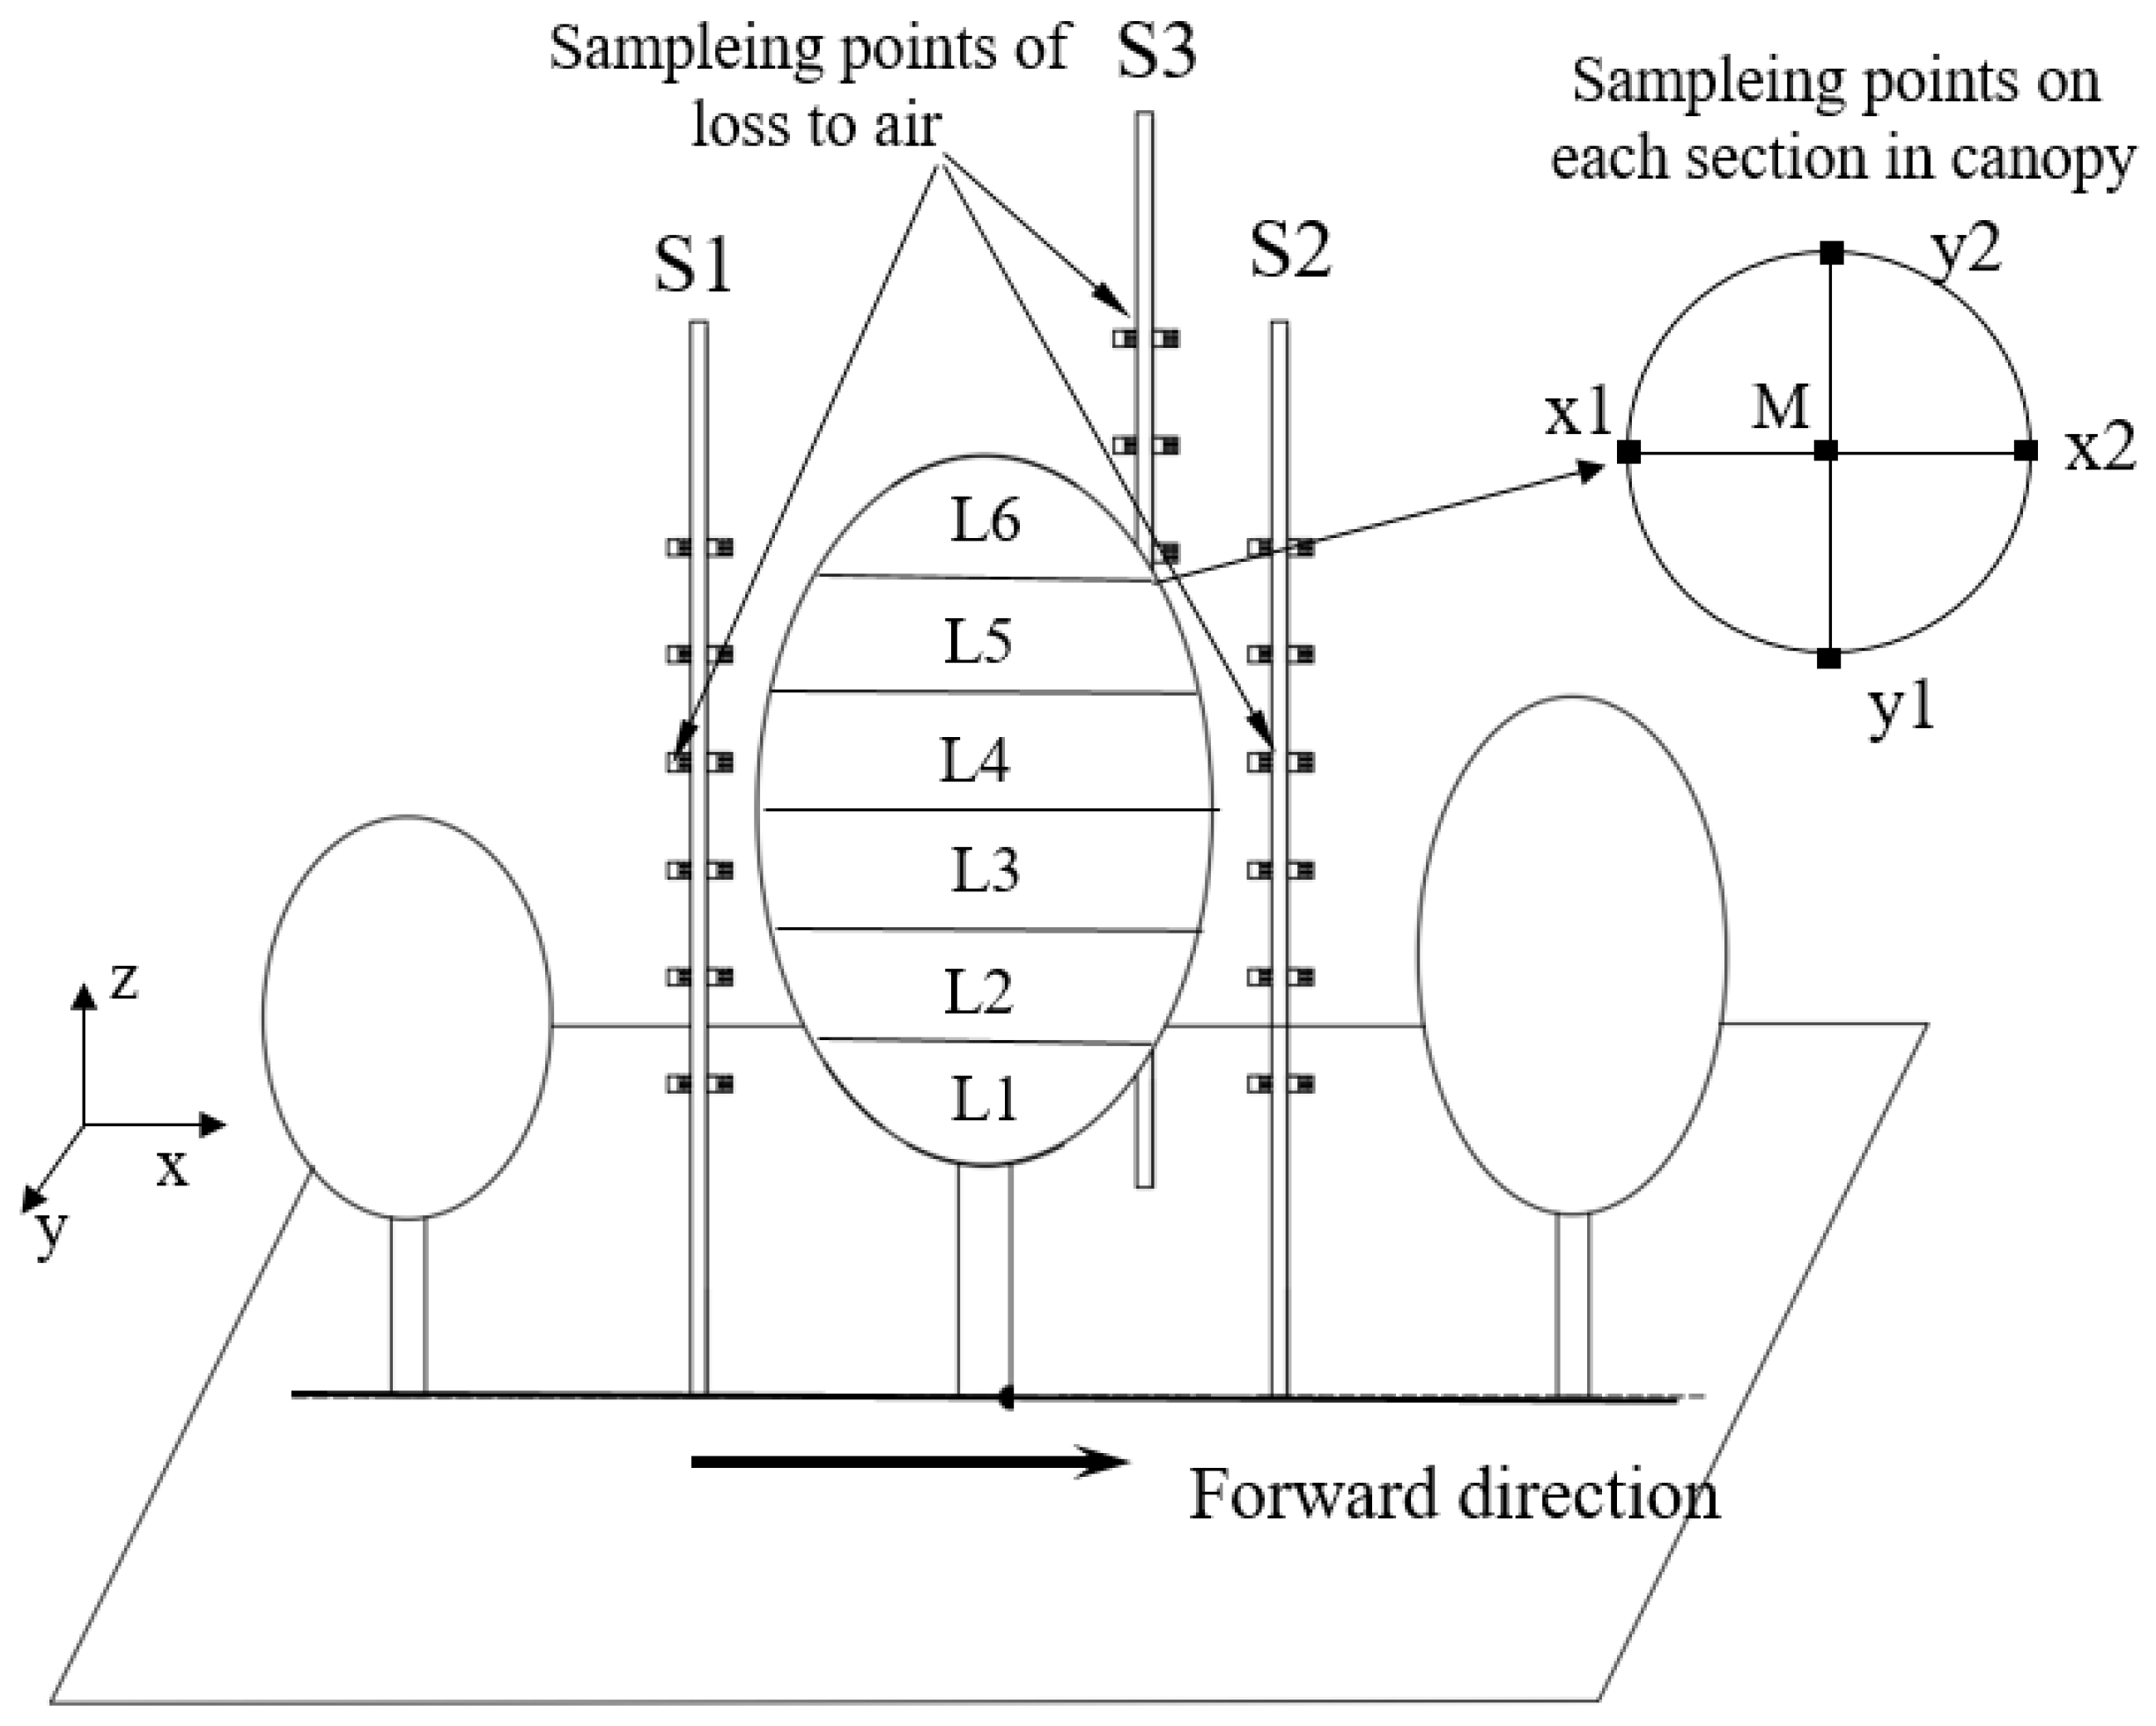
The experiment was conducted on traditionally free-growing pear trees with a spacing of 4 m between rows and 3 m between trees. The average tree height was 3.6 m, and the canopy diameter was 2.8 m. The trial followed the fruit tree deposition testing procedure outlined in the International Organization for Standardization (ISO 22522) [21] standard. Based on the canopy structure, each tree was divided vertically into six spray zones (L1…L6). Sampling points were arranged on both sides and inside the canopy to assess spray deposition. Each sampling cross-section included five positions: along the spray direction, points were labeled y1, M, and y2; perpendicular to the spray direction, points x1, M, and x2 were used, as illustrated in Figure 9. A 2.5‰ tartrazine solution was used as the tracer in the spray mixture.
The experimental procedure consisted of the following steps:
Step 1. To evaluate droplet deposition coverage and drift, water-sensitive papers (26 mm × 76 mm, Spraying Systems Co., Wheaton, IL, USA) were placed at each sampling location according to the layout in Figure 9.
Step2. The first spray application was performed on the left side of the canopy. After spraying, all water-sensitive papers were collected and sealed in plastic bags.
Step3. New water-sensitive papers were then deployed on both sides and inside the canopy (removing S1, S2, and S3). Separate spray operations were conducted on each side of the canopy. After spraying, the water-sensitive papers were collected, and three leaves were sampled near the measurement points for laboratory analysis.
In the laboratory, the collected leaves were rinsed with deionized water to elute the tracer. The absorbance of the tartrazine eluate was measured at a wavelength of 426 nm using a visible spectrophotometer. The deposition volume on the target, DT, was calculated using Equation (11). Additionally, based on the surface area of the leaves, the deposition amount per unit area, d, was determined using Equation (12). To clarify the parameters involved in these calculations: Ve denotes the volume of the eluent (deionized water) used for rinsing the leaves, which is essential for diluting the tracer and facilitating accurate absorbance measurement. Ae refers to the absorbance of the eluate at 426 nm, reflecting the tracer concentration via the Beer–Lambert law. Ac represents the absorbance of the calibration solution, a standard of known tartrazine concentration used to construct the calibration curve for converting absorbance values into concentrations. The dilution factor N corrects for any dilution applied to the tartrazine stock solution during preparation. Thus, Equation (11) computes the target deposition volume by comparing the eluent absorbance to that of the calibration solution, with adjustments for dilution and volume, while Equation (12) normalizes this value by the leaf surface area S to estimate deposition per unit area.
D T = V e A e N A c × 10 3 ,
d = D T S ,
where DT is the target deposition (μL); Ve is the eluent volume (mL); Ae and Ac are the absorbance of the eluent and calibration solution, respectively; N is the dilution factor of the tartrazine stock solution; d is the deposition per unit area (μL·cm−2); and S is the leaf surface area (cm2).
The water-sensitive papers were scanned at 300 dpi resolution using a CanoScan scanner and analyzed with DepositScan (USDA-ARS-ATRU, Wooster, OH, USA) to determine droplet coverage density and the number of droplets per unit area.

4. Results

This section presents the experimental results and corresponding discussions regarding the performance of the LiDAR-based variable-rate sprayer. The evaluation focuses on three main aspects: (1) the accuracy of canopy volume measurement and spray dosage control; (2) the real-time response and target recognition capability of the adaptive spray system; and (3) the spray deposition uniformity and drift control under field conditions.

4.1. Canopy Volume and Spray Dosage

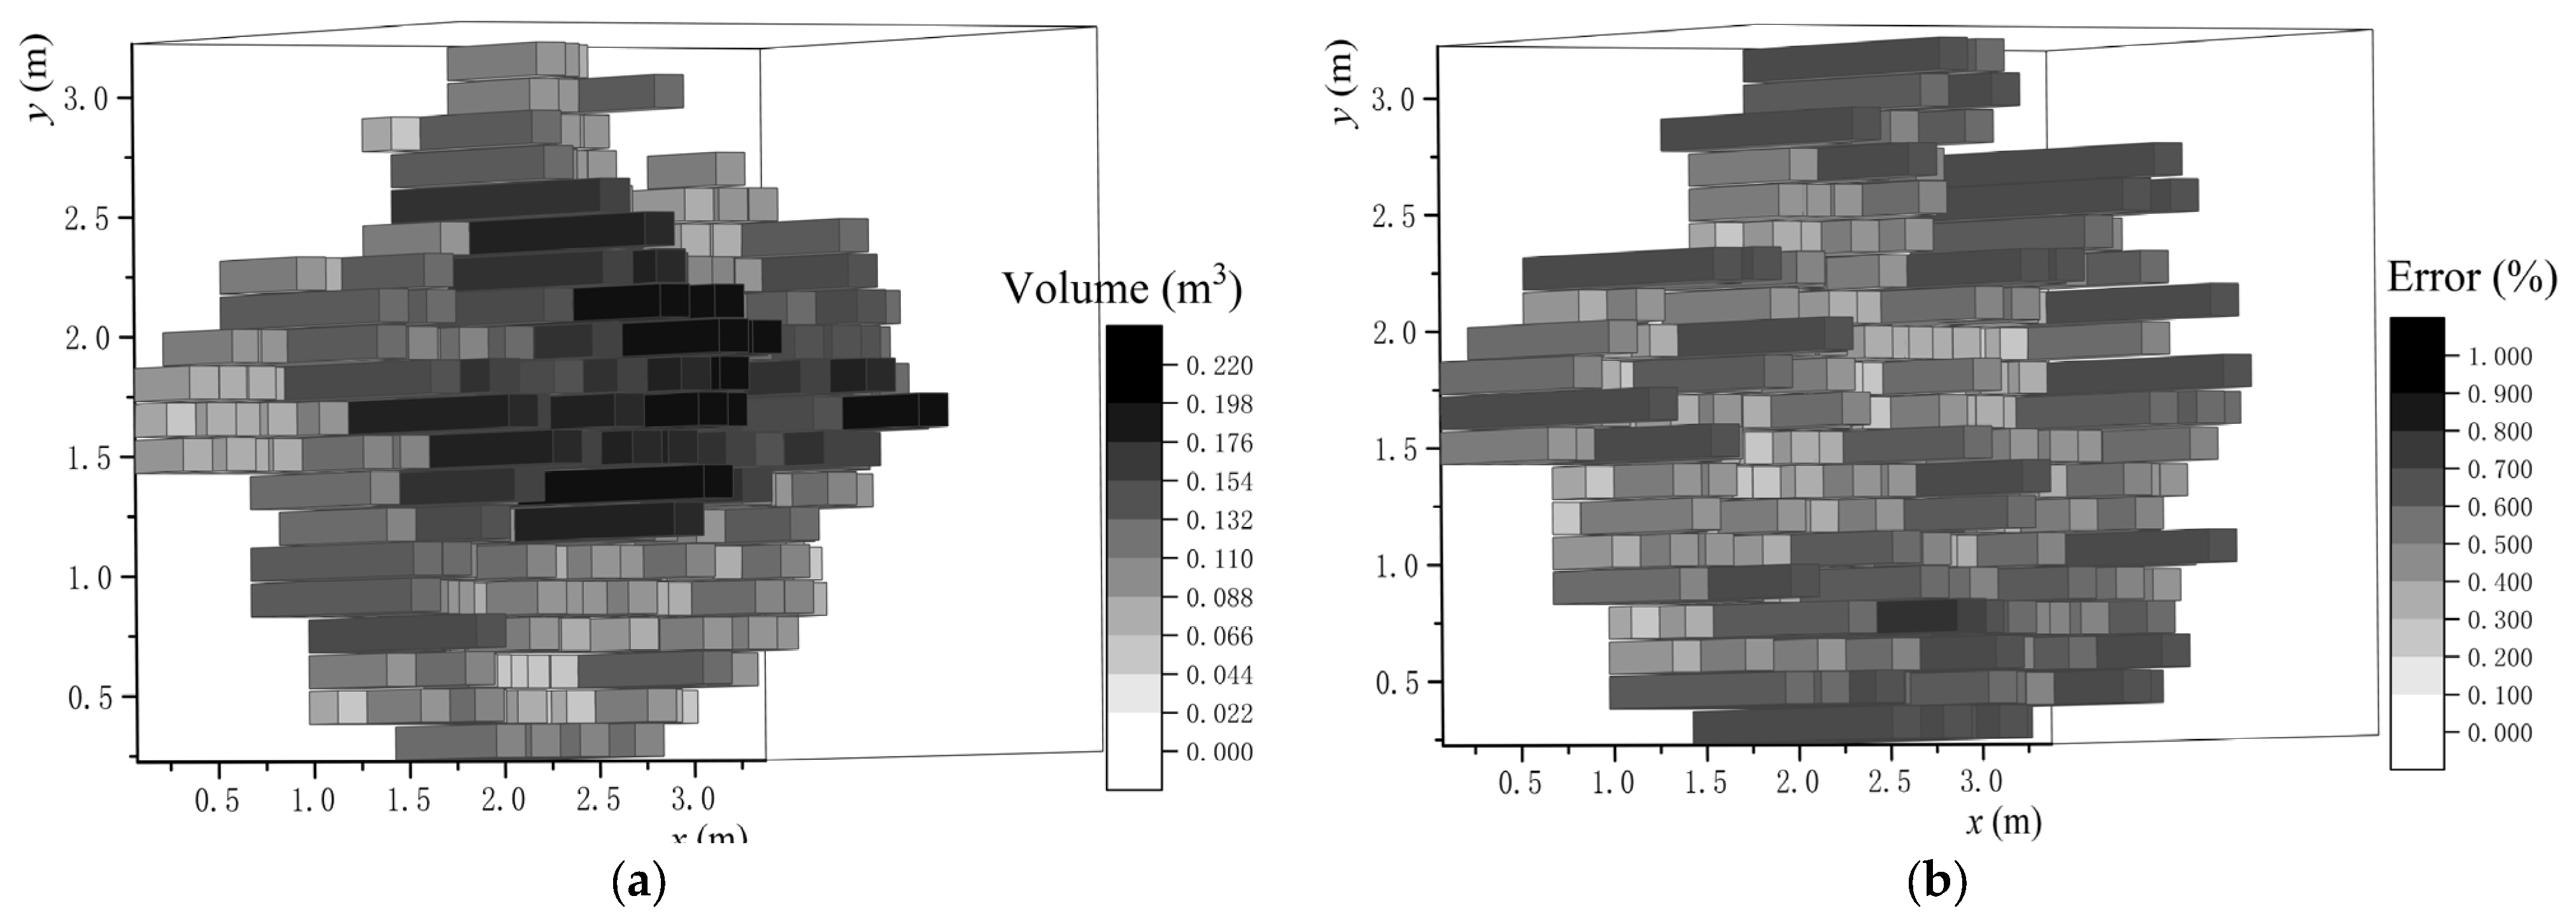
The point cloud map of the experimental pear trees was obtained by accessing the executable file in the sprayer’s upper-computer backend, as shown in Figure 10. The corresponding volume data for each calculation unit were extracted and organized, with the results presented in Figure 10a. Compared with manual measurements, the errors for individual units are illustrated in Figure 10b, showing an average error of 25.58% and a maximum error of 57.69%. Larger discrepancies occurred primarily at the canopy edges and in sparse regions, where limited point cloud data and interference in laser measurements led to overestimation of the volume. In most other areas, manual measurements yielded larger volume values than those obtained via laser sensing. This is attributed to the manual method only measuring the distance from the canopy edge to the center, without accounting for edge irregularity, thus generally overestimating the actual canopy volume. The total volume of the unilateral canopy measured by LiDAR was 16.412 m3, while the manual measurement result was 16.891 m3, resulting in an overall volume error of 2.84%. In laboratory tests on regular objects, the measurement error was below 5%. These results indicate that the algorithm meets the requirements for fruit tree volume estimation.
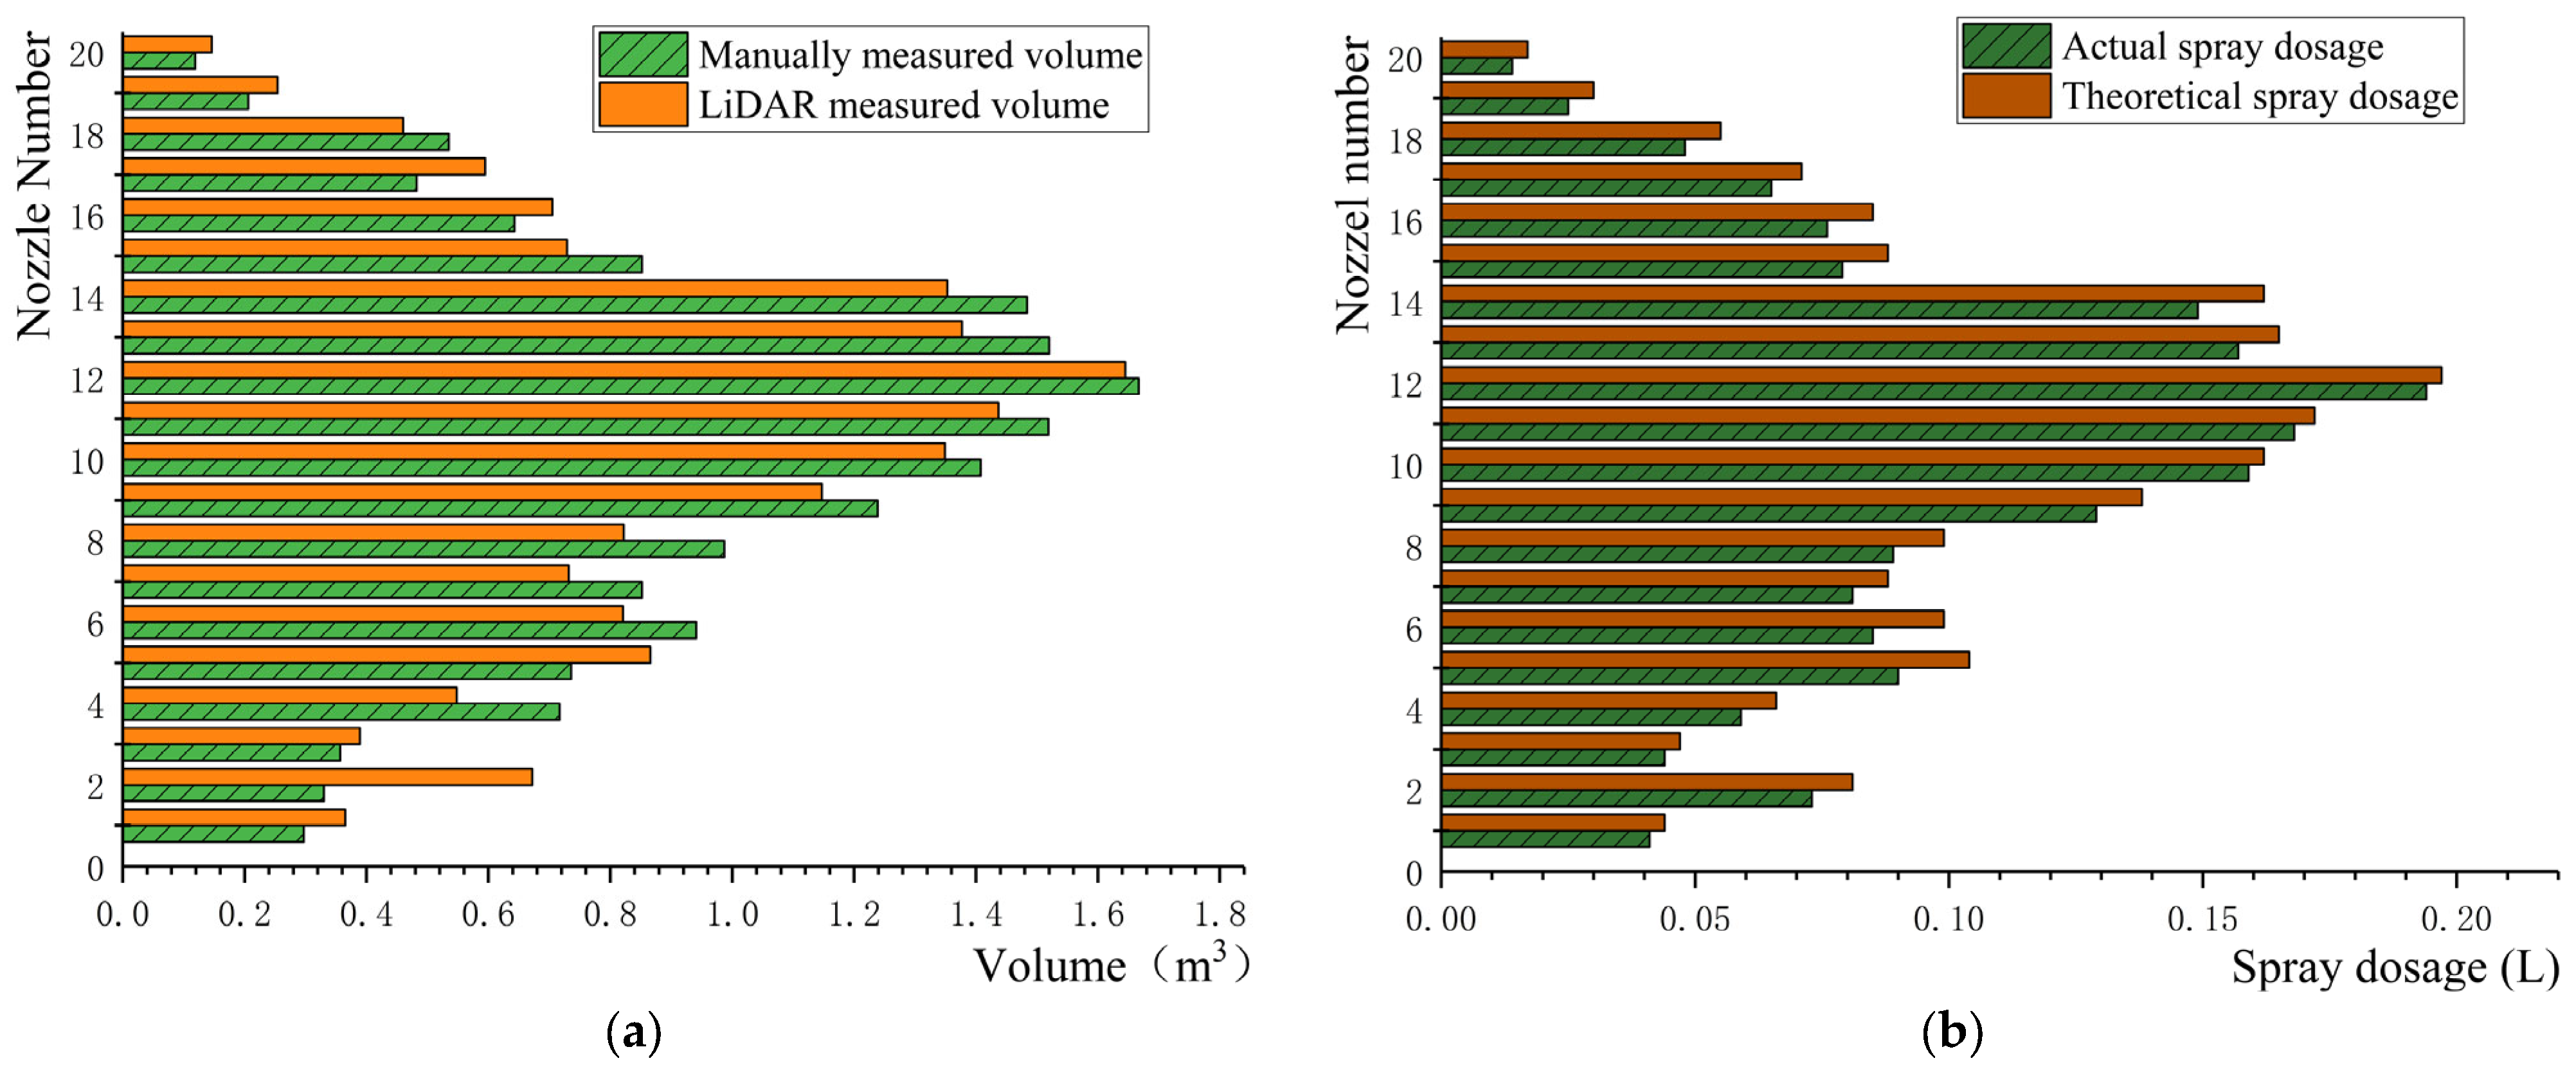
A comparison between the LiDAR-based volume calculation method and manual measurement for each nozzle zone is shown in Figure 11a. The results demonstrate good agreement between the LiDAR-derived canopy volumes and the manually measured values. Further experimental measurement of the actual spray dosage revealed that it was generally lower than the theoretical spray dosage (as shown in Figure 11b). This discrepancy is mainly attributed to the response delay of the solenoid valves and their limited adjustment capability under rapidly varying canopy volume conditions. Overall, the actual spray dosage controlled by the solenoid valves still exhibited good consistency with the theoretical values, with an average error of 8.78% and a maximum error of 17.6%, which occurred at the topmost nozzle (Nozzle 20). The theoretical spray dosage for this nozzle was 0.017 L, while the actual spray dosage was 0.014 L, yielding an absolute error of 0.003 L. Analysis based on the morphological characteristics of the test pear trees indicates that the error between theoretical and actual spray dosage was smaller in dense canopy regions, whereas it increased in areas with sparse canopy or significant structural variation.

4.2. Spray Response Time and Delay

A Real-time spray response error was determined using high-speed videography. The recorded system response errors under low, medium, and high travel speeds are summarized in Table 1.
The relationship between the actual travel speed of the sprayer and the minimum recognizable target spacing is also presented in Table 1. When the target spacing was less than 75 mm, the real-time target spray control system failed to distinguish individual targets, resulting in continuous spraying without effective interruption. At spacings greater than 175 mm, the system successfully identified the gaps and interrupted spraying across all tested speeds. Thus, the effective recognizable target spacing range for the real-time control system under the current speed conditions was determined to be 75–175 mm. Moreover, the minimum recognizable spacing increased with the sprayer’s travel speed.
The system response time of the real-time target spray control system was experimentally measured as 160 ms. The theoretical maximum recognizable target spacings at different speeds are listed in Table 1. For instance, at a speed of 0.602 m·s−1, the theoretical recognizable spacing was 96.32 mm, yet in actual spraying tests with a target spacing of 100 mm, the system failed to achieve effective spray interruption. This indicates that the practical recognition capability of the system is somewhat lower than the theoretical value at the same speed. In field conditions, factors such as environmental noise, sprayer vibration, and variation in liquid pressure may contribute to this discrepancy, leading to a higher actual recognizable spacing than theoretically predicted.
Table 1 also shows the lead spray time required by the target sprayer at various speeds. The lead time increased with travel speed, confirming that the adaptive delayed-spray model effectively adjusts the spray timing based on the current travel velocity. The system’s lead spray time remained within 50 ms, which is substantially shorter than the 100 ms period allocated for target data acquisition by the control center. This demonstrates that the real-time target spray control system exhibits satisfactory responsiveness and is suitable for integration into automatic variable-rate target spray control systems. The adaptive delayed-spray model, which includes a delay memory and a delay counter, operates by retrieving spray commands from the memory based on travel speed and dispatching them to the actuating components.
The system’s response time and travel speed directly influence spraying accuracy. A shorter response time allows for finer target discrimination, especially at higher speeds. The adaptive delay model effectively compensates for the system’s inherent latency, ensuring accurate spray targeting across the tested speed range. However, at very high speeds, the minimum recognizable target spacing increases, which may limit resolution in densely spaced canopies.

4.3. Spray Deposition Performance

After unilateral spraying of the canopy, the results of droplet deposition coverage are presented in Table 2. Along the direction of sprayer travel, the droplet deposition coverage on both sides of the canopy was generally comparable. In the direction of spray application (y1 > M > y2), coverage showed a progressive decrease. The average deposition coverage across all layers at measuring point y2 was 5.99%, indicating relatively limited droplet deposition in this region. Analysis of data from drift monitoring points revealed low levels of deposition coverage in both the left and right drift zones, with mean values of 0.79% and 1.11%, respectively. Some monitoring points showed nearly undetectable droplet deposition, reflecting the sprayer’s effective target-discrimination capability and its ability to perform precise chemical applications by accurately distinguishing non-target areas. The average deposition coverage on the leeward side of the canopy was only 0.92%, further confirming the system’s satisfactory anti-drift performance. The maximum deposition coverage among all drift monitoring points was 1.69%, observed at the uppermost layer of the canopy. This elevated drift is attributed to the relatively sparse foliage in this region, where LiDAR-measured canopy volume tends to be overestimated, leading to slightly excessive spray application. Additionally, the sparse canopy offers reduced resistance to airflow, which promotes droplet drift and results in relatively higher drift levels in this zone.
Under bilateral spraying mode, the droplet deposition amounts across different canopy layers are summarized in Table 3. Horizontally, the coefficients of variation (CV) for deposition in all layers remained below 20%, with a maximum value of 16.9%, indicating a relatively uniform vertical distribution of droplets.

5. Discussion

The development and evaluation of the LiDAR-based variable-rate orchard sprayer presented in this study demonstrate a significant advancement in precision agriculture technology for targeted pesticide applications. The results indicate that the system is capable of real-time canopy volume estimation and adaptive spray control with satisfactory accuracy and responsiveness.
The canopy volume measurement algorithm achieved an overall error of 2.84% compared to manual measurements, which is within an acceptable range for practical orchard applications. However, the larger errors observed at the canopy edges and sparse regions (up to 57.69%) highlight the limitations of LiDAR system: its inability to distinguish between solid obstructions and sparse, porous foliage, leading to volume overestimation where point cloud data is limited. This phenomenon, consistent with previous studies [15,16], is attributed to the laser beam interception by the outermost foliage, which prevents accurate mapping of the inner canopy void spaces. The system’s accuracy is therefore optimal for dense, continuous canopies and diminishes with increasing structural sparsity and complexity.
In terms of spray dosage control, the actual spray volume showed good consistency with the theoretical values, with an average error of 8.78%. The discrepancies were primarily attributed to solenoid valve response delays and limited adjustment capability under rapidly varying canopy conditions. This aligns with findings by Chen et al. [16], who also noted that rapid changes in canopy density pose challenges for real-time valve control. The higher error at the top nozzle (Nozzle 20) further underscores the difficulty in spraying sparse canopy regions, where LiDAR tends to overestimate volume and airflow resistance is lower, promoting drift. Furthermore, the use of a constant airflow velocity is often suboptimal for the precise transport and deposition of droplets onto heterogeneous canopy structures. Consequently, the development of an intelligent, adaptive air-assist system that dynamically adjusts airflow based on real-time target characteristics is paramount for the next generation of variable-rate sprayers.
The real-time performance of the adaptive delayed-spray model was validated through high-speed videography, showing a system response time of 160 ms. The system effectively achieved spray interruption at target spacings greater than 75–175 mm, depending on travel speed. This performance is intrinsically linked to the system’s physical parameters: the minimum recognizable spacing increases logically with travel speed due to the fixed processing delay, which reduces the spatial decision-making window. The operational envelope for reliable target discrimination was established between 0.35 m/s and 1.0 m/s. Beyond this range, particularly at higher speeds, performance degrades as the spatial window shrinks below the system’s response capability. The slight discrepancy between theoretical and practical recognizable spacing is attributed to real-world factors like environmental noise, sprayer vibration, and liquid pressure fluctuations—consistent with challenges noted by Osterman [17] in field conditions.
Spray deposition tests revealed uniform droplet distribution within the canopy (CV < 20%) and minimal drift (average 0.92% on leeward side), confirming the system’s ability to discriminate non-target areas effectively. The higher drift observed in the upper canopy layer was expected due to sparse foliage and overestimation of volume, as also reported by Li Longlong et al. [18]. These results affirm that the integration of LiDAR with a PWM-controlled solenoid valve system can achieve precise, target-oriented spraying, reducing pesticide waste and environmental impact.
Beyond the controlled test conditions, the system’s performance is subject to the inherent limitations of LiDAR technology. Environmental factors such as heavy dust, rain, or intense direct sunlight can attenuate the laser signal or generate noise in the point cloud. Furthermore, highly reflective or absorbent leaf surfaces may also lead to measurement inaccuracies. While our algorithm’s use of multiple scanning cycles provides some robustness, these factors represent persistent challenges for optical sensing in agriculture. Future system iterations would benefit from sensor fusion or advanced filtering techniques to mitigate these effects.
Compared to traditional constant-rate spraying systems, our LiDAR-based variable-rate system demonstrated a 35–45% reduction in pesticide usage while maintaining effective coverage, which is consistent with the 45.7% savings reported by Li Longlong et al. [18]. However, unlike the system by Chen et al. [16] that primarily adjusts based on canopy presence, our method incorporates real-time volume calculation and speed-adaptive delay compensation, enabling more precise dosage control. The main advancement lies in the integrated adaptive delayed-spray model that synchronizes measurement and actuation based on dynamic travel speed, a feature not comprehensively addressed in previous works.
In a broader context, this study contributes to the global effort to promote sustainable agriculture through precision spraying technologies. The proposed system not only reduces chemical usage but also minimizes operator exposure and environmental contamination. Future research should prioritize improving the volume estimation algorithm’s robustness in sparse canopies. This could be achieved through multi-sensor fusion (e.g., LiDAR with vision) for complementary data and by expanding control to include synchronous airflow velocity adjustment. Finally, comprehensive testing under varied orchard architectures and environments is essential.

6. Conclusions

In this study, a LiDAR-based variable-rate sprayer was successfully developed and evaluated for real-time, target-oriented orchard spraying. The system, which utilized a canopy volume calculation model and an adaptive delayed-spray mechanism, demonstrated robust performance in dynamically adjusting pesticide output based on real-time LiDAR scans and travel speed. Evaluation results confirmed the feasibility of the approach: the LiDAR-based canopy volume estimation achieved an overall error of only 2.84%, proving its suitability for real-time decision-making. The spray dosage control system showed an average error of 8.78%, with higher accuracy observed in dense canopy regions. Furthermore, the adaptive spray system exhibited a rapid response time of 160 ms and could effectively distinguish target gaps as small as 75 mm. The uniform spray deposition within the canopy, coupled with minimal drift, further attests to the system’s high targeting precision. This system offers a practical solution for reducing pesticide use, operational costs, and environmental impact in orchard management, representing a significant step forward in precision agriculture and providing a reliable reference for future research into intelligent spraying systems. Looking forward, the convergence of technologies highlighted in the recent literature on multi-platform integration, advanced canopy mapping, and AI-driven decision-making charts the course for the next generation of fully autonomous and sustainable crop protection systems [22,23].

Author Contributions

Conceptualization, C.Z.; methodology, Q.L.; software, Q.L.; validation, C.Z. and P.Y.; formal analysis, C.Z.; investigation, C.Z.; resources, H.Z.; data curation, C.Z.; writing—original draft preparation, C.Z.; writing—review and editing, C.Z.; visualization, C.Z. and P.Y.; supervision, H.Z.; project administration, H.Z.; funding acquisition, H.Z. and C.Z. All authors have read and agreed to the published version of the manuscript.

Funding

This research was funded by Talent Introduction Project of Anhui Science and Technology University (JXYJ202302) and National key Research and Development Program of China (2018YFD0600202-04).

Data Availability Statement

The original contributions presented in this study are included in the article. Further inquiries can be directed at the corresponding author.

Acknowledgments

We deeply thank reviewers and editors for giving relevant revision advice for improvement of the paper.

Conflicts of Interest

The authors declare no conflicts of interest.

Abbreviations

The following abbreviations are used in this manuscript:
LiDARLight Detection and Ranging
TGSSTrue ground speed sensor
ADCAnalog-to-digital converter
PWMPulse-width modulation
MFCMicrosoft foundation classes
TTLTransistor–transistor logic
FIFOFirst-in-first-out
DdCanopy thickness (m)
DsDistance in the Z-direction between two detection points in the j-th frame (m)
Z(k)Spray region for the k-th nozzle
V 4 | k Tree canopy volume corresponding to the k-th nozzle (m3)
vTravel speed of sprayer (m·s−1)
Q k Spray dosage of k-th nozzle (L)
q k Spray flow rate (L·min−1)
DCkDuty cycle (%)
Proportional coefficient between spray dosage and canopy volume (-)
tcompCompensation time (s)
LHorizontal distance between the lidar and the nozzles (m)
tsysSystem response time (s)
tcalSpray command computation time (s)
tvalveSolenoid valve response time (s)
tcomCommunication time for transmitting spray commands
MNumber of delay memory units (-)
DTTarget deposition (μL)
VeEluent volume (mL)
AeAbsorbance of the eluent
AcAbsorbance of the calibration solution
NDilution factor of the tartrazine stock solution
dDeposition per unit area (μL·cm−2)
SArea of leaf surface (cm2)

References

  1. Salas, B.; Salcedo, R.; Garcia-Ruiz, F.; Gil, E. Design, implementation and validation of a sensor-based precise airblast sprayer to improve pesticide applications in orchards. Precis. Agric. 2024, 25, 865–888. [Google Scholar] [CrossRef]
  2. Meshram, A.T.; Vanalkar, A.V.; Kalambe, K.B.; Badar, A.M. Pesticide spraying robot for precision agriculture: A categorical literature review and future trends. J. Field Robot. 2022, 39, 153–171. [Google Scholar] [CrossRef]
  3. Wu, M.; Liu, S.; Li, Z.; Ou, M.; Dai, S.; Dong, X.; Wang, X.; Jiang, L.; Jia, W. A Review of Intelligent Orchard Sprayer Technologies: Perception, Control, and System Integration. Horticulturae 2025, 11, 668. [Google Scholar] [CrossRef]
  4. Miranda-Fuentes, A.; Llorens, J.; Rodríguez-Lizana, A.; Cuenca, A.; Gil, E.; Blanco-Roldán, G.L.; Gil-Ribes, J.A. Assessing the optimal liquid volume to be sprayed on isolated olive trees according to their canopy volumes. Sci. Total Environ. 2016, 568, 296–305. [Google Scholar] [CrossRef] [PubMed]
  5. Zhang, J.; Chen, Y.; Gu, C.; Li, Z.; Huang, J.; Lv, X.; Qiu, W. A variable-rate spraying method fusing canopy volume and disease detection to reduce pesticide dosage. Comput. Electron. Agric. 2025, 237 Pt A, 110606. [Google Scholar] [CrossRef]
  6. Mahmud, M.S.; Zahid, A.; He, L.; Choi, D.; Krawczyk, G.; Zhu, H.; Heinemann, P. Development of a LiDAR-guided section-based tree canopy density measurement system for precision spray applications. Comput. Electron. Agric. 2021, 182, 106053. [Google Scholar] [CrossRef]
  7. Wang, M.; Dou, H.; Sun, H.; Zhai, C.; Zhang, Y.; Yuan, F. Calculation method of canopy dynamic meshing division volumes for precision pesticide application in orchards based on lidar. Agronomy 2023, 13, 1077. [Google Scholar] [CrossRef]
  8. Rosell, J.R.; Sanz, R. A review of methods and applications of the geometric characterization of tree crops in agricultural activities. Comput. Electron. Agric. 2012, 81, 124–141. [Google Scholar] [CrossRef]
  9. Maghsoudi, H.; Minaei, S.; Ghobadian, B.; Masoudi, H. Ultrasonic sensing of pistachio canopy for low-volume precision spraying. Comput. Electron. Agric. 2015, 112, 149–160. [Google Scholar] [CrossRef]
  10. Gu, C.; Zhao, C.; Zou, W.; Yang, S.; Dou, H.; Zhai, C. Innovative leaf area detection models for orchard tree thick canopy based on LiDAR point cloud data. Agriculture 2022, 12, 1241. [Google Scholar] [CrossRef]
  11. Liu, L.; Liu, Y.; He, X.; Liu, W. Precision variable-rate spraying robot by using single 3D LIDAR in orchards. Agronomy 2022, 12, 2509. [Google Scholar] [CrossRef]
  12. Baltazar, A.R.; Dos Santos, F.N.; De Sousa, M.L.; Moreira, A.P.; Cunha, J.B. 2D lidar-based system for canopy sensing in smart spraying applications. IEEE Access 2023, 11, 43583–43591. [Google Scholar] [CrossRef]
  13. Qiao, B.; Han, L.; Wang, Z.; Li, Y.; Wang, L.; Han, H.; He, X. Design and testing of an intelligent variable-rate spraying system based on LiDAR-guided application. Crop Prot. 2024, 184, 106874. [Google Scholar] [CrossRef]
  14. Fessler, L.; Fulcher, A.; Lockwood, D.; Wright, W.; Zhu, H. Advancing Sustainability in Tree Crop Pest Management: Refining: Spray Application Rate with a Laser-guided Variable-rate Sprayer in Apple Orchards. HortScience 2020, 55, 1522–1530. [Google Scholar] [CrossRef]
  15. Polo, J.R.R.; Sanz, R.; Llorens, J.; Arnó, J.; Escola, A.; Ribes-Dasi, M.; Palacin, J. A tractor-mounted scanning LIDAR for the non-destructive measurement of vegetative volume and surface area of tree-row plantations: A comparison with conventional destructive measurements. Biosyst. Eng. 2009, 102, 128–134. [Google Scholar] [CrossRef]
  16. Chen, Y.; Zhu, H.; Ozkan, H.E. Development of LIDAR-guided sprayer to synchronize spray outputs with canopy structures. In Louisville, Kentucky, 7–10 August 2011; American Society of Agricultural and Biological Engineers: St. Joseph, MI, USA, 2011. [Google Scholar] [CrossRef]
  17. Osterman, A.; Godeša, T.; Hočevar, M.; Širok, B.; Stopar, M. Real-time positioning algorithm for variable-geometry air-assisted orchard sprayer. Comput. Electron. Agric. 2013, 98, 175–182. [Google Scholar] [CrossRef]
  18. Li, L.; He, X.; Song, J.; Wang, X.; Jia, X.; Liu, C. Design and experiment of automatic profiling orchard sprayer based on variable air volume and flow rate. Trans. Chin. Soc. Agric. Eng. (Trans. CSAE) 2017, 33, 70–76, (In Chinese with English Abstract). [Google Scholar] [CrossRef]
  19. Li, L.; He, X.; Song, J.; Liu, Y.; Wang, Z.; Li, J.; Liu, Z. Comparative experiment on profile variable rate spray and conventional air assisted spray in orchards. Trans. Chin. Soc. Agric. Eng. (Trans. CSAE) 2017, 33, 56–63, (In Chinese with English Abstract). [Google Scholar] [CrossRef]
  20. Furness, G.O.; Magarey, P.A.; Miller, P.M.; Drew, H.J. Fruit tree and vine sprayer calibration based on canopy size and length of row: Unit canopy row method. Crop Prot. 1998, 17, 639–644. [Google Scholar] [CrossRef]
  21. ISO 225522: 2006; Crop Protection Equipment—Field Measurement of Spray Distribution in Tree and Bush Crops. International Organization for Standardization: Geneva, Switzerland, 2006.
  22. Li, W.; Luo, Y.; Jiang, P.; Dong, X.; Tang, K.; Liang, Z.; Shi, Y. A sustainable crop protection through integrated technologies: UAV-based detection, real-time pesticide mixing, and adaptive spraying. Sci. Rep. 2025, 15, 35748. [Google Scholar] [CrossRef]
  23. Bing, Q.; Zhang, R.; Zhang, L.; Li, L.; Chen, L. UAV-SfM Photogrammetry for Canopy Characterization Toward Unmanned Aerial Spraying Systems Precision Pesticide Application in an Orchard. Drones 2025, 9, 151. [Google Scholar] [CrossRef]
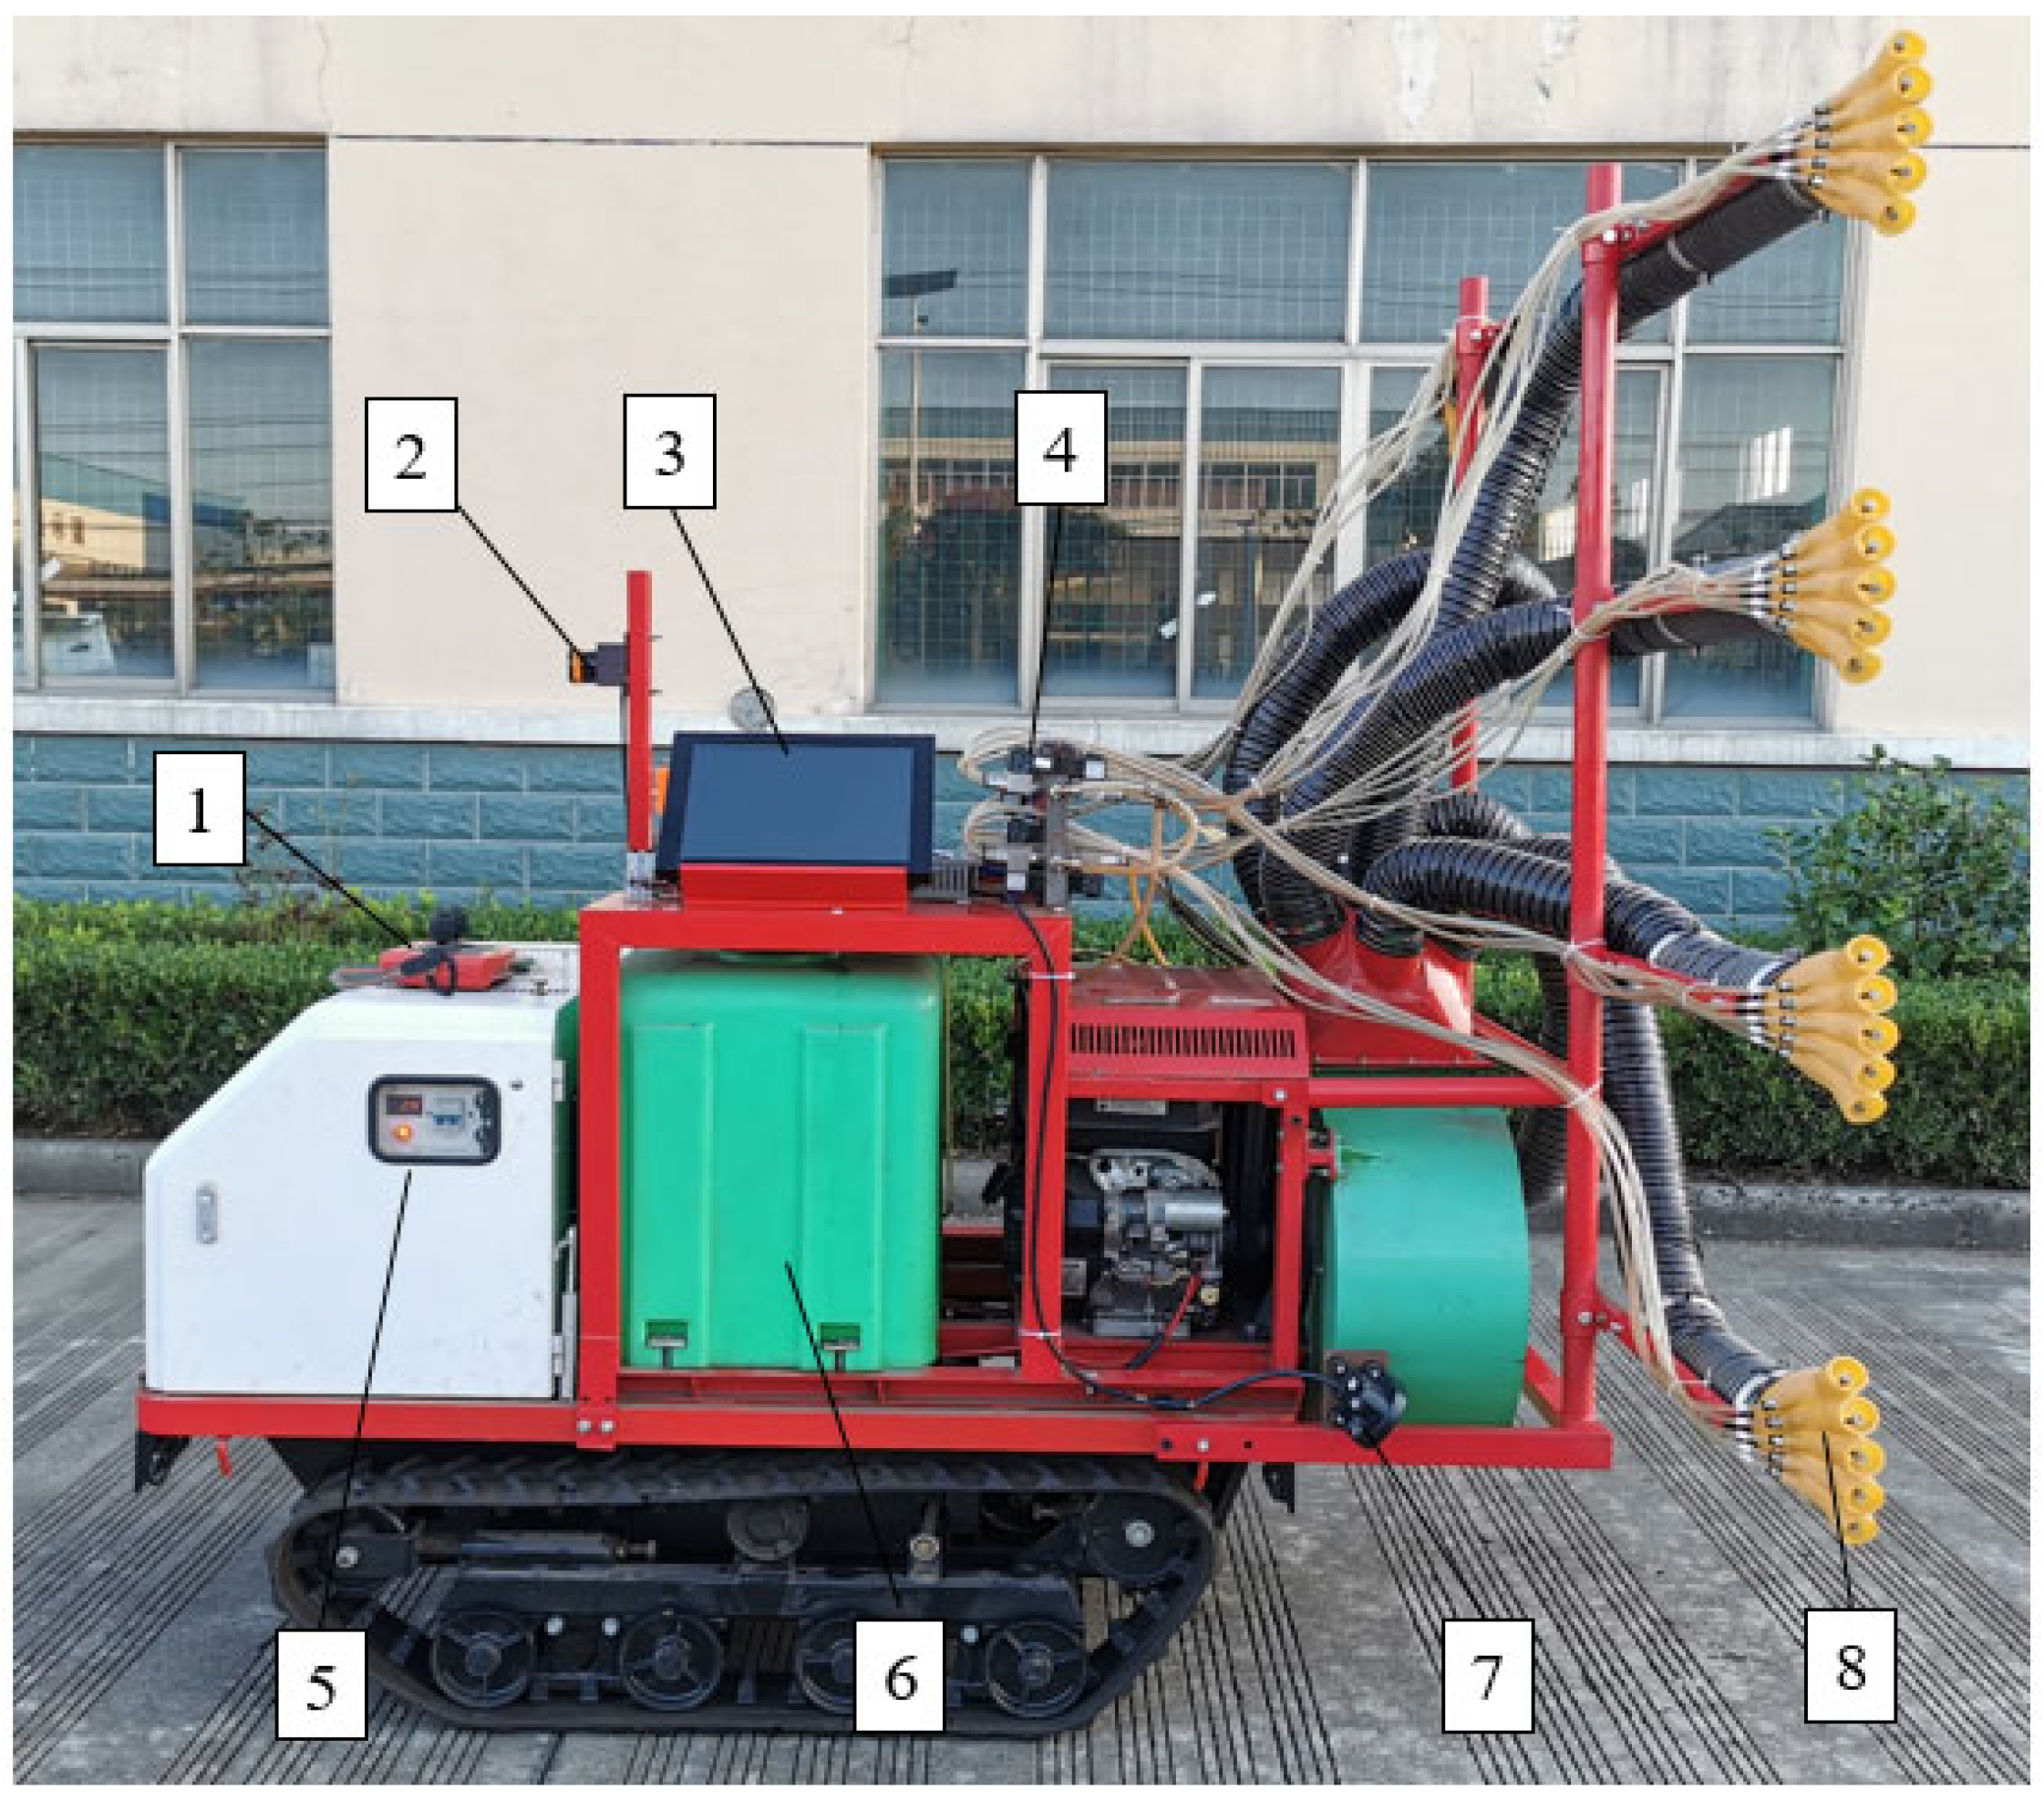
Figure 1. Orchard Variable-rate Sprayer (1. Remote control of spray machine; 2. Lidar; 3. Industrial control computer; 4. Electromagnetic valve group; 5. Control cabinet; 6. Crawler type spray; 7. Speed sensor; 8.five-port nozzles).
Agronomy 15 02709 g001
Figure 2. Schematic of the LiDAR-based canopy volume detection algorithm.
Agronomy 15 02709 g002
Figure 3. Composition of variable spray control system.
Agronomy 15 02709 g003
Figure 4. Software architecture of system.
Agronomy 15 02709 g004
Figure 5. Schematic diagram of adaptive real-time target-based spray control system.
Agronomy 15 02709 g005
Figure 6. Schematic diagram of the canopy volume units associated with each nozzle during spraying operation.
Agronomy 15 02709 g006
Figure 7. Test Layout of the Real-time Spray Control System.
Agronomy 15 02709 g007
Figure 8. Real-time test results: (a) The moment water was emitted; (b) The moment water jet aligned with the target edge.
Agronomy 15 02709 g008
Figure 9. Sketch map of sampling points arrangement.
Agronomy 15 02709 g009
Figure 10. Canopy Volume of the Experimental Fruit Trees. (a) Calculation of Canopy Volume per Unit Based on LiDAR Volume Algorithm; (b) Volume calculation error of each volume element.
Agronomy 15 02709 g010
Figure 11. Volume and application of each nozzle zone. (a) Volume of each nozzle zone; (b) Dosage of each nozzle.
Agronomy 15 02709 g011
Table 1. Speed of spray truck for measuring the distance between targets.
Test Speed (m·s−1)Theoretical Recognizable Spacing (mm)Test Recognizable Spacing (mm)Target Spray Advance Time (s)
5075100125150175
Low speed0.351 (±0.003)56.16×40
0.400 (±0.004)64.00×40
0.450 (±0.003)72.00××41
0.499 (±0.003)79.84××41
Medium speed0.551 (±0.002)88.16××42
0.602 (±0.003)96.32×××42
0.651 (±0.003)104.16×××43
0.698 (±0.002)111.68×××44
0.752 (±0.003)120.32××××45
High speed0.802 (±0.002)128.32××××47
0.847 (±0.003)135.52××××48
0.898 (±0.004)143.68××××48
0.950 (±0.001)152.00×××××49
0.998 (±0.002)159.68×××××50
Note: Values in parentheses represent the standard deviation of the test velocity; “×” denotes unrecognized spacing, while “○” indicates recognized spacing.
Table 2. Deposition coverage on different Sampling points.
Sampling PointsDeposition Coverage (%)
x1Mx2y1y2S1S2S3
L629.1311.6030.6130.736.77001.69
L532.6821.3137.2743.425.461.331.830.72
L427.3516.3432.1347.044.731.312.360.35
L336.3617.3729.8350.974.472.072.350.42
L231.7121.4226.9732.136.6300.220.93
L122.4715.1021.5732.167.88001.45
Average value29.9517.1929.7339.415.990.791.110.92
Table 3. Deposition distribution of different Sampling points.
Sample PointDeposition Rate (μL·cm2)Coefficient of Variation (%)
x1Mx2y1y2
L61.67
(0.33)
1.59
(0.17)
1.74
(0.26)
2.01
(0.42)
2.34
(0.36)
13.4
L52.68
(0.41)
2.19
(0.28)
2.97
(0.43)
3.42
(0.69)
3.96
(0.52)
15.6
L42.75
(0.37)
2.32
(0.23)
2.43
(0.32)
4.74
(0.30)
4.33
(0.39)
16.9
L32.36
(0.36)
2.37
(0.41)
2.93
(0.46)
3.99
(0.39)
3.48
(0.24)
15.7
L22.71
(0.26)
1.92
(0.17)
2.97
(0.30)
2.33
(0.16)
2.63
(0.33)
13.1
L11.77
(0.29)
1.60
(0.18)
1.97
(0.22)
2.16
(0.29)
2.58
(0.35)
15.3
Average value2.572.122.733.113.2213.2
Note: The values in parentheses represent the standard deviation.
Disclaimer/Publisher’s Note: The statements, opinions and data contained in all publications are solely those of the individual author(s) and contributor(s) and not of MDPI and/or the editor(s). MDPI and/or the editor(s) disclaim responsibility for any injury to people or property resulting from any ideas, methods, instructions or products referred to in the content.