Article

Comparative Transcriptome Analysis of Leaves and Roots Revealed Organ-Specific and Cross-Stress Defense Strategies of Pearl Millet Under Different Abiotic Stresses

1
College of Agronomy, Hunan Agricultural University, Changsha 410128, China
2
National Center for Technology Innovation and Comprehensive Utilization of Saline-Alkali Land, Academician Workstation of Agricultural High-Tech Industrial Area in the Yellow River Delta, Dongying 257300, China
3
Yuelushan Laboratory, Changsha 410128, China
*
Authors to whom correspondence should be addressed.
Agronomy 2025, 15(12), 2707; https://doi.org/10.3390/agronomy15122707
Submission received: 24 October 2025 / Revised: 20 November 2025 / Accepted: 22 November 2025 / Published: 25 November 2025

Abstract

Pearl millet (Pennisetum glaucum (L.) R. Br.) is widely recognized for its high tolerance to marginal environments. However, a systematic understanding of its organ-specific transcriptional adaptation mechanisms under individually applied abiotic stresses remains limited. In this study, we conducted a comparative transcriptome analysis of leaves and roots subjected to six distinct stress treatments (Ion stress: CdCl2/NaCl; Water stress: PEG/Waterlogging; Temperature stress: Heat/Cold), revealing fundamental differences in defense strategies between the two organs. Across all stresses, leaves showed more differentially expressed genes (DEGs) (213) than roots (118), yet the transcriptional responses were largely stress-specific. Carotenoid biosynthesis was the only pathway co-activated in leaves under both water and temperature stress. In contrast, roots exhibited a robust and conserved strategy, with significant enrichment of phenylpropanoid and flavonoid biosynthesis pathways consistently observed across all six stresses. This cross-stress synergistic response involved more than 300 enzyme genes in roots, including key enzymes such as peroxidases (128) and shikimate O-hydroxycinnamoyltransferases (33), which collectively contribute to root-specific cell wall reinforcement and oxidative stress defense. Interaction network analysis further revealed that the MYB transcription factor family serves as a central regulatory hub in root stress responses, with key nodes PMF4G04191 and PMF5G01787 frequently interacting with pathway genes under all stress conditions. This study elucidates the organ-specific and cross-stress defense mechanisms in pearl millet, providing valuable transcriptomic resources and candidate genes for molecular-assisted breeding of multi-stress-tolerant varieties.

1. Introduction

Globally, environmental pollution, weather patterns, and fluctuating climatic conditions have emerged as critical factors constraining crop production, posing significant challenges to future agricultural development and food security [1]. Various abiotic stresses triggered by harsh environments and climates—including heavy metal toxicity, salt stress, drought, flooding, extreme temperatures, and nutrient deficiencies—adversely affect crops by disrupting cell membrane integrity, interfering with ion homeostasis, and inhibiting metabolic pathways, which severely suppress their growth and potential yield [2,3,4,5]. In response to these stresses, plants initiate adaptive mechanisms through complex regulatory processes involving signaling molecules, hormone regulation, and adjustments in gene expression. These responses activate corresponding physiological and biochemical changes, ultimately enhancing stress tolerance [6]. Therefore, systematically deciphering the multi-level regulatory networks underlying plant stress responses and uncovering core molecular mechanisms in stress-tolerant species such as pearl millet has become a critical challenge for plant scientists and breeders [7].
Pearl millet (Pennisetum glaucum (L.) R.Br) is a crucial C4 crop in global dryland agricultural systems, extensively cultivated in arid and semi-arid regions across over 40 countries across Asia, Africa, and beyond. Covering approximately 31 million hectares, it accounts for nearly 50% of the world’s millet production [8,9]. This crop serves as a primary staple food source for 90 million farmers in resource-poor regions and as an indispensable forage resource for ruminant livestock, owing to its exceptionally high biomass and superior nutritional quality [10,11]. The most distinctive characteristic of pearl millet is its tolerance to various abiotic stresses, including drought, high temperatures, saline-alkali conditions, nutrient-poor soils, and high Al3+ acidic environments [12,13,14,15]. This resilience allows pearl millet to maintain stable grain yields on marginal lands with annual precipitation below 250 mm, whereas major food crops like maize and rice struggle to achieve economic viability under such harsh conditions [16,17]. Comparative studies examining relative water content (RWC), relative electrical conductivity (REC), and malondialdehyde (MDA) levels have confirmed that pearl millet exhibits a stronger foundation of tolerance than maize when subjected to heat stress [18]. In recent years, researchers have begun utilizing transcriptomics to explore the molecular mechanisms underlying pearl millet’s response to individual stresses (e.g., heat stress) or specific combinations of stresses, providing preliminary insights into its stress resistance [19,20]. However, these studies predominantly focus on specific types of stress, with limited comparative analyses addressing multiple heterogeneous stresses simultaneously, such as ion toxicity, water imbalance, and extreme temperature fluctuations. The absence of a multi-stress comparative perspective has hindered the systematic elucidation of genome-wide transcriptional reprogramming patterns that drive phenotypic adaptation and the potential regulatory mechanisms conserved across different stressors.
High-throughput RNA sequencing (RNA-seq) technology serves as a powerful tool for systematically deciphering the complex regulatory networks that underlie plant stress adaptation. Quantitatively analyzing the dynamic expression of genome-wide mRNA under stress conditions provides essential support for the identification of candidate resistance genes [21,22]. In recent years, this technology has been widely applied to elucidate transcriptional regulatory networks in model plants, such as rice and Arabidopsis, as well as in crops like maize and sorghum, under specific stress conditions (e.g., salinity, drought, and waterlogging) [23,24,25,26,27]. Through systematic analysis, researchers have not only revealed the molecular regulatory mechanisms underlying plant stress responses but have also successfully identified multiple key functional modules for stress tolerance. These include the reactive oxygen species (ROS) homeostasis regulatory system, diverse signal transduction pathways, and transcription factor (bHLH, WRKY, MYB, etc.) regulatory hubs as major components [28,29,30]. In pearl millet, differentially expressed genes under drought conditions are associated with the glycerophospholipid metabolic pathway, demonstrating unique osmotic regulation and metabolic adaptation capabilities [31]. When subjected to salt stress, pearl millet relies on antioxidant enzyme systems (such as superoxide dismutase, catalase, and peroxidase), mitogen-activated protein kinases, and plant hormone signal transduction pathways for defense [32]. These studies provide crucial insights into pearl millet’s stress tolerance; however, the mechanisms revealed often exhibit stress specificity. Systematic, comparative analyses of transcriptional responses across multiple heterogeneous stresses remain limited [33]. Most studies have primarily focused on examining responses within individual organs, which overlooks a fundamental aspect of pearl millet’s stress adaptation: organ-specific functional differentiation [34]. The microenvironments experienced by roots and leaves are inherently distinct, necessitating the activation of specialized metabolic and transcriptional regulatory mechanisms [35]. For example, roots may prioritize enhancing structural support and defense capabilities to facilitate nutrient transport from sediments, while leaves predominantly concentrate on protective mechanisms related to photosynthesis [36]. Consequently, it remains uncertain whether conserved defense strategies can be activated under various stress conditions. The crux of the matter lies in how these regulatory processes are fine-tuned to meet the specific functional demands of different organs. Therefore, elucidating the molecular regulatory mechanisms underlying pearl millet’s broad-spectrum stress tolerance—particularly the conserved pathways across different stressors and the core regulatory factors, along with their organ-specific regulatory patterns—is crucial for understanding the essence of its environmental adaptability and unlocking its breeding potential [37]. To elucidate the common gene expression patterns and molecular mechanisms of pearl millet under various stresses, we analyzed the RNA-seq transcriptomes of its leaves and roots 24 h after exposure to six abiotic stresses (CdCl2, NaCl, PEG, WL, Heat and Cold) and the control (CK) treatment. Through integrated differential gene expression identification and functional enrichment analysis, we investigated organ-specific and common transcriptional response patterns in roots and leaves under various stress conditions. Furthermore, pathway visualization and protein interaction network prediction identified conserved core pathways and key genes activated in roots, while predicting pivotal transcription factors driving common defense responses. This study aims to provide new molecular insights into the broad-spectrum stress response system of pearl millet while offering novel targets for breeding multi-resistant crops. We hypothesize that the roots of pearl millet, being the primary organ in contact with the soil environment, will utilize more conservative core defense pathways to achieve broad-spectrum tolerance, whereas the leaves will exhibit more stress-specific response patterns to adapt to their aboveground environment.

2. Materials and Methods

2.1. Plant Materials

Seeds of P. glaucum (L.) R. Br. (PI 586660, ‘ICMV-IS 88102′) provided by the National Germplasm System of the United States was used for multiple stress studies in this research. Prior to the study, seeds were disinfected with 5% NaClO (Sinopharm Chemical Reagent Co., Ltd., Shanghai, China) for 5 min, rinsed five times with sterile distilled water, and sown on sterile filter paper in autoclaved Petri dishes for pretreatment.

2.2. Plant Growth and Stress Treatment

After the successful germination of both the radicle and plumule of pearl millet seeds, we transplanted them into 10-unit seedling trays filled with a substrate composed of nutrient soil, vermiculite, and perlite in a ratio of 3:1:1. The trays were maintained under controlled conditions of 25 °C/20 °C for day/night temperatures, a photoperiod of 14 h light and 10 h dark, 75% relative humidity, and photosynthetically active radiation (PAR) of 450 μmol m−2 s−1 at canopy level. Additionally, substrate moisture was preserved at 70–80% of field capacity by watering every two days. To meet the nutritional requirements of the plants, the Hoagland nutrient solution (Henan Caijudongli Agricultural Technology Co., Ltd., Zhengzhou, Henan, China) was applied in two complete applications, following the formulation protocol outlined in Supplementary Table S1. On the 21st day after transplanting, stress treatments were applied to uniformly growing seedlings for 24 h: (1) CK: Control, watered under normal growth conditions; (2) CdCl2: Treated with a 100 mg/L CdCl2 solution (Aladdin Reagent Co., Ltd., Shanghai, China); (3) NaCl: Treated with a 250 mM NaCl solution (Sinopharm Chemical Reagent Co., Ltd., Shanghai, China); (4) PEG: Treated with a 20% (w/v) PEG 6000 solution (Sinopharm Chemical Reagent Co., Ltd., Shanghai, China); (5) WL: Waterlogging treatment (the 10-unit tray containing plant material was immersed in tap water, ensuring that the water level remained 1–2 cm above the soil surface for the duration of the 24 h treatment period); (6) Heat: Simulated high-temperature treatment at 42 °C; (7) Cold: Simulated low-temperature treatment at 4 °C. The six abiotic stresses were applied individually to accurately delineate the specific transcriptional responses to each stressor, thereby avoiding the confounding effects of stress interactions. All treatments were conducted in parallel under controlled conditions to ensure comparability. The concentrations and levels for each stress treatment (e.g., 100 mg/L CdCl2 [38,39], 250 mM NaCl [32], 20% PEG 6000 [31], 42 °C Heat [19], 4 °C Cold [40]) were selected based on established protocols from previous studies on pearl millet and related grasses. These concentrations were further validated by our preliminary experiments, which confirmed their ability to induce significant physiological and transcriptional responses within a 24 h treatment period without resulting in plant lethality. For solution treatments, plants were maintained with a water level 1–2 cm above the soil surface for 30 min to ensure complete solution absorption. Twenty-four hours after the application of stress, samples were collected from all treated plants simultaneously. Using sterile scissors, the second fully expanded leaf from each seedling was excised, along with the entire root system from the root tip to the root base. To ensure the accuracy and reproducibility of the results, three biological replicates were included for each plant tissue treatment.

2.3. RNA Extraction, Library Preparation, and Sequencing

The 42 samples collected during the experiment were derived from seven treatments, including one control and six stress treatments, across two organs (leaves and roots) with three biological replicates. The harvested plant samples were immediately frozen in liquid nitrogen and subsequently stored at −80 °C until RNA extraction. The samples were shipped on dry ice for sequencing. Total RNA was extracted from root and leaf tissues using the EASYspin Plant microRNA Kit (Aidlab Biotechnologies, Beijing, China) and the RNAprep Pure Plant Plus Kit (Tiangen Biotech, Beijing, China), respectively, in accordance with the manufacturers’ instructions. RNA quality was assessed using an Agilent 2100 Bioanalyzer (Agilent Technologies, Santa Clara, CA, USA) and a NanoDrop ND2000 spectrophotometer (Thermo Fisher Scientific, Waltham, MA, USA). The RNA quality of all samples met the library preparation requirements, with RNA integrity numbers (RINs) exceeding 8.1 and A260/280 ratios ranging from 1.9 to 2.1 (Table S2).
For qualified RNA samples, library construction utilized the Hieff NGS® Ultima Dual-mode mRNA Library Prep Kit (Yeasen Biotechnology, Shanghai, China). Eukaryotic mRNA was enriched using Oligo(dT) magnetic beads, randomly fragmented with Fragmentation Buffer, and employed as a template for first-strand cDNA synthesis followed by double-stranded cDNA synthesis. The purified double-stranded cDNA underwent end repair, A-tailing, and sequencing adapter ligation, followed by PCR amplification to construct the cDNA library. After library construction, preliminary quantification was performed using the Qubit 3.0 Fluorometer to ensure a concentration of at least 1 ng/μL. The insertion fragment size of the library was analyzed using the Qsep400 high-throughput analysis system to confirm that it fell within the expected range. Subsequently, the effective concentration of the library was accurately quantified via real-time quantitative PCR (Q-PCR) to ensure that all libraries maintained an effective concentration above 2 nM. This approach controls for library quality consistency and minimizes technical variation arising from different experimental batches. Finally, the cDNA library was sequenced using the Illumina NovaSeq 6000 platform (Illumina, San Diego, CA, USA), generating 150 bp paired-end reads.

2.4. Sequencing Data Standardization and Quality Assessment

A flowchart outlining the comprehensive bioinformatics analysis pipeline is provided in Supplementary Figure S1. The raw sequencing data (raw reads) first underwent quality assessment and quantitative analysis. FastQC (v0.23.4; https://www.bioinformatics.babraham.ac.uk/projects/fastqc/, accessed on 24 October 2025) filtered reads containing adapters or poly-N sequences, as well as low-quality reads (where bases with Q ≤ 10 constitute over 50% of the entire read). After quality control, clean reads were obtained, and their Q20, Q30, and GC content were calculated. Clean reads were aligned to the pearl millet reference genome (GCA_947561734.1) using HISAT2 (v2.2.1; https://daehwankimlab.github.io/hisat2/, accessed on 24 October 2025). Transcript assembly and novel gene prediction were performed with StringTie (v2.2.1; https://ccb.jhu.edu/software/stringtie/, accessed on 24 October 2025) [41,42]. Gene functional annotation was conducted using multiple authoritative databases, including the Protein Sequence Database (Swiss-Prot), NCBI Non-Redundant Protein Database (NR), KEGG, GO, Homologous Proteins (KOG/COG/eggNOG), and Protein Families (Pfam), with an E-value < 1 × 10⁻⁵.

2.5. Transcriptome Data Analysis

Gene expression levels were normalized and quantified using StringTie’s maximum flow algorithm with Fragments Per Kilobase of transcript per Million mapped fragments (FPKM) [43]. Differential expression analysis between groups was conducted using the DESeq2 (v1.22.1; https://bioconductor.org/packages/DESeq2/, accessed on 24 October 2025) program, employing a Fold Change ≥ 2 and a false discovery rate (FDR) < 0.01 as the screening criteria for differentially expressed genes (DEGs) [44].
Enrichment analysis was performed using the hypergeometric test method within the Cluster Profiler (v4.0; https://bioconductor.org/packages/clusterProfiler/, accessed on 24 October 2025) software package. Functional annotation of all expressed genes was carried out using the Gene Ontology (GO) and Kyoto Encyclopedia of Genes and Genomes (KEGG) databases, identifying significant GO terms and KEGG pathways. p-values were adjusted using the Benjamini–Hochberg method to control the false discovery rate (FDR < 0.05).
Based on the pearl millet genome annotation file, PlantTFDB (v5.0) was utilized to predict transcription factors (TFs) for all differentially expressed genes (DEGs) [45]. All predicted TFs and DEGs involved in phenylpropanoid and flavonoid biosynthesis pathways were selected for constructing a Protein–Protein Interaction (PPI) network. Target gene protein sequences were aligned against the Oryza sativa (japonica cultivar-group) reference protein database using BLAST+ (v2.18.1; https://blast.ncbi.nlm.nih.gov/), with an E-value ≤ 1 × 10⁻¹⁰ and a coverage of ≥99% (1678/1690) [46]. The STRING database (v12.0; https://string-db.org/) was used to predict protein–protein interactions among homologous proteins in Oryza sativa. Significant interaction pairs were screened and visualized using Cytoscape (v3.10.3; https://cytoscape.org/) software [47,48].

3. Results

3.1. Transcriptome Sequencing Overview and Global Response Characteristics

We subjected “ICMV-IS 88102” to six abiotic stresses: CdCl2, NaCl, PEG, WL, Heat and Cold. Root and leaf tissues collected 24 h post-treatment underwent transcriptome sequencing. Including the control group, a total of 42 RNA-seq libraries were constructed. Each library yielded between 40 and 60 million clean reads, with the Q30 base percentage for all samples being no less than 94.15% (Table S3). Statistical analysis of the alignment results indicated that the alignment efficiency of clean reads to the corresponding reference genome sequences ranged from 80.77% to 88.25%. A total of 49,412 expressed genes were detected across the 42 samples, comprising 12,134 novel genes annotated through de novo assembly and 37,278 genes annotated based on the reference genome.
Principal component analysis (PCA) revealed overall differences and clustering patterns among samples, with the first three principal components explaining 64.5% of the total variance (PC1 = 39.6%, PC2 = 14.9%, PC3 = 10%) (Figure 1A). Hierarchical clustering based on Pearson correlation analysis not only confirmed the suitability of the sequencing data for subsequent RNA-seq analysis but also clearly divided all 14 samples into two major clusters: roots and leaves. This further validated the findings from PCA, indicating that the organs were the primary source of variation and that stress treatments induced segregation within the organs (Figure 1B). Hierarchical clustering analysis of DEGs identified across all treatment groups revealed that biological triplicates from each treatment clustered tightly together. The red area, representing higher DEG expression in roots, was nearly twice that observed in leaves (Figure 1C). Quantitative analysis of DEGs indicated a total of 34,632 cumulative DEGs in roots (17,298 upregulated and 17,334 down-regulated) and 30,577 cumulative DEGs in leaves (16,766 upregulated and 13,811 down-regulated) across all stress treatments (Figure 1D). Collectively, Figure 1C,D suggest that roots exhibit greater sensitivity to stress.

3.2. Differential Expression Gene Analysis

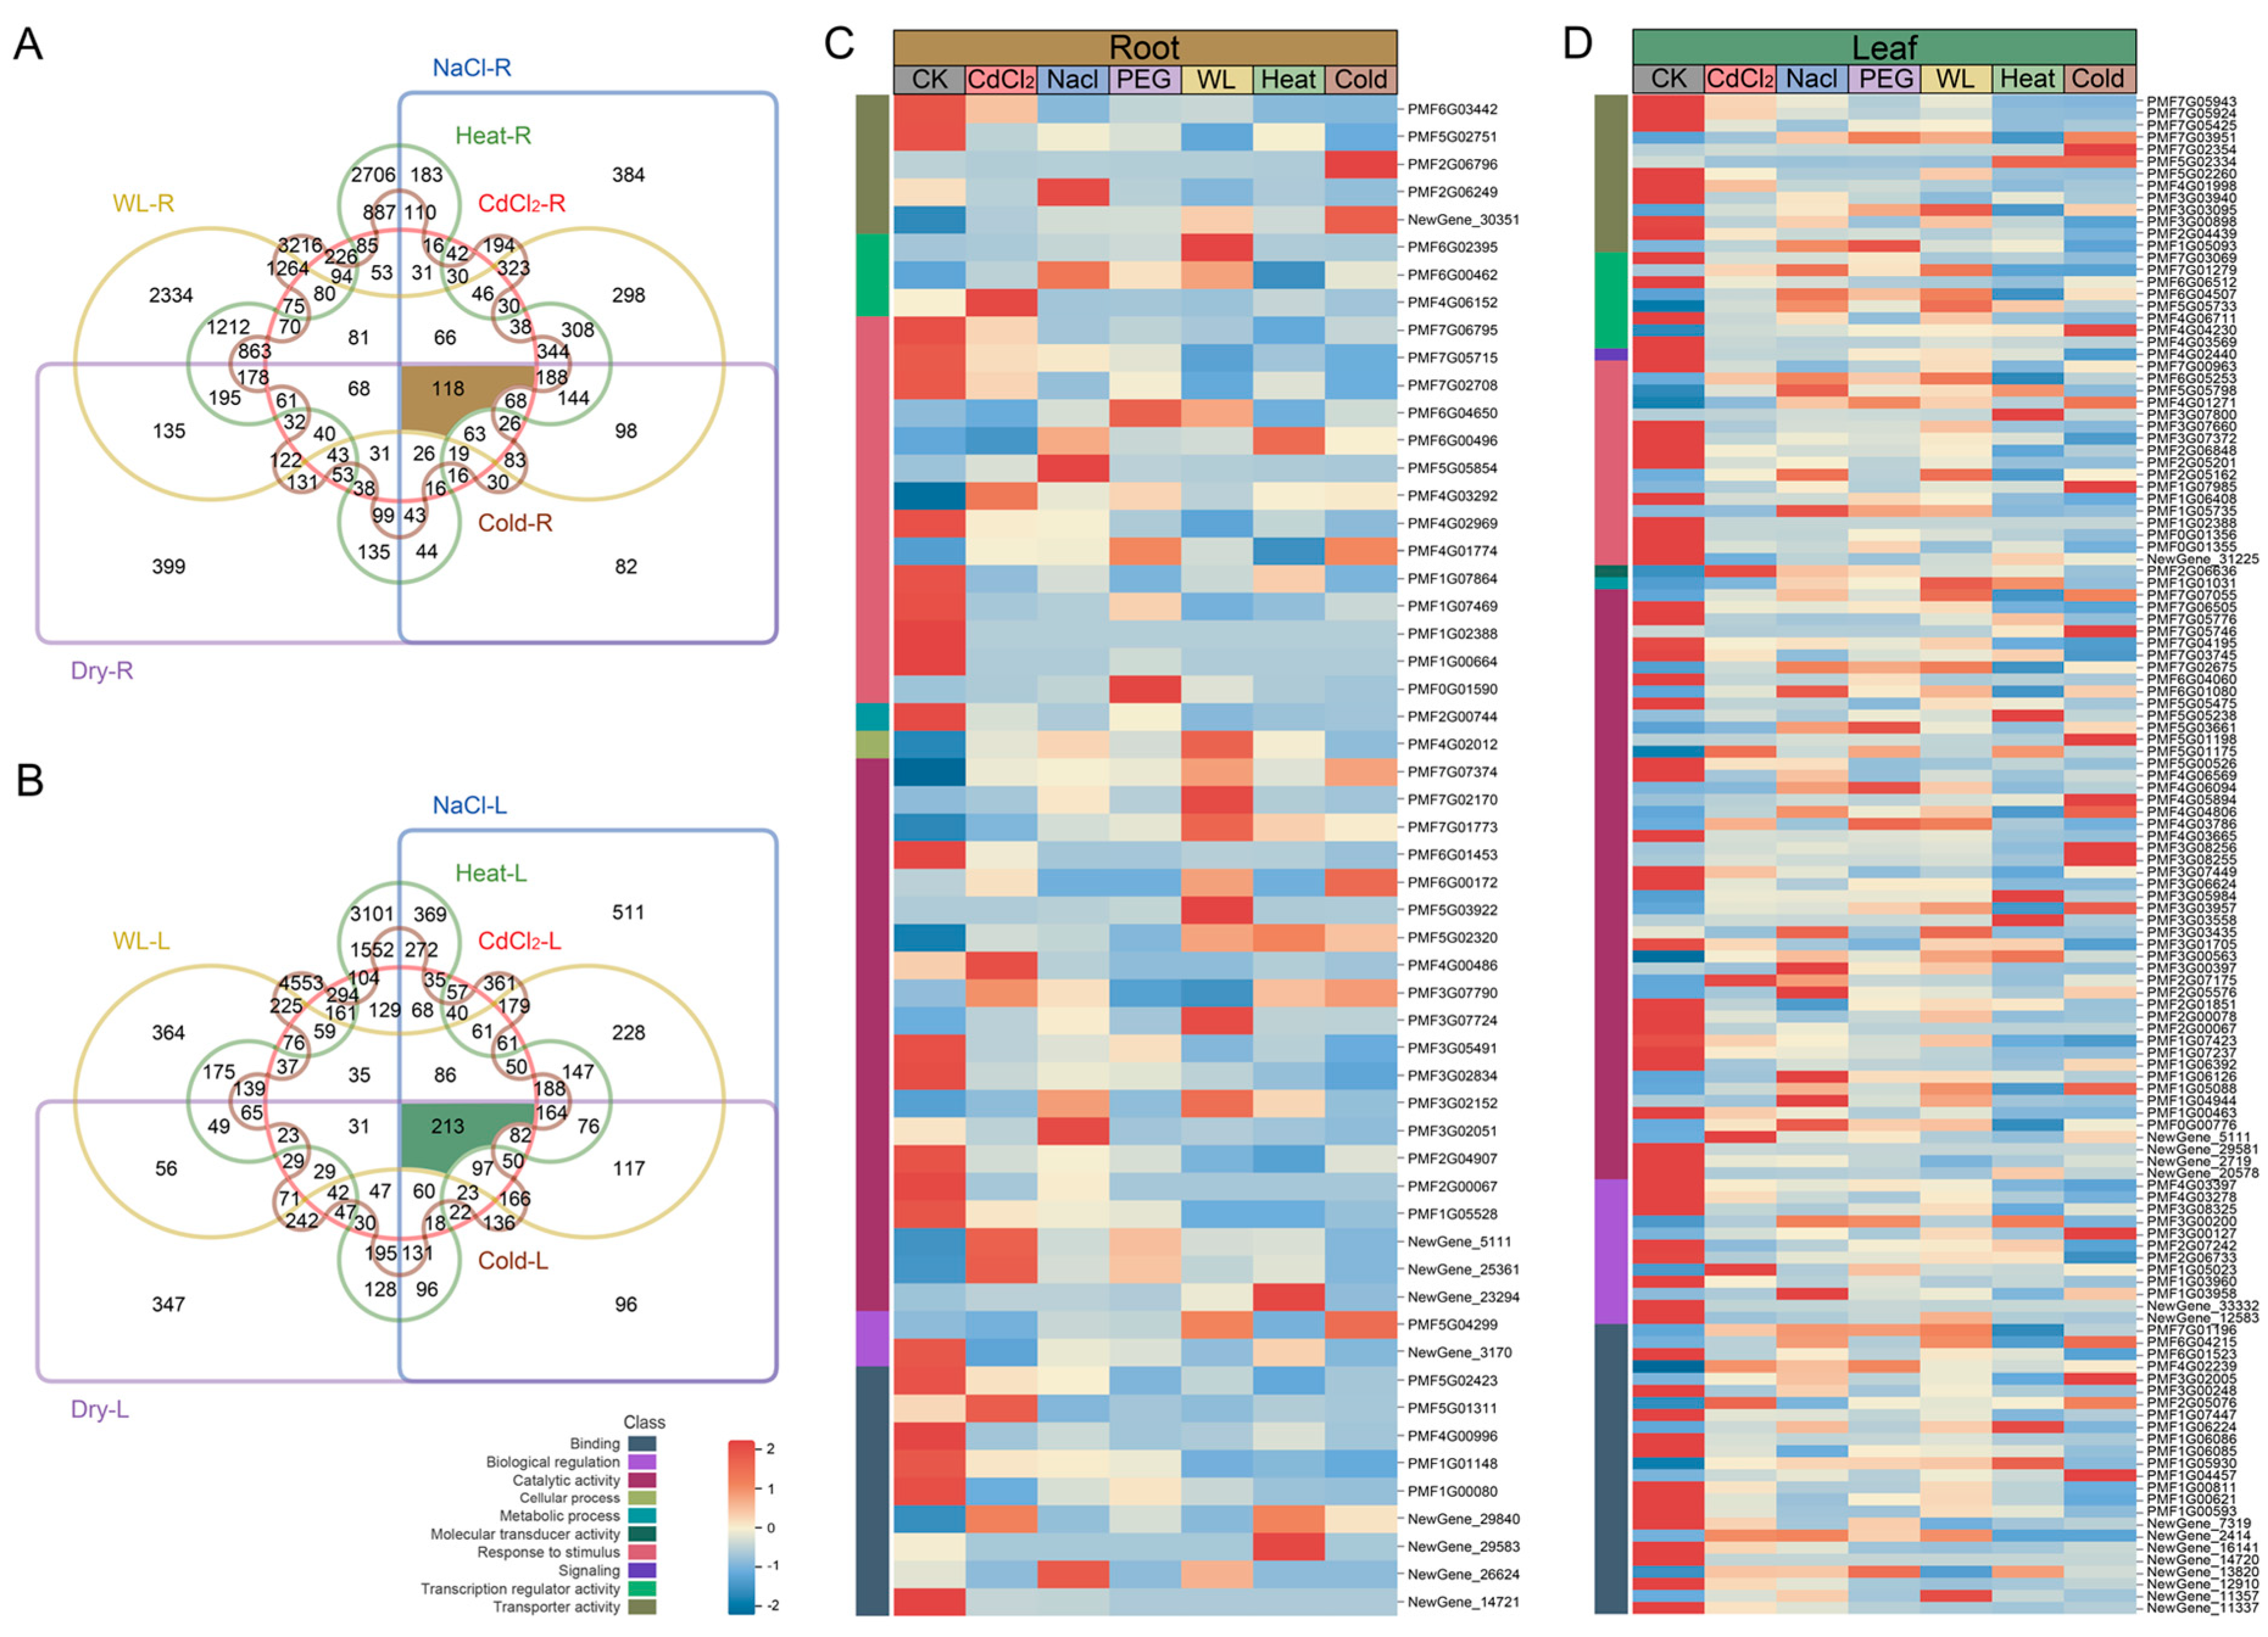
To reveal shared and organ-specific DEGs in response to stress, Venn diagrams were employed to analyze DEGs in both roots and leaves. Pairwise comparisons between the control and six stress treatments indicated that leaves exhibited a greater number of responding genes (213) compared to roots (118) (Figure 2A,B). The DEGs common across various stress conditions were selected based on the same criteria applied to those identified under individual stressors, specifically a Fold Change ≥ 2 and FOR < 0.01. Notably, only 5.08% of DEGs (16 genes) demonstrated co-differential expression in both roots and leaves, highlighting a significant degree of organ-specific responses (Table S4). Furthermore, Upset analysis revealed that when distinguishing between upregulation and downregulation, roots shared 30 genes that were co-upregulated and 58 genes that were co-downregulated across all six stresses. In comparison, leaves shared 54 genes that were co-upregulated and 122 genes that were co-downregulated (Figure S2).
To elucidate the functional characteristics and biological significance of the co-expressed DEGs, we mapped them to GO second-level annotations and generated classification heat maps that integrated expression levels (Figure 2C,D). The results revealed that in both roots and leaves, the majority of shared DEGs were significantly enriched in catalytic activity (GO:0003824), response to stimulus (GO:0050896), binding (GO:0005488), transporter activity (GO:0005215), and transcription regulator activity (GO:0140110). Among the DEGs shared by roots, the proportions of entries related to catalytic activity and response to stimulus were higher (61.82%) compared to those in leaves. Conversely, while leaves exhibited a greater number of total shared DEGs, these genes were more prominently involved in binding and transporter activity. Although leaves contained a higher total number of shared DEGs, subsequent analysis revealed that the DEGs shared in roots were more concentrated in core defense pathways, such as phenylpropanoid biosynthesis and flavonoid biosynthesis. In contrast, the DEGs shared by leaves displayed a more dispersed pattern of KEGG pathway enrichment. This finding suggests that roots exhibit a pathway-concentrated defense strategy under various stresses, while leaves employ a more diversified regulatory network, achieving stress adaptation through broader gene participation.

3.3. Enrichment Analysis Based on DEGs

We conducted an enrichment analysis of DEGs utilizing the GO and KEGG databases to elucidate the regulatory mechanisms governing gene expression in P. glaucum seedlings subjected to various abiotic stresses (Tables S5 and S6). The analysis primarily revealed organ-conserved stress response pathways and identified shared key biological processes.
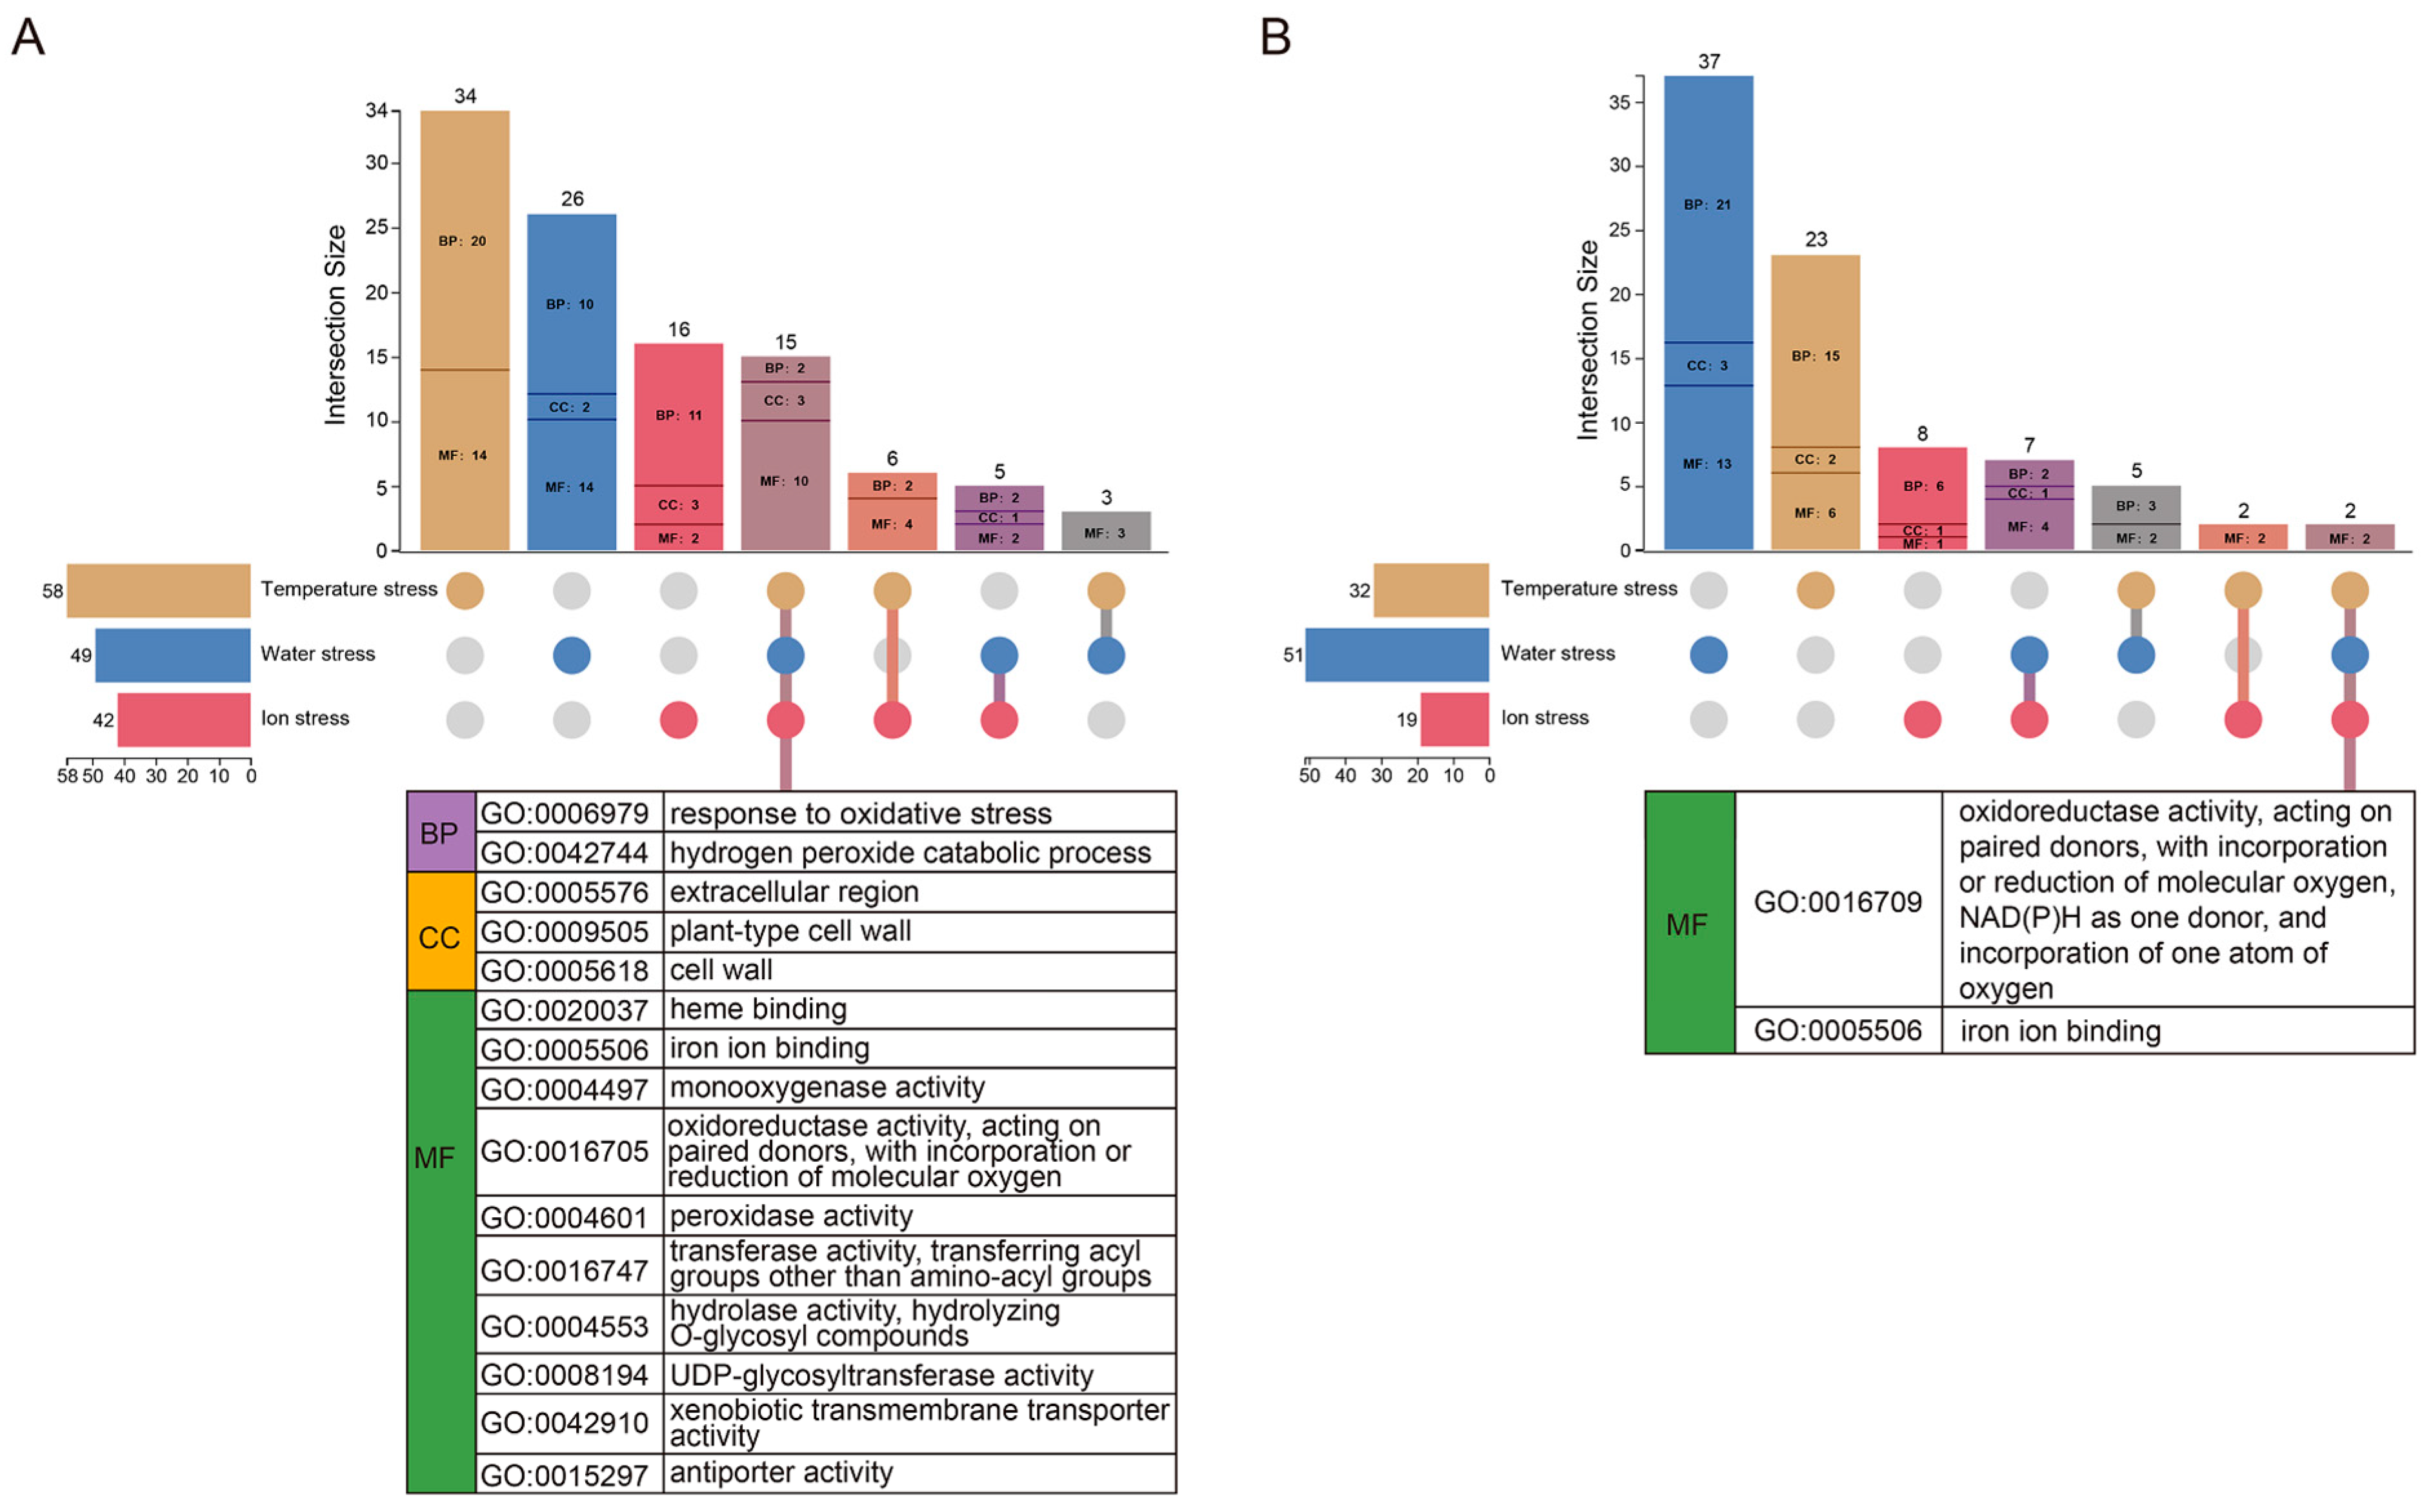
GO enrichment analysis revealed distinct stress responses between root and leaf organs under various stresses (Figure 3). By focusing on shared GO terms across homologous treatment groups (Lon stress: CdCl2 or NaCl; Water stress: PEG or WL; Temperature stress: Heat or Cold), we identified six stress-coactivated terms in roots: response to oxidative stress (GO:0006979), hydrogen peroxide catabolic process (GO:0042744), plant-type cell wall (GO:0009505), cell wall (GO:0005618), peroxidase activity (GO:0004601), monooxygenase activity (GO:0004497), and xenobiotic transmembrane transporter activity (GO:0042910), totaling 15 entries. These functions are closely related to ROS scavenging and cell wall remodeling, suggesting that roots achieve broad-spectrum stress resistance through conserved oxidative defense and structural reinforcement. In contrast, leaves exhibited only two commonly activated entries across six stresses: NAD(P)H-dependent oxygenase activity (GO:0016709) and iron ion binding (GO:0005506). This indicates that the common responses of leaves to multiple stresses may focus more on specific types of redox regulatory processes, contrasting sharply with the systemic defense observed in roots. Furthermore, comparisons among similar stresses revealed that root-specific GO entries under ionic stress relate to detoxification mechanisms, while water stress emphasizes redox homeostasis and temperature stress involves microbial symbiosis and host interactions (Figure S3). In leaves, ionic stress specifically activates hormone signaling entries, water stress correlates with carbohydrate metabolism processes, and temperature stress enriches plastid transcription and RNA processing.
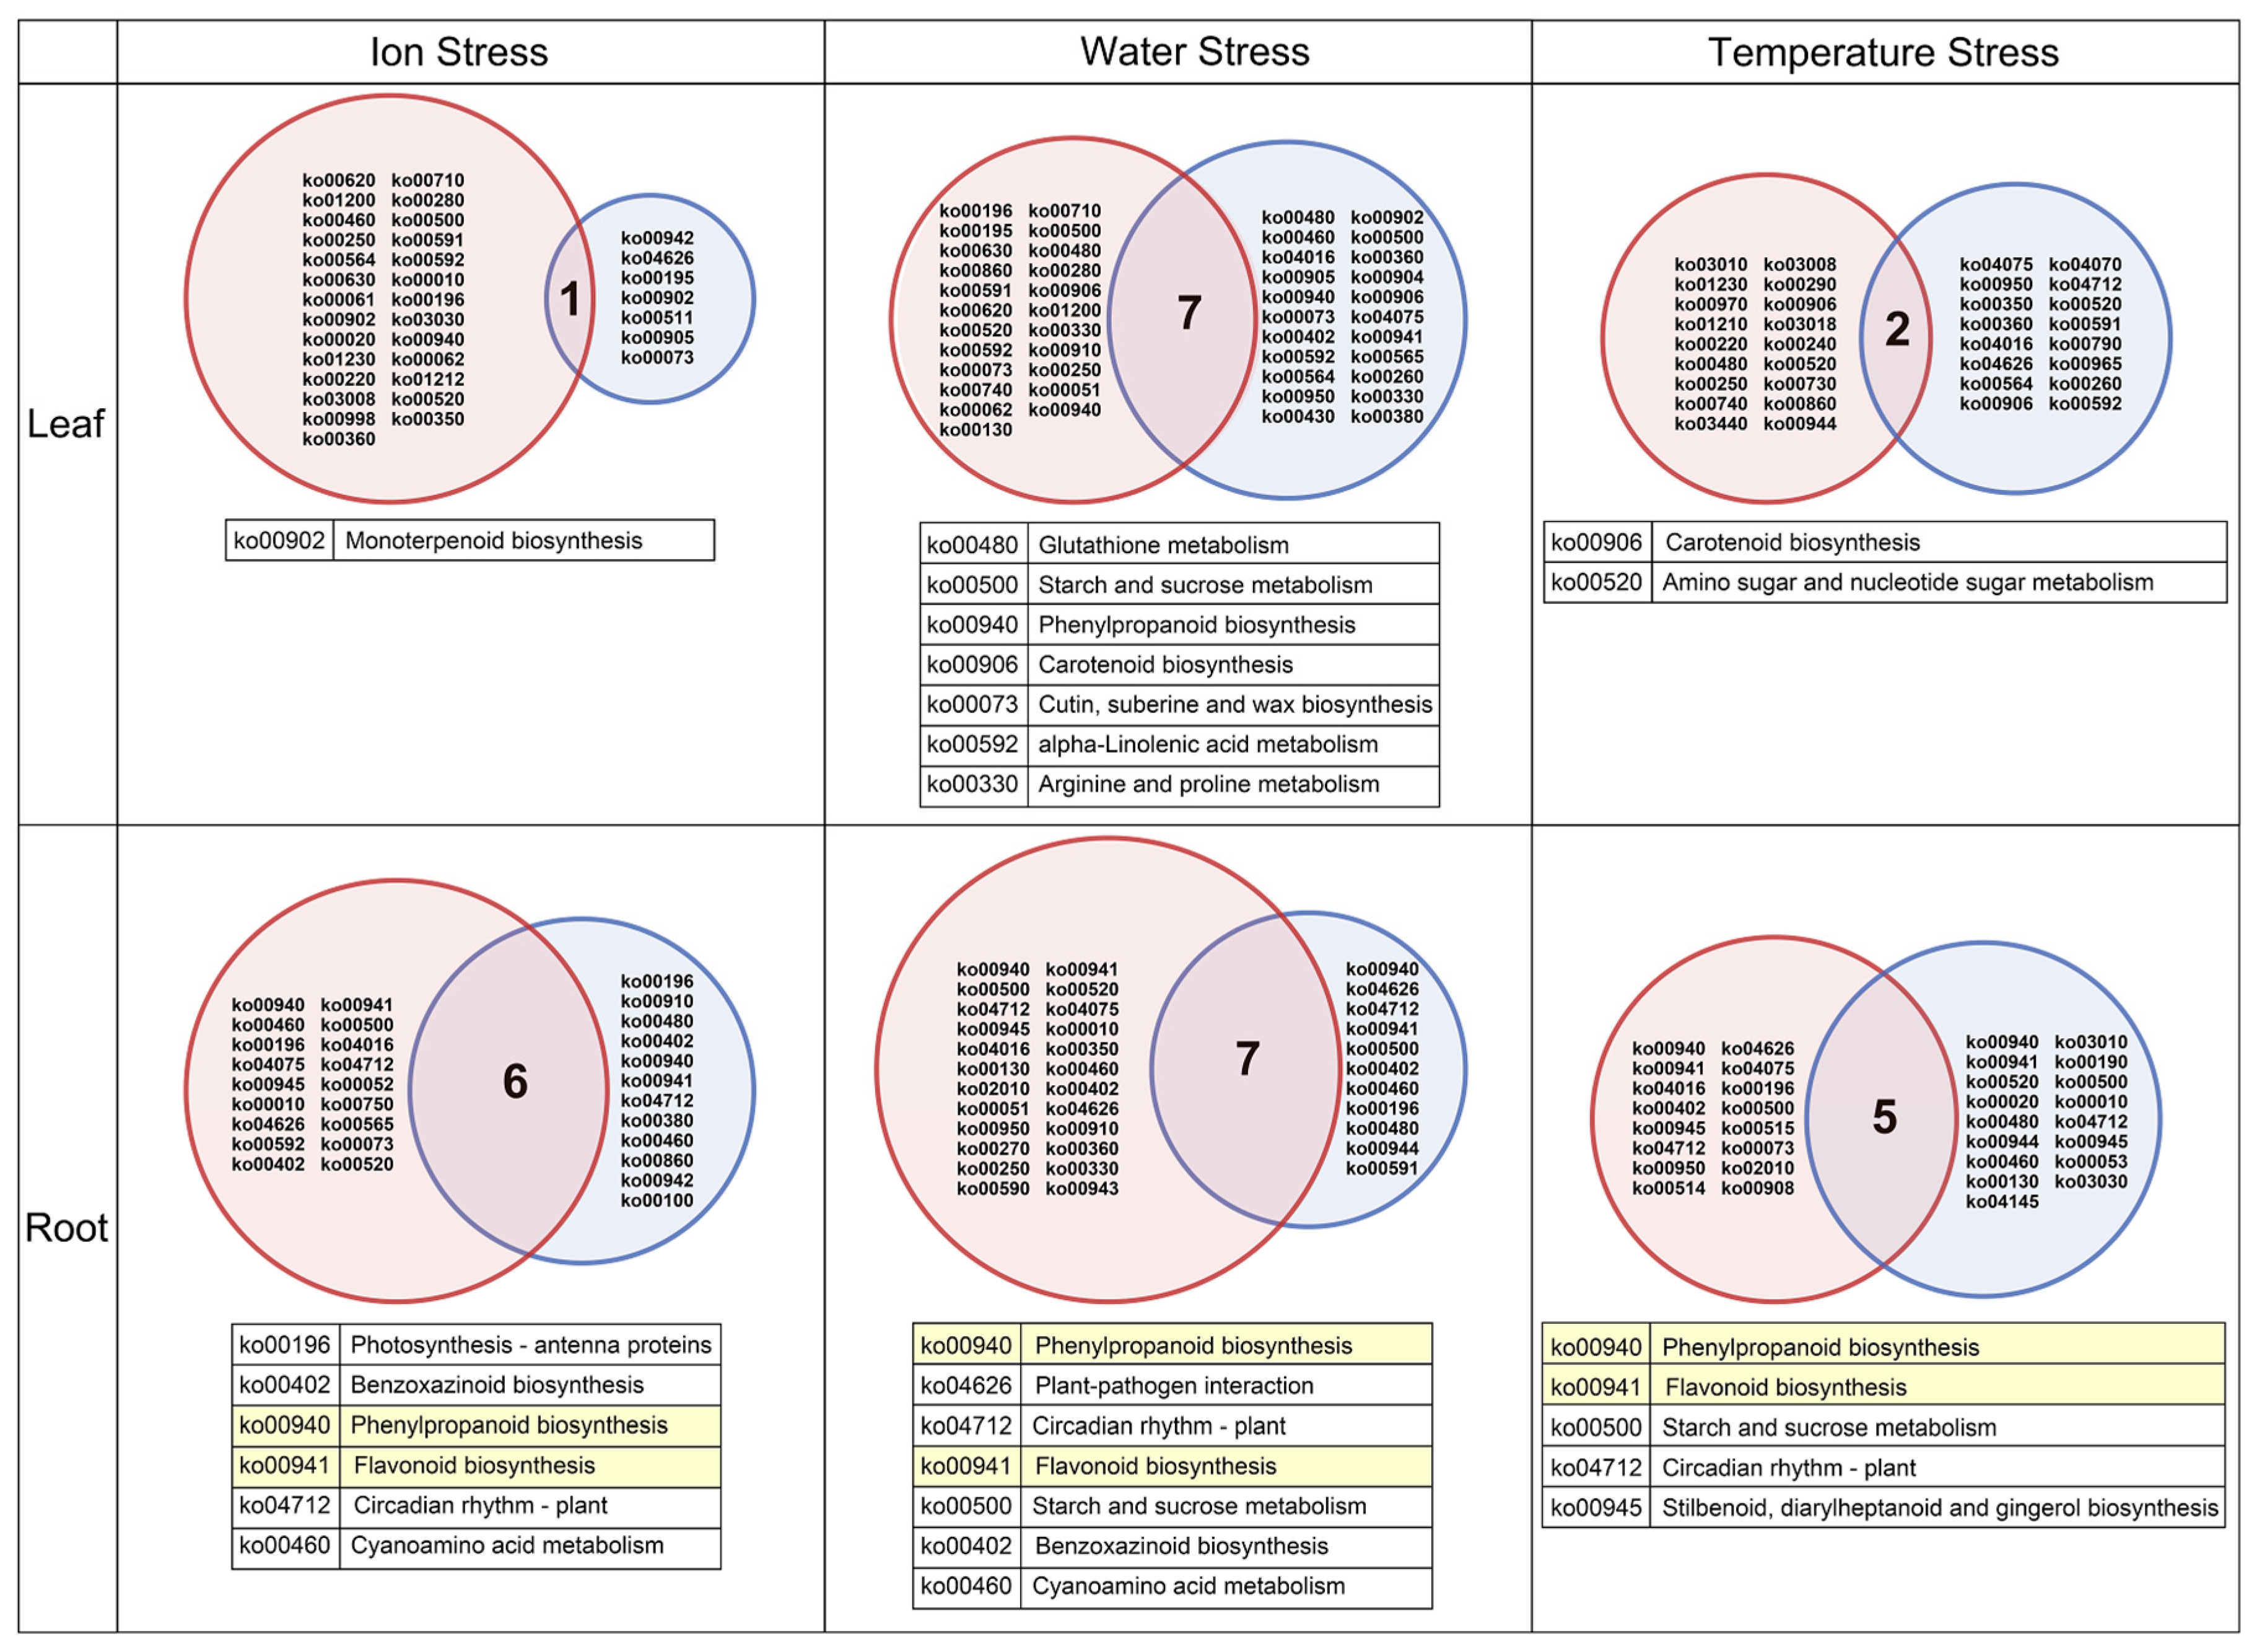
KEGG pathway enrichment analysis further revealed conserved stress response mechanisms at the metabolic pathway level (Figure 4). The most critical finding was that the phenylpropanoid biosynthesis (ko00940) and flavonoid biosynthesis (ko00941) pathways exhibited significant enrichment in roots across all six abiotic stresses. The p-value range for the enrichment of the phenylpropanoid biosynthesis pathway under all root stresses was from 1.53 × 10⁻²¹ to 4.48 × 10⁴, while the range for the flavonoid biosynthesis pathway was from 1.63 × 10⁻¹¹ to 6.67 × 10⁴ (detailed enrichment p-values and adjusted p-values for each stress are provided in Table S6). This result suggests that phenylpropanoids and flavonoids may function as “universal defense mechanisms” for roots against multiple environmental stresses. Their antioxidant and lignification functions align with the shared root responses to oxidative stress and plant-type cell wall component identified in the GO analysis. Leaf responses exhibited stress-type specificity, with only carotenoid biosynthesis (KO00906) co-enriched under both water and temperature stress. This indicates that leaves maintain photosynthetic stability under these four stresses by enhancing carotenoid-mediated photoprotection mechanisms. Additionally, we note the significant enrichment of the starch and sucrose metabolism (ko00500) pathway in roots and leaves under water stress, as well as in roots under temperature stress. This highlights its fundamental role in plant adaptation to water and temperature stress.

3.4. Analysis of Phenylpropanoid and Flavonoid Biosynthesis Pathways in Roots

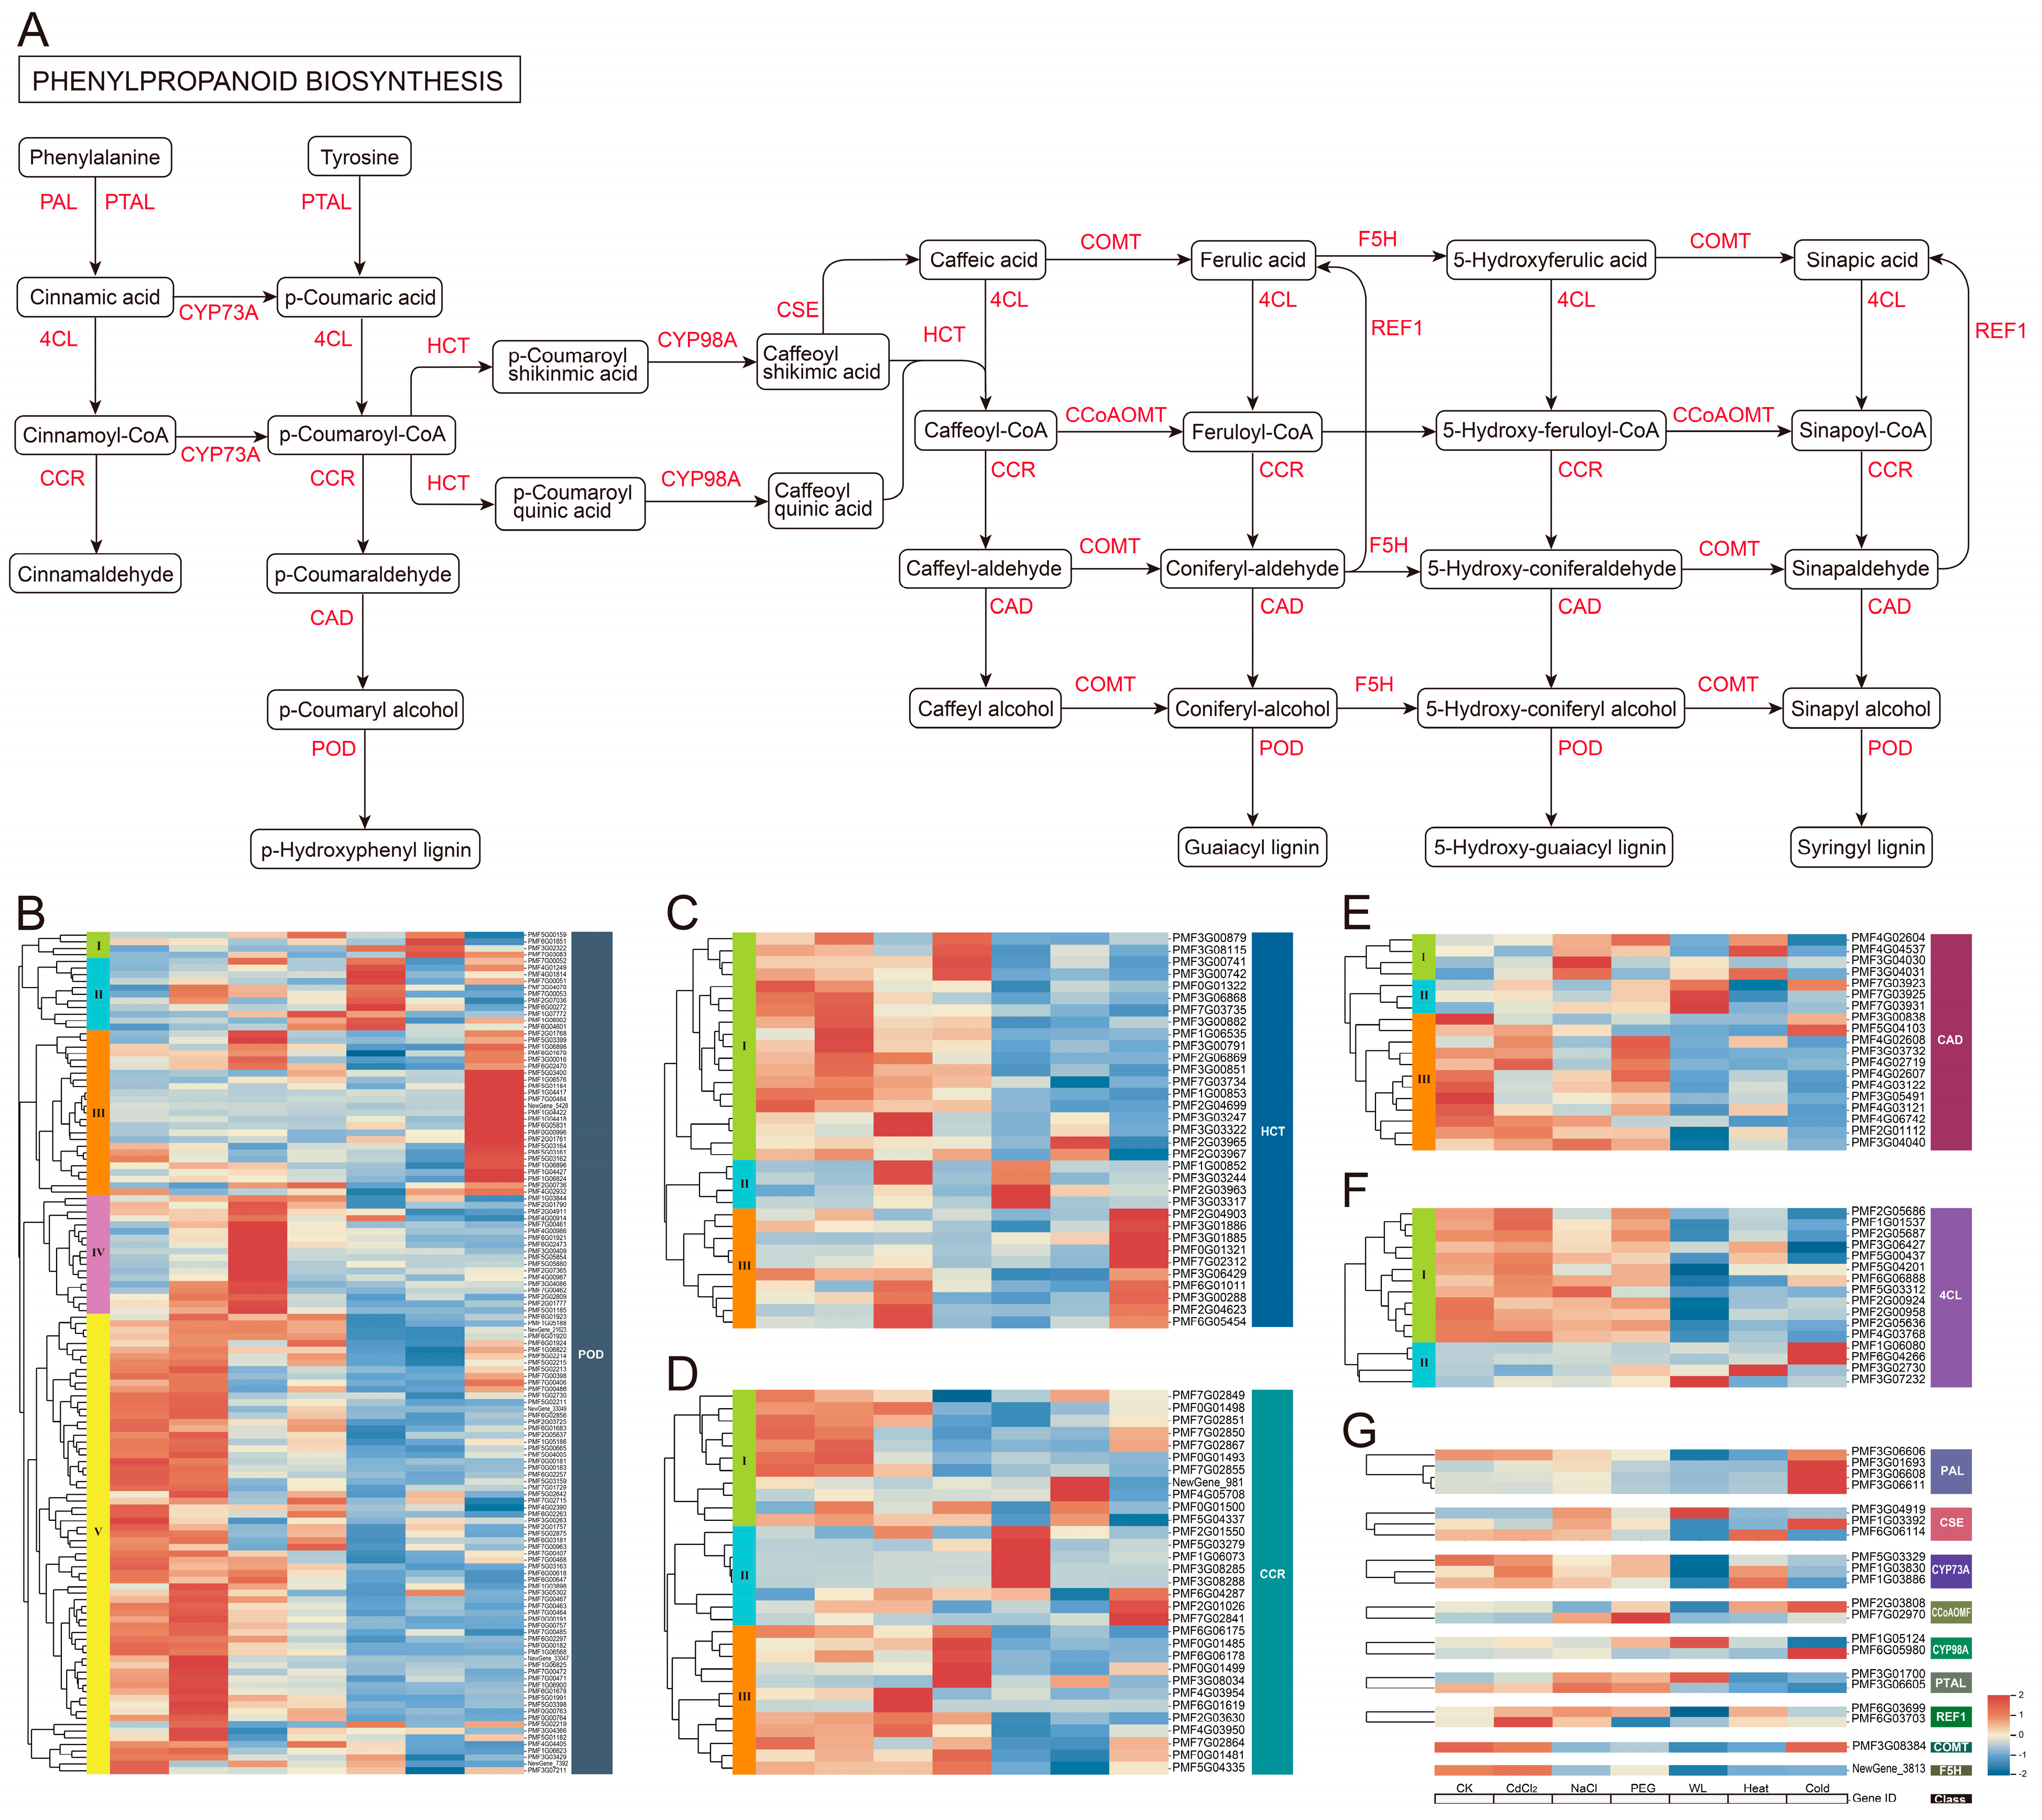
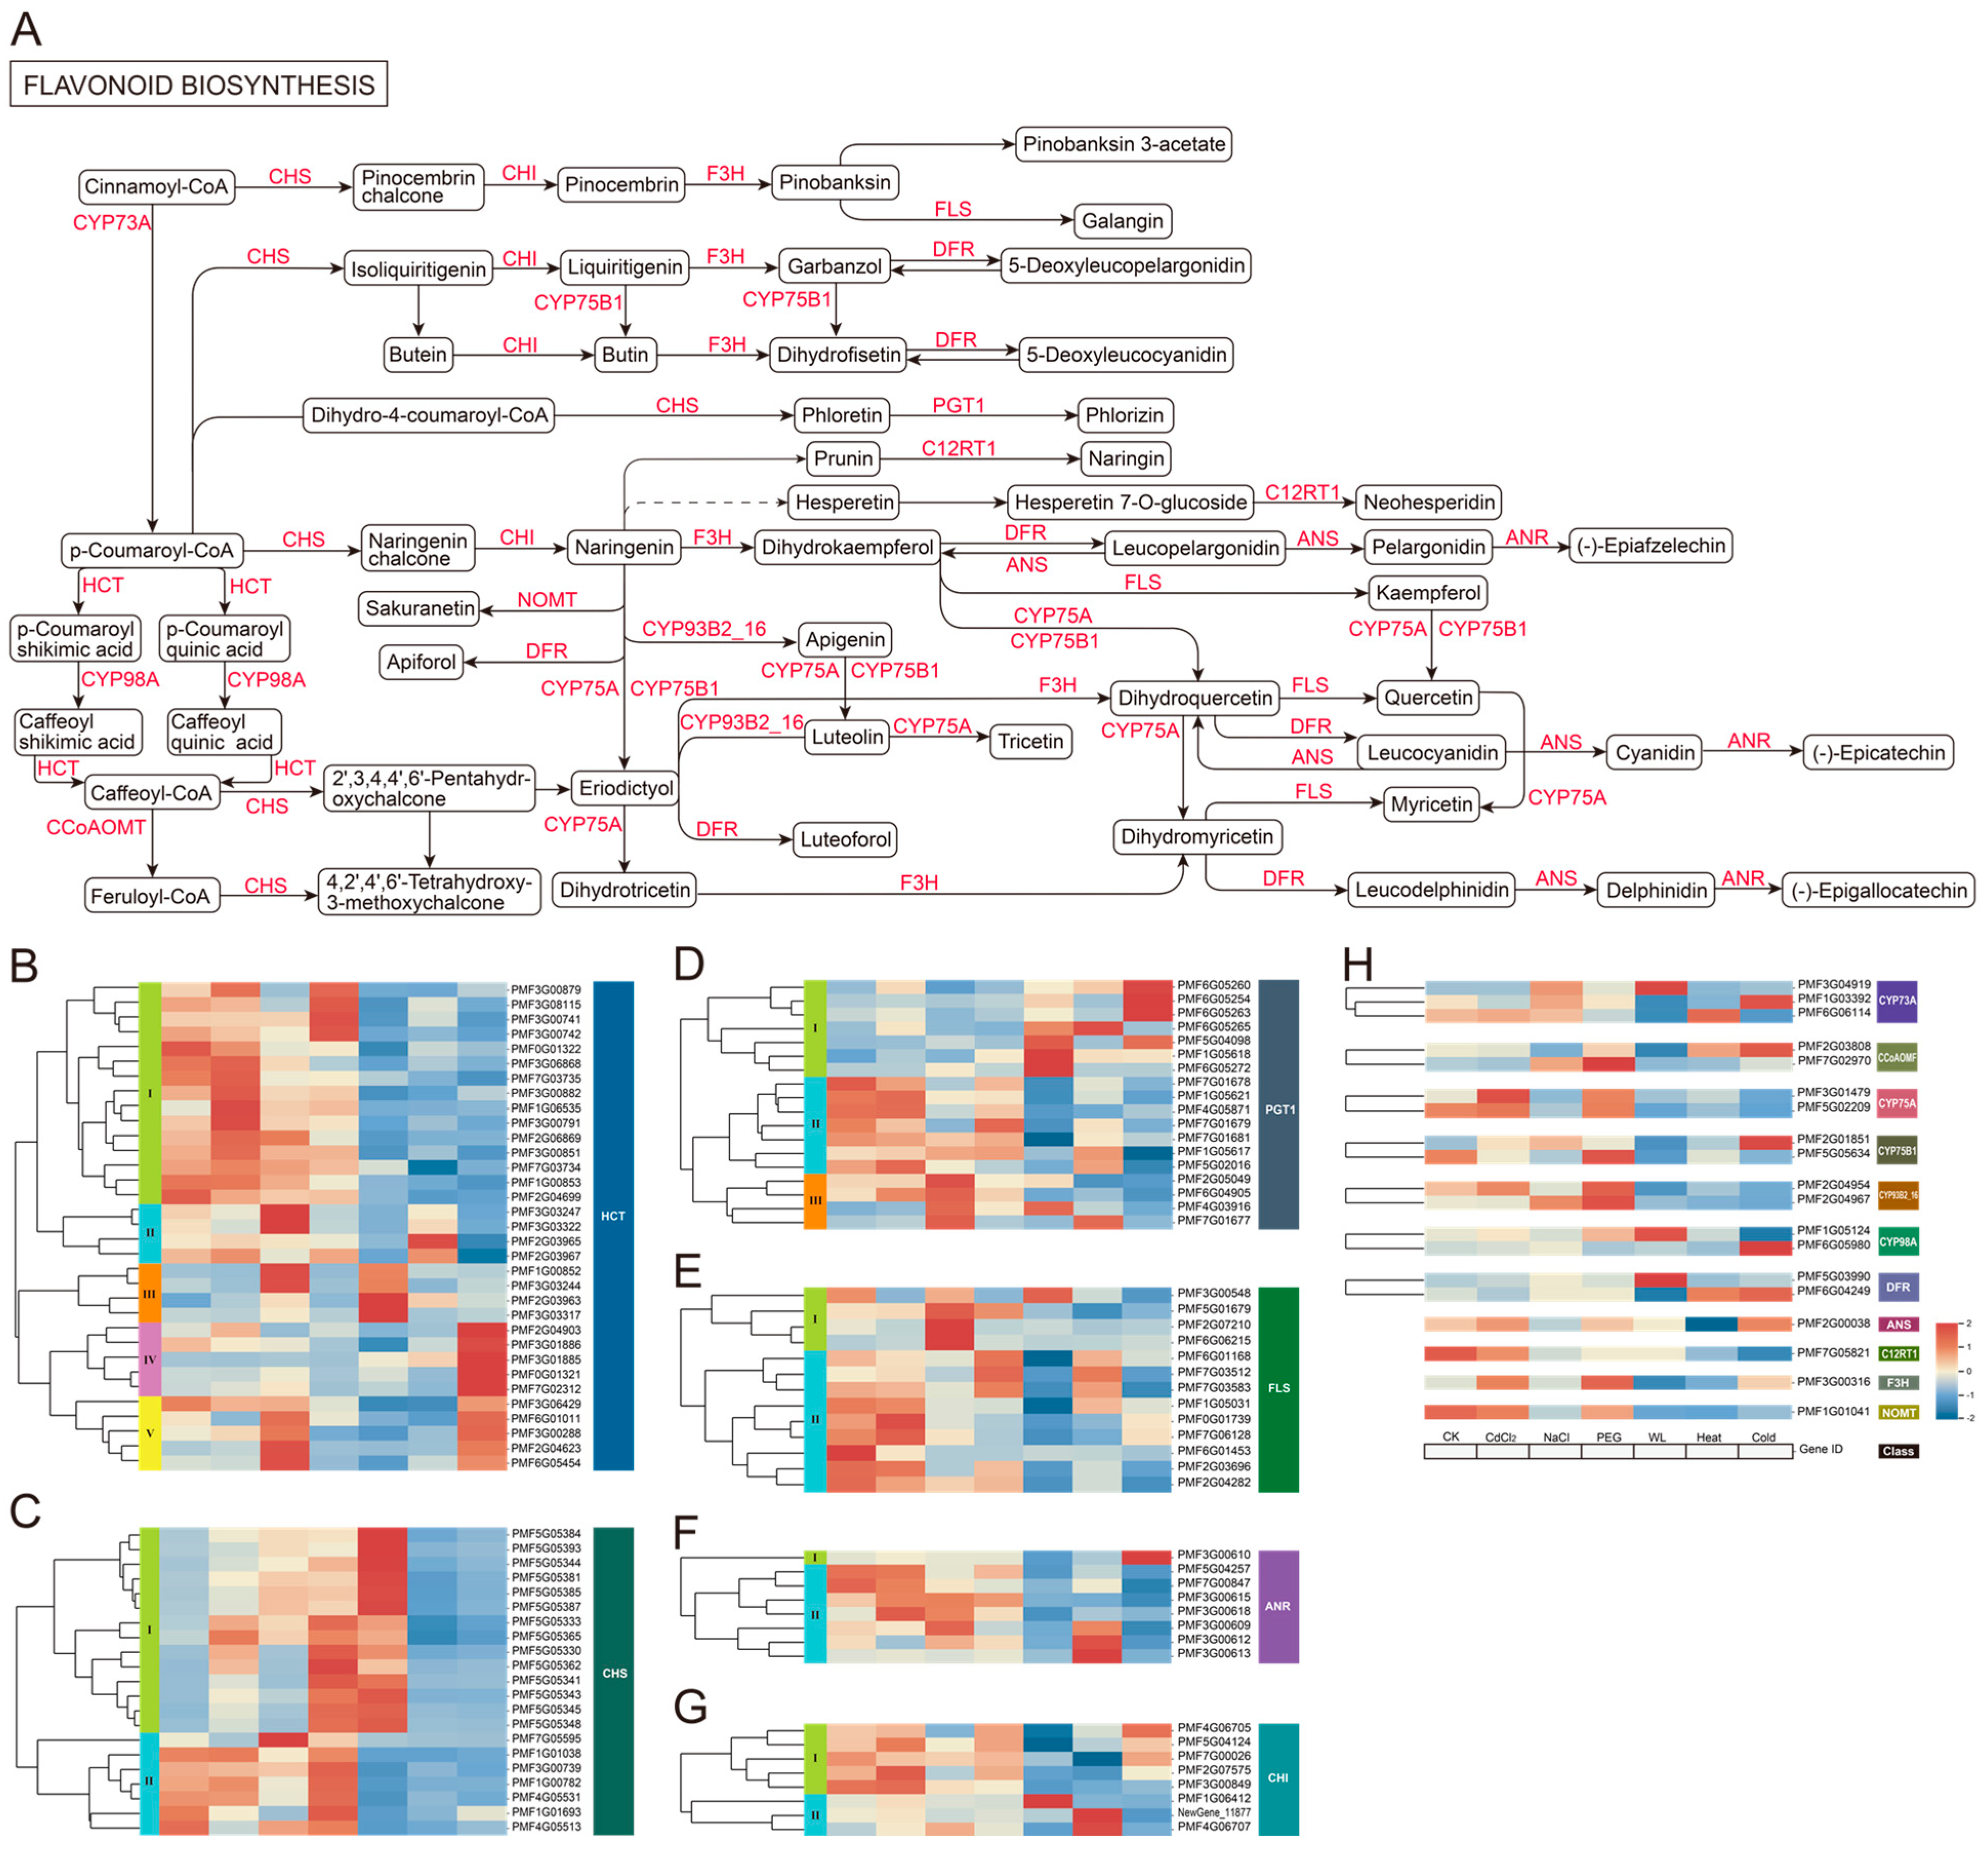
To investigate the specific regulatory patterns of phenylpropanoid and flavonoid biosynthesis pathways in roots under different stresses, we visualized pathway diagrams and integrated heatmaps of differentially expressed genes across treatments (Figure 5 and Figure 6). In the phenylpropanoid biosynthesis pathway, DEGs were primarily concentrated in peroxidase (POD), shikimate O-hydroxycinnamoyltransferase (HCT), cinnamoyl-CoA reductase (CCR), cinnamyl-alcohol dehydrogenase (CAD), 4-coumarate-CoA ligase (4CL), and phenylalanine ammonia-lyase (PAL). These genes exhibited specific responses to each stress (Figure 5A). Notably, POD, HCT, CCR, and CAD displayed differentially expressed genes across all six stress conditions, suggesting that the genes involved in lignin monomer synthesis may represent common pathways responding to diverse stresses.
As illustrated in Figure 5, POD, HCT, CCR, CAD, and 4CL represent the five enzyme categories with the highest number of DEGs in the phenylpropanoid biosynthesis pathway (Figure 5B–F). The heatmap clustering results revealed that these enzymes were organized into several clusters, denoted by Roman numerals I–V. Among these, the POD reactions were categorized into five groups: In Group I, 50% (2/4) of the genes were significantly upregulated under Heat stress; all genes (11) in Group II were significantly upregulated under WL stress; 84% (21/25) of the genes in Group III were significantly upregulated under Cold stress; and in Group IV, 77.78% (14/18) of the genes were significantly upregulated under NaCl stress (Figure 5B). As the largest group, comprising 54.69% of total POD genes (70/128), most genes in Group V exhibited an upward trend under CdCl2 stress, but a downward trend under PEG, WL, and Heat stress. Following clustering, the responses of HCT, CCR, CAD, and 4CL were grouped into 3, 3, 3, and 2 clusters, respectively (Figure 5C–F). Notably, Group I (HCT, CCR, 4CL) and Group II (CAD) displayed similar expression patterns, with most genes in these groups showing higher expression levels in the CK but exhibiting inconsistent up- or down-regulation under various stress treatments. In contrast, the other groups of these four enzymes primarily demonstrated lower expression levels in CK treatment and varying degrees of up-regulation under different stress conditions.
The biosynthesis of flavonoids initiates with the conversion of phenylalanine to cinnamic acid, a process catalyzed by PAL. Concurrently, chalcone synthase (CHS) acts as a crucial enzyme catalyzing the initial step in the formation of the flavonoid skeleton. Further analysis indicated that enzymes encoding a significantly higher number of DEGs in the flavonoid biosynthesis pathway included HCT, CHS, phlorizin synthase (PGT1), flavonol synthase (FLS), anthocyanidin reductase (ANR), and chalcone isomerase (CHI). Notably, HCT, CHS, PGT1, and FLS demonstrated differential expression across all six categories of abiotic stress, suggesting that these four enzymes constitute the core framework of the pathway’s response to stress.
We performed clustering based on heat maps, grouping the six enzymes with the highest gene counts into five categories for HCT, two for CHS, three for PGT1, two for FLS, two for ANR, and two for CHI (Figure 6B–G). As illustrated in Figure 6, HCT contained the highest number of DEGs, confirming its pivotal role as a hub in the phenylpropanoid metabolic branching pathway (Figure 6B). Consequently, we subdivided its flavonoid biosynthesis pathway into five more detailed groups for further analysis. Group I constituted the largest proportion, representing 45.45% of total HCT genes (15/33), with 80% (12/15) significantly downregulated under cold stress and 86.67% (13/15) significantly downregulated under both WL and Heat stress. In Group II, 50% (2/4) of genes were significantly downregulated under both WL and Cold stress; in Group III, 50% (2/4) of genes were significantly upregulated under NaCl stress. All genes (5) in Group IV and 80% (4/5) in Group V were significantly upregulated under cold stress. Genes encoding CHS exhibited higher expression levels under PEG stress in both groups, with all genes (14) in Group I were significantly upregulated under both PEG and WL stress (Figure 6C). In contrast, the PGT1, FLS, ANR, and CHI groups demonstrated high specificity across different stress conditions (Figure 6D–G). These results indicate that the expression patterns of key enzyme genes in the phenylpropanoid and flavonoid biosynthetic pathways are significantly associated with different types of stress. Switchgrass employs adaptive strategies for various stresses by specifically modulating the expression levels of key enzyme genes in these two pathways.

3.5. Cluster Analysis of TF Expression Profiles Under Different Stresses

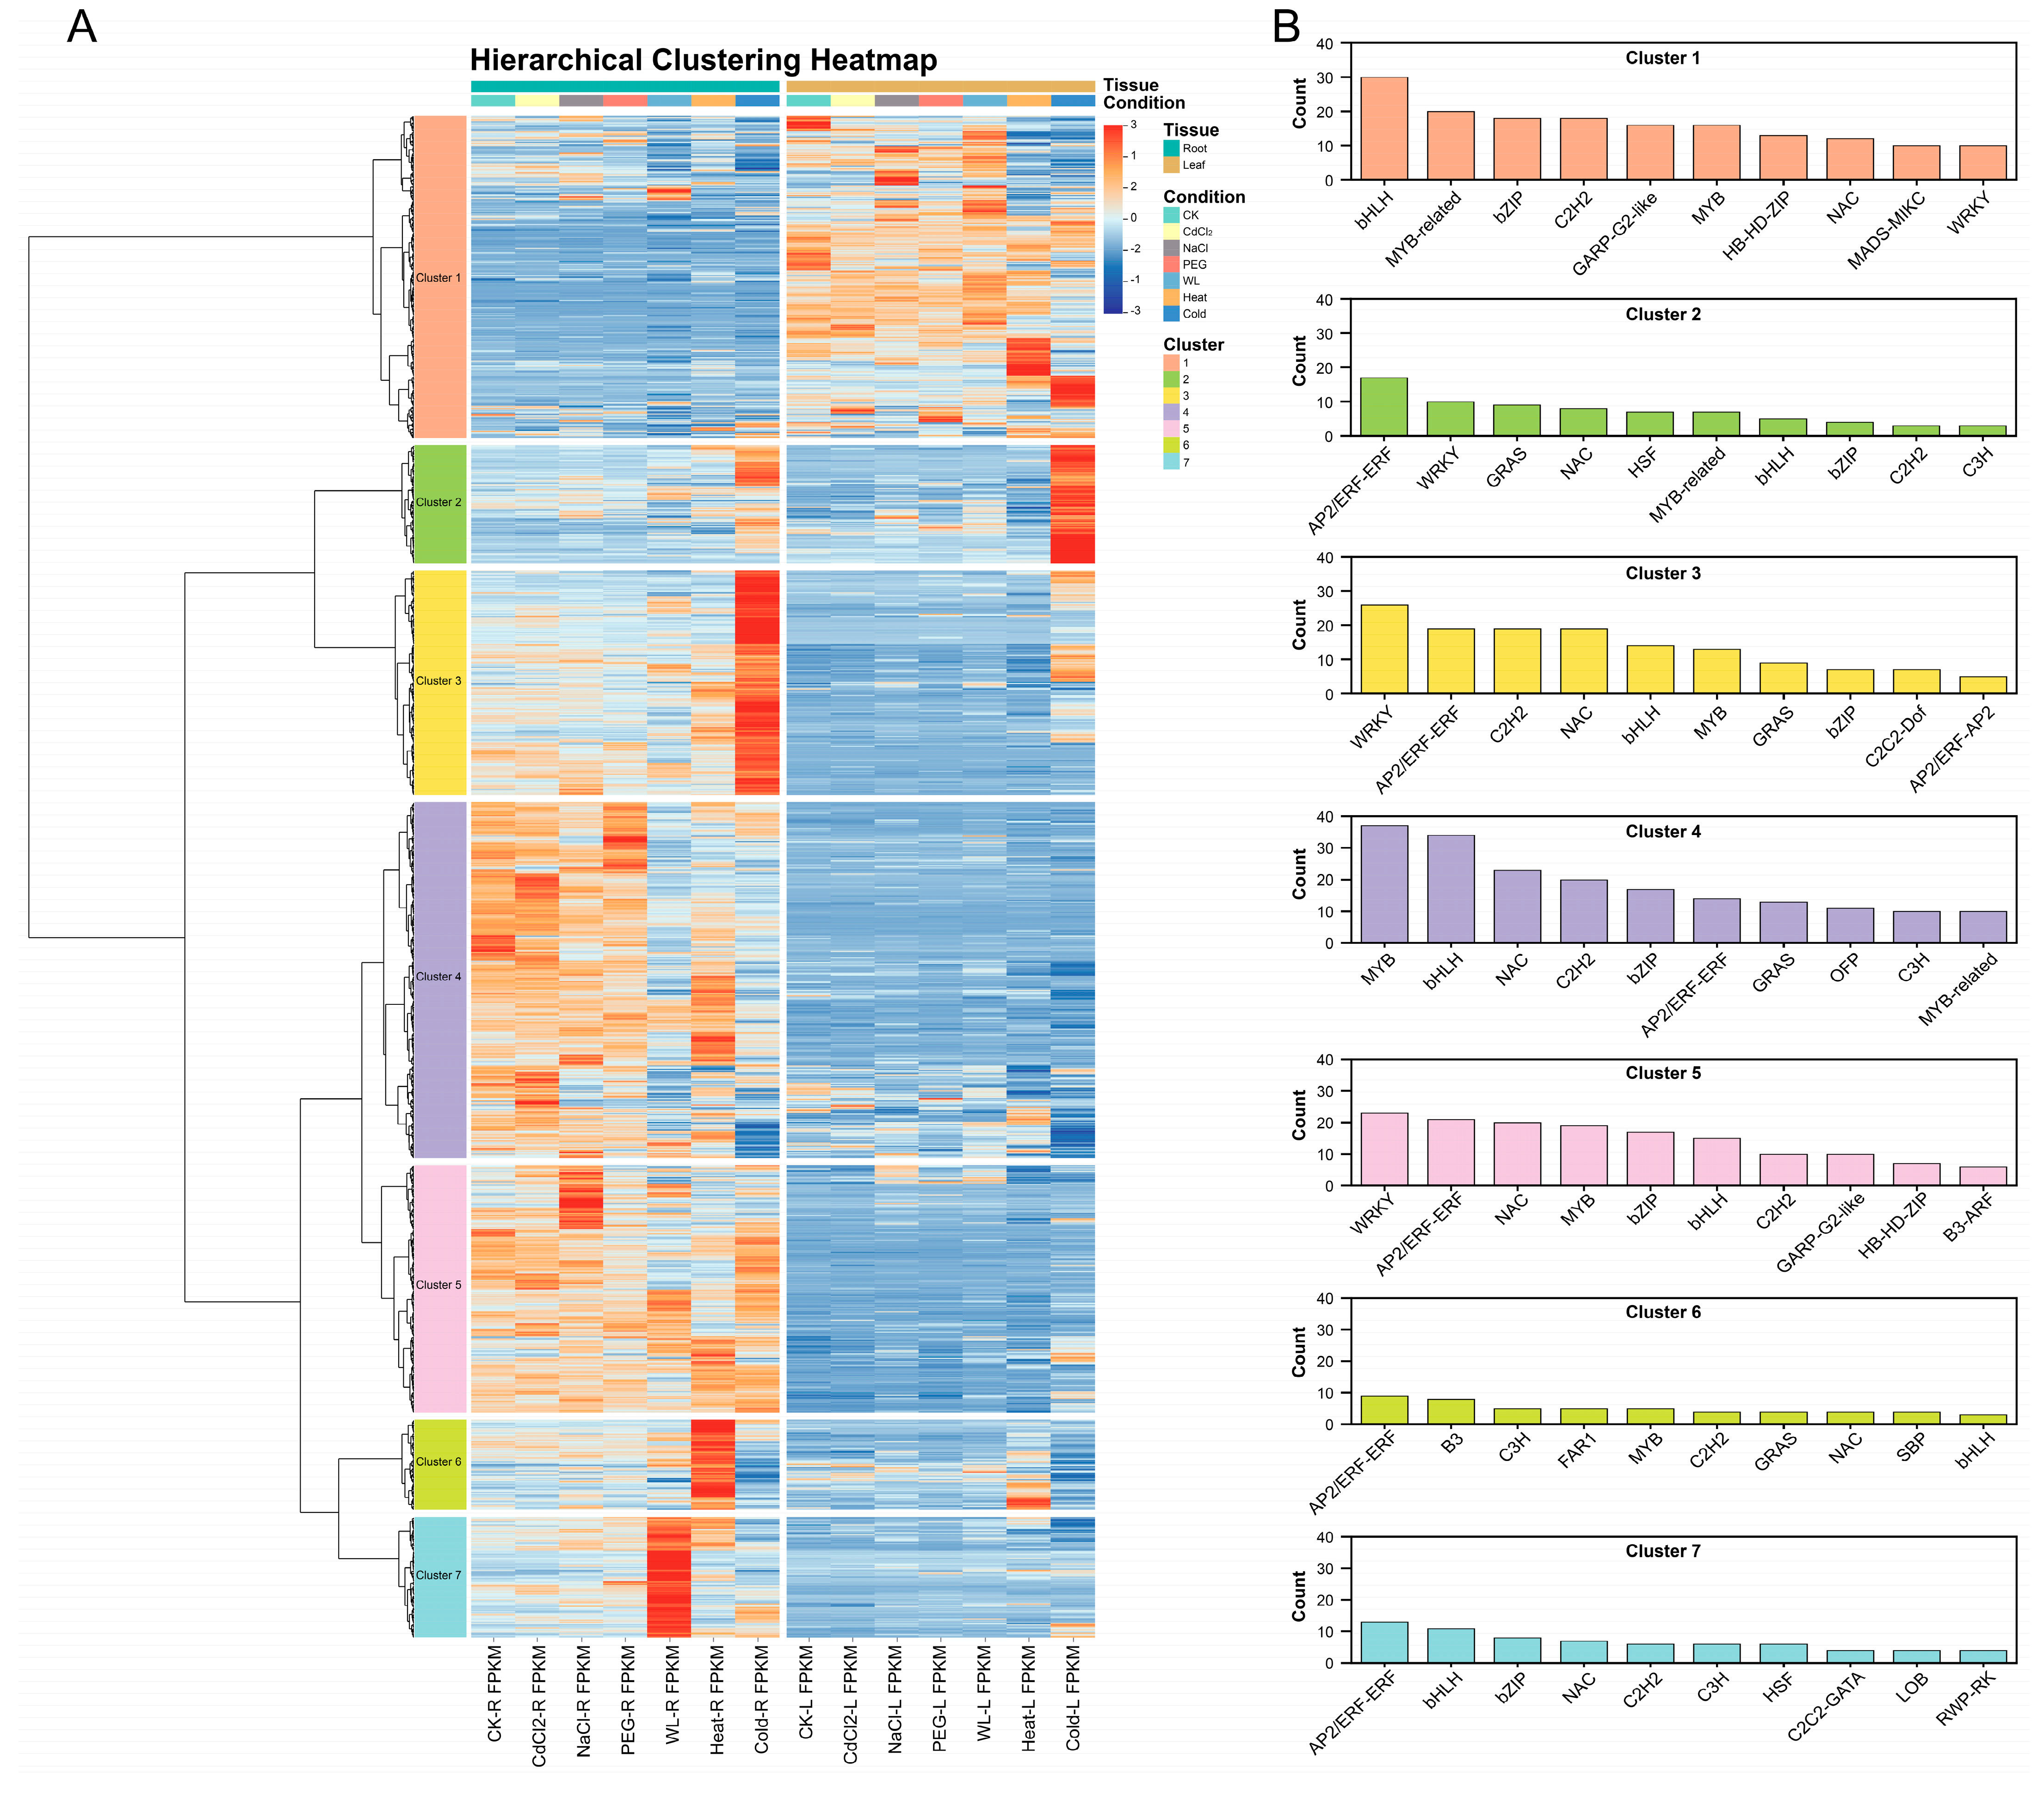
Given the pivotal role of TFs in regulating secondary metabolic pathways, we identified and analyzed all differentially expressed TFs (Table S9). Utilizing the hclust function in R, we performed hierarchical clustering analysis on the expression profiles of 1363 TFs identified in the transcriptome (Figure 7). The clustering results categorized these TFs into seven major expression clusters (Cluster 1–7). Five clusters (Clusters 3–7) exhibited elevated expression under various stress conditions in root tissues, which is consistent with the findings from the global gene expression analysis. This indicates that these differentially expressed TFs may play a role in regulating root responses to various stress mechanisms, particularly those related to phenylpropanoid metabolism. Conversely, genes in the other two clusters (Clusters 1 and 2) demonstrated increased activity under leaf stress conditions. Furthermore, classification and statistical analysis of TF families across clusters revealed that the bHLH, AP2/ERF-ERF, and MYB families constituted the top three TF categories in Clusters 2–7, accounting for 8.05% (77/957), 7.94% (76/957), and 7.94%, respectively, followed by the NAC and WRKY families.

3.6. Interaction Network Analysis of TFs Regulating Phenylpropanoid/Flavonoid Biosynthesis Pathways

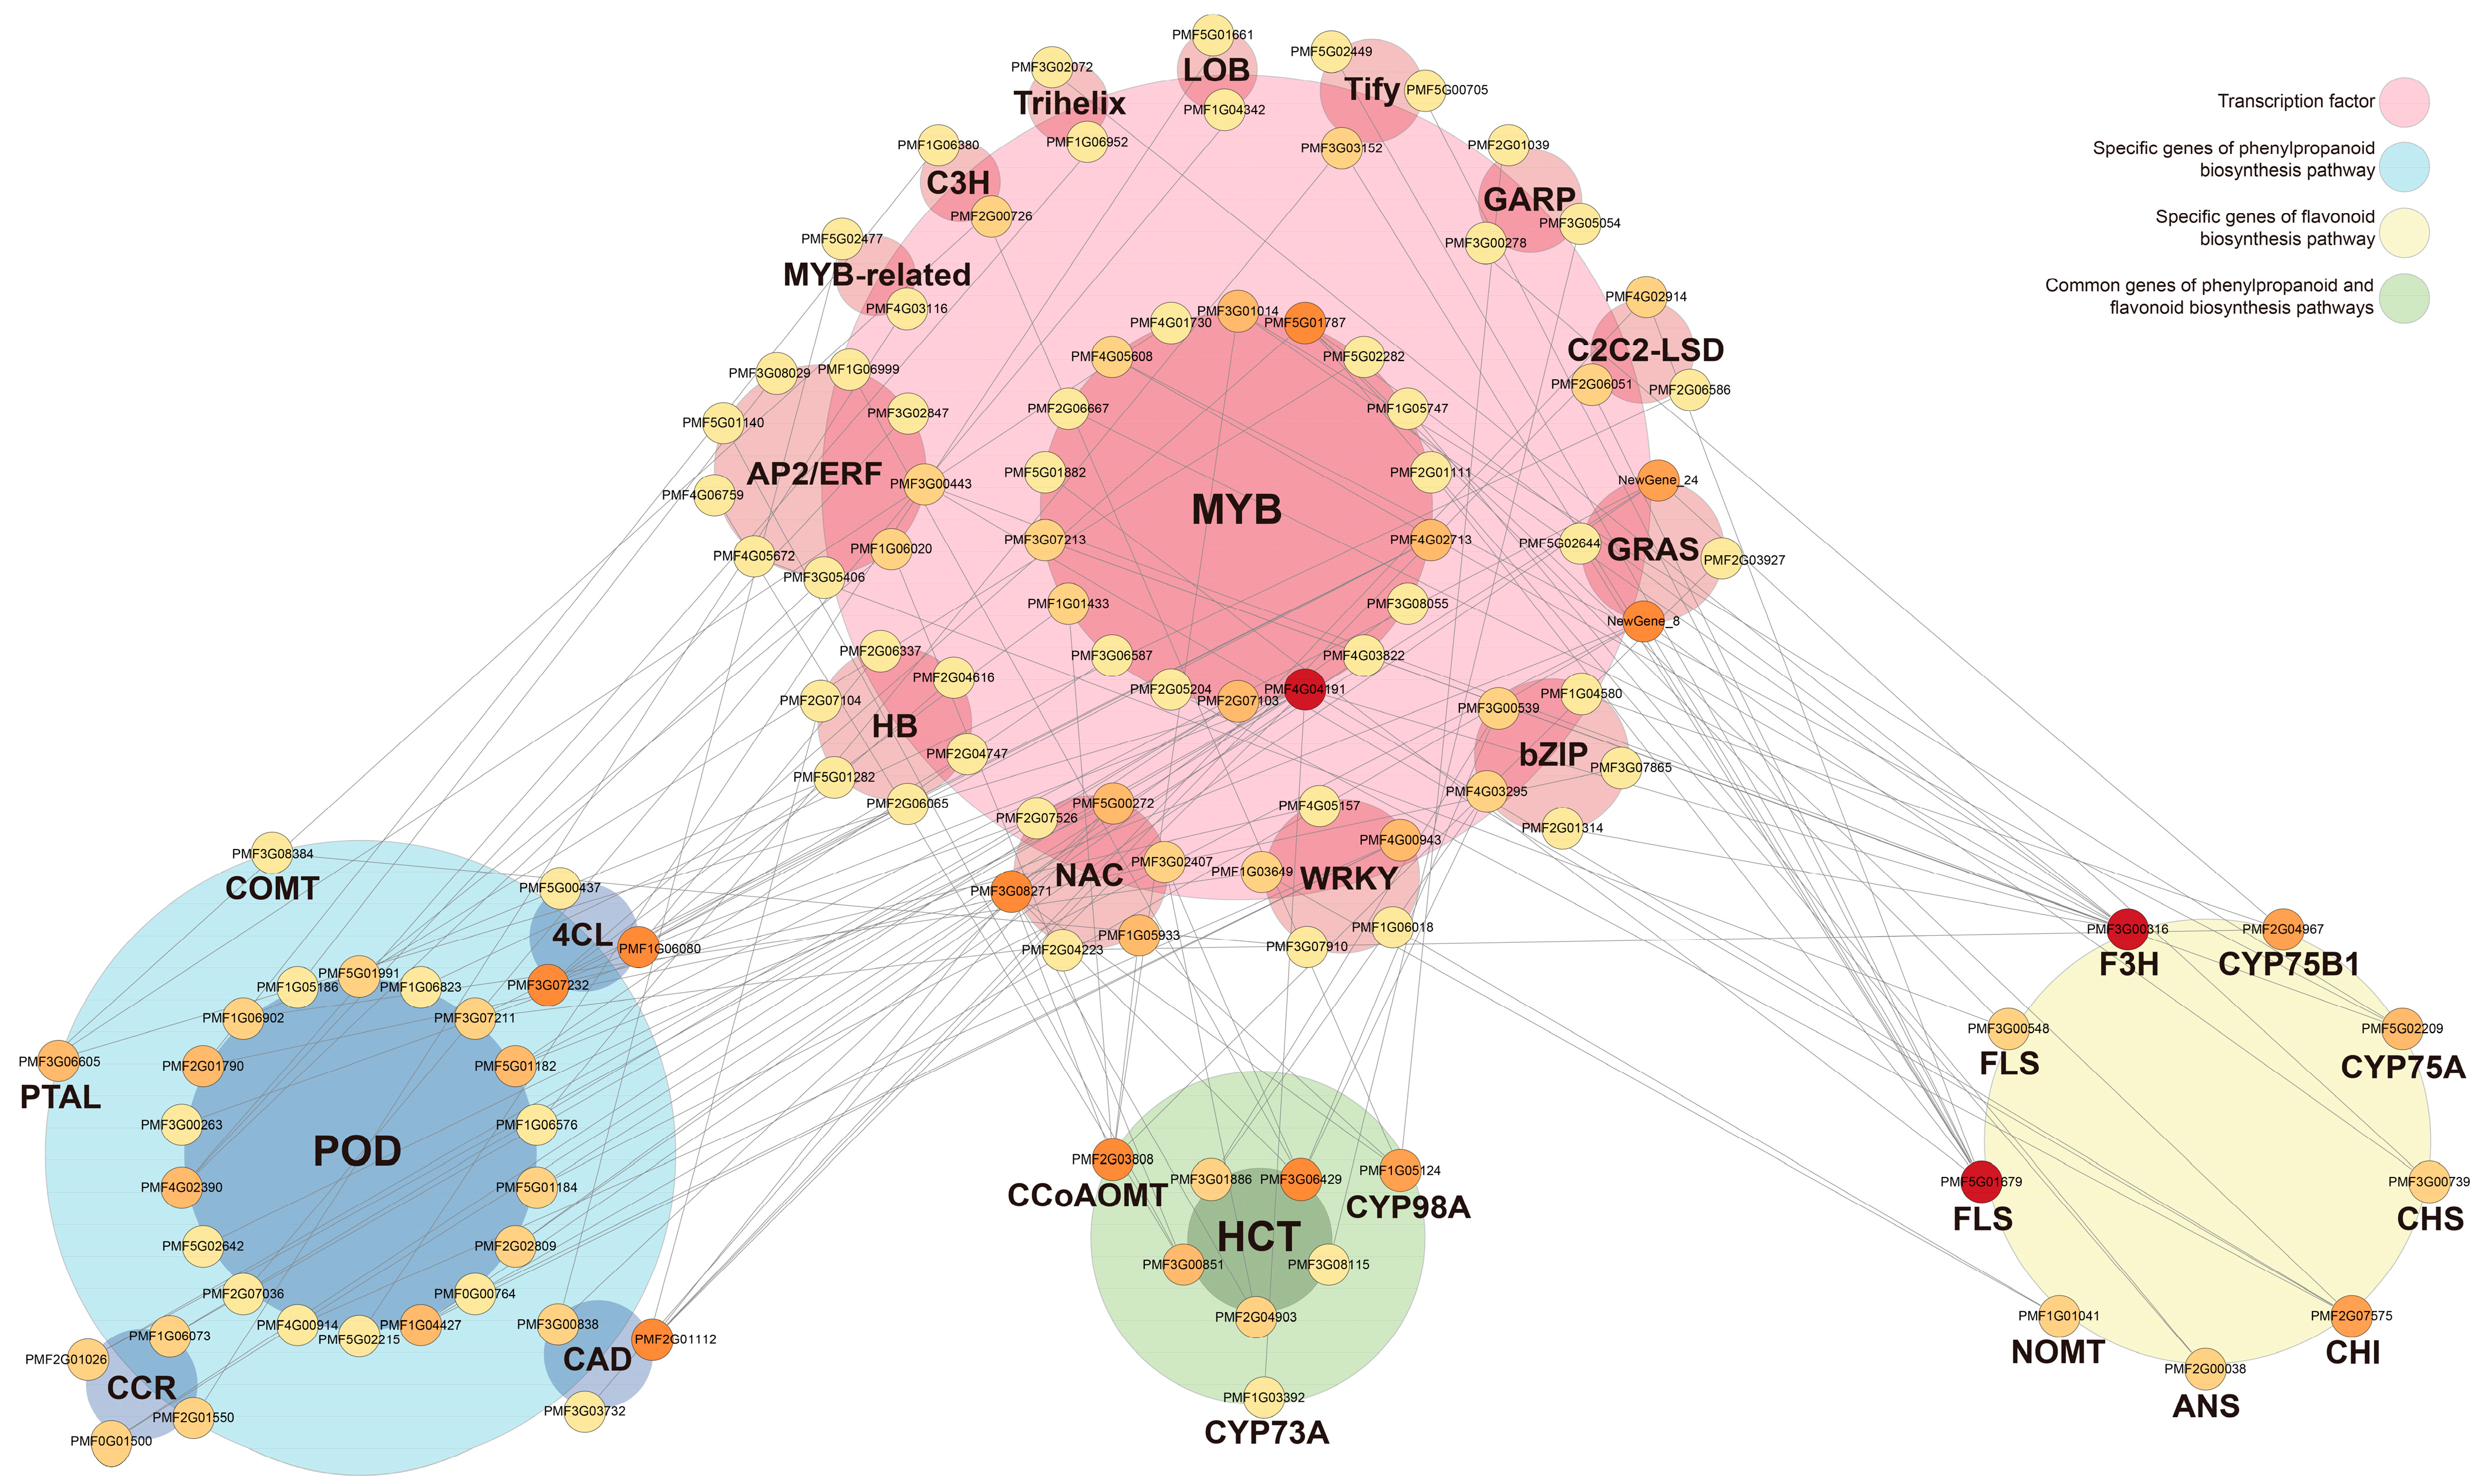
We constructed a PPI network utilizing the STRING database, based on the Oryza sativa genome, to obtain reliable information regarding protein interactions. This network aimed to identify key transcription factors regulating the phenylpropanoid and flavonoid biosynthesis pathways (Table S10). It specifically focused on genes pertinent to these pathways, along with all differentially expressed TFs. As a result, two or more TF families were selected for display, culminating in a final network comprising 117 nodes and 123 interaction edges (Figure 8). Among these, 70 nodes were annotated as TFs, while 47 nodes represented enzyme genes associated with phenylpropanoid metabolism. Notably, among the 70 TFs involved in the network, members of the MYB family were the most abundant (18), significantly outnumbering other families. This was followed by the AP2/ERF family (9) and the HB and NAC families (6). Regarding pathway genes, the network included 30 phenylpropanoid-specific genes (18 of which encode peroxidases), nine flavonoid-specific genes (with only FLS having two members), and eight genes common to both pathways (5 encoding HCT). These enzyme genes exhibited extensive predicted interactions with numerous transcription factors. The predicted PPI network reveals potential regulatory relationships as multiple MYB nodes exhibit strong connections with core enzyme nodes in the phenylpropanoid pathway (POD, 4CL) and key nodes in the flavonoid pathway (F3H, CYP75A). Notably, PMF4G04191 and PMF5G01787 demonstrate strong connectivity with multiple downstream pathway genes. This indicates that the MYB transcription factor family likely serves as a key upstream regulator governing the phenylpropanoid and flavonoid biosynthesis pathways in P. glaucum roots in response to various abiotic stresses.

4. Discussion

Uncovering the unique stress-tolerant transcriptional profiles in various organs of stress-resistant crops, such as pearl millet, is essential for understanding their adaptive mechanisms in marginal environments. Through a comparative transcriptomic analysis involving three categories of six heterogeneous stresses—ion stress (CaCl2, NaCl), water stress (PEG, WL), and temperature stress (Heat, Cold)—we revealed complex functional divisions between leaves and roots. This study not only mapped the global transcriptional landscapes of different organs of pearl millet but also identified a defense module in the roots that remains conserved across all stresses. This module appears to underpin the broad-spectrum stress tolerance of pearl millet. Our findings confirm that plants have evolved a range of adaptive strategies to cope with diverse environmental challenges [49]. These strategies include both organ-specific responses to distinct stresses and a highly conserved core response system that addresses common cellular damage induced by multiple stressors [50,51,52,53].
In the global transcriptomic overview, this study identified expression profiles for over 49,000 genes in pearl millet seedlings, with the detected DEGs highlighting differences in transcriptional resource allocation between organs. Compared to the control group, roots and leaves exhibited up to 34,632 and 30,577 DEGs, respectively, across all stress treatments. Although Venn analysis revealed that leaves shared significantly more DEGs (213) than roots (118) across all six stress conditions, activating a small number of related redox GO terms, the vast majority of these shared leaf DEGs did not converge onto common KEGG pathways. These results indicate that the leaf response strategy prioritizes efficiency over scale, mobilizing a larger but functionally dispersed gene set, where numerous genes respond only to specific stress types. This aligns with their role as photosynthetic organs: leaves prioritize maintaining photosystem stability during stress, resulting in specific stress response strategies. In Arabidopsis and maize, responses to drought stress are highly dependent on differences in leaf tissue regions [54,55]. The sole exception is the carotenoid biosynthesis pathway, which co-enriches under water and temperature stress. Changes in carotenoids under stress reflect plant adaptation mechanisms or metabolic disruption processes. The activation patterns of this pathway under various stressors have been documented in multiple crops, including sweet potato and tomato. The activation pattern of this pathway across different stresses has been reported in crops such as sweet potato and tomato. In chili peppers, the MYB transcription factor DIVARICATA1 positively regulates the transcription levels of most carotenoid DEGs [56,57,58]. Furthermore, the starch and sucrose metabolism pathway, enriched in roots and leaves under water stress and in roots under temperature stress, highlights the fundamental role of osmotic regulation and energy supply balance in plant adaptation to water shortage and temperature stress. In stark contrast to rice, which significantly activates starch metabolism pathways in leaves, pearl millet leaves exhibit a weaker response to temperature stress. This is attributed to the rapid export of photosynthetic products primarily as sucrose, which limits starch accumulation [59]. Consequently, pearl millet leaves demonstrate highly specific stress adaptation with few shared pathways, reflecting their effective adaptation as an above-ground organ to environmental changes.
In contrast to leaves, roots exhibit a highly conserved common defense strategy. Notably, the phenylpropanoid and flavonoid biosynthesis pathways were significantly enriched in root tissues across all six stress treatments. This finding indicates that these secondary metabolic pathways constitute a core defense hub in pearl millet roots for coping with diverse stress environments. As the principal pathway for lignin monomer synthesis in plants, phenylpropanoid biosynthesis enhances the mechanical strength of cell walls and utilizes the antioxidant activity of upstream intermediates and specific enzymes to scavenge ROS [60]. Reports indicate that this pathway enhances early drought and salt tolerance in plants by activating PAL activity and through the mediation of ferulic acid [61,62]. In this study, we identified 128 differentially expressed POD genes, which account for 49.23% of the DEGs associated with phenylpropanoid biosynthesis. The widespread activation of these genes is directly correlated with hydrogen peroxide (H2O2) scavenging and lignin polymerization, thereby providing an immediate defense barrier for the roots. Heat maps (Figure 5B) reveal precise upregulation of specific POD gene clusters under different stress conditions, indicating a finely tuned stress-adaptive regulation of this lignification and antioxidant mechanism. This observation aligns with the stress response mechanism in cassava, where the suppression of MeRAV5 gene expression increases sensitivity to drought stress [63]. Similarly, in rice, the knockout of the OsGRP3 gene resulted in a significant downregulation of multiple POD genes, leading to reduced lignin content [64]. The flavonoid biosynthesis pathway, as a downstream branch of phenylpropanoid metabolism, was also enriched across all six stress types. As shown in Figure 6, key enzyme genes encoding HCT, CHS, PDT1, and FLS exhibited inconsistent differential expression across different stress types. Numerous studies have reported that the upregulation of CHS, dihydroflavonol 4-reductase (DFR), and FLS promotes the accumulation of flavonoid compounds in response to abiotic stress [65,66]. However, our findings indicate that gene downregulation under specific stresses does not necessarily signify pathway shutdown but may reflect metabolic flux redistribution. For instance, the partial downregulation of HCT genes (Groups I, II) under WL stress serves as a critical branching point directing phenylpropanoid flux toward flavonoid synthesis. Their reduced expression may redirect metabolic resources toward lignin synthesis, thereby strengthening root structure to resist waterlogging stress. This resembles findings in Polygonatum kingianum adapting to drought stress [67]. Furthermore, other HCT genes (Groups IV, V) were significantly upregulated under cold stress, potentially mediating metabolic diversion toward flavonoid synthesis to enhance antioxidant capacity against cold-induced oxidative damage. Similar observations have been reported in Arabidopsis and Brassica rapa, collectively demonstrating that diverse stress conditions differentially regulate HCT genes [68,69]. This metabolic flexibility at the HCT branch point indicates that roots dynamically optimize defense responses by redirecting metabolic flux between lignin and flavonoid pathways according to specific stress demands.
In addition to identifying conserved pathways, this study also elucidates potential upstream regulatory mechanisms. Based on the PPI network analysis constructed from rice homologs, we predict that the MYB transcription factor family serves as a hub coordinating core defense responses in roots. In recent years, an increasing number of reports have demonstrated that MYB proteins, particularly those from the R2R3-MYB subfamily, are widely recognized as major regulators of phenylpropanoid and flavonoid biosynthesis pathways. Their functional diversity facilitates responses to various abiotic stresses [70,71]. Experimental evidence indicates that the MYB family not only significantly outnumbers other transcription factor families among the 70 transcription factors involved in the network (accounting for 25.71%), but also exhibits dense predicted interactions between multiple MYB nodes and key enzyme genes in both pathways. For instance, PMF2G07103 connects with three genes encoding CCR, while PMF3G01014 interacts with genes encoding CCoAOMT, F3H, and CYP75A. The regulatory function of MYBs has been validated in poplar, where the overexpression of PtrMYB3 and PtrMYB20 promotes lignin deposition by regulating the expression of genes such as CCoAOMT1, 4CL, and POD [72]. Notably, PMF4G04191 and PMF5G01787 are predicted to simultaneously interact with key enzyme genes in both phenylpropanoid and flavonoid biosynthesis pathways, suggesting their potential dual regulatory functions. Extensive functional studies in other plant systems, including model plants, further validate this prediction [73,74,75,76]. This establishes a coherent model: an MYB family-centered transcriptional regulatory network integrates multiple stress signals to simultaneously activate both phenylpropanoid and flavonoid pathways—core defense systems—thereby enabling pearl millet roots to achieve efficient, broad-spectrum stress resistance.
This study predominantly relies on transcriptomic data. However, the predicted regulatory relationships and generated metabolic fluxes require further validation through subsequent experiments. Follow-up work should include qPCR validation of key candidate genes, such as core PODs and MYBs, and quantification of phenylpropanoid and flavonoid compound accumulation via metabolomics analysis, thereby directly linking transcriptional changes to metabolic outcomes. The MYB members (PMF4G04191, PMF5G01787), which connect to multiple pathway genes in the predicted network, represent highly promising candidate targets for investigating the broad-spectrum stress resistance molecular mechanisms in pearl millet and for advancing molecular breeding. Building on this foundation, future studies should explore physiologically feasible stress combinations, such as drought and low temperature, to understand how these conserved pathways interact in more complex scenarios that better reflect real-world field conditions.

5. Conclusions

This study systematically analyzes the transcriptional response patterns of pearl millet roots and leaves to six types of abiotic stresses. The results indicate that leaves exhibit weaker common responses to multiple stresses, with only the carotenoid biosynthesis pathway being commonly activated under certain stress conditions. Although roots typically demonstrate stronger transcriptional responses than leaves, our analysis extends beyond this commonality to identify a specific conserved metabolic architecture that underpins broad-spectrum tolerance: the phenylpropanoid biosynthesis and flavonoid biosynthesis pathways were significantly enriched and activated in roots under all six stress conditions. This finding aligns with the shared cellular functions of cell wall remodeling and oxidative defense in roots. While their specific patterns exhibit stress specificity, the differential expression of core enzyme genes, such as POD, HCT, and CHS, highlights the centrality of these two pathways. PPI predictions further indicate that the MYB transcription factor family (particularly nodes like PMF4G04191 and PMF5G01787) serves as a key upstream regulatory hub coordinating these core defense pathways in response to multiple stresses. Overall, this study provides a crucial transcriptomic resource for elucidating the molecular mechanisms underlying the environmental adaptability of pearl millet. The findings offer a genetic resource for breeding programs aimed at developing multi-stress-tolerant pearl millet cultivars through molecular-assisted selection.

Supplementary Materials

The following supporting information can be downloaded at https://www.mdpi.com/article/10.3390/agronomy15122707/s1: Figure S1: The method flowchart illustrates key steps from sample collection to PPI network construction; Figure S2: The Upset plot depicts the number of unique and shared differentially expressed genes (DEGs) that are up- or down-regulated in roots and leaves under different treatments (Fold Change ≥ 2 and FDR < 0.01); Figure S3: GO enrichment analysis reveals GO terms (BP: biological processes; MF: molecular functions) co-enriched in roots and leaves across three treatments (Lon stress: CdCl2 and NaCl stress; Water stress: PEG and WL stress; Temperature stress: Heat and Cold stress). Table S1: Hogland nutrient solution method; Table S2: RNA quality indicators of different treatments; Table S3: Summary of transcriptome sequencing results for 42 libraries in pearl millet under multiple stresses; Table S4: Expression levels and GO second-level annotation results for co-responding GEDs across different treatments; Table S5: GO enrichment analysis of annotated DEGs across different treatments (p value > 0.05); Table S6: KEGG enrichment analysis of annotated DEGs across treatments (p value > 0.05); Table S7: Expression changes in DEGs in the phenylalanine biosynthesis pathway diagram; Table S8: Expression changes in DEGs in the flavonoid biosynthesis pathway diagram; Table S9: List of transcription factors across different clusters; Table S10: All string interactions between TFs and phenylpropanoid and flavonoid biosynthesis pathways.

Author Contributions

Investigation, data curation, writing—original draft preparation, visualization, Q.C.; formal analysis, data curation, L.L.; investigation, methodology, T.Z.; methodology, visualization, J.G.; formal analysis, investigation, N.L.; formal analysis, investigation, R.L.; writing—review and editing, resources, Q.X.; conceptualization, methodology, writing—review and editing, resources, supervision, project administration, funding acquisition, L.H.; methodology, writing—review and editing, supervision, project administration, funding acquisition, G.C. All authors have read and agreed to the published version of the manuscript.

Funding

This research was funded by Key R&D Program of Hunan Province, China [2024WK2013], and the Science & Technology Specific Projects in Agricultural High-tech Industrial Demonstration Area of the Yellow River Delta (2022SZX13).

Institutional Review Board Statement

Not applicable.

Data Availability Statement

The original transcriptome sequencing data presented in this study are openly accessible in the NCBI Sequence Read Archive (SRA) at [https://www.ncbi.nlm.nih.gov/sra/] (https://www.ncbi.nlm.nih.gov/sra/) (accessed on 19 November 2025) under the BioProject accession number PRJNA1362943.

Conflicts of Interest

The authors declare no conflicts of interest.

References

  1. Zandalinas, S.I.; Fritschi, F.B.; Mittler, R. Global Warming, Climate Change, and Environmental Pollution: Recipe for a Multifactorial Stress Combination Disaster. Trends Plant Sci. 2021, 26, 588–599. [Google Scholar] [CrossRef] [PubMed]
  2. Chele, K.H.; Tinte, M.M.; Piater, L.A.; Dubery, I.A.; Tugizimana, F. Soil Salinity, a Serious Environmental Issue and Plant Responses: A Metabolomics Perspective. Metabolites 2021, 11, 724. [Google Scholar] [CrossRef]
  3. Sperdouli, I. Heavy Metal Toxicity Effects on Plants. Toxics 2022, 10, 715. [Google Scholar] [CrossRef]
  4. Yadav, B.; Jogawat, A.; Rahman, M.S.; Narayan, O.P. Secondary Metabolites in the Drought Stress Tolerance of Crop Plants: A Review. Gene Rep. 2021, 23, 101040. [Google Scholar] [CrossRef]
  5. Lesk, C.; Rowhani, P.; Ramankutty, N. Influence of Extreme Weather Disasters on Global Crop Production. Nature 2016, 529, 84–87. [Google Scholar] [CrossRef]
  6. Saleem, M.H.; Noreen, S.; Ishaq, I.; Saleem, A.; Khan, K.A.; Ercisli, S.; Anas, M.; Khalid, A.; Ahmed, T.; Hassan, A.; et al. Omics Technologies: Unraveling Abiotic Stress Tolerance Mechanisms for Sustainable Crop Improvement. J. Plant Growth Regul. 2025, 44, 4165–4178. [Google Scholar] [CrossRef]
  7. Serba, D.D.; Yadav, R.S. Genomic Tools in Pearl Millet Breeding for Drought Tolerance: Status and Prospects. Front. Plant Sci. 2016, 7, 1724. [Google Scholar] [CrossRef] [PubMed]
  8. Mohammed, R. Genetic Variation and Diversity of Pearl Millet [Pennisetum glaucum (L.)] Genotypes Assessed for Millet Head Miner, Heliocheilus Albipunctella Resistance, in West Africa. Euphytica 2020, 216, 158. [Google Scholar] [CrossRef]
  9. Satyavathi, C.T. Pearl Millet: A Climate-Resilient Nutricereal for Mitigating Hidden Hunger and Provide Nutritional Security. Front. Plant Sci. 2021, 12, 659938. [Google Scholar] [CrossRef] [PubMed]
  10. Raheem, D.; Dayoub, M.; Birech, R.; Nakiyemba, A. The Contribution of Cereal Grains to Food Security and Sustainability in Africa: Potential Application of UAV in Ghana, Nigeria, Uganda, and Namibia. Urban Sci. 2021, 5, 8. [Google Scholar] [CrossRef]
  11. Srivastava, R.K. Genome-Wide Association Studies and Genomic Selection in Pearl Millet: Advances and Prospects. Front. Plant Sci. 2020, 10, 1389. [Google Scholar] [CrossRef]
  12. Zhang, A.; Ji, Y.; Sun, M.; Lin, C.; Zhou, P.; Ren, J.; Luo, D.; Wang, X.; Ma, C.; Zhang, X.; et al. Research on the Drought Tolerance Mechanism of Pennisetum glaucum (L.) in the Root during the Seedling Stage. BMC Genom. 2021, 22, 568. [Google Scholar] [CrossRef]
  13. Jacob, J.; Sanjana, P.; Visarada, K.B.R.S.; Shobha, E.; Ratnavathi, C.V.; Sooganna, D. Seedling Stage Heat Tolerance Mechanisms in Pearl Millet (Pennisetum glaucum (L.) R. Br.). Russ. J. Plant Physiol. 2022, 69, 128. [Google Scholar] [CrossRef]
  14. Sayed, M.R.I.; Zayed, E.M.; Morsi, N.A.A. Identification of Molecular Genetic Markers Associated with Salt Tolerance in PearlMillet (Pennisetum glaucum L.). Middle East J. Agric. Res. 2022, 11, 451–465. [Google Scholar] [CrossRef]
  15. Silva, Q.M.; Andrade-Vieria, L.F. Is Pearl Millet (Pennisetum glaucum) a Good Plant Species for Ecotoxicological Tests? Environ. Sci. Pollut. Res. 2024, 31, 41953–41963. [Google Scholar] [CrossRef]
  16. Merga, D. Pearl Millet (Pennisetum glaucum L.) Breeding for Adaptation and Performance under Drought Condition: Review. J. Environ. Earth Sci. 2020, 10, 1–10. [Google Scholar] [CrossRef]
  17. Nambiar, V.S.; Dhaduk, J.J.; Sareen, N.; Shahu, T.; Desai, R. Potential Functional Implications of Pearl millet (Pennisetum glaucum) in Health and Disease. J. Appl. Pharm. Sci. 2011, 1, 62–67. [Google Scholar]
  18. Ashraf, M.; Hafeez, M. Thermotolerance of Pearl Millet and Maize at Early Growth Stages: Growth and Nutrient Relations. Biol. Plant. 2004, 48, 81–86. [Google Scholar] [CrossRef]
  19. Huang, D.; Sun, M.; Zhang, A.; Chen, J.; Zhang, J.; Lin, C.; Zhang, H.; Lu, X.; Wang, X.; Yan, H.; et al. Transcriptional Changes in Pearl Millet Leaves under Heat Stress. Genes 2021, 12, 1716. [Google Scholar] [CrossRef]
  20. Sun, M.; Huang, D.; Zhang, A.; Khan, I.; Yan, H.; Wang, X.; Zhang, X.; Zhang, J.; Huang, L. Transcriptome Analysis of Heat Stress and Drought Stress in Pearl Millet Based on Pacbio Full-Length Transcriptome Sequencing. BMC Plant Biol. 2020, 20, 323. [Google Scholar] [CrossRef] [PubMed]
  21. Imadi, S.R.; Kazi, A.G.; Ahanger, M.A.; Gucel, S.; Ahmad, P. Plant Transcriptomics and Responses to Environmental Stress: An Overview. J. Genet. 2015, 94, 525–537. [Google Scholar] [CrossRef] [PubMed]
  22. Soniya, E.V.; Srinivasan, A.; Menon, A.; Kattupalli, D. Transcriptomics in Response of Biotic Stress in Plants. In Transcriptome Profiling, 1st ed.; Ali, M.A., Lee, J., Eds.; Academic Press: Cambridge, MA, USA, 2023; pp. 285–303. [Google Scholar]
  23. Zhou, Z.; Fan, J.; Zhang, J.; Yang, Y.; Zhang, Y.; Zan, X.; Li, X.; Wan, J.; Gao, X.; Chen, R.; et al. OsMLP423 Is a Positive Regulator of Tolerance to Drought and Salt Stresses in Rice. Plants 2022, 11, 1653. [Google Scholar] [CrossRef]
  24. Almira-Casellas, M.; Busoms, S.; Pérez-Martín, L.; Escolà, G.; López-Valiñas, Á.; Garcia-Molina, A.; Llugany, M.; Poschenrieder, C. At the Core of Salinity: Divergent Transcriptomic Responses to Neutral and Alkaline Salinity in Arabidopsis Thaliana. Environ. Exp. Bot. 2024, 228, 105982. [Google Scholar] [CrossRef]
  25. Nazari, L.; Zinati, Z. Transcriptional Survey of Abiotic Stress Response in Maize (Zea mays) in the Level of Gene Co-Expression Network and Differential Gene Correlation Analysis. AoB Plants 2024, 16, plad087. [Google Scholar] [CrossRef]
  26. Liu, X.; Lan, S.; Sha, J.; Zhang, Z.; Chang, Y.; Chen, Y.; Yang, S. Transcriptome Analysis Reveals the Molecular Mechanisms through Which Exogenous Methyl Jasmonate Enhances Mercury Stress Tolerance in Maize Seedlings. Agronomy 2025, 15, 1369. [Google Scholar] [CrossRef]
  27. Kim, Y.-C.; Chen, M.; Kim, G.W.; Lee, H.; Lee, J.H. Comparative Transcriptomic Analysis in Roots of a Domestic Wheat Cultivar (Triticum aestivum L. Cv. Keumkang) Seedlings under Waterlogging Stress. J. Plant Biol. 2024, 67, 35–48. [Google Scholar] [CrossRef]
  28. Mittler, R. ROS Are Good. Trends Plant Sci. 2017, 22, 11–19. [Google Scholar] [CrossRef]
  29. Turgut Yiğit, A.; Yilmaz, O.; Uzi̇Lday, B.; Özgür Uzi̇Lday, R.; Türkan, İ. Plant Response to Salinity: An Analysis of ROS Formation, Signaling, and Antioxidant Defense. Turk. J. Bot. 2020, 44, 1–13. [Google Scholar] [CrossRef]
  30. Zhang, Q.; Teng, R.; Yuan, Z.; Sheng, S.; Xiao, Y.; Deng, H.; Tang, W.; Wang, F. Integrative Transcriptomic Analysis Deciphering the Role of Rice bHLH Transcription Factor Os04g0301500 in Mediating Responses to Biotic and Abiotic Stresses. Front. Plant Sci. 2023, 14, 1266242. [Google Scholar] [CrossRef]
  31. Ji, Y.; Lu, X.; Zhang, H.; Luo, D.; Zhang, A.; Sun, M.; Wu, Q.; Wang, X.; Huang, L. Transcriptome Reveals the Dynamic Response Mechanism of Pearl Millet Roots under Drought Stress. Genes 2021, 12, 1988. [Google Scholar] [CrossRef] [PubMed]
  32. Khan, I.; Awan, S.A.; Rizwan, M.; Akram, M.A.; Zia-ur-Rehman, M.; Wang, X.; Zhang, X.; Huang, L. Physiological and Transcriptome Analyses Demonstrate the Silver Nanoparticles Mediated Alleviation of Salt Stress in Pearl Millet (Pennisetum glaucum L). Environ. Pollut. 2023, 318, 120863. [Google Scholar] [CrossRef] [PubMed]
  33. Zhang, H.; Zhu, J.; Gong, Z.; Zhu, J.-K. Abiotic Stress Responses in Plants. Nat. Rev. Genet. 2022, 23, 104–119. [Google Scholar] [CrossRef]
  34. Choudhary, M.; Jayanand; Padaria, J.C. Transcriptional Profiling in Pearl Millet (Pennisetum glaucum L.R. Br.) for Identification of Differentially Expressed Drought Responsive Genes. Physiol. Mol. Biol. Plants 2015, 21, 187–196. [Google Scholar] [CrossRef]
  35. Chen, S.; Xu, X.; Ma, Z.; Liu, J.; Zhang, B. Organ-Specific Transcriptome Analysis Identifies Candidate Genes Involved in the Stem Specialization of Bermudagrass (Cynodon dactylon L.). Front. Genet. 2021, 12, 678673. [Google Scholar] [CrossRef]
  36. Booth, M.W.; Breed, M.F.; Kendrick, G.A.; Bayer, P.E.; Severn-Ellis, A.A.; Sinclair, E.A. Tissue-Specific Transcriptome Profiles Identify Functional Differences Key to Understanding Whole Plant Response to Life in Variable Salinity. Biol. Open 2022, 11, bio059147. [Google Scholar] [CrossRef]
  37. Aher, R.R.; Palakolanu, S.R. Advancements in Genetic Enhancement Addressing Key Challenges in Pearl Millet (Pennisetum glaucum (L.) R. Br.). J. Plant Biochem. Biotechnol. 2025, 34, 1078. [Google Scholar] [CrossRef]
  38. Awan, S.A.; Khan, I.; Rizwan, M.; Irshad, M.A.; Xiaosan, W.; Zhang, X.; Huang, L. Reduction in the Cadmium (Cd) Accumulation and Toxicity in Pearl Millet (Pennisetum glaucum L.) by Regulating Physio-Biochemical and Antioxidant Defense System via Soil and Foliar Application of Melatonin. Environ. Pollut. 2023, 328, 121658. [Google Scholar] [CrossRef]
  39. Iwuala, E.; Olajide, O.; Abiodun, I.; Odjegba, V.; Utoblo, O.; Ajewole, T.; Oluwajobi, A.; Uzochukwu, S. Silicon Ameliorates Cadmium (Cd) Toxicity in Pearl Millet by Inducing Antioxidant Defense System. Heliyon 2024, 10, e25514. [Google Scholar] [CrossRef]
  40. Divya, K.; Palakolanu, S.R.; Kavi Kishor, P.; Rajesh, A.S.; Vadez, V.; Sharma, K.K.; Mathur, P.B. Functional Characterization of Late Embryogenesis Abundant Genes and Promoters in Pearl Millet (Pennisetum glaucum L.) for Abiotic Stress Tolerance. Physiol. Plant. 2021, 173, 1616–1628. [Google Scholar] [CrossRef]
  41. Kim, D.; Langmead, B.; Salzberg, S.L. HISAT: A Fast Spliced Aligner with Low Memory Requirements. Nat. Methods 2015, 12, 357–360. [Google Scholar] [CrossRef]
  42. Pertea, M.; Pertea, G.M.; Antonescu, C.M.; Chang, T.-C.; Mendell, J.T.; Salzberg, S.L. StringTie Enables Improved Reconstruction of a Transcriptome from RNA-Seq Reads. Nat. Biotechnol. 2015, 33, 290–295. [Google Scholar] [CrossRef]
  43. Trapnell, C.; Williams, B.A.; Pertea, G.; Mortazavi, A.; Kwan, G.; van Baren, J.; Salzberg, S.L.; Wold, B.J.; Pachter, L. Transcript Assembly and Abundance Estimation from RNA-Seq Reveals Thousands of New Transcripts and Switching among Isoforms. Nat Biotechnol. 2010, 28, 511–515. [Google Scholar] [CrossRef]
  44. Love, M.I.; Huber, W.; Anders, S. Moderated Estimation of Fold Change and Dispersion for RNA-Seq Data with DESeq2. Genome Biol. 2014, 15, 550. [Google Scholar] [CrossRef]
  45. Guo, A.-Y.; Chen, X.; Gao, G.; Zhang, H.; Zhu, Q.-H.; Liu, X.-C.; Zhong, Y.-F.; Gu, X.; He, K.; Luo, J. PlantTFDB: A Comprehensive Plant Transcription Factor Database. Nucleic Acids Res. 2007, 36, D966–D969. [Google Scholar] [CrossRef]
  46. Altschul, S. Gapped BLAST and PSI-BLAST: A New Generation of Protein Database Search Programs. Nucleic Acids Res. 1997, 25, 3389–3402. [Google Scholar] [CrossRef]
  47. Franceschini, A.; Szklarczyk, D.; Frankild, S.; Kuhn, M.; Simonovic, M.; Roth, A.; Lin, J.; Minguez, P.; Bork, P.; von Mering, C.; et al. STRING v9.1: Protein-Protein Interaction Networks, with Increased Coverage and Integration. Nucleic Acids Res. 2012, 41, D808–D815. [Google Scholar] [CrossRef]
  48. Shannon, P.; Markiel, A.; Ozier, O.; Baliga, N.S.; Wang, J.T.; Ramage, D.; Amin, N.; Schwikowski, B.; Ideker, T. Cytoscape: A Software Environment for Integrated Models of Biomolecular Interaction Networks. Genome Res. 2003, 13, 2498–2504. [Google Scholar] [CrossRef]
  49. Zhou, H.; Shi, H.; Yang, Y.; Feng, X.; Chen, X.; Xiao, F.; Lin, H.; Guo, Y. Insights into Plant Salt Stress Signaling and Tolerance. J. Genet. Genom. 2024, 51, 16–34. [Google Scholar] [CrossRef]
  50. Mondal, S.; Karmakar, S.; Panda, D.; Pramanik, K.; Bose, B.; Singhal, R.K. Crucial Plant Processes under Heat Stress and Tolerance through Heat Shock Proteins. Plant Stress 2023, 10, 100227. [Google Scholar] [CrossRef]
  51. Azad, M.; Tohidfar, M.; Ghanbari Moheb Seraj, R.; Mehralian, M.; Esmaeilzadeh-Salestani, K. Identification of Responsive Genes to Multiple Abiotic Stresses in Rice (Oryza sativa): A Meta-Analysis of Transcriptomics Data. Sci. Rep. 2024, 14, 5463. [Google Scholar] [CrossRef]
  52. Sun, M.; Yan, H.; Zhang, A.; Jin, Y.; Lin, C.; Luo, J.; Zhou, P.; Wang, X.; Zhang, X.; Huang, L. The Transcriptional Dynamic Landscape Map of Pearl Millet in Response to Abiotic Stress Provides New Insights into the Responses of Plants to Stress. Trop. Plants 2025, 4, e024. [Google Scholar] [CrossRef]
  53. Shi, C.; Guo, F.; Sun, Y.; Han, J.; Zheng, X.; Zhang, J.; Qin, C.; Tan, Z.; Lin, J.; Wang, J. Physiological and Transcriptomic Analysis of Hordeum Jubatum Seedlings in Response to Salt, Alkali and Drought Stresses under Uniform Water Potential. Environ. Exp. Bot. 2024, 220, 105677. [Google Scholar] [CrossRef]
  54. Tenorio Berrío, R.; Verstaen, K.; Vandamme, N.; Pevernagie, J.; Achon, I.; Van Duyse, J.; Van Isterdael, G.; Saeys, Y.; De Veylder, L.; Inzé, D.; et al. Single-Cell Transcriptomics Sheds Light on the Identity and Metabolism of Developing Leaf Cells. Plant Physiol. 2022, 188, 898–918. [Google Scholar] [CrossRef]
  55. Nelissen, H.; Sun, X.; Rymen, B.; Jikumaru, Y.; Kojima, M.; Takebayashi, Y.; Abbeloos, R.; Demuynck, K.; Storme, V.; Vuylsteke, M.; et al. The Reduction in Maize Leaf Growth under Mild Drought Affects the Transition between Cell Division and Cell Expansion and Cannot Be Restored by Elevated Gibberellic Acid Levels. Plant Biotechnol. J. 2018, 16, 615–627. [Google Scholar] [CrossRef] [PubMed]
  56. Ke, Q.; Kang, L.; Kim, H.S.; Xie, T.; Liu, C.; Ji, C.Y.; Kim, S.H.; Park, W.S.; Ahn, M.-J.; Wang, S.; et al. Down-Regulation of Lycopene ε-Cyclase Expression in Transgenic Sweetpotato Plants Increases the Carotenoid Content and Tolerance to Abiotic Stress. Plant Sci. 2019, 281, 52–60. [Google Scholar] [CrossRef]
  57. Mi, J.; Vallarino, J.G.; Petřík, I.; Novák, O.; Correa, S.M.; Chodasiewicz, M.; Havaux, M.; Rodriguez-Concepcion, M.; Al-Babili, S.; Fernie, A.R.; et al. A Manipulation of Carotenoid Metabolism Influence Biomass Partitioning and Fitness in Tomato. Metab. Eng. 2022, 70, 166–180. [Google Scholar] [CrossRef]
  58. Song, J.; Sun, B.; Chen, C.; Ning, Z.; Zhang, S.; Cai, Y.; Zheng, X.; Cao, B.; Chen, G.; Jin, D.; et al. An R-R-type MYB transcription factor promotes non-climacteric pepper fruit carotenoid pigment biosynthesis. Plant J. 2023, 115, 724–741. [Google Scholar] [CrossRef]
  59. Lunn, J.E.; Hatch, M.D. Primary Partitioning and Storage of Photosynthate in Sucrose and Starch in Leaves of C4 Plants. Planta 1995, 197, 385–391. [Google Scholar] [CrossRef]
  60. Dong, N.; Lin, H. Contribution of Phenylpropanoid Metabolism to Plant Development and Plant–Environment Interactions. J. Integr. Plant Biol. 2021, 63, 180–209. [Google Scholar] [CrossRef]
  61. Zhao, T.; Wu, T.; Pei, T.; Wang, Z.; Yang, H.; Jiang, J.; Zhang, H.; Chen, X.; Li, J.; Xu, X. Overexpression of SlGATA17 Promotes Drought Tolerance in Transgenic Tomato Plants by Enhancing Activation of the Phenylpropanoid Biosynthetic Pathway. Front. Plant Sci. 2021, 12, 634888. [Google Scholar] [CrossRef]
  62. Jia, C.; Guo, B.; Wang, B.; Li, X.; Yang, T.; Li, N.; Wang, J.; Yu, Q. Integrated Metabolomic and Transcriptomic Analysis Reveals the Role of Phenylpropanoid Biosynthesis Pathway in Tomato Roots during Salt Stress. Front. Plant Sci. 2022, 13, 1023696. [Google Scholar] [CrossRef] [PubMed]
  63. Yan, Y.; Wang, P.; Lu, Y.; Bai, Y.; Wei, Y.; Liu, G.; Shi, H. MeRAV5 Promotes Drought Stress Resistance in Cassava by Modulating Hydrogen Peroxide and Lignin Accumulation. Plant J. 2021, 107, 847–860. [Google Scholar] [CrossRef] [PubMed]
  64. Xu, W.; Dou, Y.; Geng, H.; Fu, J.; Dan, Z.; Liang, T.; Cheng, M.; Zhao, W.; Zeng, Y.; Hu, Z.; et al. OsGRP3 Enhances Drought Resistance by Altering Phenylpropanoid Biosynthesis Pathway in Rice (Oryza sativa L.). Int. J. Mol. Sci. 2022, 23, 7045. [Google Scholar] [CrossRef]
  65. Gao, H.; Huang, X.; Lin, P.; Hu, Y.; Zheng, Z.; Yang, Q. Transcriptome-Associated Metabolomics Reveals the Molecular Mechanism of Flavonoid Biosynthesis in Desmodium styracifolium (Osbeck.) Merr under Abiotic Stress. Front. Plant Sci. 2024, 15, 1431148. [Google Scholar] [CrossRef]
  66. Zhao, P.; Yan, X.; Qian, C.; Ma, G.; Fan, X.; Yin, X.; Liao, Y.; Fang, T.; Zhou, S.; Awuku, I.; et al. Flavonoid Synthesis Pathway Response to Low-Temperature Stress in a Desert Medicinal Plant, Agriophyllum squarrosum (Sandrice). Genes 2024, 15, 1228. [Google Scholar] [CrossRef] [PubMed]
  67. Qian, H.; Xu, Z.; Cong, K.; Zhu, X.; Zhang, L.; Wang, J.; Wei, J.; Ji, P. Transcriptomic Responses to Drought Stress in Polygonatum Kingianum Tuber. BMC Plant Biol. 2021, 21, 537. [Google Scholar] [CrossRef]
  68. Schulz, E.; Tohge, T.; Winkler, J.B.; Albert, A.; Schäffner, A.R.; Fernie, A.R.; Zuther, E.; Hincha, D.K. Natural Variation among Arabidopsis Accessions in the Regulation of Flavonoid Metabolism and Stress Gene Expression by Combined UV Radiation and Cold. Plant Cell Physiol. 2021, 62, 502–514. [Google Scholar] [CrossRef]
  69. Dai, Y.; Zhang, L.; Sun, X.; Li, F.; Zhang, S.; Zhang, H.; Li, G.; Fang, Z.; Sun, R.; Hou, X.; et al. Transcriptome Analysis Reveals Anthocyanin Regulation in Chinese Cabbage (Brassica rapa L.) at Low Temperatures. Sci. Rep. 2022, 12, 6308. [Google Scholar] [CrossRef]
  70. Wang, L.; Lu, W.; Ran, L.; Dou, L.; Yao, S.; Hu, J.; Fan, D.; Li, C.; Luo, K. R2R3-MYB transcription factor MYB6 promotes anthocyanin and proanthocyanidin biosynthesis but inhibits secondary cell wall formation in Populus tomentosa. Plant J. 2019, 99, 733–751. [Google Scholar] [CrossRef]
  71. Kang, L.; Teng, Y.; Cen, Q.; Fang, Y.; Tian, Q.; Zhang, X.; Wang, H.; Zhang, X.; Xue, D. Genome-Wide Identification of R2R3-MYB Transcription Factor and Expression Analysis under Abiotic Stress in Rice. Plants 2022, 11, 1928. [Google Scholar] [CrossRef]
  72. Guo, H.; Wang, Y.; Wang, L.; Hu, P.; Wang, Y.; Jia, Y.; Zhang, C.; Zhang, Y.; Zhang, Y.; Wang, C.; et al. Expression of the MYB transcription factor gene BplMYB46 affects abiotic stress tolerance and secondary cell wall deposition in Betula platyphylla. Plant Biotechnol. J. 2017, 15, 107–121. [Google Scholar] [CrossRef]
  73. Geng, P.; Zhang, S.; Liu, J.; Zhao, C.; Wu, J.; Cao, Y.; Fu, C.; Han, X.; He, H.; Zhao, Q. MYB20, MYB42, MYB43, and MYB85 Regulate Phenylalanine and Lignin Biosynthesis during Secondary Cell Wall Formation. Plant Physiol. 2020, 182, 1272–1283. [Google Scholar] [CrossRef] [PubMed]
  74. Fornalé, S.; Shi, X.; Chai, C.; Encina, A.; Irar, S.; Capellades, M.; Fuguet, E.; Torres, J.-L.; Rovira, P.; Puigdomènech, P.; et al. ZmMYB31 Directly Represses Maize Lignin Genes and Redirects the Phenylpropanoid Metabolic Flux. Plant J. 2010, 64, 633–644. [Google Scholar] [CrossRef] [PubMed]
  75. Chanwala, J.; Khadanga, B.; Jha, D.K.; Sandeep, I.S.; Dey, N. MYB Transcription Factor Family in Pearl Millet: Genome-Wide Identification, Evolutionary Progression and Expression Analysis under Abiotic Stress and Phytohormone Treatments. Plants 2023, 12, 355. [Google Scholar] [CrossRef] [PubMed]
  76. Lin, M.; Dong, Z.; Zhou, H.; Wu, G.; Xu, L.; Ying, S.; Chen, M. Genome-Wide Identification and Transcriptional Analysis of the MYB Gene Family in Pearl Millet (Pennisetum glaucum). Int. J. Mol. Sci. 2023, 24, 2484. [Google Scholar] [CrossRef] [PubMed]
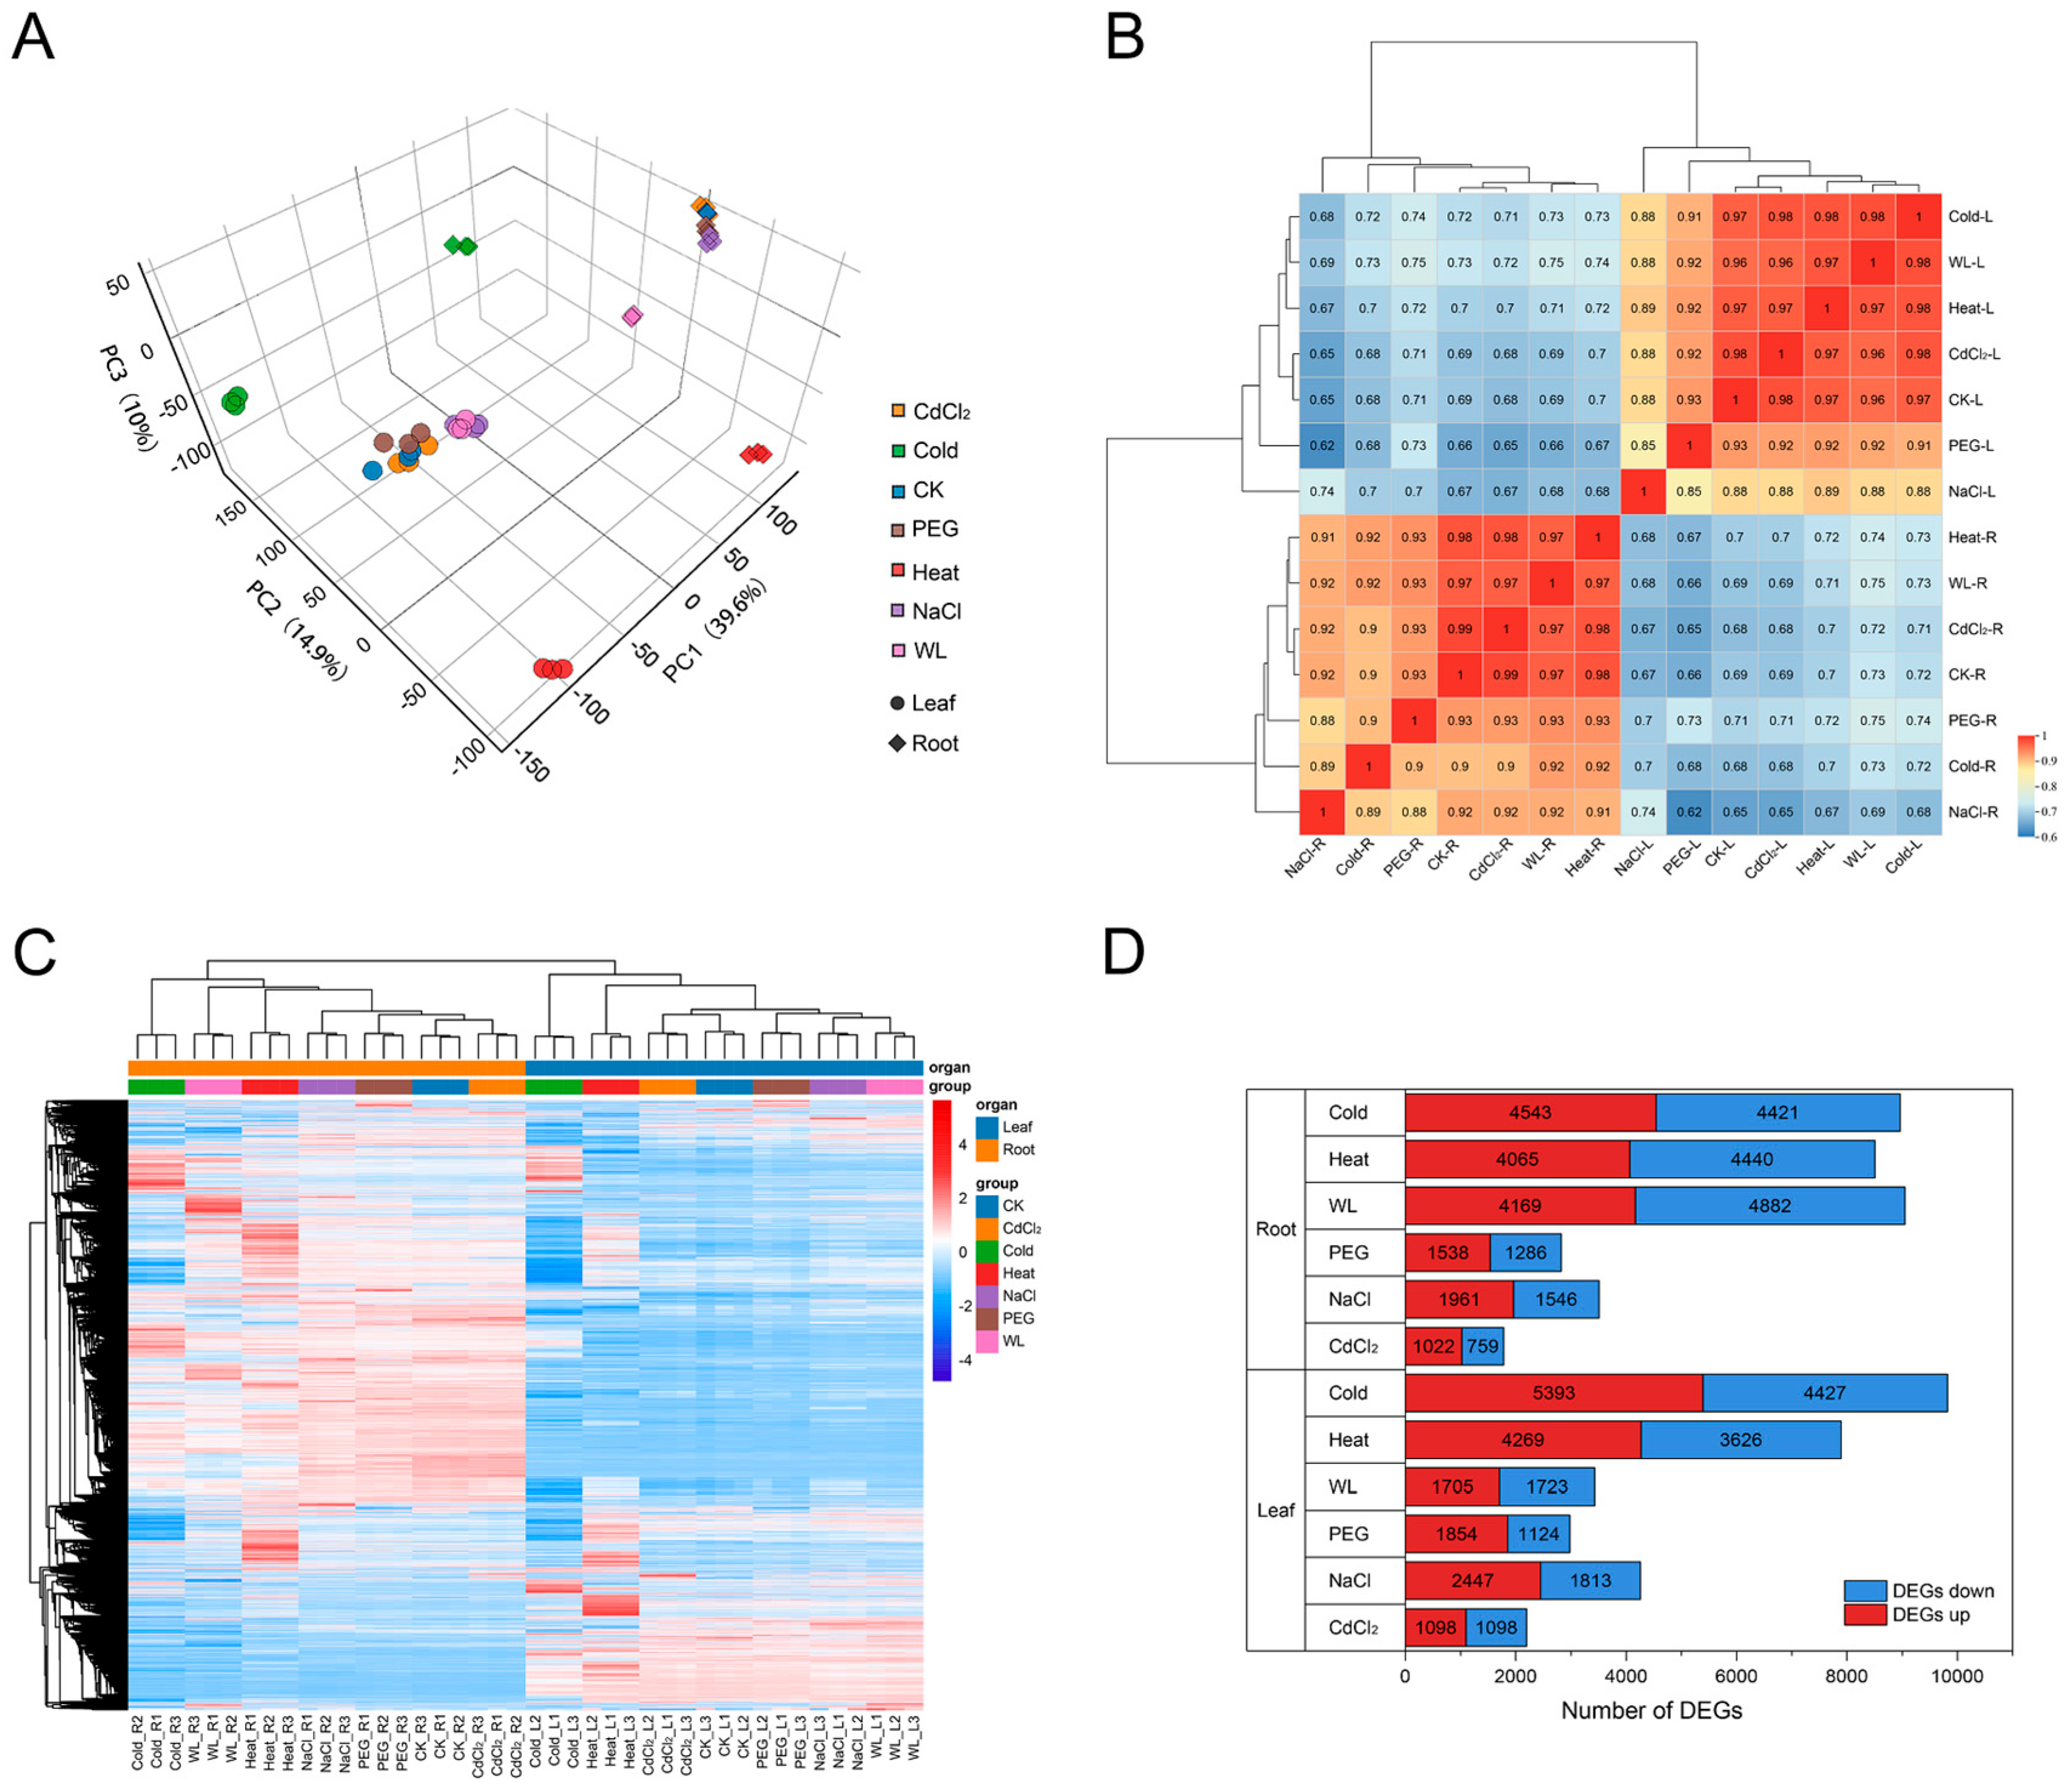
Figure 1. Analysis of RNA-seq results. (A) Principal component analysis of transcriptome samples. (B) Pearson correlation analysis among different treatments. (C) Clustering analysis of different samples and DEGs. (D) Number of DEGs upregulated or downregulated across different treatments. L, Leaf; R, Root.
Agronomy 15 02707 g001
Figure 2. Characterization of differentially expressed genes under different treatments. Venn diagrams show the number of shared DEGs identified in roots (A) and leaves (B) under different treatments (Fold Change ≥ 2 and FDR < 0.01). Heat maps display DEGs annotated by the GO database based on shared DEGs between roots and leaves under different treatments. They illustrate gene expression levels under various treatments in roots (C) and leaves (D), categorized according to GO second-level annotations. L, Leaf; R, Root.
Agronomy 15 02707 g002
Figure 3. GO enrichment analysis of DEGs common across different treatment groups. The Upset plot depicts GO enrichment of DEGs in roots (A) and leaves (B) under various treatments, listing GO terms enriched across all six stress categories. Lon stress: Includes CdCl2 and NaCl stress; Water stress: Includes PEG and WL stress; Temperature stress: Includes Heat and Cold stress. BP: Biological processes; CC: Cellular components; MF: Molecular functions.
Agronomy 15 02707 g003
Figure 4. KEGG enrichment analysis of DEGs common to different treatment groups. The Venn diagram illustrates KEGG enrichment patterns of DEGs in roots and leaves under various treatments, listing KEGG pathways enriched across similar stress conditions. Lon stress: Includes CdCl2 and NaCl stress; Water stress: Includes PEG and WL stress; Temperature stress: Includes Heat and Cold stress. The yellow marker denotes a KEGG pathway that is significantly enriched in the roots under six distinct stress conditions.
Agronomy 15 02707 g004
Figure 5. Schematic diagram and heatmap of pathways involving root “phenylpropanoid biosynthesis” DEGs. The heatmaps (BG) display expression changes for all DEGs in the phenylpropanoid biosynthesis pathway map (A), categorized into 14 groups based on enzyme type. The top five reaction categories with the highest number of DEGs (BF) are grouped into distinct clusters based on heat map clustering (using Euclidean distance metric and Complete linkage hierarchical clustering), designated as “I, II, III, IV, V.” Detailed gene expression data are provided in Supplementary Table S7.
Agronomy 15 02707 g005
Figure 6. Schematic diagram and heat map of DEGs involved in root “flavonoid biosynthesis.” The heat maps (BH) display expression changes for all DEGs in the flavonoid biosynthesis pathway map (A), categorized into 17 groups based on enzyme type. The top 6 reaction categories with the highest number of DEGs (BG) are grouped into distinct clusters based on heat map clustering (using Euclidean distance metric and Complete linkage hierarchical clustering), designated as “I, II, III, IV, V.” Detailed gene expression data are provided in Supplementary Table S8.
Agronomy 15 02707 g006
Figure 7. Clustering Analysis of Transcription Factor Expression Profiles. (A) Heat map displaying hierarchical clustering analysis of 1363 TF gene expression profiles. (Euclidean distance metric, Ward’s least-squares method (ward.D) for hierarchical clustering aggregation.) (B) List of the top 10 transcription factor families by gene count in each cluster.
Agronomy 15 02707 g007
Figure 8. Regulatory network of phenylpropanoid and flavonoid biosynthesis pathways. TF families (two or more genes) exhibiting network regulatory relationships within the phenylpropanoid and flavonoid biosynthesis pathways were visualized in Cytoscape. Node colors represent degree, with redder colors indicating higher degree values.
Agronomy 15 02707 g008
Disclaimer/Publisher’s Note: The statements, opinions and data contained in all publications are solely those of the individual author(s) and contributor(s) and not of MDPI and/or the editor(s). MDPI and/or the editor(s) disclaim responsibility for any injury to people or property resulting from any ideas, methods, instructions or products referred to in the content.