Article

Disturbance Characteristics of Subsoiling in Paddy Soil Based on Smoothed Particle Hydrodynamics (SPH)

1
School of Mechanical and Electrical Engineering, Huainan Normal University, Huainan 232038, China
2
Human-Computer Collaborative Robot Joint Laboratory of Anhui Province, Huainan 232038, China
3
College of Engineering, Nanjing Agricultural University, Nanjing 210031, China
*
Author to whom correspondence should be addressed.
Agronomy 2025, 15(12), 2695; https://doi.org/10.3390/agronomy15122695 (registering DOI)
Submission received: 22 October 2025 / Revised: 19 November 2025 / Accepted: 21 November 2025 / Published: 23 November 2025
(This article belongs to the Section Agricultural Biosystem and Biological Engineering)

Abstract

Subsoiling is an important technology in conservation tillage. The disturbance characteristics of paddy soil were simulated by smoothed particle hydrodynamics (SPH) in this paper in order to explore the optimal tillage depth of paddy soil in a rice–wheat rotation area. Firstly, a subsoiling experiment with five tillage depths was carried out by a self-made multi-functional in situ test-rig facility. Then, a three-layer-soil subsoiling model of a cultivated layer, plow pan, and subsoil layer was established based on the SPH method. Finally, the soil disturbance characteristics were analyzed from macroscopic and microscopic perspectives. The results showed that the average draft force in simulation was consistently lower than in the field, with a maximum error of 18.71%, and the field draft force fluctuated greatly. The soil block above the tine was not lifted up as a big block but broken into many small soil blocks and then lifted up, resulting in different displacements of the soil particles, but the relative position was unchanged from top to bottom. The particle displacements were concentrated above the tine, the stress was concentrated around the tine, while the velocity and acceleration were closely attached to the subsoiler. A “mole cavity” at 25 and 30 cm tillage depths existed at the bottom of the disturbance, which was consistent with the finding in the field. The disturbance area and specific draft were maximum and minimum at 20 cm tillage depth, respectively. These findings suggest that the optimal tillage depth was 20 cm for the rice–wheat rotation area. The results of the analysis provide a theoretical basis for the optimal design of subsequent subsoiling.

1. Introduction

As the level of mechanization gradually increases, agricultural machinery may cause soil compaction during field operations [1]. Soil compaction increased bulk density and mechanical resistance, forming a plow pan that reduces gas exchange and creates anaerobic conditions in the root zone, severely restricting plant growth and development. Approximately 68 million hectares of land, globally, have been affected by compaction [2]. Subsoiling is an important conservation tillage technique for solving soil compaction, which increases soil porosity, reduces soil strength without turning soil over, improves water infiltration, and increases the ability of crops to absorb nutrients and water from the subsoil, thereby benefiting crop growth and increasing yields [3,4]. Soil disturbance characteristics are an important part of subsoiling research, through which tillage-implement structures and tillage methods can be optimized.
Rice–wheat rotation is a high-yielding cropping pattern in the middle and lower reaches of the Yangtze River, with a planting area of about 4.8 million hectares [5]. However, the annual alternation of wet conditions in summer and dry conditions in winter, flooding during the rice season, and the long-term shallow rotation have led to soil hardening, low porosity, and a shallow cultivated layer [6], which seriously limit the yield and quality of rice and wheat. In order to improve the structural properties of paddy soils, in recent years, researchers [7,8] have explored the application of subsoiling technology in the South, which was widely used in the North. In view of the complexity and specificity of the soil structure of paddy soil, the theory of subsoiling applicable to the dry crop area in the north is not fully applicable to the rice–wheat rotation area in the south. Therefore, the process of subsoiling under the paddy soil in South China needs to be further studied.
With advances in computer technology, computer simulation methods have been widely applied. Simulation can observe soil disturbance at the microscopic level, which is helpful to understand the interaction patterns between tillage implements and soil so as to improve the design of subsoil machines and optimize tillage methods [9]. At present, there are three methods to simulate soil–tool interaction, i.e., the finite element method (FEM) [10,11], computational fluid dynamics (CFD) [12], the discrete element method (DEM) [13,14,15], and the coupling methods [16]. For the FEM, the soil was transformed into a solid element, which could only represent the tillage force and the failure and fracture of the soil element. The soil deformed significantly, or even stopped the calculation, and the movement of soil particles could not be observed [11]. For CFD, the soil was transformed into a fluid element, and its grid was fixed in space, which was not suitable for the deformation of the material boundary, and could not simulate the infinite deformation of soil [17]. For the DEM, it was a meshless method, which could be used to simulate the micro- and macro-deformation of soil particles. Through this function, researchers [18,19] could investigate the microlevel changes in soil particles during soil–tool interactions. However, the DEM could not directly calculate the stress–strain relationships and additionally required a complex method to calibrate soil mechanical parameters. In addition, the adhesion of soil particles in the DEM was relatively poor, which was good for dry soil but not good for wet adhesion paddy soil. In summary, good results are difficult to achieve using the above methods for large deformations, stress–strain, and complex soil–tool contact, especially for wet adhesion soil.
In recent years, the application of smoothed particle hydrodynamics (SPH) in large soil deformation is increasing [20,21]. The SPH is a Lagrangian meshless particle method, whose unique meshless properties have been widely applied to simulate large deformations such as fracture and brittle fracture of continuous structures. The SPH method is based on fluid dynamics theory and could be used to simulate various problems involving flow. Similarly, the SPH method could also be used to simulate soil–tool interactions [9]. For paddy soil, SPH could well describe the process of wet adhesion soil fragmentation and the bonding characteristics of wet adhesion soil. The soil macro-disturbance was caused by the collective movement of a large number of soil particles. Therefore, the soil bin model constructed using a large number of soil particles based on SPH could be applied to study the soil disturbance of subsoiling and obtain the macro- and micro-disturbance of soil particles in the process of subsoiling.
The aim and objectives of this paper were to (1) conduct field subsoiling experiments to obtain soil parameters and draft force; (2) within the SPH framework, a subsoiling model was developed using an elastoplastic soil constitutive model to simulate the tillage process; (3) obtain soil disturbance parameters from paddy soil simulation results and compare them with field experiments.

2. Materials and Methods

2.1. Experimental Site

The experimental site was located in a field near Babaiqiao Town (118°59′ E, 31°98′ N, 22.7 m above sea level), Luhe District, Nanjing City, Jiangsu Province, which was in the lower reaches of the Yangtze River basin and had a long history of rice–wheat rotation. The field experiment was conducted after the rice harvesting in November 2022. The soil was clay loam in texture, which contained 39.84% silt, 21.30% sand, and 38.86% clay. Soil physical properties from 0 to 50 cm after three replicates are shown in Table 1.

2.2. Experimental Method

This experiment was conducted on a self-made multi-functional in situ test-rig facility to ensure the reliability of field experiments. The test rig can be taken to any location for testing, is 8 m long and 1.8 m wide, consisting of a traction motor, movable carriage, control cabinet, lifting legs, drag force sensor, drag chain, etc., and its structure is shown in Figure 1. The movable carriage could be moved back and forth along the guide rails through its four wheels and drag chains. Four LKL-101/1T (Nanjing Lanke Automation Equipment Co., Ltd., Nanjing, China) drag force sensors were installed on the movable carriage to measure drag force with a range of 1 ton and a measurement error of ±1 kg. Data acquisition was performed using LabVIEW 2010 software (National Instruments Corporation, Austin, TX, USA) at a sampling frequency of 500 Hz. The drag force was obtained by subtracting the sum of the first two sensors’ forces from the sum of the last two sensors’ forces on the movable carriage. Due to insufficient strength of the drag chain, tillage speed was set to 0.05 m s−1. Since the appropriate subsoiling depth for paddy soil in southern China was unclear, this study conducted subsoiling experiments at 5 tillage depths (10, 15, 20, 25, and 30 cm).
The subsoiling distance for each tillage depth was 5 m, excluding the unstable working distances at the front and rear (1 m each); the middle 3 m was defined as the effective experimental distance. After each experiment, the test rig was moved 1 m laterally before the next experiment to prevent the overlapping of disturbed areas and damage to the next experiment area by the test-rig. The diagram of the field experiment is shown in Figure 2.

2.3. Smoothed Particle Hydrodynamics Model

The paddy soil–subsoiler interaction model mainly involved establishing a subsoiler and soil model, including establishing a geometric model, meshing, and defining material parameters, then using LS-DYNA R11.1.0 (ANSYS Corporation, Pittsburgh, PA, USA) for calculation, and finally analyzing calculation results. The calculation method was based on SPH for soil and FEM for the subsoiler.

2.3.1. Subsoiler Model

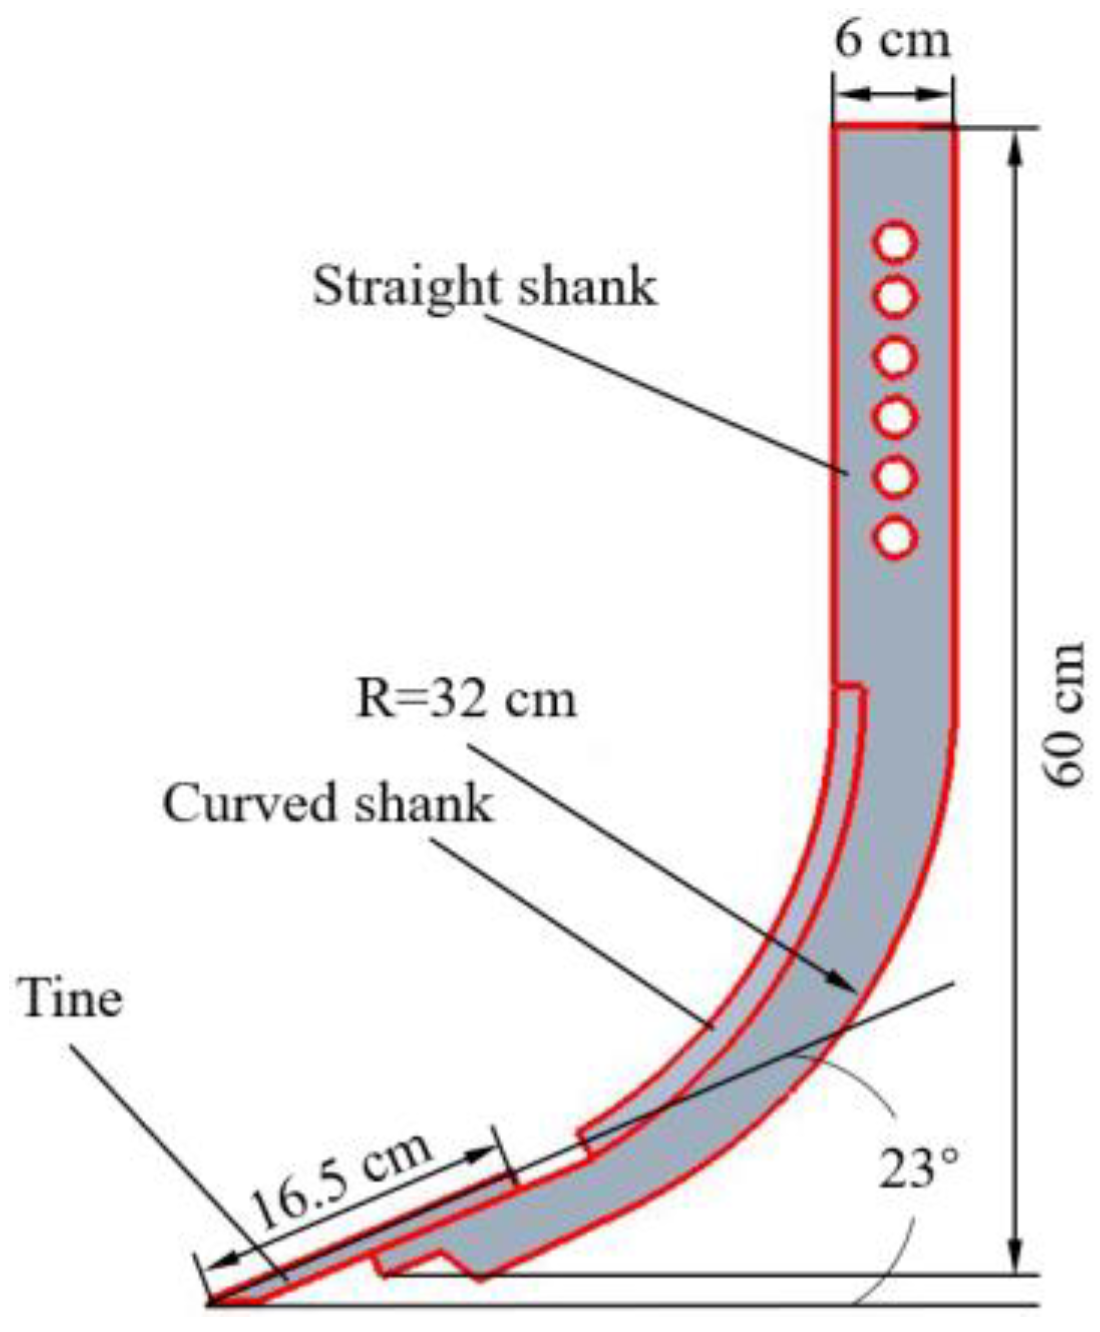
A chisel-type subsoiler was selected for this experiment (Figure 3), which mainly consists of tine, curved shank, and straight shank. The subsoiler was modeled on the Subsoiler Tines and Subsoiler Tine Shanks (JB/T 9788-1999). The height of the shank was 60 cm, the tine length was 16.5 cm, radius of the curved shank was 32 cm, the thickness of the shank was 2.5 cm, and the penetration angle of the subsoiler was 23°. In order to ensure the accuracy of the simulation and facilitate the division of the grid, this paper used Creo 10.0 software (Parametric Technology Corporation, Needham, MA, USA) to model the subsoiler at a 1:1 scale.

2.3.2. Soil Bin Model

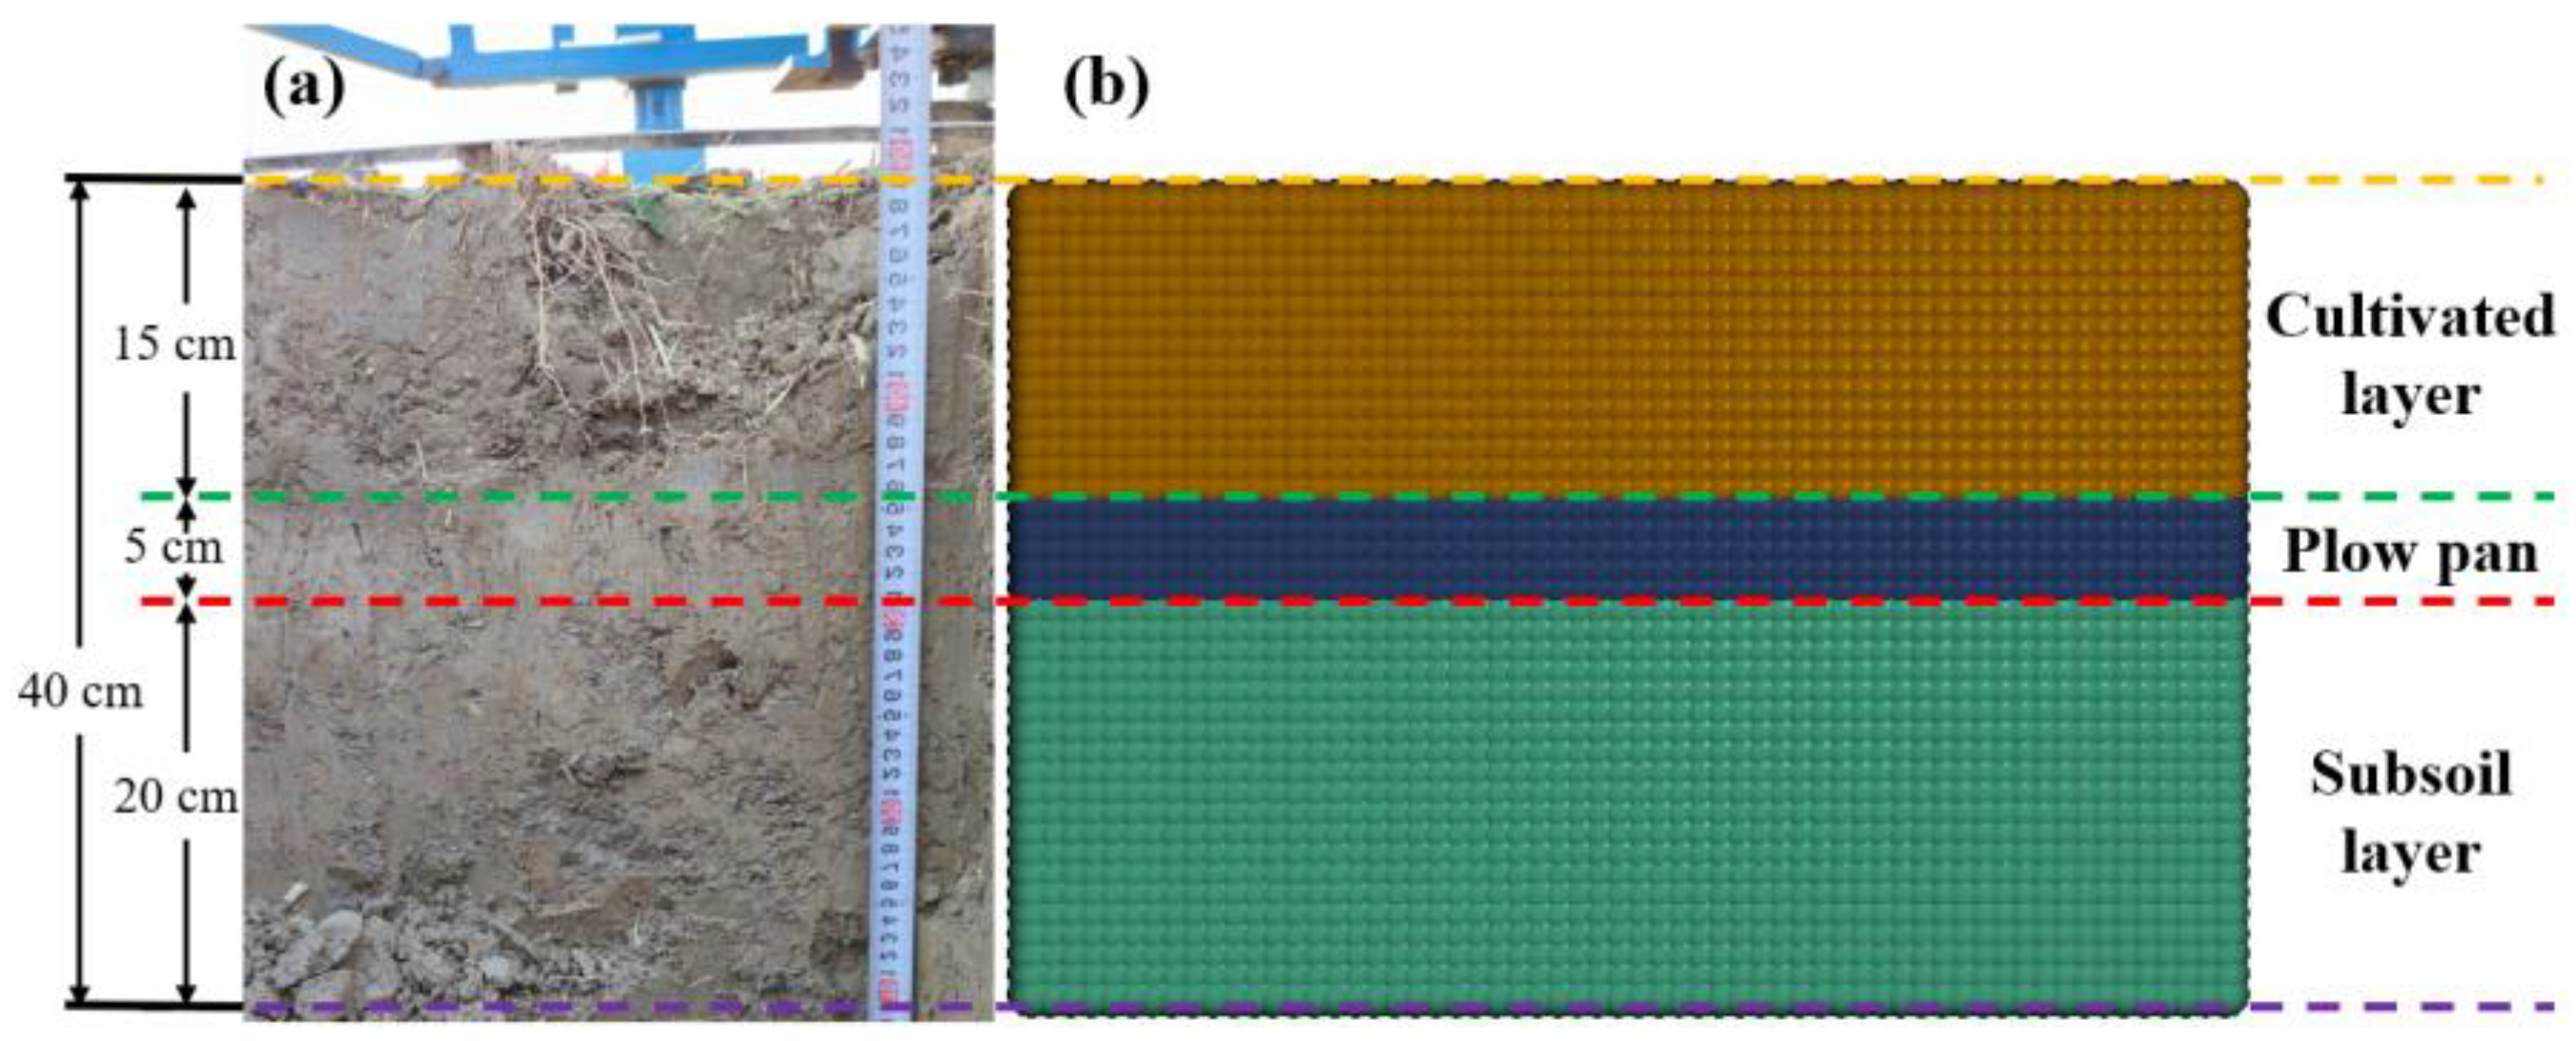
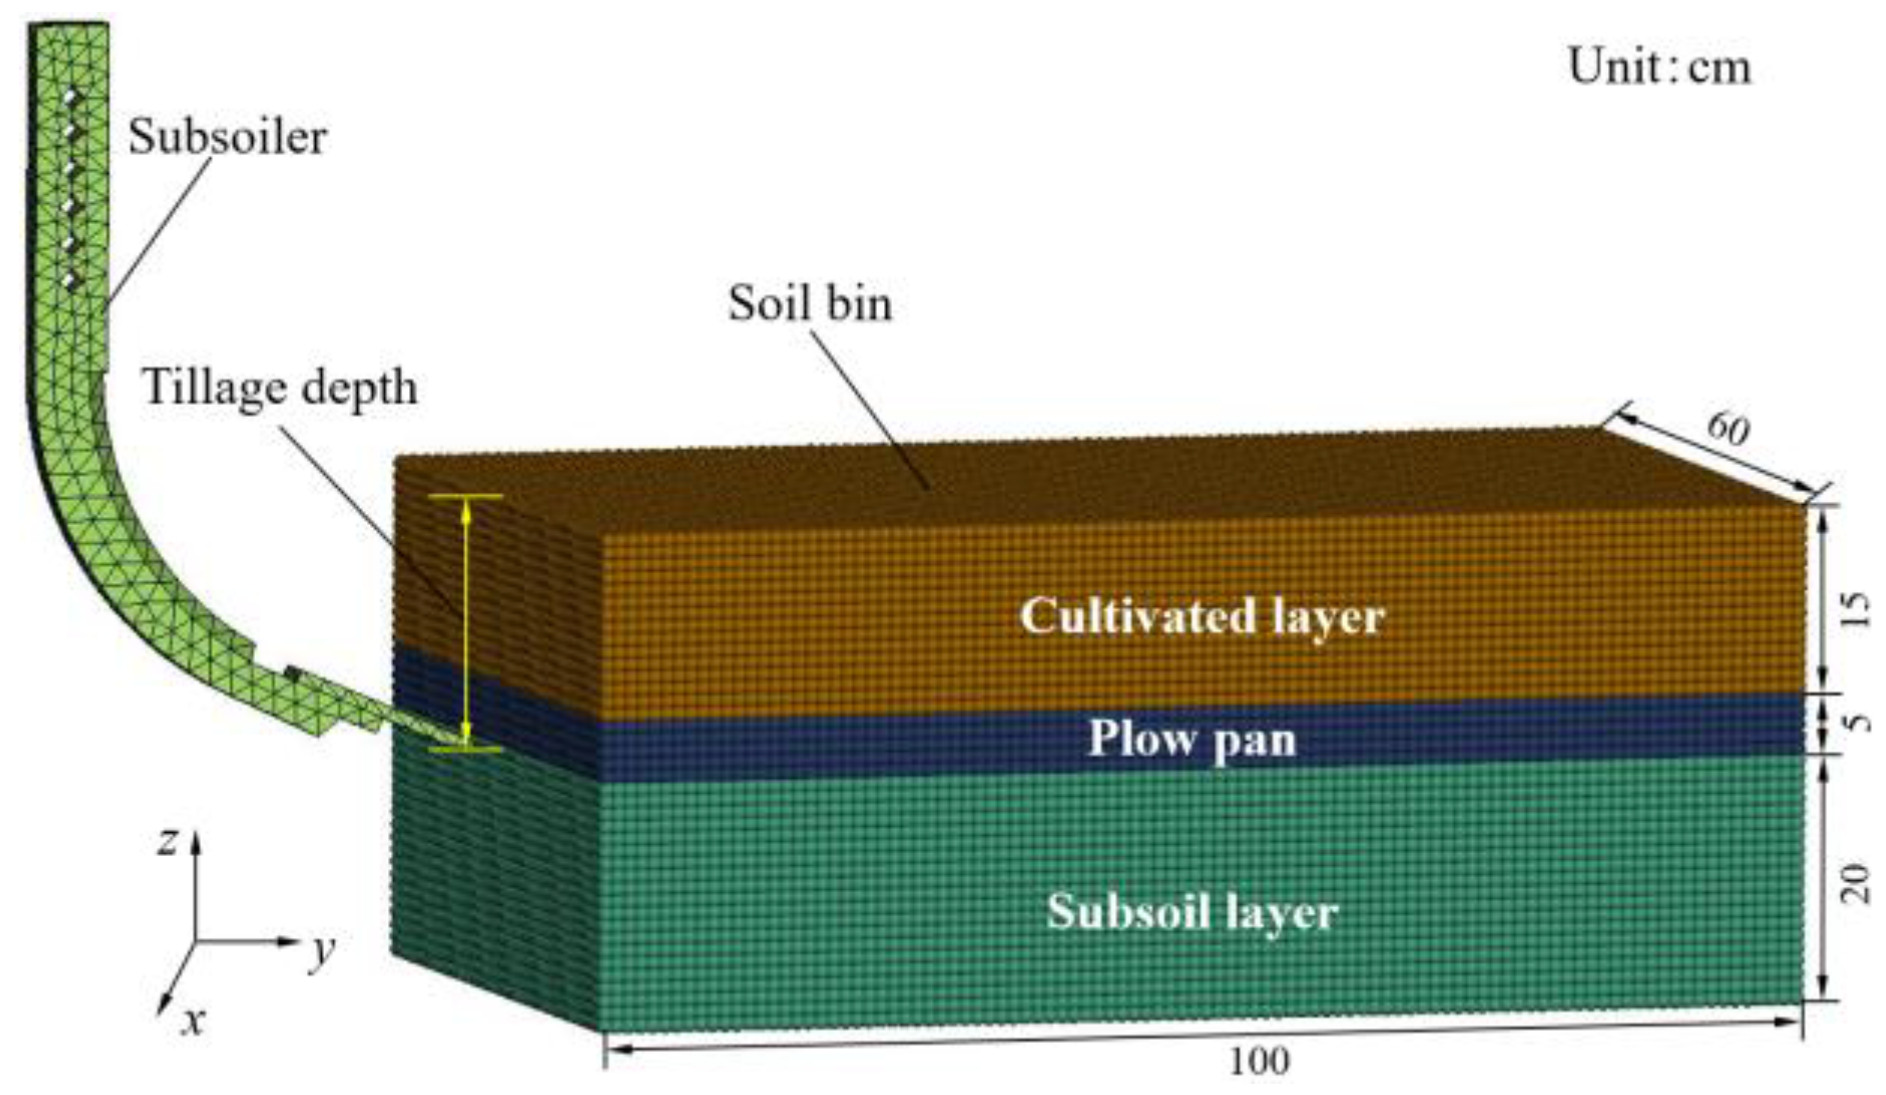
The soil bin model is usually cuboid, and the size of the cuboid has a significant impact on the subsoiling process [22]. Smaller cuboid dimensions cannot provide a comprehensive view of soil disturbance during subsoiling, while larger dimensions require high computer performance. Wei [18] studied the effects of the backswept angle, plow spacing, and penetration angle of the subsoiler on the draft force and soil disturbance of adhesion soil in a tropical sugarcane field. They established a simulated soil bin with dimensions of 150 cm in length, 100 cm in width, and 60 cm in height and divided the soil layer into three equal layers, i.e., tillage layer (0~15 cm), subsoil layer (15~30 cm), and plow bottom layer (30~45 cm). Xu [23] researched the tillage force and soil disturbance of the coupled bionic subsoiler in northern China through field experiments and simulation. In the simulation, a soil bin with a length of 120 cm, a width of 80 cm, and a height of 60 cm was established, and the simulated soil layer was divided into three layers, which were the cultivated layer (0~26 cm), plow pan (26~35 cm), and subsoil layer (35~60 cm). With reference to the above soil bin dimensions and based on the tillage speed, tillage depth, and computing performance of this paper, a soil bin with a length, width, and height of 100, 60, and 40 cm, respectively, was established in this paper.
For rice–wheat rotation soil, we have concluded that bulk density, water content, field capacity, and total porosity at a depth of 15~20 cm were significantly different from those at a depth of 0~15 cm, and soil penetration resistance at a depth of 15~20 cm was significantly different from those at depths of 0~15 cm and 20~40 cm (p < 0.05). This showed that the cultivated layer was located at a depth of 0~15 cm, the plow pan was at a depth of 15~20 cm, and the subsoil layer was below the depth of 20 cm [24]. Therefore, the soil bin model was established with three layers. Figure 4 shows that the soil in the cultivated layer was relatively loose, with more root distribution, large gaps between soil particles, and mainly composed of aggregates, and this layer had good soil structure, which was conducive to water infiltration, making it the main area for mechanical tillage. The soil in the plow pan was relatively compact and difficult for roots to penetrate, resulting in fewer roots, and the soil in this layer had less porosity and poor permeability. According to Table 1, it can be observed that the bulk density of the plow pan increased and the moisture content decreased compared to the cultivated layer. The subsoil layer was located below the plow pan, with less material exchange with the upper layer. The soil was compacted, with more iron and manganese spots, poor structure, and low nutrient content.

2.3.3. Material Model

The subsoiler was made of 65 Mn steel. The subsoiler material model was selected as a rigid material (MAT_RIGID) in LS-DYNA [25]. The density was 7860 kg m−3. The elastic modulus was 7.9 × 10¹⁰ Pa and Poisson’s ratio was 0.25 [26].
Soil is a three-phase material composed of soil particles, pore gas, and water, but in practical analysis, soil is often treated as a continuous medium [27,28]. The constitutive relationship of soil has a significant impact on the accuracy of subsoiling process simulation results [29]. Therefore, in order to improve the accuracy of simulation calculations, this paper referred to Yang [30] and selected MAT147 (MAT_FHWA_SOIL) as the soil material model, which was an isotropic material with damage that can be used for solid elements. Soil material parameters mainly included bulk density, water content, soil porosity, cohesion, internal friction angle, bulk modulus, and shear modulus, where cohesion and internal friction angle were determined using a direct shear test [27], while other parameters were obtained from the measured soil material parameters in the induction experiment site and the literature [11,31].
The soil direct shear test involved pushing the soil sample along a predetermined shear plane to failure and testing its deformation resistance. Shear strength was obtained from the relationship between shear stress and normal stress on a water-lubricated sliding surface based on the Mohr–Coulomb law [27]. Three random points were selected on the surface of the experimental area and soil samples were collected using a cut ring (area, 30 cm2, height, 2 cm). Soil samples were collected from the ground surface at intervals of 5 cm at each point, reaching a depth of 40 cm, with a total of eight layers. Four soil samples were obtained from each layer (one of which was reserved as a backup), for a total of 96 shear soil samples. After collection, the soil samples were sealed in cut ring boxes to prevent moisture evaporation and brought back to the laboratory for the direct shear test.
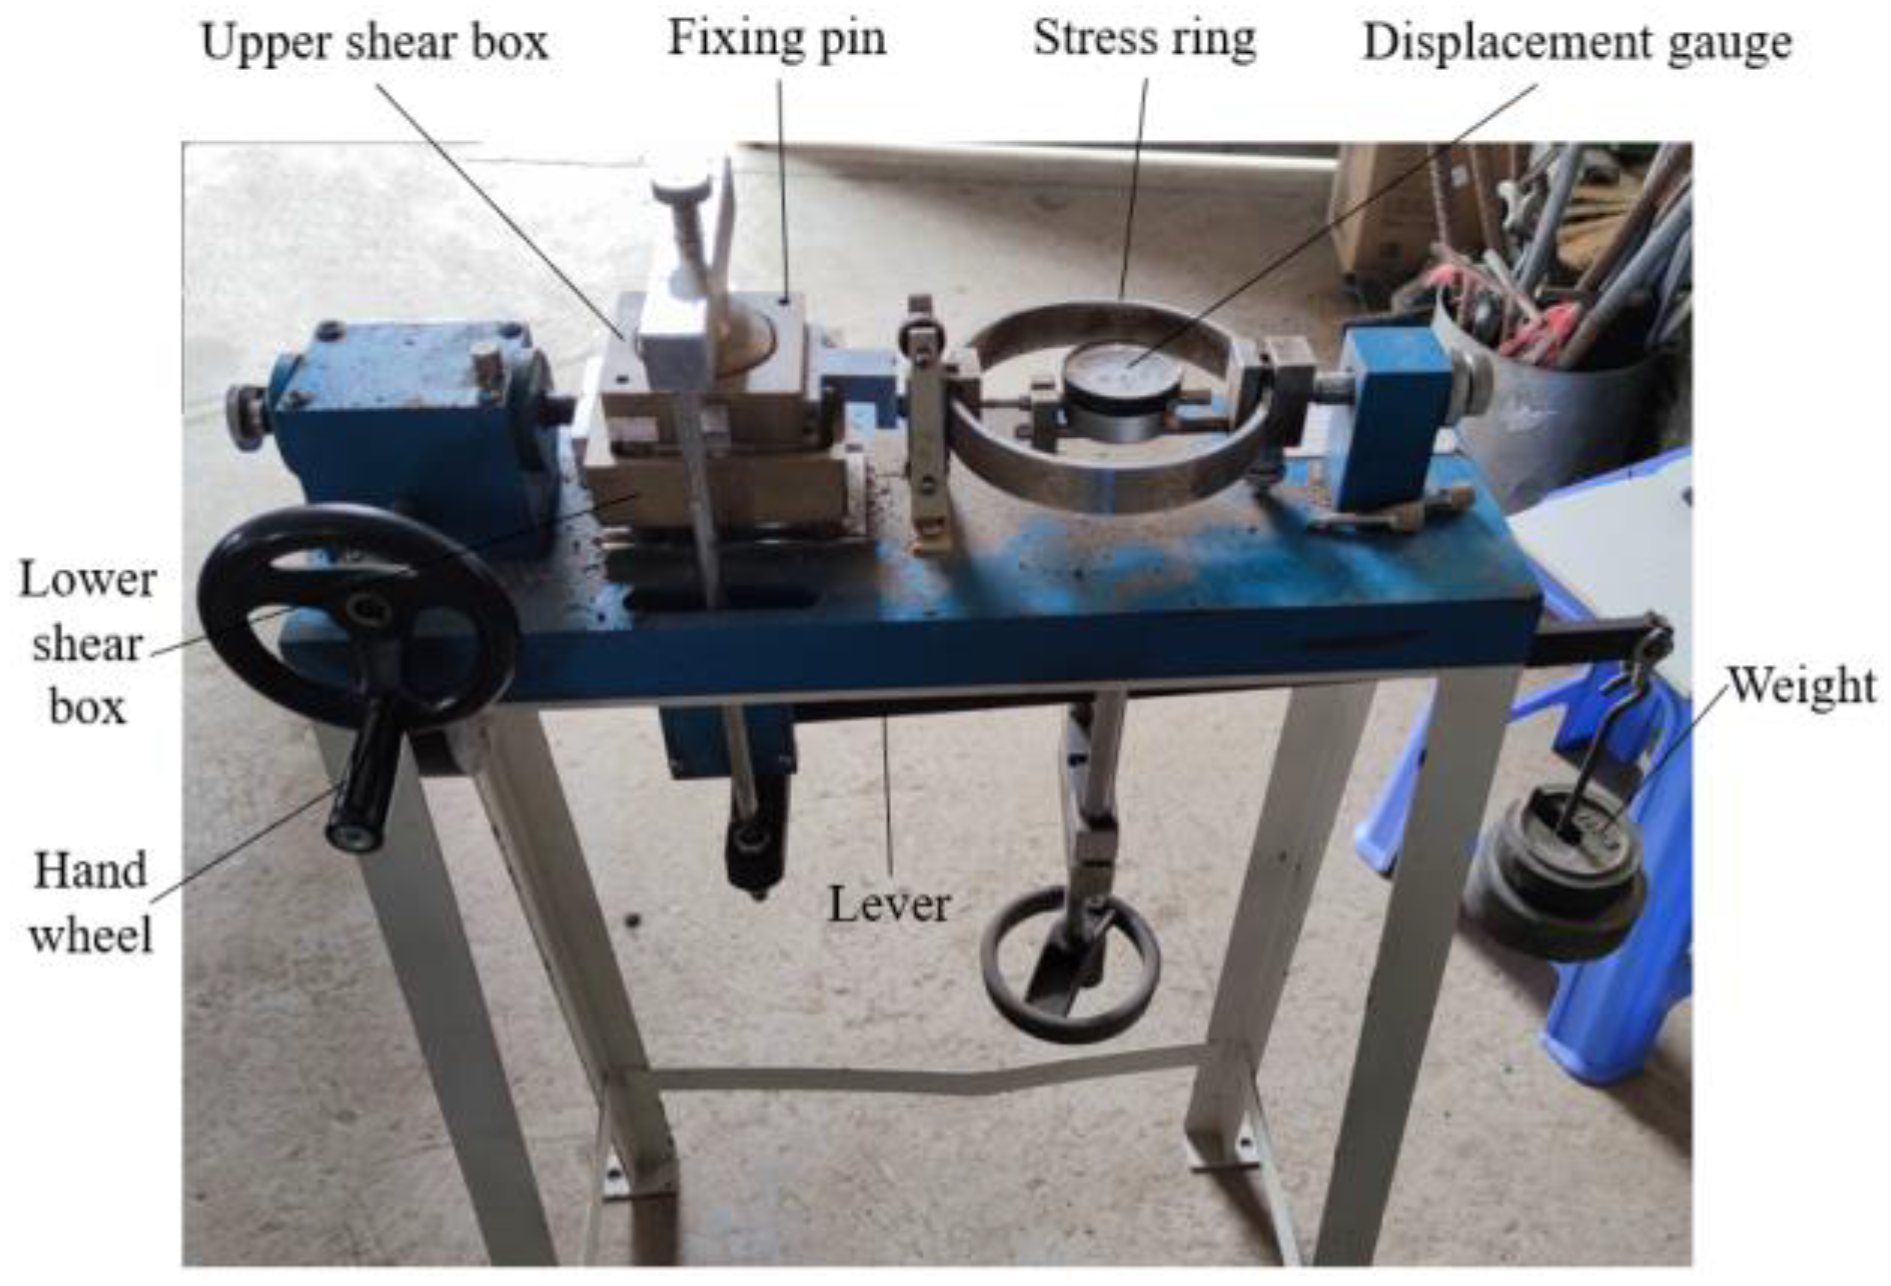
The direct shear test was conducted on direct shear equipment (Figure 5). The soil sample was placed in the shear box and lined with filter paper and permeable stones in sequence, then three specified normal stresses (100, 200, and 300 kPa) were applied to the soil sample using a lever and weights. Then we removed the fixing pin, turned the handwheel to move the lower shear box at a constant speed (2 mm s−1), causing the soil sample to undergo shear on the predetermined shear plane, while recording the displacement gauge, until shear stress reached its peak or showed a significant decrease. Finally, the above process was repeated three times to obtain shear strength under different vertical pressures, which was used to calculate the soil sample’s cohesion and internal friction angle under field conditions of undisturbed soil.
The cohesion and internal friction angle of the soil based on Coulomb’s Equation (1), linearly fitted with normal stress as a horizontal coordinate and shear stress as a vertical coordinate, are shown in Table 2.
τ = σ   t a n   φ + c
where τ   (kPa) is shear stress, c (kPa) is cohesive, σ   (kPa) is normal stress, and φ   (°) is internal friction angle.
Simulated soil parameters were obtained by averaging the soil physical parameters in Table 1 and the soil mechanical parameters in Table 2 according to three soil layers, i.e., the topsoil layer (0~15 cm), the plow pan (15~20 cm), and the subsoil layer (20~40 cm). The main soil material parameters for soil simulation are shown in Table 3.

2.3.4. Numerical Calculation Model

The simulation model of subsoiling is shown in Figure 6. The subsoiler was located at one end of the soil bin. The tillage speed was 0.05 m s−1, and tillage depth could be set independently when building the model. The number of soil bin nodes was 240,000, with 2168 subsoiler elements. Full constraints were applied to the outer boundary of the soil bin. The contact between the subsoiler and the soil was defined as a rigidly connected failed contact. The contact between the subsoiler and the soil was defined as point-to-surface contact, with a static friction coefficient of 0.6 and a dynamic friction coefficient of 0.5. In the simulation model, the force in the X direction represented the lateral force of the subsoiler, the force in the Y direction represented the draft force, and the force in the Z direction represented the lifting force of the subsoiler.

2.3.5. Data Analysis

A variance analysis (ANOVA) was conducted on parameters of simulated soil disturbance within a 95% confidence interval. Data in the table are shown as averages. The measure of the dispersion of tillage force is standard deviation. All analyses were performed using IBM SPSS Statistics 26.0 software (IBM Corporation, Armonk, NY, USA).

3. Results

3.1. Draft Force

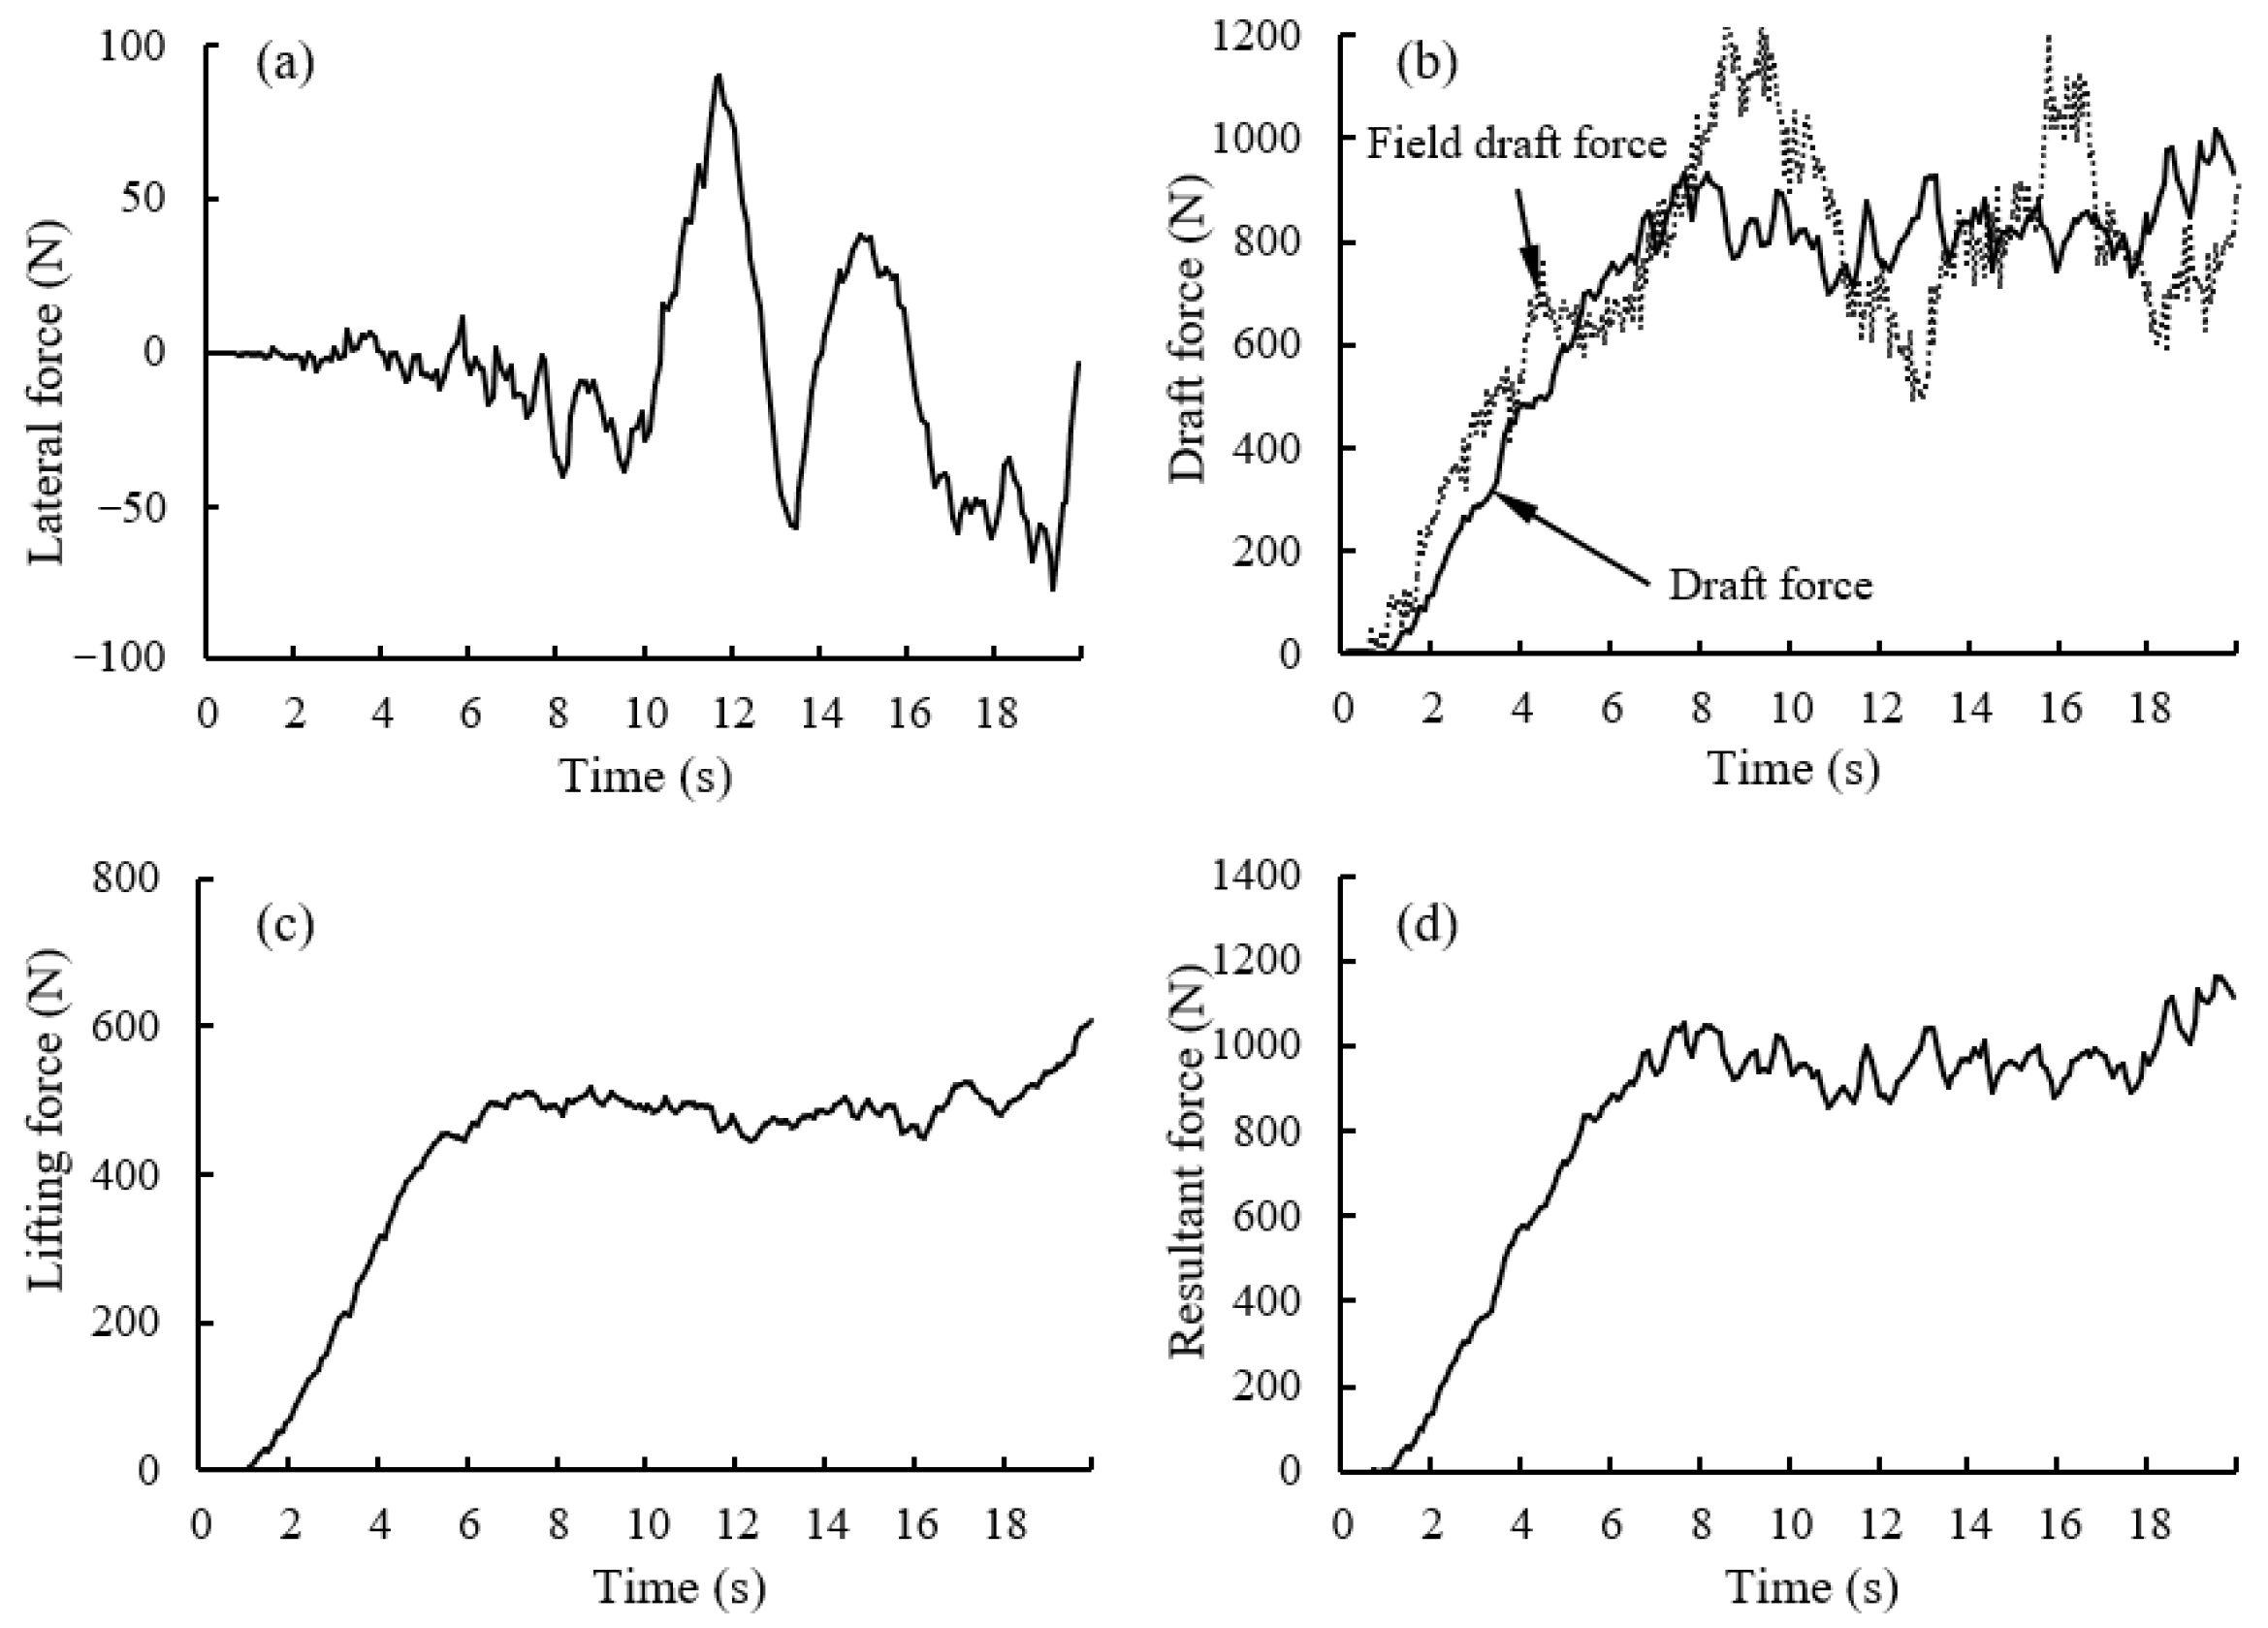
The lateral force, draft force, lifting force, resultant force of vector, and field draft force changed over time at 15 cm tillage depth, as shown in Figure 7, which showed that the lateral force alternated between positive and negative values over time, indicating that the subsoiler experienced alternating forces from left to right during subsoiling. The lifting force, draft force, resultant force, and field draft force all increased initially over time before fluctuating around a certain value. The force at other tillage depths showed a similar trend to that at 15 cm. The mean force and standard deviation at different tillage depths obtained in stable fluctuation (8–18 s) are shown in Table 4.
Table 4 shows that the simulated draft force was lower than the field draft force. This difference may be due to the presence of root-fixed soil in field-cultivated layer. The draft force during the stable fluctuations in Figure 7b shows that, compared to the simulation, the field draft force had larger fluctuations (higher standard deviation) than those in the simulation.
The negative lateral forces indicated that the force direction was opposite to the positive direction of the coordinate axis. Theoretically, the lateral force should be 0 N, but in practice it was not, which indicated that the lateral force caused by the subsoiler during tillage was random. Lateral forces at different tillage depths (10, 15, 20, 25, and 30 cm) accounted for 3.68%, 0.24%, 0.05%, 0.61%, and 0.47% of their respective draft forces, respectively. Therefore, the lateral forces were relatively small compared to the draft forces, but their presence was beneficial for lateral soil fragmentation.
The resultant force was the vector of lateral force, draft force, and lifting force. The vectorial forces of lifting force and draft force at different tillage depths (10, 15, 20, 25, and 30 cm) were calculated using the Pythagorean theorem, which were 675.45 N, 950.27 N, 1653.05 N, 3507.92 N, and 5751.01 N, respectively, with a small difference from the resultant force. The angles of lifting force and draft force obtained through inverse trigonometric functions at different tillage depths (10, 15, 20, 25, and 30 cm) were 28.25°, 30.83°, 27.19°, 22.20°, and 19.78°, respectively. These angles did not correspond to the penetration angle of 23°, indicating that draft force and lifting force were not related to the penetration angle.

3.2. Soil Disturbance Characteristics

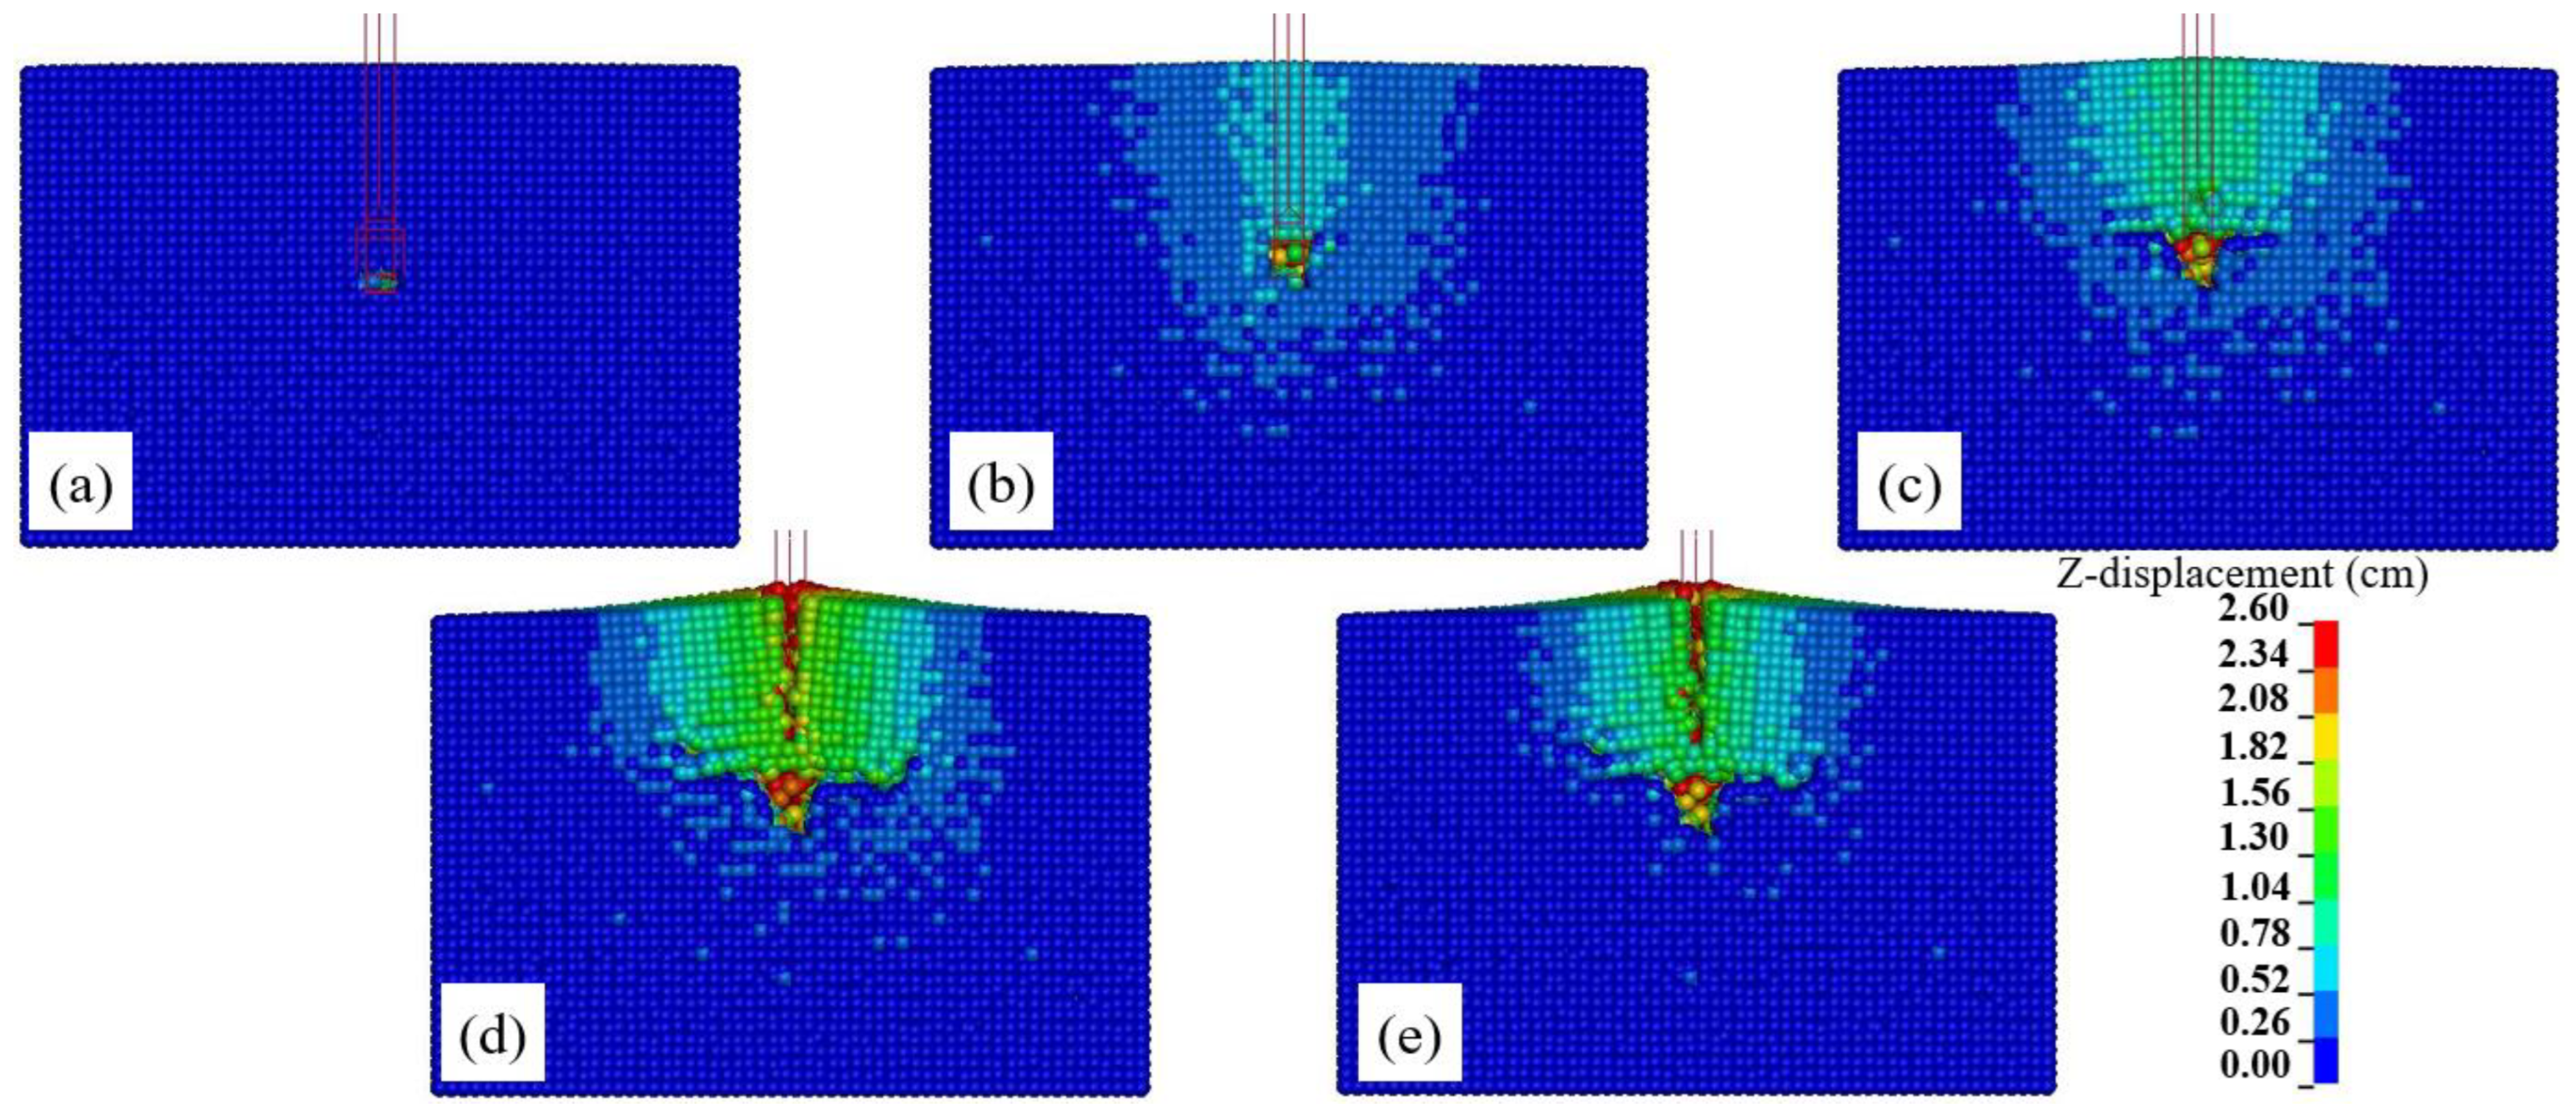
The displacement changes along the −Z and Y directions were captured from the dynamic disturbance process and arranged chronologically, as shown in Figure 8 and Figure 9. Due to the similarity of disturbance processes across all tillage depths, the subsoiling process at a tillage depth of 20 cm, which showed the maximum disturbance range, was selected for analysis. At 2 s, the subsoiler tine entered the soil, slightly lifting the soil at the tine without disturbing the entire flank; the whole soil surface was undisturbed (Figure 8a and Figure 9a). At 3.5 s, the subsoiler began to enter the soil, disturbing the soil both above and below the tine. At this stage, the soil surface began to rise slightly, with very little soil being lifted (Figure 8b and Figure 9b). At 5 s, the soil was sheared by the subsoiler, the disturbed area was further expanded, and the height of surface uplift further increased. At this stage, small cracks appeared on the surface and the area of soil uplift further expanded (Figure 8c and Figure 9c). At 8 s, the subsoiler’s curved shank entered the soil, the soil uplift reached its maximum, and a fissure formed next to the subsoiler. At this stage, the disturbance area reached its maximum, a distinct fissure appeared on the surface, and the height of surface uplift reached its highest (Figure 8d and Figure 9d). At 12 s, the subsoiler passed through, soil fell back, and the disturbed area became small (Figure 8e and Figure 9e). The greatest disturbance occurred at the tine of the subsoiler. As the subsoiler continued forward, surface cracks were continuously generated, and the height of disturbance was greatest beside the subsoiler.

3.3. Soil Particle Displacement

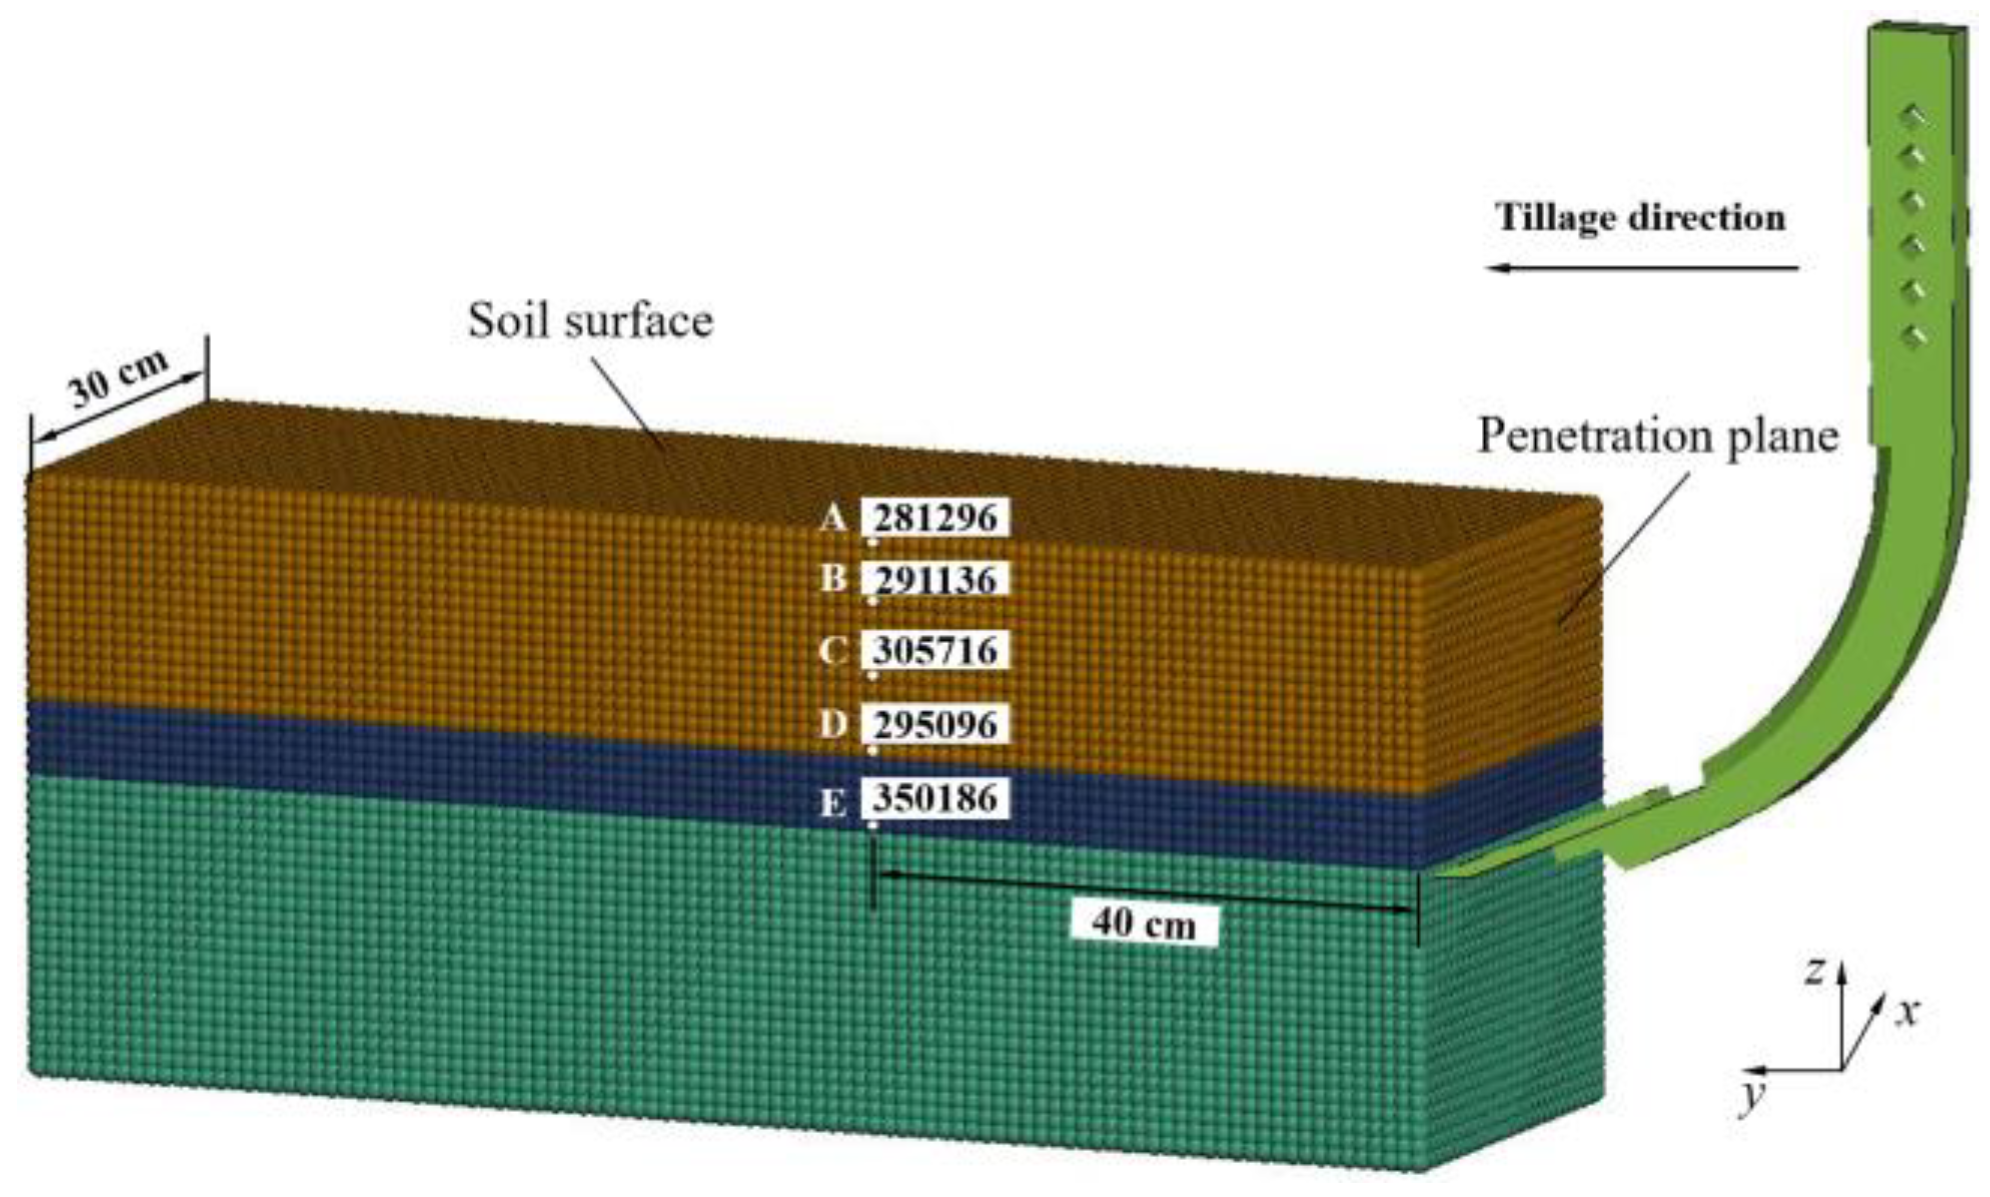
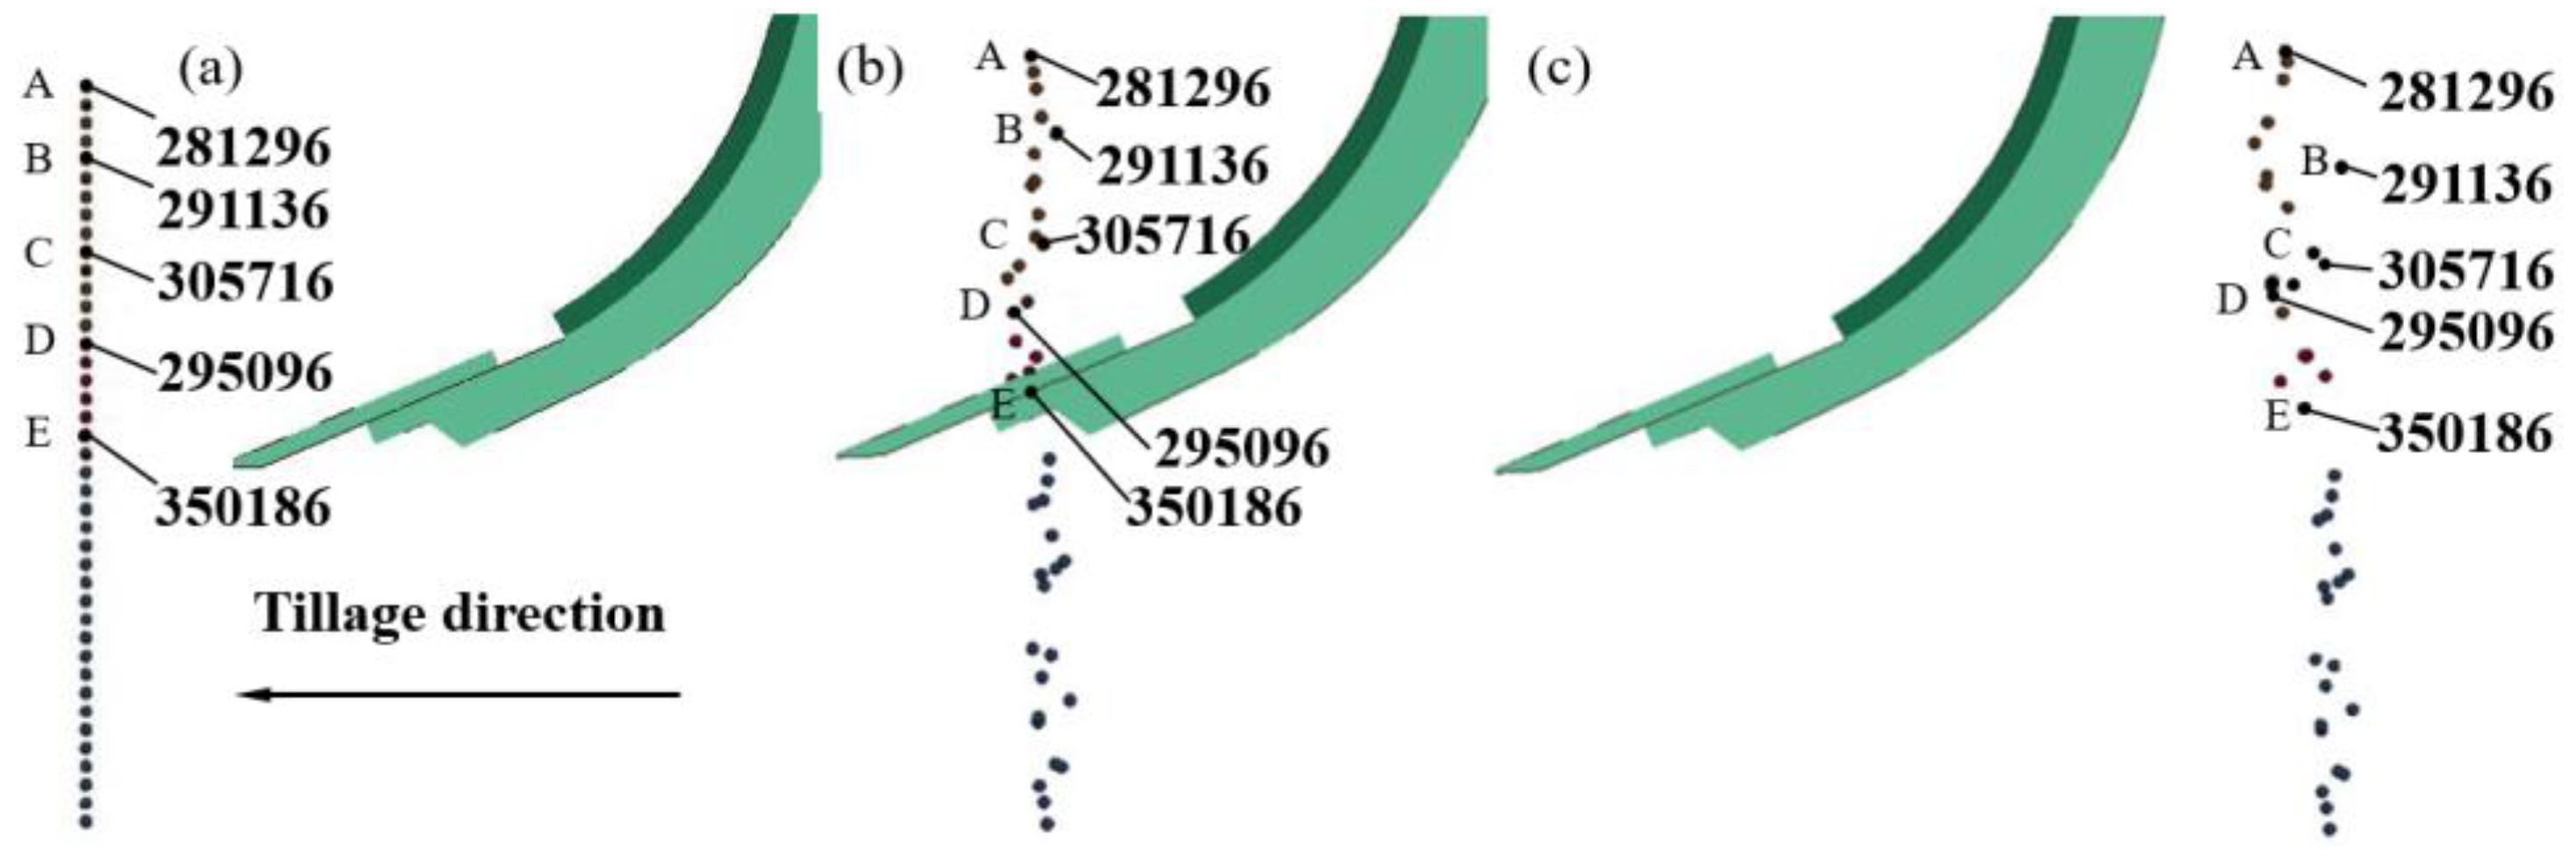
Field experiments could not observe the movement of soil particles, particularly the movement processes of deep soil particles, thereby limiting the optimization of the subsoiler and guidance of the tillage practices [6]. To observe the movement of internal soil particles, referring to the methodology of Ding [26], representative soil particles and tillage depth of 20 cm were selected to analyze their displacement change in X, Y, and Z directions during subsoiling. Selected particles were located 40 cm from the penetration plane in the Y-direction and at depths of 0, 5, 10, 15, and 20 cm below the soil surface, with node numbers 281296, 291136, 305716, 295096, and 350186. For analytical convenience, the nodes were designated as A, B, C, D, and E, respectively (Figure 10).
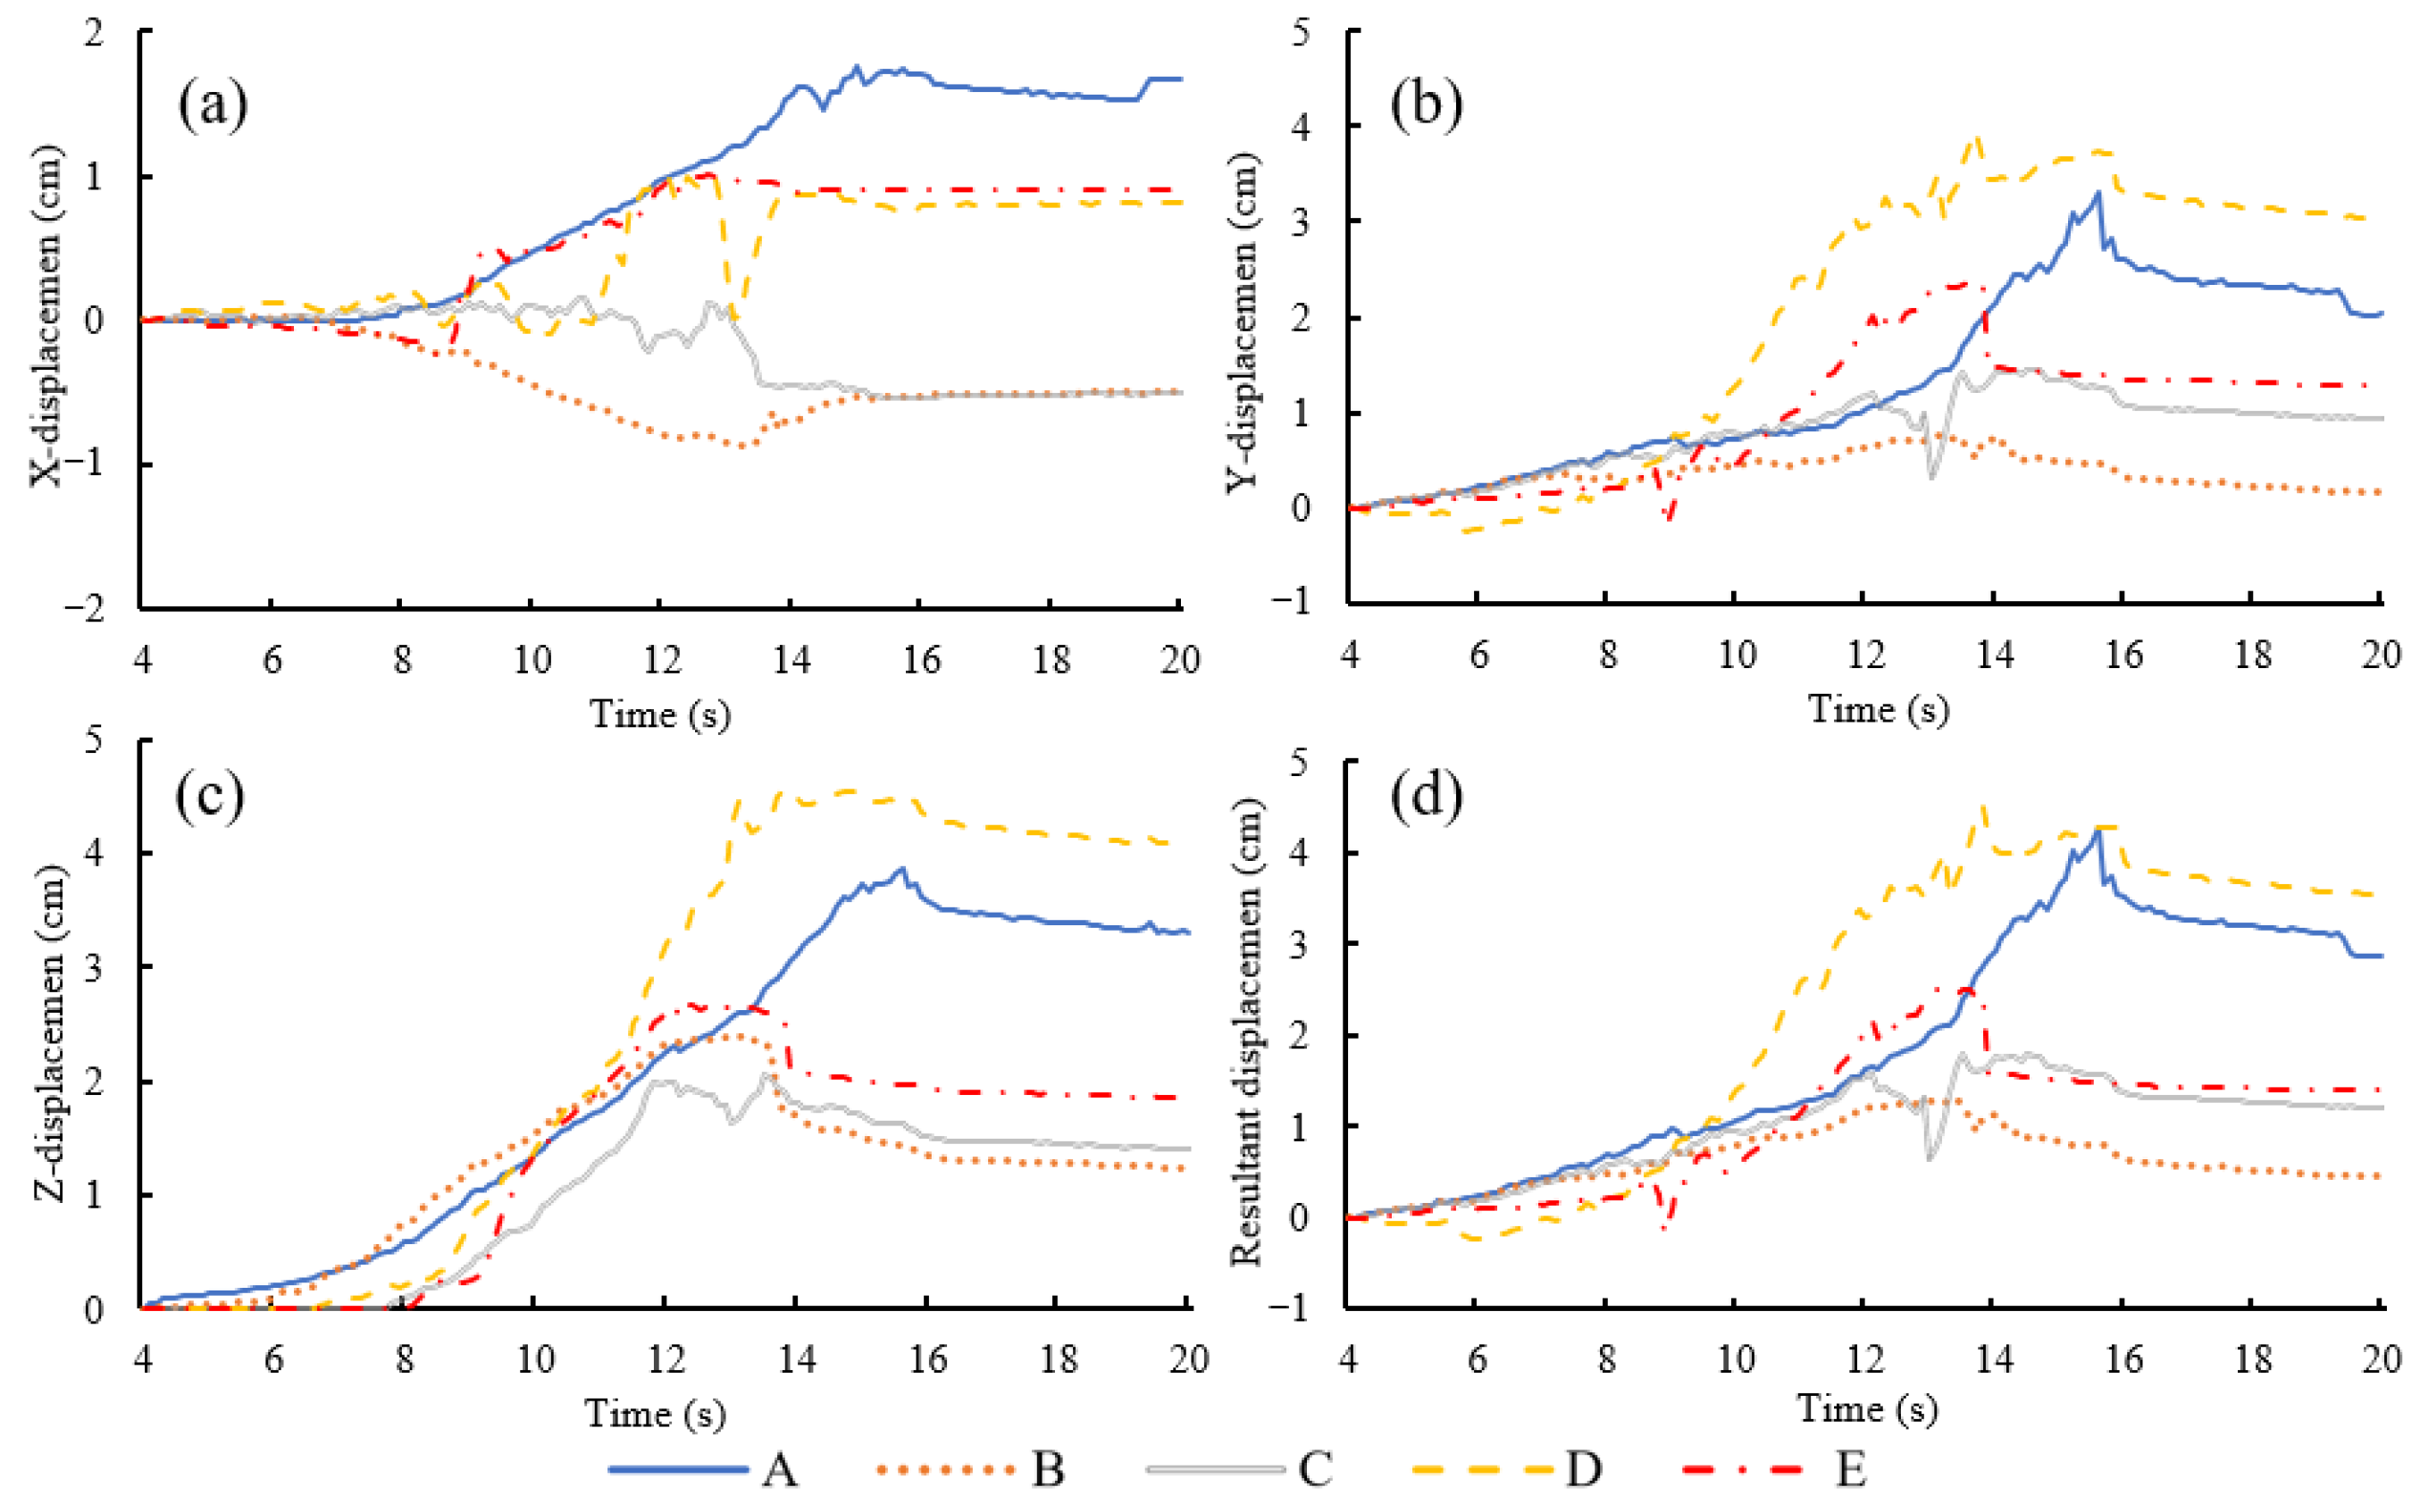
The displacement of different particles over time is shown in Figure 11. As the subsoiler did not disturb the soil particles during the first 4 s, the displacement curve was plotted starting from 4 s. The selected soil particles were lifted by the tine and curved shank for approximately 10 to 16 s. Figure 11a shows that particle A at the soil surface had the largest lateral displacement (along the X direction), followed by particles B and C with the same displacement. The five selected soil particles moved towards both sides of the subsoiler under its influence, resulting in both positive and negative displacements, with particles A, D, and E displaced on one side and particles B and C on the other side. Additionally, the subsoiler reached the position of the particles in 12 s; however, the particles moved at 7 s, indicating that the particles were influenced by other particles rather than the subsoiler. This showed that the disturbance distance in the Y direction was approximately 25 cm. Figure 11b shows that forward displacement corresponds to Y direction displacement, which was D > A > E > C > B. All displacements were positive values, indicating that all soil particles moved forward. The displacement of soil particles initially increased before decreasing, showing that after the subsoiler passed, soil particles fell back, resulting in reduced displacement. Figure 11c shows that the maximum lift heights of particles were D > A > E > C > B, which was different from the findings of Ding [26], who observed that particles in the lowest layer were lifted and had the largest displacement. This may be because when the subsoiler worked on the large clod, which contained the five soil particles, it fractured into multiple smaller clods. Multiple small soil clods were displaced differently under the force of the subsoiler, as shown in Figure 12. The soil block containing particle E had been separated from the tine. Particle D may have been continuously climbed by the curved shank. All other particles slid sideways. Even though their displacements differ, the final relative positions of the five particles remained unchanged. All displacements were positive values, indicating that all soil particles moved up. All particles fell back at 16 s after the subsoiler had passed. Figure 11d shows that the change in resultant displacement was similar to that in Y direction displacement, which was consistent with the force changes in Figure 7b,d. Theoretically, soil particles primarily move upward and forward during subsoiling. However, as shown in Figure 11 and Figure 12, this was not the case in practice. Therefore, the structure of the subsoiler should be optimized to ensure all soil particles move upward and forward.

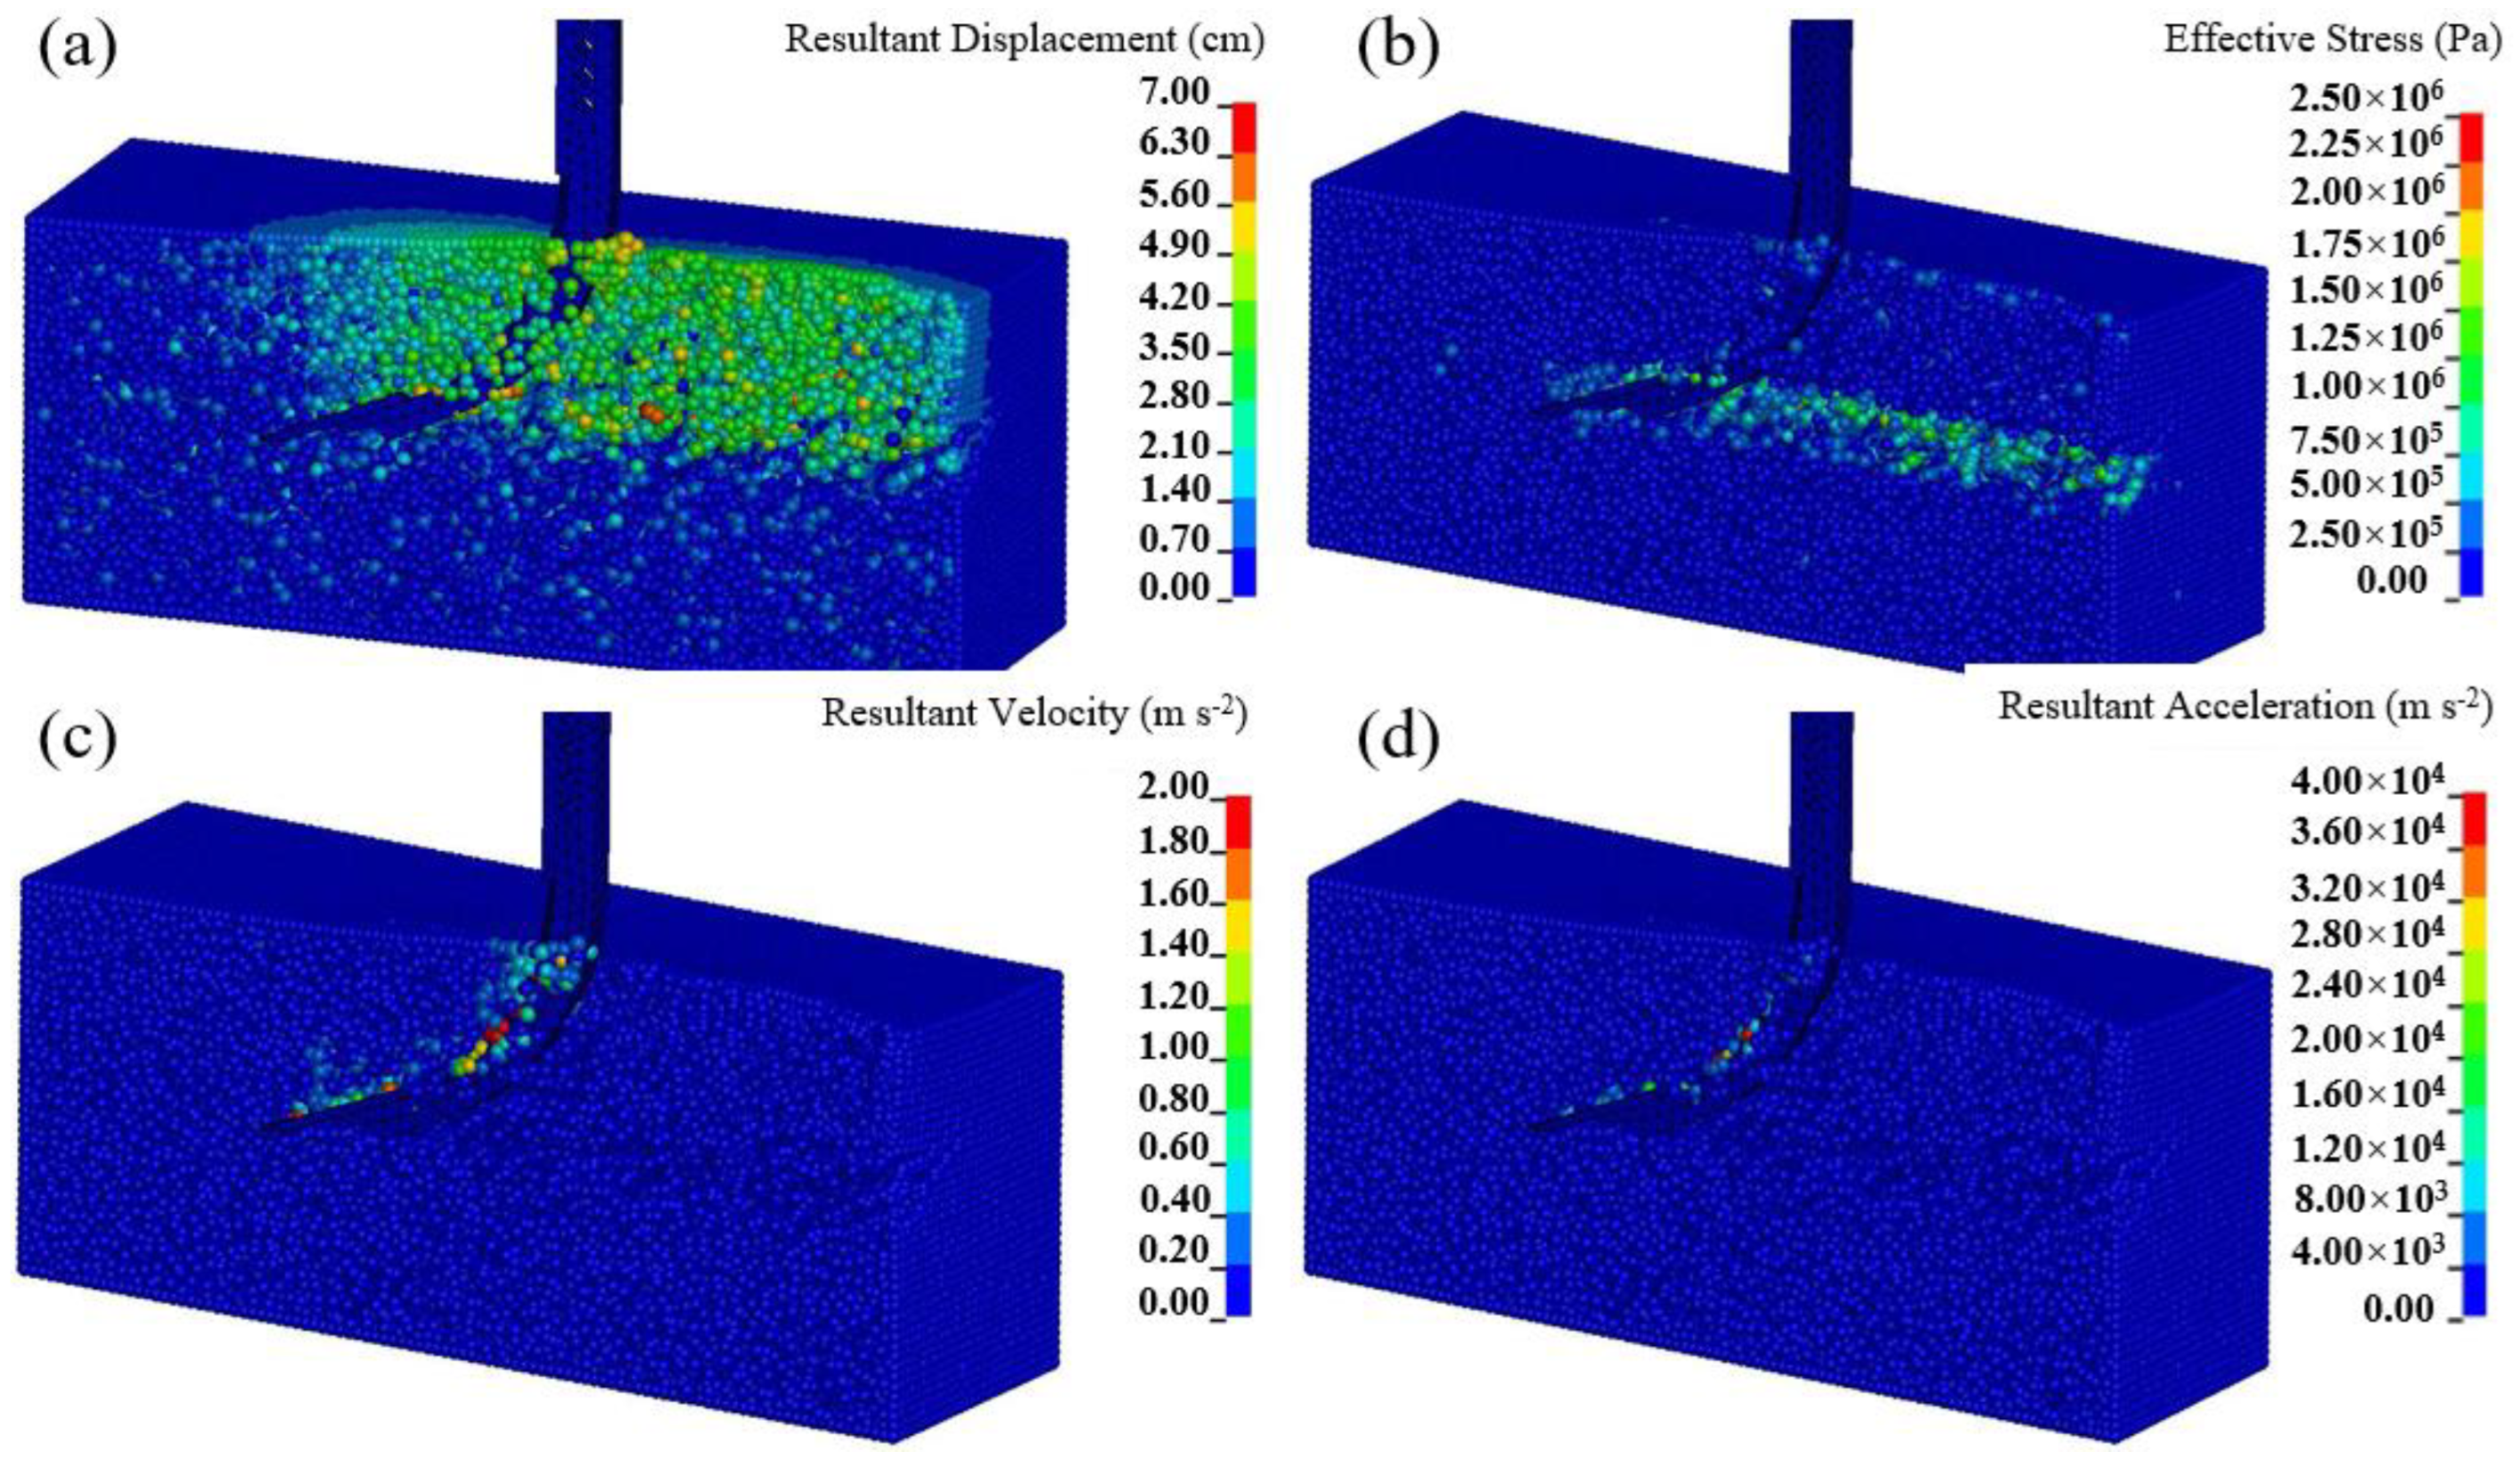
3.4. Soil Particle Distribution in Soil Profile

The soil bin was divided into two parts along the forward direction of the subsoiler to analyze displacement, stress, velocity, and acceleration. Analysis was conducted using a tillage condition with a tillage depth of 20 cm and a time of 15 s, and the results for other times and tillage depths were similar. Figure 13a shows the distribution of resultant displacement. The majority of disturbed soil was located above the tine. Most soil displacement distribution was between 2.8 and 4.2 cm, with surface soil being lifted by the subsoiler. Figure 13b shows that greater soil stress (between 7.5 × 10⁵ and 1.5 × 10⁶ Pa) was concentrated around the tine. After the subsoiler passes through, there is residual stress in the tine area, which may be because some soil at the tine area was overhead after the soil was lifted, thus creating residual stress. Figure 13c shows that soil particles with higher velocities were distributed around the subsoiler, with smaller distribution areas. The maximum velocity was distributed along the curved shank, which was consistent with the findings of Wang [32]. This was because the curved shank’s function was soil climbing and cutting. Figure 13d shows that the distribution of resultant acceleration was similar to the velocity distribution. The acceleration indicated that soil particles were affected by force. The force distribution of soil particles was the same as its acceleration. This study showed that the stresses and forces were concentrated around the subsoiler and the distribution range was small, and the structure of the subsoiler could be optimized to increase the distribution range and increase soil disturbance.

3.5. Soil Disturbance Profile

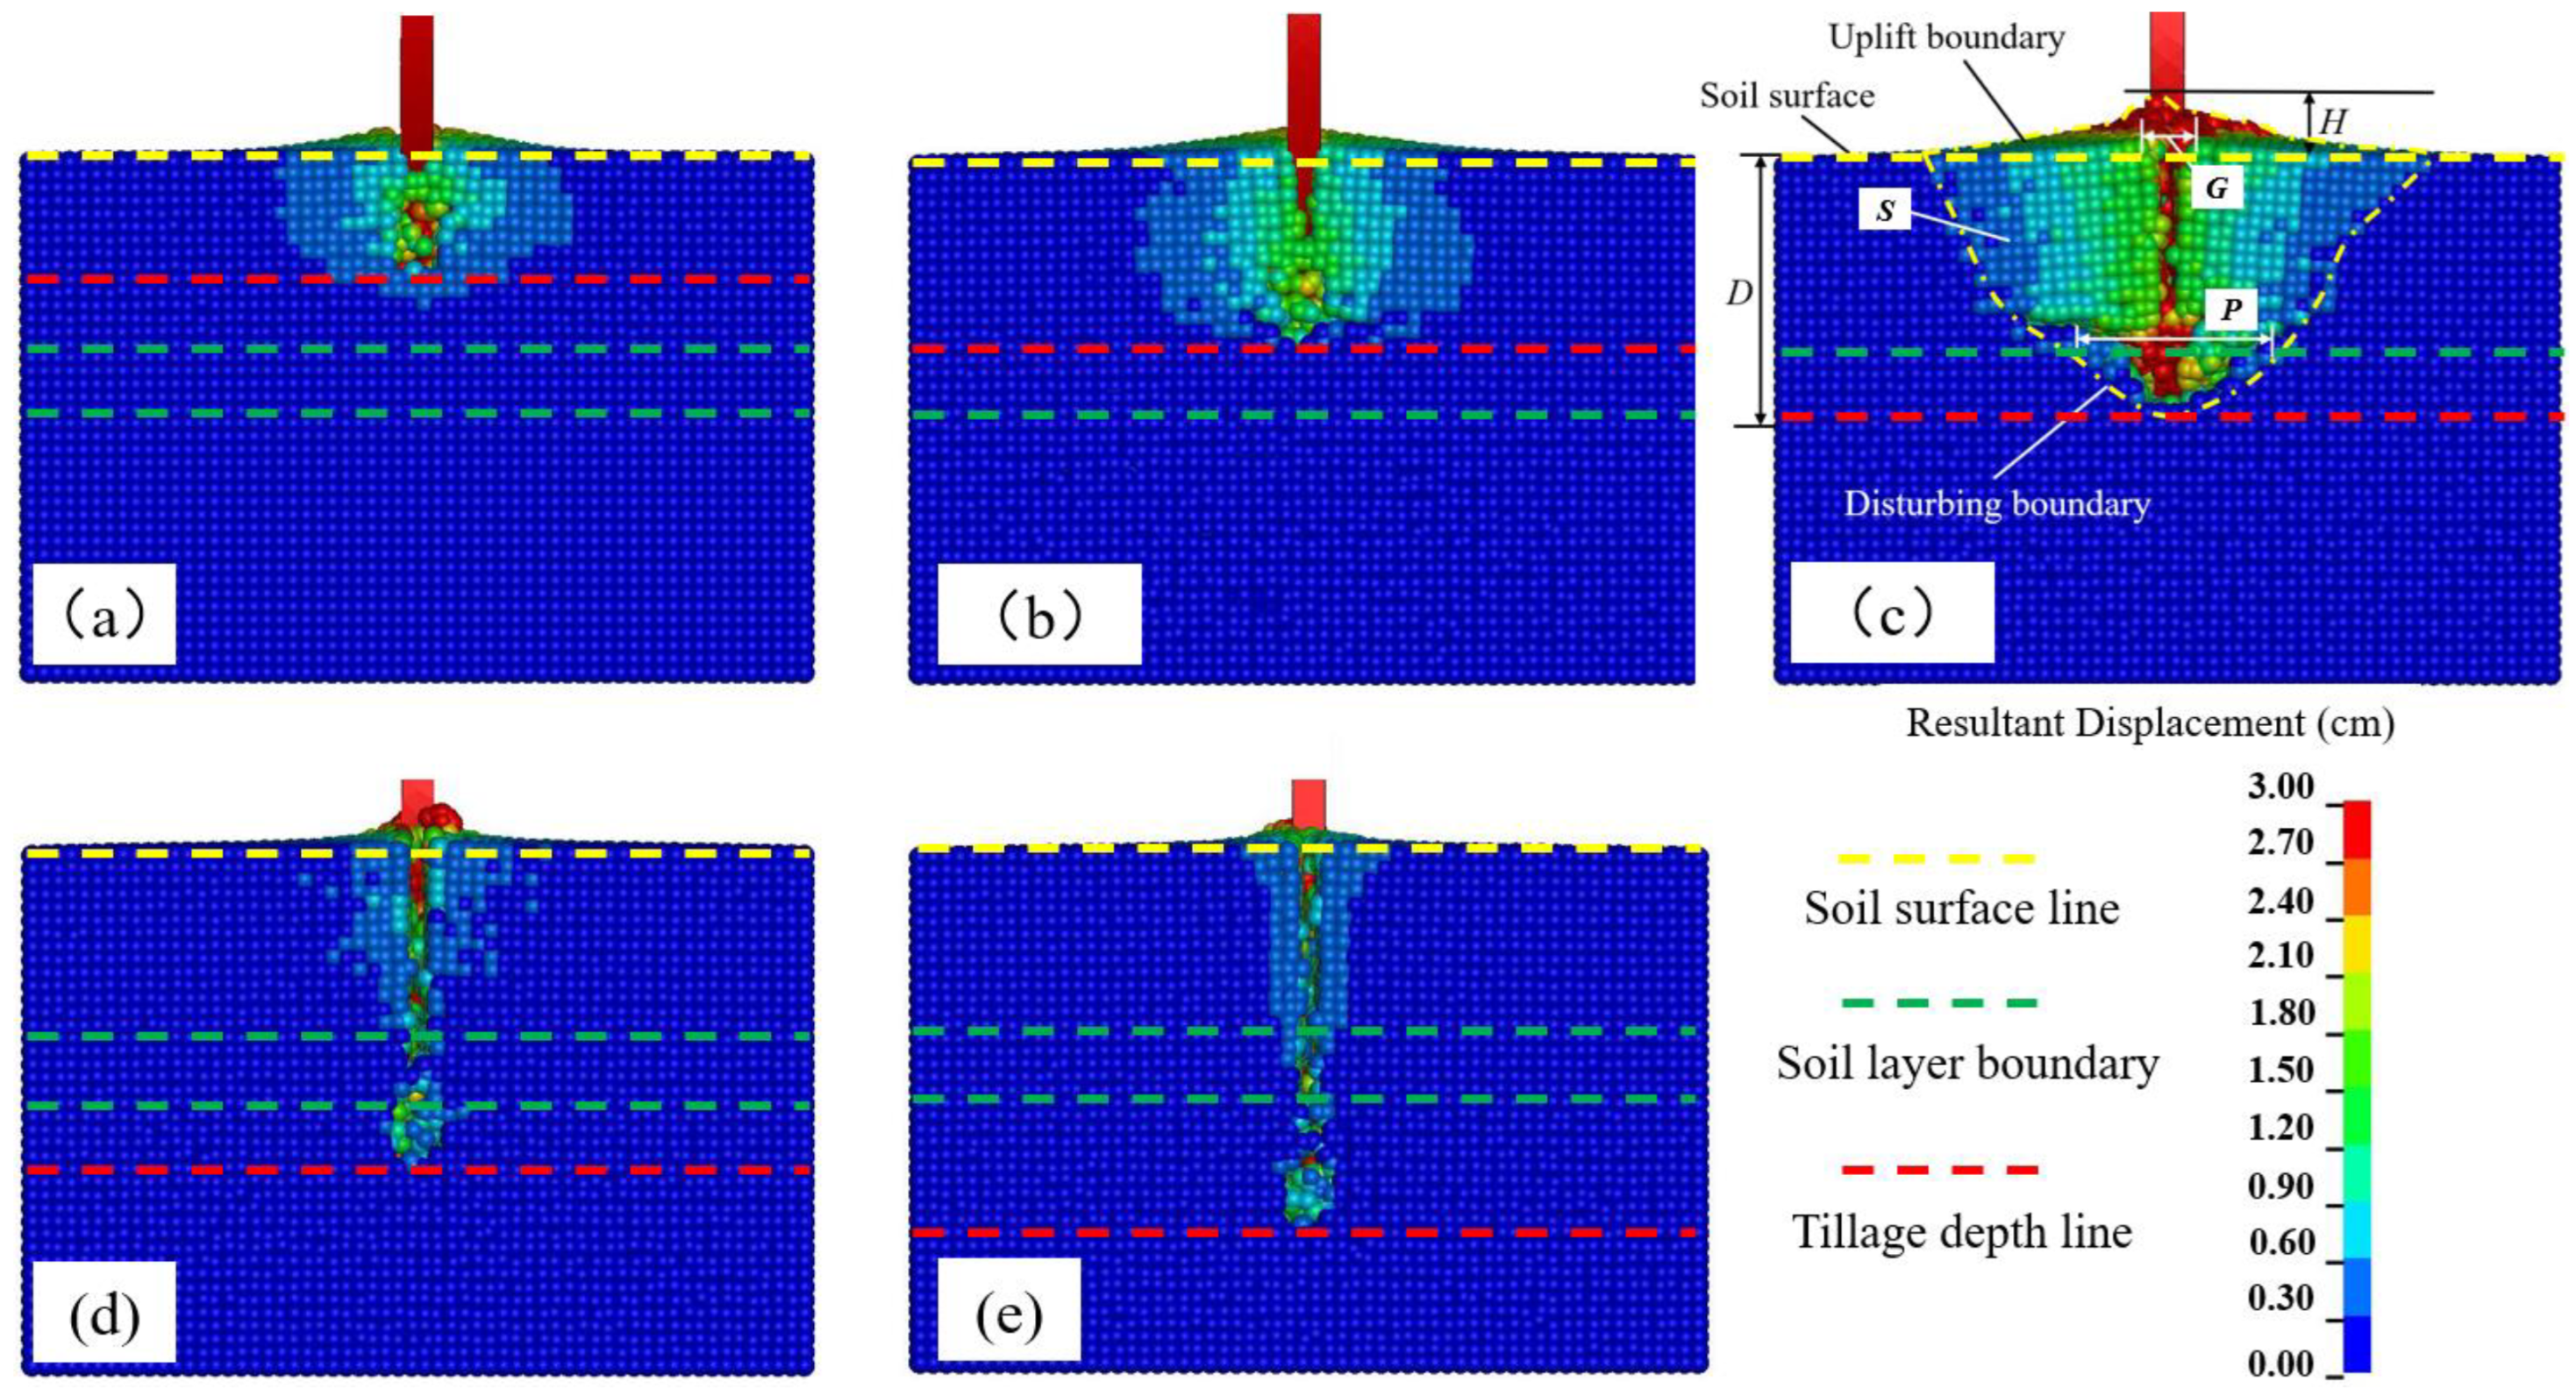
After subsoiling, the subsoiling disturbance areas of penetration planes with different tillage depths after 15 s are shown in Figure 14, where the same scale (between 0 and 3 cm) of resultant displacement is used as the boundary for disturbed areas. Figure 14a shows that soil disturbance was greater on both sides of the subsoiler; the further away from the subsoiler, the more the disturbance decreased. Figure 14b shows that the disturbance area became larger. Figure 14c shows that the subsoiler completely destroyed the plow pan. Significant cracks formed at the interface between the cultivated layer and the plow pan, with the soil above the cracks being lifted and displaced significantly. Compared to tillage depths of 10 and 15 cm, the disturbance area was significantly larger. Figure 14d shows that the disturbance area at a tillage depth of 25 cm was significantly smaller than that at a tillage depth of 20 cm, which was deeper than the plow pan. Figure 14e shows the curved shank of the subsoiler was completely immersed in the soil, where the impeded soil made upward movement difficult. This resulted in less disturbed soil, with a “mole cavity” forming beneath the subsoiler.
The soil surface disturbance observed at different tillage depths along the −Z direction is shown in Figure 15. The disturbed area increased with a tillage depth from 10 to 20 cm, decreased at 25 and 30 cm, and reached its maximum at a tillage depth of 20 cm. Soil cracks were not distributed symmetrically along forward tillage. This was due to the fact that soil failure and fracture occurred randomly during the tillage process.
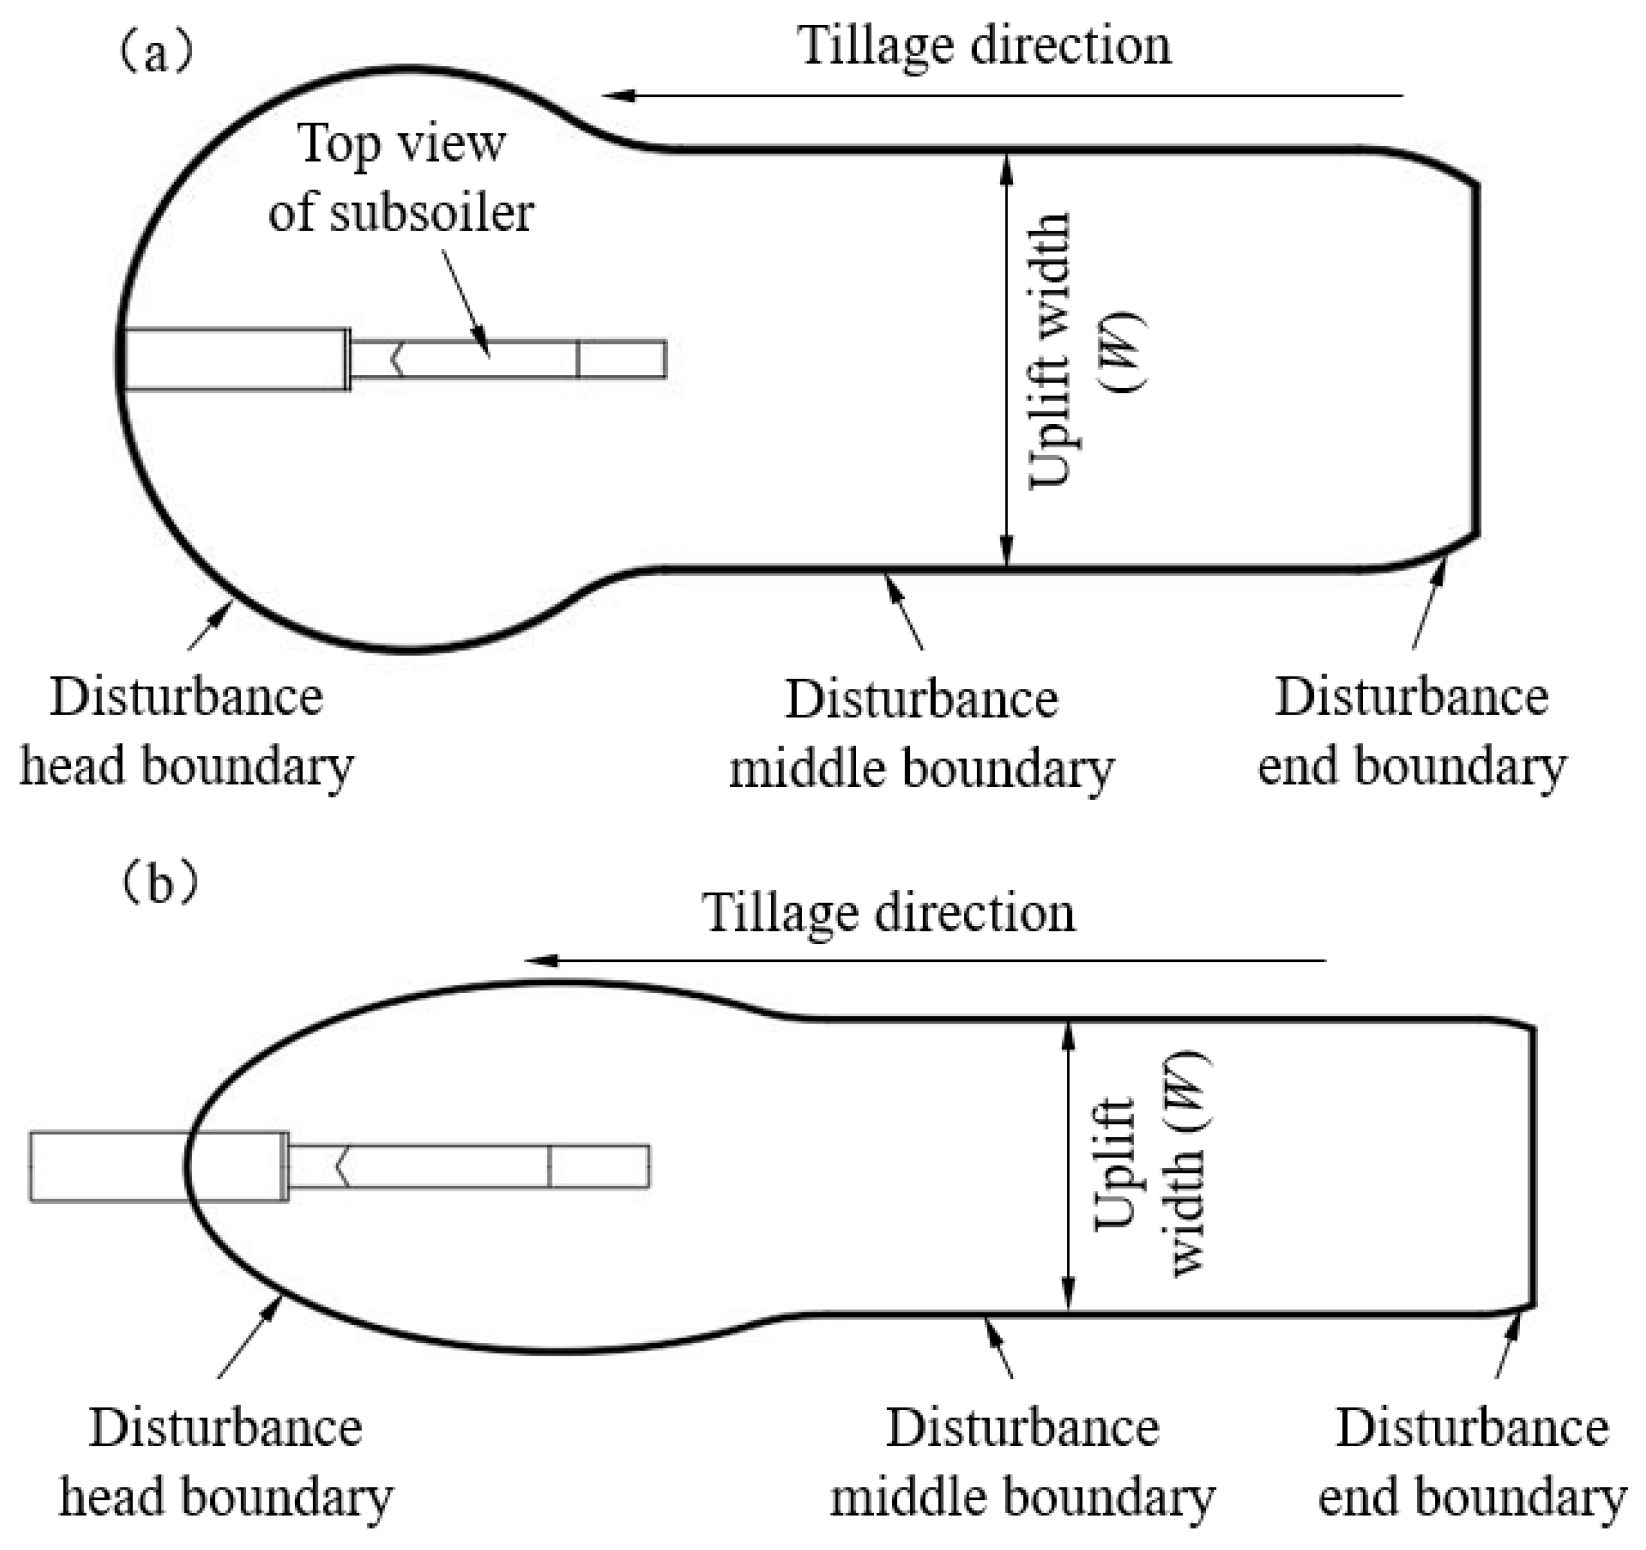
The disturbance boundary is shown in Figure 16, according to Figure 15. The disturbance boundary was divided into three segments: the disturbance head boundary, the disturbance middle boundary, and the disturbance end boundary. The disturbance head boundary was formed by soil being lifted by the subsoiler, the disturbance middle boundary was formed after the subsoiler passed, and the disturbance end boundary was formed when the subsoiler initially entered the soil. The greatest disturbance occurred above the tine. At tillage depths of 10 to 20 cm, the disturbance head boundary appeared approximately semicircular, while at tillage depths of 25 and 30 cm, it showed an elliptical, and the soil above the tine remained undisturbed due to the encountered significant resistance. The disturbance middle boundary was smaller than the uplift width at the disturbance head boundary due to soil fallback after the subsoiler passed. Compared to tillage depths of 10 to 20 cm, the uplift width at depths of 25 and 30 cm became smaller. Furthermore, as shown in Figure 7, the uplift width at the disturbance middle boundary did not remain constant but fluctuated around a certain value. The disturbance end boundary had a smaller uplift width relative to the disturbance middle boundary, which may be due to the disturbance end boundary being in the position where the subsoiler first entered the soil. At this position, one side had no soil particles, thus losing support, leading to greater soil fallback.
The disturbance parameters for different tillage depths were obtained by averaging multiple measurements taken from the disturbance middle boundary, where uplift height, furrow width, disturbance area, and disturbance plow pan width were obtained from Figure 14c and disturbance width from Figure 15c, which are shown in Table 5. The specific draft in Table 5 could indirectly indicate the tillage efficiency of tillage implements [33], which was obtained from the draft force divided by the disturbance area. The specific draft was not only related to the draft force but also to the disturbance characteristics of the soil. Table 5 shows that the disturbance width, uplift height, and disturbance area all increased initially and then decreased as the tillage depth increased, reaching their maximum values at a tillage depth of 20 cm, and the value of 20 cm tillage depth was significantly different from other tillage depths. The furrow width also differed significantly from other tillage depths at a tillage depth of 20 cm. The specific draft first decreased gradually, then increased rapidly at tillage depths of 25 and 30 cm, reaching a minimum at 20 cm tillage depth. The disturbance plow pan width reached a maximum of 15.31 cm at a tillage depth of 20 cm, differing significantly from other tillage depths. Comprehensive data analysis concluded that the optimal tillage depth for paddy soil is 20 cm. The disturbance plow pan width indicates that when multiple subsoilers are in operation, the optimal subsoiler spacing is 15 cm.

4. Discussion

4.1. Effect of Subsoiler on Draft Force

Draft force is a key indicator for optimizing machine design, setting optimal tillage depth, and obtaining the specific draft [34]. The results in Figure 7 suggest that both simulated and field draft forces began to rise, then remained stable with fluctuations, and this change was similar to the results of Song [3]. Compared to the simulated draft force, the field draft force fluctuated greatly. The fluctuation in draft force may be attributable to the soil being compressed and deformed by the subsoiler during tillage. When soil bonding exceeded the critical fracture point, soil fracture occurred. Large-scale soil fracture consequently led to fluctuating variations in draft force. The degree of fluctuation correlated with the uniformity of soil mechanical properties. As the simulated soil was uniform, fluctuations were minimal. Field soils, however, contain plant roots and organic matter, leading to soil variability and consequently greater fluctuations. Thus, higher soil variability resulted in greater vibration during tillage, whereas more uniform soil produced lower vibration. It was also determined that soil variability could be measured by the degree of fluctuation in the draft force.

4.2. Effect of Subsoiler on Simulated and Field Disturbance

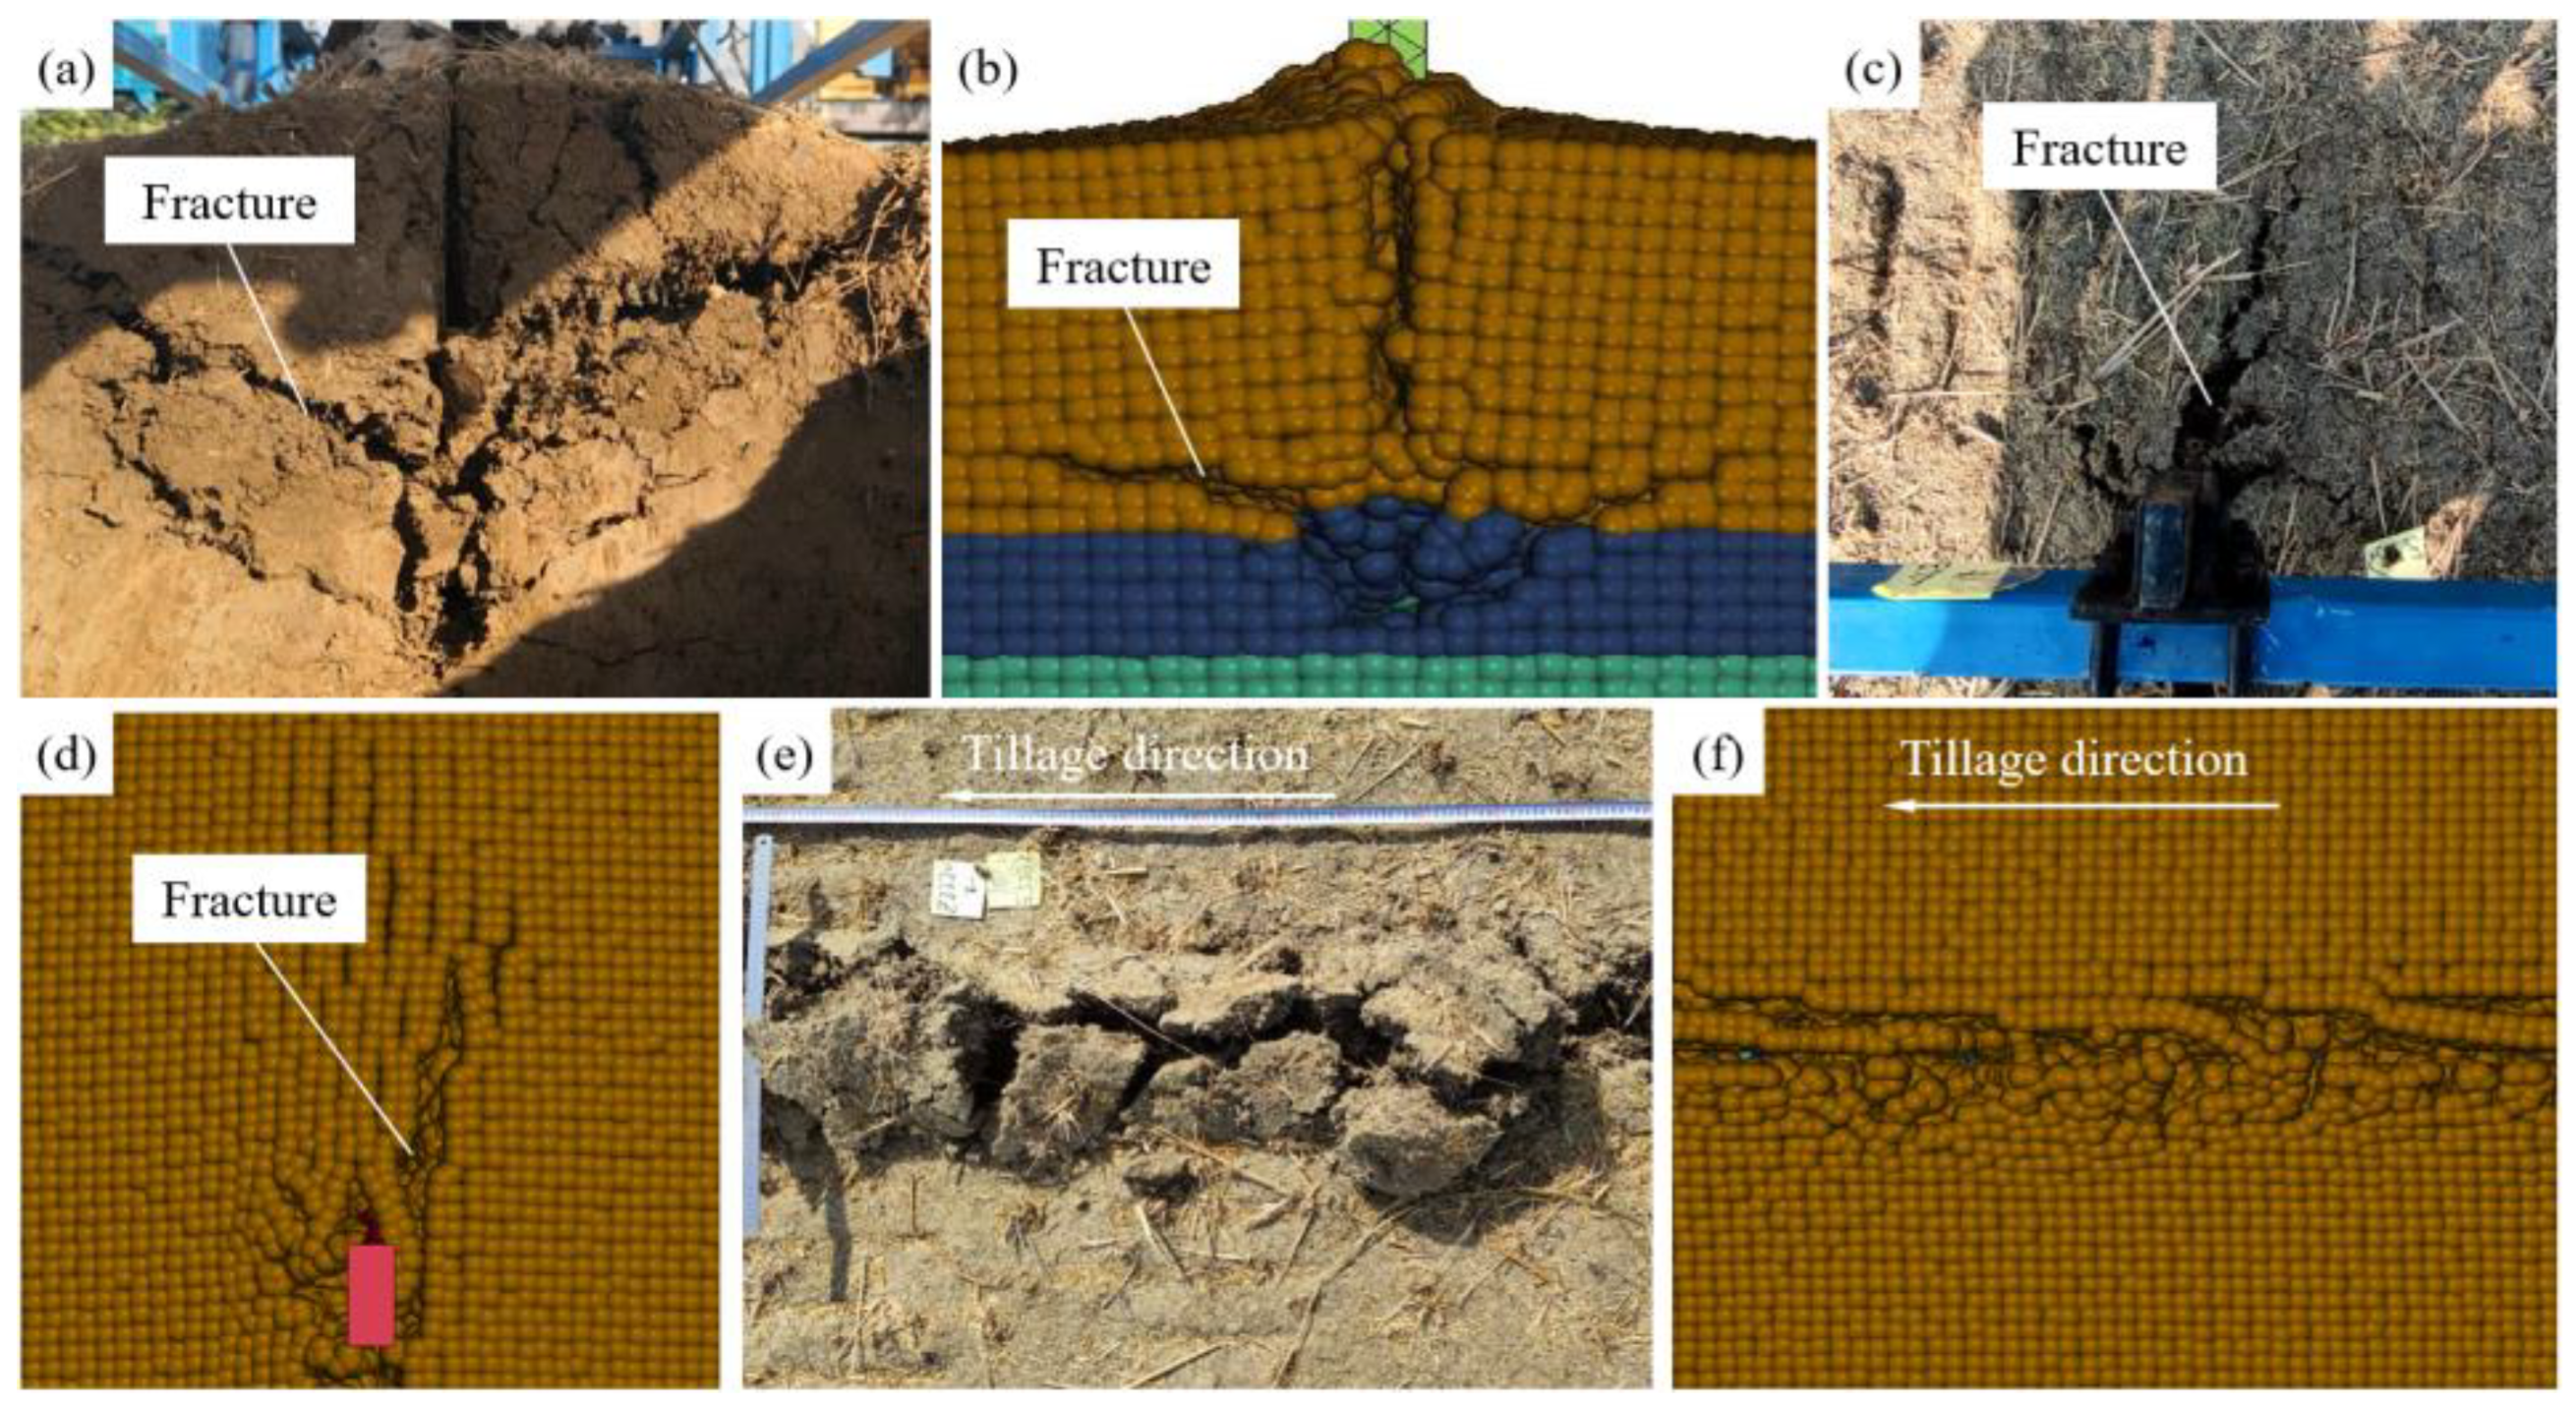
The results of the simulation and field experiment on the soil profile at a tillage depth of 20 cm are compared in Figure 17. As shown in Figure 17a,b, the simulation was more similar to the surface fractures in the field. Compared to the surface fractures in the field, the fractures on both sides of the simulation were more symmetrical, which was due to the relatively uniform soil in the simulation. As shown in Figure 14, no fractures were generated at tillage depths of 10 and 15 cm due to insufficient depth, while no fractures were also generated at tillage depths of 25 and 30 cm due to excessive depth. Compared to the DEM simulation, after the subsoiler passed, the DEM particles rapidly fell back into the space left by the subsoiler, failing to form a fracture [35]. From Figure 17c,d, the soil in front of the subsoiler did not fracture centrally but instead developed a large fracture on one side of the subsoiler. This may be attributed to the chisel-type tine, which is designed to lift soil. During the soil lifting process, the soil on one side fractures first, leading to the formation of large fractures on that side. From Figure 17e,f, it can be seen that large soil clods formed on the field surface, whereas the simulation did not exhibit this phenomenon. This may be attributed to the anchoring effect exerted by the root system. According to Figure 15, the higher the height of soil uplift, the greater the soil disturbance. When the tillage depth was 20 cm, this depth was located at the boundary between the plow pan and the subsoil layer. The plow pan soil was compacted, and under the lifting effect of the tine, the upper soil was lifted together, resulting in the greatest disturbance.
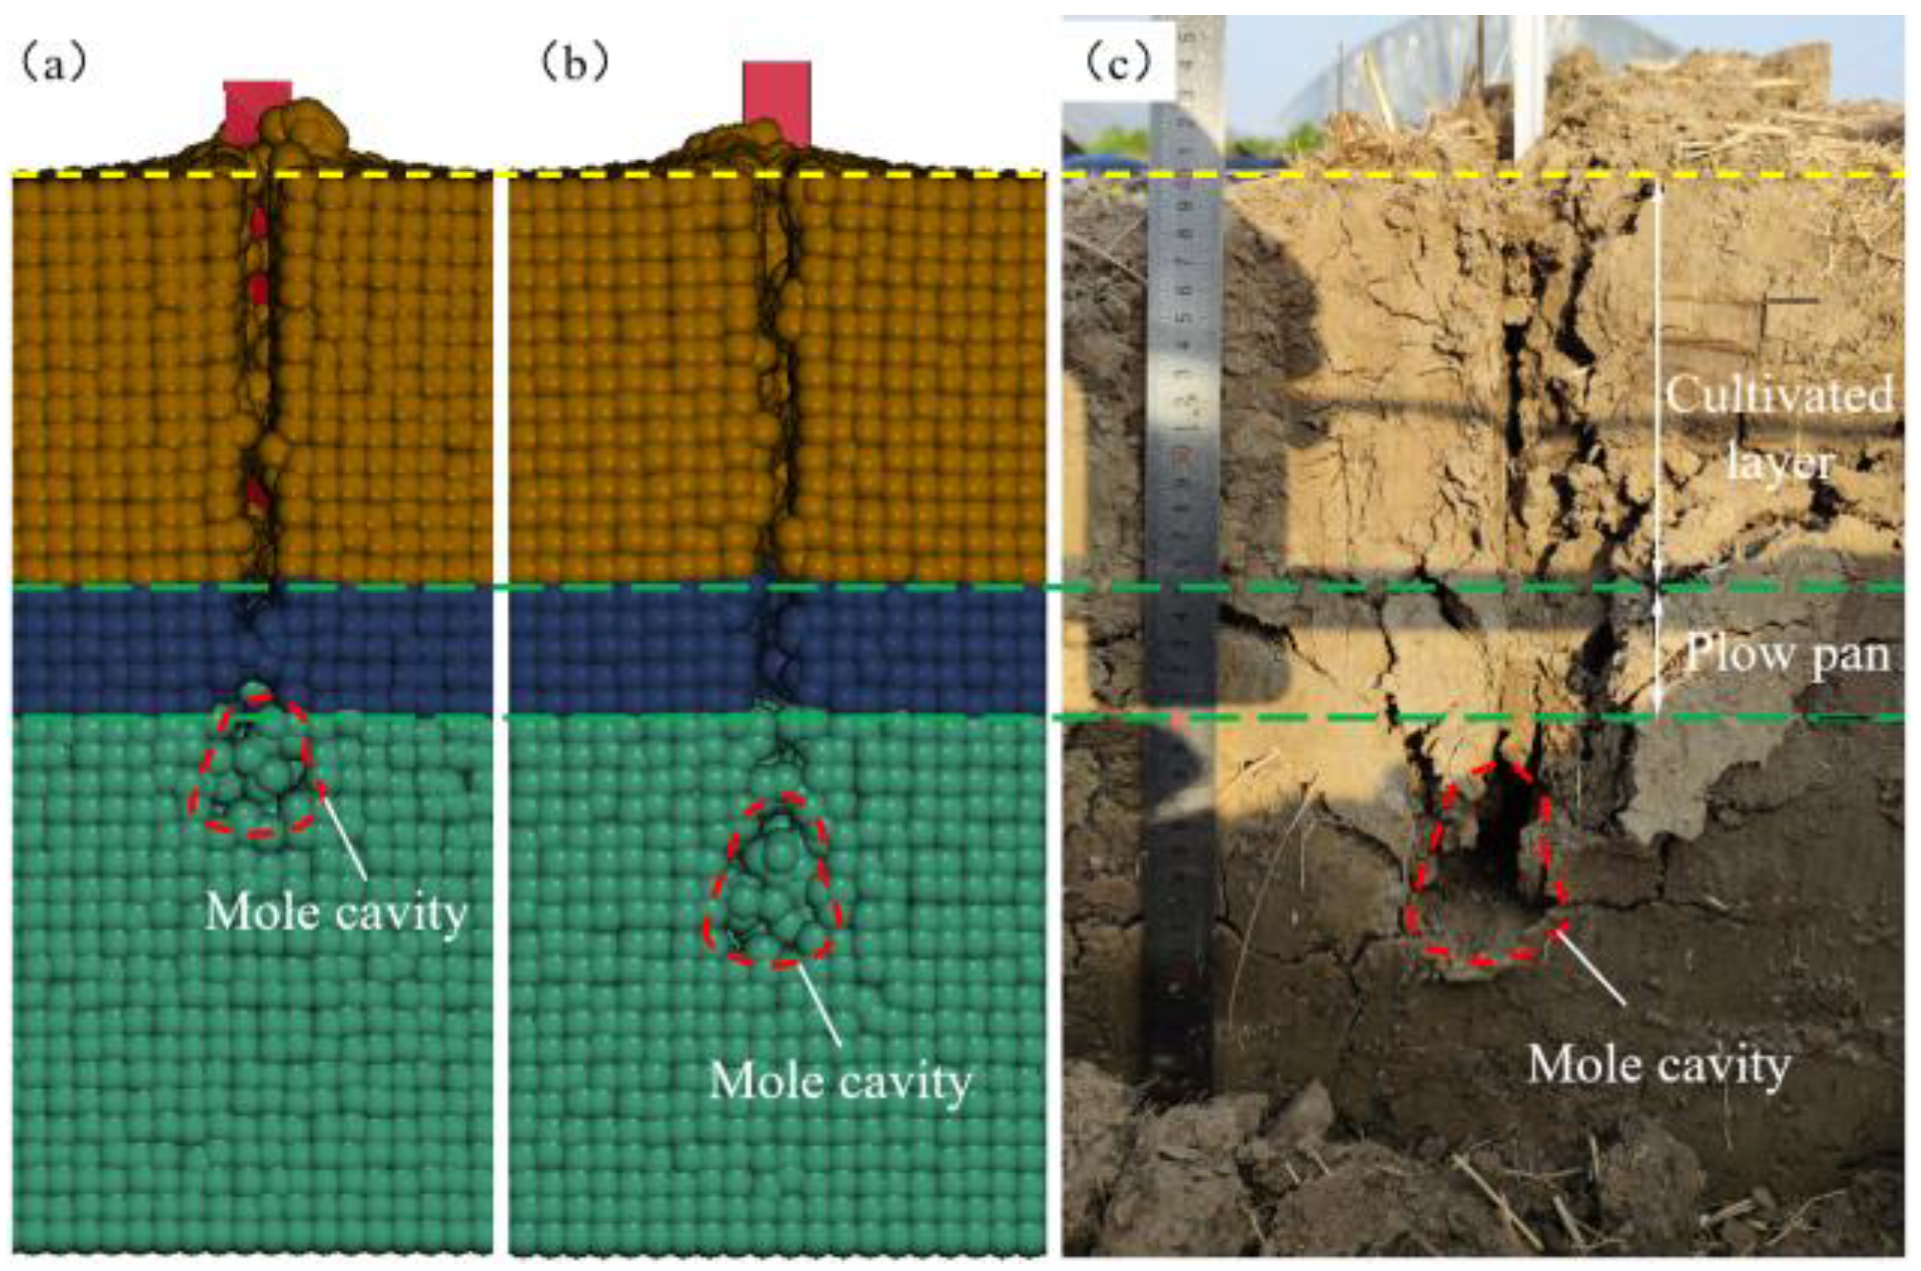
Due to the characteristics of wet, sticky, poor porosity, and compacted subsoil in paddy soil [36,37], the soil below the cultivated layer was laterally “squeezed” by the subsoiler. After the subsoiler passed, the “squeezed” soil fell back to the center under gravity, forming a “mole cavity” at the bottom of the disturbed boundary, as shown in Figure 18. When the tillage depth was less than or close to 20 cm, the disturbance boundary exhibited a “fan-shaped” profile. When the tillage depth exceeded 20 cm, the bottom of the disturbance boundary formed a “mole cavity” (Figure 18). In addition, due to different soil properties, the soil disturbance profile with a tillage depth greater than 20 cm in Figure 18 was significantly different from the indoor soil bin subsoiling experiment by Hang [38] and the dryland field subsoiling experiment by Hang [39] and Sun [40].

5. Conclusions

In this paper, a model of subsoiler and soil interaction was established based on SPH. After establishing the 3D model with different tillage depths, meshing was performed, material parameters and calculation parameters were defined, and calculation was conducted using LS-DYNA. In addition, field experiments were carried out for validation. The results of this study obtained by analyzing tillage force, disturbance process, soil particle displacement, and soil disturbance profile for different tillage depths were as follows:
(i)
Simulation and field experiment showed that draft force increased with increasing tillage depth. However, the simulated soil physical properties were uniform, and the field soil physical properties were variable, resulting in the average draft force in the simulation being consistently lower than in the field and the field draft force fluctuating greatly. The results showed that the simulation was difficult to completely match the real field soil conditions.
(ii)
From the movement process of soil particles with shallow to deep arrangement on the soil profile, it can be observed that the soil block above the tine was not lifted up as a big block but broken into many small soil blocks and then lifted up. Theoretically, the soil particles above the tine moved mainly upward and forward during subsoiling. However, this was not the case in practice. Therefore, in future research, the structure of the subsoiler should be optimized to ensure that all soil particles move upward and forward.
(iii)
Analysis of the displacement, stress, velocity, and acceleration of the soil particles showed that the particle displacements were concentrated above the tine, the stress was concentrated around the tine, while the velocity and acceleration were closely attached to the subsoiler. Therefore, it is necessary to research a special subsoiler to expand the stress range in the future.
(iv)
From the analysis of soil disturbance at different tillage depths, it was found that the “mole cavity” at 25 and 30 cm tillage depths existed at the bottom of the disturbance. The disturbance area and specific draft were maximum and minimum at 20 cm tillage depth, respectively. When multiple subsoilers were working, the optimum spacing between the subsoilers was 15 cm. In the future, when tillage was carried out in the field, breaking the root anchorage of soil in the cultivated layer could reduce the tillage force and thus reduce the energy consumption of subsoiling.

Author Contributions

Conceptualization, L.L. and Q.D.; methodology, L.L. and H.Z.; software, L.L. and Q.L.; investigation, L.L.; writing—original draft preparation, L.L.; writing—review and editing, Q.D., H.Z., and Q.L.; visualization, Q.D.; supervision, Q.D.; funding acquisition, Q.D. All authors have read and agreed to the published version of the manuscript.

Funding

This research was funded by the National Key Research and Development Program of China, grant number 2022YFD2300304.

Data Availability Statement

The original contributions presented in the study are included in the article; further inquiries can be directed to the corresponding author.

Conflicts of Interest

The authors declare no conflicts of interest.

References

  1. Pulido-Moncada, M.; Katuwal, S.; Kristensen, J.B.; Munkholm, L.J. Effects of bio-subsoilers on subsoil pore-system functionality: Case study with intact soil columns. Geoderma 2021, 385, 114897. [Google Scholar] [CrossRef]
  2. Janbazialamdari, S.; Flippo, D.; Ridder, E.; Brokesh, E. Soil compaction prediction in precision agriculture using cultivator shank vibration and soil moisture data. Agriculture 2025, 15, 1896. [Google Scholar] [CrossRef]
  3. Song, W.; Jiang, X.; Li, L.; Ren, L.; Tong, J. Increasing the width of disturbance of plough pan with bionic inspired subsoilers. Soil Tillage Res. 2022, 220, 105356. [Google Scholar] [CrossRef]
  4. Askari, M.; Shahgholi, G.; Abbaspour-Gilandeh, Y. New wings on the interaction between conventional subsoiler and paraplow tines with the soil: Effects on the draft and the properties of soil. Arch. Agron. Soil Sci. 2019, 65, 88–100. [Google Scholar] [CrossRef]
  5. Huo, L.F.; Liang, L.; Abbas, A.; White, D.; Ding, Q.S.; Wang, X.C.; He, R.Y. Soil disturbance under small harvester traffic in paddy-based smallholder farms in China. Agron. J. 2020, 112, 1441–1451. [Google Scholar] [CrossRef]
  6. Li, X.; Luo, Z.; Hao, Z.; Zheng, E.; Yao, H.; Zhu, Y.; Wang, X. Investigation on tillage resistance and soil disturbance in wet adhesive soil using discrete element method with three-layer soil-plough coupling model. Powder Technol. 2024, 436, 119463. [Google Scholar] [CrossRef]
  7. Wang, C.; Yan, Z.; Wang, Z.; Batool, M.; El-Badri, A.M.; Bai, F.; Li, Z.; Wang, B.; Zhou, G.; Kuai, J. Subsoil tillage promotes root and shoot growth of rapeseed in paddy fields and dryland in Yangtze River Basin soils. Eur. J. Agron. 2021, 130, 126351. [Google Scholar] [CrossRef]
  8. Kong, F.X.; Jiu, A.; Kan, Z.; Zhou, J.; Yang, H.; Li, F.-M. Deep tillage combined with straw biochar return increases rice yield by improving nitrogen availability and root distribution in the subsoil. Field Crops Res. 2024, 315, 109481. [Google Scholar] [CrossRef]
  9. Hu, M.; Gao, T.; Dong, X.; Tan, Q.; Yi, C.; Wu, F.; Bao, A. Simulation of soil-tool interaction using smoothed particle hydrodynamics (SPH). Soil Tillage Res. 2023, 229, 105671. [Google Scholar] [CrossRef]
  10. Walunj, A.; Chen, Y.; Tian, Y.; Zeng, Z. Modeling Soil–Plant–Machine Dynamics Using Discrete Element Method: A Review. Agronomy 2023, 13, 1260. [Google Scholar] [CrossRef]
  11. Tagar, A.A.; Ji, C.Y.; Adamowski, J.; Malard, J.; Chen, S.Q.; Ding, Q.S.; Abbasi, N.A. Finite element simulation of soil failure patterns under soil bin and field testing conditions. Soil Tillage Res. 2015, 145, 157–170. [Google Scholar] [CrossRef]
  12. Zhu, L.; Cheng, X.; Peng, S.S.; Qi, Y.Y.; Zhang, W.F.; Jiang, R.; Yin, C.L. Three dimensional computational fluid dynamic interaction between soil and plowbreast of horizontally reversal plow. Comput. Electron. Agric. 2016, 123, 1–9. [Google Scholar] [CrossRef]
  13. Sedara, A.M.; Abdeldayem, M.A.A.; Pratas Glycerio De Freitas, F.; Mehari, T.Z. Optimization of subsoiler design using similitude-based DEM simulation and soil bin testing on cohesive-frictional artificial soil. J. Terramechanics 2025, 117, 101026. [Google Scholar] [CrossRef]
  14. Aikins, K.A.; Ucgul, M.; Barr, J.B.; Awuah, E.; Antille, D.L.; Jensen, T.A.; Desbiolles, J.M.A. Review of Discrete Element Method Simulations of Soil Tillage and Furrow Opening. Agriculture 2023, 13, 541. [Google Scholar] [CrossRef]
  15. Wang, X.; Zhou, H.; Ji, J. Effect of Mounting Angle on Bending Subsoiling Tool–Soil Interactions Using DEM Simulations. Agriculture 2022, 12, 1830. [Google Scholar] [CrossRef]
  16. Tang, Z.; Zeng, Z.; Wu, S.; Fu, D.; He, J.; Cai, Y.; Chen, Y.; Gong, H.; Qi, L. Optimizing soil resistance and disturbance of bionic furrow opener for paddy field based on badger claw using the CFD-DEM method. Comput. Electron. Agric. 2024, 227, 109549. [Google Scholar] [CrossRef]
  17. Zhang, L.B.; Cai, Z.X.; Liu, H.F. A novel approach for simulation of soil-tool interaction based on an arbitrary Lagrangian–Eulerian description. Soil Tillage Res. 2018, 178, 41–49. [Google Scholar] [CrossRef]
  18. Wei, L.; Huang, W.; Liu, J.; Li, M.; Zheng, Z.; Wang, S.; Du, D.; Zhang, Y. DEM simulation of subsoiling in tropical sugarcane fields: Effects of opposing subsoiler design and model parameters. Smart Agric. Technol. 2024, 9, 100593. [Google Scholar] [CrossRef]
  19. Gao, P.; Li, J.; Qi, H.; Liu, X.; Ma, Y. Simulation of Draught Reduction Performance of Subsoiling with Upcutting Belt Motion Using Discrete Element Method. Appl. Sci. 2024, 14, 1313. [Google Scholar] [CrossRef]
  20. Reese, L.; Qiu, T.; Linzell, D.; Rado, Z. Field-scale testing and numerical investigation of soil-boulder interaction under vehicular impact using FEM and coupled FEM-SPH formulations. Int. J. Prot. Struct. 2016, 7, 77–99. [Google Scholar] [CrossRef]
  21. Yang, W.; Xiao, X.; Pan, R.; Guo, S.; Yang, J. Numerical Simulation of Spiral Cutter–Soil Interaction in Deep Vertical Rotary Tillage. Agriculture 2023, 13, 1850. [Google Scholar] [CrossRef]
  22. Liu, M.; Sun, J.; Huang, D.; Qiao, D.; Xiang, M.; Feng, W.; Fu, D.; Wang, J. Mechanism Analysis of Soil Disturbance in Sodic Saline–Alkali Soil Tillage Based on Mathematical Modeling and Discrete Element Simulation. Agriculture 2025, 15, 1885. [Google Scholar] [CrossRef]
  23. Xu, Z.; Qi, H.; Wang, L.; Wang, S.; Liu, X.; Ma, Y. DEM Study and Field Experiments on Coupling Bionic Subsoilers. Biomimetics 2025, 10, 306. [Google Scholar] [CrossRef]
  24. Liang, L.; Sun, H.T.; Xu, G.M.; Li, Y.N.; He, R.Y.; Ding, Q.S. Soil infiltration of rice-wheat rotation field under long-term mechanical treatment based on field in situ experiments. Trans. Chin. Soc. Agric. Eng. 2023, 39, 110–118. (In Chinese) [Google Scholar] [CrossRef]
  25. LSTC. LS-DYNA r8.0 Keyword User’s Manual; Livermore Software Technology Corporation: Livermore, CA, USA, 2016. [Google Scholar]
  26. Ding, Q.S.; Ren, J.; Adam, B.E.; Zhao, J.K.; Ge, S.Y.; Li, Y. DEM analysis of subsoiling process in wet clayey paddy soil. Trans. Chin. Soc. Agric. Mach. 2017, 48, 38–48. (In Chinese) [Google Scholar] [CrossRef]
  27. Ran, X.; Wang, L.; Xing, J.; Shi, L.; Wang, D.; Guo, W.; Wang, X. A Discrete Element Model for Characterizing Soil-Cotton Seeding Equipment Interactions Using the JKR and Bonding Contact Models. Agriculture 2025, 15, 1693. [Google Scholar] [CrossRef]
  28. Hoseinian, S.H.; Hemmat, A.; Esehaghbeygi, A.; Shahgoli, G.; Baghbanan, A. Development of a dual sideway-share subsurface tillage implement: Part 1. Modeling tool interaction with soil using DEM. Soil Tillage Res. 2022, 215, 105201. [Google Scholar] [CrossRef]
  29. Troncone, A.; Pugliese, L.; Parise, A.; Mazzuca, P.; Conte, E. Post-failure stage analysis of flow-type landslides using different numerical techniques. Comput. Geotech. 2025, 182, 107152. [Google Scholar] [CrossRef]
  30. Yang, W.; Zhao, W.; Liu, Y.; Chen, Y.; Yang, J. Simulation of forces acting on the cutter blade surfaces and root system of sugarcane using FEM and SPH coupled method. Comput. Electron. Agric. 2021, 180, 105893. [Google Scholar] [CrossRef]
  31. Yang, W.; Li, J.J.; Yang, J.; Wei, L. Numerical simulation of an experienced farmer lifting tubers of cassava for designing a bionic harvester. CMES-Comput. Model. Eng. Sci. 2015, 104, 471–491. [Google Scholar] [CrossRef]
  32. Wang, Y.; Zhang, D.; Yang, L.; Cui, T.; Jing, H.; Zhong, X. Modeling the interaction of soil and a vibrating subsoiler using the discrete element method. Comput. Electron. Agric. 2020, 174, 105518. [Google Scholar] [CrossRef]
  33. Tong, J.; Jiang, X.H.; Wang, Y.M.; Ma, Y.H.; Li, J.W.; Sun, J.Y. Tillage force and disturbance characteristics of different geometric-shaped subsoilers via DEM. Adv. Manuf. 2020, 8, 392–404. [Google Scholar] [CrossRef]
  34. Wang, X.; Zhou, H.; Wang, S.; Zhou, H.; Ji, J. Methods for reducing the tillage force of subsoiling tools: A review. Soil Tillage Res. 2023, 229, 105676. [Google Scholar] [CrossRef]
  35. Mudarisov, S.; Farkhutdinov, I.; Khamaletdinov, R.; Khasanov, E.; Mukhametdinov, A. Evaluation of the significance of the contact model particle parameters in the modelling of wet soils by the discrete element method. Soil Tillage Res. 2022, 215, 105228. [Google Scholar] [CrossRef]
  36. Gathala, M.K.; Ladha, J.K.; Saharawat, Y.S.; Kumar, V.; Kumar, V.; Sharma, P.K. Effect of tillage and crop establishment methods on physical properties of a medium-textured soil under a seven-year rice−wheat rotation. Soil Sci. Soc. Am. J. 2011, 75, 1851–1862. [Google Scholar] [CrossRef]
  37. Alhammad, B.A.; Roy, D.K.; Ranjan, S.; Padhan, S.R.; Sow, S.; Nath, D.; Seleiman, M.F.; Gitari, H. Conservation Tillage and Weed Management Influencing Weed Dynamics, Crop Performance, Soil Properties, and Profitability in a Rice–Wheat–Greengram System in the Eastern Indo-Gangetic Plain. Agronomy 2023, 13, 1953. [Google Scholar] [CrossRef]
  38. Hang, C.; Huang, Y.; Zhu, R. Analysis of the movement behaviour of soil between subsoilers based on the discrete element method. J. Terramechanics 2017, 74, 35–43. [Google Scholar] [CrossRef]
  39. Hang, C.; Gao, X.; Yuan, M.; Huang, Y.; Zhu, R. Discrete element simulations and experiments of soil disturbance as affected by the tine spacing of subsoiler. Biosyst. Eng. 2018, 168, 73–82. [Google Scholar] [CrossRef]
  40. Sun, J.; Wang, Y.; Ma, Y.; Tong, J.; Zhang, Z. DEM simulation of bionic subsoilers (tillage depth > 40 cm) with drag reduction and lower soil disturbance characteristics. Adv. Eng. Softw. 2018, 119, 30–37. [Google Scholar] [CrossRef]
Figure 1. Multi-functional in situ test-rig facility.
Agronomy 15 02695 g001
Figure 2. Diagram of field experiment; (a) geomorphology after subsoiling; (b) subsoiling in progress.
Agronomy 15 02695 g002
Figure 3. Structural diagram of the subsoiler.
Agronomy 15 02695 g003
Figure 4. Soil profile: (a) actual condition of field soil: (b) three-layer soil model.
Agronomy 15 02695 g004
Figure 5. Direct shear equipment.
Agronomy 15 02695 g005
Figure 6. Simulation model of subsoiling.
Agronomy 15 02695 g006
Figure 7. The force of change over time: (a) lateral force, (b) draft force and field draft force, (c) lifting force, and (d) resultant force.
Agronomy 15 02695 g007
Figure 8. Top view of subsoiling disturbance process at different times: (a) 2 s, (b) 3.5 s, (c) 5 s, (d) 8 s, (e) 12 s.
Agronomy 15 02695 g008
Figure 9. Side view of subsoiling disturbance process at different times: (a) 2 s, (b) 3.5 s, (c) 5 s, (d) 8 s, (e) 12 s.
Agronomy 15 02695 g009
Figure 10. Location of soil particles.
Agronomy 15 02695 g010
Figure 11. The displacement curve of soil particles over time: (a) X-displacement, (b) Y-displacement, (c) Z-displacement, (d) resultant displacement.
Agronomy 15 02695 g011
Figure 12. Displacement of soil particles (a) before disturbance, (b) during disturbance, and (c) after disturbance.
Agronomy 15 02695 g012
Figure 13. Particle distribution in soil profile (a) displacement, (b) stress, (c) velocity, and (d) acceleration.
Agronomy 15 02695 g013
Figure 14. Soil disturbance area after subsoiling at different tillage depths: (a) 10 cm, (b) 15 cm, (c) 20 cm, (d) 25 cm, and (e) 30 cm. H (cm) is uplift height; G (cm) is furrow width; S (cm2) is disturbance area; and P (cm) is disturbance plow pan width.
Agronomy 15 02695 g014
Figure 15. Soil surface after subsoiling at different tillage depths: (a) 10 cm, (b) 15 cm, (c) 20 cm, (d) 25 cm, and (e) 30 cm. W (cm) is the disturbance width.
Agronomy 15 02695 g015
Figure 16. Schematic diagram of disturbance boundary: (a) diagram of 10~20 cm tillage depth boundary; (b) diagram of 25~30 cm tillage depth boundary.
Agronomy 15 02695 g016
Figure 17. Comparison of field and simulated profile: (a) Y direction profile in field; (b) Y direction profile in simulation; (c) −Z direction surface during subsoiling in field; (d) −Z direction surface during subsoiling in simulation; (e) soil surface after subsoiling in field; (f) soil surface after subsoiling in simulation.
Agronomy 15 02695 g017
Figure 18. Disturbed boundary bottom “mole cavity”: (a) simulated profile with a tillage depth of 25 cm, (b) simulated profile with a tillage depth of 25 cm, and (c) field profile at a tillage depth of 30 cm.
Agronomy 15 02695 g018
Table 1. Physical properties in 0~50 cm soil depth.
Soil Depth (cm)Bulk Density
(g cm−3)
Water Content (%)Total Porosity (%)Soil Penetration Resistance (kPa)
0~51.2518.0552.831048.7
5~101.2622.6252.45796.9
10~151.3723.9848.302525.5
15~201.5820.5340.381906.5
20~251.5123.2543.021436.7
25~301.5324.5442.261461.5
30~351.5424.6841.891509.9
35~401.5724.4440.751683.1
40~451.5823.6340.381540.7
45~501.5723.0940.751453.7
Table 2. Soil cohesion and internal friction angle at different depths.
Soil Depth (cm)Cohesive (kPa)Internal Friction Angle (°)
0–533.7523.02
5–1035.5622.58
10–1537.3627.26
15–2098.2319.42
20–2552.4326.44
25–3069.3016.14
30–3569.9115.17
35–4063.8811.74
Table 3. Parameters of soil material.
ParametersCultivated LayerPlow PanSubsoil Layer
Bulk density (kg cm−3)1.291.581.54
Water density (kg cm−3)100010001000
Soil particle specific gravity2.652.652.65
Water content (%)21.5520.5324.23
Soil porosity (%)51.1940.3841.98
Internal friction angle (rad)0.430.340.30
Cohesion (Pa)35.56 × 10398.23 × 10363.88 × 103
Bulk modulus (Pa)23.32 × 10574.31 × 10546.36 × 105
Shear modulus (Pa)7.77 × 10524.77 × 10515.45 × 105
Table 4. Force at different tillage depths.
Tillage Depth (cm)Lateral Force (N)Draft Force (N)Lifting Force (N)Resultant Force (N)Field Draft Force (N)Error (%)
1021.89 ± 33.61594.99 ± 31.24319.72 ± 27.64676.44 ± 49.25645.10 ± 114.067.77
15−1.95 ± 53.07815.98 ± 114.49487.03 ± 46.64951.59 ± 108.61859.29 ± 476.155.04
200.78 ± 54.671470.40 ± 165.80755.32 ± 95.341653.49 ± 211.201518.31 ± 306.833.16
2519.96 ± 40.453247.83 ± 129.471325.56 ± 58.693509.24 ± 131.943888.22 ± 465.7716.47
30−25.51 ± 63.325411.60 ± 162.661946.47 ± 60.115757.09 ± 169.976657.16 ± 545.0518.71
Table 5. Parameters of simulated soil disturbance.
Tillage Depth (D, cm)Disturbance Width (W, cm)Uplift Height (H, cm)Furrow Width (G, cm)Disturbance Area (S, cm2)Specific Draft (kN m−2)Disturbance Plow Pan Width (P, cm)
1023.51 d2.18 c2.73 b212.59 c27.990
1535.67 b2.69 c2.59 c321.80 b25.360
2046.66 a5.15 a4.27 a597.65 a24.6015.31 a
2529.11 c3.34 b2.55 c182.66 d177.811.88 b
3028.71 c3.11 bc2.92 b110.81 e488.372.01 b
Note: Different lowercase letters in the same column of each treatment are significantly different at p < 0.05.
Disclaimer/Publisher’s Note: The statements, opinions and data contained in all publications are solely those of the individual author(s) and contributor(s) and not of MDPI and/or the editor(s). MDPI and/or the editor(s) disclaim responsibility for any injury to people or property resulting from any ideas, methods, instructions or products referred to in the content.