Article

Assessing the Carbon Balance and Its Drivers for Banana Cultivation in Hainan Island, China

1
Chengmai Meiting Agroforestry Complex Ecosystem Hainan Observation and Research Station, Chengmai 571900, China
2
Key Laboratory of Tropical Island Land Surface Processes and Environmental Changes of Hainan Province, Hainan Normal University, Haikou 571158, China
*
Author to whom correspondence should be addressed.
Agronomy 2025, 15(12), 2676; https://doi.org/10.3390/agronomy15122676
Submission received: 17 October 2025 / Revised: 17 November 2025 / Accepted: 19 November 2025 / Published: 21 November 2025
(This article belongs to the Section Agroecology Innovation: Achieving System Resilience)

Abstract

Banana plantations are important tropical agro-ecosystems, and quantifying their greenhouse gas emissions is essential for developing low-carbon agriculture and mitigating global warming. The carbon balance of two banana cultivars (Musa paradisiaca AA (MA) and M. AAA Cavendish var. Brazil (MB)) was evaluated using the life cycle assessment (LCA) approach, based on field trials and farmer surveys in Chengmai County, Hainan Province, China. The results indicated that (1) both cultivation systems functioned as net carbon sinks, and the MB cultivar demonstrated a superior carbon balance, with a net sequestration of 21,652.88 kg CO2 eq·ha−1, significantly higher than the MA cultivar (15,197.96 kg CO2 eq·ha−1); (2) fertilizer management was the dominant source of anthropogenic emissions, contributing 74.03–81.76% of the carbon footprint from agricultural inputs; and (3) the MB cultivar’s enhanced carbon fixation capacity outweighed its higher emissions, resulting in a more favorable carbon balance than the MA cultivar. Concurrently, the banana plantations significantly increased soil carbon sequestration by 13.47–24.48%. Thus, within the studied system boundary, banana agro-ecosystems serve as net carbon sinks, a function that can be enhanced by optimizing fertilizer management to reduce emissions and by increasing both plant biomass and soil carbon sequestration. These results provide a scientific basis for low-carbon practices and promoting a more sustainable banana industry.

1. Introduction

Global warming poses a critical environmental challenge for the 21st century, prompting governments worldwide to implement a range of mitigation strategies [1]. China has committed to achieving “carbon peaking” by 2030 and “carbon neutrality” by 2060. These goals are expected to accelerate industrial optimization and upgrading, energy restructuring, and a comprehensive green transition of the economy and society [2]. As a dominant form of land use, covering 38.5% of terrestrial ecosystems, agriculture represents one of the most active carbon pools in the global carbon cycle [3]. According to the IPCC Sixth Assessment Report, agriculture, forestry, and other land uses (AFOLU) contribute approximately 22% of global greenhouse gas (GHG) emissions [1]. Agricultural ecosystems play a dual role, serving as both a significant source of anthropogenic emissions (21–25%) and an important carbon sink through photosynthetic carbon fixation and soil sequestration. For instance, studies in China report an annual carbon sequestration of 34.4 million tons in farmland soils; this amount is equivalent to offsetting 126.13 million tons of CO2 emissions, highlighting the significant role of these ecosystems in the global carbon balance [4,5,6]. Enhancing soil carbon storage and improving the efficiency of agricultural inputs such as fertilizers through improved management practices are considered key pathways for enabling cropland ecosystems to contribute to carbon neutrality. For example, optimized water management and fertilizer application have been shown to reduce greenhouse gas emissions from crop production in China by 6.4–30.4% [7]. Consequently, research focused on mitigating agricultural emissions while enhancing carbon sequestration has become essential for advancing sustainable and green agricultural development.
The carbon footprint, as a quantitative metric for quantifying greenhouse gas emissions, has garnered considerable scholarly attention and has been widely employed in agricultural research [8,9]. Carbon footprint assessments are commonly conducted using the life cycle assessment (LCA) framework, which can be applied to entire product life cycles as well as to comparative analyses of carbon emissions in specific production processes [7,10]. In recent years, numerous studies have investigated the carbon footprint and carbon balance in agricultural systems, yielding valuable preliminary insights [11,12]. For example, diversified cropping practices have been shown through LCA to effectively reduce carbon footprints [13]. Research on perennial tree crops like orchards and plantations often highlights their significant carbon sequestration potential due to substantial biomass accumulation and soil organic carbon storage [14]. Conversely, other studies on intensively managed systems, including some annual crops and even certain orchards, have identified them as net carbon sources when emissions from inputs and soil management outweigh sequestration [15]. This ongoing debate underscores that the net carbon balance is highly system-specific, influenced by factors such as crop type, management practices, and local environmental conditions [16]. However, many studies overlook farmland soil respiration, which is typically partitioned into root respiration and microbial respiration [17,18]. Neglecting these components may lead to an inaccurate evaluation of the carbon balance in agricultural systems [19]. Furthermore, unlike other sectors, agriculture not only produces food and fiber but also generates substantial amounts of agricultural waste, which can be utilized through various pathways such as biogas production and biochar application. Simply assuming that all agricultural waste decomposes and oxidizes into CO2 that returns to the atmosphere ignores the carbon sequestration potential of agricultural systems. Indeed, studies indicated that agricultural systems possess substantial carbon sequestration capacity [20,21]. Despite this, debate remains regarding whether farmland ecosystems function as a net carbon source or sink [22,23]. Given the variations in natural conditions, crop species, and field management practices, carbon balance findings from one cropping system may not be directly applicable to others. Therefore, system-level assessments that accurately quantify all emission and sequestration fluxes are essential to clarify the net carbon impact of specific cropping systems.
Fruit crops are indispensable both for climate change mitigation and ensuring food security [24]. Bananas (Musa spp.) rank among the world’s most widely consumed fruits. In 2022, 337,000 ha of bananas were planted in China, yielding approximately 11.78 million tons. As a key tropical fruit production region, Hainan accounted for about 15% of the national planting area [25]. The intensive nature of banana cultivation requires substantial inputs of water and fertilizer, resulting in considerable carbon emissions, particularly during the production stage [9]. Nevertheless, relatively few studies have focused on the carbon footprint of banana plantations, which limiting the assessment of the carbon balance of the system and the development of mitigation strategies [26].
Therefore, we selected a representative banana plantation in Chengmai County, Hainan Island. Based on field investigations, household questionnaires, and a one-year field experiment, we employed the life cycle assessment (LCA) method to analyze the carbon emissions associated with the production and use of agricultural inputs for two banana cultivars, as well as soil respiration throughout the entire cultivation process. The objectives of this study were to (1) quantify carbon emissions across the life cycle of two banana cultivars; (2) compare the carbon footprint per unit yield and per unit area, and evaluate the overall carbon balance of banana plantations; and (3) propose management strategies to reduce carbon emissions throughout the banana plantation life cycle. Compared with assessing carbon changes alone, integrating carbon balance assessments with input–output analysis provides a more comprehensive understanding of the impact of agriculture on carbon emissions, which can improve the efficiency of agricultural inputs, support policymakers’ goals of reducing emissions and enhancing carbon sequestration, and ultimately promote the sustainable development of agriculture. The findings provide a theoretical foundation and practical guidance for optimizing agricultural structural adjustment in Hainan and developing efficient, low-carbon agriculture with tropical characteristics.

2. Materials and Methods

2.1. Study Area

The study area is located in northern Chengmai County (19°44′38″ N, 109°56′13″ E) (Figure 1) and is characterized by tableland plains, a tropical maritime monsoon climate, a multi-year average temperature of 23.2 °C, and an average annual precipitation of approximately 1700 mm. Precipitation exhibits pronounced seasonality, with the rainy season from May to October and the dry season from November to April of the following year. The predominant soil type in the study area is identified as Ferralosols, with an average organic matter content of 2.53% in the 0–30 cm layer. The soil texture is loamy-clay loam, with a deep soil layer, making it suitable for tropical crops such as bananas and coffee.
Chengmai County is one of the major banana-producing areas in China. Its climate, soils, and cultivation practices are representative and provide sufficient samples and data support [27]. From 2018 to 2020, the county had an average annual banana harvest area of 9.17 × 10³ ha, accounting for 20.95% of the banana cultivation area in Hainan Province, and an average annual production of 3.08 × 10⁸ kg, representing 24.70% of the province’s banana output. The main banana cultivars grown are Musa paradisiaca AA (MA) and M. AAA Cavendish var. Brazil (MB). During production, the first batch of bananas is transplanted from seedlings, while the second and third harvests are regenerated from retained buds. Each plantation cycle allows for three harvests within two years.

2.2. Experimental Design

Based on the analysis of preliminary survey data, two banana plantations with different varieties and regional representations were selected, including the Musa paradisiaca AA (MA) and M. AAA Cavendish var. Brazil (MB) (Figure 1). The banana plantations in this study were established in September 2018, and the final harvest was completed in October 2020. Before the banana plantation was established in 2018, the land had been predominantly used for sugarcane cultivation. At the initiation of the study in 2018, the average soil organic matter content in the 0–30 cm layer was 21.6 g·kg−1 and 21.7 g·kg−1 in the MA and MB plantations, respectively. Both banana plantations exhibited no significant differences in initial soil texture or organic matter content and were managed under a uniform irrigation regime throughout the cultivation period. Table 1 lists the main agronomic and management characteristics of the two banana plantations.

2.3. Sampling and Data Collection

(1)
Data on carbon emissions from agricultural inputs were obtained from household surveys conducted between 2018 and 2020. Twenty-two growers of MA and thirty of MB were selected, and their production practices were continuously monitored for two years, covering a total plantation area of approximately 450 ha. All selected farmers had more than two years of banana-growing experience and cultivated more than 3 ha. The questionnaire collected information on banana variety, planting area and density, yield, fertilizer and pesticide use, bagging, electricity consumption for irrigation, and diesel use for machinery.
(2)
Soil respiration was continuously monitored from October 2019 to December 2020, during the second and third banana cropping cycles. In the initial phase, soil texture and organic matter sampling analyses were conducted at candidate sites. Study plots with minimal soil property variations were selected. Three monitoring points were randomly assigned to each plot to ensure representative observations, with soil rings installed at each location. A 60 cm deep trench was dug around the soil ring, and a double-layer thick plastic film was placed and backfilled to isolate the plant roots around it, and the soil heterotrophic respiration was monitored. Measurements were conducted monthly using a Li-8100A soil respiration monitoring system, with continuous 48 h monitoring at 1 h intervals, and each plot was measured three times.
(3)
Measuring banana biomass. During the ripening and harvest stage, fifty representative plants were selected from each of the eight near-average fertilizer-applied plantations for MB and MA. Morphological parameters such as plant height, pseudostem diameter, and leaf length were recorded and averaged. One representative plant matching the average values of these parameters was selected from each plantation. The entire plant was harvested. Aboveground organs (pseudostems, leaves, fruits) were weighed separately, while underground parts were excavated, washed, and weighed. Samples from each organ were returned to the laboratory. Water content was determined by oven drying at 60 °C until constant weight. Dried samples were ground into powder and sieved (0.25 mm). Carbon content was determined via potassium dichromate–sulfuric acid oxidation. The amount of carbon sequestered in the dry biomass of each plant was quantified and extrapolated to the plantation scale based on planting density.
(4)
Measuring soil carbon sequestration. Soil organic carbon (SOC) dynamics were assessed over a two-year period. Specifically, in September 2018 and October 2020, soil samples were collected from three distinct 15 m × 15 m plots within each banana plantation. Using a 50 mm diameter auger, five individual samples were taken from the 0–30 cm depth profile (0–10 cm, 10–20 cm, and 20–30 cm layers) within each plot. Samples from the same layer were combined to form a composite sample. In total, 18 composite samples were obtained (2 plantations × 3 plots × 3 soil layers). These samples were air-dried, passed through a 2 mm sieve, and then ground to pass through a 100-mesh sieve for SOC analysis. SOC content was measured using the potassium dichromate oxidation–spectrophotometric method, and bulk density was determined using the ring-knife method [28]. The annual soil carbon sequestration rate in the banana plantation was calculated based on the SOC content measured in September 2018 and October 2020.

2.4. Calculations of Indices

2.4.1. System Boundaries

The system boundaries for assessing the carbon balance of banana production in this study were defined as “from cradle to farm gate” [29], referring to the process from the production of agricultural inputs to banana harvest. In the study area, bananas are sold directly from growers’ fields. After harvest, intermediaries transport bananas from the fields to various markets. The underground parts and some leaves of banana plants remain in the fields, whereas pseudostems with leaves are collected by an energy company for biogas production.

2.4.2. Carbon Emissions and Footprint

The carbon footprint was calculated using the following equation:
Carbon   Footprint   ( g   CO 2   eq   kg 1 )   =   ( Ep C O 2 + Es C O 2 ) / Banana   yield
where Ep C O 2   represents direct or indirect carbon emissions from the use of agricultural inputs during banana cultivation, including CO2 emissions from their production and N2O emissions from fertilizer application. Carbon emissions from agricultural input production primarily include those from fertilizers and pesticides, as well as energy use for machinery and irrigation. In Formula (1), banana yield refers to the dry weight of the entire bunch, including the rachis. The average annual yield was 7160.24 kg·ha−1 for MA and 11,026.94 kg·ha−1 for MB. The calculation of Ep C O 2 is as follows [30]:
Ep C O 2   =   Ep i   =   Q i   ×   α i   ×   44 / 12
where Ep C O 2 represents the CO2-equivalent emissions of agricultural inputs during banana production (kg CO2 eq), Epi is the carbon emissions of each agricultural input, Qi is the quantity of each input (including fertilizer, pesticide, machinery, irrigation, and tillage), and αi is the carbon emission coefficient of each input, derived from the relevant literature [31,32,33,34,35,36] (Table 2). The factor 44/12 converts carbon equivalents (CEs) to CO2 equivalents.
N2O emissions from banana plantations primarily result from the application of nitrogen fertilizers, including (1) direct emissions of N2O through nitrification and denitrification; (2) indirect emissions from the deposition of nitrogen-containing reactive compounds after volatilization; and (3) indirect emissions from nitrogen leaching and runoff. The equations are as follows [37].
N 2 O direct =   N total   ×   E F direct
N 2 O deposition =   N total   ×   E F deposition   ×   α deposition
N 2 O leaching = N total   ×   E F leaching   ×   α leaching
E N 2 O = ( N 2 O direct +   N 2 O deposition + N 2 O leaching )   ×   298
where N2Odirect, N2Odeposition and N2Oleaching represent direct N2O emissions, indirect emissions from deposition, and indirect emissions from leaching and runoff, respectively; Ntotal is the total nitrogen input; and EFdirect, EFdeposition, and EFleaching represent the corresponding emission factors, with values of 1%, 1%, and 1.1%, respectively. αdeposition is the volatilization rate of nitrogen from agricultural land (11%), and αleaching is the rate of nitrogen leaching and runoff from banana plantations (24%) [37]. E N 2 O represents the CO2-equivalent of total N2O emissions (kg CO2 eq), and a conversion factor of 298 was applied, corresponding to the global warming potential of N2O relative to CO2 [32].
In Formula (1), Es C O 2 represents carbon emissions from soil heterotrophic respiration, which consumes soil organic or inorganic carbon. Residual banana roots and leaves in the field are important sources of soil carbon. CO2 absorbed from the atmosphere through photosynthesis is partly released back via root and leaf respiration, while the remainder is stored as organic matter, i.e., a part of net primary production (NPP) [38]. To avoid double-counting of CO2 from root respiration, banana roots should be physically isolated during soil respiration monitoring in agricultural fields. The equation is as follows:
Es C O 2   =   R soil   ×   T   ×   A
where Es C O 2 represents CO2 emissions from soil respiration (kg CO2 eq), T is time (a), A is the plantation area (ha), and R soil is the soil respiration flux (μmol·m−2·s−1).

2.4.3. Carbon Fixation and Measurement Methods

Carbon sequestration in banana plantations consists of two components: banana plants and plantation soils. Plant carbon fixation was calculated from the dry weight of banana organs using the following equation:
C plant = i C i = i G i t i 1     w i
where Cplant denotes the carbon fixation of a single banana plant (g C); i represents a plant organ; C i is the carbon sequestration of organ i (g C); G i is the organ’s weight (g); t i is its carbon content; and w i is its water content.
Soil carbon sequestration was calculated as follows [39]:
C soil   =   γ   ×   d   ×   C SOC   ×   S
Δ C soil = ( C soil   t C soil   0 ) t o
where Csoil denotes soil carbon content (g C); γ denotes soil bulk density (g·cm−3); d denotes soil depth (cm); CSOC denotes soil organic carbon content (%); S denotes the sampled area (cm2); ΔCsoil denotes the increase in soil carbon (g C); Csoil t denotes soil carbon content in period t, and Csoil 0 denotes soil carbon content in the baseline period; and t-o represents the duration of the observation period (years).

2.5. Statistical Analysis

The sensitivity analysis was conducted using a one-factor-at-a-time approach, whereby key input parameters were individually varied by ±20% from their baseline values, and the subsequent change in the net carbon sequestration was quantified. The uncertainty associated with the net carbon sequestration was expressed as 95% confidence intervals, derived from the propagation of uncertainties in the primary input parameters [40]
The raw data were organized and preprocessed using Microsoft Excel 2019. All statistical analyses were conducted with SPSS 26.0. Specifically, independent samples t-tests were employed to compare the corresponding indicators between the two banana plantations (or between the two sampling years), while one-way ANOVA was used to assess differences in these indicators among the various soil layers. All figures and data visualizations were produced using Origin 2024.

3. Results and Analysis

3.1. Carbon Emission and Carbon Footprint of Banana Plantations

3.1.1. Carbon Emissions of Agricultural Material

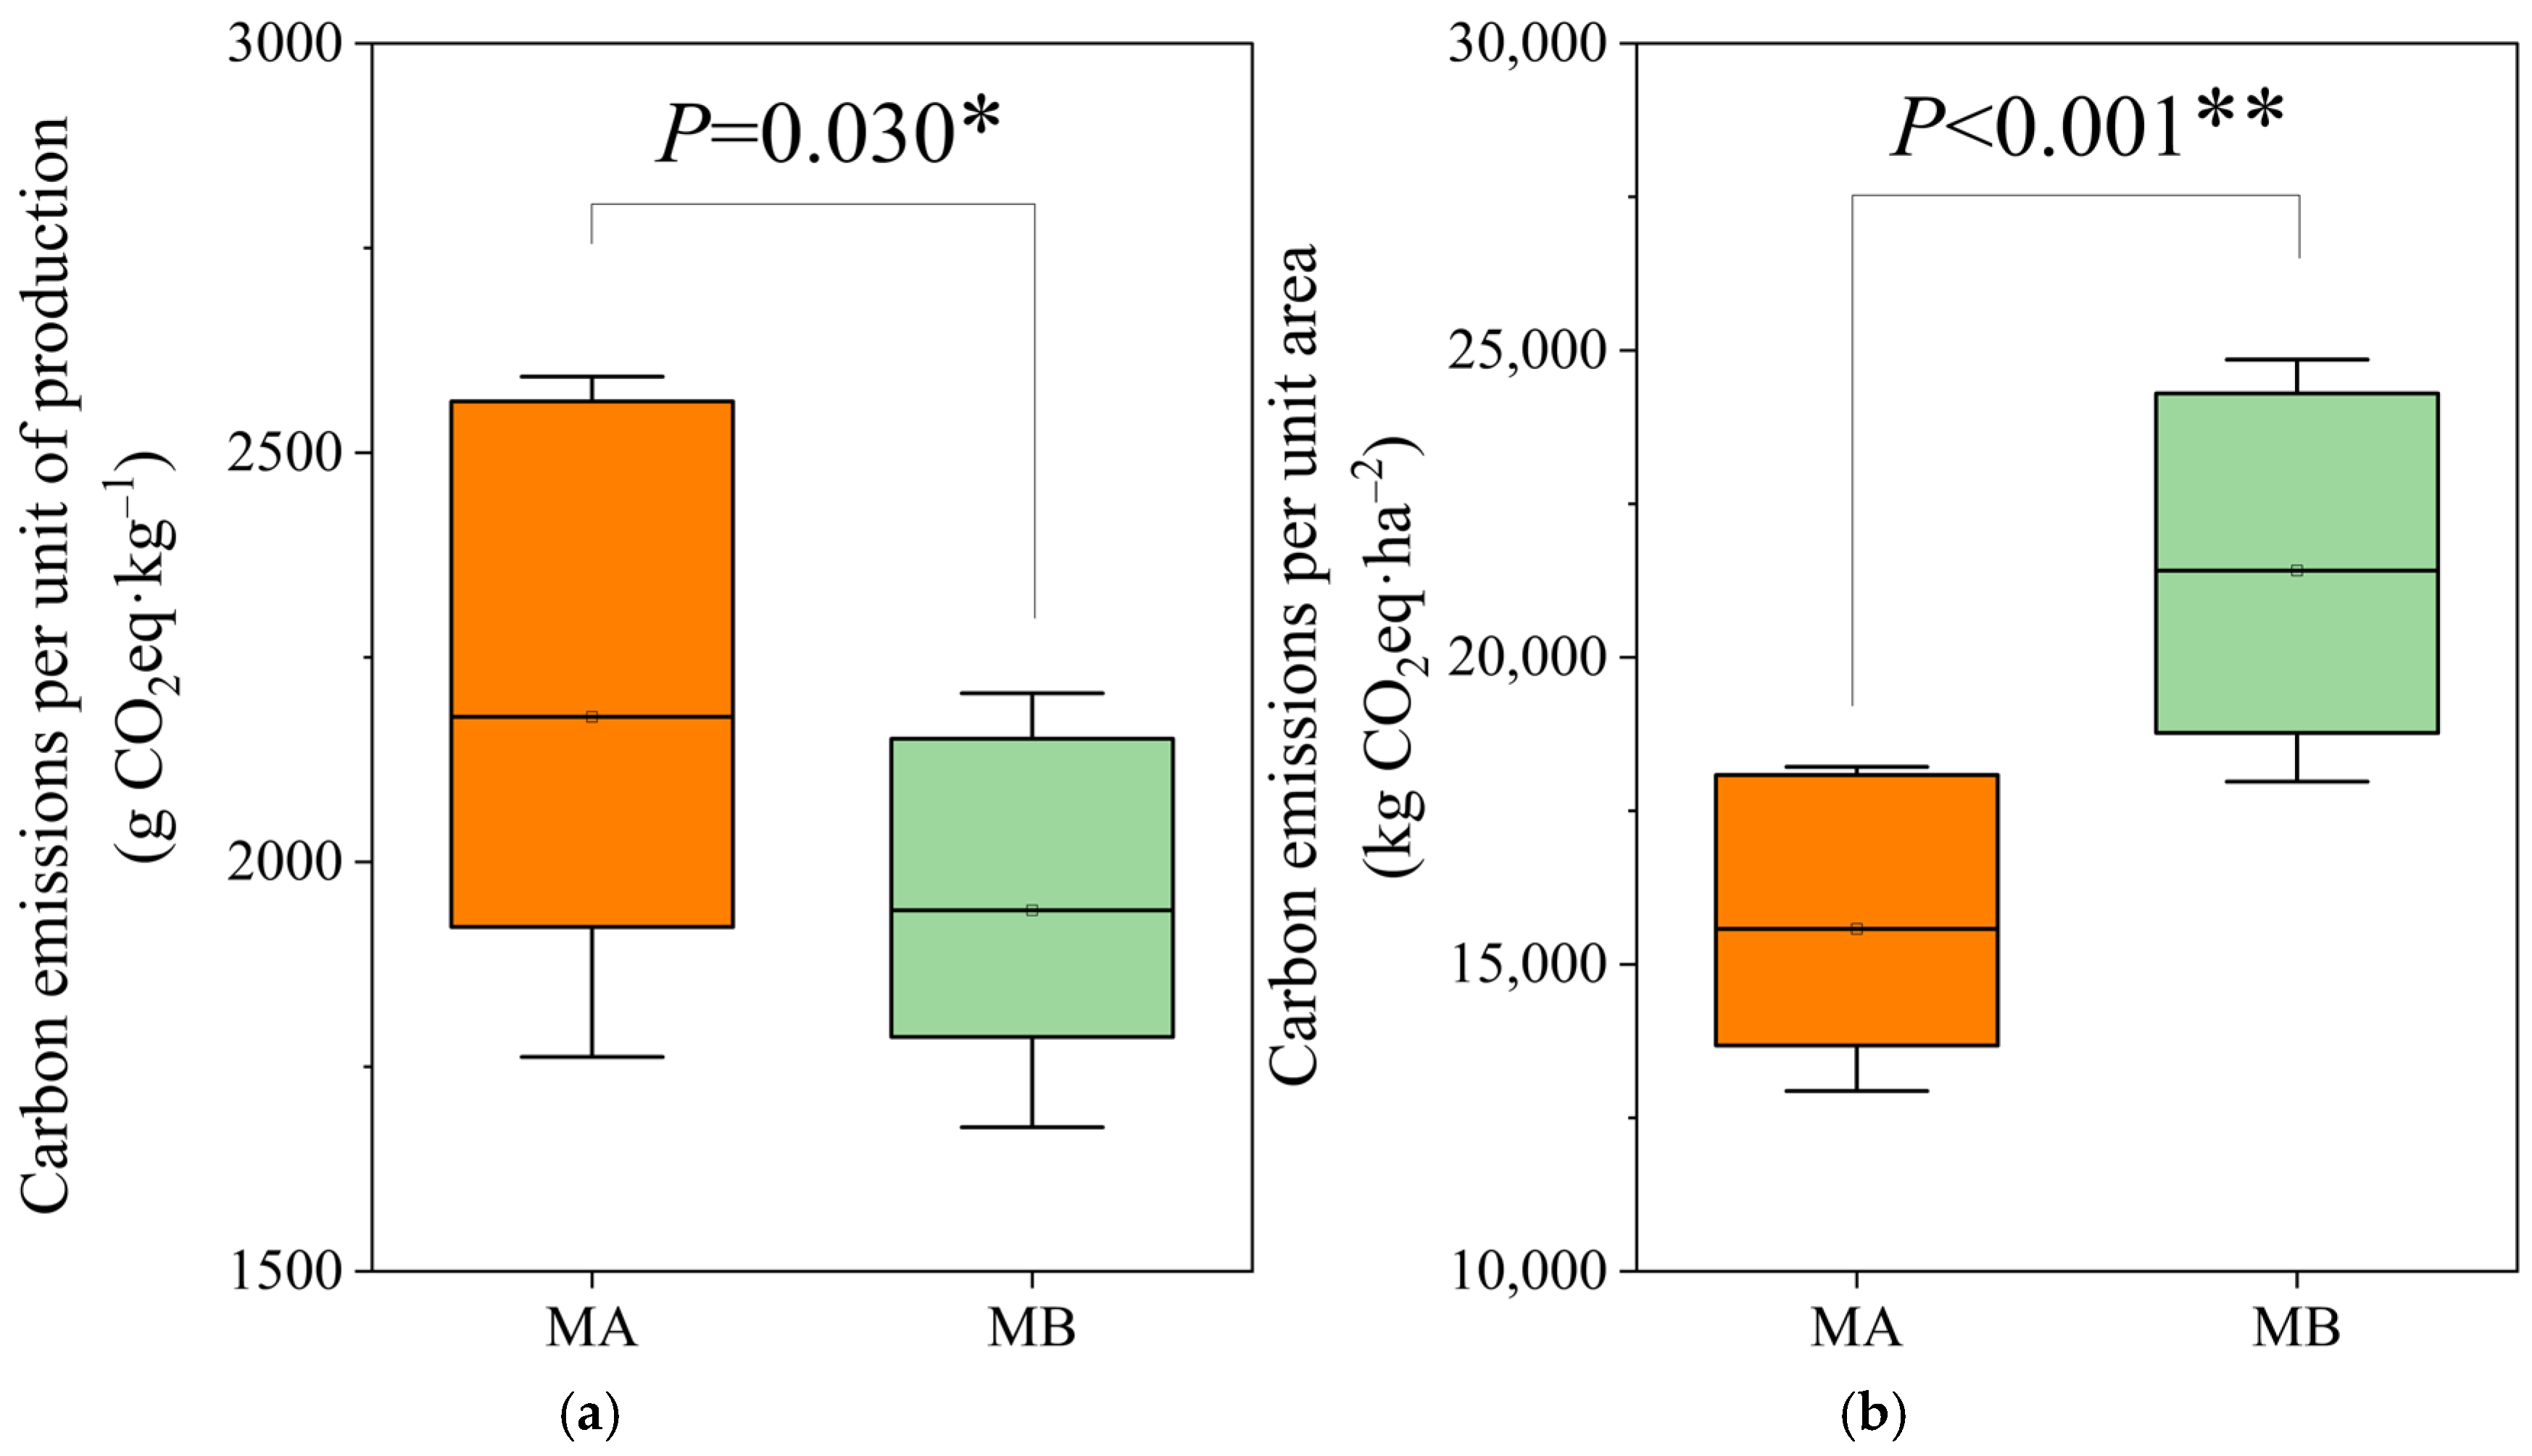
As shown in Figure 2, carbon emissions from agricultural inputs significantly differ across banana cultivars, both per unit yield and per unit area (p < 0.05). Specifically, cultivar MA emitted 2177.27 ± 415.63 g CO2 eq·kg−1 per unit yield and 15,575.66 ± 2640.11 kg CO2 eq·ha−1 per unit area. In contrast, cultivar MB exhibited 10.85% lower emissions per unit yield (1940.98 ± 265.06 g CO2 eq·kg−1) but 37.47% higher emissions per unit area (21,411.60 ± 3437.15 kg CO2 eq·ha−1) compared to MA.
As illustrated in Figure 3, notable differences were observed between the MA and MB banana cultivation systems in terms of the ranking of carbon emission sources from agricultural materials inputs and the proportional contribution of individual carbon emission components. For both banana plantations, compound fertilizers production and transportation constituted the largest source of carbon emissions, accounting for 36.49% (35.76–37.22%) and 30.80% (30.18–31.41%) of total agricultural emissions for MA and MB, respectively. This was followed by N2O emissions derived from the application of nitrogen and nitrogen-containing compound fertilizers, which represented 32.56% (31.90–33.22%) in MA and 28.71% (28.14–29.29%) in MB. Potash fertilizers (including potassium chloride, potassium sulfate, and high-potassium compound fertilizers) contributed 12.37% to total emissions in MA and 11.42% in MB. Moreover, diesel fuel use and other fertilizers represented a considerably higher share of emissions in MB plantations (6.90%) than in MA plantations (0.91%).

3.1.2. Carbon Emissions of Soil Respiration

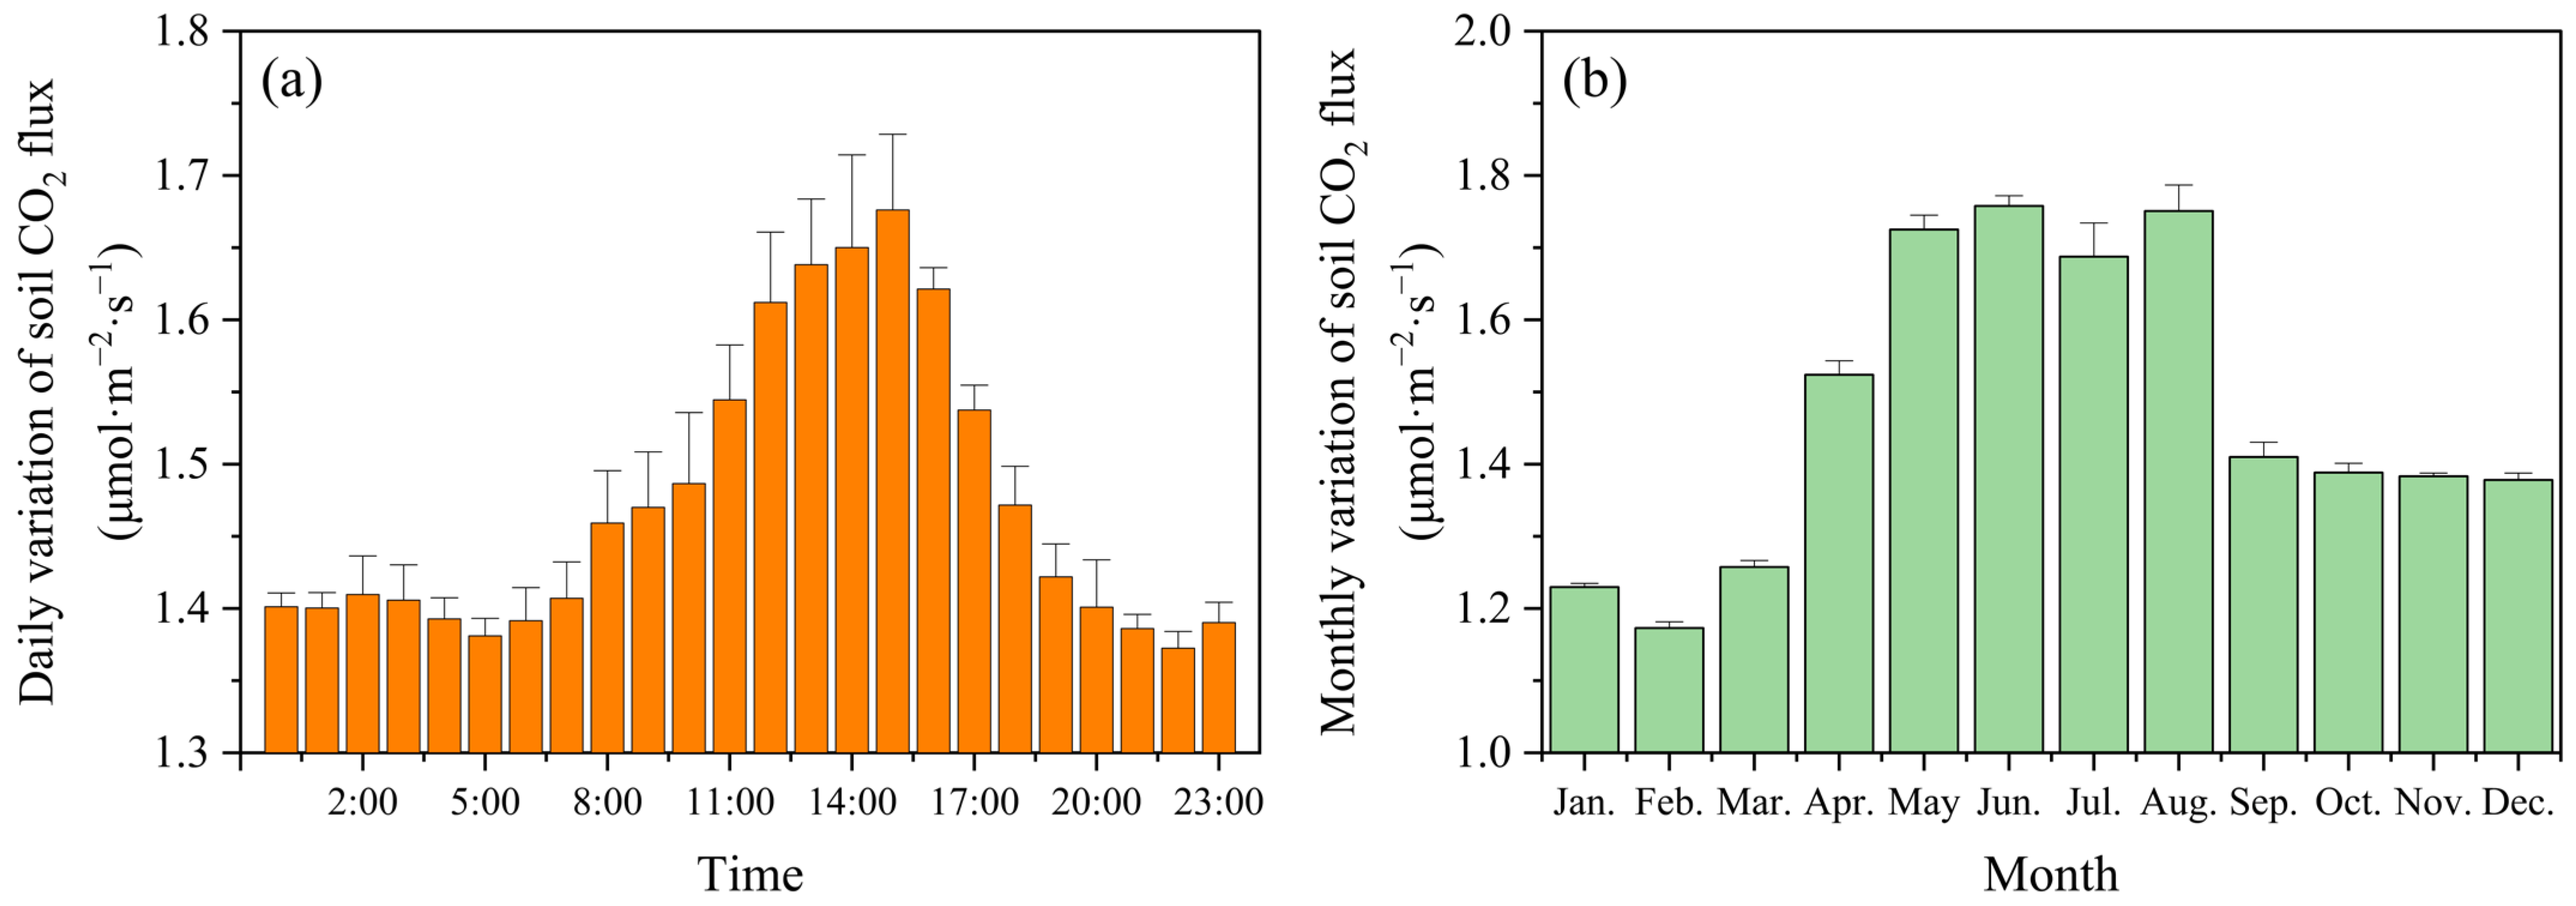
Soil respiration in the banana plantations exhibited a unimodal pattern in both its diurnal and seasonal variations (Figure 4). Diurnally, the respiration rate began to rise after 06:00, peaked at approximately 1.68 μmol·m−2·s−1 around 15:00, and then declined to approximately 1.37 μmol·m−2·s−1 by 22:00, remaining at a low level until sunrise. Seasonally, soil respiration rates were higher from April to August, reaching a maximum in June (1.76 μmol·m−2·s−1), and lower from September to March, with a minimum in February (approximately 1.17 μmol·m−2·s−1). The annual average soil respiration rate was 1.47 μmol·m−2·s−1, which corresponded to an average CO2 emissions of approximately 20,370 kg·ha−1·a−1 from the banana plantations.

3.1.3. Carbon Footprint of Banana Plantations

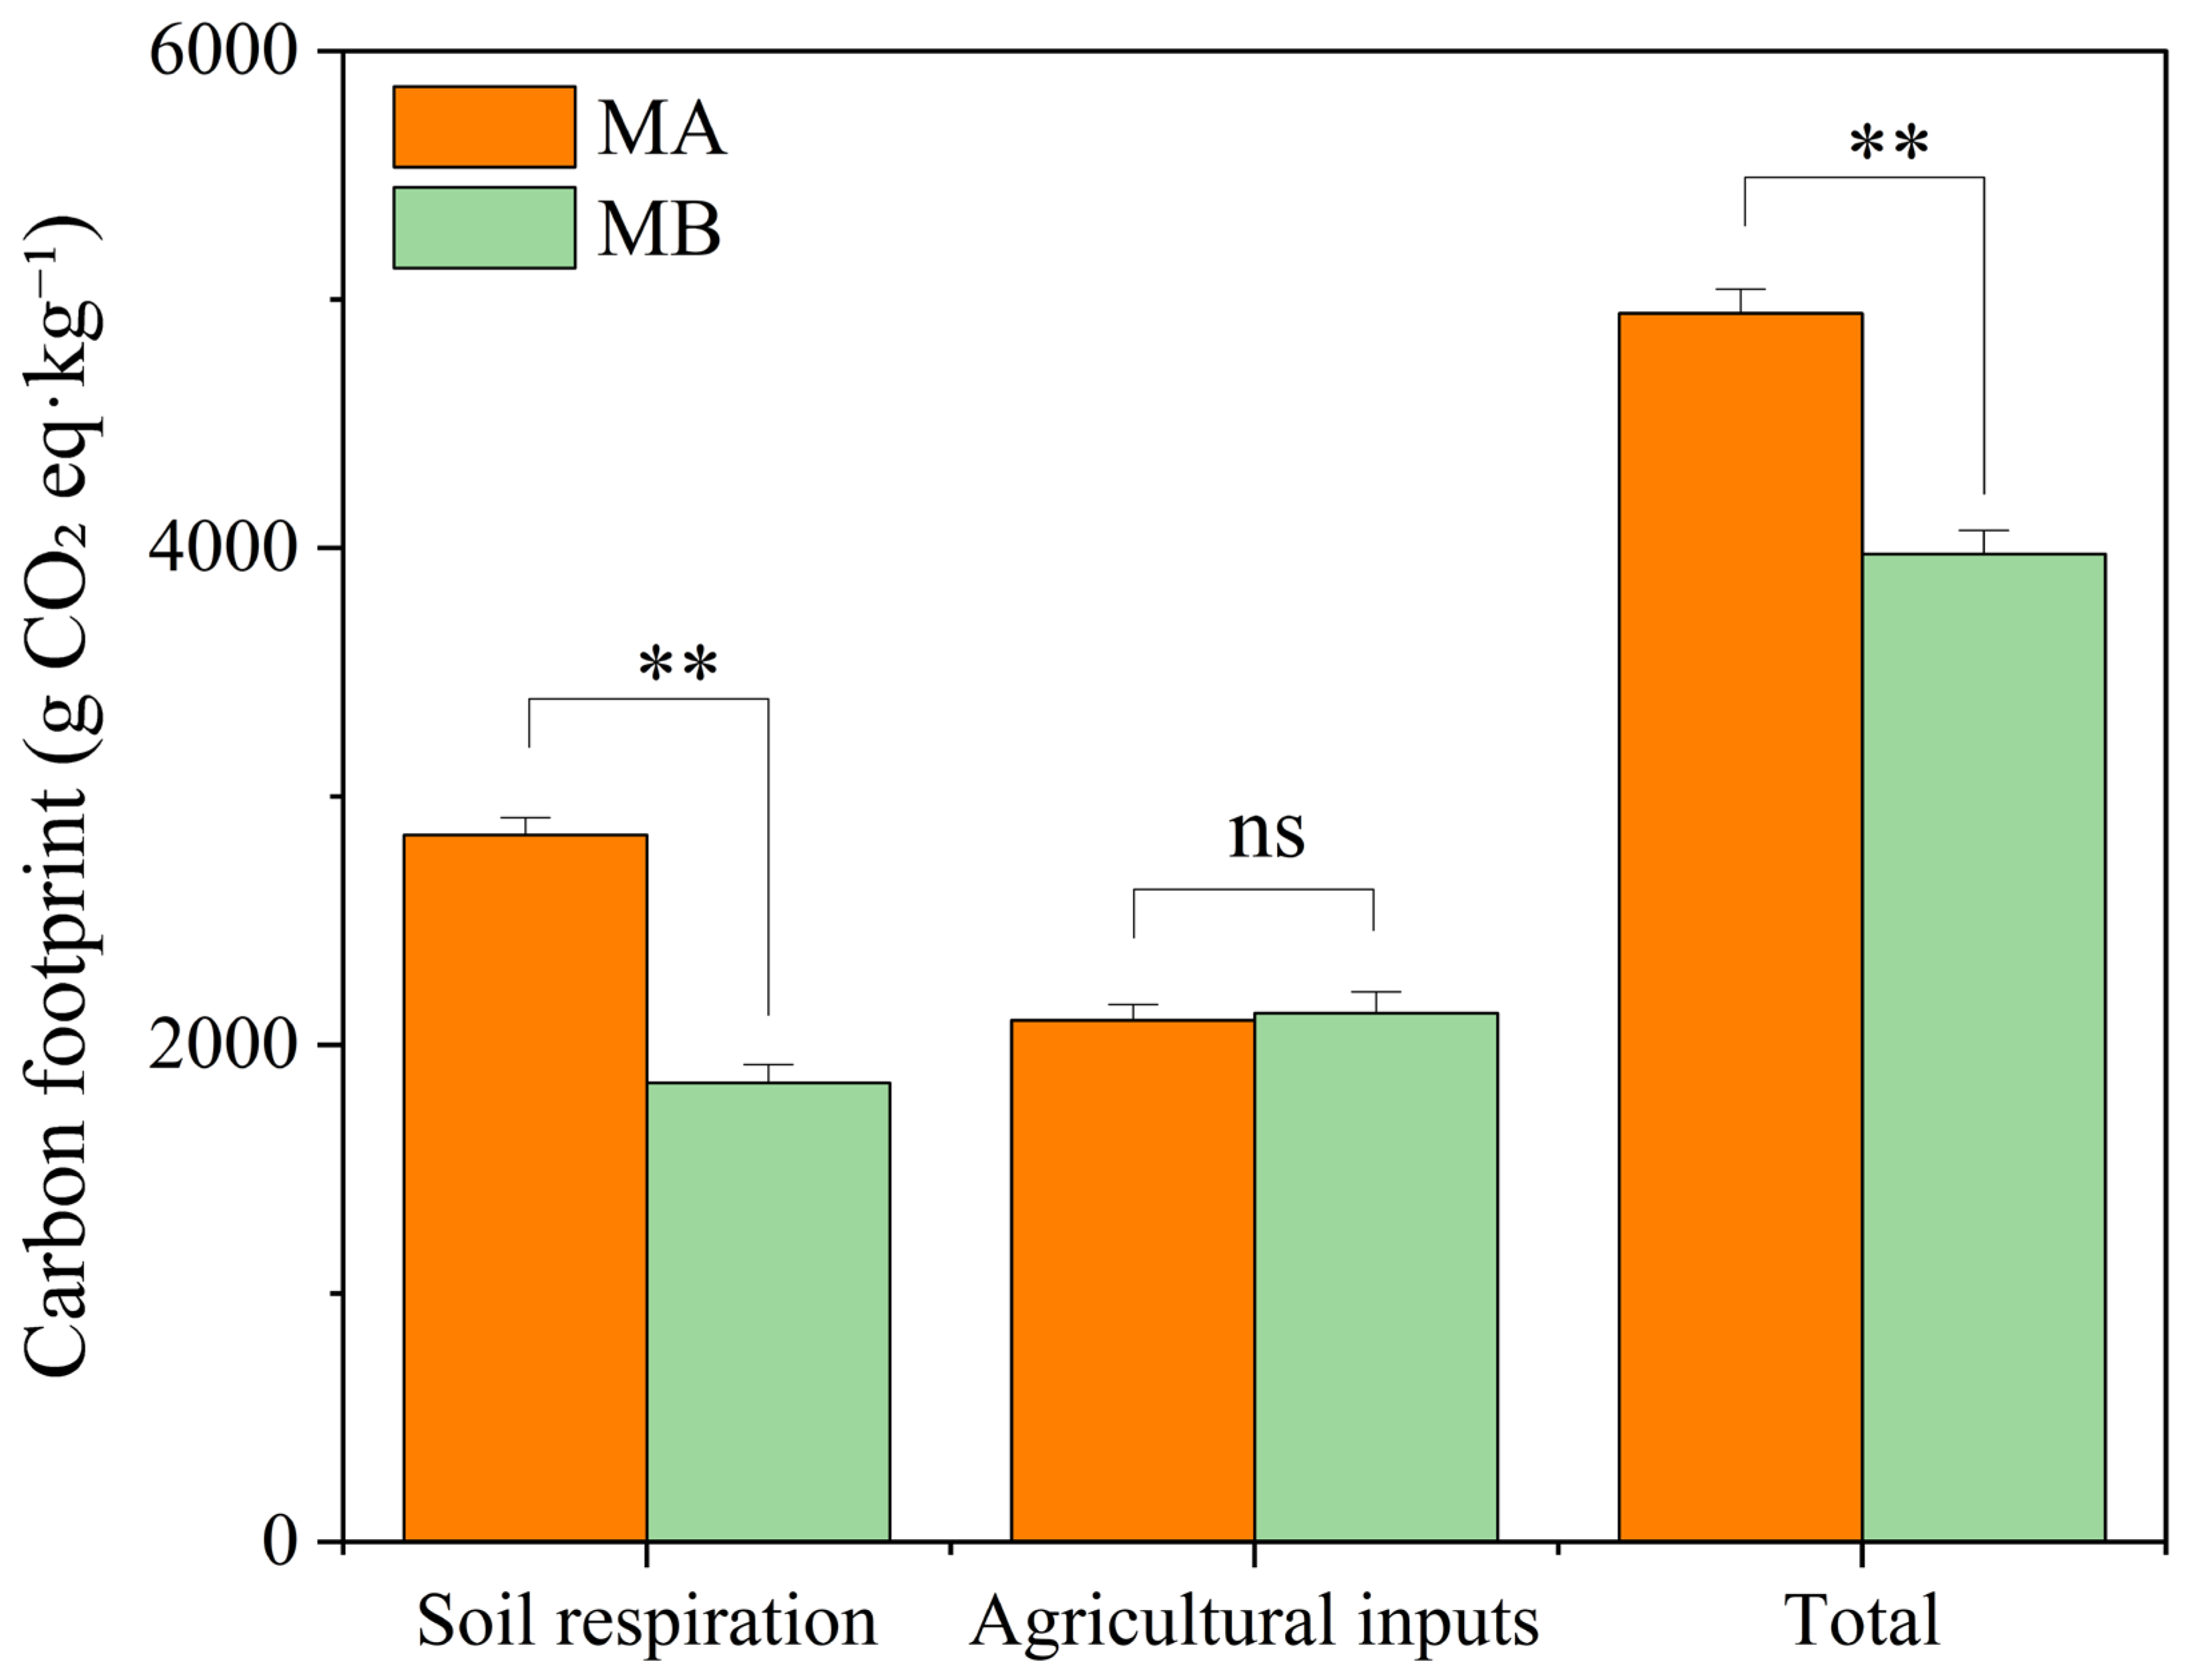
The carbon footprint of banana plantations consisted of emissions from both agricultural inputs and soil respiration (Figure 5). The soil respiration component was 2844.74 ± 71.12 g CO2 eq·kg−1 for MA and 1847.48 ± 73.90 g CO2 eq·kg−1 for MB, whereas emissions from agricultural inputs were 2099.77 ± 62.99 g CO2 eq·kg−1 and 2128.39 ± 85.14 g CO2 eq·kg−1, respectively.
The total carbon footprint was 4944.51 ± 98.89 g CO2 eq·kg−1 for MA, with soil respiration and agricultural inputs contributing 57.53% and 42.47%, respectively. In comparison, the total carbon footprint for MB was 3975.87 ± 95.42 g CO2 eq·kg−1, with the soil respiration and agricultural inputs contributing 46.47% and 53.53%, respectively.
Overall, the carbon footprint of MA banana plantations was significantly higher than that of MB (p < 0.01). This difference was primarily driven by the greater soil respiration emissions in MA.

3.2. Carbon Fixation of Banana Plantation Ecosystem

3.2.1. Plant Carbon Fixation of Banana Plantations

Table 3 shows that significant differences were observed in the average water and carbon contents among different organs of the two banana cultivars, whereas differences between the same organs of the two cultivars were minimal. For both cultivars, water content followed the order: pseudostem > root > leaf > fruit, while carbon content decreased in the order: leaf > fruit > pseudostem > root. Compared with MB, MA had slightly lower water content and slightly higher carbon content.
Carbon fixation of MA per plant and per unit area was lower than that of MB. This difference was mainly due to the smaller individual biomass of MA. On a per-plant basis, fixation was 36.77% lower in MA, averaging 2.31 kg CE (equivalent to 8.46 kg CO2 eq) per plant, compared with 3.65 kg CE (13.38 kg CO2 eq) per plant for MB. Overall, the annual average carbon fixation was approximately 37,092.82 kg CO2 eq for MA, compared to 51,982.50 kg CO2 eq for MB. On a per-unit area basis, MA exhibited a 28.68% lower in carbon fixation rate than MB.
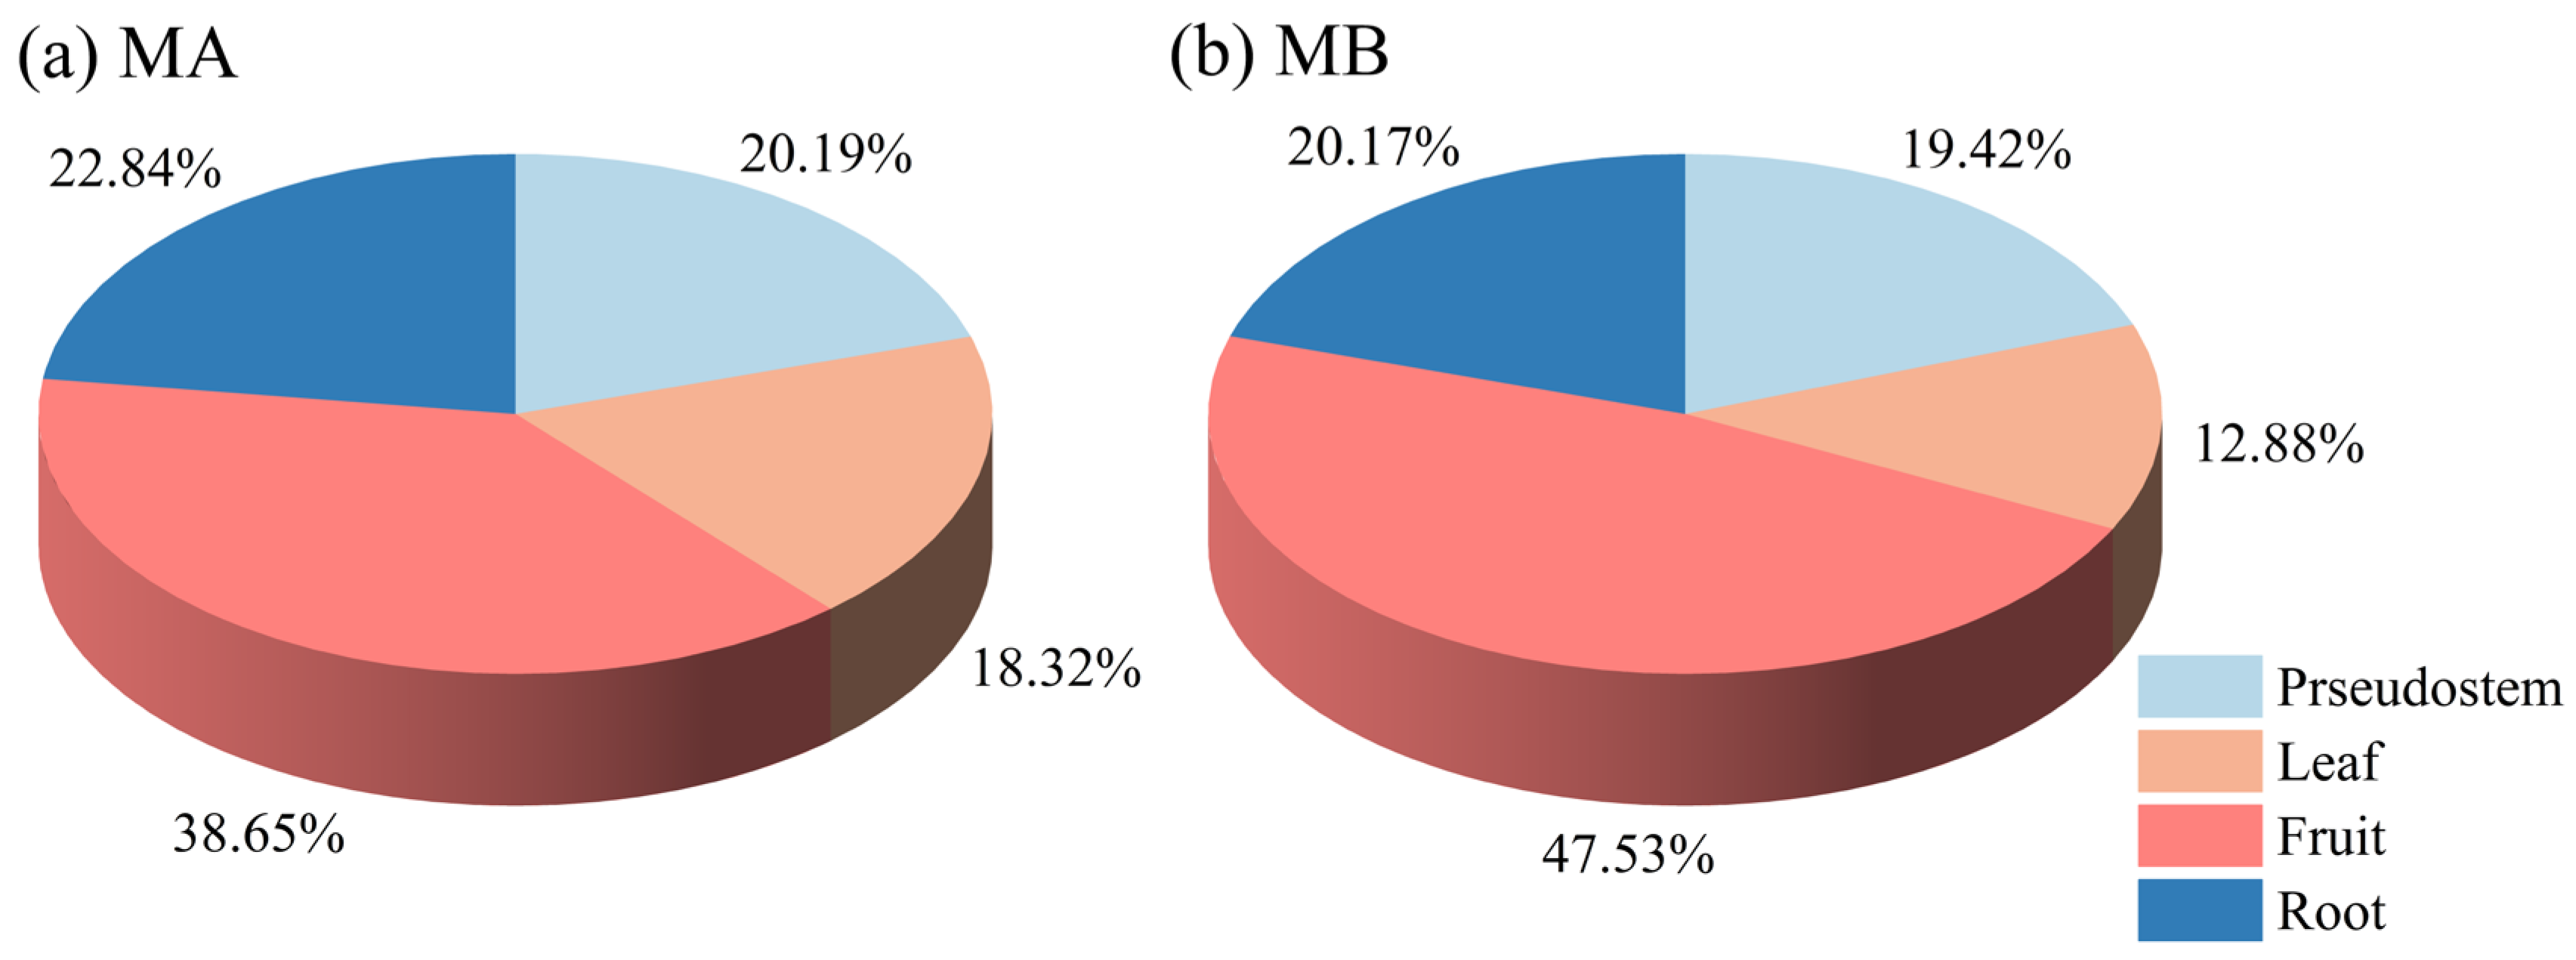
As shown in Figure 6, the ranking of organ-specific contributions to carbon fixation was consistent across cultivars, following the order: fruit > root > pseudostem > leaf. Fruits represented the largest proportion of carbon fixation, accounting for 38.65% in MA and 47.53% in MB. In contrast, leaves contributed the least, at 18.32% and 12.88%, respectively. Pseudostems and roots contributed intermediate proportions, with no significant differences between the two cultivars.

3.2.2. Soil Carbon Sequestration of Banana Plantations

Table 4 indicates that SOC content in the 0–30 cm layer of banana plantations increased from 2018 to 2020, with a more pronounced increase observed inter-row than inter-plant. Spatially, SOC content decreased with soil depth and was consistently higher in inter-row soils than in inter-plant soils. From 2018 to 2020, the average SOC content increased by 13.47% in inter-plant soils and 24.48% in inter-row soils. The annual change in SOC storage represents the soil carbon sequestration, which translates into an increase in SOC storage from 45,620 ± 1941 kg C·ha−1 in 2018 and 52,990 ± 4684 kg C·ha−1 in 2020. This equates to an average annual sequestration of 3680 kg C·ha−1 (corresponding to 13,510 kg CO2 eq·ha−1).

3.3. Carbon Balance of Banana Plantations

The carbon balance in banana plantation ecosystems was assessed by quantifying sources (agricultural inputs and soil respiration) and sinks (plant and soil carbon sequestration). Total carbon emissions reached 35,404.92 kg CO2 eq·ha−1 in MA plantations, with agricultural inputs and soil respiration contributing 42.47% and 57.53%, respectively. In contrast, MB plantations exhibited higher total carbon emissions (43,839.90 kg CO2 eq·ha−1), of which agricultural inputs and soil respiration contributed 53.53% and 46.47%, respectively. Total carbon fixation in banana plantation ecosystems comprised both plant and soil carbon sequestration. MA plantations sequestered 50,602.82 kg CO2 eq·ha−1, of which 73.30% was attributable to plant carbon fixation and 26.70% to soil carbon sequestration. In comparison, MB plantations showed greater total fixation (65,492.50 kg CO2 eq·ha−1), with plant and soil components accounting for 79.37% and 20.63%, respectively. Throughout the cultivation period, both banana systems functioned as a net carbon sink, with sequestration exceeding emissions. Net carbon sequestration per unit area was lower in MA (15,197.96 kg CO2 eq·ha−1) than in MB (21,652.88 kg CO2 eq·ha−1) (Table 5).

3.4. Sensitivity and Uncertainty Analysis

To assess the robustness of the carbon balance results, sensitivity and uncertainty analyses were conducted. A one-factor-at-a-time sensitivity analysis revealed that the net carbon sequestration was most sensitive to variations in two key parameters: the emission factor for nitrogen fertilizer application and the SOC sequestration coefficient. A ±20% change in the nitrogenous emission factor resulted in a 9.5% to 11.2% change in the net carbon sequestration across both cultivars. Similarly, a ±20% change in the SOC sequestration coefficient led to a 7.8% to 9.1% variation in the final carbon balance.
The uncertainty associated with net carbon sequestration was quantified using 95% confidence intervals and further interpreted through probabilistic analysis. The estimated ranges were 15,197.96 (95% CI: 13,633.46–16,762.37) kg CO2 eq·ha−1 for cultivar MA and 21,652.88 (95% CI: 19,738.92–23,566.28) kg CO2 eq·ha−1 for cultivar MB. The coefficients of variation were 5.25% and 4.51%, respectively, which are considered low as both values fall below the 10% threshold. This analysis confirms the robustness of the conclusion that MB plantations constitute a significantly superior net carbon sink compared to MA plantations, within the evaluated bounds of uncertainty.

4. Discussion

4.1. Sources and Drivers of Agricultural Carbon Emissions in Banana Cultivation Systems

The carbon emissions from agricultural inputs per unit yield were 2099.77 g CO2 eq·kg−1 for MA and 2128.39 g CO2 eq·kg−1 for MB, while the corresponding annual emissions per unit area were 15,034.92 and 23,469.90 kg CO2 eq·ha−1·a−1, respectively (Figure 2). In comparison with staple crops, including wheat, maize, and cotton, both MA and MB exhibited higher emissions on both a per-unit-area and per-unit-yield basis (Table 6). Compared with Myrica rubra fruit, the per-unit-yield emissions of bananas were significantly higher [41], while compared with Ecuadorian bananas, the unit emissions of MA and MB were slightly higher [42].
The composition of carbon emissions in banana production aligned with patterns observed in other crops, with fertilizer application, particularly nitrogen fertilizers, identified as the primary source of CO2 and N2O emissions. Specifically, fertilizer application contributed 81.73% of the total input-related emissions in MA and 74.00% in MB. These values exceed 68.56% reported for a winter wheat–summer maize rotation system [43], a discrepancy likely attributable to the intensive fertilization regimes in banana cultivation, where nitrogen input levels substantially exceed those of grain crops [44]. Moreover, the warm and humid climate of Hainan Island enhances soil nitrogen transformation, further increasing the potential for greenhouse gas emissions [45], which together explain the high contribution of fertilizer-derived emissions in the banana plantation.
Additionally, this study also revealed a distinct composition of agricultural carbon emissions between the two cultivars (Figure 2). For example, the contribution of energy-related emissions to total agricultural emissions differed significantly: 11.00% for MA versus 20.70% for MB. This discrepancy can be explained by three main factors. First, although both cultivars were cultivated using integrated water and fertilizer systems, MB required more frequent irrigation during the dry season due to its higher nutrient demands. Second, the higher fruit yield per plant in MB necessitated the use of diesel-powered equipment to drill holes and install support brackets for the fruit stalks. Third, although pesticide consumption contributed marginally to total emissions (5.70% for MA and 4.33% for MB), its application in MB relied on diesel-powered sprayers due to the cultivar’s dense foliage, whereas MA was mostly treated manually. Consequently, these factors resulted in nearly double the energy-related emissions in MB compared to MA.
Table 6. Comparison of carbon emissions from agricultural inputs of different crops.
SpeciesStudy AreaCarbon Emissions Per Unit Area
kg CO2 eq·ha−1
Carbon Emissions Per Unit of Production
kg CO2 eq·kg−1
Source
Myrica rubra fruitHuaihua, Hunan, China-0.19[41]
BananaEcuadorian-1.94[42]
Wheat-corn rotationGaomi, Shandong, China89600.53[43]
maizeXinjiang, China78230.35[46]
wheat,Xinjiang, China64750.41[46]
cottonXinjiang, China10,5771.91[46]

4.2. Factors Affecting Carbon Fixation in Banana Plantation Ecosystems

In banana plantation ecosystems, the fruits and vegetative plant parts served as the primary contributors to carbon fixation. This process was governed by several factors, including biomass accumulation, water content, tissue carbon content, and planting density. Although banana fruits contain approximately 80% water, the entire plants exhibit even higher moisture levels, with water content reaching up to 90%. Conversely, the carbon content of dry matter generally remained below 40%. Nevertheless, the high per-unit-area carbon fixation observed in bananas was attributable to their substantial individual fruit and plant biomass, coupled with high planting densities (2400–3000 plants·hm−2). Consequently, enhancing banana productivity by implementing appropriate field management practices is a key measure to enhance the carbon sequestration potential of the banana garden ecosystem.
Conservation tillage practices, such as no-tillage or reduced-tillage, can reduce the loss of SOC and enhance soil carbon sequestration [47]. In the study area, field management typically involved three harvests every two years, with the second and third crops regenerated from buds. These practices minimized soil disturbance, thereby reducing the rate of SOC mineralization and promoting its accumulation. Correspondingly, soil organic matter showed an increasing trend in banana plantations. This finding is consistent with previous studies indicating that conservation tillage can effectively mitigate SOC loss and enhance soil carbon sequestration [41,48]. Furthermore, other studies confirm that reducing soil disturbance, combined with plant residue mulching, not only increases crop yields and improves soil fertility but also contributes to carbon neutrality goals [49]. Long-term field experiments on winter wheat and other cropping systems have similarly reported higher carbon sequestration rates under no-tillage compared to conventional tillage [43].

4.3. Scientific Management and Development of Agricultural Land

Fertilizer application was identified as the primary contributor to carbon emissions in banana plantations, accounting for 80–90% of the total emissions from agricultural input (Figure 3). This predominance highlights a substantial potential for emission mitigation through improved fertilizer management. In the study area, the use of chemical fertilizers is an important measure to increase banana yield; the prevalent practice of excessive fertilizer application not only contributes to environmental pollution [50] but also significantly elevates carbon emissions [51]. Previous studies have shown that adopting scientific fertilization practices can reduce chemical fertilizer usage by up to 20% without compromising banana yields [52]. For example, Leno et al. (2021) found that applying organic fertilizer after biological composting led to significant improvements in banana plants compared to traditional methods, enhancing key metrics such as plant height, leaf count, pseudostem girth, bunch yield, and dry matter content [53]. Meya et al. (2023) also demonstrated that using a combination of cattle manure and mineral nitrogen fertilizer resulted in the highest average banana yield (an increase of 6.80–43.80%) while reducing average costs by 32% across all sites [54]. The sensitivity analysis identified the emission factor of nitrogen fertilizer as the most influential parameter on the carbon balance. This finding directly supports our recommendation for optimizing fertilizer management, as improving nitrogen use efficiency not only reduces direct emissions but also minimizes the uncertainty associated with the overall carbon footprint. Therefore, adopting integrated strategies, such as precision fertilization, organic amendments, and fertilizer inhibitors, presents a key strategy for mitigating the carbon footprint of banana cultivation while maintaining crop productivity.
Additionally, the modernization of field management also influenced per-unit-yield carbon emissions. For instance, plantations of MA were managed traditionally and manually, whereas MB plantations employed more modernized management. Consequently, the former emitted an average of 15,575.66 kg CO2 eq per unit area, while the latter emitted 21,411.60 kg CO2 eq·ha−1 (Figure 2). Moreover, MB banana varieties have denser foliage, which necessitates the use of diesel-powered sprayers. In contrast, the less dense MA variety allows for manual spraying with traditional equipment. Consequently, fuel-related carbon emissions account for a significantly larger share of the ecosystem’s total emissions in MB plantations (6.9%) than in MA plantations (0.91%). Similar findings have been reported for other crops [55]. For example, Sun et al. (2024) showed that the labor effect was a common suppressing factor for the carbon emissions of maize, wheat, and rice in the North China Plain [56]. Additionally, Cammarata et al. (2024) compared the carbon balance of orange orchards under conventional management and regenerative management, demonstrating that the latter can transform soil from a carbon source into a carbon sink [57]. The uncertainty analysis also confirms that, despite inherent data variability, the key finding is statistically robust: both banana systems act as net carbon sinks, with MB performing better than MA. Therefore, optimized chemical fertilizer application combined with improved field management practices can reduce greenhouse gas emissions and nutrient leaching without compromising yields, thus contributing to the green development of agriculture [52,58,59].
This study provides a carbon balance assessment of the entire banana cultivation cycle, establishing a benchmark for comprehensive environmental impact evaluations. Given that its findings are based on two varieties under similar management, it did not account for carbon emissions during commodity circulation or the resource utilization of banana plant residues, both of which are critical for a full lifecycle assessment. Future research should: (1) expand the system boundaries to include carbon emissions from post-harvest commodity circulation and the resource utilization of banana plant residues, and evaluate the carbon footprint throughout the entire life cycle of banana production; (2) conducting long-term trials to quantify the carbon sequestration and soil health benefits of integrated organic-mineral fertilization; (3) thoroughly analyzing the emissions trade-offs between modernized and traditional practices; and (4) developing integrated decision-support tools. Such tools are essential for generating localized recommendations on fertilizer use, variety selection, and management, thereby advancing climate-smart, low-carbon, and high-efficiency banana production systems.

5. Conclusions

This study provides a comprehensive, ecosystem-scale assessment of the carbon balance in banana cultivation, demonstrating that both production systems function as net carbon sinks. The MB cultivar exhibited a markedly superior carbon balance, with net sequestration per unit area reaching 21,652.88 kg CO2 eq·ha−1, significantly higher than that of the MA cultivar (15,197.96 kg CO2 eq·ha−1) (p < 0.05). Fertilizer management was identified as the dominant source of anthropogenic emissions, contributing 74.03–81.76% of the total carbon footprint from agricultural inputs, underscoring that optimizing fertilization practices represents the most critical lever for emission mitigation. The study also confirms the significant carbon sequestration potential of banana plantations, supported by robust plant growth and a notable increase in topsoil organic carbon ranging from 13.47% to 24.48% during the study period. To enhance the ecosystem’s inherent sink capacity, it is imperative to promote organic amendments and management practices that improve soil carbon storage. Furthermore, for high-yielding varieties such as MB, efforts should focus on precision fertilizer application and improved mechanization efficiency to reduce input-related emissions. This dual approach of mitigating major emission sources while strengthening sequestration pathways offers a pathway for the banana industry to achieve a productive and sustainable future. Future research will expand the system boundary to encompass the entire life cycle of banana production, evaluate the long-term carbon sequestration effects of soil under integrated fertilization conditions, analyze the emissions trade-offs between modernized and traditional practices, and develop decision support tools to guide the formulation of climate-smart low-carbon management strategies.

Author Contributions

X.S.: Writing—original draft, Conceptualization, and Investigation; C.K., W.Y. and M.M.: Formal analysis, Methodology, and resources; C.Z.: Funding acquisition, Conceptualization, and Revision. All authors have read and agreed to the published version of the manuscript.

Funding

This research was funded by the Hainan Natural Science Foundation (422RC662, 322RC659 and 320QN253) and the National Nature Science Foundation of China (41361006).

Data Availability Statement

The original contributions presented in this study are included in the article. Further inquiries can be directed to the corresponding author.

Conflicts of Interest

The authors declare no conflicts of interest.

References

  1. Zhou, H.C. Researcher Zhou Hongchun from the Development Research Center of the Carbon Peaking and Carbon Neutrality Goals Leading the Comprehensive Green Transformation in China’s Economy and Society: An Interview withe State Council. J. Poyang Lake 2022, 1, 5–14+125. [Google Scholar]
  2. IPCC. Climate Change 2023: Synthesis Report. Contribution of Working Groups i, ii and iii to the Sixth Assessment Report of the Intergovernmental Panel on Climate Change; IPCC: Geneva, Switzerland, 2023. [Google Scholar]
  3. Beillouin, D.; Demenois, J.; Cardinael, R.; Berre, D.; Corbeels, M.; Fallot, A.; Boyer, A.; Feder, F. A global database of land management, land-use change and climate change effects on soil organic carbon. Sci. Data 2022, 9, 228. [Google Scholar] [CrossRef]
  4. Mandal, A.; Majumder, A.; Dhaliwal, S.S.; Toor, A.S.; Mani, P.K.; Naresh, R.K.; Gupta, R.K.; Mitran, T. Impact of agricultural management practices on soil carbon sequestration and its monitoring through simulation models and remote sensing techniques: A review. Crit. Rev. Environ. Sci. Technol. 2022, 52, 1–49. [Google Scholar] [CrossRef]
  5. Sha, Z.; Bai, Y.; Li, R.; Lan, H.; Zhang, X.; Li, J.; Liu, X.; Chang, S.; Xie, Y. The global carbon sink potential of terrestrial vegetation can be increased substantially by optimal land management. Commun. Earth Environ. 2022, 3, 8. [Google Scholar] [CrossRef]
  6. Kamyab, H.; SaberiKamarposhti, M.; Hashim, H.; Yusuf, M. Carbon dynamics in agricultural greenhouse gas emissions and removals: A comprehensive review. Carbon Lett. 2024, 34, 265–289. [Google Scholar] [CrossRef]
  7. Madrid-Solórzano, J.M.; García-Alcaraz, J.L.; Martínez Cámara, E.; Blanco Fernández, J.; Jiménez Macías, E. Sustainable Industrial Sotol Production in Mexico—A Life Cycle Assessment. Agriculture 2022, 12, 2159. [Google Scholar] [CrossRef]
  8. Ozlu, E.; Arriaga, F.J.; Bilen, S.; Gozukara, G.; Babur, E. Carbon Footprint Management by Agricultural Practices. Biology 2022, 11, 1453. [Google Scholar] [CrossRef]
  9. Wang, J.; Chang, G.; Liu, H.; Zhang, Y.; Li, H.; Hu, K. Carbon balance analysis of agricultural production systems in oasis areas. Sci. Rep. 2024, 14, 16698. [Google Scholar] [CrossRef]
  10. Suwan, C.; Somjai, T. Carbon Footprint Analysis of the Cultivated Banana Cultivation in Prachinburi Province, Thailand. E3S Web Conf. 2022, 355, 02002. [Google Scholar] [CrossRef]
  11. Luo, D.; Xu, G.; Luo, J.; Cui, X.; Shang, S.; Qian, H. Integrated Carbon Footprint and Economic Performance of Five Types of Dominant Cropping Systems in China’s Semiarid Zone. Sustainability 2022, 14, 5844. [Google Scholar] [CrossRef]
  12. Bartzas, G.; Doula, M.; Komnitsas, K. Life Cycle Assessment of Key Mediterranean Agricultural Products at the Farm Level Using GHG Measurements. Agriculture 2025, 15, 1494. [Google Scholar] [CrossRef]
  13. Sun, T.; Feng, X.; Lal, R.; Cao, T.; Guo, J.; Deng, A.; Zheng, C.; Zhang, J.; Song, Z.; Zhang, W. Crop diversification practice faces a tradeoff between increasing productivity and reducing carbon footprints. Agric. Ecosyst. Environ. 2021, 321, 107614. [Google Scholar] [CrossRef]
  14. Mehta, H.; Kumar, P.; Banyal, V.; Sharma, N.; Kumar, N. Driving Sustainability in Fruit-Based Cropping Systems: Intercropping Impacts on Growth, Soil Health, Microbial Dynamics and Yield Stability. Physiol. Mol. Plant Pathol. 2025, 139, 102774. [Google Scholar] [CrossRef]
  15. Yang, C.; Wang, A.; Zhu, Z.; Lin, S.; Bi, Y.; Du, X. Impact of Extensive Management System on Soil Properties and Carbon Sequestration under an Age Chronosequence of Moso Bamboo Plantations in Subtropical China. For. Ecol. Manag. 2021, 497, 119535. [Google Scholar] [CrossRef]
  16. López-Blanco, E.; Väisänen, M.; Salmon, E.; Jones, C.P.; Schmidt, N.M.; Marttila, H.; Lohila, A.; Juutinen, S.; Scheller, J.; Christensen, T.R. The Net Ecosystem Carbon Balance (NECB) at Catchment Scales in the Arctic. Front. Environ. Sci. 2025, 13, 1544586. [Google Scholar] [CrossRef]
  17. Abdelkader, M.; Zargar, M.; Murtazova, K.M.-S.; Nakhaev, M.R. Life Cycle Assessment of the Cultivation Processes for the Main Vegetable Crops in Southern Egypt. Agronomy 2022, 12, 1527. [Google Scholar] [CrossRef]
  18. Hanson, P.J.; Edwards, N.T.; Garten, C.T.; Andrews, J.A. Separating Root and Soil Microbial Contributions to Soil Respiration: A Review of Methods and Observations. Biogeochemistry 2000, 48, 115–146. [Google Scholar] [CrossRef]
  19. Bond-Lamberty, B.; Shi, Z.; Vargas, R.; Todd-Brown, K. Twenty years of progress, challenges, and opportunities in soil respiration research. J. Geophys. Res. Biogeosci. 2024, 129, e2023JG007637. [Google Scholar] [CrossRef]
  20. Jansson, C.; Faiola, C.; Wingler, A.; Zhu, X.-G.; Kravchenko, A.; De Graaff, M.-A.; Ogden, A.J.; Handakumbura, P.P.; Werner, C.; Beckles, D.M. Crops for Carbon Farming. Front. Plant Sci. 2021, 12, 636709. [Google Scholar] [CrossRef] [PubMed]
  21. Zhang, K.; Liu, Z.; McCarl, B.A.; Fei, C. Enhancing Agricultural Soil Carbon Sequestration: A Review with Some Research Needs. Climate 2024, 12, 151. [Google Scholar] [CrossRef]
  22. Mo, L.; Zohner, C.M.; Reich, P.B.; Liang, J.; De Miguel, S.; Nabuurs, G.-J.; Renner, S.S.; Van Den Hoogen, J.; Araza, A.; Herold, M. Integrated Global Assessment of the Natural Forest Carbon Potential. Nature 2023, 624, 92–101. [Google Scholar] [CrossRef] [PubMed]
  23. Zhou, Z.; Wang, C.; Li, Y.; Wang, X.; He, X.; Xu, M.; Cai, A. Carbon Gain in Upper but Loss in Deeper Cropland Soils across China over the Last Four Decades. Proc. Natl. Acad. Sci. USA 2025, 122, e2422371122. [Google Scholar] [CrossRef]
  24. Gelaye, Y.; Getahun, S. A review of the carbon sequestration potential of fruit trees and their implications for climate change mitigation: The case of Ethiopia. Cogent Food Agric. 2024, 10, 2294544. [Google Scholar] [CrossRef]
  25. Hong, S.; Yuan, X.; Yang, J.; Yang, Y.; Jv, H.; Li, R.; Jia, Z.; Ruan, Y. Selection of rhizosphere communities of diverse rotation crops reveals unique core microbiome associated with reduced banana Fusarium wilt disease. New Phytol. 2023, 238, 2194–2209. [Google Scholar] [CrossRef] [PubMed]
  26. Suppen-Reynaga, N.; Guerrero, A.; Dominguez, E.; Sacayón, E.; Solano, A. Life cycle assessment of bananas, melons, and watermelons from Costa Rica. Clean. Circ. Bioecon. 2024, 9, 100120. [Google Scholar] [CrossRef]
  27. Zhao, Y.; Zhang, B.; Zhang, C.; Ju, X. Nitrogen and Phosphorus Surplus and Soil Nitrate Nitrogen Accumulation in Typical Rice-Vegetable Rotation and Banana Garden in Hainan. Sci. Agric. Sin. 2023, 56, 2954–2965. [Google Scholar]
  28. Bao, S.D. Soil Agricultural Chemical Analysis, 3rd ed.; China Agricultural Press: Beijing, China, 2000; pp. 265–267. [Google Scholar]
  29. Wróbel-Jędrzejewska, M.; Włodarczyk, E. Comparison of Carbon Footprint Analysis Methods in Grain Processing—Studies Using Flour Production as an Example. Agriculture 2023, 14, 14. [Google Scholar] [CrossRef]
  30. Zhao, R.; Qin, M. Temporospatial Variation of Partial Carbon Source/Sink of Farmland Ecosystem in Coastal China. J. Ecol. Rural Environ. 2007, 23, 1–6. [Google Scholar]
  31. Chen, S.; Lu, F.; Wang, X.K. Estimation of greenhouse gases emission factors for China’s nitrogen, phosphate, and potash fertilizers. Acta Ecol. Sin. 2015, 35, 6371–6383. [Google Scholar]
  32. Zhang, G.; Lu, F.; Huang, Z.G.; Chen, S.; Wang, X. Estimations of application dosage and greenhouse gas emission of chemical pesticides in staple crops in China. Chin. J. Appl. Ecol. 2016, 27, 2875–2883. [Google Scholar]
  33. Ministry Policy Paper. China Low Carbon Yearbook—2013 China Regional Grid Baseline Emission Factors, 1st ed.; Metallurgical Industry Press: Beijing, China, 2014; pp. 189–191. [Google Scholar]
  34. IPCC. Climate Change 2007: Synthesis Report. Contribution of Working Groups I, II and III to the Fourth Assessment Report of the Intergovernmental Panel on Climate Change; IPCC: Geneva, Switzerland, 2007. [Google Scholar]
  35. Zhou, T.; Gao, M.; Xie, D.; Wei, C. Research on Carbon Source/Sink and Carbon Footprint of Cropland Ecosystem in Chongqing. J. Southwest Agric. Univ. 2014, 36, 96–102. [Google Scholar]
  36. Chen, C.; Qiu, R. Estimation of Energy Consumption and Carbon Emissions of China’s Pulp & Paper Industry. Chin. Pulp Paper 2014, 32, 50–55. [Google Scholar]
  37. Department of Climate Change. National Development and Reform Commission. In Guidelines for the Preparation of Provincial Greenhouse Gas Inventories (for Trial Implementation); State Council Executive Meeting: Beijing, China, 2011. [Google Scholar]
  38. Izett, R.W.; Fennel, K.; Stoer, A.C.; Nicholson, D.P. Reviews and Syntheses: Expanding the Global Coverage of Gross Primary Production and Net Community Production Measurements Using Biogeochemical-Argo Floats. Biogeosciences 2024, 21, 13–47. [Google Scholar] [CrossRef]
  39. Han, B.; Wang, X.K.; Lu, F.; Duan, X.N.; OuYang, Z.Y. Soil carbon sequestration and its potential by cropland ecosystems in China. Acta Ecol. Sin. 2008, 28, 612–619. [Google Scholar]
  40. Jiang, R.; Xu, Q.; Li, J.Y.; Dai, L.X.; Ao, D.C.; Dou, Z.; Gao, H. Sensitivity and Uncertainty Analysis of Carbon Footprint Evaluation: A Case Study of Rice–Crayfish Coculture in China. Chin. J. Eco-Agric. 2022, 30, 1577–1587. [Google Scholar]
  41. He, J.; Xiong, Z.; Deng, L.; Liao, Q.; Liu, D.; Dai, Q. Carbon Footprint Assessment of Fresh Myrica Rubra Fruit Based on LCA. Chin. J. Eco-Agric. 2025, 33, 413–423. [Google Scholar]
  42. Veliz, K.; Chico-Santamarta, L.; Ramirez, A.D. The Environmental Profile of Ecuadorian Export Banana: A Life Cycle Assessment. Foods 2022, 11, 3288. [Google Scholar] [CrossRef] [PubMed]
  43. Zhu, Y.; Li, Y.; Jiang, D.; Zou, X. Life Cycle Assessment on Carbon Footprint of Winter Wheat -Summer Maize Cropping System Based on Survey Data of Gaomi in Shandong Province, China. J. Agric. Resour. Environ. 2017, 34, 473–482. [Google Scholar]
  44. Wang, S.; Zhou, S. The dynamic relation between fertilization, precipitation and the diffusion of agricultural non-point pollution in Hainan Island. Front. Environ. Sci. 2024, 12, 1419912. [Google Scholar] [CrossRef]
  45. da Silva, R.B.; Antunes, T.; Rosa, J.S.; Packer, A.P.; Bento, C.B.; do Carmo, J.B.; de Melo Silva, F.A. CO2, CH4 and N2O Emissions after Fertilizer Application in Banana Plantations Located in the Brazilian Atlantic Forest. Soil Use Manag. 2022, 38, 1597–1613. [Google Scholar] [CrossRef]
  46. Yang, L.; Yue, K.; Zhang, L. Carbon Footprint of Major Crop Production under the Goal of’ double Carbon’ in Xinjiang, China. Chin. J. Appl. Ecol. 2025, 36, 1147–1158. [Google Scholar]
  47. Meng, X.; Meng, F.; Chen, P.; Hou, D.; Zheng, E.; Xu, T. A meta-analysis of conservation tillage management effects on soil organic carbon sequestration and soil greenhouse gas flux. Sci. Total Environ. 2024, 954, 176315. [Google Scholar] [CrossRef] [PubMed]
  48. Liu, W.; Shi, Z.; He, H.; Lin, B.; He, C.; Dang, Y.; Zhao, X.; Zhang, H. Improving soil organic carbon sequestration through conservation tillage incorporating legume-based crop rotations. Soil Till. Res. 2026, 255, 106792. [Google Scholar] [CrossRef]
  49. Li, Y.; Wang, Y.; Qiu, G.; Yu, H.; Liu, F.; Wang, G.; Duan, Y. Conservation tillage facilitates the accumulation of soil organic carbon fractions by affecting the microbial community in an eolian sandy soil. Front. Microbiol. 2024, 15, 1394179. [Google Scholar] [CrossRef]
  50. Zhou, Y.; Xu, L.; Zhang, J.W.; Li, W.; Jiang, Y.; Wang, S.; Ding, Y.; Liu, Z.; Li, G. Low N Apparent Surplus with Higher Rice Yield under Long-Term Fertilizer Postponing in the Rice-Wheat Cropping System. Crop J. 2022, 10, 1178–1186. [Google Scholar] [CrossRef]
  51. Chen, H.; Cheng, X.; Zhang, X.; Shi, H.; Chen, J.; Xu, R.; Chen, Y.; Ying, J.; Wu, Y.; Zhou, Y. Effects of Fertilizer Application Intensity on Carbon Accumulation and Greenhouse Gas Emissions in Moso Bamboo Forest–Polygonatum Cyrtonema Hua Agroforestry Systems. Plants 2024, 13, 1941. [Google Scholar] [CrossRef]
  52. Huang, L.; Cheng, S.; Liu, H.; Zhao, Z.; Wei, S.; Sun, S. Effects of Nitrogen Reduction Combined with Organic Fertilizer on Growth and Nitrogen Fate in Banana at Seedling Stage. Environ. Res. 2022, 214, 113826. [Google Scholar] [CrossRef]
  53. Leno, N.; Sudharmaidevi, C.R. Physicochemical and Nutrient Release Characteristics of a Thermochemical Organic Fertilizer Produced from Degradable Solid Waste and Its Effect on Productivity of Banana. Commun. Soil Sci. Plant Anal. 2021, 52, 2562–2577. [Google Scholar] [CrossRef]
  54. Meya, A.I.; Swennen, R.; Ndakidemi, P.A.; Mtei, K.M.; Merckx, R. Better nitrogen fertilizer management improved Mchare banana productivity and profitability in northern highlands, Tanzania. Agronomy 2023, 13, 1418. [Google Scholar] [CrossRef]
  55. Behera, S.S.; Ojha, C.S.P.; Prasad, K.H.; Dash, S.S. Yield, water, and carbon footprint of rainfed rice production under the lens of mid-century climate change: A case study in the eastern coastal agro-climatic zone, Odisha, India. Environ. Monit. Assess. 2023, 195, 544. [Google Scholar] [CrossRef] [PubMed]
  56. Sun, T.; Li, H.; Wang, C.; Li, R.; Zhao, Z.; Guo, B.; Yao, L.; Gao, X. The Carbon Footprint and Influencing Factors of the Main Grain Crops in the North China Plain. Agronomy 2024, 14, 1720. [Google Scholar] [CrossRef]
  57. Cammarata, M.; Tadiello, T.; Scuderi, A.; Millar, N.; Basso, B. Regenerative practices can lead to carbon-negative orange groves in Sicily. J. Agric. Food Res. 2024, 19, 101615. [Google Scholar] [CrossRef]
  58. Ye, W.; Wang, C.; Zhao, C.; Zheng, X. Spatial and temporal patterns of the carbon footprint of tropical farmland ecosystems on Hainan Island in the last 20 years. Chin. J. Agric. Resour. Reg. Plan. 2021, 42, 114–126. [Google Scholar]
  59. Madane, D.A.; Singh, M.C.; Sharma, P.; Mane, M. Water and carbon footprint assessment of onion crop cultivated under differential irrigation scenarios. Arab. J. Geosci. 2023, 16, 419. [Google Scholar] [CrossRef]
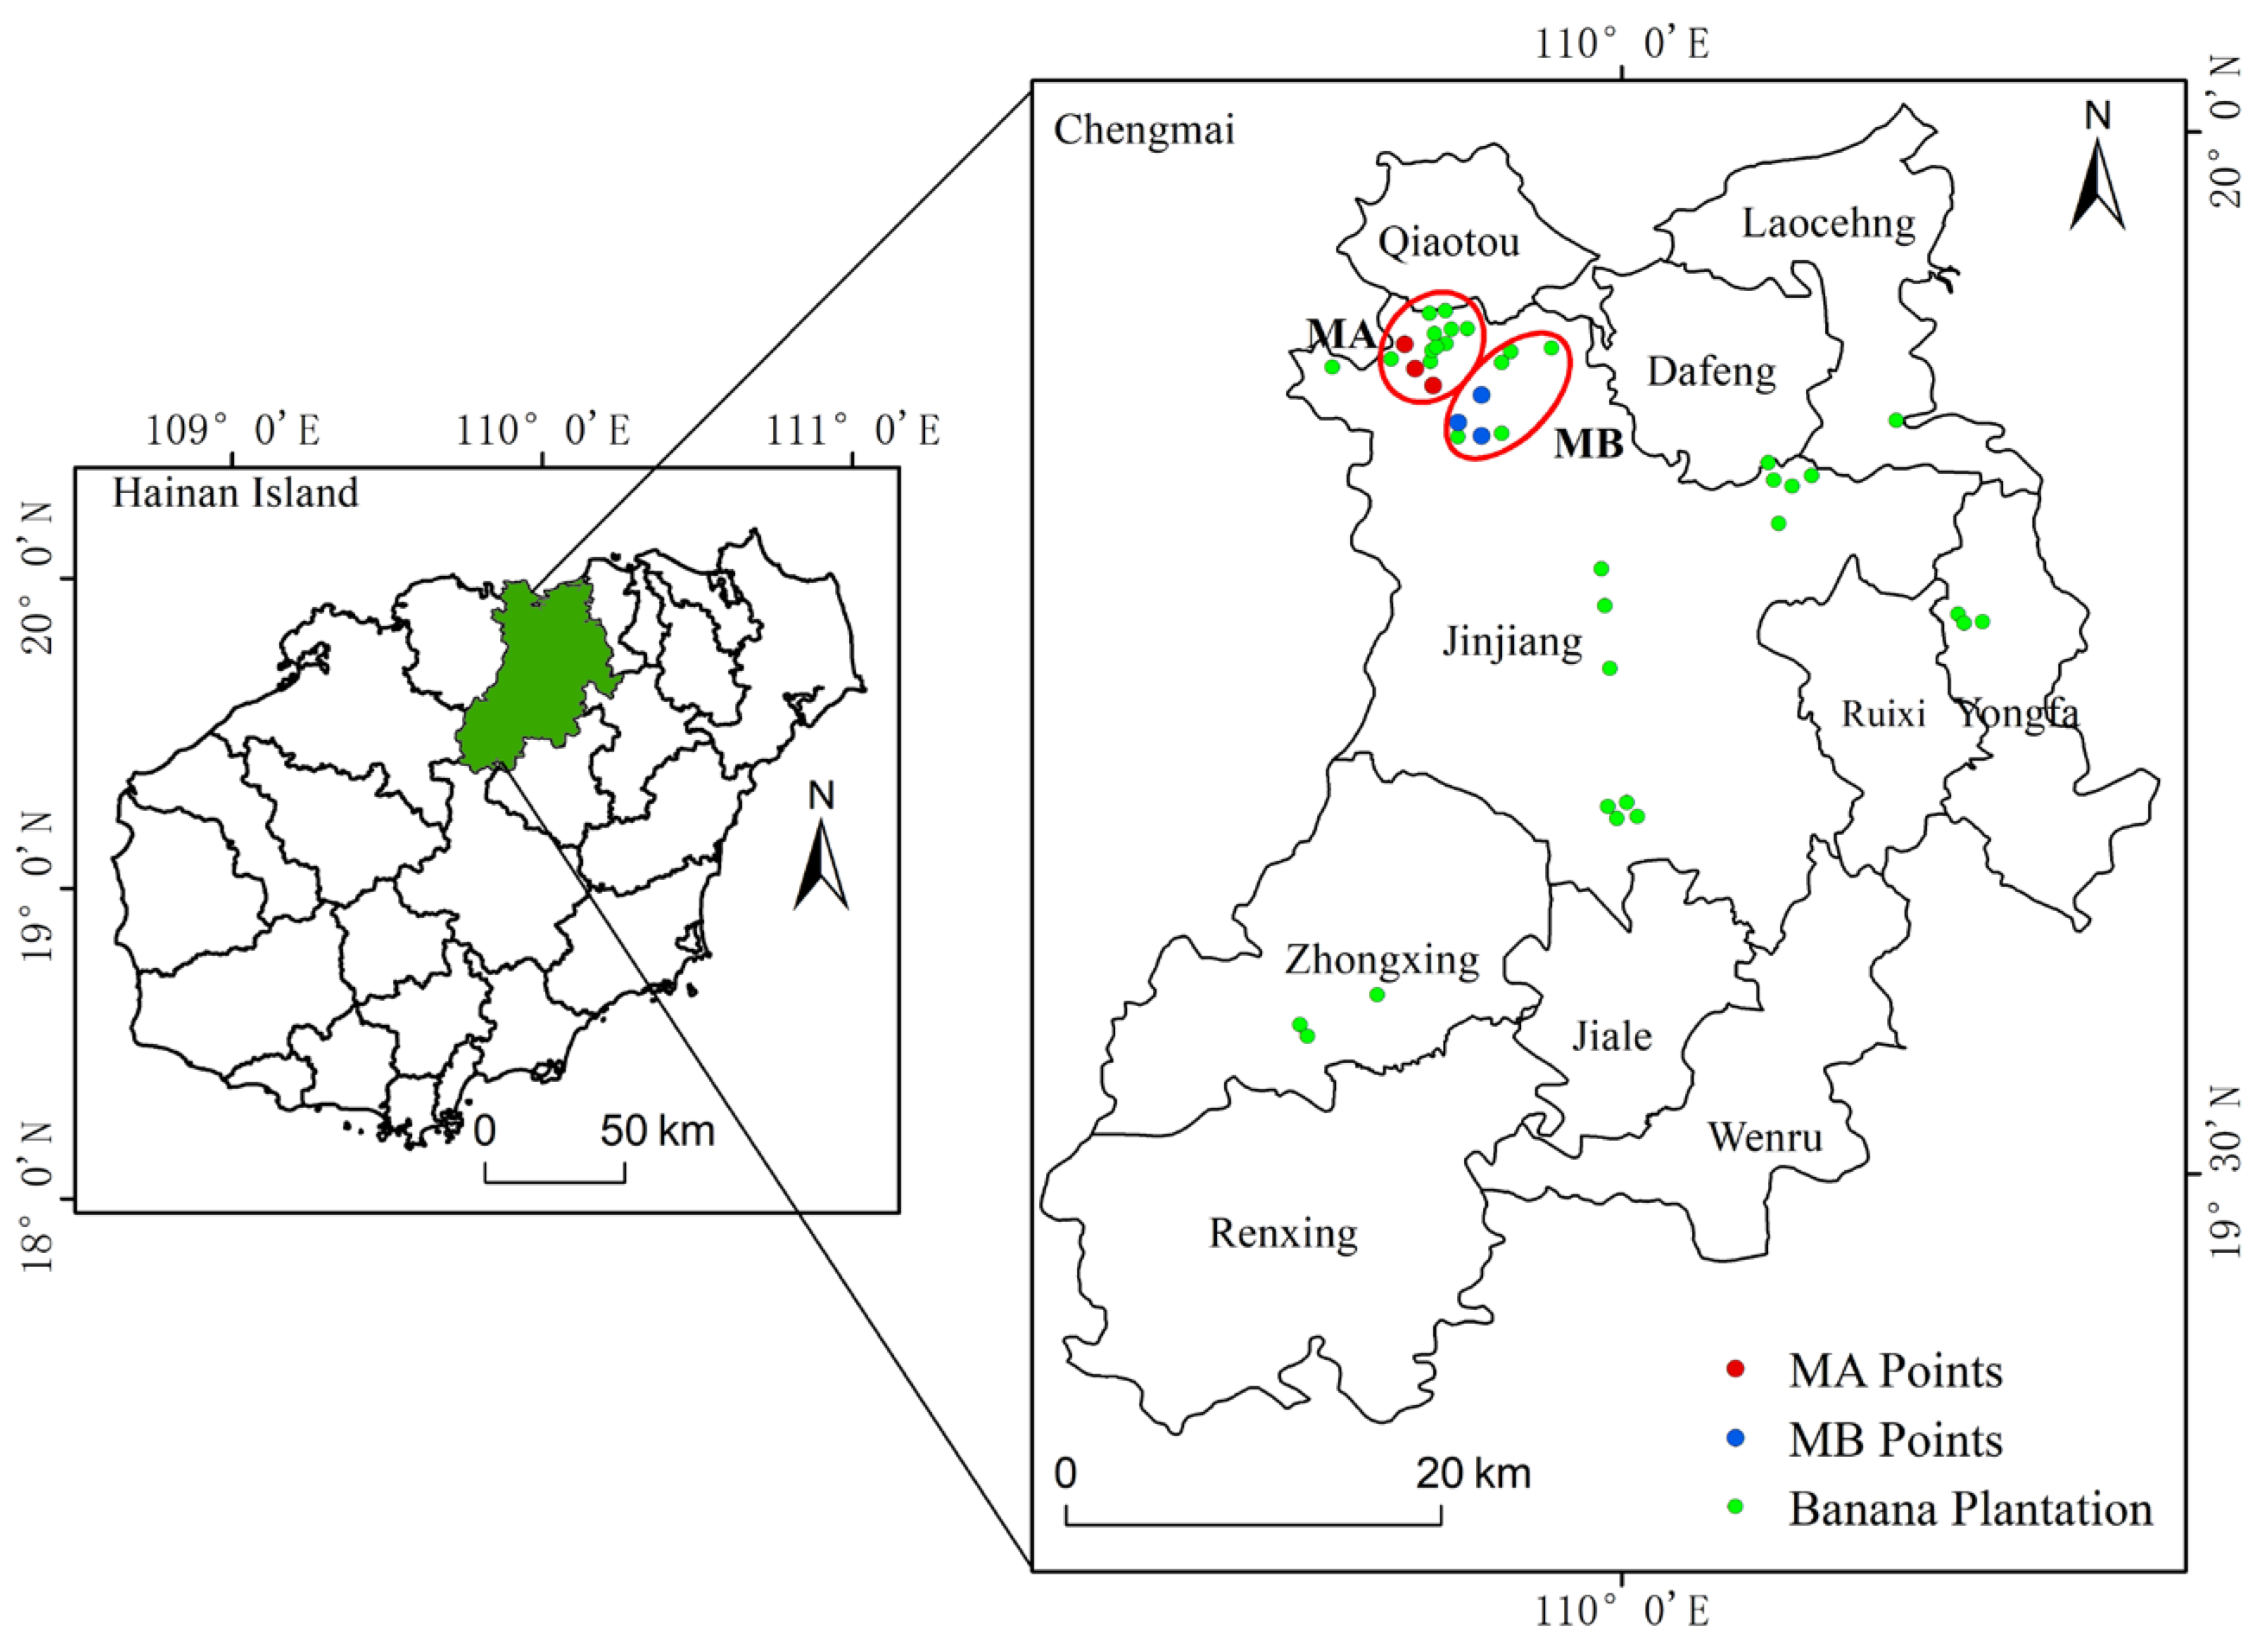
Figure 1. Locations of the study sites. MA, Musa paradisiaca AA; MB, M. AAA Cavendish var. Brazil.
Agronomy 15 02676 g001
Figure 2. Carbon emissions from agricultural inputs per unit of production (a) and per unit area of different varieties of bananas (b). MA, Musa paradisiaca AA; MB, M. AAA Cavendish var. Brazil. The central line in each box represents the mean (n = 22). * indicates a significant difference between the two banana plantations (based on independent samples t-test), *, p < 0.05; **, p < 0.01.
Agronomy 15 02676 g002
Figure 3. Carbon emission composition of agricultural inputs of different banana varieties. MA, Musa paradisiaca AA; MB, M. AAA Cavendish var. Brazil. N2O refers to the emissions resulting from the fertilizer application process; the carbon emissions of all fertilizers include the total emissions generated during fertilizer production and transportation; the carbon emissions for diesel fuel, electricity, and bags include those from direct combustion, operation, and transportation.
Agronomy 15 02676 g003
Figure 4. Soil heterotrophic respiration fluxes in banana plantations: (a) diurnal and (b) seasonal variations. Values are expressed as the mean ± standard error (n = 3) at each sampling time.
Agronomy 15 02676 g004
Figure 5. Carbon footprint and its composition of different banana varieties. MA, Musa paradisiaca AA; MB, M. AAA Cavendish var. Brazil. Values are expressed as the mean ± standard error (n = 22). ** indicates a significant difference between the two banana plantations at p < 0.01, ns, p > 0.05.
Agronomy 15 02676 g005
Figure 6. Carbon fixation composition of banana plants. MA, Musa paradisiaca AA; MB, M. AAA Cavendish var. Brazil.
Agronomy 15 02676 g006
Table 1. Key agronomic and management characteristics of the two banana plantations.
ParameterMusa paradisiaca AA (MA)M. AAA Cavendish var. Brazil (MB)
Planting density (plants/ha)~3000~2700
Spacing (plant × row)1.2–1.5 m × 2.0–2.5 m1.5–2.0 m × 2.0–2.5 m
Pseudostem height2.5–3.2 m2.5–3.2 m
Basal circumference (at 20 cm)40–50 cm50–65 cm
Yield/plant5–10 kg18–35 kg
Basal fertilizerOrganic manure + compound fertilizerOrganic manure + compound fertilizer
Topdressing (seedling stage)1–2 times/month1–2 times/month
Topdressing (growth stage)2–3 times/month3–4 times/month
IrrigationDrip irrigationDrip irrigation
Table 2. Carbon emission coefficient of the main carbon emission sources in banana plantations.
Carbon SourceEmission FactorsData Sources
Urea2.041 kg CE/kg[31]
Calcium superphosphate0.195 kg CE/kg[31]
Potassium chloride0.168 kg CE/kg[31]
Potassium sulfate0.409 kg CE/kg[31]
Ternary compound fertilizer0.939 kg CE/kg[31]
High potassium low
phosphorus compound fertilizer
0.836 kg CE/kg[31]
Bactericide12.78 kg CE/kg[32]
Insecticide10.0 kg CE/kg[32]
Herbicide7.91 kg CE/kg[32]
Preservative12.78 kg CE/kg[32]
Agricultural Electricity0.917 kg CO2 eq/kW·h[33]
Diesel fuel3.933 kg CO2 eq/kg[34]
Agricultural film5.18 kg CO2 eq/kg[35]
Paper bags1.5 kg CO2 eq/kg[36]
Table 3. Water content and carbon content in different tissues of various banana varieties.
ItemSpeciePseudostemLeafFruitRootWhole Plant
Water Content
(Fresh Weight)
(%)
MA94.6 a86.0 b77.9 b89.2 a88.96 a
MB94.9 a88.1 a81.4 a89.9 a89.64 a
Carbon Content
(Dry Weight)
(%)
MA38.1 a41.0 a40.9 a36.4 a39.23 a
MB36.4 b40.6 a40.4 a36.2 a38.66 a
MA, Musa paradisiaca AA; MB, M. AAA Cavendish var. Brazil. Lowercase letters indicate that there were significant differences in water content and carbon content between different banana varieties at the same plant parts (p < 0.05).
Table 4. Changes in soil organic carbon content in different depths.
TimeSiteDepth
(cm)
SOC Content
(g·kg−1)
SOC Storage
(t C·ha−1)
September
2018
Inter-plant0–1014.30 ± 0.29 Aa16.87 ± 0.51 Bb
10–2012.70 ± 0.38 Ba14.99 ± 0.60 Ba
20–3010.50 ± 0.21 Ba12.39 ± 0.25 Bb
Inter-row0–1014.70 ± 0.59 Ba18.23 ± 0.91 Ba
10–2012.20 ± 0.24 Ba15.13 ± 0.30 Ba
20–3011.00 ± 0.44 Ba13.64 ± 0.27 Ba
October
2020
Inter-plant0–1014.80 ± 0.30 Ab17.46 ± 0.35 Ab
10–2014.00 ± 0.28 Ab16.52 ± 0.50 Ab
20–3013.30 ± 0.27 Aa15.69 ± 0.31 Ab
Inter-row0–1016.80 ± 0.34 Aa20.16 ± 0.40 Aa
10–2016.20 ± 0.32 Aa19.44 ± 0.39 Aa
20–3013.90 ± 0.56 Aa16.68 ± 1.00 Aa
ANOVA results (p values)
Soil depth (D)<0.001 **<0.001 **
Sampling Point (P)<0.001 **<0.001 **
Sampling Time (T)<0.001 **<0.001 **
D × P0.119 ns0.139 ns
D × T<0.001 **<0.001 **
P × T<0.001 **0.001 **
D × P × T0.001 **0.008 **
Values in the table represent each sample plot (mean ± standard errors). SOC, soil organic carbon; SOC storage, soil organic carbon storage. Inter-plant, the sampling point is located between two banana plants within the same row. Inter-row, the sampling point is located between two adjacent rows of banana plants. Uppercase letters indicate significant differences for the same soil layer between different years (Intra-row or Inter-row) (p < 0.05). Lowercase letters indicate significant differences within the same soil layer and year between row and plant positions (p < 0.05). **, p < 0.01; ns, p > 0.05.
Table 5. Comparison of Ecosystem Carbon Balance between Two Banana Cultivars.
ParameterMA
(Musa paradisiaca AA)
MB
(M. AAA Cavendish var. Brazil)
Carbon emissions per unit of production2177.27 ± 415.63
g CO2 eq·kg−1
1940.98 ± 265.06
g CO2 eq·kg−1
Carbon emissions per unit area15,575.66 ± 2640.11
kg CO2 eq ha−1
21,411.60 ± 3437.15
kg CO2 eq ha−1
Carbon footprint4944.511 g CO2 eq·kg−13975.871 g CO2 eq·kg−1
Carbon Fixation37,092.82 kg CO2 eq30,451,982.50 kg CO2 eq
Net Carbon Fixation per Area15,197.96 kg CO2 eq·ha−121,652.88 kg CO2 eq·ha−1
Disclaimer/Publisher’s Note: The statements, opinions and data contained in all publications are solely those of the individual author(s) and contributor(s) and not of MDPI and/or the editor(s). MDPI and/or the editor(s) disclaim responsibility for any injury to people or property resulting from any ideas, methods, instructions or products referred to in the content.