Article

Interactive Effects of Planting Density and Row Spacing on Maize Root Distribution and Yield

1
College of Agronomy and Biotechnology, China Agricultural University, Beijing 100193, China
2
College of Resources and Environmental Sciences, National Academy of Agriculture Green Development, Key Laboratory of Plant-Soil Interactions, Ministry of Education, Key Laboratory of Low-Carbon Green Agriculture, Ministry of Agriculture and Rural Affairs, China Agricultural University, Beijing 100193, China
*
Author to whom correspondence should be addressed.
Agronomy 2025, 15(11), 2552; https://doi.org/10.3390/agronomy15112552
Submission received: 26 September 2025 / Revised: 28 October 2025 / Accepted: 31 October 2025 / Published: 3 November 2025

Abstract

Effective spatial arrangement in maize population can reduce inter-plant competition, promote root development, and enhance nutrient uptake. This study aimed to clarify how planting density and row spacing affect maize growth and yield. A four-year field experiment (2011–2014) was conducted using three planting densities (50,025, 67,500, and 100,050 plants ha−1) combined with two row spacings. Grain yield increased with higher planting density, whereas plant dry weight and nutrient (N, P, K) contents declined. Higher density restricted root growth both vertically and horizontally, particularly in the 0–10 cm soil layer and inner root zone. Narrower row spacing increased grain yield, plant dry weight, and shoot nutrient contents and improved vertical and inner-zone root growth while reducing growth in the outer root zone. At the highest density, these effects were most pronounced in fine roots (<2 mm diameter), with significant increases in root length and surface area in the 0–10 cm layer in both vertical and inner horizontal zones. Overall, higher density intensified root competition and inhibited root development, whereas narrower row spacing alleviated such competition, enhanced nutrient acquisition, and improved crop yield. These results highlight the central role of fine roots in mediating maize responses to planting density and row spacing, suggesting that a moderate planting density (~67,500 plants ha−1) combined with narrower row spacing is optimal for balancing root development and yield.

1. Introduction

In recent decades, maize (Zea mays L.) yields have steadily increased, with 40–50% of the improvement attributed to advances in field management practices [1]. Planting density has been recognized as a key component of these practices, contributing 8.5–17.0% to yield gains [2]. However, yield responses to increasing density are often non-linear: grain yield rises initially but declines beyond an optimal threshold [3]. Thus, identifying suitable planting density levels and complementary agronomic measures has become a central focus in efforts to further improve maize productivity. Various planting patterns have been developed to achieve this goal, including narrow row spacing [4] and wide row spacing [5]. While the effects of row spacing on canopy architecture and light interception have been extensively studied, much less is known about how density and row spacing interact to influence below-ground traits, particularly root system architecture and nutrient acquisition.
Root morphology and spatial distribution are key indicators of root development [6,7,8]. Maize has an outwardly radiating root system. Vertically, most roots are concentrated in the upper 0–10 cm of soil and gradually decline with depth [9]. Horizontally, root density decreases with distance from the stem and follows an S-shaped distribution [10]. Nutrient uptake and transport are fundamental functions of the root system. Each of roots creates an absorption zone, and when these zones overlap, nutrient depletion occurs, thereby reducing uptake efficiency [11]. As a result, nutrient competition intensifies in regions of high root densities. However, due to the structural and functional complexity of the maize root system, nutrient acquisition cannot be explained solely by root overlap, as uptake capacity varies across both vertical and horizontal root segments. To better understand these spatial patterns, Wang et al. [12] conducted root-break experiments, which demonstrated that the upper root system and roots near the stem contribute most significantly to plant nutrient uptake. Thus, the 0–10 cm soil layer and the stem-adjacent horizontal zone represent regions where root competition and nutrient acquisition are most intense. Increasing planting density exerts the strongest influence on root development in these regions [13]. Therefore, identifying strategies to mitigate root competition in these zones is essential for improving crop yield under high-density planting conditions. In addition to influencing intra-specific root competition, planting density and row spacing may also affect crop–weed interactions by changing canopy structure and light interception.
Narrow-row planting has been widely adopted to enhance maize yield [4]. At a given planting density, reducing row spacing can mitigate inter- and intra-plant competition, particularly under high-density conditions [14]. While most previous studies have emphasized canopy-level processes—narrower rows improve light interception and radiation use efficiency [15]—evidence also indicates that narrow row spacing promotes root development. By approaching a near-square planting geometry, reduced row spacing facilitates a more uniform root distribution, which aligns with the radial growth pattern of maize roots [16,17]. Both theoretical and experimental studies further suggest that narrower row spacing reduces the formation of nutrient depletion zones, thereby alleviating root competition [11]. Spatial responses of the root system, however, varies by soil depth and orientation: the effect is most pronounced in the topsoil and diminishes with depth [16], whereas its effects on horizontal root distribution remain poorly understood. Moreover, roots of different diameters serve distinct functional roles. Fine roots (<2 mm) are central to root system architecture [18] and account for most water and nutrient uptake [19]. Yet, how fine-root development is influenced by the interaction of planting density and row spacing, and how variations in root diameter classes affect nutrient acquisition, remain understudied.
Therefore, the objectives of this study were: (I) to examine vertical and horizontal root responses to plant density and row spacing, (II) to characterize how roots of different diameters respond in vertical and horizontal directions under varying plant densities and row spacings, and (III) to assess the effects of these root responses on nutrient uptake. The outcomes of this study will provide valuable insights for achieving high-yield maize cultivation and offer a solid theoretical basis for understanding root distribution and nutrient acquisition. We hypothesized that increasing planting density would intensify inter-plant root competition and restrict root growth, while reducing row spacing could alleviate this limitation by improving root spatial distribution and nutrient uptake, thereby maintaining or enhancing maize yield.

2. Materials and Methods

2.1. Experimental Site

The field experiment was conducted at the Shangzhuang Experimental Station of China Agricultural University, Beijing, China (40°8′20′′ N, 116°10′47′′ E). During the 2011–2014 growing seasons, mean air temperatures were 25.1 °C, 24.9 °C, 24.8 °C, and 25.1 °C, with corresponding precipitation amounts of 588, 567, 533, and 401 mm, respectively (Detailed meteorological information is shown in Table 1). The soil at the experimental site is classified as sandy loam, with organic matter, total nitrogen, available phosphorus, and available potassium contents of 11.15 g kg−1, 0.91 g kg−1, 38.68 mg kg−1, and 100.02 mg kg−1, respectively, in the 0–20 cm soil layer.

2.2. Field Experimental Design

The experiment was conducted using the maize variety Zhengdan958, a widely cultivated hybrid in China known for its high yield potential and adaptability across different planting densities and row spacing configurations. Three planting densities of 50,025 plants ha−1, 67,500 plants ha−1 and 100,050 plants ha−1 were established. At each density, two row spacing × plant spacing configurations were applied, resulting in a total of six treatments. The specific plant configuration treatments were as follows: 80 cm by 25 cm and 60 cm by 33.3 cm at D50025; 60 cm by 25 cm and 40 cm by 37 cm at D67500; and 60 cm by 16.7 cm and 40 cm by 25 cm at D100050. Maize was sown manually to maintain consistent row spacing and plant density across all plots. Each plot covered an area of 84 m2, and all treatments were arranged in a randomized complete block design with three replicates.
In 2011 and 2012, fertilizers were applied as follows: N 180 kg ha−1, P2O5 90 kg ha−1, K2O 90 kg ha−1. In 2013 and 2014, N, P2O5 and K2O were applied at 180 kg ha−1, 90 kg ha−1 and 120 kg ha−1, respectively. For N fertilization, 120 kg ha−1 was applied at the 12-leaf stage, with the remainder applied at sowing.
Standard local plant protection practices were followed, including routine pest and disease monitoring and conventional chemical or mechanical control measures when necessary. No experimental or unusual treatments were applied that could have influenced the results.

2.3. Sampling and Measurement

From 2011 to 2013, two representative plants per plot were selected at the tasseling stage for sampling. Plants were cut at the stem base, and above-ground organs (stems, leaves, ears) were separated, fixed at 105 °C for 30 min, and then oven-dried at 80 °C to a constant weight. Dry weights were recorded, and samples were ground into powder. The powdered samples were digested using H2SO4-H2O2 for nutrient analysis. Nitrogen, phosphorus, and potassium contents were determined using the modified Kjeldahl method [20], automated colorimetry [21], and flame photometry, respectively. Due to extreme weather in 2012 that caused incomplete sampling, nutrient analysis was discontinued that year, while the field experiment continued as planned. Therefore, only data from 2011 and 2013 are presented for nutrient measurements. After removal of shoots, the vertical distribution of roots was analyzed by excavating soil layers at the center of the plant within the row spacing by plant spacing range. Soil was sampled every 10 cm to a depth of 60 cm. For horizontal root distribution, the soil was excavated with the center of the plant as a reference. The inner layer was defined as within one-quarter of the row or plant spacing, and the outer layer as one-quarter to one-half of the row or plant spacing. All root samples were washed and scanned using a root scanner (EPSON Perfection V700 Photo, Seiko Epson Corporation, Suwa City, Japan). Images were analyzed with WinRhizo Pro Vision 2009c software (Regent Instruments Inc., Québec, QC, Canada) to determine root diameter, length, and surface area. Roots were classified into three diameter categories: 0–2 mm, 2–4 mm, and greater than 4 mm. Root measurements across the two horizontal distances were summed to analyze vertical distribution, and roots from different soil layers at the same horizontal distance were summed to analyze horizontal distribution under different treatments.
From 2011 to 2014, a sampling area measuring 4 rows by 5 m was selected in each plot for yield determination. Twenty ears per plot were sampled to measure yield components, including kernel row number (KR), kernels per row (KPR), and kernels per square meter (KSQ), with grain moisture content standardized to 14%.

2.4. Statistical Analysis

Data from all years were combined for comprehensive statistical analysis. After confirming the homogeneity of variances, one-way analysis of variance (ANOVA) was performed using SPSS 26.0 (SPSS Inc., Chicago, IL, USA). Significant differences among treatments were evaluated using Duncan’s multiple range test at the 0.05 probability level. Graphs were generated using OriginPro 2021.

3. Results

3.1. Yield and Shoot Dry Weight

Compared with D50025, planting densities of D100050 and D67500 increased grain yield by 16.2% and 11.6%, respectively. Reducing row spacing led to higher grain yield across all planting densities, with the largest increase (16.5%) observed at D100050 (Figure 1A). Shoot dry weight decreased with increasing planting density, while narrower row spacing appeared to mitigate this reduction, resulting in increases of 3.4%, 2.2%, and 13.2% at D50025, D67500, and D100050, respectively. Overall, shoot dry weight showed an upward trend at the highest density (D100050) under reduced row spacing (Figure 1B).

3.2. Shoot Nutrient Content (N, P, K) of a Single Maize Plant

Shoot nutrient contents (N, P, K) per plant decreased with increasing planting density. Compared with D67500 and D50025, the highest density (D100050) showed 19.2–39.2% and 53.1–57.6% lower shoot N, P, and K contents, respectively. Reducing row spacing increased N, P, and K contents at all planting densities. Specifically, N content increased by 3.9%, 6.8%, and 9.1% at D50025, D67500, and D100050; P content increased by 3.3%, 2.8%, and 6.8%; and K content increased by 6.2%, 1.3%, and 26.7%, respectively (Table 2). These results indicate that reducing row spacing, particularly at high planting densities, enhances nutrient uptake by the maize root system.

3.3. Vertical and Horizontal Root Distribution

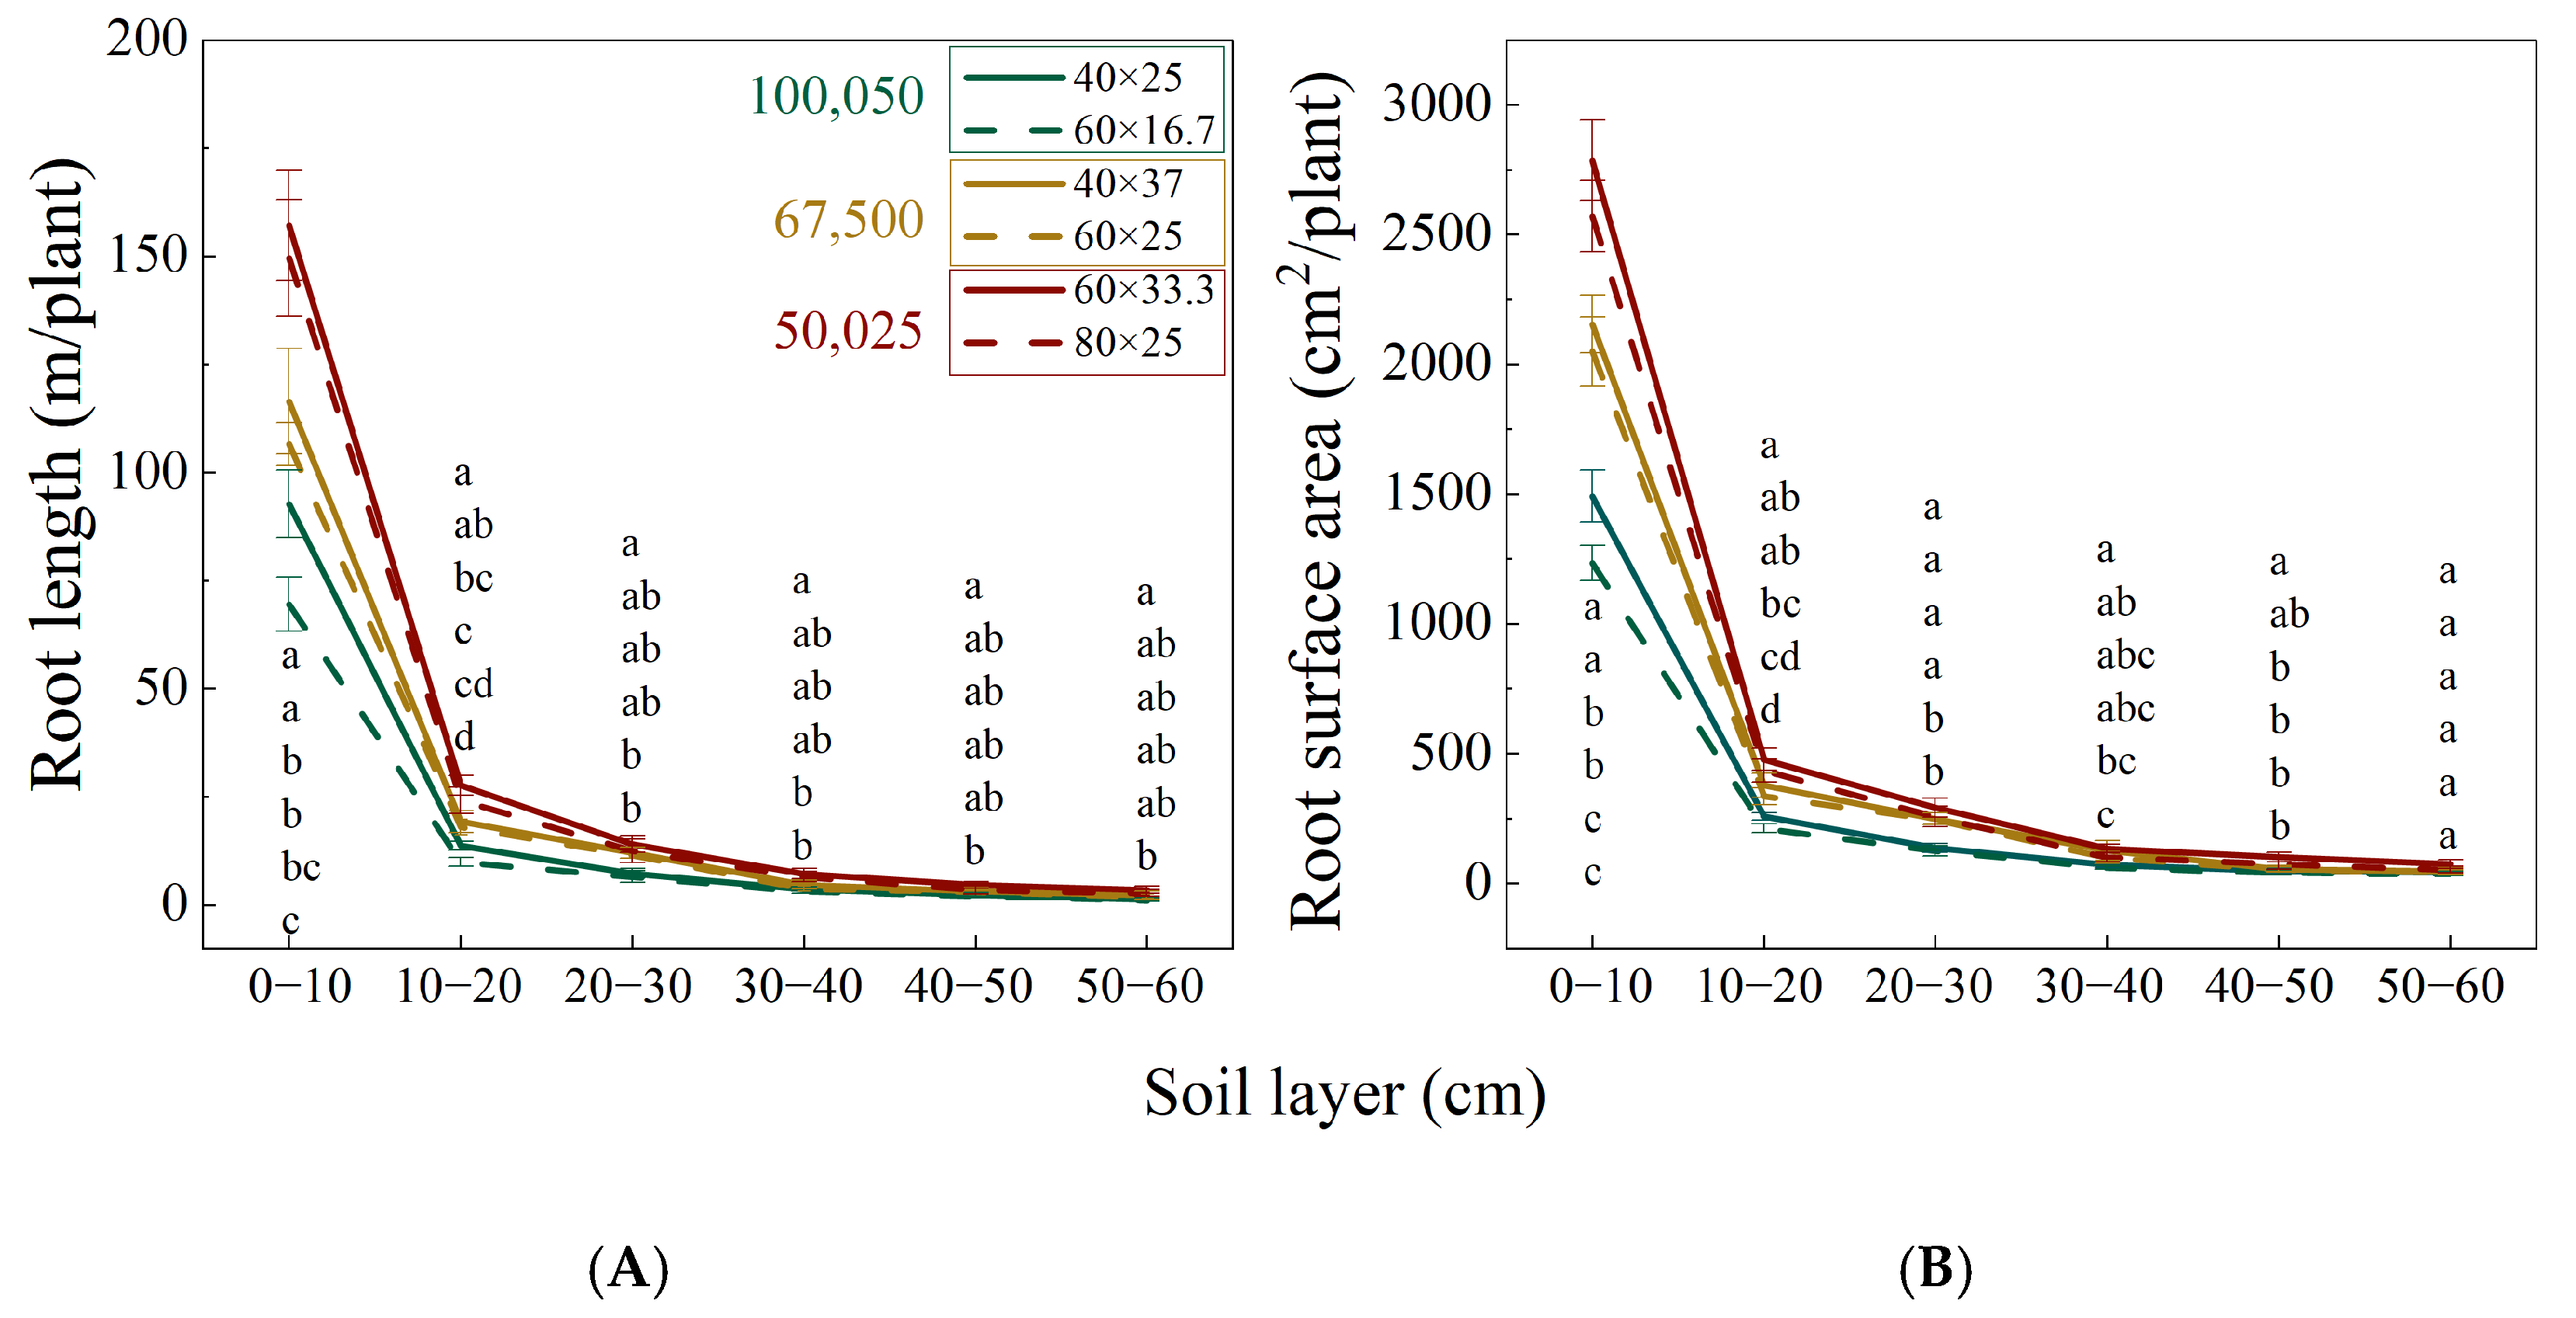
Maize roots were mainly concentrated in the 0–10 cm soil layer, with root length and surface area gradually decreasing with depth. Across all soil layers, both root length and surface area tended to decrease with increasing planting density, and significant differences were observed mainly in the 0–10 cm layer. Reducing row spacing generally increased root length and surface area in the 0–10 cm layer across all planting densities. At the highest planting density (D100050), these parameters increased by 33.4% and 20.8%, respectively, under narrower row spacing. Below 10 cm, the effect of row spacing was limited (Figure 2).
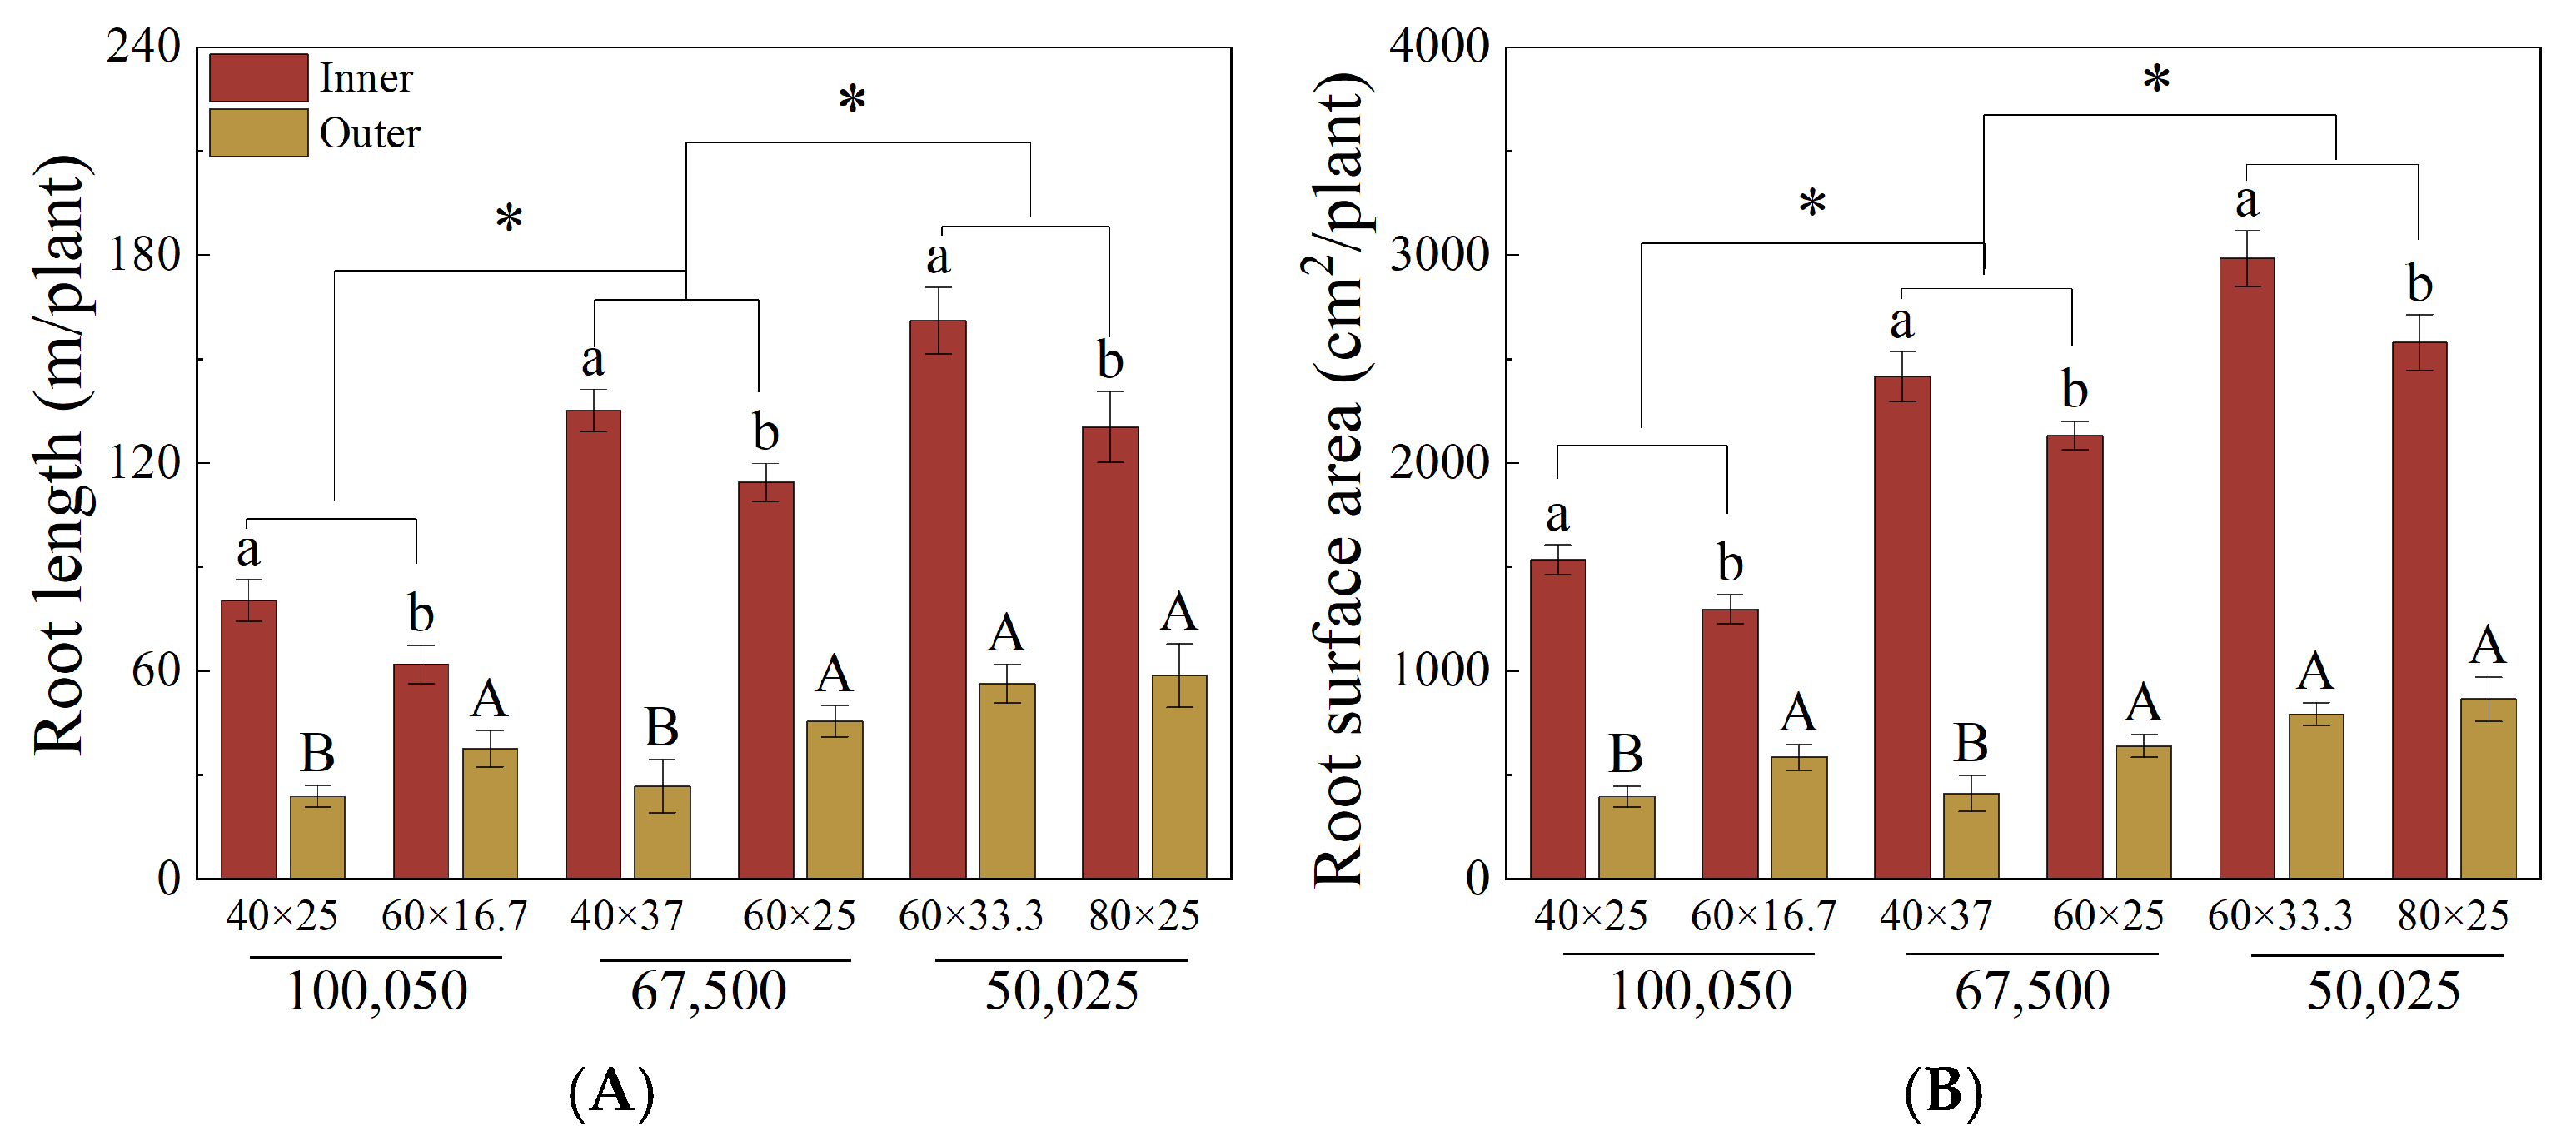
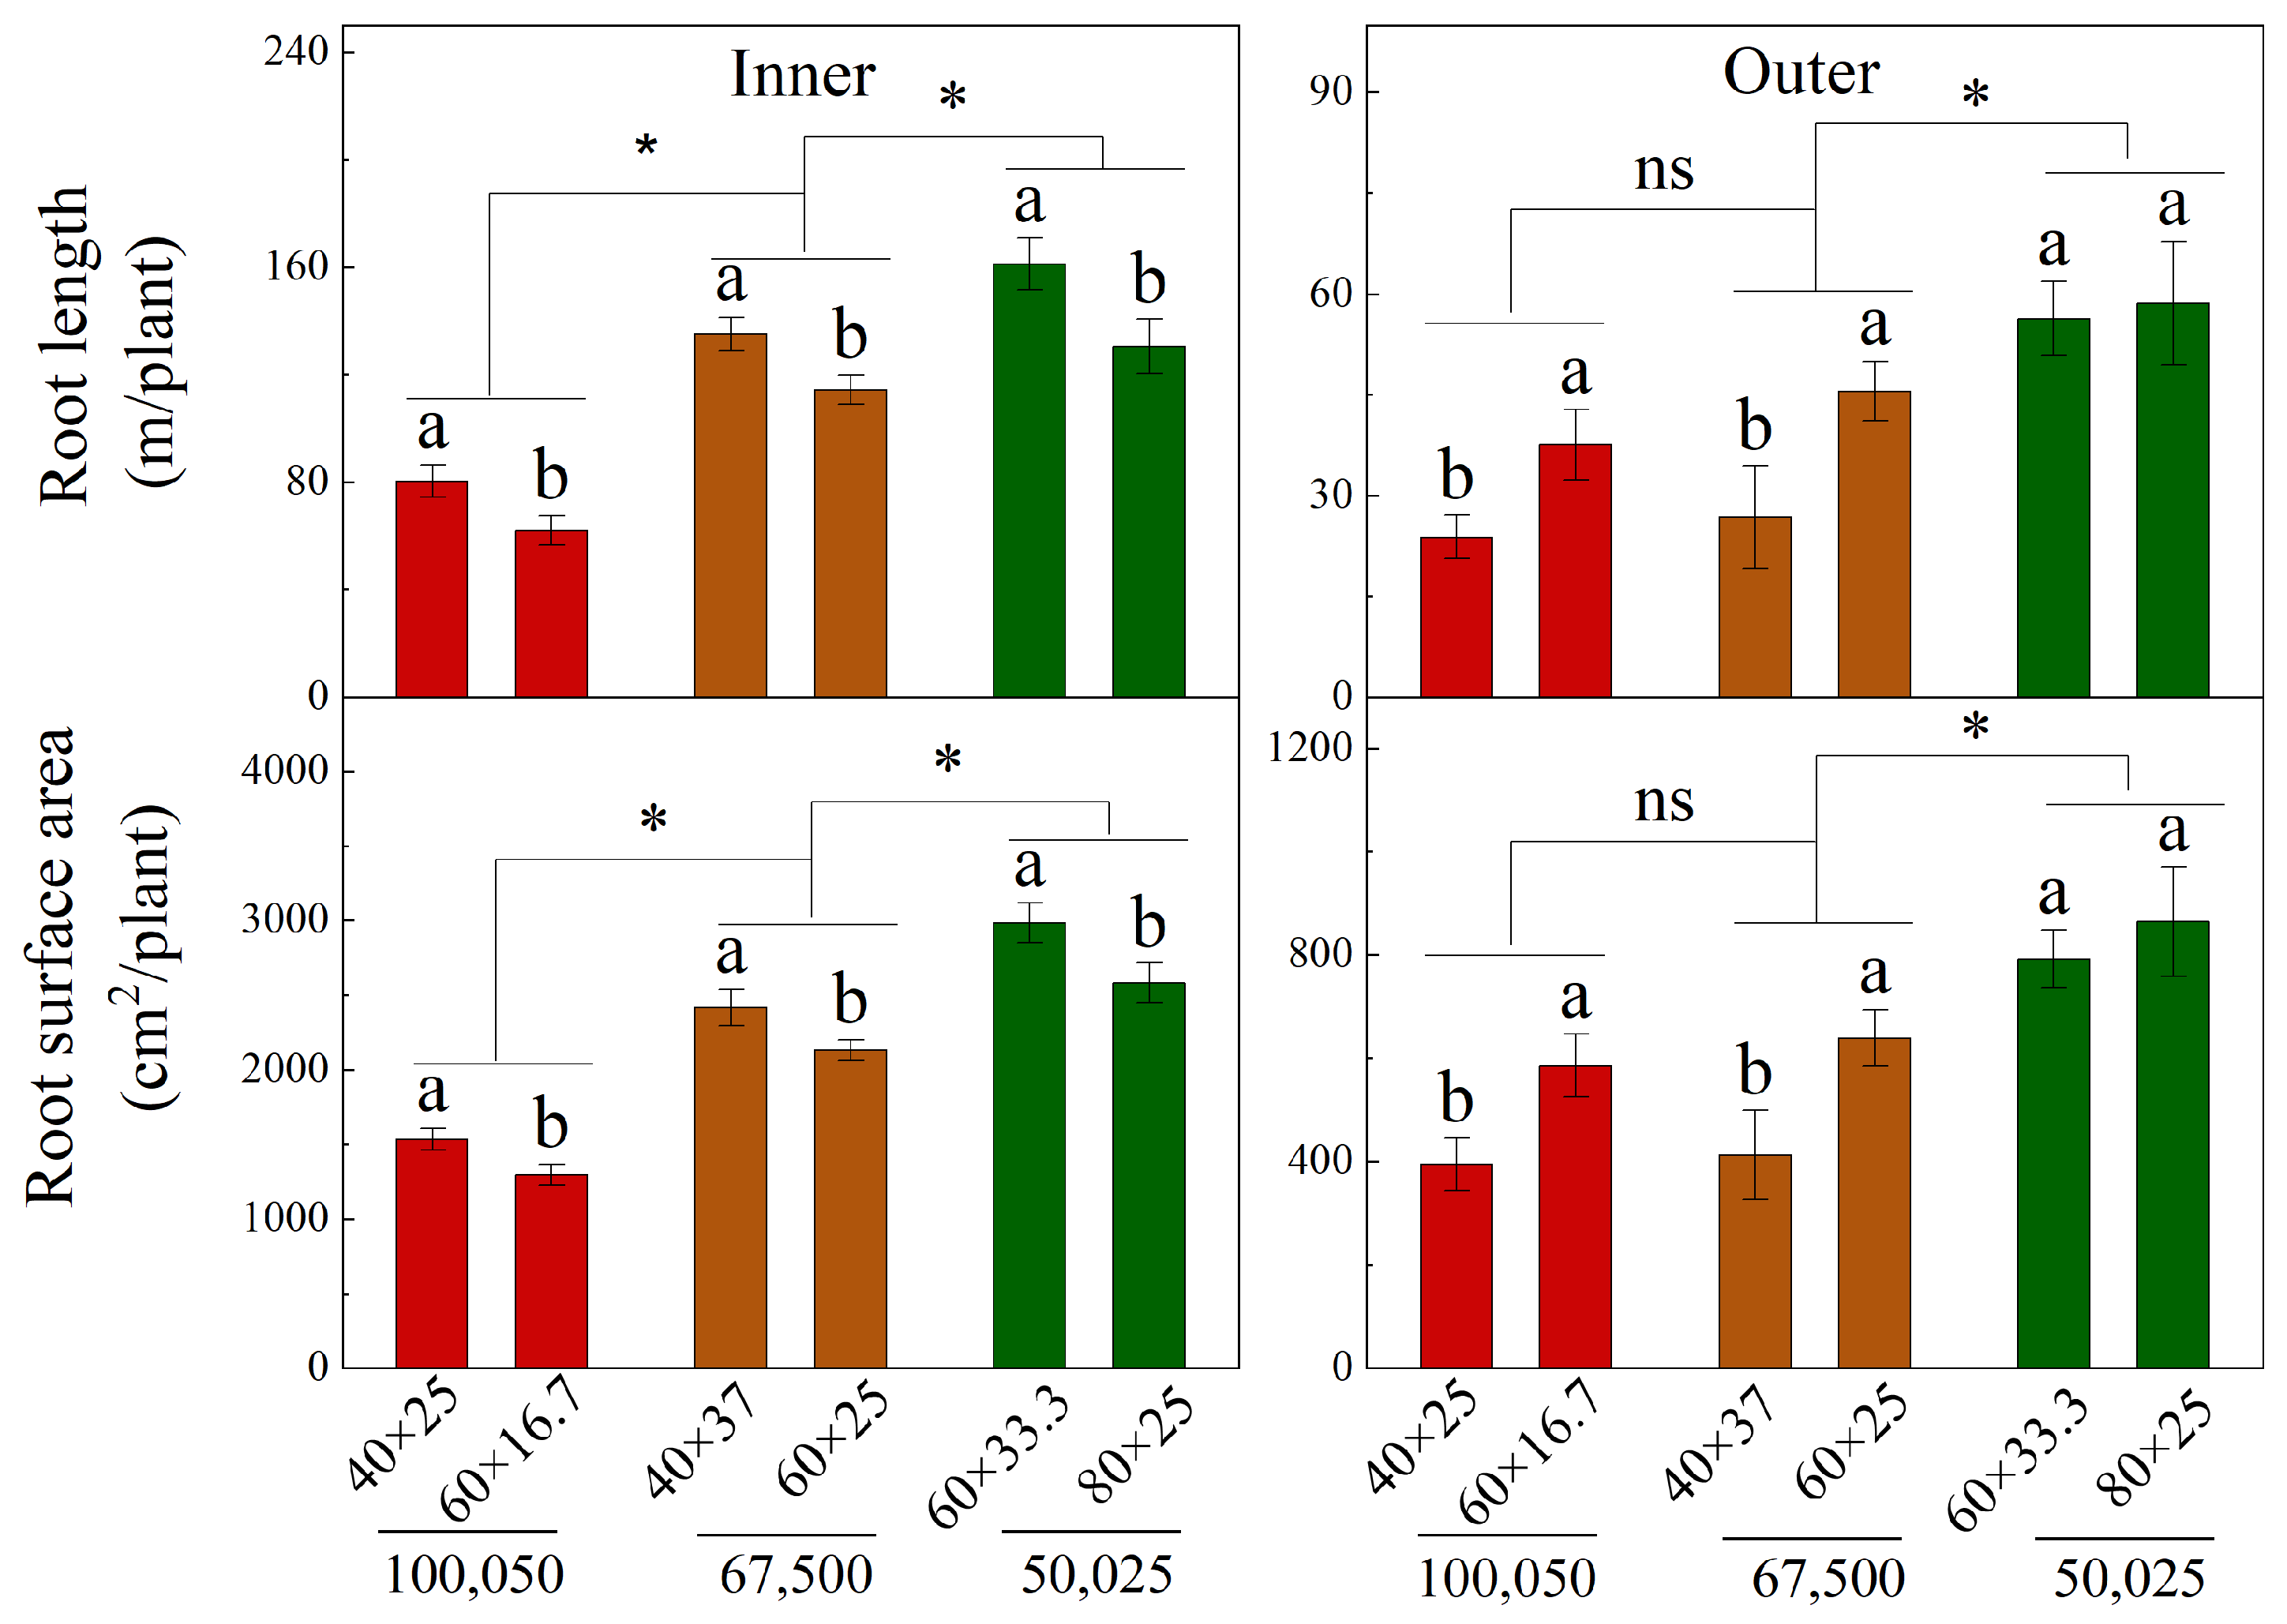
The horizontal distribution of roots showed similar trends across different planting densities and row spacings. Root length and surface area tended to be greater in the inner layer and smaller in the outer layer. Across all row spacings, both inner and outer root parameters generally decreased with increasing planting density. Reducing row spacing influenced both layers: inner root length and surface area increased significantly by 23.5%, 18.1%, and 29.9% at D50025, D67500, and D100050, respectively. In contrast, outer root length and surface area decreased by 41.2% and 36.6% at D67500 and D100050, respectively, whereas row spacing had little effect on outer root parameters at D50025 (Figure 3 and Figure 4).

3.4. Vertical and Horizontal Root Distribution of Different Diameters

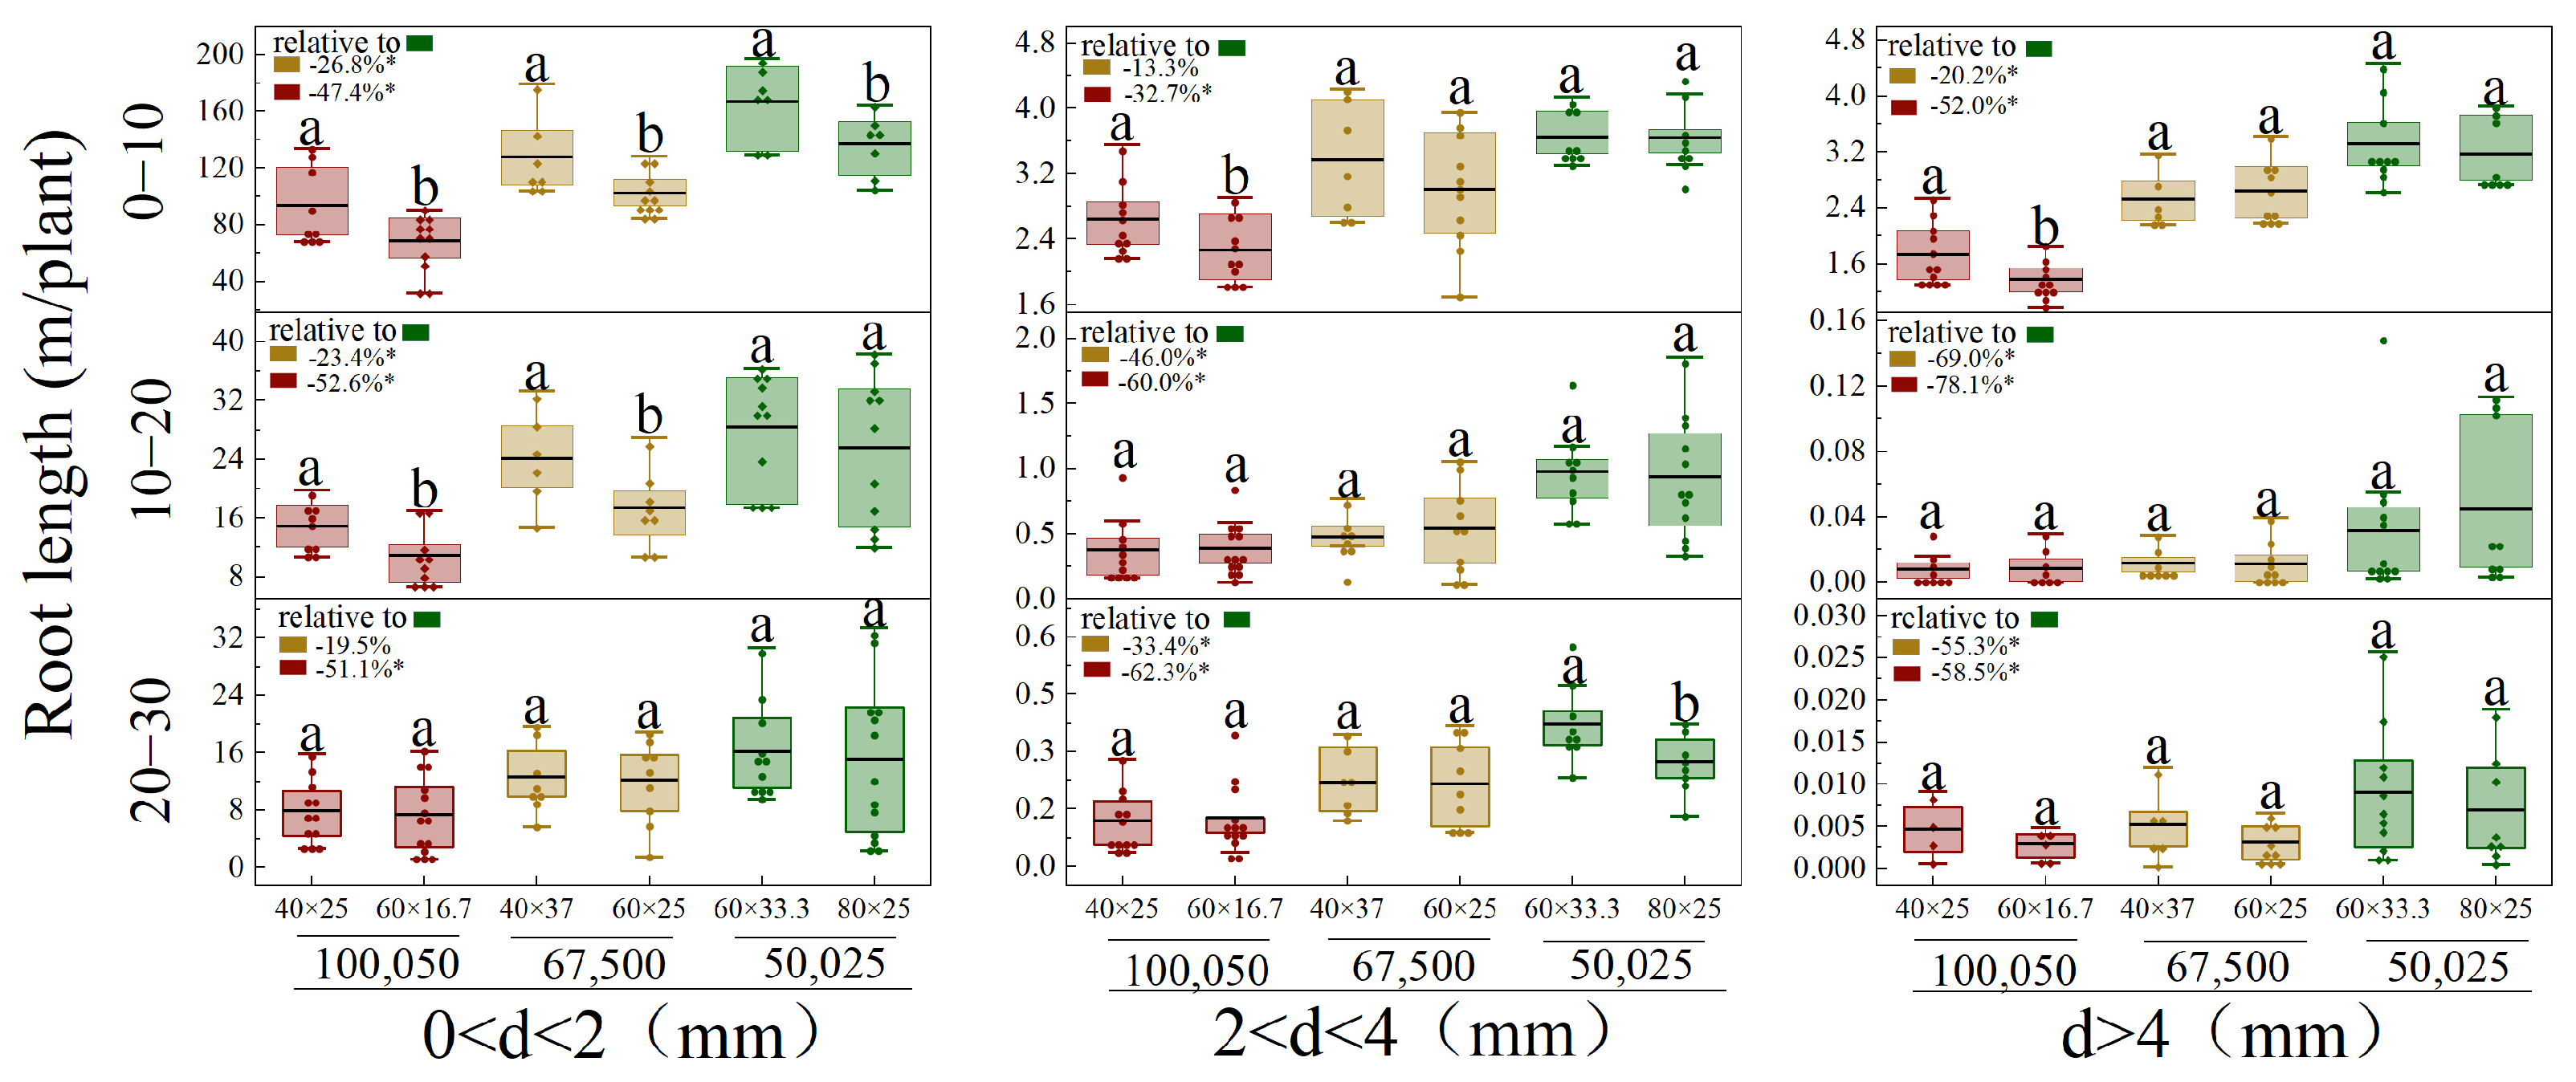
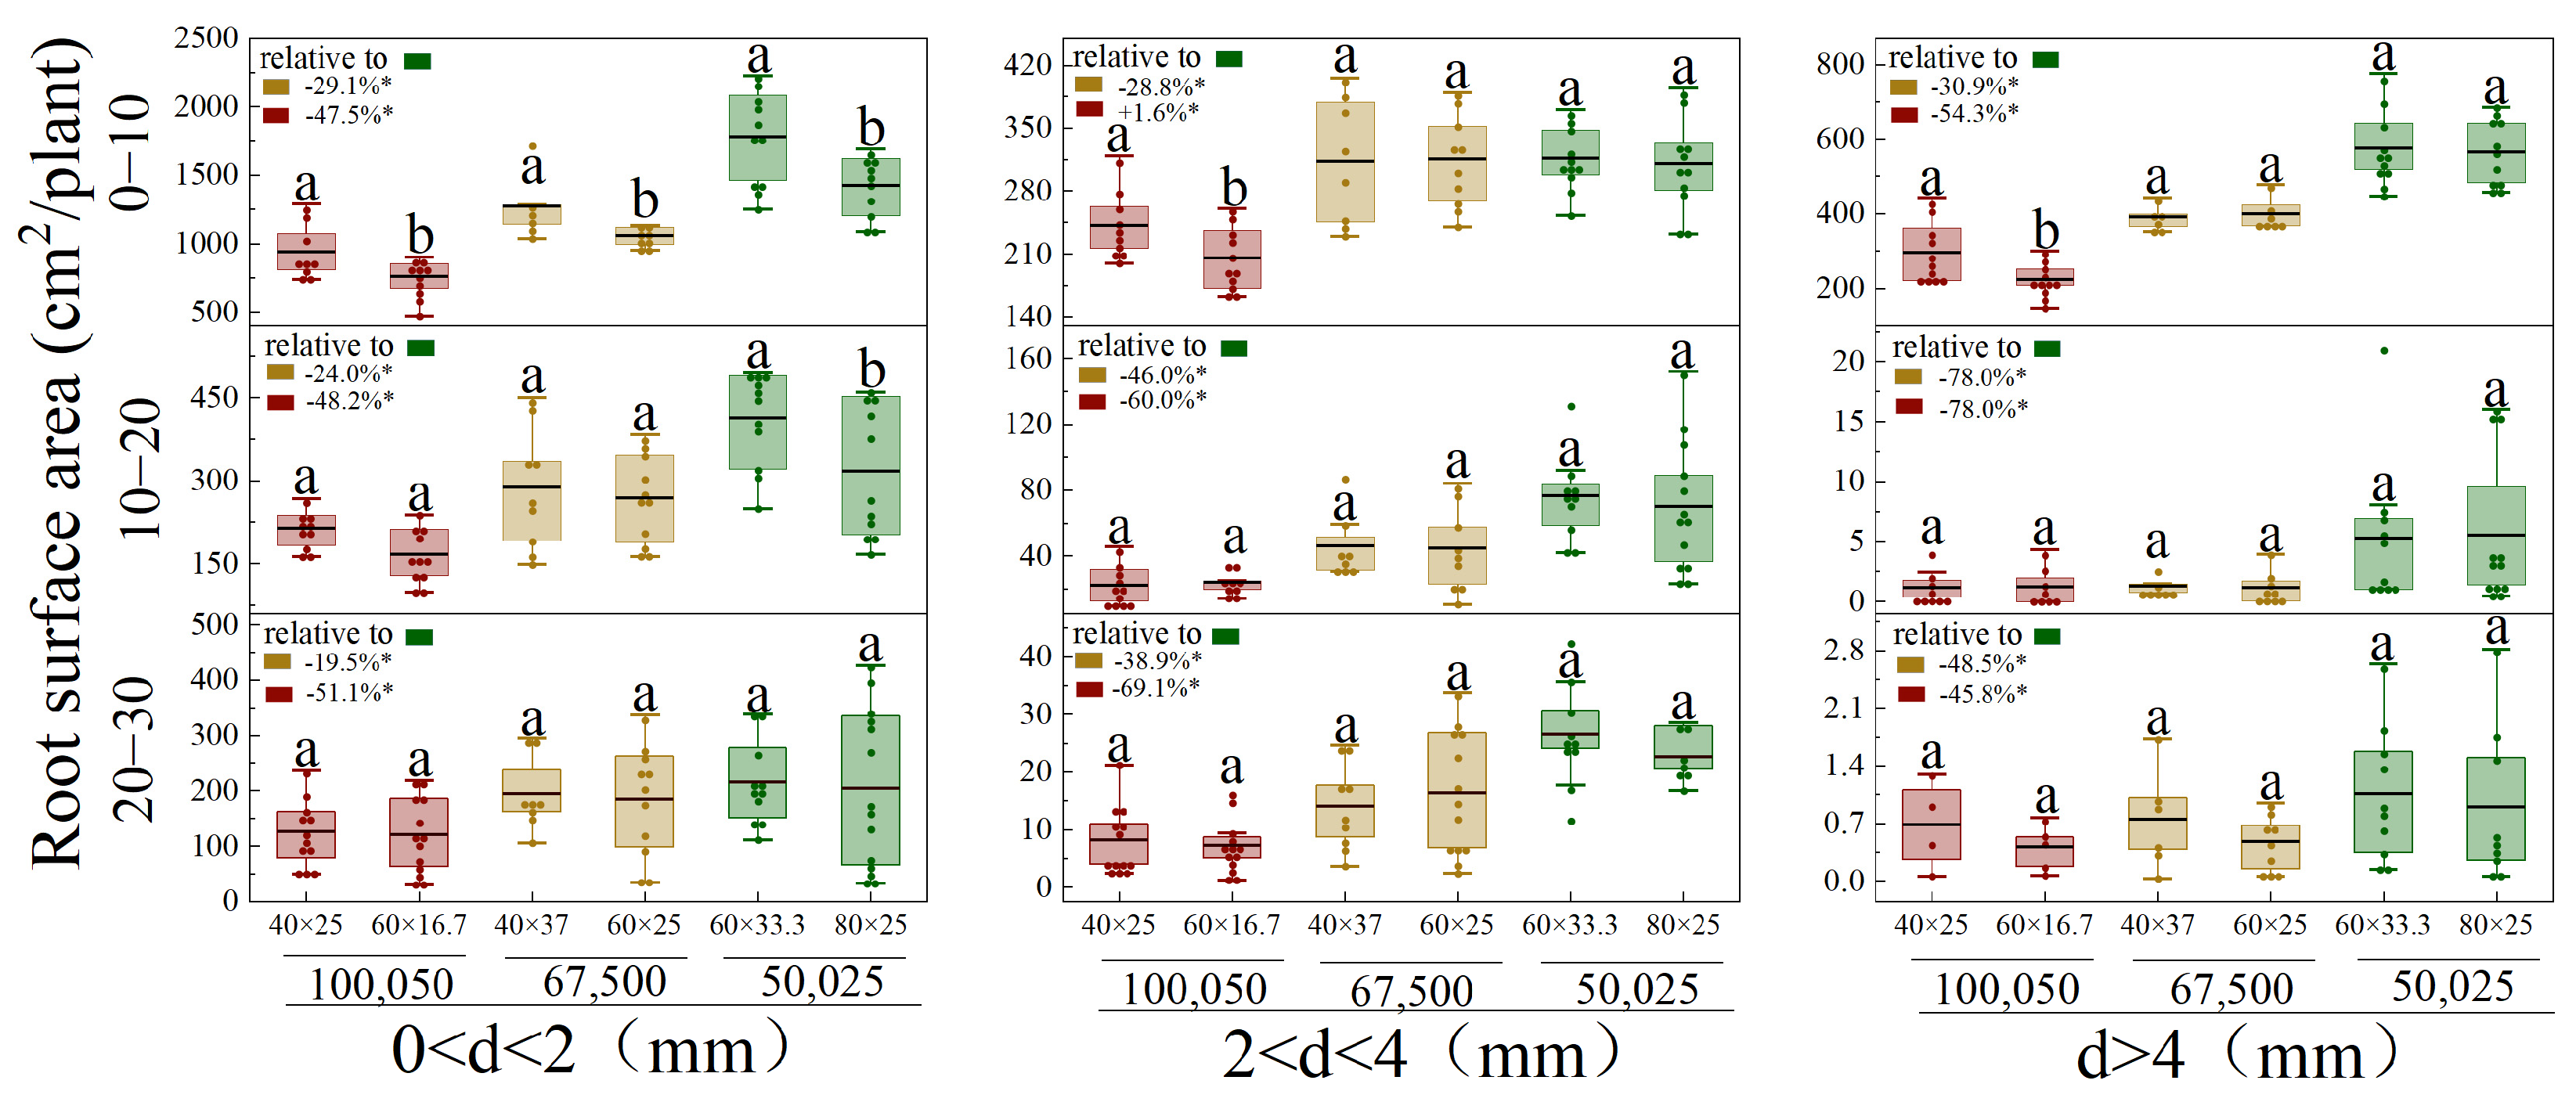
Classification of the root system into three diameter classes (Figure 5, Figure 6, Figure 7 and Figure 8) indicated that finer roots generally contributed more to total root length and surface area. Roots larger than 4 mm in diameter were primarily confined to the 0–30 cm soil layer. Overall, the length and surface area of roots in all diameter classes decreased with increasing planting density. Roots larger than 4 mm were more strongly affected by planting density than 0–2 mm roots (Figure 5 and Figure 6). Narrower row spacing was generally associated with increased root length and surface area across most diameter classes and soil layers at each planting density. For example, at D100050 in the 0–10 cm layer, reduced row spacing corresponded with increases of 36.4% and 28.3% for 0–2 mm roots, 16.2% and 17.6% for 2–4 mm roots, and 26.1% and 31.5% for roots larger than 4 mm. In addition, modest improvements for 0–2 mm roots were also observed in the 10–20 cm layer.
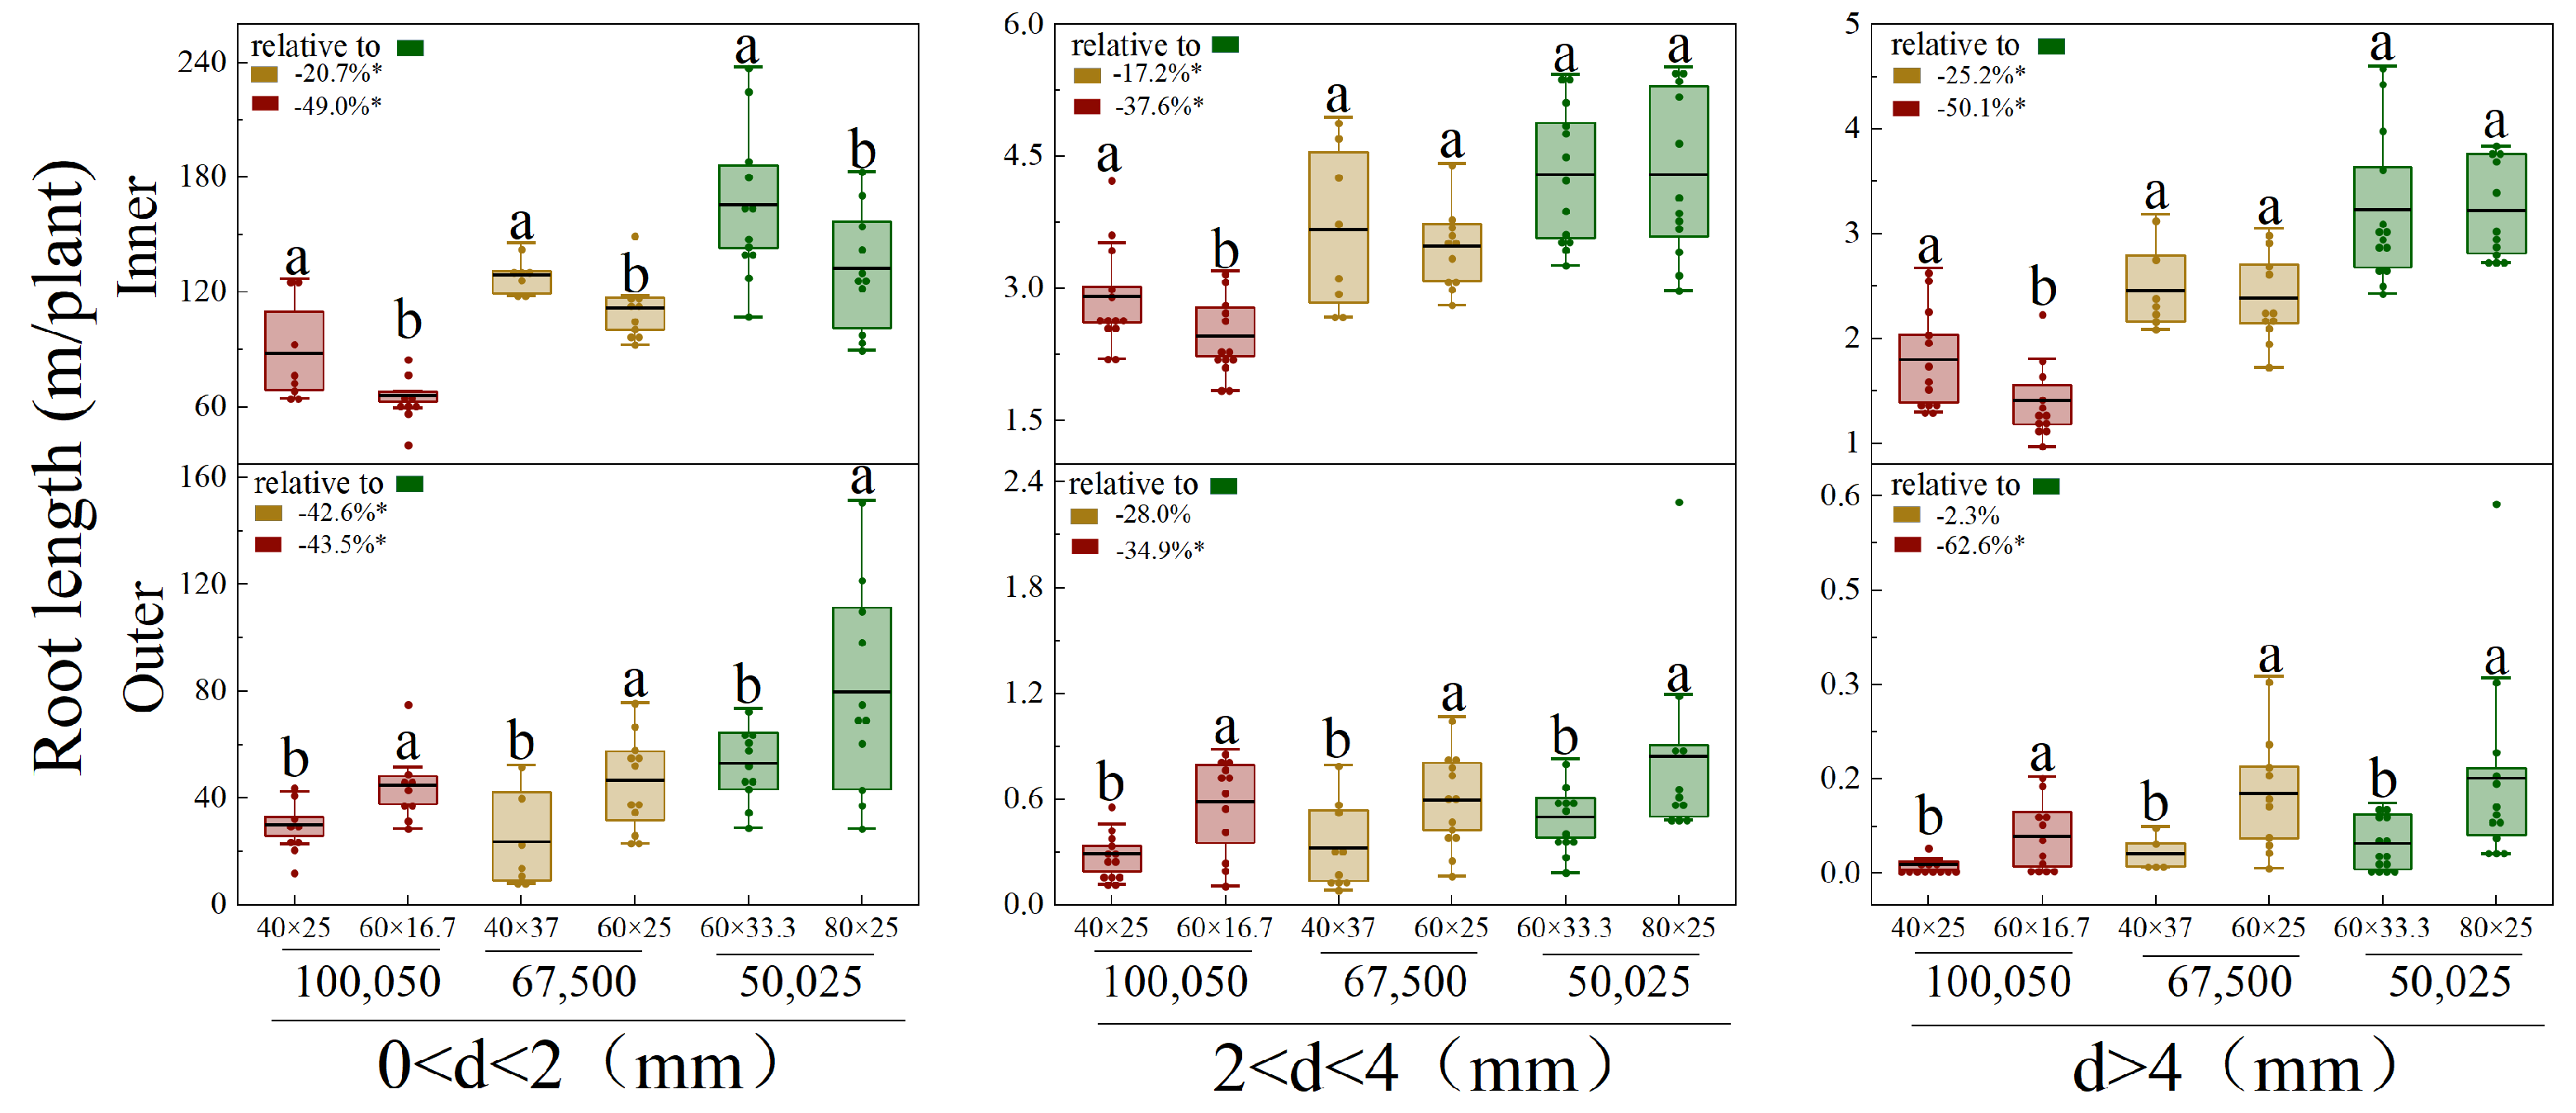
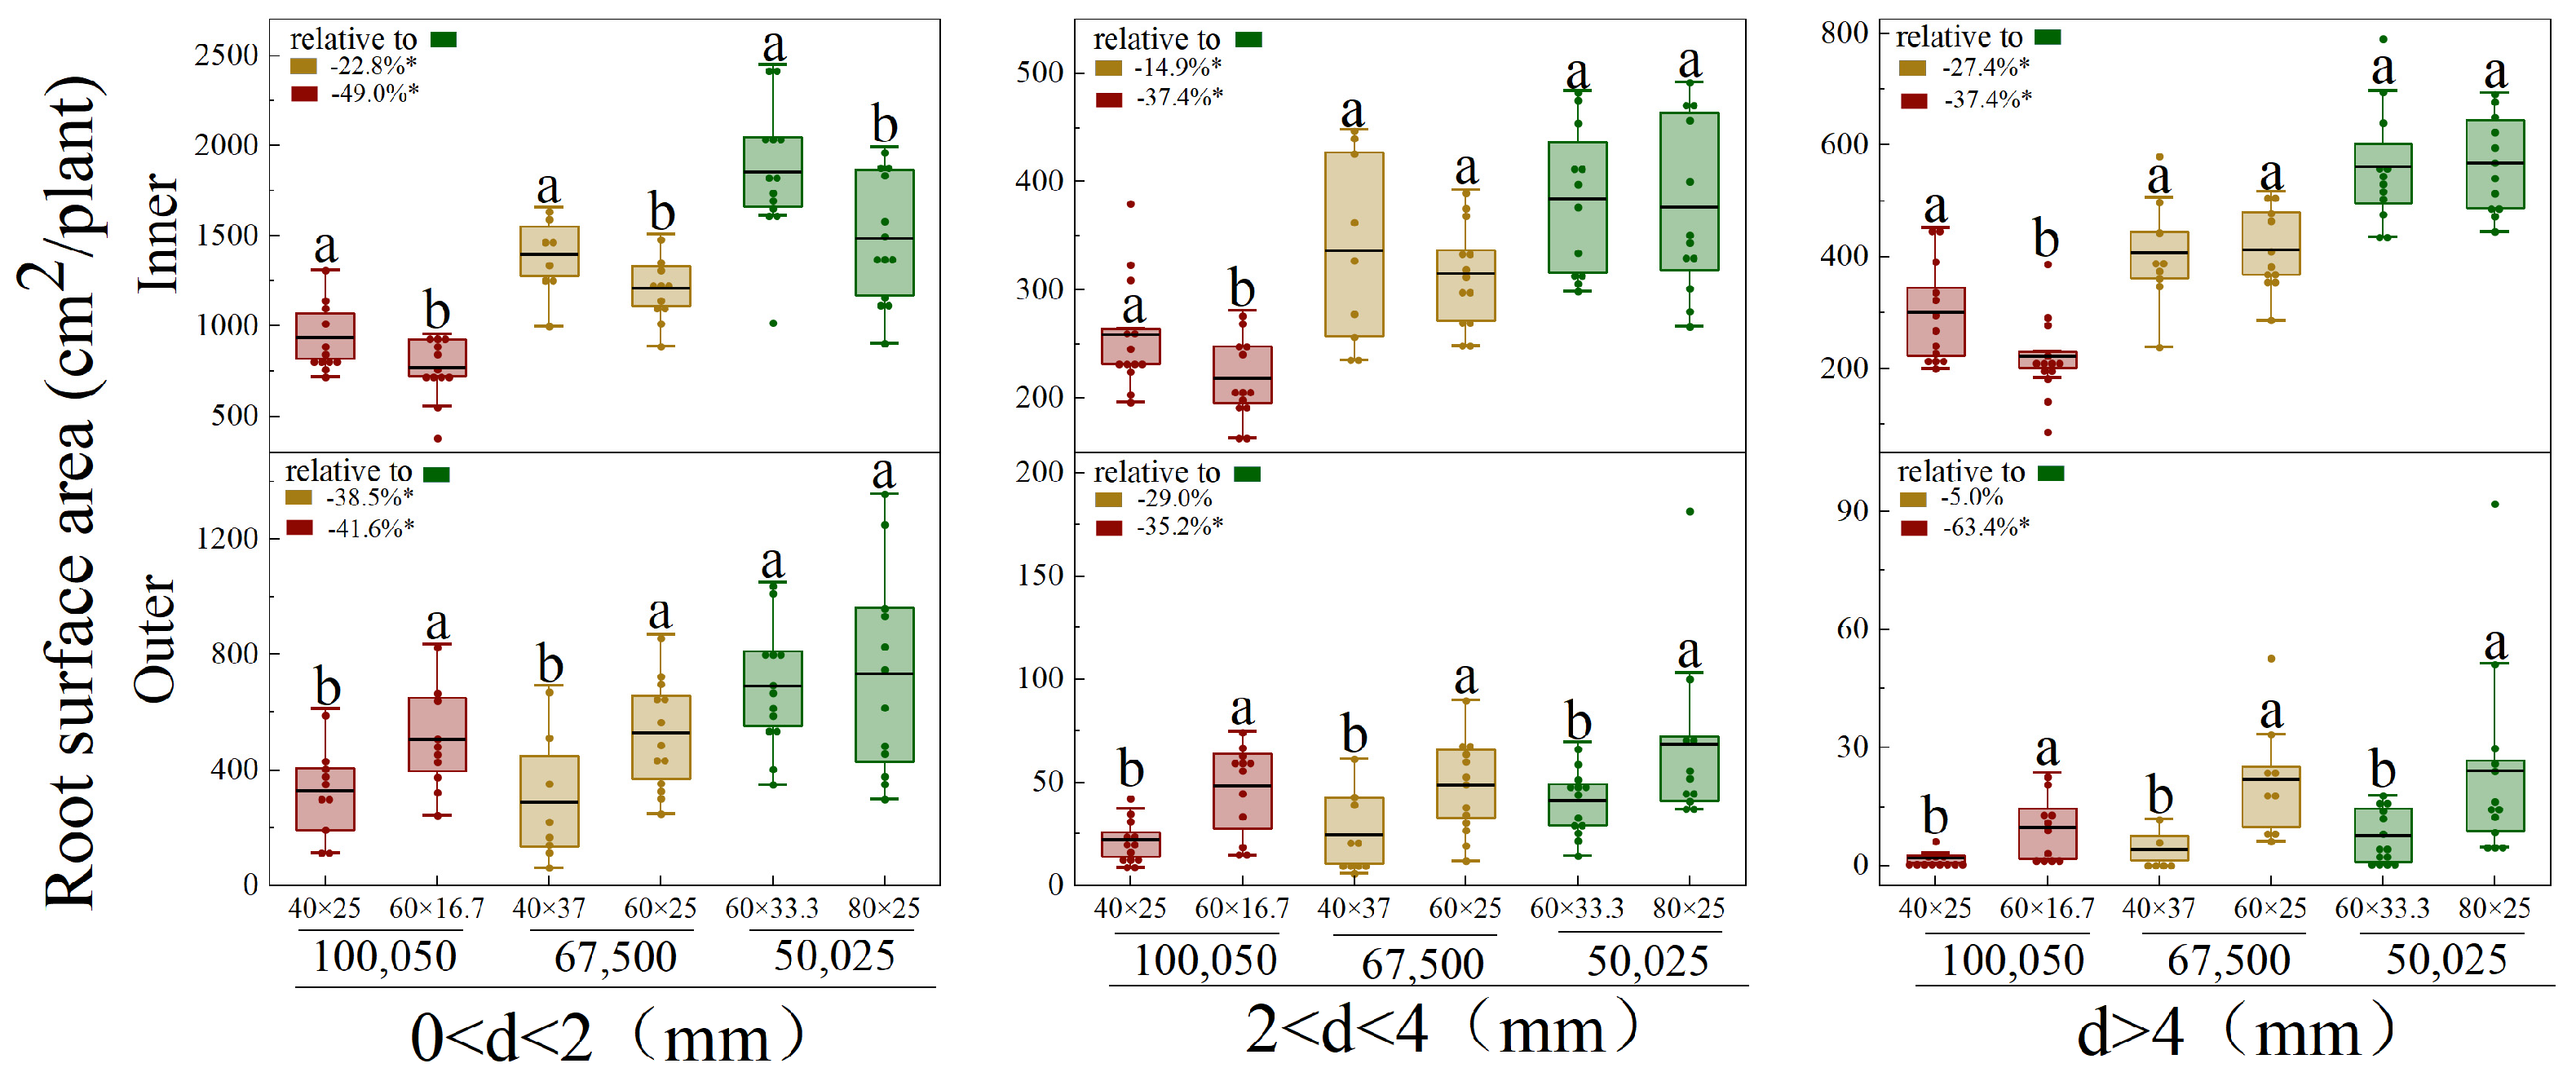
With increasing density, both inner and outer root parameters generally declined. For inner roots, the effect of density on root length and surface area followed the order: 2–4 mm < 0–2 mm < roots larger than 4 mm, indicating that larger roots were more sensitive to density. For outer roots, density significantly affected only 0–2 mm roots at D67500 compared with D100050. A similar pattern was observed for 2–4 mm roots, which were more strongly affected by density than 0–2 mm roots. Roots larger than 4 mm exhibited minor reductions at D67500 compared with D50025, but were reduced at D100050. Reducing row spacing generally increased inner root length and surface area at all planting densities across all diameter classes (Figure 7 and Figure 8). In contrast, outer root length and surface area generally decreased. At D100050, row spacing reduction increased inner root length and surface area by 33.4% and 21.2% for 0–2 mm roots, 18.5% and 18.4% for 2–4 mm roots, and 27.8% and 35.4% for roots larger than 4 mm. Row spacing also affected 0–2 mm roots at D50025 and D67500. Among outer roots, all parameters decreased significantly with reduced row spacing, except surface area at D50025.

3.5. Root Length Correlation with Shoot Nutrient Content (N, P, K)

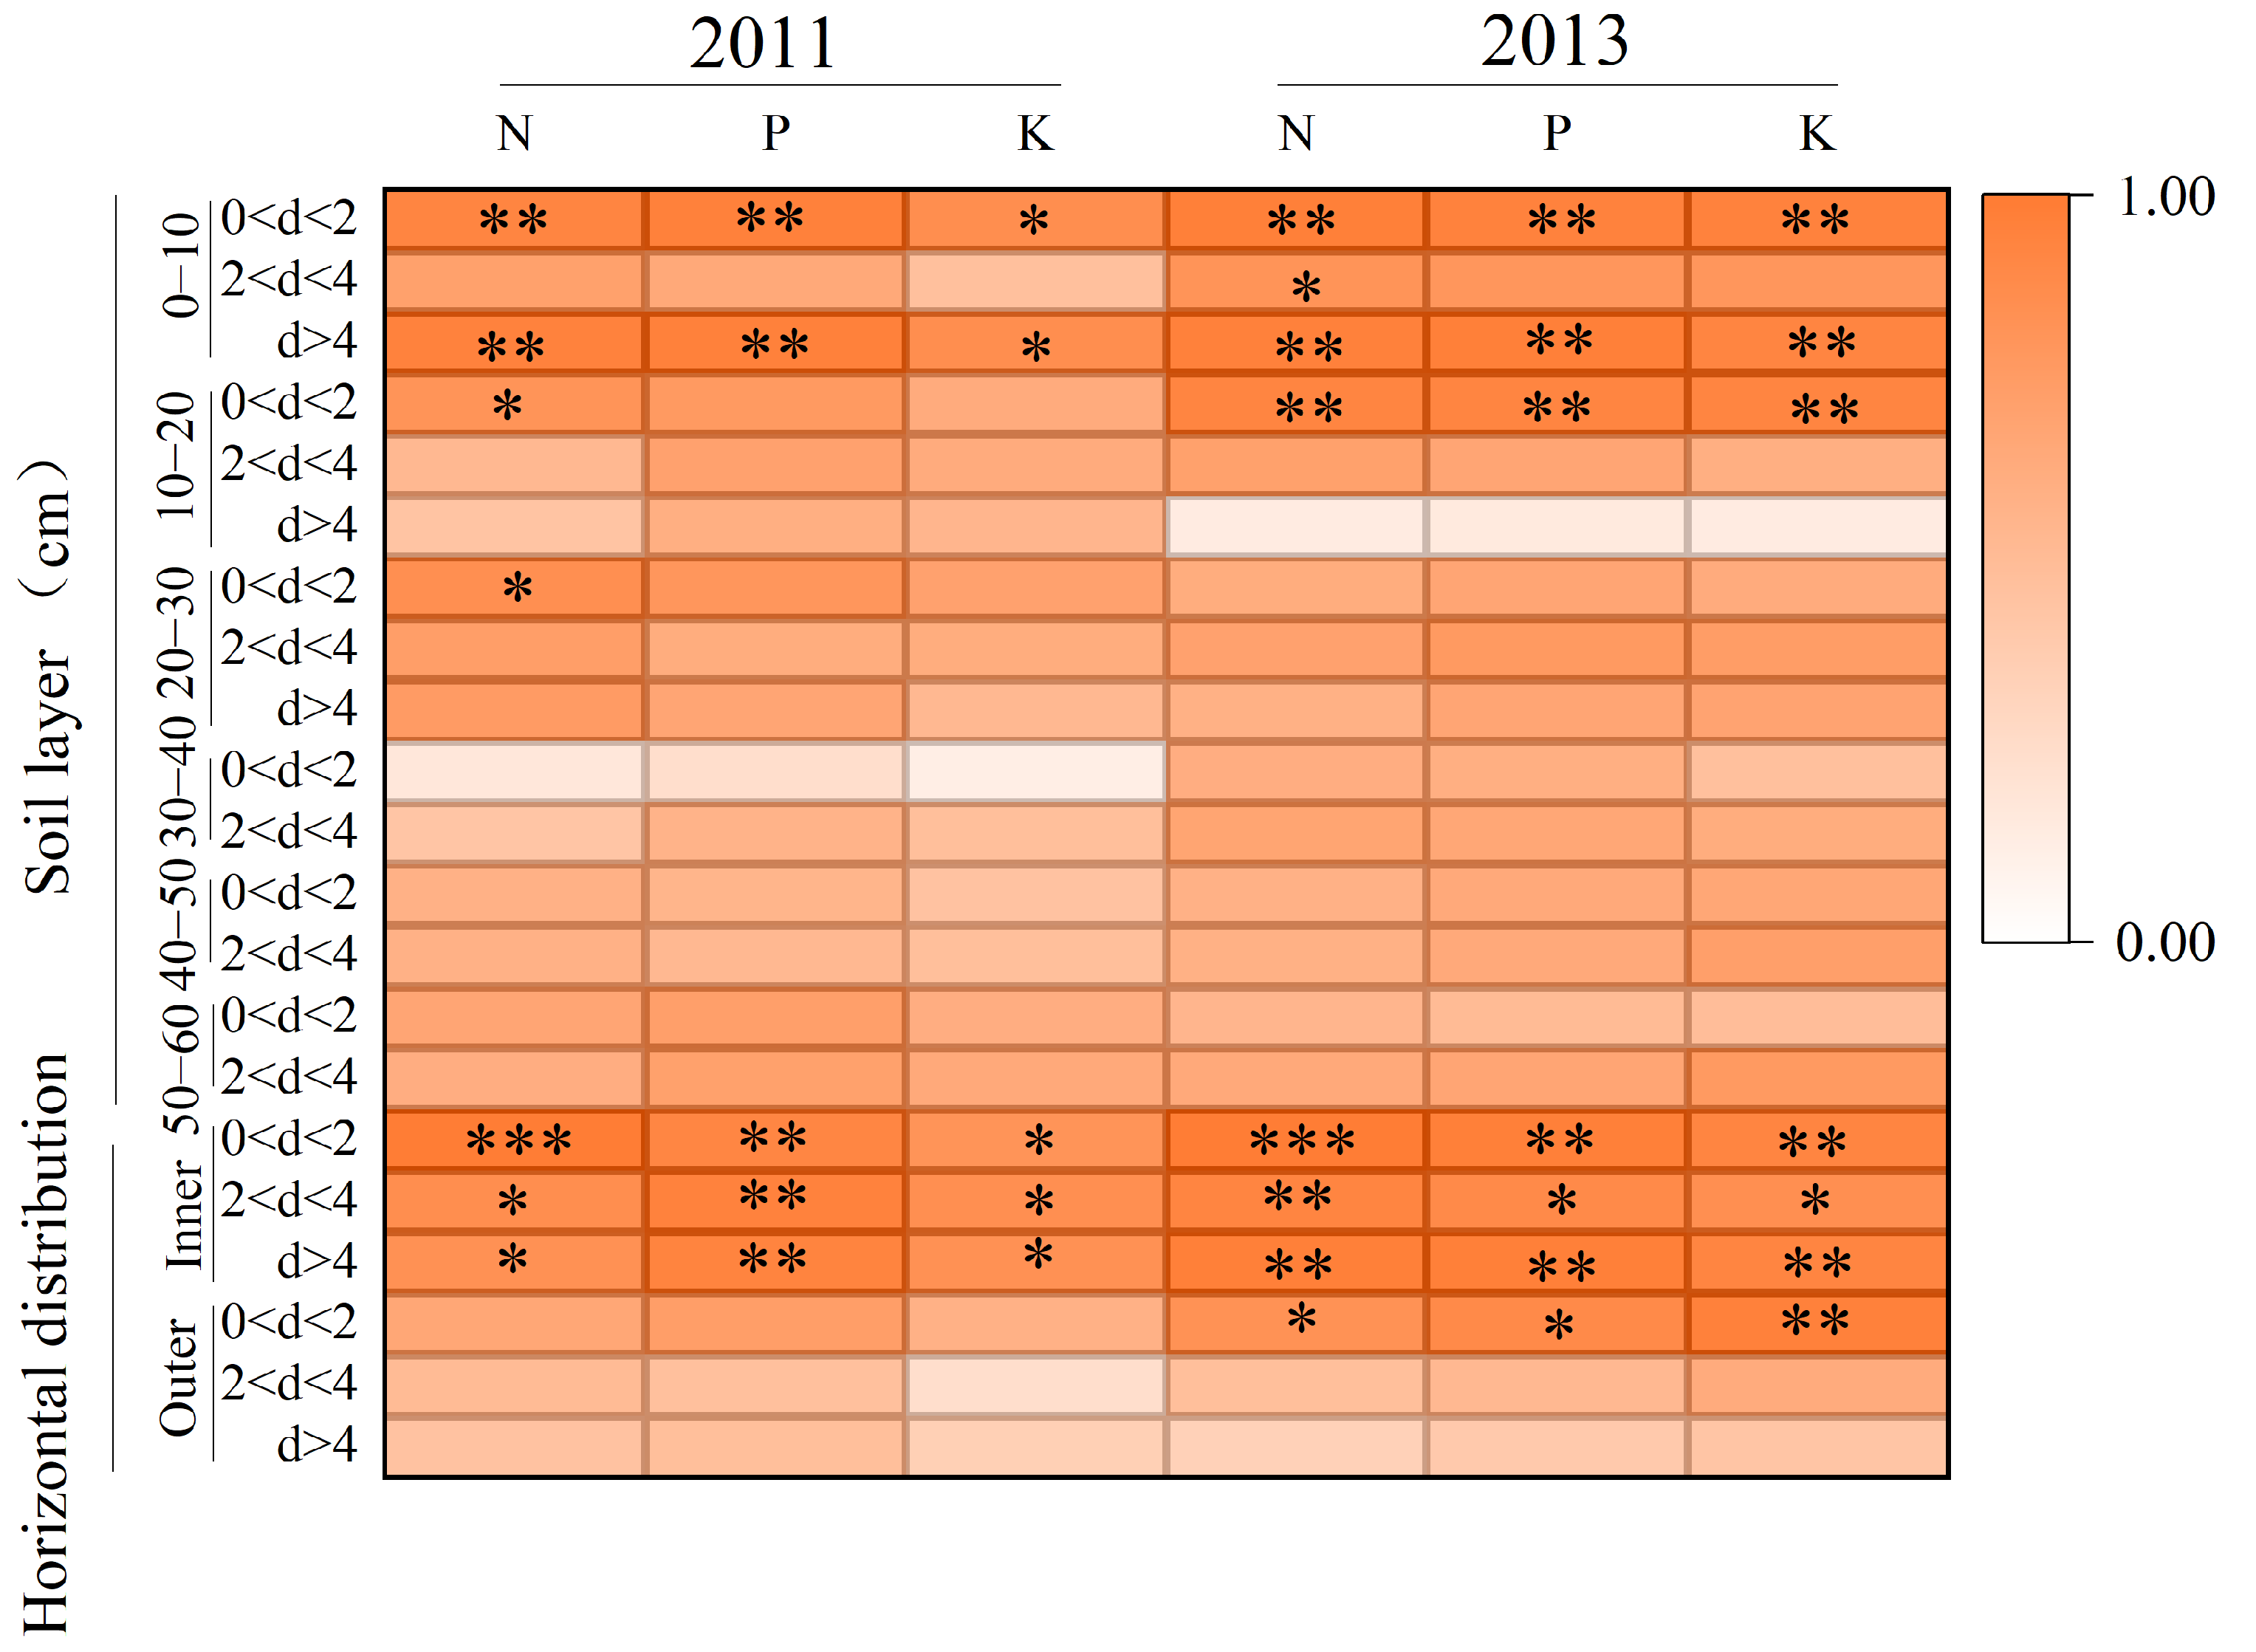
The results (Figure 9) indicated that root length was positively correlated with shoot nutrient content, and the strength of this correlation varied with vertical and horizontal root distribution. For vertical distribution, N content was correlated with root length in the 0–10, 10–20, and 20–30 cm soil layers, while P and K contents were correlated with root length in the 0–10 and 10–20 cm layers. These findings suggest that deeper roots have a weaker impact on shoot N, P, and K content.
For horizontal distribution, inner root length was positively associated with N, P, and K contents, whereas outer roots showed weaker effects. Further analysis revealed that, within the 0–10 cm soil layer, root length of 0–2 mm and larger-than-4 mm diameter roots had the strongest influence on nutrient accumulation. In the 10–20 and 20–30 cm layers, 0–2 mm roots were primarily responsible for promoting N uptake. Horizontally, inner roots of all diameters tended to be positively related to nutrient content, with the strongest associations observed for 0–2 mm roots. Outer 0–2 mm roots also contributed to nutrient content in 2013 (Figure 9).

4. Discussion

This study demonstrates that maize yield is strongly influenced by plant spatial arrangement, including both density and row spacing. Our results confirmed that increasing planting density up to 100,050 plants ha−1 reduced the yield per individual plant. Nevertheless, higher densities produced greater overall grain yield due to an increased number of kernels per unit area [22,23,24]. In contrast, row spacing affects yield differently, primarily by enhancing the yield of individual plants [4,22,23]. A key factor underlying these patterns is the growth and development of the maize root system [25].
Higher planting density inhibited maize root growth more than above-ground organs [26]. Mutual shading among leaves reduces photosynthetic production, limiting assimilate allocation to roots [27,28,29], while roots compete more intensely for space and soil resources. Vertically, maize roots are primarily concentrated in the 0–10 cm soil layer, with brace roots contributing to rapid proliferation near the surface at silking stage [30,31,32]. This layer plays a key role in nutrient uptake due to the spatial distribution of N, P, and K in the soil [33]. Increasing density intensified competition and reduced root proliferation in this layer.
Horizontally, inner roots were more abundant than outer roots, declining in density with distance from the stem in an S-shaped curve [10]. Over 90% of roots were located within half of the row spacing from the stem [34]. Both inner and outer root lengths decreased with increasing density, though outer roots were less affected. This may reflect a strategy to maximize soil resource exploitation, as inner roots contribute most to nutrient uptake [18]. Competition between roots from the same plant and neighboring plants intensified at high density, especially within the inner root system [34].
Fine roots (<2 mm) play a central role in water and nutrient uptake, and shallow roots are particularly sensitive to high density [35]. Adjacent roots create nutrient depletion zones and may release chemical signals that suppress neighboring root growth [19,36]. Consequently, fine root growth is strongly constrained under high density. The density effect is greater for finer roots vertically in the 0–30 cm soil layer, and horizontally it produces a more compact root system, inhibiting inner fine root growth.
Row spacing strongly influences competition for resources both above and below ground. Due to the distinct architecture of maize, wider rows favor above-ground growth, while narrower rows promote root proliferation [37,38]. Root structure has a more direct effect on nutrient uptake and yield than canopy photosynthesis [39], making reduced row spacing an effective strategy to increase yield. Previous studies suggested that the promotion of root growth by narrow spacing mainly occurs in the 0–20 cm soil layer, with little effect at greater depths [16]. In our study, this effect was most pronounced in the 0–10 cm layer and intensified at high planting densities, highlighting the role of this zone in nutrient uptake and its contribution to shoot biomass and grain yield.
Reducing row spacing promoted root growth compared to conventional planting patterns [40]. Maize has an outward-radiating root system, and at the same density, a more square-like arrangement of rows and plants favors root proliferation near the trunk [16]. For example, adjusting row × plant spacing from 60 cm × 25 cm to 40 cm × 37.5 cm increases the inner root area from 30 cm × 12.5 cm to 20 cm × 18.75 cm, preserving more roots close to the stem while reducing outer roots [41,42]. Narrow row spacing thus alleviates competition among inner roots and increases their density, while outer root growth is somewhat reduced [43]. This effect is more pronounced under high-density conditions. Despite these contrasting behaviors, the inner root system remains the primary contributor to nutrient supply, supporting plant growth and yield.

5. Conclusions

This study shows that a high planting density of 100,050 plants ha−1 can enhance maize yield only when combined with narrow row spacing (40 cm). The interaction of density and row spacing exerted stronger effects on root traits than on above-ground growth. High density reduced root length and surface area in the 0–10 cm soil layer and in the inner root zone, particularly in fine roots critical for nutrient uptake, whereas narrow row spacing alleviated this decline. These findings support our hypothesis that reducing row spacing can mitigate the negative effects of high planting density on root growth and nutrient acquisition, thereby sustaining higher maize yield. Overall, a moderate planting density of around 67,500 plants ha−1 combined with narrow row spacing (40 cm) is recommended for balancing root development and yield, while higher densities can further increase yield if row spacing is reduced. Future research should investigate the underlying physiological mechanisms of root adaptation to spatial competition and test these management strategies under different soil types and climatic conditions to refine practical recommendations.

Author Contributions

Conceptualization, Y.Y., S.H., Q.M., Z.C. (Zhenling Cui) and P.W.; data curation, J.W., Z.C. (Zhong Chen) and Z.L.; software, Z.C. (Zhong Chen) and Z.L.; writing—original draft preparation, J.W.; writing—review and editing, Y.Y., S.H., Q.M. and Z.C. (Zhenling Cui); supervision, Z.C. (Zhenling Cui) and P.W.; Validation, Y.Y., S.H., Q.M. and P.W. All authors have read and agreed to the published version of the manuscript.

Funding

This research was funded by the Key R&D Program of Shandong Province, grant number 2023TZXD088.

Data Availability Statement

The raw data supporting the conclusions of this article will be made available by the authors on request.

Acknowledgments

The language and grammar of the manuscript were refined with the assistance of generative AI tools to enhance clarity and readability.

Conflicts of Interest

The authors declare no conflicts of interest.

References

  1. Duvick, D. Genetic progress in yield of United States maize (Zea mays L.). Maydica 2005, 50, 193–202. [Google Scholar]
  2. Assefa, Y.; Carter, P.; Hinds, M.; Bhalla, G.; Schon, R.; Jeschke, M.; Paszkiewicz, S.; Smith, S.; Ciampitti, I.A. Analysis of Long Term Study Indicates Both Agronomic Optimal Plant Density and Increase Maize Yield per Plant Contributed to Yield Gain. Sci. Rep. 2018, 8, 4937. [Google Scholar] [CrossRef] [PubMed]
  3. Assefa, Y.; Vara Prasad, P.V.; Carter, P.; Hinds, M.; Bhalla, G.; Schon, R.; Jeschke, M.; Paszkiewicz, S.; Ciampitti, I.A. Yield Responses to Planting Density for US Modern Corn Hybrids: A Synthesis-Analysis. Crop Sci. 2016, 56, 2802–2817. [Google Scholar] [CrossRef]
  4. Bernhard, B.J.; Below, F.E. Plant population and row spacing effects on corn: Plant growth, phenology, and grain yield. Agron. J. 2020, 112, 2456–2465. [Google Scholar] [CrossRef]
  5. Borrás, L.; Maddonni, G.; Otegui, M. Leaf senescence in maize hybrids: Plant population, row spacing and kernel set effects. Field Crops Res. 2003, 82, 13–26. [Google Scholar] [CrossRef]
  6. Gao, J.; Shi, J.; Dong, S.; Liu, P.; Zhao, B.; Zhang, J. Grain yield and root characteristics of summer maize (Zea mays L.) under shade stress conditions. J. Agron. Crop Sci. 2017, 203, 562–573. [Google Scholar] [CrossRef]
  7. Gheysari, M.; Sadeghi, S.-H.; Loescher, H.W.; Amiri, S.; Zareian, M.J.; Majidi, M.M.; Asgarinia, P.; Payero, J.O. Comparison of deficit irrigation management strategies on root, plant growth and biomass productivity of silage maize. Agric. Water Manag. 2017, 182, 126–138. [Google Scholar] [CrossRef]
  8. Feng, G.; He, X.; Coulter, J.A.; Chen, Y.; Gao, Q.; Mi, G. Effect of limiting vertical root growth on maize yield and nitrate migration in clay and sandy soils in Northeast China. Soil Tillage Res. 2019, 195, 104407. [Google Scholar] [CrossRef]
  9. Song, R.; Wu, C.; Ma, L.; Guo, J.; Xing, F. Comparison of roots distribution in different maize plant type cultivars in the Songnen Plain. Chin. J. Appl. Ecol. 2003, 14, 1911–1913. [Google Scholar]
  10. Li, L.; Sun, J.; Zhang, F.; Guo, T.; Bao, X.; Smith, F.A.; Smith, S.E. Root distribution and interactions between intercropped species. Oecologia 2006, 147, 280–290. [Google Scholar] [CrossRef]
  11. Rubio, G.; Walk, T.; Ge, Z.; Yan, X.; Liao, H.; Lynch, J.P. Root gravitropism and below-ground competition among neighbouring plants: A modelling approach. Ann. Bot. 2001, 88, 929–940. [Google Scholar] [CrossRef]
  12. Wang, F.; Zhang, S.; Shao, L.; Li, G.; Chen, X.; Liu, P.; Zhao, B.; Dong, S.; Zhang, J.; Zhao, B. Effect of root in different soil layers on plant growth and yield formation after anthesis in summer maize. Sci. Agric. Sin. 2013, 46, 4007–4017. [Google Scholar] [CrossRef]
  13. Niu, L.; Yan, Y.; Hou, P.; Bai, W.; Zhao, R.; Wang, Y.; Li, S.; Du, T.; Zhao, M.; Song, J.; et al. Influence of plastic film mulching and planting density on yield, leaf anatomy, and root characteristics of maize on the Loess Plateau. Crop J. 2020, 8, 548–564. [Google Scholar] [CrossRef]
  14. Sharratt, B.S.; McWilliams, D.A. Microclimatic and rooting characteristics of narrow-row versus conventional-row corn. Agron. J. 2005, 97, 1129–1135. [Google Scholar] [CrossRef]
  15. Bernhard, B.J.; Below, F.E. Plant population and row spacing effects on corn: Phenotypic traits of positive yield-responsive hybrids. Agron. J. 2020, 112, 1589–1600. [Google Scholar] [CrossRef]
  16. Jiang, W.; Wang, K.; Wu, Q.; Dong, S.; Liu, P.; Zhang, J. Effects of narrow plant spacing on root distribution and physiological nitrogen use efficiency in summer maize. Crop J. 2013, 1, 77–83. [Google Scholar] [CrossRef]
  17. Wang, Q.; Yu, S.; Wang, W.; Zhan, L.; Wang, J. Characteristics of fine-root biomass in poplar plantations with different planting densities and spacing configurations. J. Nanjing For. Univ. 2020, 44, 179. [Google Scholar] [CrossRef]
  18. Lynch, J. Root architecture and plant productivity. Plant Physiol. 1995, 109, 7. [Google Scholar] [CrossRef]
  19. McCormack, M.L.; Dickie, I.A.; Eissenstat, D.M.; Fahey, T.J.; Fernandez, C.W.; Guo, D.; Helmisaari, H.S.; Hobbie, E.A.; Iversen, C.M.; Jackson, R.B.; et al. Redefining fine roots improves understanding of below-ground contributions to terrestrial biosphere processes. New Phytol. 2015, 207, 505–518. [Google Scholar] [CrossRef] [PubMed]
  20. Nelson, D.W.; Sommers, L. Determination of total nitrogen in plant material 1. Agron. J. 1973, 65, 109–112. [Google Scholar] [CrossRef]
  21. Soon, Y.; Kalra, Y. A comparison of plant tissue digestion methods for nitrogen and phosphorus analyses. Can. J. Soil Sci. 1995, 75, 243–245. [Google Scholar] [CrossRef]
  22. Murányi, E. Effect of plant density and row spacing on maize (Zea mays L.) grain yield in different crop year. Columella-J. Agric. Environ. Sci. 2015, 2, 57–63. [Google Scholar]
  23. Testa, G.; Reyneri, A.; Blandino, M. Maize grain yield enhancement through high plant density cultivation with different inter-row and intra-row spacings. Eur. J. Agron. 2016, 72, 28–37. [Google Scholar] [CrossRef]
  24. Van Roekel, R.J.; Coulter, J.A. Agronomic responses of corn to planting date and plant density. Agron. J. 2011, 103, 1414–1422. [Google Scholar] [CrossRef]
  25. Gao, Y.; Duan, A.; Qiu, X.; Liu, Z.; Sun, J.; Zhang, J.; Wang, H. Distribution of roots and root length density in a maize/soybean strip intercropping system. Agric. Water Manag. 2010, 98, 199–212. [Google Scholar] [CrossRef]
  26. Shao, H.; Shi, D.; Shi, W.; Ban, X.; Chen, Y.; Ren, W.; Chen, F.; Mi, G. Genotypic difference in the plasticity of root system architecture of field-grown maize in response to plant density. Plant Soil 2019, 439, 201–217. [Google Scholar] [CrossRef]
  27. Lambers, H.; Posthumus, F. The effect of light intensity and relative humidity on growth rate and root respiration of Plantago lanceolata and Zea mays. J. Exp. Bot. 1980, 31, 1621–1630. [Google Scholar] [CrossRef]
  28. Demotes-Mainard, S.; Pellerin, S. Effect of mutual shading on the emergence of nodal roots and the root/shoot ratio of maize. Plant Soil 1992, 147, 87–93. [Google Scholar] [CrossRef]
  29. Hebert, Y.; Guingo, E.; Loudet, O. The response of root/shoot partitioning and root morphology to light reduction in maize genotypes. Crop Sci. 2001, 41, 363–371. [Google Scholar] [CrossRef]
  30. Somma, F.; Hopmans, J.; Clausnitzer, V. Transient three-dimensional modeling of soil water and solute transport with simultaneous root growth, root water and nutrient uptake. Plant Soil 1998, 202, 281–293. [Google Scholar] [CrossRef]
  31. Reneau, J.W.; Khangura, R.S.; Stager, A.; Erndwein, L.; Weldekidan, T.; Cook, D.D.; Dilkes, B.P.; Sparks, E.E. Maize brace roots provide stalk anchorage. Plant Direct 2020, 4, e00284. [Google Scholar] [CrossRef]
  32. Lynch, J.P. Steep, cheap and deep: An ideotype to optimize water and N acquisition by maize root systems. Ann. Bot. 2013, 112, 347–357. [Google Scholar] [CrossRef]
  33. Postma, J.A.; Lynch, J.P. Root cortical aerenchyma enhances the growth of maize on soils with suboptimal availability of nitrogen, phosphorus, and potassium. Plant Physiol. 2011, 156, 1190–1201. [Google Scholar] [CrossRef]
  34. Liedgens, M.; Richner, W. Minirhizotron observations of the spatial distribution of the maize root system. Agron. J. 2001, 93, 1097–1104. [Google Scholar] [CrossRef]
  35. Kuroda, H.; Chiba, K. Effect of planting density on root growth in “Starking delicious” apple [Malus pumila] trees grafted on dwarfing and semi-dwarfing rootstocks. J. Jpn. Soc. Hortic. Sci. 1999, 68, 312–320. [Google Scholar] [CrossRef]
  36. Borden, K.A.; Thomas, S.C.; Isaac, M.E. Variation in fine root traits reveals nutrient-specific acquisition strategies in agroforestry systems. Plant Soil 2020, 453, 139–151. [Google Scholar] [CrossRef]
  37. Maltese, N.E.; Maddonni, G.A.; Melchiori, R.J.M.; Ferreyra, J.M.; Caviglia, O.P. Crop nitrogen status of early- and late-sown maize at different plant densities. Field Crops Res. 2020, 258, 107965. [Google Scholar] [CrossRef]
  38. Kuchenbuch, R.O.; Gerke, H.H.; Buczko, U. Spatial distribution of maize roots by complete 3D soil monolith sampling. Plant Soil 2009, 315, 297–314. [Google Scholar] [CrossRef]
  39. Hammer, G.L.; Dong, Z.; McLean, G.; Doherty, A.; Messina, C.; Schussler, J.; Zinselmeier, C.; Paszkiewicz, S.; Cooper, M. Can Changes in Canopy and/or Root System Architecture Explain Historical Maize Yield Trends in the U.S. Corn Belt? Crop Sci. 2009, 49, 299–312. [Google Scholar] [CrossRef]
  40. Ma, B.; Dwyer, L.; Costa, C. Row spacing and fertilizer nitrogen effects on plant growth and grain yield of maize. Can. J. Plant Sci. 2003, 83, 241–247. [Google Scholar] [CrossRef]
  41. Jordan, M.; Picard, D. A simulation model of the three-dimensional architecture of the maize root system. Plant Soil 1989, 119, 147–154. [Google Scholar] [CrossRef]
  42. Feldman, L. The Maize Handbook; Springer: Berlin/Heidelberg, Germany, 1994; pp. 29–37. [Google Scholar]
  43. Gao, J.; Lei, M.; Yang, L.; Wang, P.; Tao, H.; Huang, S. Reduced row spacing improved yield by optimizing root distribution in maize. Eur. J. Agron. 2021, 127, 126291. [Google Scholar] [CrossRef]
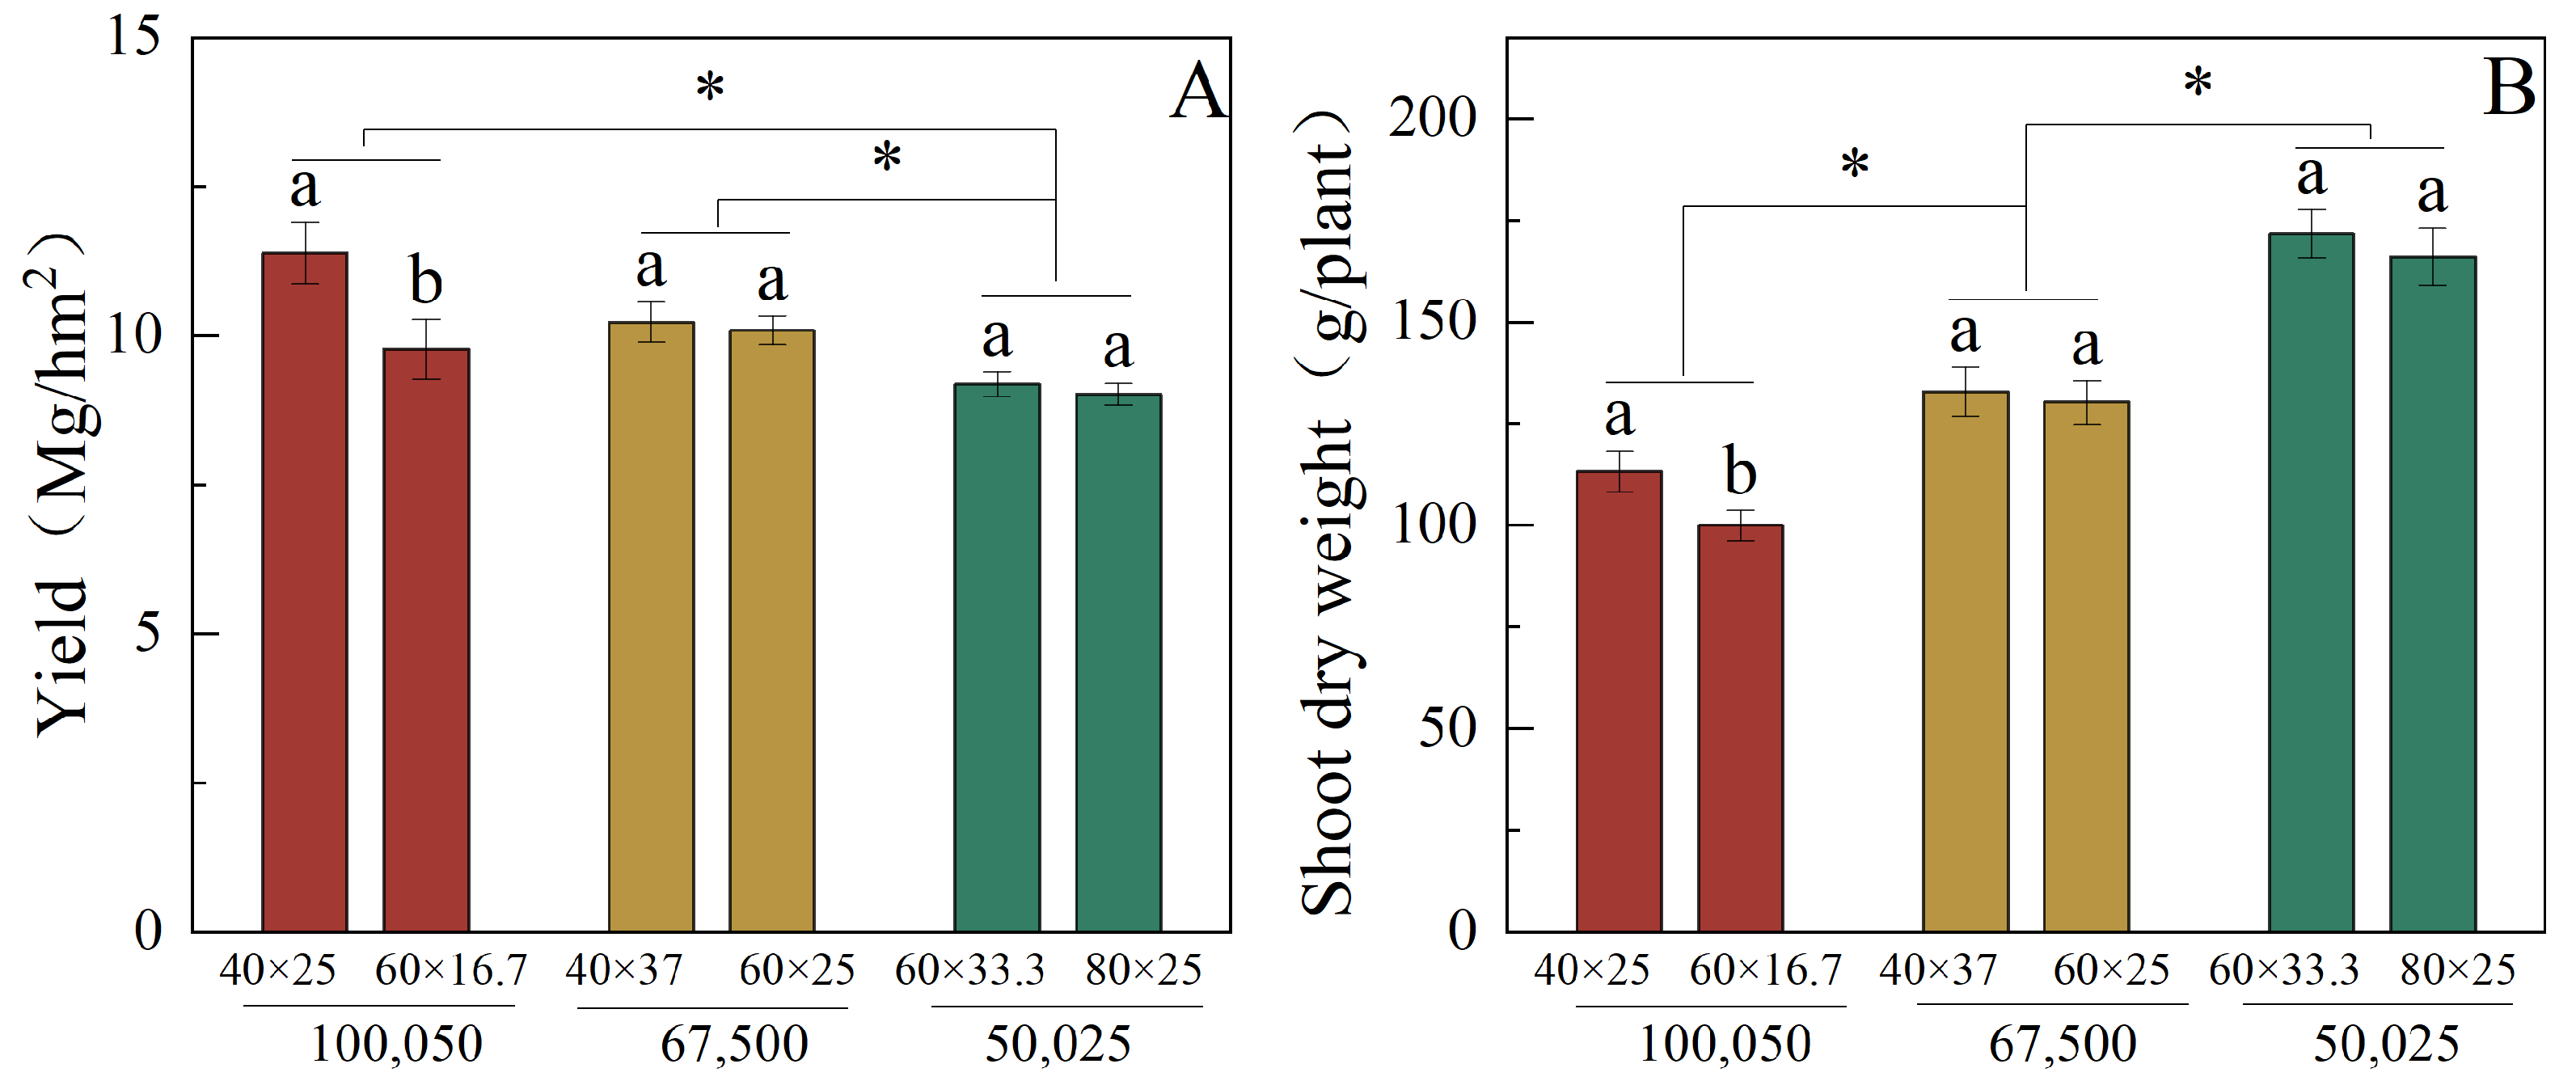
Figure 1. Effects of planting density and row spacing on grain yield and shoot dry weight. (A) Grain yield (means across 2011–2014). (B) Shoot dry weight per plant (means across 2011–2013). Values are means ± SE (n = 3 plots per treatment). Different letters above bars indicate significant differences among treatments by one-way ANOVA followed by Duncan’s multiple range test at p < 0.05. Asterisks (*) indicate significant differences among planting densities at p < 0.05. Treatment codes: D50025, D67500 and D100050 indicate 50,025, 67,500 and 100,050 plants ha−1, respectively; within each density two row × plant spacing combinations are shown (see Section 2).
Agronomy 15 02552 g001
Figure 2. Vertical distribution of root length and root surface area under different density × row-spacing treatments (2011–2013). (A) Root length by 10 cm soil layers to 60 cm depth. (B) Root surface area by 10 cm layers. Different letters indicate significant differences among treatments within the same soil layer according to one-way ANOVA followed by Duncan’s multiple range test at p < 0.05.
Agronomy 15 02552 g002
Figure 3. Horizontal (inner vs. outer) distribution of root morphological traits (2011–2013). (A) Root length of inner and outer zones. (B) Root surface area of inner and outer zones. Different lowercase letters indicate significant differences among row-spacing treatments within the same planting density for the inner root zone, and different uppercase letters indicate significant differences among row-spacing treatments within the same planting density for the outer root zone (p < 0.05). Asterisks (*) denote significant differences among planting densities (p < 0.05).
Agronomy 15 02552 g003
Figure 4. Vertical and horizontal distribution of root length and root surface area under different density × row-spacing treatments (2011–2013). Left column shows the inner root zone and right column shows the outer root zone. Top row presents root length and bottom row presents root surface area. Different lowercase letters indicate significant differences among row-spacing treatments within the same planting density (p < 0.05). Asterisks (*) denote significant differences among planting densities (p < 0.05) and NS denote not significant.
Agronomy 15 02552 g004
Figure 5. Root length by soil depth and diameter class under different density × row-spacing treatments (2011–2013). Each column corresponds to a root diameter class: left, 0–2 mm; middle, 2–4 mm; right, >4 mm. Within each column, panels from top to bottom show root length in the 0–10, 10–20 and 20–30 cm soil layers, respectively. Different lowercase letters indicate significant differences among row-spacing treatments within the same planting density (p < 0.05). An asterisk (*) indicates a significant difference (p < 0.05).
Agronomy 15 02552 g005
Figure 6. Effects of planting density and row spacing on root surface area of maize at different soil depths and diameter classes (2011–2013). Each column corresponds to a root diameter class: left, 0–2 mm; middle, 2–4 mm; right, >4 mm. Within each column, panels from top to bottom show root length in the 0–10, 10–20 and 20–30 cm soil layers, respectively. Different lowercase letters indicate significant differences among row-spacing treatments within the same planting density (p < 0.05). An asterisk (*) indicates a significant difference (p < 0.05).
Agronomy 15 02552 g006
Figure 7. Effects of plant density and row spacing on maize root length in different root diameter classes (2011–2013). Panels from left to right represent fine roots (0 < d < 2 mm), medium roots (2 < d < 4 mm), and coarse roots (d > 4 mm). Within each column, the upper panel shows root length in the inner zone and the lower panel shows root length in the outer zone. Different lowercase letters indicate significant differences among row-spacing treatments within the same planting density (p < 0.05). An asterisk (*) indicates a significant difference (p < 0.05).
Agronomy 15 02552 g007
Figure 8. Effects of plant density and row spacing on maize root surface area in different root diameter classes (2011–2013). Panels from left to right represent fine roots (0 < d < 2 mm), medium roots (2 < d < 4 mm), and coarse roots (d > 4 mm). Within each column, the upper panel shows root length in the inner zone and the lower panel shows root length in the outer zone. Different lowercase letters indicate significant differences among row-spacing treatments within the same planting density (p < 0.05). An asterisk (*) indicates a significant difference (p < 0.05).
Agronomy 15 02552 g008
Figure 9. Diameter-class and horizontal (inner/outer) root length correlations with shoot nutrient content (2011, 2013). Correlation matrices showing how root length of different diameter classes (0–2, 2–4, >4 mm) in inner and outer zones relates to shoot N, P and K. Significance of correlations is indicated by asterisks: *, **, *** denote p < 0.05, 0.01 and 0.001, respectively; NS denotes not significant.
Agronomy 15 02552 g009
Table 1. Monthly Mean Daily Solar Radiation and Mean Maximum/Minimum Temperature from May to October, 2011–2014.
YearMonthMean Daily Solar Radiation
(MJ/m2/Day)
Mean Max Temperature
(°C)
Mean Min Temperature
(°C)
Precipitation
(mm)
2011526.69 26.52 13.97 30.08
2011623.90 31.35 19.90 112.38
2011720.21 30.88 22.62 376.32
2011818.84 30.45 22.05 103.93
2011917.36 24.62 14.18 21.59
20111013.85 19.42 8.03 7.85
2012526.28 28.08 15.05 20.61
2012622.87 29.67 19.49 95.62
2012720.25 31.34 22.87 354.80
2012820.01 30.51 21.08 52.65
2012917.48 26.23 13.95 82.21
20121014.71 20.72 6.84 23.10
2013525.24 27.88 15.27 8.47
2013620.73 28.24 20.02 101.08
2013721.48 31.93 22.82 239.07
2013819.85 31.40 21.87 109.5
2013916.80 25.10 15.79 81.84
20131014.76 19.17 6.48 15.36
2014526.85 27.67 14.52 36.68
2014624.51 30.89 19.37 108.72
2014721.49 32.52 23.48 84.86
2014821.07 31.42 20.57 100.18
2014916.46 25.31 15.51 106.38
20141013.43 18.80 8.12 12.76
Table 2. Nitrogen (N), phosphorus (P), and potassium (K) accumulation per plant under different years, planting densities, and row × plant spacing combinations (2011, 2013). Values are means (mg/plant) and different letters within each factor indicate significant differences at p < 0.05 (Tukey’s test). Significance of main effects is shown in the “Source of variation” row: ***, ** and NS denote p < 0.001, 0.01 and not significant, respectively.
TreatmentsNitrogen
(mg/Plant)
Phosphorus
(mg/Plant)
Potassium
(mg/Plant)
Year
20112365.0 a466.2 a1940.5 a
20131713.7 b473.5 a1775.2 a
Density (plants/ha)
D1000501695.6 c373.2 c1538.3 b
D675002239.4 b454.4 b1692.0 b
D500252671.6 a584.5 a2354.9 a
Row space × plant space (cm)
40 × 251769.2 a383.7 a1690.9 a
60 × 16.71622.1 a359.2 a1334.8 b
40 × 372313.4 a471.0 a1702.7 a
60 × 252165.4 a457.8 a1681.3 a
60 × 33.32723.1 a594.1 a2426.2 a
80 × 252620.0 a575.0 a2283.7 a
Source of variation
Year**NSNS
Density*********
Row space × plant space*********
Disclaimer/Publisher’s Note: The statements, opinions and data contained in all publications are solely those of the individual author(s) and contributor(s) and not of MDPI and/or the editor(s). MDPI and/or the editor(s) disclaim responsibility for any injury to people or property resulting from any ideas, methods, instructions or products referred to in the content.