Article

EAG-YOLOv11n: An Efficient Attention-Guided Network for Rice Leaf Disease Detection

1
College of Information and Intelligence, Hunan Agricultural University, Changsha 410128, China
2
College of Life Science and Technology, Huazhong Agricultural University, Wuhan 430070, China
3
Sanya Yazhou Bay Innovation Technology International Consulting Research Institute Co., Ltd., Sanya 572016, China
*
Author to whom correspondence should be addressed.
Agronomy 2025, 15(11), 2513; https://doi.org/10.3390/agronomy15112513
Submission received: 6 October 2025 / Revised: 25 October 2025 / Accepted: 27 October 2025 / Published: 29 October 2025
(This article belongs to the Topic Digital Agriculture, Smart Farming and Crop Monitoring)

Abstract

Rice leaf diseases are critical factors affecting rice yield and quality, and their effective detection is crucial for ensuring stable production. However, existing detection models exhibit limitations in capturing irregular and fine-grained lesion features and are susceptible to interference from complex backgrounds. To address these challenges, this study proposes an Efficient Attention-Guided Network (EAG-YOLOv11n) for rice leaf disease detection. Specifically, an EMA-C3K2 module is proposed to enhance the network’s feature extraction capability. It integrates Efficient Multi-Scale Attention (EMA) into the shallow C3K2 layers, enabling the network to extract richer low-level feature representations. In addition, a Global Local Complementary Attention module (GLC-PSA) is proposed, which integrates a Local Importance Attention (LIA) branch to enhance the local feature representation of the original C2PSA. This design strengthens the perception of lesion regions while effectively suppressing background interference. Furthermore, an Adaptive Threshold Focal Loss (ATFL) is employed to guide the optimization of model parameters during training, alleviating sample imbalance and adaptively emphasizing the learning of challenging samples. Experimental results demonstrate that EAG-YOLOv11n achieves a mean Average Precision (mAP) of 87.3%, representing a 2.7% improvement over the baseline. Furthermore, compared with existing mainstream detection methods, including RT-DETR-L, YOLOv7tiny, YOLOv8n, YOLOv9tiny, YOLOv10n, and YOLOv12n, EAG-YOLOv11n improves mAP by 4.2%, 4.3%, 1.9%, 1.1%, 8.7%, and 2.9%, respectively. Overall, these results highlight its superior effectiveness in rice leaf disease detection, providing reliable technical support for stable yield and sustainable agricultural development.

1. Introduction

Rice is an important crop that supports the livelihood and sustenance of over half of the world’s population [1,2]. In China, rice is widely cultivated, covering over 30.07 million hectares in 2020, playing a pivotal role in ensuring global food security [3,4]. However, the quality and yield of rice are easily affected by various diseases [5]. The fluctuations in rice yield and quality not only affect the stability of the agricultural economy but also have a direct impact on food security [6]. Therefore, the early recognition and control of rice leaf diseases are crucial for rice production.
Early rice disease monitoring was primarily conducted manually, requiring farmers to determine the type of diseases based on experience or expert consultation [7,8]. This method cannot meet the requirements of modern agricultural development. Furthermore, it is susceptible to human subjectivity, which can lead to the misdiagnosis of diseases. To eliminate diseases, farmers often overuse chemical pesticides, leading to environmental pollution [9]. Therefore, establishing an efficient detection approach for rice diseases is essential to ensure accurate diagnosis and timely warning, thereby supporting green and sustainable agricultural production.
Over the past few years, computer vision has been widely applied in agriculture, offering robust technical support for the automated identification of crop diseases. Early computer vision approaches primarily constructed disease recognition models by integrating handcrafted features (e.g., color, texture, and shape) with machine learning algorithms. Snehaprava et al. [10] adopted an adaptive thresholding segmentation strategy based on the Otsu method to segment rice disease regions according to Saturation (S) and Hue (H). Subsequently, they constructed a disease recognition model using LS-SVM, achieving recognition accuracies of 91.3% and 98.87% on two datasets, respectively. BHARANIDHARAN et al. [11] extracted 14 statistical features from thermal images of rice leaves and designed a feature transformation method based on the LOA to enhance the adaptability of features in machine learning algorithms. The enhanced features were fed into the KNN algorithm to construct a classifier, achieving a recognition accuracy of over 90%. Kumar et al. [12] employed the Discrete Wavelet Transform (DWT) to extract three types of image features—color, shape, and texture. These features were subsequently input into an AdaBoost-SVM classifier, achieving an accuracy of 98.8% in identifying three rice diseases. Although machine learning methods have shown considerable effectiveness in crop disease detection, their applicability to large-scale datasets remains limited. The preprocessing stage is complex, requiring manual extraction of disease-specific features. Furthermore, the feature selection process is inherently subjective, which may result in the omission of critical features and restrict the model’s generalization ability.
Nowadays, various deep learning methods have been proposed for crop disease identification [13,14,15,16]. Among these methods, object detection is a deep learning approach that simultaneously classifies and localizes diseases in an image. Currently, two main approaches are commonly employed for plant disease detection: Transformer-based methods and YOLO-based methods. The Transformer architecture possesses excellent capabilities in global dependency modeling and contextual information integration, enabling it to demonstrate significant advantages in complex crop disease detection tasks. Yang et al. [17] Transformer-based rice disease detection model, DHLC-DETR, which enhances the DETR backbone by integrating Res2Net and a high-density hierarchical hybrid sampling mechanism to improve multi-scale feature representation. The Hungarian algorithm is further employed to optimize prediction matching. Experimental results demonstrate that DHLC-DETR achieves a 17.3% improvement in mAP, with an average detection accuracy of 97.44%. Hanxiang et al. [18] proposed an end-to-end detection model, PD-TR, which enhances the DINO framework by integrating BatchFormerV2, the LAMB optimizer, and the CIoU loss function. The model effectively detects multiple crop diseases on a large-scale dataset, achieving a maximum mAP of 56.3%. Similarly, Li et al. [19] proposed PL-DINO, a Transformer-based crop leaf disease detection model that incorporates CBAM to enhance feature extraction and employs EQL to mitigate class imbalance. PL-DINO demonstrates superior performance to Faster R-CNN and YOLOv7 in detecting leaf diseases under natural conditions. Transformer-based plant disease detection methods excel at modeling global dependencies and capturing contextual features, thereby achieving high accuracy in disease recognition [20]. However, in rice leaf disease detection tasks under complex field environments, their high computational cost, slower inference speed, and reliance on large-scale training data significantly limit their deployment in practical scenarios, particularly on resource-constrained edge devices. In contrast, yolo-based detection approach can improve detection speed while maintaining reasonable accuracy, which renders it more appropriate for deployment in agriculture.
YOLO-based methods employ a fully convolutional design that performs classification and localization directly on feature maps, thereby enabling faster inference and simpler optimization. In the field of crop disease detection, researchers have progressively optimized and improved the network structure of YOLO to address diverse challenges across application scenarios, thereby improving detection performance and generalization. To detect rice blast in field environments, Cao et al. [21] designed a lightweight C2F-Pyramid module to improve the computational efficiency of YOLOv8x. To reduce the misdetection of small disease targets, they incorporated a CBAM module to enhance the network’s ability to capture multi-scale features from both spatial and channel dimensions, and added an additional detection head to supplement small target information. The network ultimately achieved a mAP of 84.3%, surpassing the baseline by 6.1%. To address the challenges of small lesion areas and high density in peanut leaf spot disease, Zhang et al. [22] proposed a lightweight detection method, ESM-YOLOv11. By incorporating EMA, SLIM-NECK, and MPDIoU to improve the structure and loss function of YOLOv11, this method reduced the number of parameters by 3.87% while increasing the mAP to 96.90%. Meng et al. [23] enhanced the feature extraction capability of YOLOv8n by introducing multi-scale variable kernel convolution and a selective kernel (SK) attention module. In addition, they optimized the loss function using MPDIoU to improve the model’s localization ability for occluded targets. Finally, the mAP of improved model achieved 89.24%. Gao et al. [24] proposed a lightweight CB module to enhance YOLOv5s, integrating StarNet and Shape-NWD to improve backbone features and bounding box computation for efficient wheat Fusarium head blight detection. The method achieved a mAP of 90.51% and was successfully deployed on an embedded platform. YOLO-based methods have demonstrated strong performance not only in single-disease detection tasks but also in multi-disease detection scenarios. To address the challenge of detecting disease regions on different parts of peppers, Zheng et al. [25] proposed MSPB-YOLO, a YOLOv8-based detection algorithm. By incorporating the RVB-EMA module, the RepGFPN structure, and the DIOU loss function, the algorithm enhances the network’s feature extraction capability and optimizes the training process, enabling efficient localization of disease regions across multiple parts, with an mAP@0.5 of 96.4%. Pan et al. [26] proposed SSD-YOLO, a rice disease detection method that integrates SENet, DySample, and ShapeIoU into the YOLOv8 framework. SSD-YOLO achieved detection accuracies of 87.52%, 99.48%, and 98.99% for three diseases, outperforming the baseline by 11.11%, 1.73%, and 3.81%. To address the challenges of varying target scales and complex backgrounds in field scenarios, Gan et al. [27] introduced a lightweight efficient detection head (LEDH) and multi-scale spatial pyramid pooling (MSPPF) into YOLOv8n. These improvements effectively enhanced the network’s ability to capture intricate details of rice leaf diseases, achieving a 4.4% increase in mAP compared with the original YOLOv8n. To deploy the model on embedded mobile devices, Wang et al. [28] introduced a structural re-parameterization module RepGhost and GhostConv to lighten YOLOv8. They also incorporated CBAM into the backbone and reduced the number of parameters by 33.2%. It maintaining high accuracy with lower params and can be widely applied to different crops.
The above research indicates that deep learning-based methods have achieved remarkable progress in crop disease detection. However, in real field environments, rice leaf disease detection is still influenced by multiple factors, such as complex backgrounds, diverse disease types with varying visual characteristics, and sample imbalance. Therefore, achieving reliable detection accuracy while ensuring efficient deployment on mobile devices remains a critical challenge. To solve these issues, this study proposes EAG-YOLOv11n, a rice leaf disease detection method based on YOLOv11n. It incorporates the EMA [29] into the shallow C3K2 modules of the backbone and neck to enhance the network’s attention to the feature details of various diseases. Additionally, a global local complementary attention module (GLC-PSA) is designed to suppress background interference by integrating global and local information. At the same time, ATFL [30] is employed to enhance the network’s ability on challenging samples. The main contributions of this work are summarized as follows:
(1)
A global local complementary attention module (GLC-PSA) is proposed and integrated into the backbone of YOLOv11n. This module enhances the perception of lesion regions while effectively suppressing background interference.
(2)
An EMA-C3K2 module is constructed and strategically deployed into the shallow C3K2 layers of the backbone and neck. By introducing Efficient Multi-Scale Attention (EMA), this module effectively improves the network’s sensitivity to multi-scale disease feature.
(3)
An Adaptive Threshold Focal Loss (ATFL) is introduced to optimize the network’s learning on hard-to-detect samples. In addition, a rice leaf disease dataset RLD-3C is constructed to validate the model’s effectiveness.

2. Materials and Methods

2.1. Dataset Construction

2.1.1. Data Collection

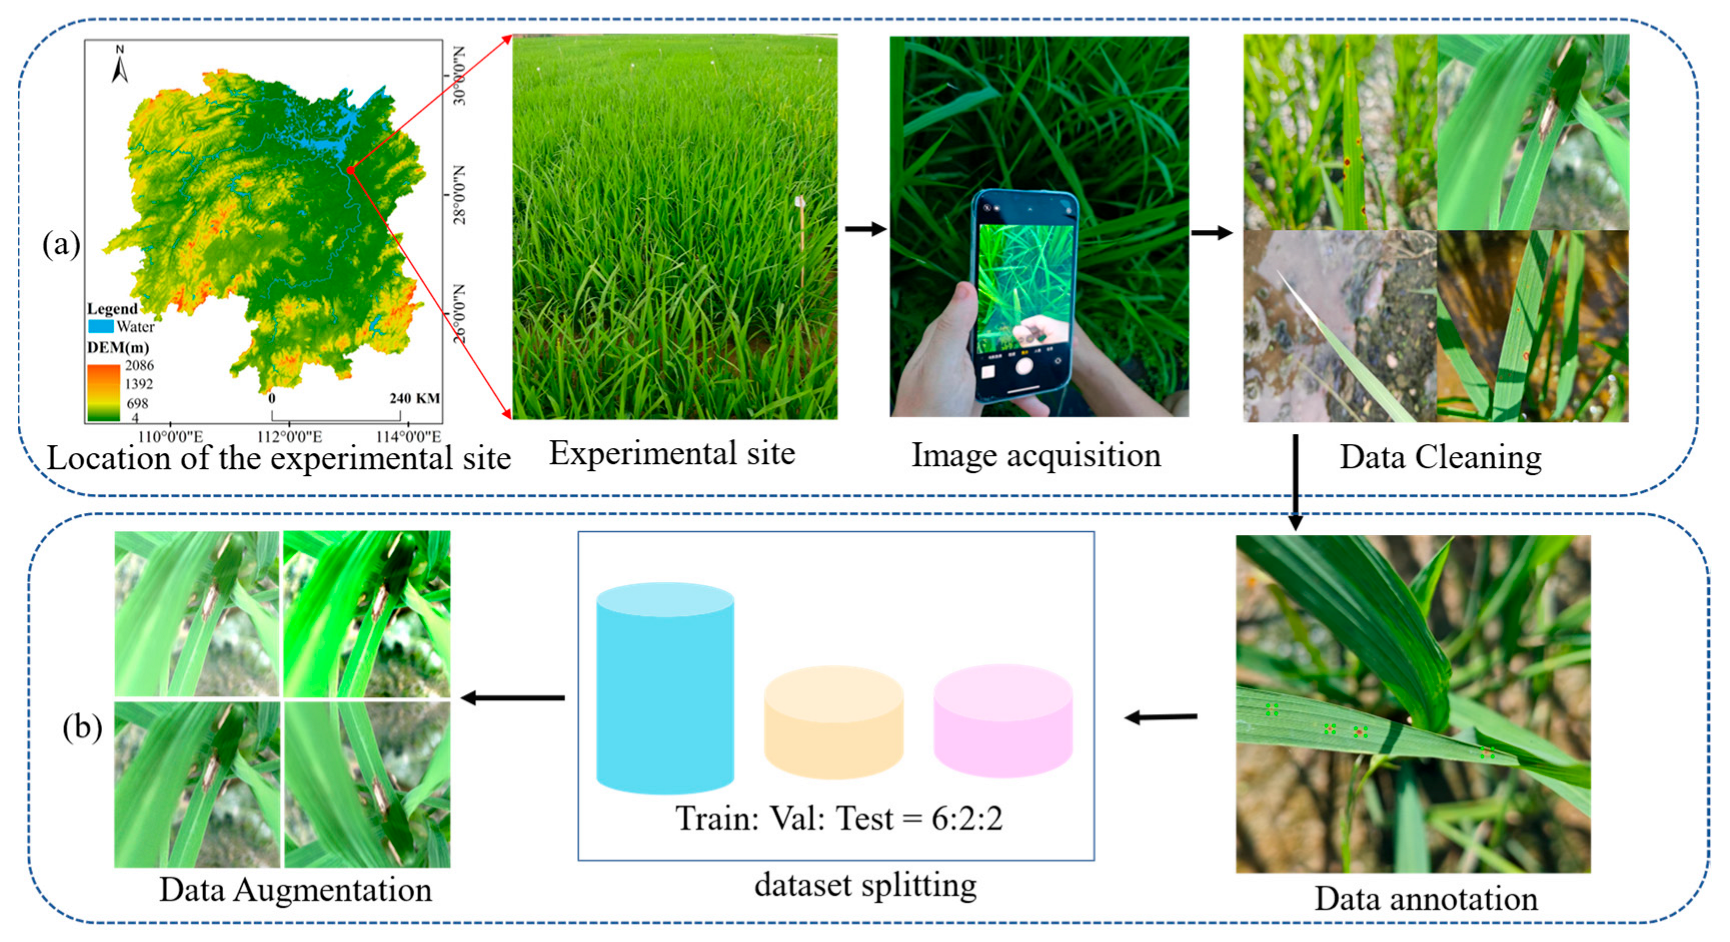
To advance the research and practical deployment of rice leaf disease detection models, this study develops an object detection dataset named RLD-3C (Rice Leaf Disease–3 Classes), which comprises multiple disease categories, complex backgrounds, and real field conditions for model training and performance evaluation. The rice leaf disease images used in RLD-3C were collected in the experimental field of the Hunan Academy of Agricultural Sciences (28.20° N, 113.08° E). The site and process of data collection are shown in Figure 1a.
Data collection was carried out from May to late July 2025 between 9:00 a.m. and 4:00 p.m., covering the jointing-booting, heading, and grain-filling stages of rice. During data collection, the distance between the camera and rice leaves ranged approximately from 20 to 50 cm, depending on lesion size and field conditions. A Redmi K70 Pro smartphone (Xiaomi, Beijing, China) and an iPhone 13 Pro smartphone (Apple, Cupertino, CA, USA) were used for image acquisition. All images were captured using the default camera settings of each smartphone to ensure authenticity and consistency across samples, and the detailed specifications of the wide camera for both devices are provided Table 1.

2.1.2. Dataset Production

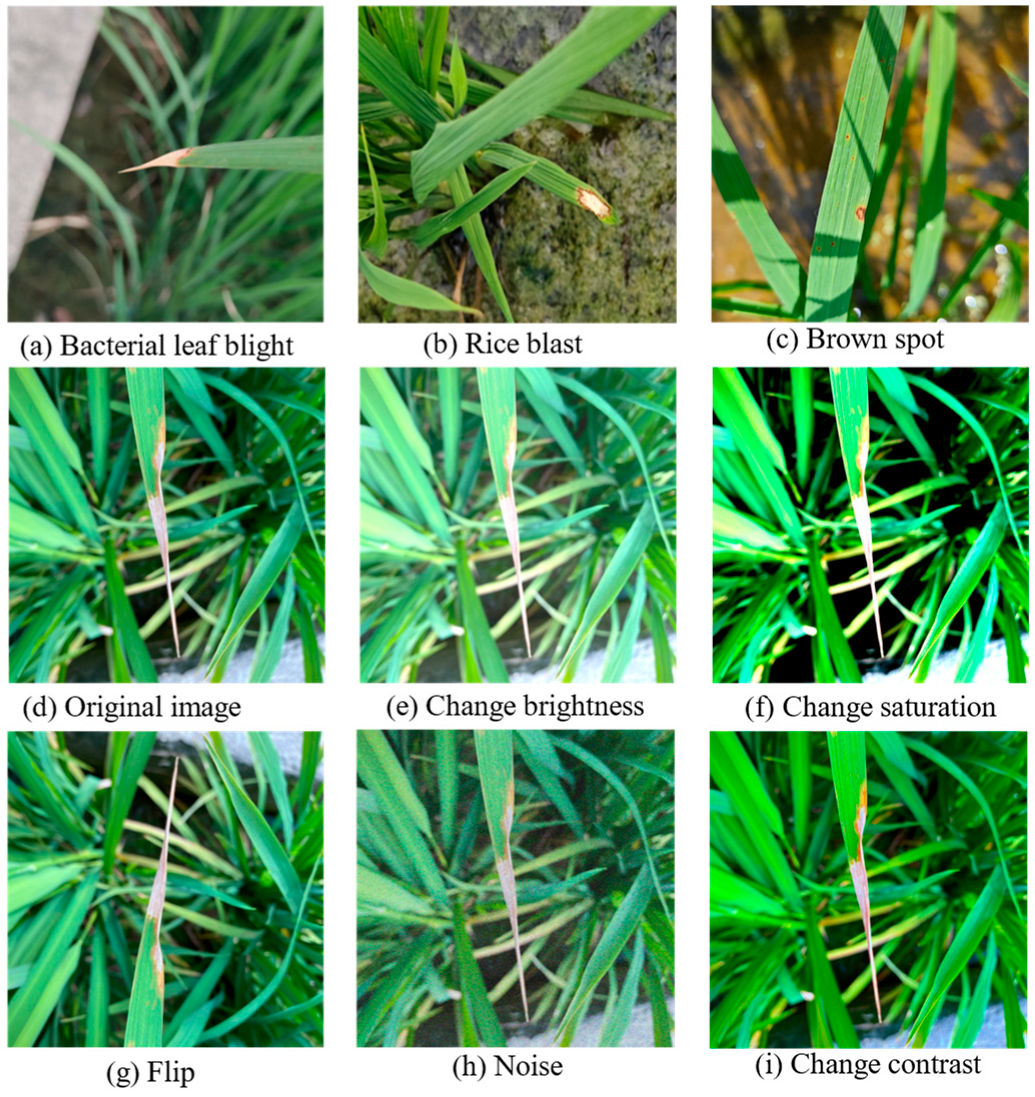
After data cleaning, a total of 1428 images were retained to construct a dataset comprising multiple disease categories. Specifically, the dataset contains 581 images of bacterial leaf blight (Xanthomonas oryzae pv. oryzae), 442 images of brown spot (Bipolaris oryzae), and 409 images of rice blast (Magnaporthe oryzae). To ensure professionalism and consistency, all images in this study were annotated under expert guidance using LabelImg 1.8.6 software. The dataset was split into training, validation, and test sets with a ratio of 6:2:2 [31]. To improve sample diversity, simulate complex field environments, and boost the model’s adaptability and stability, five augmentation strategies were employed on the training set. Specifically, contrast adjustment, saturation adjustment, brightness adjustment, flipping, and noise addition were applied. Representative disease samples and augmented examples are shown in Figure 2. Each augmentation was applied once, resulting in an expansion of the training set to 5136 images. The overall data distribution of RLD-3C dataset is presented in Table 2.

2.2. The Proposed EAG-YOLOv11n for Rice Leaf Disease Detection

2.2.1. Overall Architecture

YOLOv11 [32] is a common deep learning framework that supports multiple vision tasks and can be deployed across various environments for practical applications. Compared with earlier versions of YOLO models and Transformer-based detection methods, YOLOv11 achieves a better balance between accuracy and model complexity. To select the most suitable baseline model, three versions of the YOLOv11 algorithm—YOLOv11n, YOLOv11s, and YOLOv11m were trained and evaluated on RLD-3C dataset. As presented in Table 3, YOLOv11m achieves the highest accuracy with an mAP50 of 87.5%, but its 67.66 GFLOPs and 20.03 MB parameters limit its applicability in resource-constrained agricultural scenarios. Notably, YOLOv11n attains a competitive mAP50 of 84.6% with only 6.3 GFLOPs and 2.58 MB parameters. Balancing model complexity and accuracy, we adopt YOLOv11n as the baseline model, as it is suitable for deployment on low-cost embedded and mobile devices.
Building upon the YOLOv11n baseline, we further propose the EAG-YOLOv11n detection algorithm to enable rapid recognition and precise localization of rice leaf diseases, as shown in Figure 3. The EAG-YOLOv11n improves the backbone, neck, and loss function of original YOLOv11n to enhance the model’s applicability for the current task. Specifically, a multi-scale attention module, EMA-C3K2, is designed in place of the original C3K2 modules in the shallow layers of the backbone and neck. By integrating EMA-C3K2, the module effectively enhances the network’s representation capability of shallow detail features, thereby improving the overall detection performance. In addition, a GLC-PSA module is designed to optimize the original C2PSA. Through complementary integration of global and local features, this module strengthens the network’s perception of diseased areas while effectively suppressing background interference. At the same time, ATFL is introduced to dynamically adjust the weighting of easy and hard samples to improve detection performance on minority classes and hard-to-detect targets. Compared with YOLOv11n, EAG-YOLOv11n significantly improves detection accuracy for rice leaf diseases while maintaining low complexity. Those improved modules are described in detail in the subsequent sections.

2.2.2. EMA-C3K2

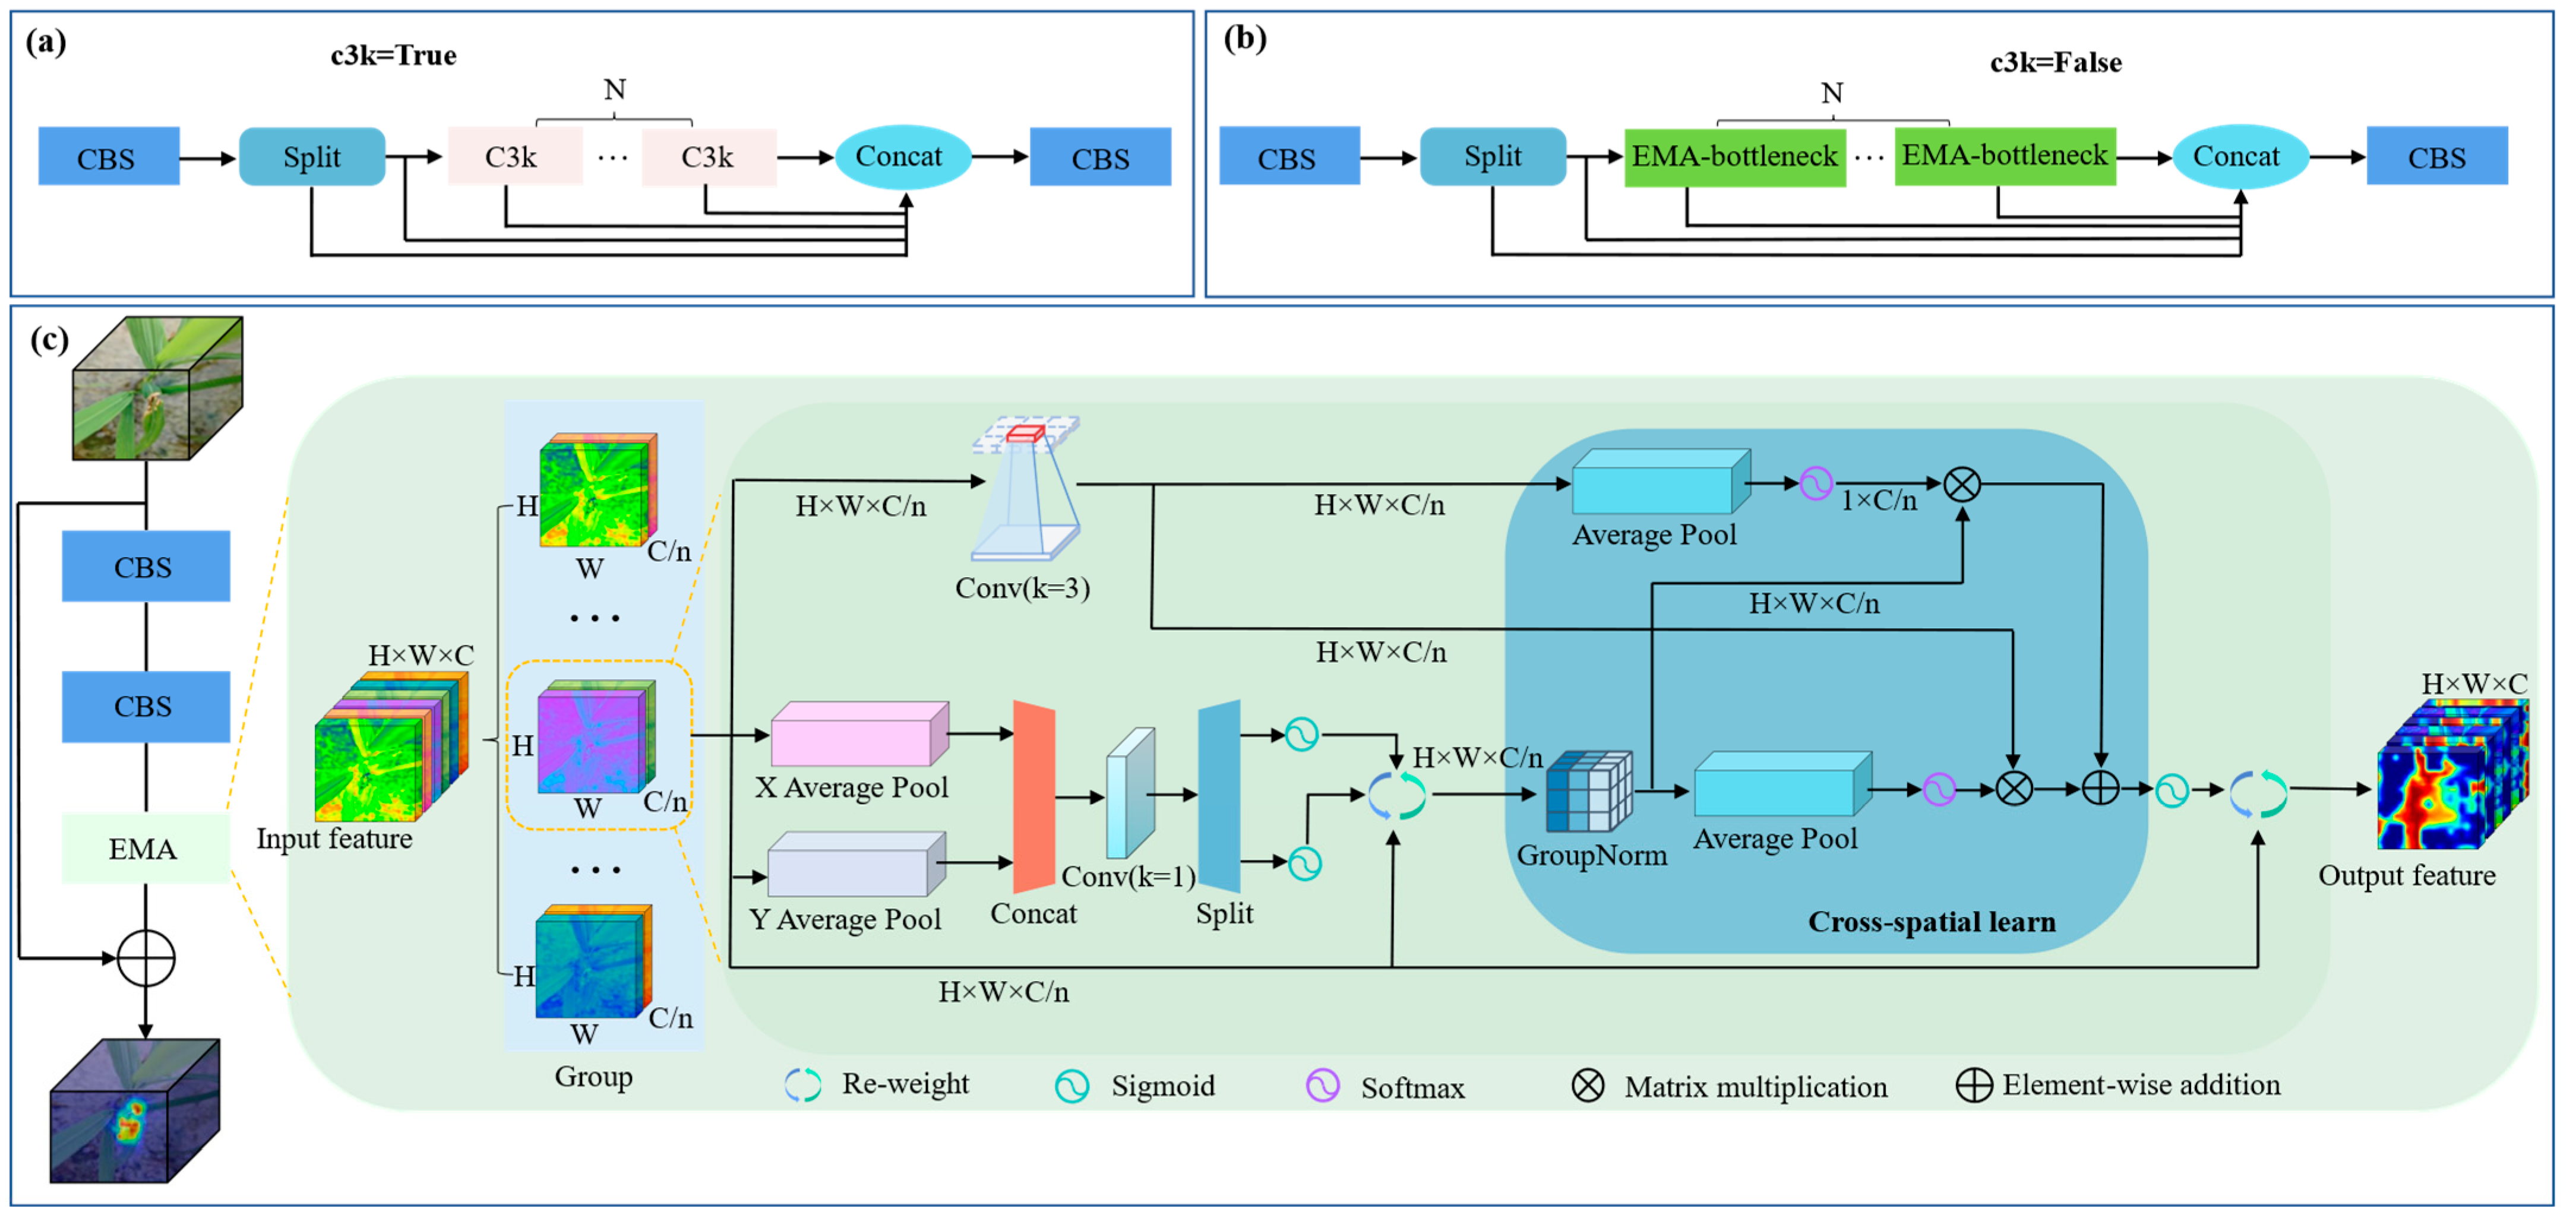
Rice leaf disease detection is challenged by complex backgrounds, illumination variability, and lesion scale differences, which constrain the detection reliability of existing YOLOv11n model. Specifically, when the C3K is False, the original C3K2 module relying on bottleneck blocks shows weak capability in multi-scale detailed features. To overcome this limitation, we designed the EMA-C3K2 module, which incorporates EMA into the bottleneck of C3K2 to strengthen feature representation. The EMA-C3K2 module is integrated into the shallow C3K2 layers of both the backbone and neck, enhancing the network’s ability to capture multi-scale textures and small-scale lesions on rice leaves, while preserving a lightweight architecture and efficient inference. As shown in Figure 4a, the EMA-C3k2 module retains its original structure when C3K is set to True, while the Bottleneck block is replaced by the EMA-Bottleneck module when C3K is set to False.
The structure of the EMA-Bottleneck is shown in Figure 4b, where the EMA module is applied following the second convolution to adaptively recalibrate feature responses. EMA is a lightweight attention mechanism that preserves channel information while enhancing inter-channel fusion and cross-spatial context modeling, which improves feature representation for complex targets. Given a feature map X R C × H × W , EMA first divides it into n groups X i R C n × H × W , i = 1,2 , , n . This group-wise division allows the module to operate more efficiently and reduces computational overhead. In each group, two complementary branches are employed to extract attention weight descriptors. In the first branch, one-dimensional global average pooling is performed along the horizontal and vertical directions, as defined by the following equations:
z c H H = 1 W 0 i W   x c H , i
z c W W = 1 H 0 j H   x c j , W
where x c denotes the c-th channel of input features.
This process enables the network to model long-range dependencies across both orientations while simultaneously producing precise positional information. The two pooled descriptors are concatenated, fused via a 1 × 1 convolution, split, and passed through a Sigmoid to produce direction-specific attention maps. Then, channel-wise recalibration is achieved by multiplicatively aggregating the two channel attention maps. The second branch employs a 3 × 3 convolution to acquire additional multi-scale features, which enlarges the receptive field. Subsequently, cross-spatial learning is applied to the two parallel branches. Specifically, global average pooling is performed on the outputs of the two branches, which is computed as:
z c = 1 H × W i = 1 H   j = 1 W   x c ( i , j )
Global average pooling reduces the spatial dimensions to extract global contextual features across spatial positions. The pooled features are then passed through a Softmax function to produce global descriptors, which are subsequently used to obtain two spatial attention maps: the global descriptor from the first branch weights the local features of the second branch, while the global descriptor from the second branch weights the local features of the first branch. The two spatial attention maps are summed and passed through a Sigmoid to produce the final adaptive attention weights. Finally, the reweighted group features are reshaped and aggregated to form the enhanced representation X ~ R C × H × W . EMA module integrates group-wise pooling, orientation-aware attention, and bidirectional affinity modeling to enhance feature representation. It enhances the network’s attention to low-level details information, facilitating the learning of task-relevant key features.

2.2.3. GLC-PSA

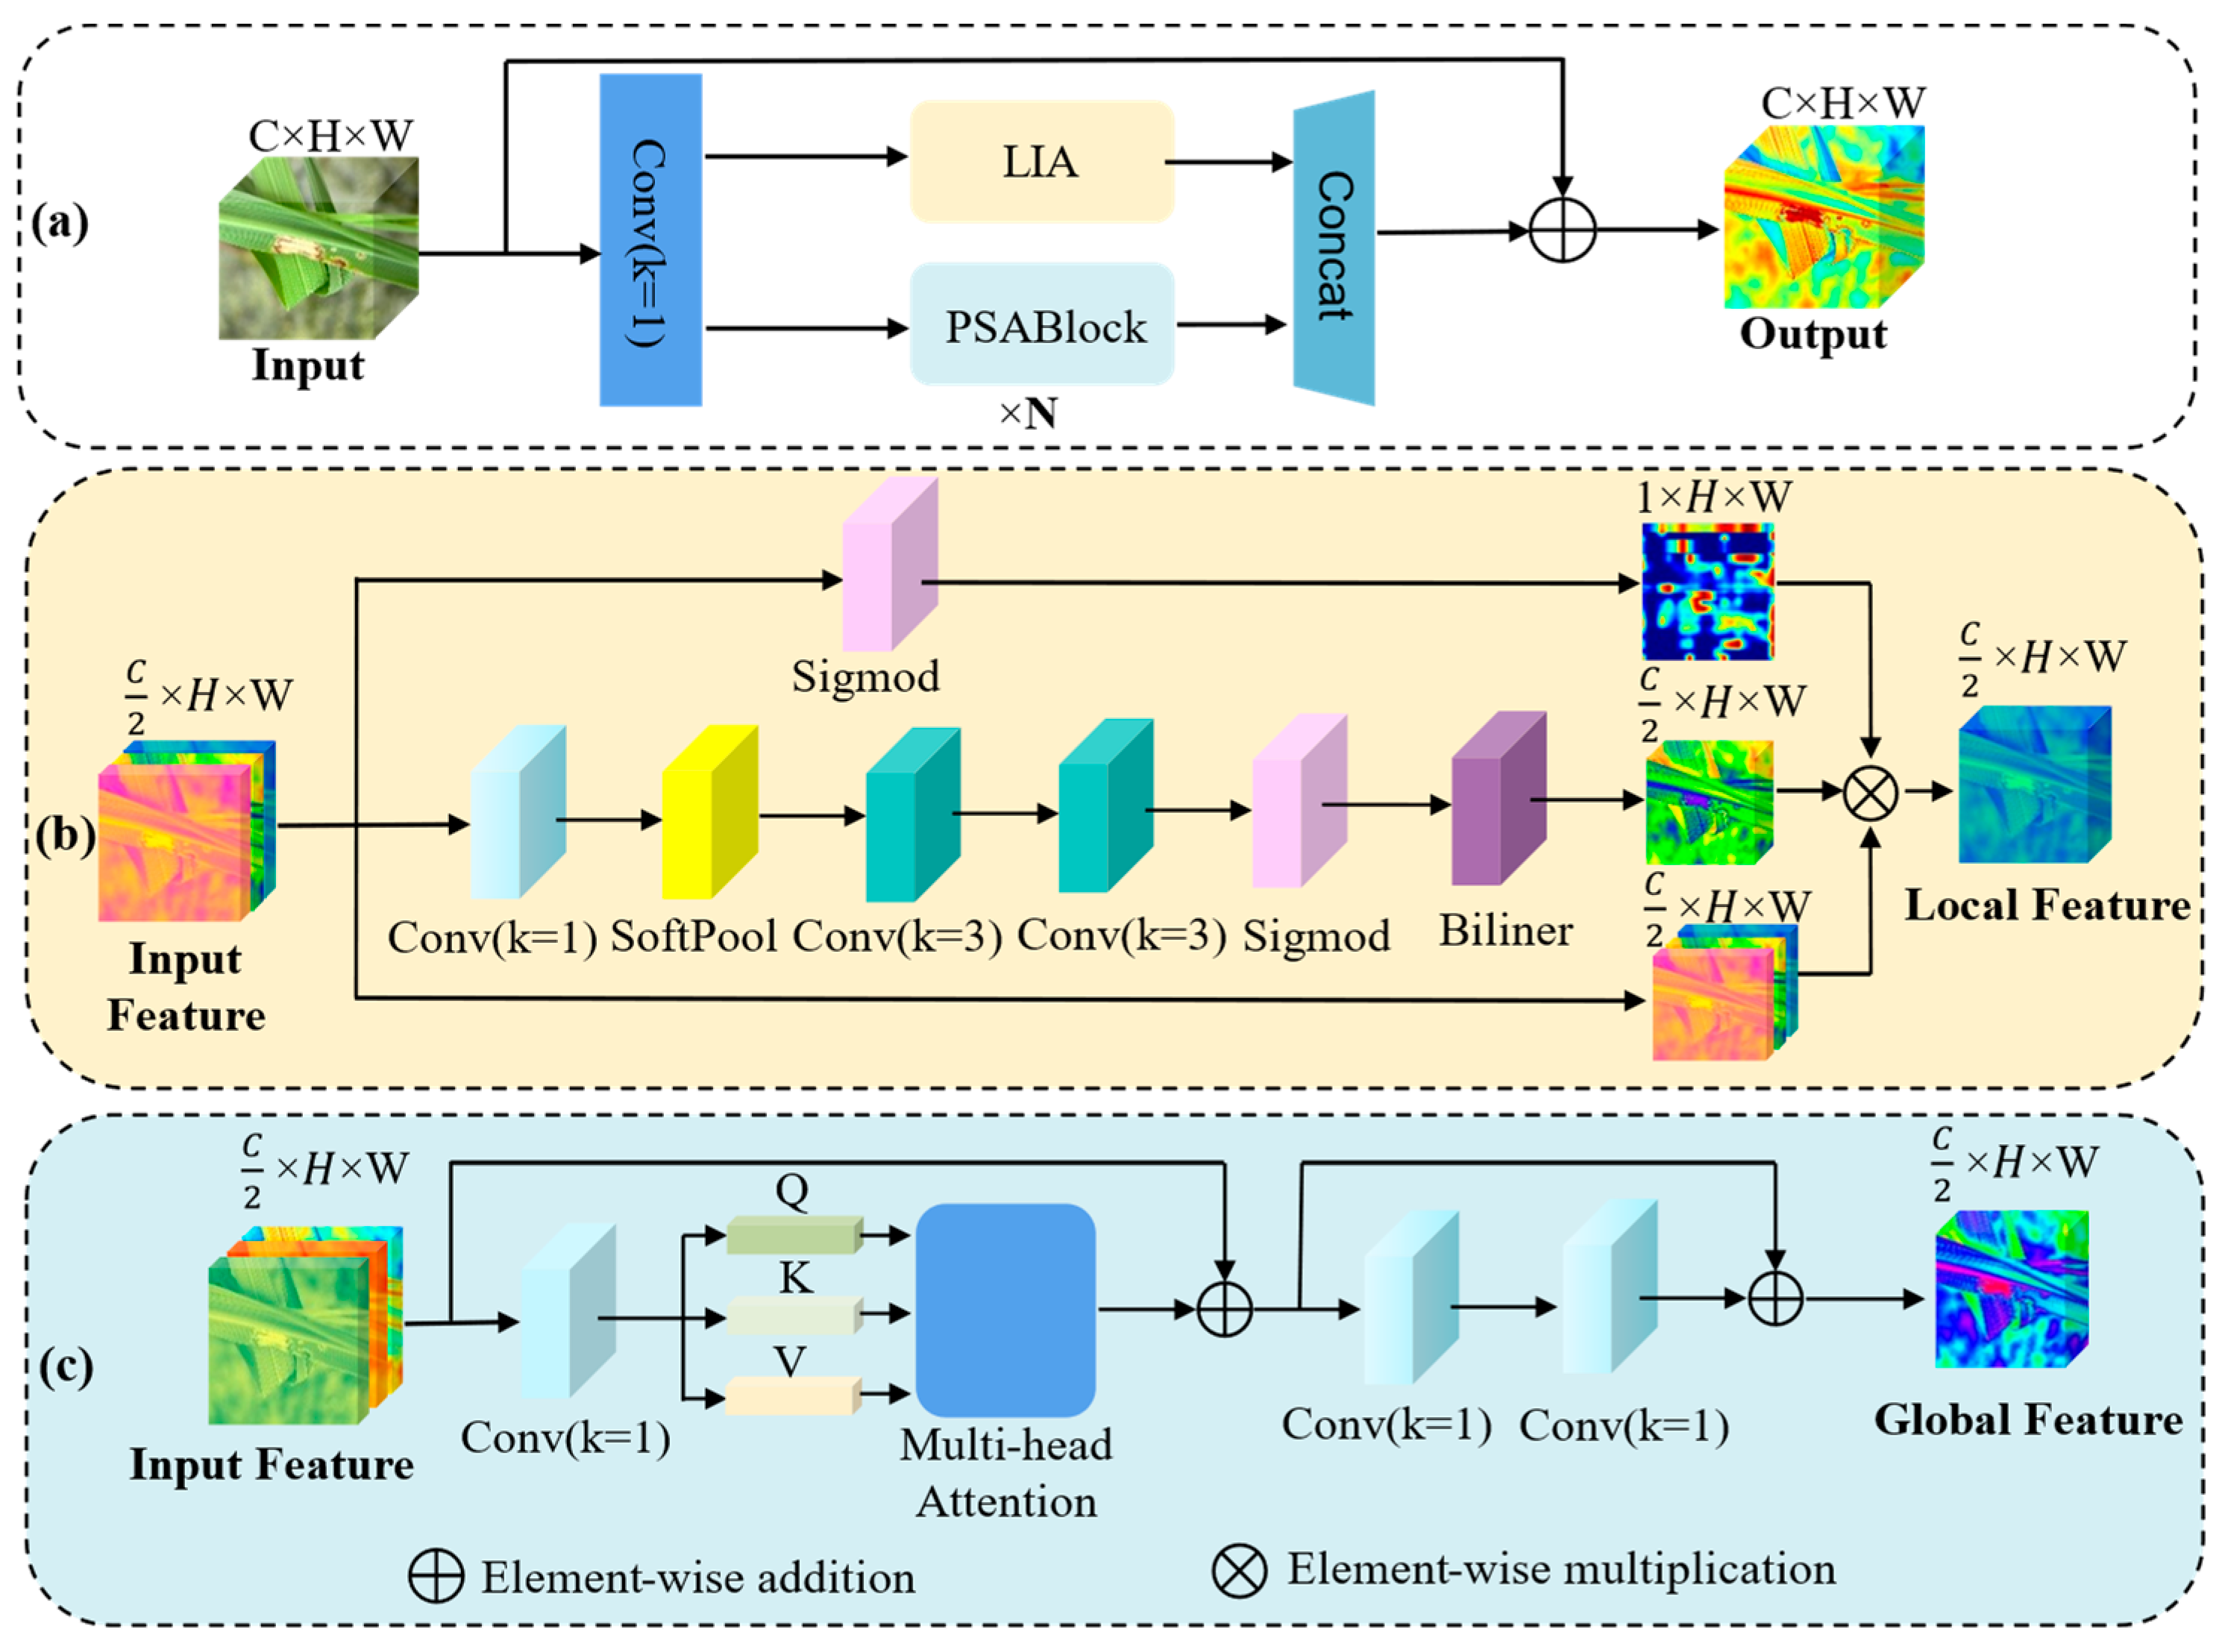
C2PSA is a key feature interaction module in YOLOv11 and employs stacked PSA blocks to maintain global modeling capability while reducing computational overhead. It partitions the input into a residual branch and an attention branch, enabling the preservation of local information while simultaneously modeling global dependencies. However, in the task of rice leaf disease detection, the original local features are insufficient to capture the fine-grained boundary details of lesions. To complement local lesion features, we propose the GLC-PSA module that integrates a Local Interaction Attention (LIA) branch [33] alongside the PSA-based global attention branch. By concatenating and residually fusing the outputs of these two branches, GLC-PSA achieves complementary integration of global and local information, thereby enhancing the perception of lesion boundary features. The structure of GLC-PSA is shown in Figure 5.
For an input feature map X R C × H × W , GLC-PSA first employs a 1 × 1 convolution to compress the channels, yielding a compact representation X ´ R C ´ × H × W . After channel adjustment, the feature X ´ is processed through two complementary branches to extract global and local feature information. The first branch employs N stacked PSABlocks to the projected input feature X ´ to obtain globally enhanced semantic features X g l o b :
X g l o b = P S A B l o c k ( × n ) ( X ´ )
Each PSABlock consists of a multi-head attention and followed by a FFN with residual connections. Stacking multiple PSABlocks allows the model to progressively refine the feature representation by capturing long-range dependencies, thereby effectively enhancing global semantic information.
The second branch employs SoftPool and local convolutions to enhance responses to discriminative regions such as edges and textures, thereby improving the network’s perception of lesion areas on rice leaves. Specifically, the channels of the projected feature X ´ are reduced using a 1 × 1 convolution and processed with SoftPool to emphasize locally salient regions. A stride 3 × 3 convolution is then applied to enlarge the receptive field while reducing computational cost, producing the local importance map I ( X ´ ) :
I ( X ´ ) | x = k R   i R k   e x i j R k   e x j · w k ,
Here, I ( X ´ ) | x is the local importance of pixel x in X ´ , R denotes the neighborhood centered at x, and w is a learnable weight.
Subsequently, a 3 × 3 convolution, followed by a Sigmoid function and bilinear interpolation, are applied to generate normalized weight maps. To mitigate artifacts that may arise from stride convolution and interpolation, a lightweight gating mechanism is introduced, which uses the first channel of the input feature X as the gate signal. Overall, the local attention can be expressed as:
X l o c a l = σ ( X ´ [ 0 ] ) ψ ( σ ( I ( X ´ ) ) ) X ´ ,
Here, σ(·) denotes the Sigmoid function, ψ(·) represents bilinear interpolation, and ⊙ indicates element-wise multiplication.
Finally, the features from the two branches are concatenated and added to the original features, followed by fusion through a 1 × 1 convolution to produce the final output. Compared with the original C2PSA, GLC-PSA enables complementary integration of global modeling and local feature information, thereby enhancing the detection performance for rice leaf diseases.

2.2.4. ATFL

In rice leaf disease detection tasks, an imbalanced ratio of positive to negative samples can cause the cross-entropy loss to be dominated by easily classified examples (e.g., background), which diminishes the contribution of hard-to-classify samples in the loss computation. To address this issue, this work introduces the ATFL [12] to replace the cross-entropy loss. ATFL can dynamically adjusts the weight of each sample based on its classification difficulty. By decoupling easy and hard-to-classify targets, it decreases the influence of easy samples while placing greater emphasis on learning from hard samples. Specifically, samples with predicted probabilities above 0.5 are defined as easy-to-classify, whereas those below 0.5 are regarded as hard-to-classify. The ATFL loss can be expressed as:
A T F L = λ p t l n p t log p t             p t < = 0.5 1 p t l n p ^ c log p t             p t > 0.5
where l n p t and l n p ^ c is adaptive modulation factors for adjust the loss weights of easy and hard samples. p t is the predicted probability corresponding to the ground-truth class, p ^ c denotes the predicted probability of real target, which can be used to mathematically model the training dynamics of the model and can be predicted using exponential smoothing. Its formulation is as follows:
p ^ c = 0.05 × 1 t 1 i = 0 t 1   p i ¯ + 0.95 × p t
where p ^ c is the predicted value in the next epoch, p i ¯ denotes the average predicted probability in each epoch.

2.3. Evaluation Metrics for Model

To comprehensively evaluate the effectiveness of the proposed model, this study conducts assessments from two perspectives: model complexity and detection accuracy. In terms of model complexity, the number of parameters (Params), model size, and computational cost (GFLOPs) are selected as evaluation indicators. For detection accuracy, precision, recall, mAP@50, and mAP@50–95 are selected as evaluation metrics. Precision is the ratio of correctly detected samples to the total detected samples. Recall is the ratio of correctly detected positive samples to the total positive samples in the test dataset. mAP@50 is the mean of average precision values calculated at an IoU threshold of 0.5. mAP@50–95 is the mean average precision across IoU thresholds from 0.5 to 0.95, providing a more comprehensive assessment of detection performance. The formulas for the above metrics are calculated as follows:
P r e c i s i o n ( P ) = T P T P + F P
R e c a l l ( R ) = T P T P + F N
m A P @ 50 = 1 N i = 1 N   A P i
m A P @ 50 95 = 1 N i = 1 N 95   A P j
where TP represents a positive sample correctly predicted as positive. FN represents a positive sample correctly predicted as negative. FP represents a negative sample correctly predicted as positive.

3. Results

3.1. Experimental Design

The experiments in this study were conducted on the following hardware environment: NVIDIA GeForce RTX 2080Ti GPUs, Intel Xeon E5-2680v3 CPU, and 128 GB RAM. The software environment includes python 3.8.20, pytorch 1.8.1, and CUDA 11.1. During training, SGD is adopted to update the model. The initial learning rate, momentum factor, and weight decay coefficient are 0.1, 0.937, and 0.0005, respectively. To ensure sufficient iterations for capturing key features and mitigating underfitting, the model is trained for a total of 200 epochs with a batch size of 32. For consistency in training, the resolution of input image is set to 640 × 640. To ensure consistency and comparability of results, all subsequent experiments are conducted under this experimental environment.

3.2. Comparison of Different Models

To assess the effectiveness of EAG-YOLOv11n for rice disease detection, a comprehensive comparison was performed with Transformer-based model RT-DETR-L [34] and six representative lightweight YOLO models: YOLOv7tiny [35], YOLOv8n [36], YOLOv9n [37], YOLOv10n [38], YOLOv11n [32], and YOLOv12n [39]. The experimental results are summarized in Table 4. Overall, EAG-YOLOv11n outperforms other models across multiple evaluation metrics. It achieves the highest recall of 82.5%, mAP@50 of 87.3% and mAP@50–95 of 52.0%, demonstrating the superiority of EAG-YOLOv11n in the current task.
Among the comparative models, RT-DETR-L achieves a high precision of 90.6% and a relatively high recall of 80.0%, reflecting strong classification confidence in detecting rice leaf disease targets. However, its mAP@50 of 83.1% and mAP@50–95 of 45.7% remain comparatively low, indicating weaker localization accuracy across IoU thresholds. This is likely due to the lesions being generally small, fine-grained, and having blurred boundaries. The global modeling mechanism of the Transformer tends to average local features, which weakens the model’s ability to accurately localize small targets. YOLOv7tiny achieves 89.5% precision but suffers from a sharp drop in recall to 76.6%, indicating a higher rate of missed detections, particularly for small disease regions. YOLOv8n offers a better trade-off between precision at 87.5% and recall at 82.4%, achieving a higher mAP@50–95 of 46.8% compared with YOLOv5n and YOLOv7tiny. YOLOv9tiny achieves the highest mAP@50–95 of 50.2% and a mAP@50 of 86.2% among the comparative models with a small number of parameters. Although its recall of 79.6% is slightly lower than that of YOLOv8n, it demonstrates notable advantages in precision and overall detection accuracy. YOLOv10n exhibits limited capacity, resulting in lower detection accuracy, with only 78.6% mAP@50 and 39.5% mAP@50–95, which restricts its practical applicability. YOLOv11n demonstrates balanced performance, achieving 87.3% precision, 79.9% recall, and 49.1% mAP@50–95 with a low computational cost of 6.3 Gflops. In contrast, YOLOv12n attains highest precision at 90.7% but exhibits a comparatively lower recall of 77.0%. Although it has fewer parameters and lower computational cost than YOLOv11n, it still exhibits notable missed detections in rice leaf disease detection.
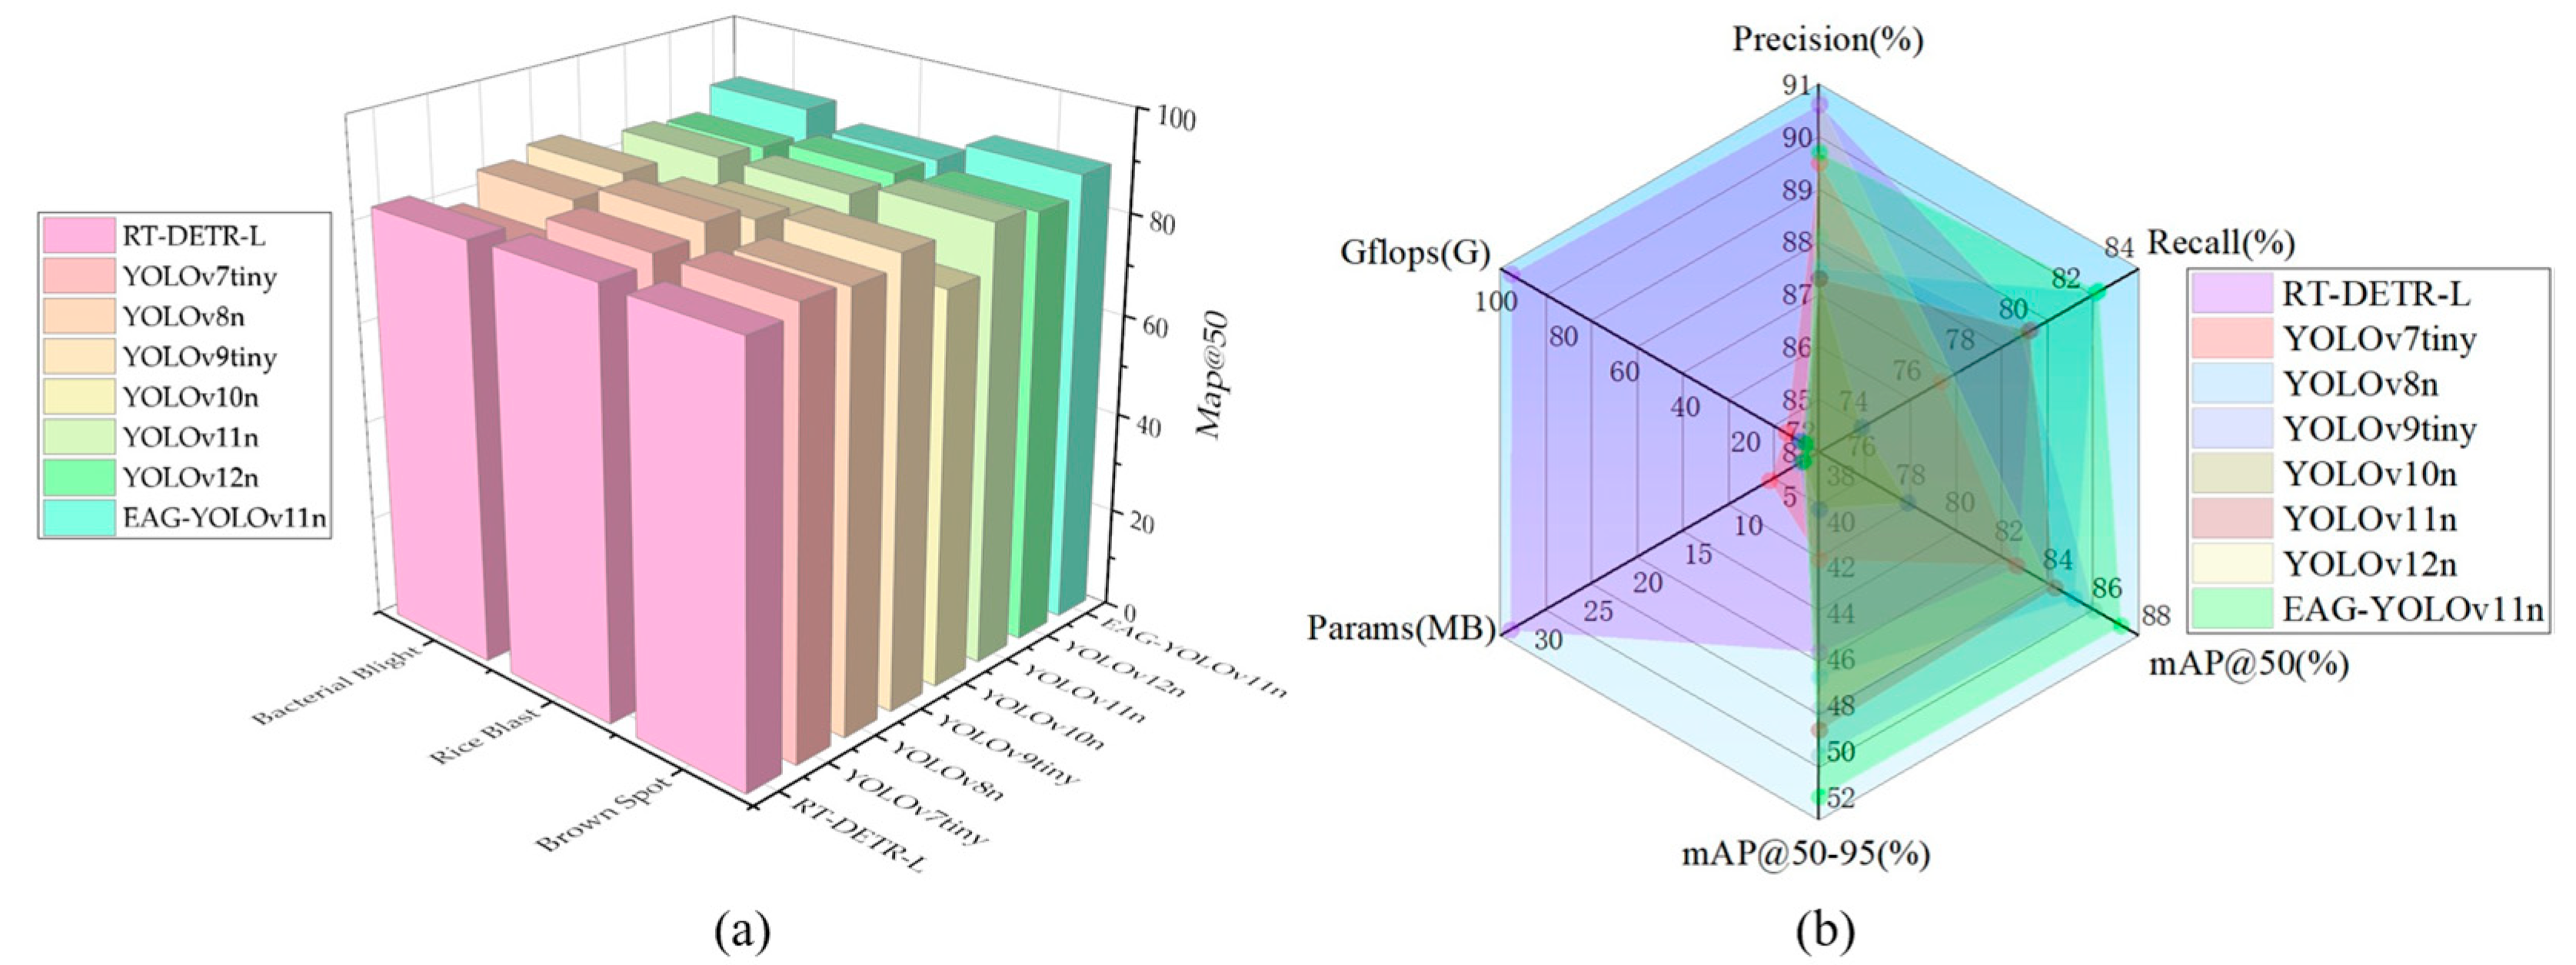
Meanwhile, EAG-YOLOv11n maintains a lightweight design while substantially enhancing detection performance. Its recall improves to 82.5%, representing a 2.6% increase over YOLOv11n, effectively reducing missed detections of small and challenging disease targets. Additionally, mAP@50 and mAP@50–95 rise to 87.3% and 52.0%, respectively, achieving the highest overall accuracy among all compared models while keeping parameters nearly increased. To clearly demonstrate the performance of EAG-YOLOv11n on three different diseases, we employed the mAP@50 metric to conduct a comparative evaluation of various models. As shown in Figure 6a, due to the relatively small number of Rice Blast samples, most models achieve lower detection accuracy for this disease compared with the other two. In contrast, EAG-YOLOv11n exhibits a significantly higher mAP@50 for Brown Spot and Bacterial Blight than the compared models; although its mAP@50 for Rice Blast is not the highest, it still surpasses that of YOLOv11n. These results indicate that the proposed module offers a distinct advantage in modeling features across different rice diseases. In addition, a radar chart is employed to visualize the evaluation metrics of each model, as shown in Figure 6b. The parameter and GFLOPs of RT-DETR-L are considerably larger than those of the YOLO-based methods. Among the YOLO-based models, except for YOLOv7-tiny, which exhibits a substantially higher number of parameters and FLOPs compared to the other counterparts, the remaining models consistently keep their parameter sizes within approximately 2–3M and their FLOPs below 10G. Specifically, EAG-YOLOv11n requires only 0.3G more FLOPs than YOLOv11n, with almost no increase in parameter size. As illustrated in the radar chart, EAG-YOLOv11n achieves broader coverage across the four evaluation metrics while maintaining low parameter size and computational cost, thereby demonstrating an effective trade-off between model performance and complexity.

3.3. Ablation Experiment

To further assess the impact of each module on the model’s performance, a series of ablation experiments were performed on the RLD-3C dataset. As presented in Table 5, the integration of the EMA-C3K2 module results in a precision of 89.1% and a mAP@50 of 86.1%, representing a notable improvement over the baseline. This indicates that embedding EMA into the shallow C3K2 layer enhances feature extraction, particularly for local textures and small-scale lesions. Similarly, the incorporation of the GLC-PSA module achieves balanced improvements, increasing recall to 80.5% and mAP@50 to 86.0%, which confirms its effectiveness in strengthening local feature representation while suppressing background interference. In contrast, the adoption of ATFL decreases precision but increases recall to 83.3%. This result indicates that ATFL enables the model to capture more challenging samples, thereby reducing missed detections and achieving the highest mAP@50 of 86.3% among single-module variants. When combining modules, complementary improvements are observed: EMA-C3K2 with GLC-PSA improves both recall and overall accuracy, while EMA-C3K2 with ATFL enhances precision and recall simultaneously.
When the integration of all three modules, the model attains its optimal overall performance, with precision, recall, mAP@50, and mAP@50–95 reaching 89.7%, 82.5%, 87.3%, and 52.0%, respectively. Compared with the baseline, these improvements are obtained with nearly no increase in parameters, 2.58M compared to 2.58M, and only marginal growth in model size, 5.27 MB compared to 5.25 MB, and computational cost, 6.6 compared to 6.3 GFLOPs, demonstrating that the proposed design attains superior accuracy while preserving lightweight. These results indicate that each module provides a significant contribution, and their combined integration achieves the highest performance improvement.

3.4. EAG-YOLOv11n Detection Results Analysis

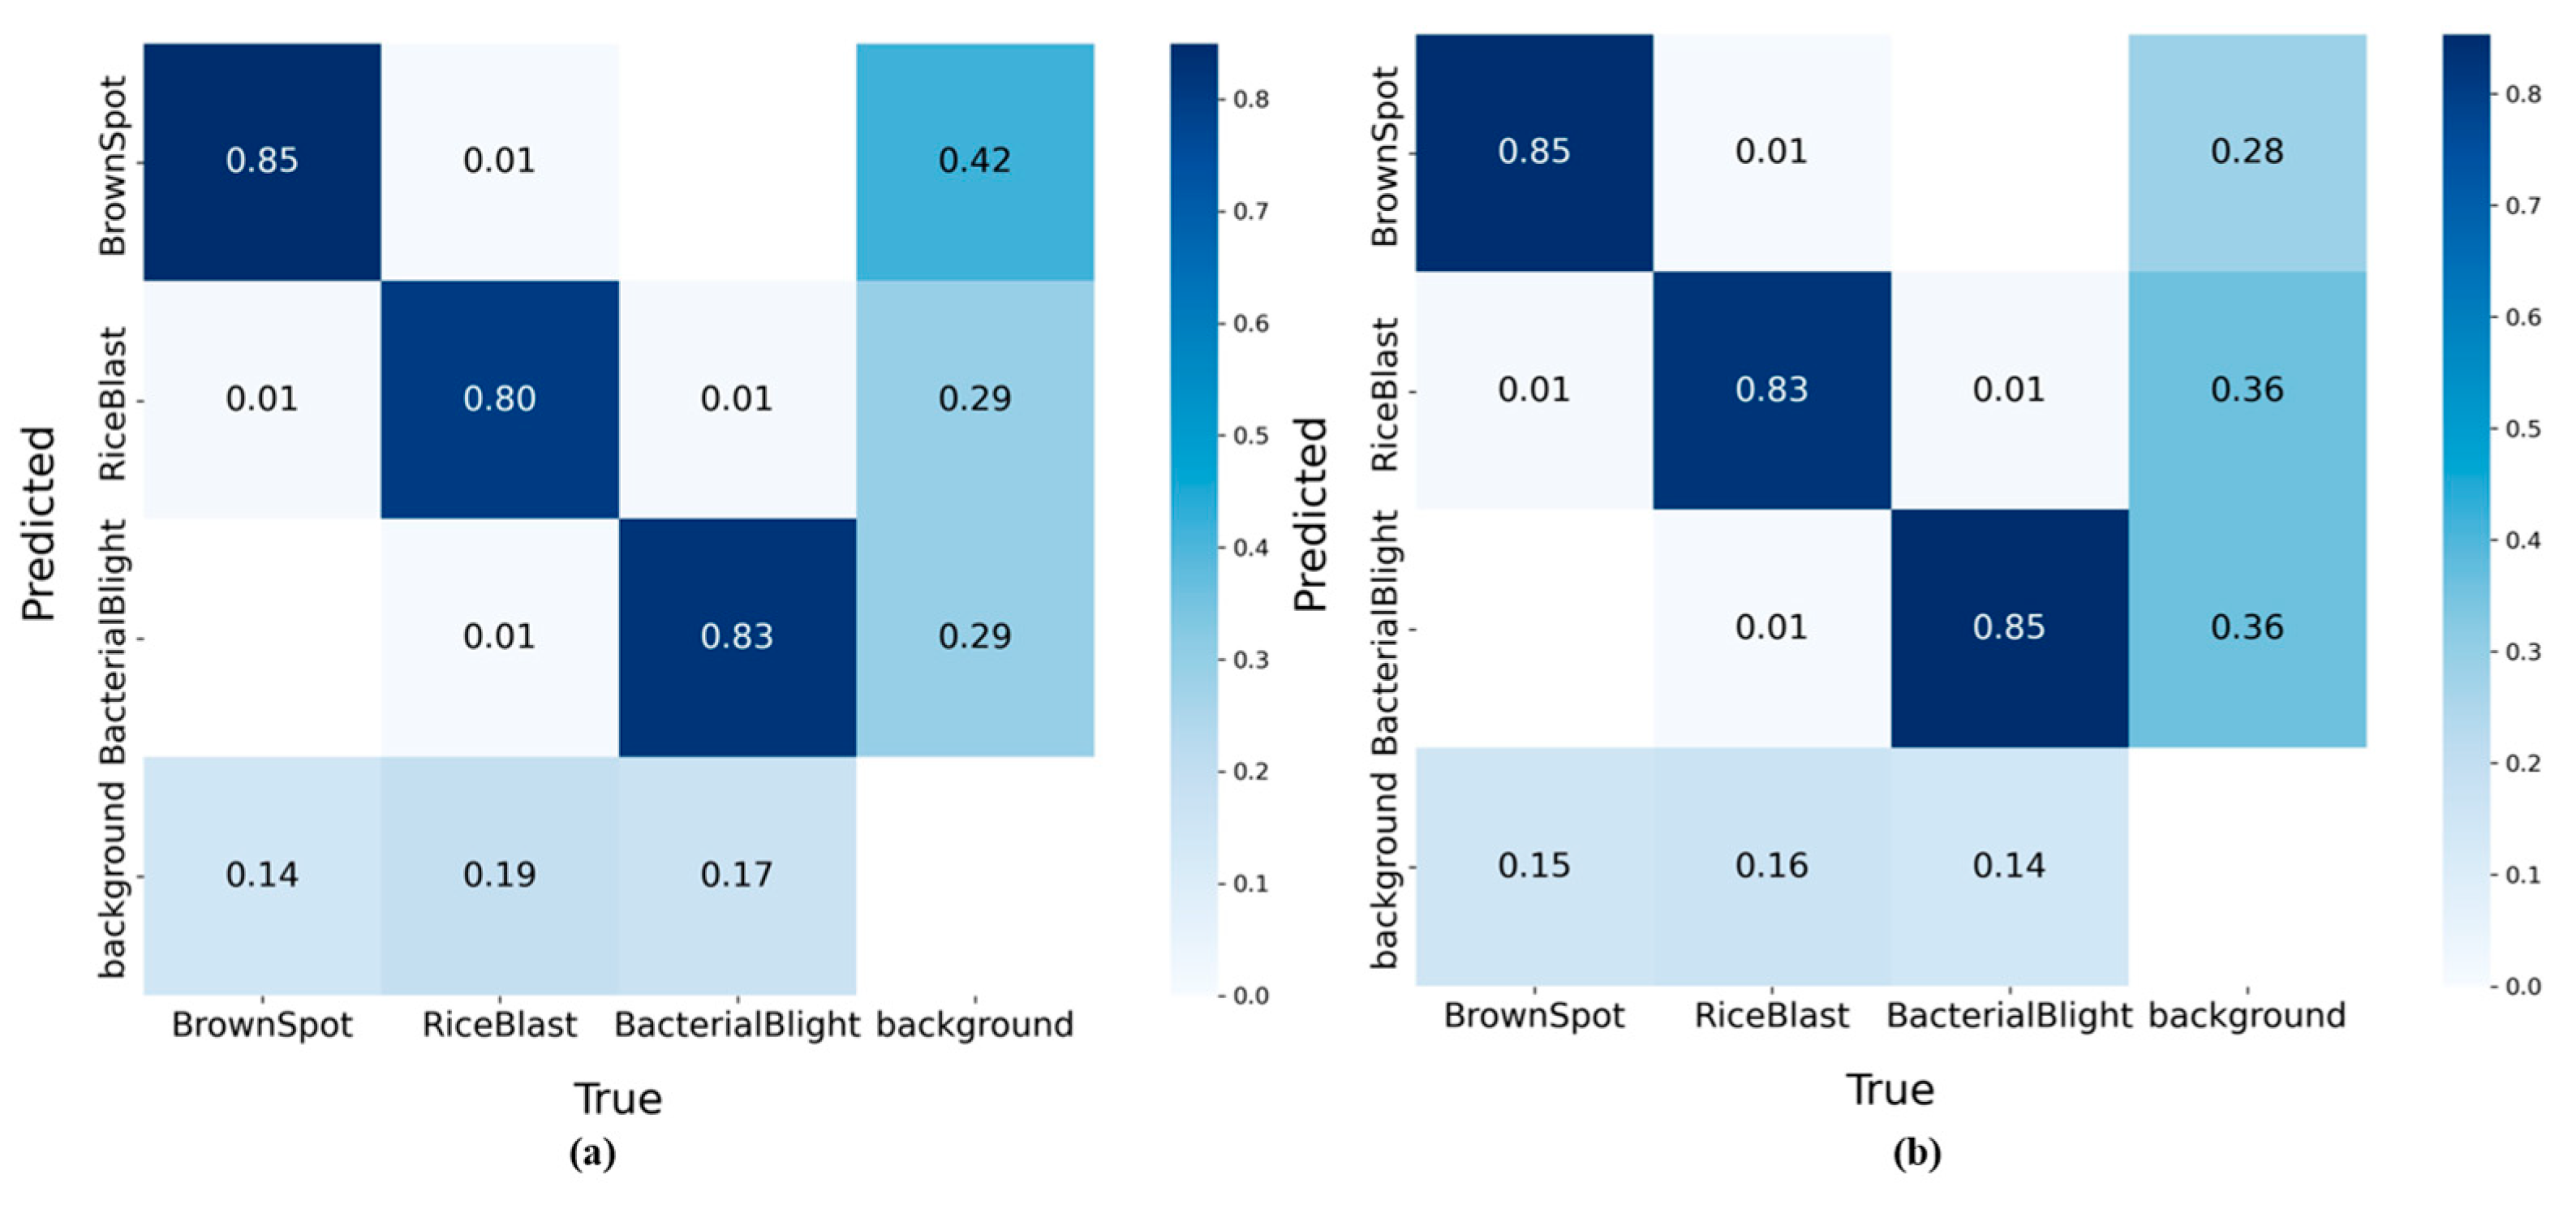
To provide a clear assessment of EAG-YOLOv11n’s discriminative capability across three rice diseases and backgrounds, a confusion matrix is introduced, as shown in Figure 7. For rice blast, the classification accuracy improves from 80% to 83%, with the proportion of instances misclassified as background reduced by 3%, indicating that the model achieves higher accuracy in capturing the key characteristics of this disease. Similarly, the classification accuracy for bacterial blight increases from 83% to 85%, with a 3% reduction in background misclassification. This result further demonstrates the enhanced feature extraction capability of the model. Although the classification accuracy for brown spot remains unchanged, the reduced background confusion demonstrates stronger robustness in suppressing interference from non-target regions. Overall, the background confusion rates for all categories decrease to varying degrees, indicating that EAG-YOLOv11n can not only learn the distinctive characteristics of different diseases but also effectively reduce background interference.
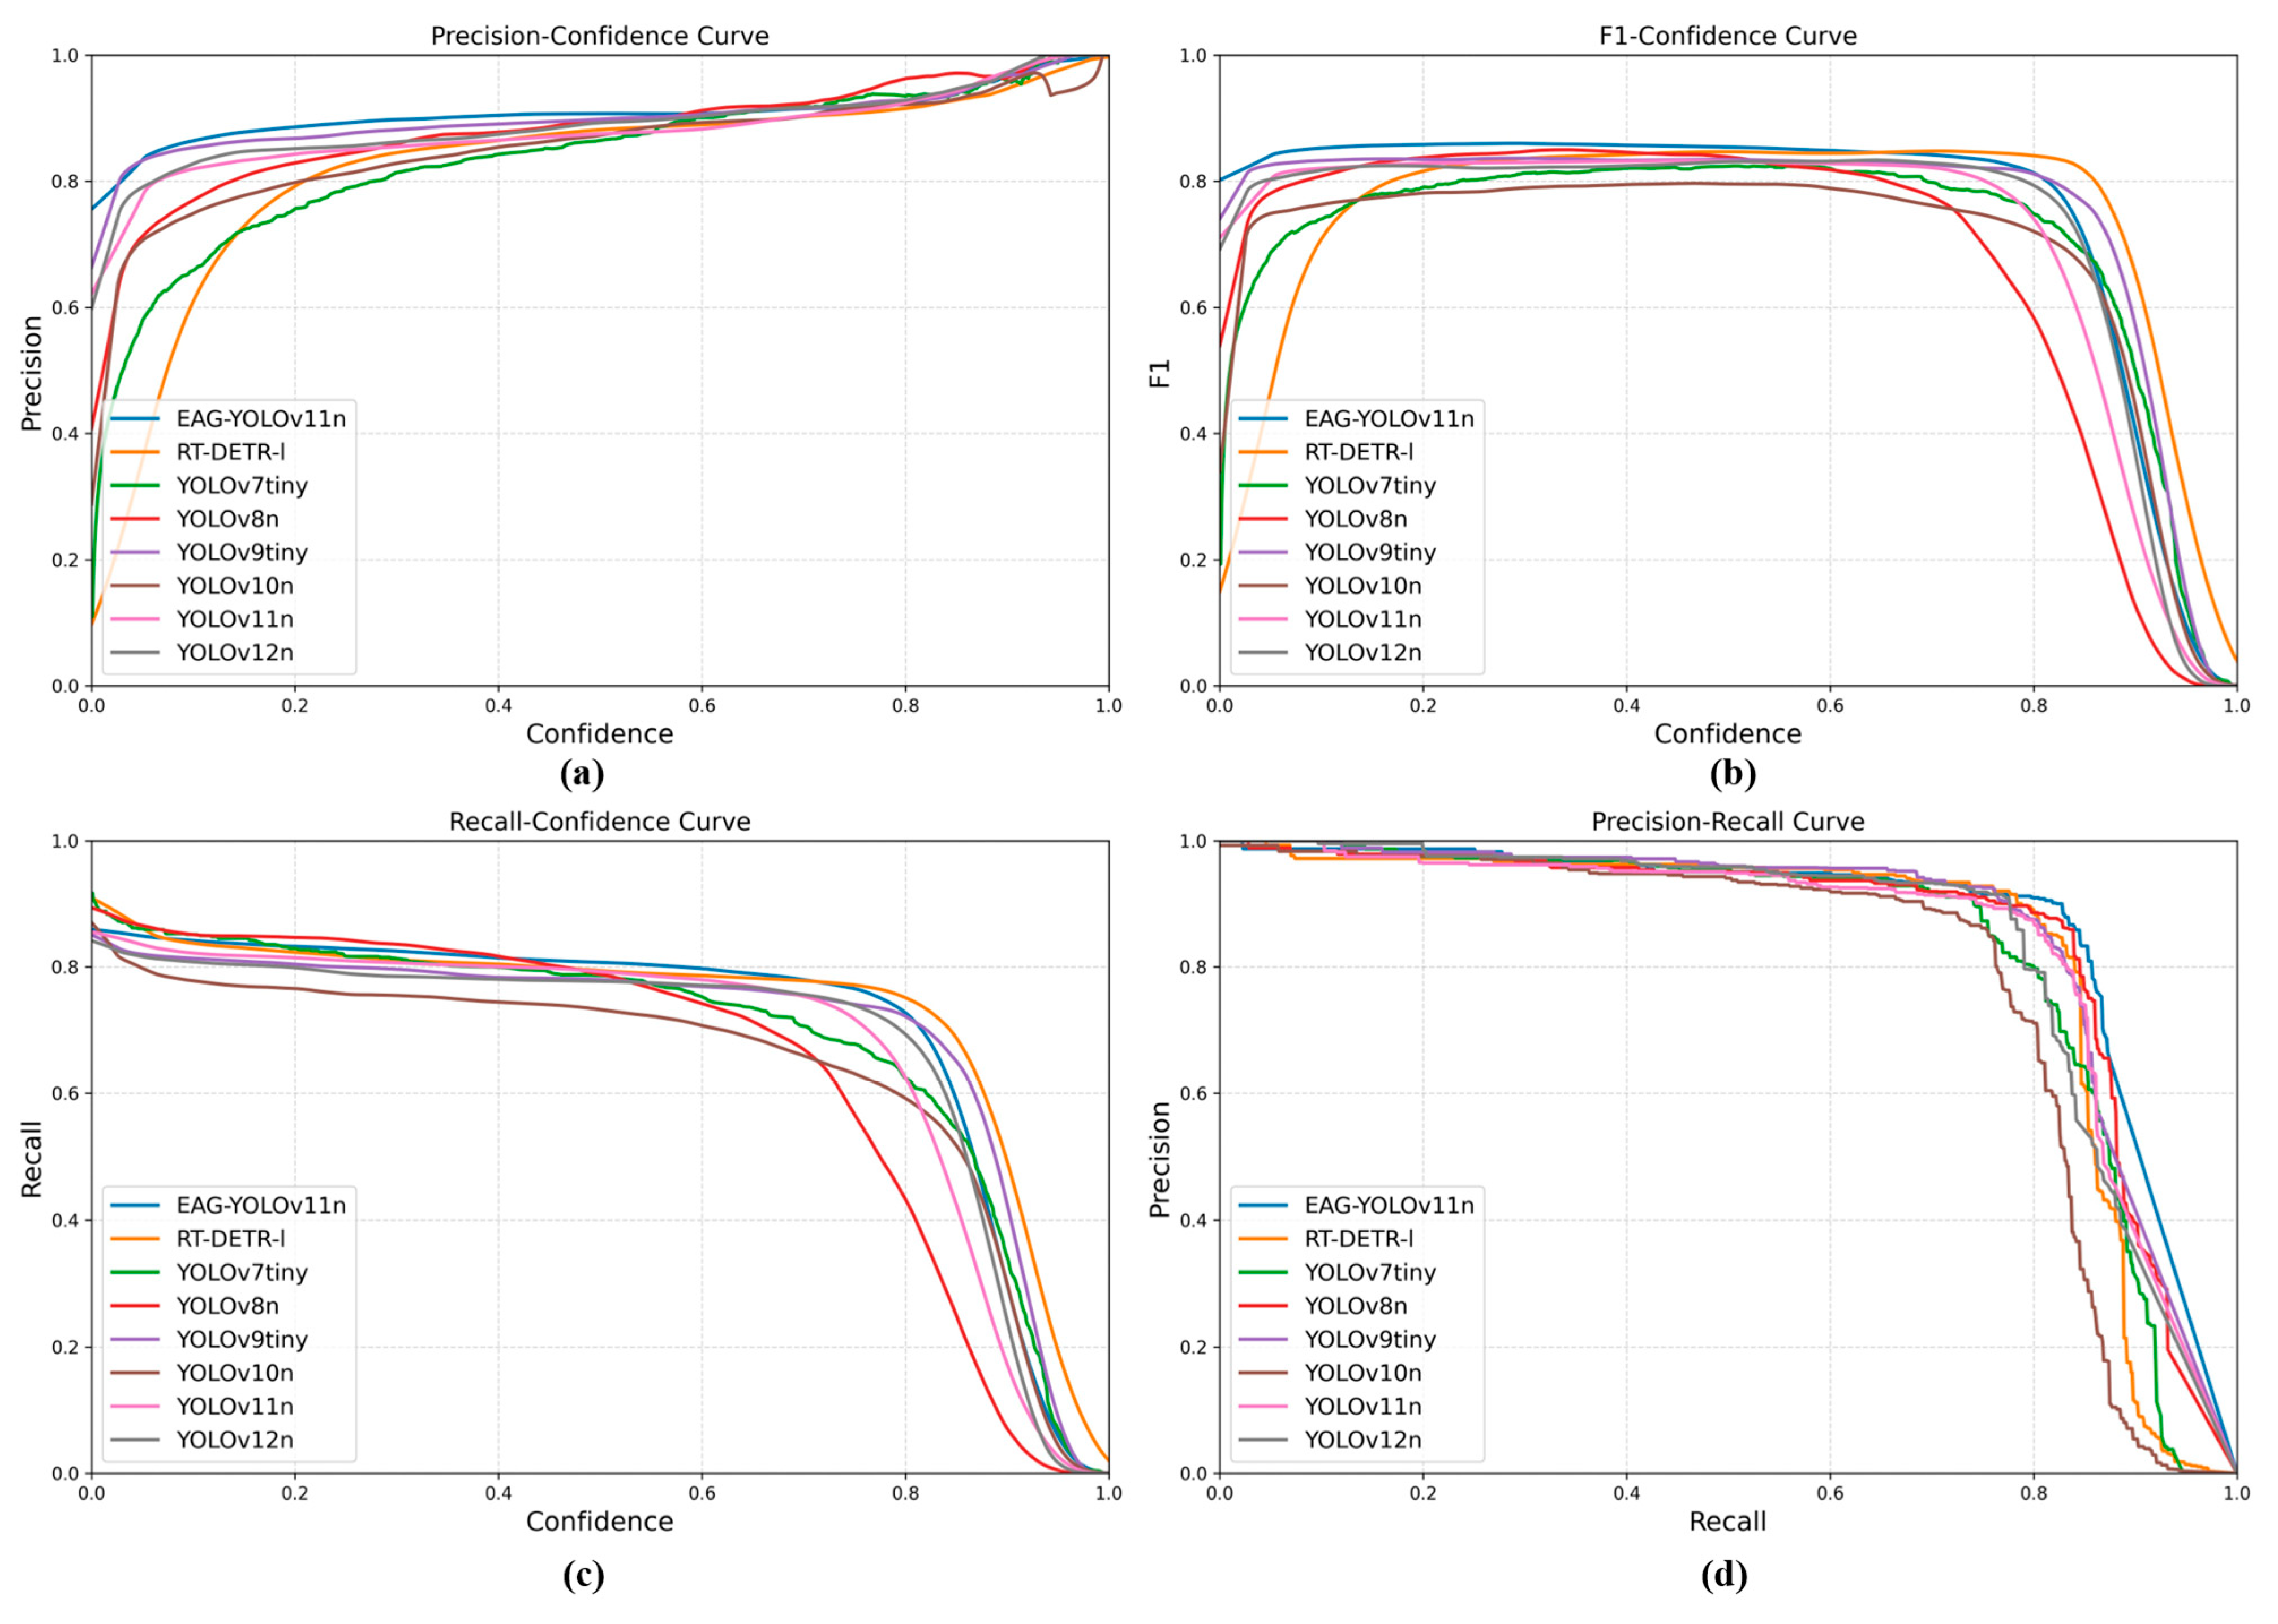
To further evaluate the performance of EAG-YOLOv11n, the F1-Confidence, P-Confidence, R-Confidence, and Precision–Recall curves were compared with those of seven representative models. As illustrated in Figure 8a,b, EAG-YOLOv11n maintains higher and more stable precision and F1-scores across the entire confidence range. Its precision in the low-confidence region is significantly higher than that of other models, indicating stronger robustness against false positives; meanwhile, the curve remains smooth in the high-confidence region, reflecting the stability and consistency of the prediction results. As shown in Figure 8c, EAG-YOLOv11n exhibits a relatively gentle decline in recall within the medium-to-high confidence range, indicating stable detection performance across different confidence thresholds. Figure 8d further demonstrates that the precision curve of EAG-YOLOv11n remains above those of other models throughout the recall range. When recall exceeds 0.8, its precision decreases most gradually, indicating superior stability and generalization in balancing precision and recall for the detection of diverse rice leaf disease under complex backgrounds.
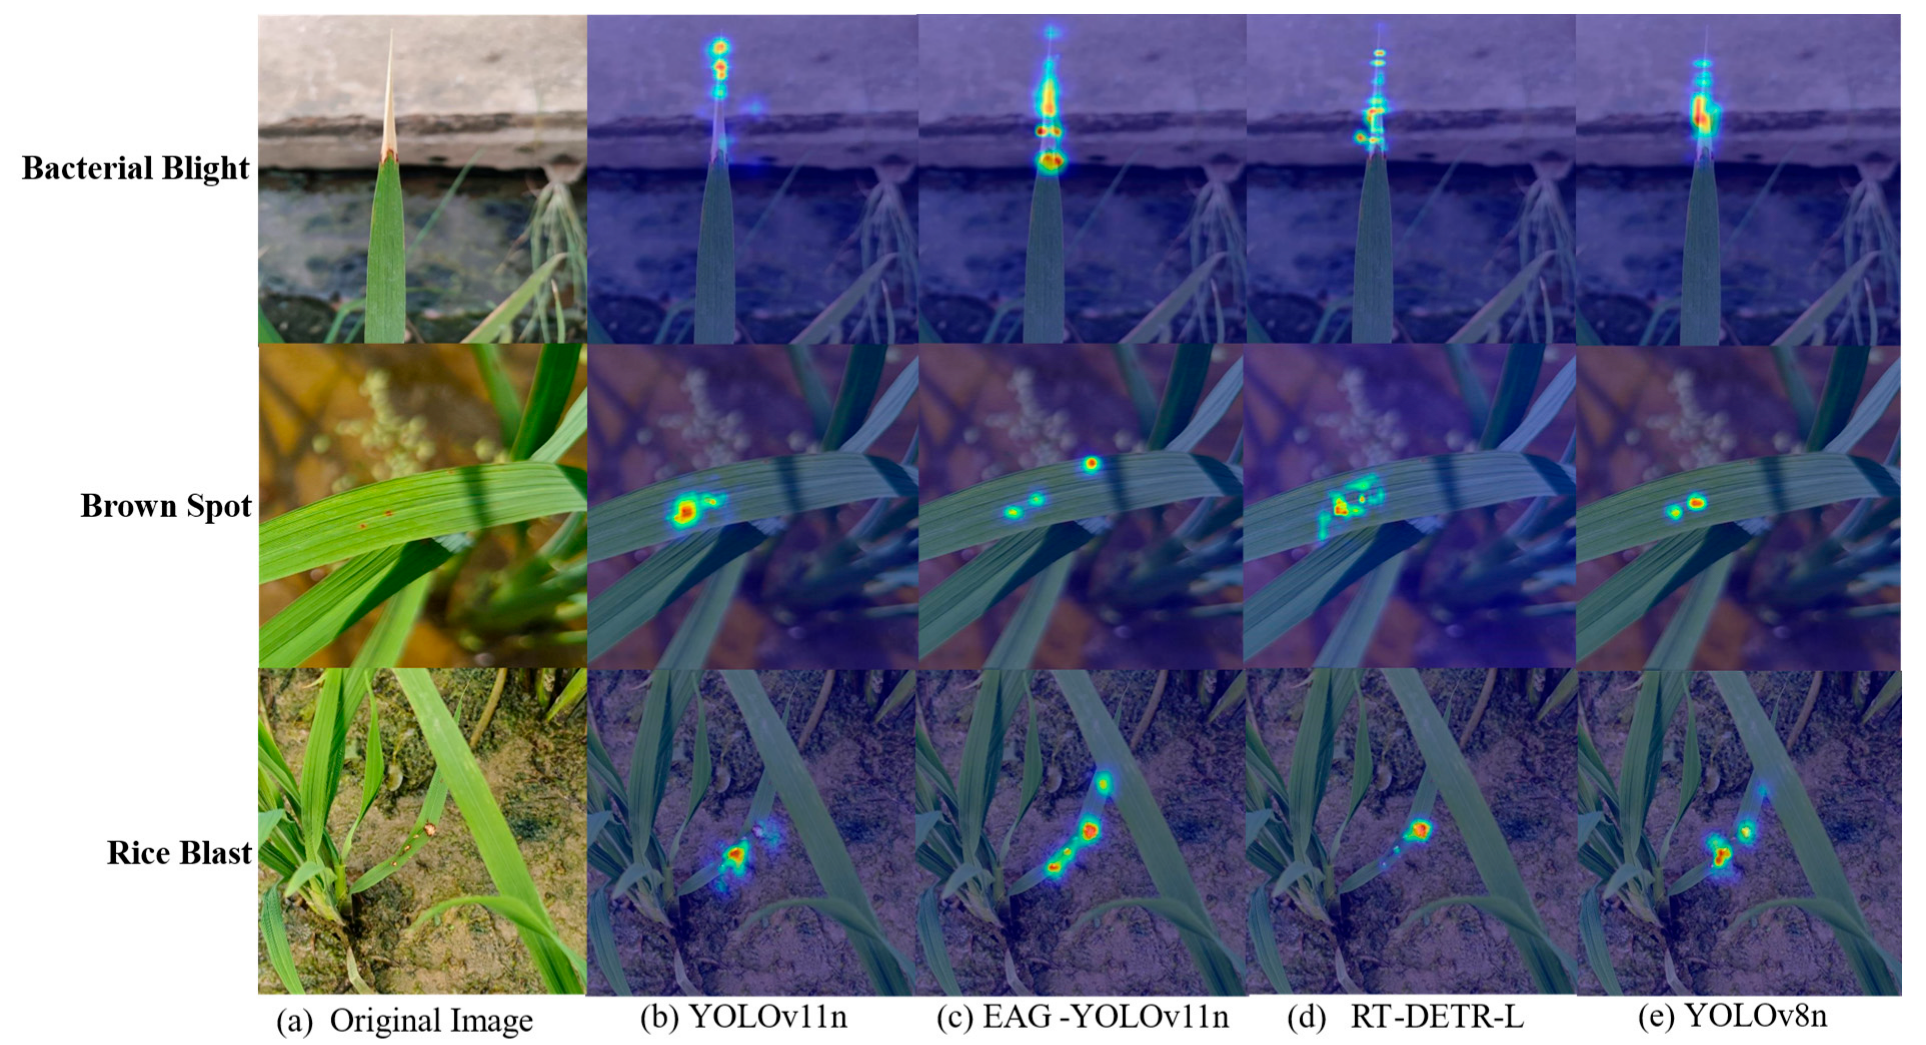
To clearly demonstrate the performance of EAG-YOLOv11n, Heatmap-based visual analysis was conducted on the experimental results. Three representative disease samples were selected, and their original images along with the corresponding heatmaps from four representative models are shown in Figure 9. For bacterial blight, YOLOv11n was able to localize lesion areas but was still affected by background interference. In contrast, EAG-YOLOv11n, RT-DETR-L and YOLOv8n achieved more precise localization of the lesion areas. For brown spot, YOLOv11n, RT-DETR-L, and YOLOv8n effectively perceive the prominent lesion regions but exhibit missed detections for small targets. In contrast, EAG-YOLOv11n not only localizes the obvious lesion areas but also successfully identifies small diseased regions. Similarly, for rice blast under complex backgrounds, EAG-YOLOv11n successfully localized all lesion areas, demonstrating enhanced background suppression and improved robustness.
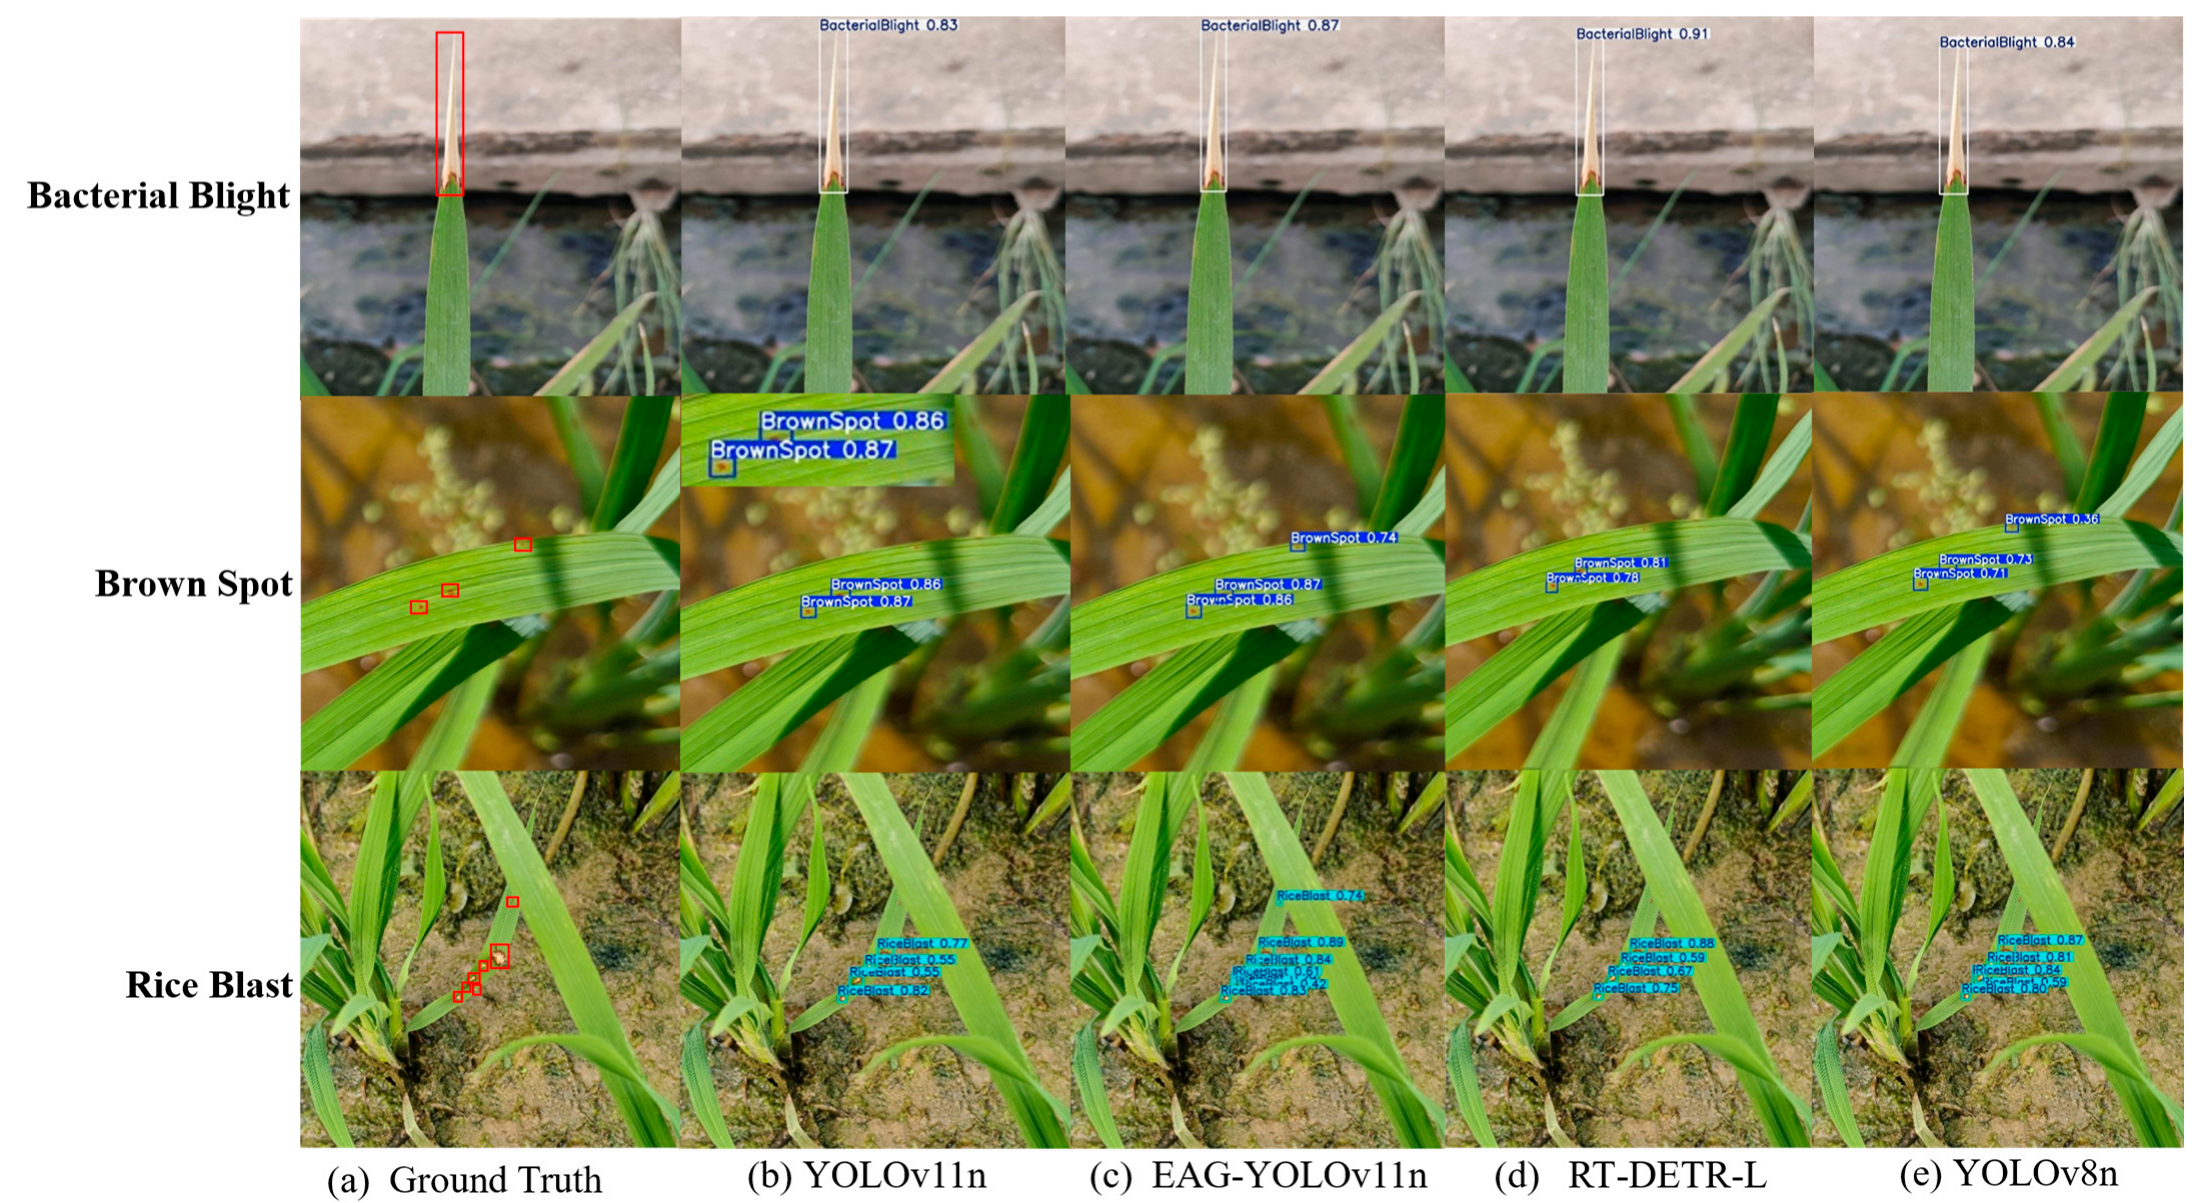
To more intuitively demonstrate the effectiveness of EAG-YOLOv11n on the RLD-3C dataset, three disease images with different detection difficulties were selected to validate EAG-YOLOv11n, YOLOv11n, RT-DETR-L, and YOLOv8n. The results are shown in Figure 10. For disease regions with clearly defined bacterial blight areas, all four models accurately performed localization. The confidence score of RT-DETR-L reached 91%, which is higher than that of EAG-YOLOv11n, indicating that RT-DETR-L exhibits better classification performance, especially for simpler tasks. For the detection of complex brown spot disease, RT-DETR-L and YOLOv11n exhibited missed detections. Although YOLOv8n successfully detected all diseased regions, its confidence scores were significantly lower than those of EAG-YOLOv11n. In the rice blast detection task, EAG-YOLOv11n successfully detected all diseased regions, achieving higher confidence scores than the three comparison models. Overall, EAG-YOLOv11n exhibited superior detection accuracy and robustness across multiple disease types and complex scenarios, confirming its effectiveness.

3.5. Five-Fold Cross-Validation Experiment

To evaluate the robustness and generalization capability of EAG-YOLOv11n, a five-fold cross-validation was performed on RLD-3C, and the results are shown in Table 6. Compared with YOLOv11n, EAG-YOLOv11n achieved higher precision of 89.96 ± 1.24%, recall of 81.64 ± 0.92%, mAP@50 of 87.28 ± 0.30%, and mAP@50–95 of 51.92 ± 0.45%. Except for the standard deviation of precision, which fluctuates by more than 1%, the standard deviations across all other metrics remain relatively small. These experimental results indicate that EAG-YOLOv11n maintains consistent performance across different folds, demonstrating its stability and reliability in disease detection tasks.
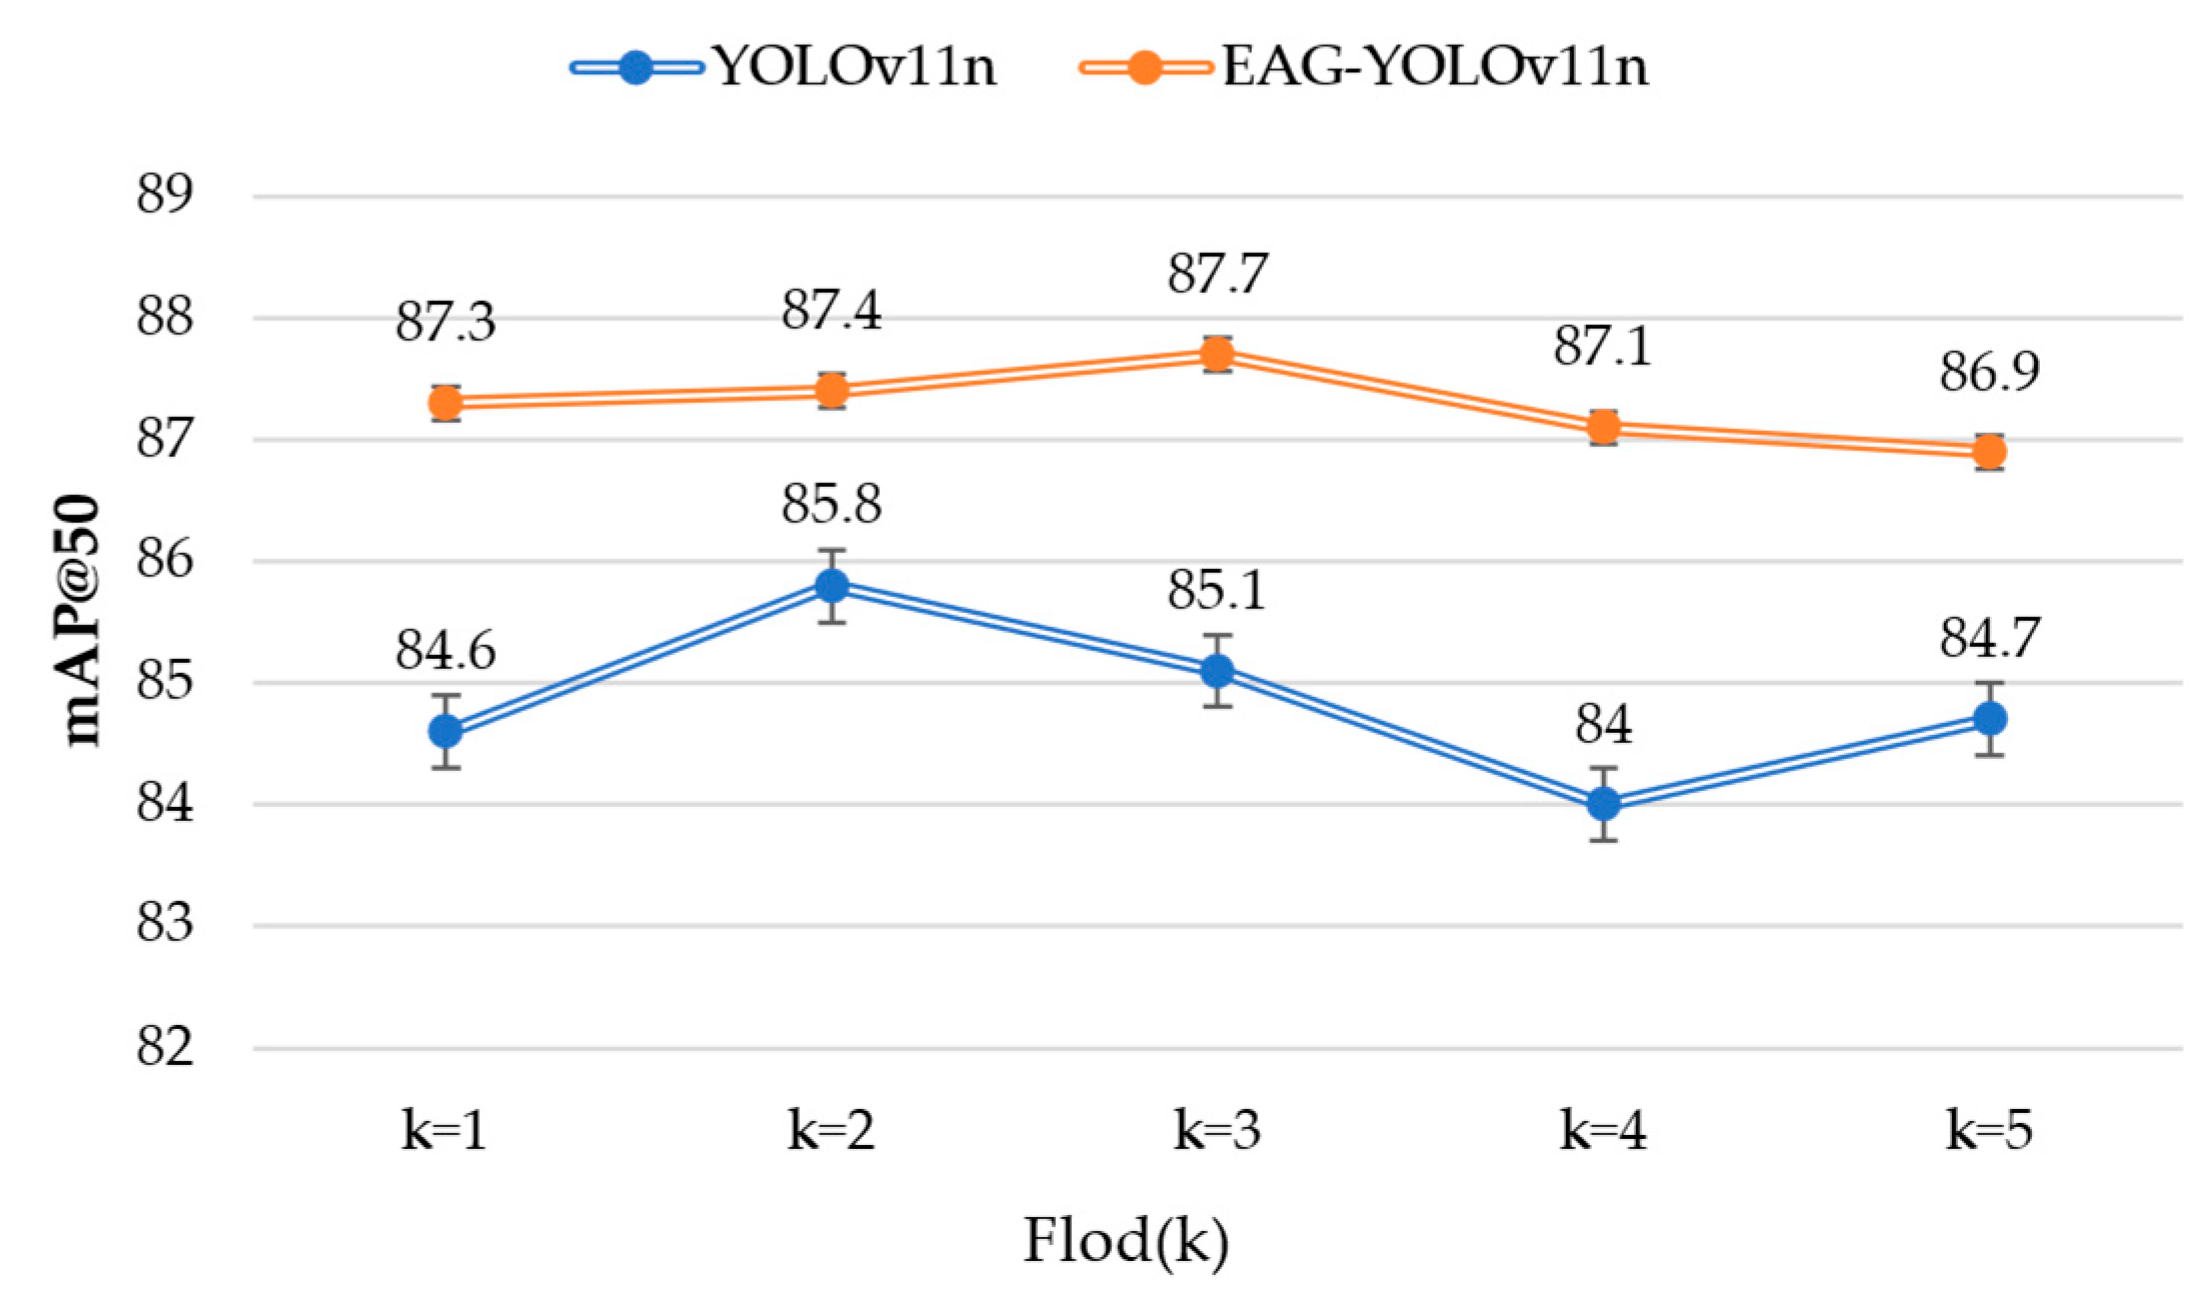
In addition, the mAP@50 results of EAG-YOLOv11n and YOLOv11n across different cross-validation folds are presented in Figure 11. Although the random partitioning of the dataset introduces variations in model performance, the mAP@50 of EAG-YOLOv11n varies within the range of 86.9% to 87.7%, whereas that of YOLOv11n ranges from 84.0% to 85.8%. Nevertheless, the mAP@50 of EAG-YOLOv11n consistently exceeds that of YOLOv11n, thereby further validating the effectiveness of the proposed enhancements.

4. Discussion

4.1. Key Contributions and Advantage

This study tackles several key challenges in rice leaf disease detection under field conditions, including background interference, large variations in lesion scale, sample imbalance, and the balance between model performance and complexity. To address these issues, an EMA module is integrated into the shallow C3K2 layers, enhancing the network’s sensitivity to shallow features such as color and texture. A Global–Local Complementary PSA (GLC-PSA) attention module is designed to effectively suppress background interference by combining global and local contextual information. In addition, ATFL is introduced to improve the network’s learning on challenging or underrepresented samples. Finally, a dedicated dataset RLD-3C containing three types of rice leaf diseases is constructed, providing a benchmark to assess the effectiveness and practical applicability of EAG-YOLOv11n.
Compared with mainstream lightweight YOLO models, EAG-YOLOv11n demonstrates significant advantages in both performance and model complexity. It achieves a recall of 82.5%, mAP@50 of 87.3%, and mAP@50–95 of 52.0%, effectively reducing missed detections of small disease. Correspondingly, YOLOv5n achieves a recall of 80.6% and a mAP@50–95 of 43.9%, reflecting relatively lower overall performance. Although YOLOv7tiny attains a high precision of 89.5%, its recall is only 76.6% and mAP@50–95 is 41.7%, indicating a higher rate of missed detections for small and challenging lesions. In comparison with YOLOv8n, EAG-YOLOv11n improves precision, mAP@50, and mAP@50–95 by 2.2%, 1.9%, and 5.2%, respectively, demonstrating its superior robustness in accurately detecting lesions across different scales and complex scenarios. Compared with YOLOv9tiny, EAG-YOLOv11n increases the number of parameters by only 0.71M while reducing GFLOPs by 0.5G. Its recall, mAP@50, and mAP@50–95 improve by 2.9%, 1.1%, and 1.8%, respectively, demonstrating a better balance between detection performance and model complexity. YOLOv10n exhibits limited overall detection capability, with a recall of only 73.6% and mAP@50–95 of 39.5%. Although YOLOv12n achieves high precision of 90.7%, its recall is only 77.0%, and mAP@50 and mAP@50–95 reach 84.4% and 48.2%, respectively. Compared with RT-DETR-L, EAG-YOLOv11n achieves higher detection accuracy and maintains an optimal balance between precision and model complexity.
In addition to outperforming mainstream YOLO models, EAG-YOLOv11n also demonstrates competitive advantages compared with other recently improved YOLO-based architectures designed for specific crops. For example, ESM-YOLOv11 [22] integrates EMA attention, Slim-neck and the MPDIoU loss to improve YOLOv11 for detecting a single dense peanut leaf disease, achieving 2.48M parameters, 5.80 GFLOPs, and an mAP of 96.90%. These results demonstrate strong performance; however, the model is primarily validated in tightly controlled conditions characterized by a single disease category and spatially clustered lesions, which may affect its direct transferability to multi-class field environments. By contrast, EAG-YOLOv11n is designed to enhance lesion perception in more complex field conditions involving three rice leaf diseases with irregular lesion distributions and background interference, while maintaining a lightweight structure with 2.58M parameters and 6.6 GFLOPs. Similarly, Pyramid-YOLOv8 [21] employs a multi-attention fusion mechanism and a C2F-Pyramid module within the YOLOv8x framework to detect rice blast, achieving an mAP of 84.3%. Nevertheless, this performance is obtained at the cost of a substantially larger model size with 42.0M parameters and a computational complexity of 196.2 GFLOPs, which may limits its applicability to real-time scenarios on resource-constrained devices. In comparison, EAG-YOLOv11n achieves a comparable mAP@50 of 87.3% with less than 1/15 of the parameters and approximately 1/30 of the GFLOPs, indicating better suitability for deployment in mobile or edge-based agricultural monitoring systems.
In summary, EGA-YOLOv11n achieves high detection accuracy while maintaining a lightweight structure and strong adaptability for real-world deployment. The model can automatically and accurately identify three major rice leaf diseases—bacterial leaf blight, leaf blast, and brown spot—from field images, supporting early warning, precision spraying, and smart agricultural monitoring through integration with drones, mobile devices, and IoT platforms. Although chemical pesticide application remains a common practice in rice disease management, early and accurate detection is essential for optimizing pesticide use, reducing unnecessary chemical inputs, and minimizing environmental impact. Therefore, the proposed model provides not only a reliable visual detection framework but also a practical and sustainable solution that can be readily applied in intelligent and precision agriculture.

4.2. Future Improvement for EAG-YOLOv11n

Although this study has made progress in rice leaf diseases detection, several limitations remain to be addressed. To begin with, the performance of model is highly dependent on the scale and quality of the dataset, which restricts its applicability in scenarios with limited samples or non-uniform data distribution. In addition, the RLD-3C dataset used in this study was entirely collected from the experimental fields of the Hunan Academy of Agricultural Sciences between May and late July 2025, resulting in a relatively homogeneous data source. Variations in rice growth environments (e.g., farm locations), collection periods (e.g., different seasons), and imaging devices may cause shifts in feature distributions, thereby limiting the model’s generalization capability under diverse environmental conditions. Furthermore, the current framework relies solely on visible light imagery, which is susceptible to illumination fluctuations and background noise, potentially leading to misclassification in complex field scenarios. Finally, the current model is limited to identifying diseased areas without distinguishing the developmental stages of diseases or offering further diagnostic insights. In practical applications, different disease stages have varying impacts on crop growth, and thus mere detection remains inadequate.
To alleviate the influence of dataset limitations on model performance, future work will employ strategies such as data augmentation, semi-supervised learning, and diffusion-based data generation to mitigate the challenges of insufficient training samples and imbalanced data distribution, thereby enhancing the model’s adaptability and robustness in real-world scenarios. In addition, domain adaptation techniques are employed, and diverse multi-source, multi-scene datasets are constructed to enhance the model’s generalization across different crops, environments, and acquisition conditions. Given that visible light imagery offers limited spectral information, resulting in reduced feature discrimination under complex illumination and background variations, future work will explore multimodal fusion approaches. The integration of hyperspectral imaging is expected to provide richer physiological and biochemical cues (e.g., chlorophyll variations), thus improving disease characterization accuracy and model generalization. To further enhance diagnostic capability, future research will collect and analyze image data over time for dynamic monitoring of disease progression. In addition, future work can integrate large language models to interpret detection results and perform knowledge reasoning, providing farmers with targeted management and control recommendations, enhancing the model’s applicability in agricultural production. Finally, future research will focus on the lightweight optimization of the model to improve inference speed and hardware adaptability. This improvement will facilitate the deployment of EGA-YOLOv11n on field monitoring cameras and farmers’ smartphones, enabling the construction of an agricultural integrated system. The system combines remote intelligent real-time monitoring with on-site image recognition, which is expected to significantly enhance the timeliness and practicality of disease detection and provide more efficient technical support for the precise prevention and control of rice diseases.
5. Conclusions

To achieve precise and efficient detection of rice leaf diseases, this paper proposes an efficient attention-guided disease detection method, EAG-YOLOv11n. Specifically, EMA is integrated into the shallow C3K2 layers of the backbone and neck in YOLOv11n to improve the overall feature extraction ability of the network. EMA improves the network’s perception of local texture and scale variations in diseases while reducing the loss of small-target information during deep-layer propagation. In addition, a global local complementary attention module GLC-PSA is designed, which integrates global and local information in a complementary manner to strengthen the perception of lesion regions and suppress background interference. At the same time, the ATFL function is adopted to enhance the network’s ability to learn challenging samples. Through these optimizations, EAG-YOLOv11n attains significant improvements in rice leaf diseases detection, achieving a mAP@50 of 87.3%. Compared with the original YOLOv11n, EAG-YOLOv11n improves mAP@50 and mAP@50–95 by 2.7% and 2.9%, respectively, with virtually no increase in parameters, while the model size and GFLOPs grow by only 0.02 MB and 0.3 GFLOPs. Experimental results demonstrate that EAG-YOLOv11n preserves a lightweight and efficient design while achieving high recognition accuracy, demonstrating its effectiveness in rice leaf disease detection.

Author Contributions

Software, Conceptualization, Writing—original draft, and Methodology: C.L.; Investigation and Validation: B.Q.; Software and Methodology: D.W.; Resources and Supervision: J.Y.; Resources, Supervision, and Funding acquisition: X.Z., F.K. and X.N. All authors have read and agreed to the published version of the manuscript.

Funding

This work was supported by the Hunan Province Key Research and Development Plan Project under grant number: 2023NK2011, Hainan Provincial Sanya Yazhou Bay Science and Technology Innovation Joint Project under grant number: ZDYF2025GXJS154 and Science Research Excellent Youth Project of Hunan Provincial Department of Education under grant number: 23B0906, Hunan Agricultural University Research Project under grant number: 25KT066.

Data Availability Statement

The raw data supporting the conclusions of this article will be made available by the authors on request.

Conflicts of Interest

Author Jian Yu was employed by the company Sanya Yazhou Bay Innovation Technology International Consulting Research Institute Co., Ltd. The remaining authors declare that the research was conducted in the absence of any commercial or financial relationships that could be construed as a potential conflict of interest.

References

  1. Sarfaraz, H. Rice Production, Quality, and Nutrition: A Comprehensive Review on Challenges, Opportunities, and Global Perspectives. Int. J. Agric. Sustain. Dev. 2023, 5, 90–103. [Google Scholar]
  2. Xu, Y.; Ma, K.; Zhao, Y.; Wang, X.; Zhou, K.; Yu, G.; Xu, S. Genomic selection: A breakthrough technology in rice breeding. Crop. J. 2021, 9, 669–677. [Google Scholar] [CrossRef]
  3. Yang, W.; Yang, F.; Wu, X. Challenges Faced by Grain Production in China and Advantages of Intercropping. In Theories and Application in Maize-Soybean Strip Intercropping System; Springer Nature: Singapore, 2025; pp. 1–15. [Google Scholar]
  4. Nie, L.; Peng, S. Rice production in China. In Rice Production Worldwide; Springer International Publishing: Cham, Switzerland, 2017; pp. 33–52. [Google Scholar]
  5. Conde, S.; Catarino, S.; Ferreira, S.; Temudo, M.P.; Monteiro, F. Rice Pests and Diseases Around the World: Literature-Based Assessment with Emphasis on Africa and Asia. Agriculture 2025, 15, 667. [Google Scholar] [CrossRef]
  6. Tang, L.; Risalat, H.; Cao, R.; Hu, Q.; Pan, X.; Hu, Y.; Zhang, G. Food security in China: A brief view of rice production in recent 20 years. Foods 2022, 11, 3324. [Google Scholar] [CrossRef] [PubMed]
  7. Zheng, Q.; Huang, W.; Xia, Q.; Dong, Y.; Ye, H.; Jiang, H.; Huang, S. Remote sensing monitoring of rice diseases and pests from different data sources: A review. Agronomy 2023, 13, 1851. [Google Scholar] [CrossRef]
  8. Li, S.; Feng, Z.; Yang, B.; Li, H.; Liao, F.; Gao, Y.; Yao, Q. An intelligent monitoring system of diseases and pests on rice canopy. Front. Plant Sci. 2022, 13, 972286. [Google Scholar] [CrossRef]
  9. Zahoor, I.; Mushtaq, A. Water pollution from agricultural activities: A critical global review. Int. J. Chem. Biochem. Sci. 2023, 23, 164–176. [Google Scholar]
  10. Acharya, S.; Kar, T.; Samal, U.C.; Patra, P.K. Performance comparison between svm and ls-svm for rice leaf disease detection. EAI Endorsed Trans. Scalable Inf. Syst 2023, 10, 1–7. [Google Scholar]
  11. Bharanidharan, N.; Chakravarthy, S.S.; Rajaguru, H.; Kumar, V.V.; Mahesh, T.R.; Guluwadi, S. Multiclass paddy disease detection using filter-based feature transformation technique. IEEE Access 2023, 11, 109477–109487. [Google Scholar] [CrossRef]
  12. Kumar, K.; Kannan, E. Detection of rice plant disease using AdaBoostSVM classifier. Agron. J. 2022, 114, 2213–2229. [Google Scholar] [CrossRef]
  13. Jung, M.; Song, J.S.; Shin, A.Y.; Choi, B.; Go, S.; Kwon, S.Y.; Kim, Y.M. Construction of deep learning-based disease detection model in plants. Sci. Rep. 2023, 13, 7331. [Google Scholar] [CrossRef] [PubMed]
  14. Xin, D.; Li, T. Revolutionizing tomato disease detection in complex environments. Front. Plant Sci. 2024, 15, 1409544. [Google Scholar] [CrossRef] [PubMed]
  15. Ashok, S.; Kishore, G.; Rajesh, V.; Suchitra, S.; Sophia, S.G.; Pavithra, B. Tomato leaf disease detection using deep learning techniques. In Proceedings of the 2020 5th International Conference on Communication and Electronics Systems (ICCES), Coimbatore, India, 10–12 June 2020; pp. 979–983. [Google Scholar]
  16. Li, Y.; Chen, X.; Yin, L.; Hu, Y. Deep Learning-Based Methods for Multi-Class Rice Disease Detection Using Plant Images. Agronomy 2024, 14, 1879. [Google Scholar] [CrossRef]
  17. Yang, H.; Deng, X.; Shen, H.; Lei, Q.; Zhang, S.; Liu, N. Disease detection and identification of rice leaf based on improved detection transformer. Agriculture 2023, 13, 1361. [Google Scholar] [CrossRef]
  18. Wang, H.; Nguyen, T.H.; Nguyen, T.N.; Dang, M. PD-TR: End-to-end plant diseases detection using a transformer. Comput. Electron. Agric. 2024, 224, 109123. [Google Scholar] [CrossRef]
  19. Li, W.; Zhu, L.; Liu, J. PL-DINO: An improved transformer-based method for plant leaf disease detection. Agriculture 2024, 14, 691. [Google Scholar] [CrossRef]
  20. Liu, W.; Zhang, A. Plant Disease Detection Algorithm Based on Efficient Swin Transformer. Comput. Mater. Contin. 2025, 82, 3045. [Google Scholar] [CrossRef]
  21. Cao, Q.; Zhao, D.; Li, J.; Li, J.; Li, G.; Feng, S.; Xu, T. Pyramid-YOLOv8: A detection algorithm for precise detection of rice leaf blast. Plant Methods 2024, 20, 149. [Google Scholar] [CrossRef]
  22. Zhang, Y.; Liu, J.; Li, S.; Feng, S.; Sun, Z.; Cui, Y.; Guo, W. ESM-YOLOv11: A lightweight deep learning framework for real-time peanut leaf spot disease detection and precision severity quantification in field conditions. Comput. Electron. Agric. 2025, 238, 110801. [Google Scholar] [CrossRef]
  23. Meng, Y.; Zhan, J.; Li, K.; Yan, F.; Zhang, L. A rapid and precise algorithm for maize leaf disease detection based on YOLO MSM. Sci. Rep. 2025, 15, 6016. [Google Scholar] [CrossRef]
  24. Gao, C.; He, B.; Guo, W.; Qu, Y.; Wang, Q.; Dong, W. SCS-YOLO: A real-time detection model for agricultural diseases—A case study of wheat fusarium head blight. Comput. Electron. Agric. 2025, 238, 110794. [Google Scholar] [CrossRef]
  25. Zheng, X.; Shao, Z.; Chen, Y.; Zeng, H.; Chen, J. MSPB-YOLO: High-Precision Detection Algorithm of Multi-Site Pepper Blight Disease Based on Improved YOLOv8. Agronomy 2025, 15, 839. [Google Scholar] [CrossRef]
  26. Pan, C.; Wang, S.; Wang, Y.; Liu, C. SSD-YOLO: A Lightweight Network for Rice Leaf Disease Detection. Front. Plant Sci. 2025, 16, 1643096. [Google Scholar] [CrossRef] [PubMed]
  27. Gan, B.; Pu, G.; Xing, W.; Wang, L.; Liang, S. Enhanced YOLOv8 with lightweight and efficient detection head for detecting rice leaf diseases. Sci. Rep. 2025, 15, 22179. [Google Scholar] [CrossRef] [PubMed]
  28. Wang, J.; Ma, S.; Wang, Z.; Ma, X.; Yang, C.; Chen, G.; Wang, Y. Improved Lightweight YOLOv8 Model for Rice Disease Detection in Multi-Scale Scenarios. Agronomy 2025, 15, 445. [Google Scholar] [CrossRef]
  29. Ouyang, D.; He, S.; Zhang, G.; Luo, M.; Guo, H.; Zhan, J.; Huang, Z. Efficient multi-scale attention module with cross-spatial learning. In Proceedings of the IEEE International Conference on Acoustics, Speech and Signal Processing (ICASSP), Rhodes Island, Greece, 4–9 June 2023; pp. 1–5. [Google Scholar]
  30. Yang, B.; Zhang, X.; Zhang, J.; Luo, J.; Zhou, M.; Pi, Y. EFLNet: Enhancing feature learning network for infrared small target detection. IEEE Trans. Geosci. Remote Sens. 2024, 62, 1–11. [Google Scholar] [CrossRef]
  31. Liu, J.; Wang, X.; Zhu, Q.; Miao, W. Tomato brown rot disease detection using improved YOLOv5 with attention mechanism. Front. Plant Sci. 2023, 14, 1289464. [Google Scholar] [CrossRef]
  32. Khanam, R.; Hussain, M. Yolov11: An overview of the key architectural enhancements. arXiv 2024, arXiv:2410.17725. [Google Scholar] [CrossRef]
  33. Wang, Y.; Li, Y.; Wang, G.; Liu, X. PlainUSR: Chasing faster ConvNet for efficient super-resolution. In Proceedings of the Asian Conference on Computer Vision, Hanoi, Vietnam, 8–12 December 2024; pp. 4262–4279. [Google Scholar]
  34. Zhao, Y.; Lv, W.; Xu, S.; Wei, J.; Wang, G.; Dang, Q.; Chen, J. Detrs beat yolos on real-time object detection. In Proceedings of the IEEE/CVF Conference on Computer Vision and Pattern Recognition, Seattle, WA, USA, 17–21 June 2024; pp. 16965–16974. [Google Scholar]
  35. Wang, C.Y.; Bochkovskiy, A.; Liao, H.Y.M. YOLOv7: Trainable bag-of-freebies sets new state-of-the-art for real-time object detectors. In Proceedings of the IEEE/CVF Conference on Computer Vision and Pattern Recognition, Vancouver, BC, Canada, 18–22 June 2023; pp. 7464–7475. [Google Scholar]
  36. Varghese, R.; Sambath, M. Yolov8: A novel object detection algorithm with enhanced performance and robustness. In Proceedings of the International Conference on Advances in Data Engineering and Intelligent Computing Systems (ADICS), Chennai, India, 18–19 April 2024; pp. 1–6. [Google Scholar]
  37. Wang, C.Y.; Yeh, I.H.; Mark Liao, H.Y. Yolov9: Learning what you want to learn using programmable gradient information. In Proceedings of the European Conference on Computer Vision, Milan, Italy, 29 September–4 October 2024; Springer Nature: Cham, Switzerland, 2024; pp. 1–21. [Google Scholar]
  38. Wang, A.; Chen, H.; Liu, L.; Chen, K.; Lin, Z.; Han, J. Yolov10: Real-time end-to-end object detection. Adv. Neural Inf. Process. Syst. 2024, 37, 107984–108011. [Google Scholar]
  39. Tian, Y.; Ye, Q.; Doermann, D. Yolov12: Attention-centric real-time object detectors. arXiv 2025, arXiv:2502.12524. [Google Scholar]
Figure 1. Dataset preparation workflow. (a) Data collection and preprocessing; (b) Data annotation and dataset construction.
Agronomy 15 02513 g001
Figure 2. Representative disease samples and augmented examples.
Agronomy 15 02513 g002
Figure 3. Structure diagram of EAG-YOLOv11n.
Agronomy 15 02513 g003
Figure 4. Structure of EMA-C3K2. (a) C3k2 of EMA-C3K2 with C3K is set to True; (b) C3k2 of EMA-C3K2 with C3K is set to False; (c) Structure of EMA-bottleneck.
Agronomy 15 02513 g004
Figure 5. Structure of GLC-PSA. (a) Overall architecture of GLC-PSA; (b) Detailed architecture of LIA; (c) Detailed architecture of PSABlock.
Agronomy 15 02513 g005
Figure 6. Bar and radar charts of performance across different models. (a) mAP@50 of Different models across three rice leaf diseases (b) detection metrics and model complexity across different models.
Agronomy 15 02513 g006
Figure 7. Confusion matrices on test dataset. (a) confusion matrix of the YOLOv11n model; (b) confusion matrix of the EAG-YOLOv11n model.
Agronomy 15 02513 g007
Figure 8. Comparison of Confidence and Recall-Confidence Curves Across different Models. (a) Precision–confidence curve across different models; (b) F1-confidence curve across different models; (c) Recall–confidence curve across different models; (d) Precision–Recall curve across different models.
Agronomy 15 02513 g008
Figure 9. Comparative heatmaps across different models. (a) Original images of different disease; (b) Heatmaps of YOLOv11n; (c) Heatmaps of EAG-YOLOv11n; (d) Heatmaps of RT-DETR-L; (e) Heatmaps of YOLOv8n.
Agronomy 15 02513 g009
Figure 10. Comparative detection results across different models. (a) Ground Truth of different disease; (b) Detection result of YOLOv11n; (c) Detection result of EAG-YOLOv11n; (d) Detection result of RT-DETR-L; (e) Detection result of YOLOv8n.
Agronomy 15 02513 g010
Figure 11. mAP@50 of EAG-YOLOv11n and YOLOv11n across different folds.
Agronomy 15 02513 g011
Table 1. Detailed specifications of the smartphone camera.
DeviceResolution
/Pixels
ApertureFocal LengthFeatures
Redmi K70 Pro50 MPf/1.6-PDAF, OIS
iPhone 13 Pro12 MPf/1.526 mmDual Pixel PDAF, OIS
Table 2. Data distribution of the RLD-3C dataset.
Disease TypeQuantityBacterial Leaf BlightBrown SpotRice Blast
Train856346265245
val2861158982
test2861168882
Total1428581442409
Train (Augmentation)5136207615901470
Table 3. The performance and complexity of different YOLOv11 models.
ModelPRmAP@50mAP@50–95ParamsModel SizeGflops
YOLOv11n87.379.984.649.12.585.256.3
YOLOv11s88.980.486.551.49.4118.3321.3
YOLOv11m89.781.687.552.320.0338.6867.7
Table 4. Comparison results with different detection methods.
ModelPRmAP@50mAP@50–95ParamsModel SizeGflops
RT-DETR-L90.680.083.145.731.9963.10103.4
YOLOv7tiny89.576.683.041.76.011.7313.0
YOLOv8n87.582.485.446.83.015.948.1
YOLOv9tiny88.179.686.250.21.874.267.1
YOLOv10n87.373.678.639.52.75.528.2
YOLOv11n87.379.984.649.12.585.256.3
YOLOv12n90.777.084.448.22.515.215.8
EAG-YOLOv11n89.782.587.352.02.585.276.6
Table 5. Result of ablation experiments.
BaselineEMAGLC-PSAATFLPRmAP@50mAP@50–95ParamsModel SizeGflops
×××87.379.984.649.12.585.256.3
××89.180.286.149.72.595.296.6
××88.380.586.048.92.575.246.3
××85.683.386.349.92.585.256.3
×87.981.786.650.62.585.276.6
×88.880.786.449.82.595.296.6
×89.081.586.950.12.575.246.3
89.782.587.352.02.585.276.6
Table 6. Result of five-fold cross-validation experiment.
ModelPRmAP@50mAP@50–95
5-Fold Mean
± Std
YOLOv11n87.88 ± 0.6879.64 ± 0.6184.84 ± 0.6749.92 ± 0.93
EAG-YOLOv11n89.96 ± 1.2481.64 ± 0.9287.28 ± 0.3051.92 ± 0.45
Disclaimer/Publisher’s Note: The statements, opinions and data contained in all publications are solely those of the individual author(s) and contributor(s) and not of MDPI and/or the editor(s). MDPI and/or the editor(s) disclaim responsibility for any injury to people or property resulting from any ideas, methods, instructions or products referred to in the content.