Article

Impact of Artificial Humic Acid on the Migration and Transformation of Soil Phosphorus

1
School of Water Conservancy & Civil Engineering, Northeast Agricultural University, Harbin 150030, China
2
International Cooperation Joint Laboratory of Health in Cold Region Black Soil Habitat of the Ministry of Education, Harbin 150030, China
3
Department of Colloid Chemistry, Max Planck Institute of Colloids and Interfaces, 14476 Potsdam, Germany
*
Authors to whom correspondence should be addressed.
Agronomy 2025, 15(11), 2482; https://doi.org/10.3390/agronomy15112482 (registering DOI)
Submission received: 16 September 2025 / Revised: 22 October 2025 / Accepted: 23 October 2025 / Published: 25 October 2025

Abstract

Phosphorus (P) is a critical factor in enhancing agricultural yield improvement, but the over-application of P fertilizers has led to the widespread accumulation of ineffective P in soils worldwide. Artificial humic acid (AHA) has gained recognition as a new method for enhancing P effectiveness in soils. This study aims to explore the patterns and mechanisms underlying the effect of AHA on P effectiveness. A 60-day indoor incubation experiment was conducted using a soil column system, in which the soil was fractionated into five distinct particle size classes: 2 mm, 4 mm, 6 mm, 8 mm, and 10 mm. Findings revealed that AHA effectively promoted the accumulation of Olsen-P in fine-textured soils. Following the application of AHA, the fraction of particles with a size of 2 mm exhibited the highest increase in Olsen-P, at 15.4%, whereas the fraction with a size of 8 mm showed the lowest increase, at 0.2% relative to the control, at the 60th day. Additionally, AHA promoted the migration of HCl-P while enhancing the immobilization of Olsen-P. During the initial cultivation phase, the concentrations of HCl-P in the topsoil (0 cm) differed little from those in the deeper soil (40 cm). As cultivation progressed, the concentrations of NaOH-P and HCl-P in the 0 cm soil decreased more markedly than those at the 40 cm depth by the later cultivation stage. Finally, the structural equation modeling results indicated that among NaHCO3-P, NaOH-P, and HCl-P, NaOH-P had the most significant effect on Olsen-P. These findings offer valuable insights into how AHA could be used to improve the effectiveness of P in soils.

1. Introduction

Phosphorus (P), as one of the most active elements in soil fertility, is also a fundamental material for the growth and development of crops [1]. However, the unreasonable application of P in global agricultural areas has led to problems such as soil degradation and environmental pollution. There is a large amount of P in soil. However, most of it exists in forms unavailable to crops, and this leads to a generally low level of available P [2]. Therefore, how to efficiently activate and utilize the P reserve pool in soil has become a crucial issue in the international fields of soil science and agricultural environment [3,4]. Cross and Schlesinger studied the biogeochemical P cycle in soil based on the Hedley P classification method [5]. They divided the P in the soil into different components and constructed an analytical framework for the transformation of organic–inorganic P forms [6]. These components include the readily available labile P (including Resin-P and NaHCO3-P), the moderately stable P (such as NaOH-P associated with iron and aluminum, and HCl-P associated with calcium), and the highly stable residual P that is extremely difficult to utilize. Among these, Resin P and Olsen-P, as readily soluble P fractions, are more readily absorbed and utilized by plants. Conversely, HCl-P, Residual P, and NaOH-P, being less soluble P fractions, are more prone to leaching and less readily available to plants [7,8]. Nevertheless, the distribution pattern of these P components is not static. The dynamics of soil P transport and transformation under different environmental conditions will directly affect the environmental fate and ecological effects of P. Therefore, studying the dynamics of P in soil is essential for exploiting stored P. Research has demonstrated that balanced P management in wheat–maize rotation systems can effectively reduce soil fertilizer residues and leaching risks [9]. Concurrently, studies on switchgrass indicate that its root systems, along with associated microbiota, significantly reshape the soil’s available P pool [10]. Furthermore, genetic insights have enabled the proposal of targeted plant cultivation strategies to enhance P cycling [11]. Research on P migration and transformation during the cropping season has been intensive, while recent scientific inquiry is increasingly shifting toward the fallow stage [12,13]. The fallow period is a tillage system conducive to soil health restoration and is also a critical stage for soil internal nutrient cycling and recovery. Therefore, researching the dynamics of P during this period holds significant value [13]. Additionally, studies on the transformation between different P forms and their vertical distribution patterns during the fallow period are still relatively scarce. Key environmental changes during the fallow period can significantly affect soil aggregate structure [14], which in turn triggers the redistribution of P fractions [7]. Critically, the forms and reserves of P formed during the fallow period directly determine the soil’s P supply capacity at the beginning of the subsequent growing season [13]. Therefore, elucidating the patterns of P transformation and migration during the fallow period is essential for developing scientific fertilization strategies and promoting the sustainable enhancement of soil fertility.
A novel type of organic material—artificial humic acid (AHA)—is garnering increasing attention [15]. Previous studies indicate that AHA not only enhances soil P fixation capacity through its inherent phenolic, hydroxyl, and carboxyl groups, but also increases P availability and uptake by boosting calcium P precipitation rates. It forms P complexes, enhances competing adsorption sites to elevate soil P concentrations, and promotes the conversion of insoluble P minerals into forms more readily absorbed and utilized by plants [16]. In investigations of soil P transport and transformation, the role of aggregate size is essential [17]. It has been found that there are significant differences in soil nutrients between micro-aggregates and macro-aggregates, with micro-aggregates exhibiting a more pronounced impact on the immobilization of soil nutrient elements C, N, and P [15]. The formation of soil aggregates, in conjunction with other soil properties, exerts a substantial influence on P adsorption and bioavailability in soil [18]. However, it remains unclear how AHA affects P dynamics across soils with different grain sizes. In addition, the influence of the depth of AHA addition on soil P migration and transformation remains unknown. This lack of clarity hinders the optimal utilization of AHA in agricultural production.
Therefore, we designed column experiments to discuss the effects of soil particle sizes, AHA addition, and the depth of addition on soil P migration and transformation. This paper aims to investigate (I) the role of AHA in P transformation in soils with different particle size fractions, (II) the impact of AHA addition on soil P migration, and (III) the impact of AHA addition depth on soil P migration and transformation.

2. Materials and Methods

2.1. Experimental Materials

Soil samples for testing were collected from Qianjin Farm in Jiamusi City (N 47°34′12″, E 125°23′38.50″), located southeast of the Sanjiang Plain and situated on the eastern margin of the Jiamusi Massif, where Middle Devonian Heitai Formation sandstone is widely distributed. Based on the Chinese Soil Classification System, the experimental soil was classified as Alfisol [19]. The study area is classified as having a cold temperate continental climate, characterized by mild and rainy summers, alongside cold and dry winters. The region exhibits an average annual temperature of 3.9 °C at 350 m a.s.l. In 2022, soil samples were systematically obtained at a depth of 0–20 cm with a sampling spade. The initial soil Olsen-P content was 7.44 ± 1.64 mg/kg. Soil samples were collected using a five-point sampling method: a plot was selected, with the midpoint of its diagonal serving as the central sampling point. Four additional sampling points were then positioned equidistant from the central point along the diagonals, ensuring consistent soil type. Collected samples were thoroughly mixed before being sealed in sample bags for subsequent analysis. Following collection, soil samples were placed in a well-ventilated, sunlit location [20]. In order to circumvent the extreme impact of clay or gravel, the experiment was designed with five distinct particle sizes (2 mm, 4 mm, 6 mm, 8 mm, and 10 mm). The air-dried soil was subjected to a series of sieves of five distinct sizes to obtain the specified sizes.
The AHA raw material was sourced from mature corn stalks collected within the campus of Northeast Agricultural University. After collection, the stalks were first washed, then dried in a constant-temperature oven at 105 °C, followed by pulverization. Liquid artificial humic acid was prepared via hydrothermal humification technology [16]. Solid humic acid was obtained using 6 mol/L hydrochloric acid through precipitation and centrifugation. This solid was dissolved in a 3% ammonia solution (Shanghai Hushi Laboratory Equipment Co., Ltd., Shanghai, China), adjusted to neutral pH, and ultimately yielded a 1 g/L concentration of liquid AHA. The C/N ratio, determined using an elemental analyzer (Olivetti, Ivrea, Italy), was approximately 10.9:1. Scanning electron microscopy (SEM) (Hitachi Ltd., Tokyo, Japan), transmission electron microscopy (TEM) (Hitachi Ltd., Tokyo, Japan) images and Fourier transform infrared spectroscopy (FTIR) (Thermo Fisher Scientific Inc., Waltham, MA, USA) analyses of the synthetic humic substance are presented in Figure 1.

2.2. Column Experimental Design

The experiment was conducted in a soil cultivation device made of cylindrical polyvinyl chloride (PVC). The experimental device was 50 cm in height and 10 cm in diameter. Three holes, each 2 cm in diameter, were created 5 cm from the bottom of the unit, with three more holes of the same size spaced every 10 cm along its height. The device was prepared with approximately 4 cm of quartz sand at the bottom of the soil column. A nylon filter layer with a mesh size of 150 μm was placed on top of the sand to prevent soil-sand mixing and clogging.
To achieve uniform density across the samples, the same mass of soil was placed layer by layer into the same volume of PVC columns. Since the normal growth range of crop roots is 10–40 cm, the experiment was set up to investigate the effects of AHA on soil nutrients at different depths by applying AHA at 10–20 cm and 30–40 cm. The soil incubation experiment was organized into three groups: (I) Soil was sieved into particle size fractions of 2 mm, 4 mm, 6 mm, 8 mm, and 10 mm, which were then placed into separate PVC columns. These columns received only water supplementation with no additional treatments (Control, CK). (II) The same soil fractions were subjected to the addition of 300 mg/kg of AHA. (III) AHA was applied to the different particle size fractions at depths of 10–20 cm and 30–40 cm. Liquid AHA was added to the filled soil columns prior to the start of the experiment along with supplemental water to bring the soil moisture content to 20%.

2.3. Sample Collection and Measurement

The experiment was conducted over a 60-day period, with soil sampling performed at 10-day intervals. The experiment was designed to simulate the changes in soil P fractions during the fallow period, so no crops were planted. At each sampling event, the rubber plugs on the PVC columns were removed, and soil samples were collected from 5 depths (0, 10, 20, 30, and 40 cm) in triplicate. Over the entire experimental duration, a total of six sampling campaigns were carried out. Immediately after collection, the soil samples were placed in labeled aluminum boxes and oven-dried. After removing stones and residual grass roots, the samples were ground. NaHCO3-P, NaOH-P, HCl-P, and Olsen-P were leached using the Hedley method and Maranguit method [21]. For NaHCO3-P determination, 0.5 g of air-dried soil was placed into a 50 mL polyethylene centrifuge tube. A total of 30 mL of 0.5 mol/L NaHCO3 solution (pH 8.5) was added, before being agitated at 25 °C and 180 rpm in a water bath shaker (Shanghai Boxun Medical Biological Instrument Corp., Shanghai, China) for 16 h. Following shaking, the mixture was centrifuged at 3500 rpm for 8 min (Hunan Kaida Science Instrument Co., Ltd, Changsha, China) to determine NaHCO3-P content. The remaining solid phase was preserved for subsequent extraction cycles. This procedure was iterated to isolate NaOH-P and HCl-P fractions, following established sequential extraction principles [5]. Olsen-P was determined following the method described in Maranguit [22]. Air-dried soil (<2 mm) was weighed into a conical flask, followed by the addition of 0.5 mol/L NaHCO3 solution and activated carbon. The mixture was shaken horizontally in a temperature-controlled water bath oscillator (180 rpm) for 30 min. The supernatant was used to determine the Olsen-P. The soil P content was measured by the Smartchem 200 Automated Discrete Analyzer (LICA United Technology Limited, Beijing, China).

2.4. Statistical Analyses

The effects of three factors—AHA application method, soil depth, and incubation time—on four P fractions were evaluated using multi-way ANOVA. Post hoc comparisons were performed using the Least Significant Difference (LSD) test. The experimental results were evaluated using IBM SPSS Statistics 27. Pearson correlation analysis was conducted to examine the relationships among NaHCO3-P, NaOH-P, HCl-P, and Olsen-P. Reliability analysis and factor analysis were performed on the data.
IBM SPSS Amos 24.0 software was used to develop a structural equation model (SEM) using the covariance matrix of variables, including NaHCO3-P, NaOH-P, HCl-P, and Olsen-P, to investigate the relative importance of these variables. The correlation coefficients are presented in Table 1.
The best model was selected based on 5 fit indices, including CMIN/DF. A good fit is indicated by an RMSEA value less than 0.1, a CMIN/DF value less than 3, and values of the other indices greater than 0.9 [23].

3. Results

3.1. Transformation Pattern of Soil P with the Addition of AHA in Different Soil Particle Size Fractions

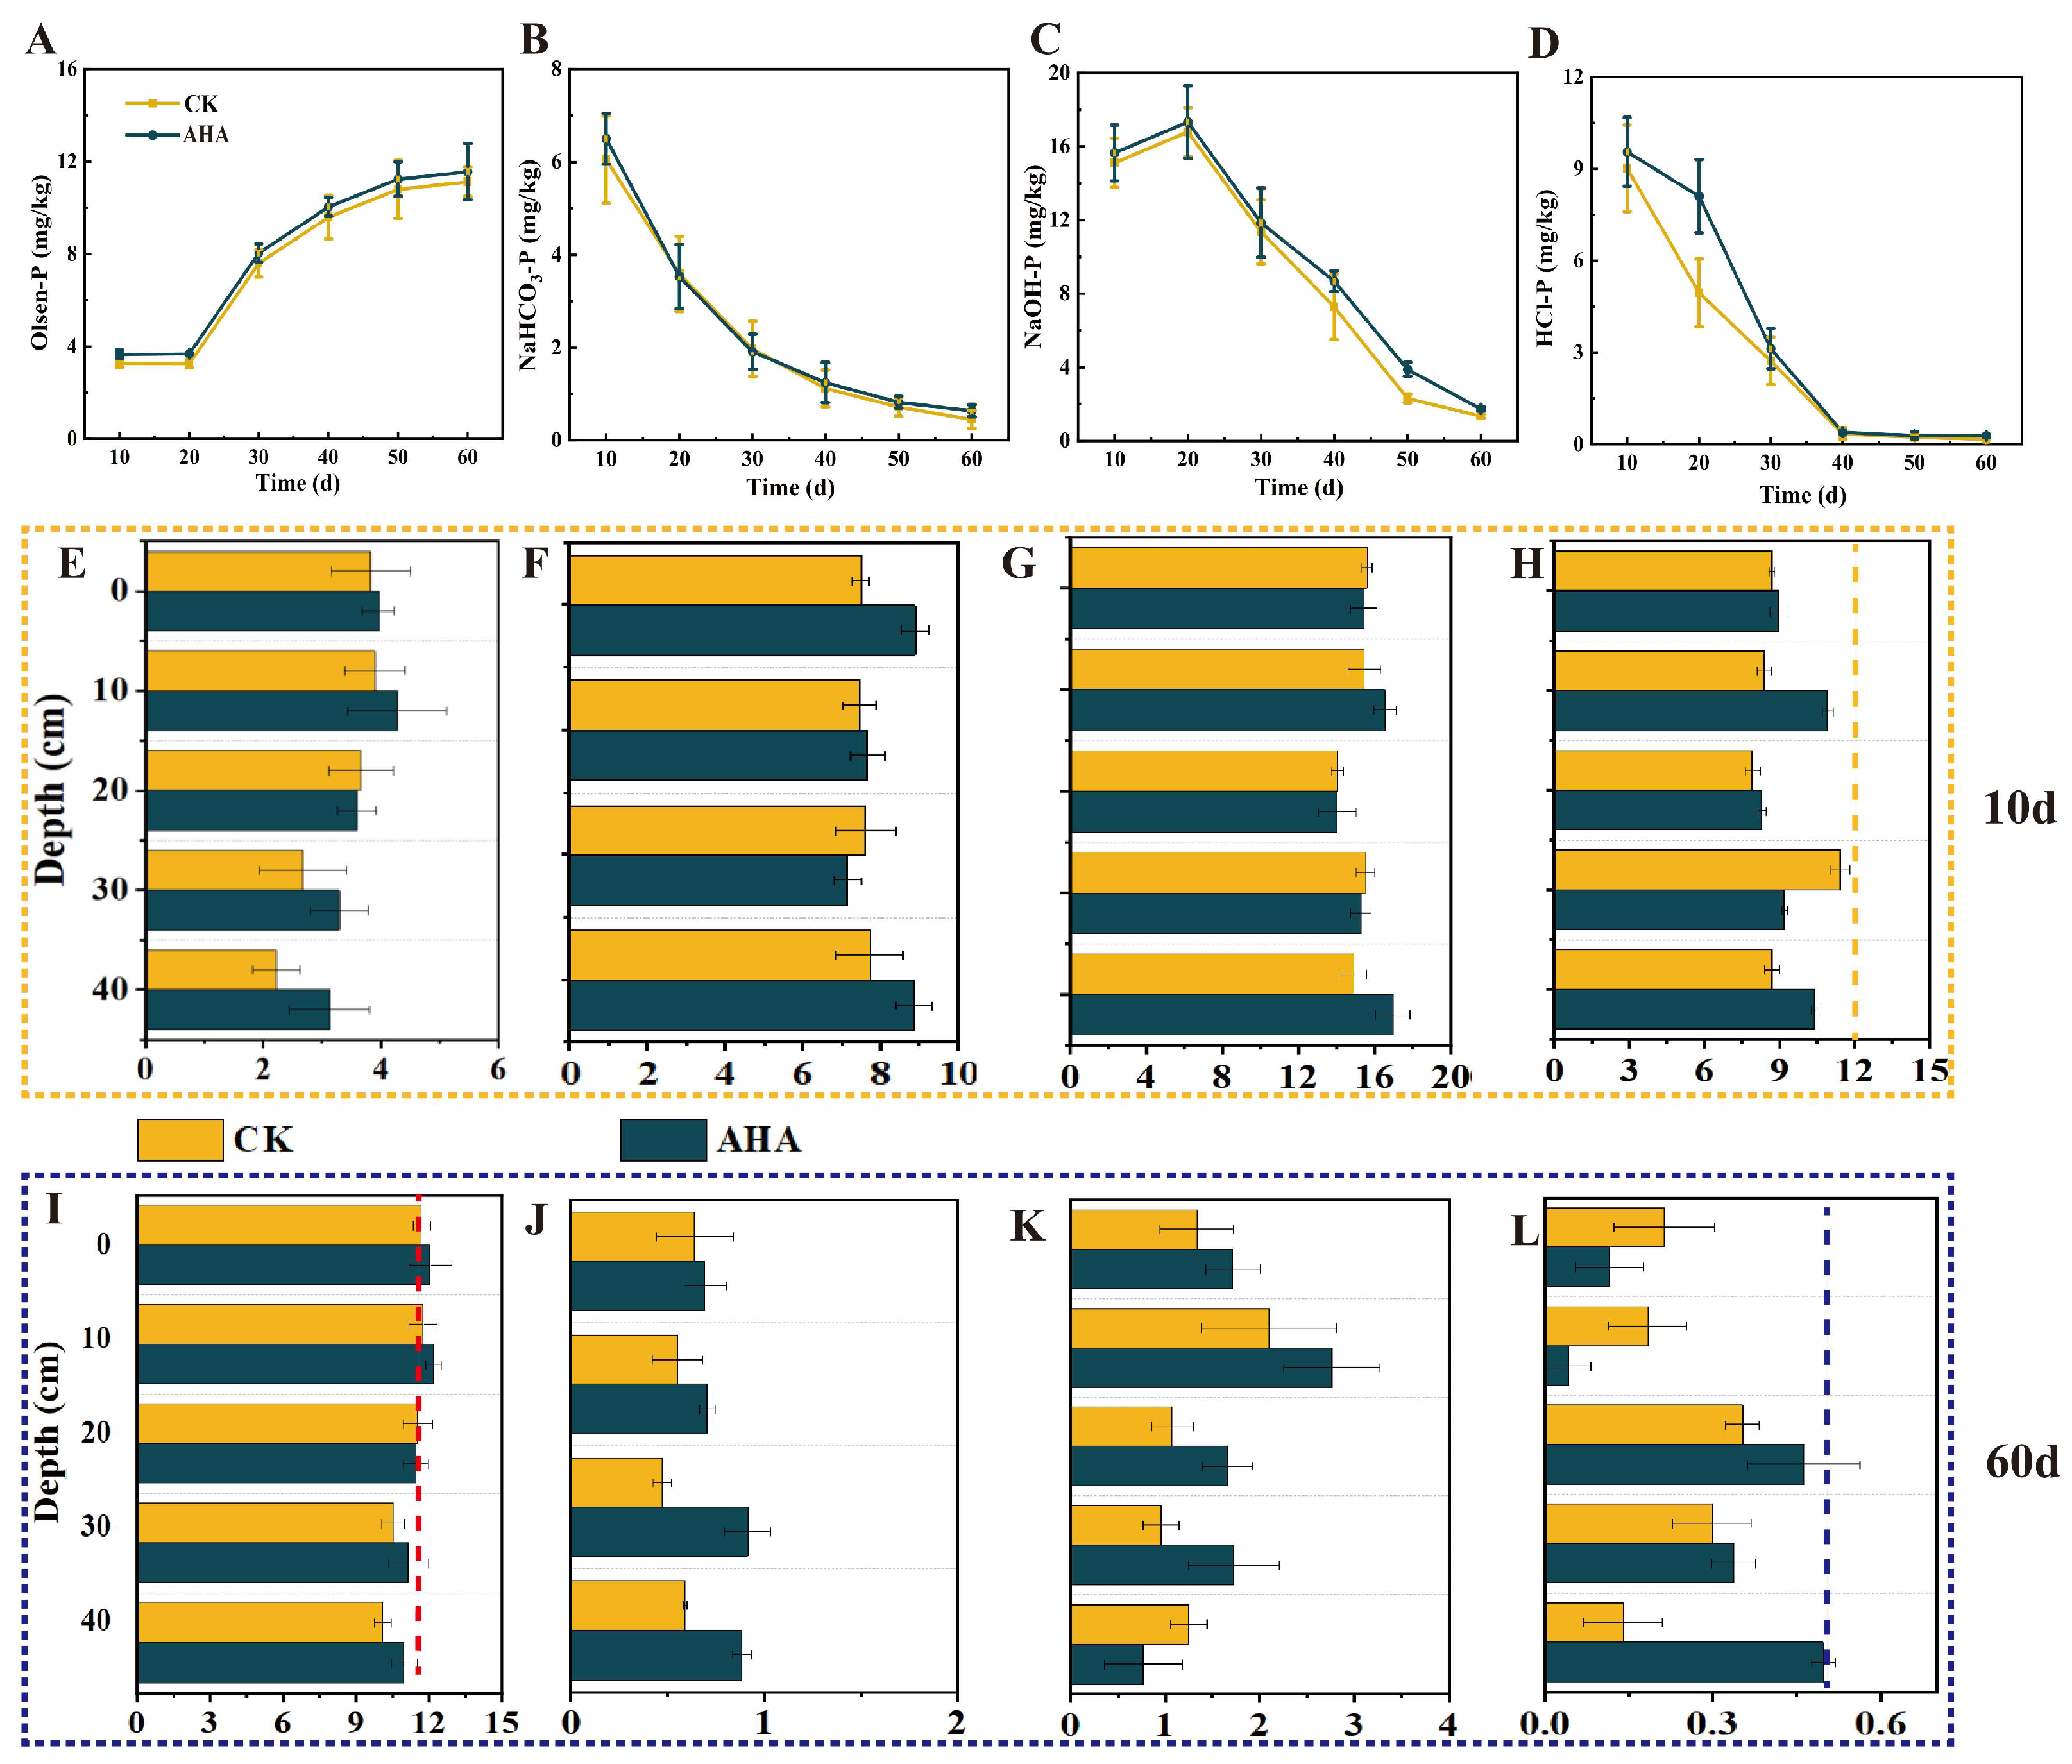
Basic soil parameters are shown in Table 2. Under both treatments, NaHCO3-P, NaOH-P, and HCl-P were all converted to Olsen-P, a form more readily absorbed by crops. Overall, NaHCO3-P and HCl-P concentrations decreased sharply for both treatments, while Olsen-P concentration progressively increased. During the initial 20 days of incubation, NaOH-P exhibited an increasing trend and its concentration began to decline after this period. The application of AHA effectively facilitated the conversion of NaHCO3-P, NaOH-P, and HCl-P to Olsen-P. During soil cultivation, the P component with the greatest variation was HCl-P after the application of AHA, which decreased by 0.05–6.40 mg/kg. Olsen-P content increased by 7.17–9.10 mg/kg.
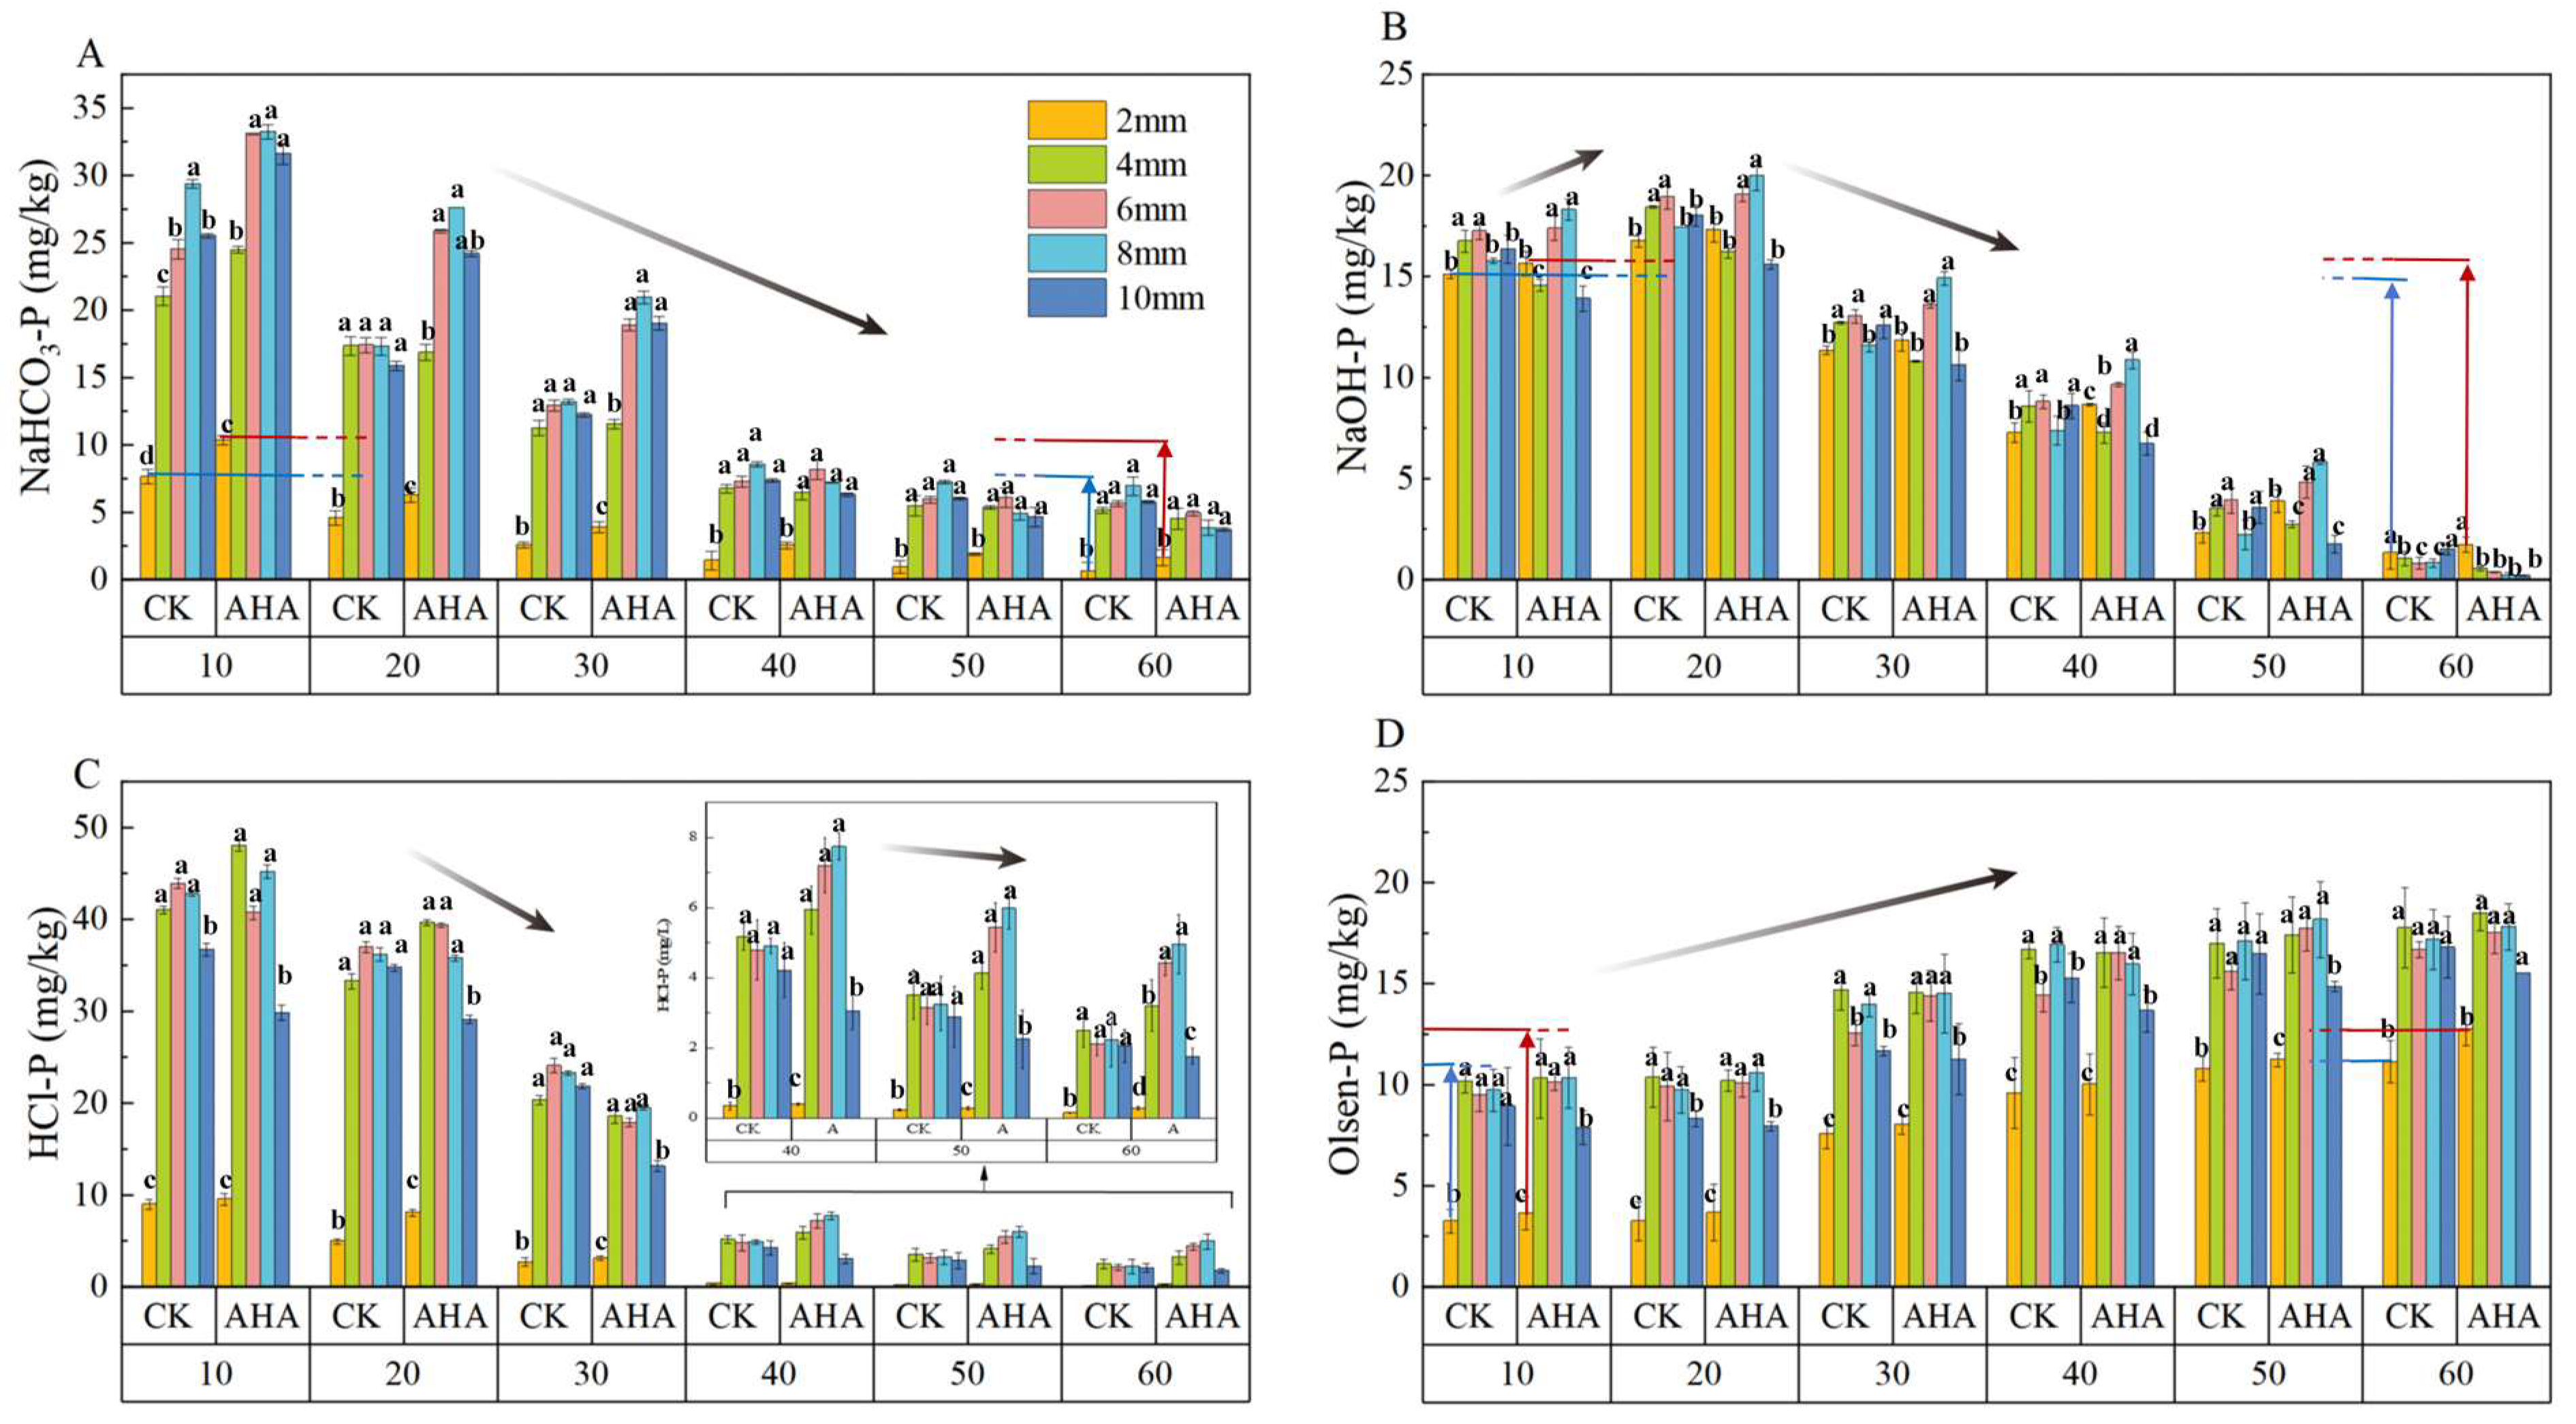
A comparison of P concentrations across five particle size fractions found that AHA increased the effective conversion of P in the majority of particle size fractions (Figure 2). In the presence of AHA, NaHCO3-P, NaOH-P, HCl-P and Olsen-P concentrations increased in the 2 mm, 4 mm, 6 mm, and 8 mm soil particle size fractions. The Olsen-P content in these four particle size fractions grew by 15.4%, 7.3%, 3.1%, and 0.2%. Therefore, AHA was most effective in promoting the conversion of NaHCO3-P, NaOH-P, and HCl-P to Olsen-P in the 2 mm particle size fraction.
The experimental results showed that AHA most significantly influenced the transformation of P in the 2 mm fraction. Therefore, in the following experiments, the 2 mm fraction will be utilized to further investigate the effects of AHA on the migration and transformation of P.

3.2. Migration Patterns of Soil P Influenced by AHA

A multi-way ANOVA revealed distinct effects on the different P fractions (Table 3). For Olsen-P, significant main effects were found for AHA application method (F = 5.21, p < 0.05) and incubation time (F = 44.91, p < 0.001), but not for soil depth (F = 1.29, p = 0.274). A similar pattern was observed for NaHCO3-P and NaOH-P, where both AHA application method (NaHCO3-P: F = 3.14, p < 0.05; NaOH-P: F = 2.33, p = 0.05) and incubation time (NaHCO3-P: F = 48.49, p < 0.001; NaOH-P: F = 50.06, p < 0.001) had significant main effects, while soil depth did not (NaHCO3-P: F = 0.55, p = 0.702; NaOH-P: F = 1.15, p = 0.335). In contrast, for HCl-P, the main effects of AHA application method, incubation time, and soil depth were all significant. A significant interaction between AHA application method and soil depth was detected (p < 0.001). The results of the aforementioned analysis indicate that the experimental data in this study are statistically significant.
Figure 3 showed that Olsen-P levels peaked in the 0–10 cm layer and declined with depth across both treatments. After the addition of AHA, Olsen-P concentration increased throughout the 0–40 cm soil profile, indicating that a greater amount of Olsen-P was retained in the soil treated with AHA. At the initial stage of the incubation test, the levels of NaOH-P and HCl-P in the topsoil (0 cm) were similar to those at 40 cm. Post-incubation analysis revealed that the concentrations of HCl-P in the 0 cm soil had decreased by 0.95 mg/kg compared to the 40 cm soil treated with AHA. This vertical gradient disparity exceeded the control group, where the difference was 0.131 mg/kg. This indicates that AHA promotes the downward transport of HCl-P.
In the experiment, we added AHA to the surface layer to investigate its effects on soil P migration and transformation. To study whether the different application depths of AHA would influence soil P migration and transformation, we conducted soil column experiments, adding AHA at depths of 10–20 cm and 30–40 cm for further investigation.

3.3. Migration and Transformation Patterns of Soil P Under Different Humic Acid Addition Depths

The application of AHA significantly elevated NaOH-P and HCl-P levels in the immediate vicinity of the treatment zones (Figure 4). Notably, when AHA was applied at the 10–20 cm depth, it did not significantly alter the distribution of Olsen-P and NaHCO3-P within the soil profile. However, at the 10–20 cm depth, NaOH-P and HCl-P concentrations increased. NaOH-P at 10–20 cm increased by 0.27 times relative to the surface layer as cultivation time increased, while HCl-P at 10–20 cm increased by 0.62 times relative to the surface layer over the same period. Similarly, AHA application at the 30–40 cm depth significantly elevated both NaOH-P and HCl-P concentrations.
Comparative analysis of the effects of the two AHA application depths on Olsen-P, NaHCO3-P, NaOH-P, and HCl-P concentrations revealed that AHA application at 10–20 cm significantly enhanced soil P effectiveness. Compared with AHA application at 30–40 cm, AHA application at 10–20 cm is more effective in promoting the transformation of P into other forms. From the perspective of the whole soil column, the Olsen-P concentration tended to increase with prolonged incubation time, while NaHCO3-P, NaOH-P, and HCl-P concentrations generally exhibited a decreasing trend. Specifically, AHA application at 10–20 cm resulted in a higher Olsen-P concentration compared to application at 30–40 cm. On day 60 of incubation, the Olsen-P concentration of the addition of AHA at 10–20 cm was 7.83% higher than that of the other treatment. The NaOH-P concentration exhibited a similar trend, with higher concentrations observed at depths of 10–20 cm, representing a 6.12% increase compared to other treatments.

3.4. Structural Equation Model of Factors Affecting Soil P

As shown in Figure 5, the structural equation model results revealed that NaOH-P was the most significant factor influencing the conversion of Olsen-P. NaHCO3-P, NaOH-P, and HCl-P exhibited a negative effect on the conversion of Olsen-P, which is consistent with the findings in Section 3.1. Specifically, NaOH-P showed the strongest negative effect (p < 0.001), with a path coefficient of −0.33. A causal relationship was observed among NaHCO3-P, NaOH-P, and HCl-P, with HCl-P showing the weakest significance (p < 0.05) and a path coefficient of 0.09, suggesting that HCl-P has minimal influence on the transformation of NaOH-P. Consistent with our prior observations, NaOH-P and Olsen-P maintained relatively constant concentrations during the first 20 days (Figure 2). After 20 days of incubation, the changes in Olsen-P and NaOH-P concentrations exhibited opposing trends, and NaHCO3-P and HCl-P consistently showed an increasing trend throughout the incubation period. Consequently, the structural equation model reveals a stronger significant relationship between Olsen-P and NaOH-P compared to the significance of NaHCO3-P and HCl-P in relation to Olsen-P.

4. Discussion

The effective P pools are influenced by the activity of plant roots [24]. Under conditions devoid of plant-mediated regulation, Olsen-P exhibited less variability compared to other P fractions during the incubation period. The secondary P pools (NaOH-P and HCl-P) exhibited a higher environmental response sensitivity in comparison to Olsen-P. NaHCO3-P was loosely pooled on the surface of soil particles [16], and this fraction of P exhibited characteristics similar to those of effective P. In conjunction with the data presented in Figure 2A, the levels of NaHCO3-P in soils augmented with AHA exceeded those observed in the control group over a period of 10–30 days. This phenomenon can be attributed to the inhibition of the immobilization of NaHCO3-P by the reactive functional groups present on the surface of the AHA, which resulted in its binding to mineral adsorption sites [25]. The observed decrease in NaHCO3-P concentration during the incubation period was attributed to its conversion into water-soluble P, which is more readily available for plant uptake [10]. In Figure 2B,C, it can be seen that NaOH-P and HCl-P also exhibited a trend towards conversion to Olsen-P. Previous research has demonstrated that HCl-P functions both as a P source and a reservoir, similar to NaOH-P, and can serve as a supplement to the readily available forms of P [26,27,28,29]. AHA competes with P for binding sites on the soil surface and promotes the conversion of NaOH-P and HCl-P into a more water-soluble form, thereby increasing the effective P concentration [29,30]. Therefore, in the absence of P supply, there was a soil P deficit and all three forms were converted to Olsen-P to replenish the effective P pool, as corroborated by Figure 2.
NaHCO3-P, NaOH-P, and HCl-P were converted to effective P pools and the conversion of P was more pronounced in the soil with a 2 mm particle size fraction compared to other particle size fractions. The effect is attributed to the abundant phenolic hydroxyl and carboxyl groups in AHA [11], which are strongly adsorbed onto specific aluminum and iron oxides due to their high affinity for these surfaces [31]. AHA promotes the effective conversion of P by competing for adsorption sites [25]. In addition, soils with smaller particle sizes have a larger specific surface area and also undergo more adsorption and desorption reactions [12]. Therefore, the incorporation of AHA enhances the uptake of nutrients by soils with a small particle size, increasing the effective P concentration in the soil. The retention of Olsen-P by AHA is attributed to its ability to physically facilitate the formation of water-soluble humic acid–metal–phosphate complexes. The formation of stable P complexes substantially increases the soil’s potassium sequestration efficiency [25]. The carboxyl and hydroxyl groups on the surface of AHA are known to interact with hydroxyl groups on the soil surface, competing for adsorption sites with both organic and inorganic P [30,32]. This interaction activates potential P sources within the soil and promotes the mobilization of NaOH-P and HCl-P.
The experiment revealed a distinct enrichment of NaOH-P and HCl-P within the treated range. This effect is attributed to the large specific adsorption surface area of humic acid for P ions in the soil [33,34], combined with P’s strong affinity to soil solids. When P concentrations are excessive, P tends to preferentially adsorb onto soil particles, interacting with compounds such as calcium and transforming into more stable fractions, including NaOH-P and HCl-P [35,36,37]. Thus, a localized increase in NaOH-P and HCl-P content occurred.
In this experiment, the addition of AHA at 10–20 cm was found to be effective in promoting the conversion of P. This effect is attributed to the greater pore space and enhanced gas mobility in the mid-layer soil compared to the subsoil. Indeed, previous studies have demonstrated that humic acid enhances the growth of phosphorus-solubilizing microorganisms in the soil, some of which are strictly aerobic [38]. Consequently, the concentration of oxygen and soil aeration significantly influence the effectiveness of AHA in P transformation [39]. Aeration was more favorable at the 10–20 cm depth compared to the 30–40 cm depth, leading to a more pronounced increase in P effectiveness with AHA application at 10–20 cm. A decreasing trend in NaOH-P concentration was observed throughout the incubation period in the experiment.

5. Conclusions

This study demonstrated that AHA can promote the conversion of P from other components to Olsen-P within the 2 mm particle size fraction. Notably, Olsen-P concentrations showed a marked elevation after 20 days of incubation. Additionally, AHA can inhibit the migration of Olsen-P to a certain extent, thereby further immobilizing Olsen-P and reducing nutrient consumption. We found that the transformation processes of the four soil P components were interrelated. When the application depth of AHA was 10 to 20 cm, NaHCO3-P, NaOH-P, and HCl-P were able to transform into Olsen-P. This study presents a viable strategy for enhancing soil P utilization efficiency through AHA amendment and provides theoretical support for sustainable soil P management in cold black soil regions.

Author Contributions

Data curation, visualization, methodology, writing—original draft, L.Z.; data curation, methodology, Y.H. writing—review and editing, resources, supervision, M.A.; conceptualization, supervision, writing—review and editing, Y.Z.; writing—review and editing, resources, Z.L.; writing—review and editing, resources, supervision, F.Y. All authors have read and agreed to the published version of the manuscript.

Funding

This research was funded by the National Key Research and Development Program of China (2022YFD1500100), National Natural Science Foundation of China (52279034), International Cooperation Joint Laboratory of Health in Cold Region Black Soil Habitat of the Ministry of Education Open Subjects (HCRBSH202311-03), and Natural Science Foundation of Heilongjiang Province of China (ZL2024E005).

Data Availability Statement

The original contributions presented in this study are included in the article. Further inquiries can be directed to the corresponding authors.

Conflicts of Interest

The authors declare no conflicts of interest.

References

  1. Ahmed, U.; Lin, J.C.-W.; Srivastava, G.; Djenouri, Y. A nutrient recommendation system for soil fertilization based on evolutionary computation. Comput. Electron. Agr. 2021, 189, 106407. [Google Scholar] [CrossRef]
  2. Wan, W.; Li, X.; Han, S.; Wang, L.; Luo, X.; Chen, W.; Huang, Q. Soil aggregate fractionation and phosphorus fraction driven by long-term fertilization regimes affect the abundance and composition of P-cycling-related bacteria. Soil Tillage Res. 2020, 196, 104475. [Google Scholar] [CrossRef]
  3. Li, H.; Han, Q.; Liu, Q.; Gan, Y.; Ren, C.; Rivera, W.; Zhao, Q.; Zhang, J. Roles of phosphate-solubilizing bacteria in mediating soil legacy phosphorus availability. Microbiol. Res. 2023, 272, 11. [Google Scholar] [CrossRef] [PubMed]
  4. Ding, S.; Li, J.; Wang, Y.; He, S.; Xie, H.; Fu, H.; Feng, Y.; Shaheen, S.; Rinklebe, J.; Xue, L. Manure derived hydrochar reduced phosphorus loss risk via an alteration of phosphorus fractions and diversified microbial community in rice paddy soil. Sci. Total Environ. 2024, 918, 11. [Google Scholar] [CrossRef]
  5. Anne, F.C.; William, H.S. A literature review and evaluation of the Hedley fractionation: Applications to the biogeochemical cycle of soil phosphorus in natural ecosystems. Geoderma 1995, 64, 197–214. [Google Scholar] [CrossRef]
  6. Hedley, M.J.; Stewart, J.W.B.; Chauhan, B.S. Changes in Inorganic and Organic Soil Phosphorus Fractions Induced by Cultivation Practices and by Laboratory Incubations. Soil Sci. Soc. Am. J. 1982, 46, 970–976. [Google Scholar] [CrossRef]
  7. Bowman, R.A.; Olsen, S.R.; Watanabe, F.S. Greenhouse evaluation of residual phosphate by four phosphorus methods in neutral and calcareous soils1. Soil Sci. Soc. Am. J. 1978, 42, 451–454. [Google Scholar] [CrossRef]
  8. Bowman, R.A.; Cole, C.V. Transformations of organic phosphorus substrates in soils as evaluated by NaHCO3 extraction. Soil Sci. 1978, 125, 49–54. [Google Scholar] [CrossRef]
  9. Li, S.; Chen, X.; Wang, Z.; Wu, D.; Wang, M.; Torsten, M.; Zou, C.; Chen, X.; Zhang, W. Phosphorus fertilizer management for high yields in intensive winter wheat-summer maize rotation system: Integrating phosphorus budget and soil available phosphorus. Field Crops Res. 2024, 313, 109410. [Google Scholar] [CrossRef]
  10. Hao, Z.; Wang, Y.; Ding, N. Spectroscopic analysis reveals that soil phosphorus availability and plant allocation strategies impact feedstock quality of nutrient-limited switchgrass. Commun. Biol. 2022, 5, 227. [Google Scholar] [CrossRef]
  11. Cong, W.; Suriyagoda, L.; Lambers, H. Tightening the phosphorus cycle through phosphorus-efficient crop genotypes. Trends Plant Sci. 2020, 25, 967–975. [Google Scholar] [CrossRef]
  12. Soltangheisi, A.; Haygarth, P.M.; Pavinato, P.S.; Cherubin, M.R.; Teles, A.P.B.; Bordonal, R.O.; Carvalho, J.L.N.; Withers, P.J.A.; Martinelli, L.A. Long term sugarcane straw removal affects soil phosphorus dynamics-sciencedirect. Soil Till. Res. 2021, 208, 1048989. [Google Scholar] [CrossRef]
  13. Williams, A.; Kay, P.; Stirling, G.; Weng, X.; Bell, L. Impacts of reducing fallow periods on indicators of soil function in subtropical dryland farming systems. Agric. Ecosyst. Environ. 2022, 324, 107727. [Google Scholar] [CrossRef]
  14. Ma, R.; Dou, S.; Zhang, Y.; Wu, D.; Ndzelu, B.S.; Xie, S.; YaLiHong, D. Different soil particle size changes the 15N retention in soil and 15N utilization by maize. Sci. Total Environ. 2022, 843, 157133. [Google Scholar] [CrossRef] [PubMed]
  15. Phong, N.; Yoon, H.; Kang, M.; Mina, L.; Yesol, B.; Ji, M.; Eun, J.; Kyoung, S.; Dong, W.; Ki, S.; et al. Ionic liquid-based extraction of fulvic-like substances from wood sawdust: Reproducing unique biological activities of fulvic acids using renewable natural sources. J. Agric. Food Chem. 2024, 72, 20981–20990. [Google Scholar] [CrossRef] [PubMed]
  16. Zhao, Y.; Hao, Y.; Cheng, K.; Wang, L.; Dong, W.; Liu, Z.; Yang, F. Artificial humic acid mediated migration of phosphorus in soil: Experiment and modelling. Catena 2024, 238, 107896. [Google Scholar] [CrossRef]
  17. Lu, M.; Yang, M.; Yang, Y.; Wang, D.; Sheng, L. Soil carbon and nutrient sequestration linking to soil aggregate in a temperate fen in Northeast China. Ecol. Indic. 2019, 98, 869–878. [Google Scholar] [CrossRef]
  18. Milić, S.; Ninkov, J.; Vasin, J.; Zeremski, T.; Jakšić, S.; Živanov, M.; Šeremešić, S.; Milić, D. Organic Phosphorus Fractions in Relation to Soil Aggregate Fractions of Black Soil. Agronomy 2024, 14, 1022. [Google Scholar] [CrossRef]
  19. Shi, X.Z.; Yu, D.S.; Warner, E.D.; Sun, W.X.; Petersen, G.W.; Gong, Z.T. Cross-Reference System for Translating Between Genetic Soil Classification of China and Soil Taxonomy. Soil Sci. Soc. Am. J 2006, 70, 78–83. [Google Scholar] [CrossRef]
  20. Antonio, G.; Oriol, O.; David, B.; Clara, M. Effects of prescribed burning on soil organic C, aggregate stability and water repellency in a subalpine shrubland: Variations among sieve fractions and depths. Catena 2018, 166, 68–77. [Google Scholar] [CrossRef]
  21. Zhang, S.; Chen, S.; Jin, J.; Wu, G.; Bolan, N.S.; White, J.R.; Shaheen SMRinklebe, J.; Chen, Q. Incorporation of calcium cyanamide and straw reduces phosphorus leaching in a flooded agricultural soil. Geoderma 2022, 428, 116150. [Google Scholar] [CrossRef]
  22. Maranguit, D.; Guillaume, T.; Kuzyakov, Y. Land-use change affects phosphorus fractions in highly weathered tropical soils. Catena 2017, 149, 385–393. [Google Scholar] [CrossRef]
  23. Schermelleh-Engel, K.; Moosbrugger, H.; Hans, M. Evaluating the fit of structural equation models: Tests of significance and descriptive goodness-of-fit measures. Int. J. Meth. Psych. Res. 2003, 8, 23–74. [Google Scholar]
  24. Yinglan, A.; Wang, G.; Liu, T.; Shrestha, S.; Tan, Z. Vertical variations of soil water and its controlling factors based on the structural equation model in a semi-arid grassland. Sci. Total Environ. 2019, 691, 1016–1026. [Google Scholar] [CrossRef]
  25. Urrutia, O.; Guardado, I.; Erro, J.; Mandado, M.; Garcia-Mina, J.M. Theoretical chemical characterization of phosphate-metal-humic complexes and relationships with their effects on both phosphorus soil fixation and phosphorus availability for plants. J. Sci. Food. Agr. 2013, 93, 293–303. [Google Scholar] [CrossRef]
  26. Yuan, Y.; Gai, S.; Tang, C.; Jin, Y.; Cheng, K.; Antonietti, M.; Yang, F. Artificial humic acid improves maize growth and soil phosphorus utilization efficiency. Appl. Soil Ecol. 2022, 179, 104587. [Google Scholar] [CrossRef]
  27. Beck, M.A.; Sanchez, P.A. Soil phosphorus fraction dynamics during 18 years of cultivation on a typic paleudult. Soil Sci. Soc. Am. J. 1994, 34, 1424–1431. [Google Scholar] [CrossRef]
  28. Gao, Y.; Tariq, A.; Zeng, F.; Graciano, C.; Zhang, Z.; Sardans, J.; Peuelas, J. Allocation of foliar-p fractions of alhagi sparsifolia and its relationship with soil-p fractions and soil properties in a hyperarid desert ecosystem. Geoderma 2022, 407, 115546. [Google Scholar] [CrossRef]
  29. Vance, C.P.; Uhde-Stone, C.; Allan, D.L. Phosphorus acquisition and use: Critical adaptations by plants for securing a nonrenewable resource. New Phytol. 2003, 157, 423–447. [Google Scholar] [CrossRef]
  30. Antelo, J.; Arce, F.; Avena, M.; Fiol, S.; Lopez, R.; Macias, F. Adsorption of a soil humic acid at the surface of goethite and its competitive interaction with phosphate. Geoderma 2007, 138, 12–19. [Google Scholar] [CrossRef]
  31. Xing, B.; Ouyang, M.; Graham, N.; Yu, W. Enhancement of phosphate adsorption during mineral trans-formation of natural siderite induced by humic acid: Mechanism and application. Chem. Eng. J. 2020, 393, 124730. [Google Scholar] [CrossRef]
  32. Datta, A.; Sanyal, S.K.; Saha, S. A study on natural and synthetic humic acids and their complexing ability towards cadmium. Plant Soil 2001, 235, 115–125. [Google Scholar] [CrossRef]
  33. Liu, X.; Yang, J.; Tao, J.; Yao, R.; Li, W.; Xie, W.; Wang, X. Effects of the combined application of biochar and humic substances on the improvement of saline cropland in the Yellow River Delta of China. Land Degrad. Dev. 2023, 34, 4793–4809. [Google Scholar] [CrossRef]
  34. Jing, J.; Zhang, S.; Yuan, L.; Li, Y.; Lin, Z.; Xiong, Q.; Zhao, B. Combining humic acid with phosphate fertilizer affects humic acid structure and its stimulating efficacy on the growth and nutrient uptake of maize seedlings. Sci. Rep. 2020, 10, 17502. [Google Scholar] [CrossRef]
  35. Jalali, M.; Ranjbar, F. Aging effects on phosphorus transformation rate and fractionation in some calcareous soils. Geoderma 2010, 155, 101–106. [Google Scholar] [CrossRef]
  36. Sun, Q.; Qiu, H.; Hu, Y.; Wei, X.; Chen, X.; Ge, T.; Wu, J.; Su, Y. Cellulose and lignin regulate partitioning of soil phosphorus fractions and alkaline phosphomonoesterase encoding bacterial community in phosphorus-deficient soils. Biol. Fert. Soils. 2019, 55, 31–42. [Google Scholar] [CrossRef]
  37. Boilard, G.; Bradley, R.L.; Paterson, E.; Sim, A.; Carubba, A. Interaction between root hairs and soil phosphorus on rhizosphere priming of soil organic matter. Soil Biol. Biochem. 2019, 135, 264–266. [Google Scholar] [CrossRef]
  38. Yuan, Y.; Tang, C.; Jin, Y.; Cheng, K.; Yang, F. Contribution of exogenous humic substances to phosphorus availability in soil-plant ecosystem: A review. Crit. Rev. Environ. Sci. Technol. 2023, 53, 1085–1102. [Google Scholar] [CrossRef]
  39. Pukalchik, M.; Kydralieva, K.; Yakimenko, O.; Fedoseeva, E.; Terekhova, V. Outlining the potential role of humic products in modifying biological properties of the soil-a review. Front. Environ. Sci. 2019, 7, 80. [Google Scholar] [CrossRef]
Figure 1. SEM, TEM, and FTIR spectra of artificial humic acid.
Agronomy 15 02482 g001
Figure 2. Concentrations of NaHCO3-P (A), NaOH-P (B), HCl-P (C), and Olsen-P (D) in soils with the addition of AHA in different soil particle sizes. (The significance analysis labeled in the figure is for different particle size treatments. The bar graphs represent the average values of different P components under each treatment, and the lines above the bars indicate the standard error. The letters a, b, c, and d in the figure denote statistically distinct groups from the significance analysis. The red line in the figure represents the comparison of phosphorus content in the 2mm soil fraction between day 10 and day 60 after the addition of AHA. The blue line in the figure represents the comparison of phosphorus content in the 2mm soil fraction of the CK group between day 10 and day 60.)
Agronomy 15 02482 g002
Figure 3. Changes in the concentrations of Olsen-P (A), NaHCO3-P (B), NaOH-P (C) and HCl-P (D) in the soil incubation cycle without and with the addition of AHA and at different depths in the soil profile Olsen-P (E,I), NaHCO3-P (F,J), NaOH-P (G,K) and HCl-P (H,L). (The bar graphs represent the average values of different P components under each treatment, and the lines above the bars indicate the standard error. The yellow dashed line denotes the HCl-P content in CK at 30 cm; the red dashed line denotes the Olsen-P content following AHA amendment at 20 cm; and the blue dashed line denotes the HCl-P content at 40 cm. These dashed lines are designated to serve as a visual aid for the direct comparison of P levels across the specified depths.)
Agronomy 15 02482 g003
Figure 4. Concentration changes in Olsen-P (A), NaHCO3-P (B), NaOH-P (C), and HCl-P (D) during the soil incubation cycle under conditions of AHA addition at 10–20 cm depth and AHA addition at 30–40 cm depth, and concentration changes in Olsen-P (E,I), NaHCO3-P (F,J), NaOH-P (G,K), and HCl-P (H,L) at different depths in the soil profile. (The bar graphs represent the average values of different P components under each treatment, and the lines above the bars indicate the standard error. The green dashed line indicates the Olsen-P content at 10 cm soil depth when applying AHA at 10–20 cm intervals. The blue and red dashed lines represent the soil Olsen-P content on day 60 under the conditions of AHA addition at the 10–20 cm and 30–40 cm. These dashed lines are designated to serve as a visual aid for the direct comparison of P levels.)
Agronomy 15 02482 g004
Figure 5. Structural equation model of Olsen-P, NaHCO3-P, NaOH-P, and HCl-P transformations. Numbers next to the arrows indicate standardized path coefficients and asterisks mark their significance: *** p < 0.001, ** p < 0.01. (CMIN/DF: Chi-square Minimum/Degrees of Freedom; GFI: Goodness-of-Fit Index; CFI: Comparative Fit Index; NFI: Normed Fit Index; RMSEA: Root Mean Square Error of Approximation. Positive and negative path coefficients are represented by red and blue lines with arrows.)
Agronomy 15 02482 g005
Table 1. Evaluation parameters of the structural equation model.
CMIN/DFGFICFINFIRMSEA
1.8260.9210.9960.9900.071
CMIN/DF: Chi-square Minimum/Degrees of Freedom; GFI: Goodness-of-Fit Index; CFI: Comparative Fit Index; NFI: Normed Fit Index; RMSEA: Root Mean Square Error of Approximation.
Table 2. Basic physical and chemical properties of soil.
pHConductivityOlsen-PTotal NitrogenOrganic MatterCation Exchange CapacityZeta
μS/cmmg/kgg/kgg/kgmmolc/kgmV
soil7.15
±0.05
196.53
±5.42
7.44
±1.64
1.44
±0.19
6.51
±0.38
3.1
±0.1
−3.65
±0.16
Table 3. Analysis of variance summary table.
dfFp
Olsen-PApplication Method of AHA35.1230.002
Incubation Time544.907<0.001
Soil depth41.2940.274
NaHCO3-PApplication Method of AHA33.1400.026
Incubation Time548.492<0.001
Soil depth40.5470.702
NaOH-PApplication Method of AHA32.3320.050
Incubation Time550.056<0.001
Soil depth41.1480.335
HCl-PApplication Method of AHA39.673<0.001
Incubation Time587.084<0.001
Soil depth46.034<0.001
Application Method of AHA—Soil depth104.107<0.001
df: degree of freedom; F: F = between-groups variance/within-groups variance; p: probability value.
Disclaimer/Publisher’s Note: The statements, opinions and data contained in all publications are solely those of the individual author(s) and contributor(s) and not of MDPI and/or the editor(s). MDPI and/or the editor(s) disclaim responsibility for any injury to people or property resulting from any ideas, methods, instructions or products referred to in the content.