Article

Synergistic Regulation of Vegetation Greening and Climate Change on the Changes in Evapotranspiration and Its Components in the Karst Area of China

1
Key Laboratory of the Evaluation and Monitoring of Southwest Land Resources (Ministry of Education), Sichuan Normal University, Chengdu 610068, China
2
College of Grassland Agriculture, Northwest A&F University, Xinong Road 22, Yangling 712100, China
3
College of Water Resources and Architectural Engineering, Northwest A&F University, Yangling 712100, China
4
Institute of Soil and Water Conservation, Northwest A&F University, Yangling 712100, China
*
Authors to whom correspondence should be addressed.
Agronomy 2025, 15(10), 2375; https://doi.org/10.3390/agronomy15102375
Submission received: 11 September 2025 / Revised: 4 October 2025 / Accepted: 7 October 2025 / Published: 11 October 2025

Abstract

The fragile karst ecosystem in Southwest China faces severe water scarcity. Since 2000, large-scale ecological restoration programs (e.g., the “Grain for Green” Program) have substantially increased vegetation coverage. Concurrently, climate change has manifested as a distinct warming trend and heightened drought risk in recent decades. Therefore, understanding the synergistic and competing effects of climate change and vegetation restoration on regional evapotranspiration (ET) is critical for projecting water budgets and ensuring the sustainability of ecosystems and water resources within this vital ecological barrier region. This study employs a dual-scenario PT-JPL model (simulating natural vegetation dynamics versus constant coverage) integrated with Sen + MK trend analysis to quantify the spatiotemporal patterns of ET and its components—canopy transpiration (ETc), interception evaporation (ETi), and soil evaporation (ETs)—in Southwest China’s karst region (2000–2018). Furthermore, multiple regression analysis and SEM were utilized to investigate the driving mechanisms of vegetation and climatic factors (temperature, precipitation, radiation, and relative humidity) on changes in ET and its components. The key results demonstrate the following: (1) Vegetation restoration exerted a net positive effect on total ET (+0.44 mm/a) through enhanced ETi (+0.22 mm/a) and ETs (+0.37 mm/a), despite reducing ETc (−0.08 mm/a), revealing trade-offs in water allocation. (2) Radiation dominated ET variability (66.45% of the area exhibiting >50% contribution), while temperature exhibited the most extensive spatial dominance (44.02% of the region), and relative humidity exhibited drought-mediated dual effects (promoting ETi while suppressing ETc). (3) Precipitation exhibited minimal direct influence. Vegetation restoration and climate change collectively drive ET dynamics, with ETc declines indicating potential water stress. These findings elucidate the synergistic regulation of vegetation restoration and climate change on karst ecohydrology, providing critical insights for water resource management in fragile ecosystems globally.

1. Introduction

Evapotranspiration (ET) constitutes a crucial component of the hydrological cycle and climatic system, profoundly influencing water resource management, agricultural irrigation, ecosystem health, and regional sustainable development. ET encompasses vegetation transpiration and evaporation from soil, water bodies, and canopies. It acts as a major regulator of the water cycle and represents a key pathway for land–atmosphere energy exchange [1]. As the second-largest hydrological flux in terrestrial ecosystems after precipitation, ET returns approximately 60% of global terrestrial precipitation to the atmosphere [2]. Its dynamics directly impact the water supply capacity of surface ecosystems and are critical for accurately quantifying regional water budgets and analyzing water use efficiency. Climate change further influences ET by altering atmospheric moisture capacity and vegetation patterns [3]. Therefore, quantifying the effects of climate change on regional ET is vital for understanding hydrological interactions and supporting optimized water resource management [4].
Existing studies highlight that land use and climatic factors (e.g., temperature, precipitation, radiation, wind speed) jointly regulate the spatiotemporal distribution of water resources, resulting in substantial regional heterogeneity in ET patterns. Even in climatically stable regions, changes in the underlying surface can significantly alter ET patterns. For instance, in the Yellow River Basin, precipitation and Normalized Difference Vegetation Index (NDVI) are the primary drivers of ET, with minimal influence from slope, while the synergy between precipitation and altitude plays a dominant role [5]. Research in China’s northern transitional climate zone reveals that ET decreases under arid climates but increases under humid conditions. Comparative studies across different ecosystems demonstrate that: solar radiation primarily controls interannual ET fluctuations on the Loess Plateau and Inner Mongolia grasslands; plant transpiration dominates alpine meadows; and soil moisture and air humidity regulate ET in Qinghai spruce forests [6]. Conversely, sparse vegetation restricts transpiration in arid alpine steppes. Studies using the Budyko framework have also elucidated climate and geomorphic impacts on ET across karst watersheds [7]. Nevertheless, given the pronounced spatial heterogeneity of ET drivers, extrapolating findings across regions is challenging. China’s complex continental climate and varied topography lead to spatially divergent ET controls, where climatic factors may dominate in some areas but be secondary in others. A deeper understanding of these regional variations is essential for developing targeted water resource management and vegetation restoration strategies.
Southwest China’s karst region features a mild climate, favorable hydrothermal conditions, and high vegetation coverage, serving as a vital agricultural zone and ecological security barrier [8]. However, it exhibits high ecological fragility due to shallow soil, poor edaphic properties, and susceptibility to erosion [9]. As one of the world’s largest contiguous karst systems, it features thin soil layers over permeable bedrock, leading to rapid subsurface water loss and frequent “engineering water scarcity” despite abundant precipitation [10]. Ecological restoration projects, such as China’s Grain for Green Program initiated in 2000, have significantly improved vegetation coverage and altered land use/cover patterns [8]. These changes directly and indirectly affect the regional water balance [11], while also enhancing carbon storage, mitigating climate change, and reducing soil erosion, yielding multiple environmental benefits [12]. In recent decades, pronounced warming and a declining precipitation trend have increased drought risk in Southwest China’s karst region, raising concerns over the sustainability of large-scale vegetation restoration under a warming and drying climate [13]. The distinctive geological setting of karst areas further complicates regional ET processes. Meanwhile, climate evolution affects ET both directly and through vegetation feedbacks. Currently, although some studies have focused on hydrological changes in karst watersheds, quantitatively disentangling the synergistic regulation of climate change and vegetation restoration on the dynamics of evapotranspiration and its components across the karst watersheds, and clarifying the underlying driving mechanisms, remains a prominent scientific challenge.
This study employed the PT-JPL model to quantify the spatiotemporal responses of ET and its components (ETc, ETi, and ETs) under contrasting scenarios of dynamic vegetation evolution and static vegetation cover (constant cover) in the karst region of Southwest China from 2000 to 2018. This analysis systematically elucidated the driving mechanisms of climate and vegetation changes on regional ET dynamics and its component variations. Consequently, the research addressed two core objectives: (1) to quantify the net effect of vegetation restoration on ET and its components, thereby revealing the magnitude and spatial heterogeneity of hydrological changes induced by ecological engineering; and (2) to disentangle the spatiotemporal evolution patterns of vegetation and climatic factors through integrated multi-method analysis, enabling a quantitative assessment of the coupled climate-vegetation contributions to ET changes. These findings establish a crucial theoretical foundation for understanding water cycling processes in karst and analogous fragile ecosystems. The scientific evaluation of climate-vegetation synergistic influences and their relative contributions to ET dynamics offers critical insights for sustainable water resource management under climate change.

2. Materials and Methods

2.1. Overview of the Study Area

This study focuses on the karst region of Southwest China (24°37′–29°13′ N, 103°36′–109°35′ E), encompassing parts of Guizhou, Yunnan, Sichuan, and Chongqing provinces (Figure 1). As shown in the geological map of Figure S1, the entire study area is situated within the Yunnan-Guizhou Plateau karst system, one of the world’s largest contiguous karst regions, and its bedrock is predominantly composed of carbonate rocks (limestone and dolomite). The region exhibits significant topographic variation with higher elevations in the northwest and lower elevations in the southeast (Figure 1a). Land cover is characterized by forests, grasslands, and croplands (Figure 1b). These ecosystems play a critical role in maintaining ecological balance and form a nationally significant ecological barrier. However, the widespread karst landforms, characterized by steep slopes and exposed bedrock, combined with long-term human activities, have led to severe soil erosion, posing substantial ecological challenges [14]. The dominant vegetation consists of tropical and subtropical forests, with favorable climatic conditions—characterized by warm temperatures, abundant precipitation, and concurrent precipitation and warmth—supporting high biodiversity and making this region an important potential ecological carbon sink in China. In recent decades, large-scale ecological restoration projects have been implemented, mitigating rocky desertification and promoting vegetation recovery [15]. Sustainable vegetation management through these initiatives provides valuable insights for restoring fragile ecosystems and achieving regional sustainable development.

2.2. Data Sources and Processing

2.2.1. Remote Sensing Data

This study utilized multi-source remote sensing datasets, primarily including satellite remote sensing retrieval products and vegetation index data. Among them, the LAI data were obtained from the Global Land Surface Satellite (GLASS) product (https://glass-product.bnu.edu.cn/; accessed on 17 April 2025), with a spatial resolution of 0.05° and a temporal resolution of 8 days. The MODIS vegetation index product (MOD13A3) was resampled to a spatial resolution of 0.05° × 0.05° using bilinear interpolation to achieve spatial alignment with other datasets. Table S1 provides a detailed description of the key data sources.

2.2.2. ET Data

The ET data used in this study were obtained from the Global Land Evaporation Amsterdam Model (GLEAM) version 4.2. The GLEAM ET dataset was used primarily for validating the total ET simulated by the PT-JPL model in this study, as it provides a well-established, independent benchmark for regional-scale analyses. It was selected due to its physically-based partitioning of ET components, which is essential for our analysis, and its proven performance in capturing soil moisture stress dynamics relevant to the water-limited karst environment. This dataset features a spatial resolution of 1 km and covers the period 2000–2018. The original NetCDF-format data, referenced to the WGS-84 geographic coordinate system, were acquired via the Google Earth Engine (GEE) cloud computing platform (https://code.earthengine.google.com/; accessed on 12 April 2025).

2.2.3. Climate Data

Meteorological variables were sourced from the China Meteorological Forcing Dataset (CMFD v2.0), available through the National Tibetan Plateau Data Center (https://data.tpdc.ac.cn/zh-hans/data/e60dfd96-5fd8-493f-beae-e8e5d24dece4; accessed on 10 May 2025). It includes near-surface air temperature (Tem), precipitation (Pre), downward shortwave radiation (Rad), downward longwave Rad, and relative humidity (RH), with a 3-h temporal resolution and 0.1° spatial resolution. The dataset spans a 70-year period (1951–2020) and covers terrestrial areas within 70° E–140° E and 15° N–55° N.

2.2.4. Land Cover Data

Land use/cover data were derived from the China Land Cover Dataset (CLCD), a 30 m resolution annual product developed by Prof. Jie Yang and Prof. Xin Huang of Wuhan University (https://zenodo.org/records/12779975; accessed on 19 August 2024). This dataset classifies land cover into nine categories: cropland, forest, shrubland, grassland, water, snow/ice, barren land, impervious surface, and wetland.

2.3. Research Methodology

2.3.1. PT-JPL Model Framework for ET Estimation

The Priestley-Taylor Jet Propulsion Laboratory (PT-JPL) model was implemented as a spatially explicit framework within a geographic information system (GIS) environment to simulate ET across stand-level to regional scales. This approach integrates remotely sensed vegetation dynamics to enhance ET simulation accuracy, partitioning total ET into three components [16]: canopy transpiration (ETc), soil evaporation (ETs), and interception evaporation (ETi), with governing equations and associated parameters detailed below.
E T = E T c + E T i + E T s
E T c = 1 f w e t f g f t f m α Δ Δ + γ R n c
E T s = 1 f w e t + f s m 1 f w e t α Δ Δ + γ R n s G
E T i = f w e t α Δ Δ + γ R n c
f w e t = R H 4
f c = f I P A R
f g = f A P A R f I P A R
f t = e x p T T o p t T o p t 2 2
f m = f A P A R + 1 f A P A R m a x + 1
f s m = R H V P D / β
f A P A R = b 1 × 1 e x p k 1 × L A I
f I P A R = b 2 × 1 e x p k 2 × L A I
R H = 0.263 × s h u m × p r e s s × e x p 17.67 T T 0 T 29.65 1
G = R n Γ c + 1 M Γ s Γ c
In these equations, the parameters are set as follows: The Priestley-Taylor coefficient ( α ) is set to 1.26; the extinction coefficient (kRn) is 0.6. For the calculation of the fraction of absorbed photosynthetically active Rad ( f A P A R ) and the fraction of intercepted photosynthetically active Rad ( f I P A R ), parameters b1 and b2 are set to 0.95 and 0.9355, respectively. Topt denotes the optimal Tem for plant growth; β is an indicator of soil moisture constraint sensitivity to vapor pressure deficit (VPD) ranges from 0 to 1. T0 is the standard Tem, 273.16 K. G represents soil heat flux. Γ c and Γ s are parameters for the high-quality vegetation cover region and high-quality bare soil region, set to 0.05 and 0.325, respectively. M represents monthly fractional vegetation cover [17]. Detailed parameter descriptions are provided in Tables S2 and S3.

2.3.2. Validation Metrics for the PT-JPL Model Results

To quantitatively evaluate the predictive accuracy and goodness-of-fit of the developed model(s), two widely recognized statistical metrics were employed: the Root Mean Squared Error (RMSE) and the Coefficient of Determination (R2). The validation was conducted by comparing the spatially averaged annual total ET values from all pixels within the study area, simulated by the PT-JPL model, against the corresponding aggregated values from the GLEAM dataset for each year of the study period (2000–2018). These metrics provide complementary perspectives on model performance:
R M S E = 1 n i = 1 n θ i o b s θ i s i m 2
R 2 = 1 i = 1 n y i y i ^ 2 i = 1 n y i y i ¯ 2
In these equations, n denotes the sample size, θ i s i m represents the simulated value from the model, θ i o b s represents the observed value, y i is the observed value for the i-th sample, y i ^ is the corresponding predicted value, and y i ¯ is the mean of all observed values. R2 value closer to 1 indicates that a larger proportion of variance is explained by the model.

2.3.3. Scenario Design

To quantify the impact of vegetation changes on net surface evaporation, two scenarios were simulated using the PT-JPL model: (1) dynamic vegetation coverage (involving forest, grassland, cropland, and shrubland), and (2) constant vegetation coverage. Under the dynamic scenario, net surface evaporation was calculated considering natural vegetation succession. Under the constant scenario, vegetation coverage was fixed at the initial state (year 2000) throughout the study period (2000–2018), thereby isolating the effects of subsequent environmental, climatic, and ecological policy changes [18]. By comparing the simulation results between these two scenarios, the net effect of vegetation changes on net surface evaporation in the Southwest Karst region from 2000 to 2018 was quantified.

2.3.4. Trend Analysis

The Theil–Sen slope estimator combined with the Mann–Kendall (MK) test was employed to quantitatively analyze the spatiotemporal trends of vegetation ET and additional meteorological factors in the Southwest Karst region during 2000–2018. The Theil–Sen approach is robust against missing data and outliers in time series, providing more accurate trend estimation compared to simple linear regression and ordinary least squares (OLS) methods. The Theil–Sen estimator is calculated using Equation (17):
S l o p e = M e d i a n X m X n m n , m < n
In the formula, the M e d i a n ( ) function computes the median value. The slope represents the estimated Theil–Sen slope for all pairs where m ≠ n. X m and X n denote the values of variable X in m year and n year, respectively, where m and n are indices representing different years.
The MK test was employed to assess the overall trend within the time series data. Trends were categorized into five levels of statistical significance: highly significant increase, significant increase, no significant change, significant decrease, and highly significant decrease.

2.3.5. Partial Correlation Analysis

Partial correlation (PC) measures the association between two variables while controlling for the influence of one or more other variables. This method accounts for the complex interrelationships among variables when establishing their relationships. The first-order partial correlation coefficient (controlling for k = 1) between variables X and Y is calculated using Equation (18):
r X Y , Z = r X Y r X Z r Y Z 1 r X Z 2 1 r Y Z 2
where r X Y , Z denotes the partial correlation coefficient between variables X and Y while controlling for variable Z. This coefficient quantifies the linear relationship between the dependent variable Y and the independent variable X, holding the independent variable Z constant.

2.3.6. Multiple Regression Analysis of ET

Multiple regression analysis (MRA) was employed to determine the relative contributions of different drivers to ET in the Southwest Karst region [19]. Based on the assumptions of linearity and independence of the predictor variables, MRA utilizes sample data to estimate regression coefficients. This allows for the prediction of the dependent variable’s value and describes the linear relationship between the dependent variable and multiple independent variables. The calculations were performed using the following equations:
Y = a 0 + a 1 X 1 + a 2 X 2 + + a i X i + μ
Q i = a i i = 1 n a i
where Y represents the detrended and normalized ET, ETc, ETi, or ETs in the Karst region. X 1 , X 2 , …, X i denote the values of the independent variables. a i represents the standardized partial regression coefficient for the corresponding independent variable. a 0 is the constant term; μ is the residual error. Q i represents the contribution of the i th independent variable.

2.3.7. Path Analysis

Partial Least Squares Structural Equation Modeling (PLS-SEM) is a method employed to explore and test hypotheses regarding relationships within complex systems. It facilitates comprehensive and precise analysis of mediating effects in highly intricate models. In this study, PLS-SEM analysis was performed using SmartPLS software (version 4.1.1.4; SmartPLS GmbH, Oststeinbek, Germany). The model demonstrated satisfactory goodness-of-fit, with the Standardized Root Mean Square Residual (SRMR) value below 0.08.

3. Results

3.1. PT-JPL Model Validation Against GLEAM ET

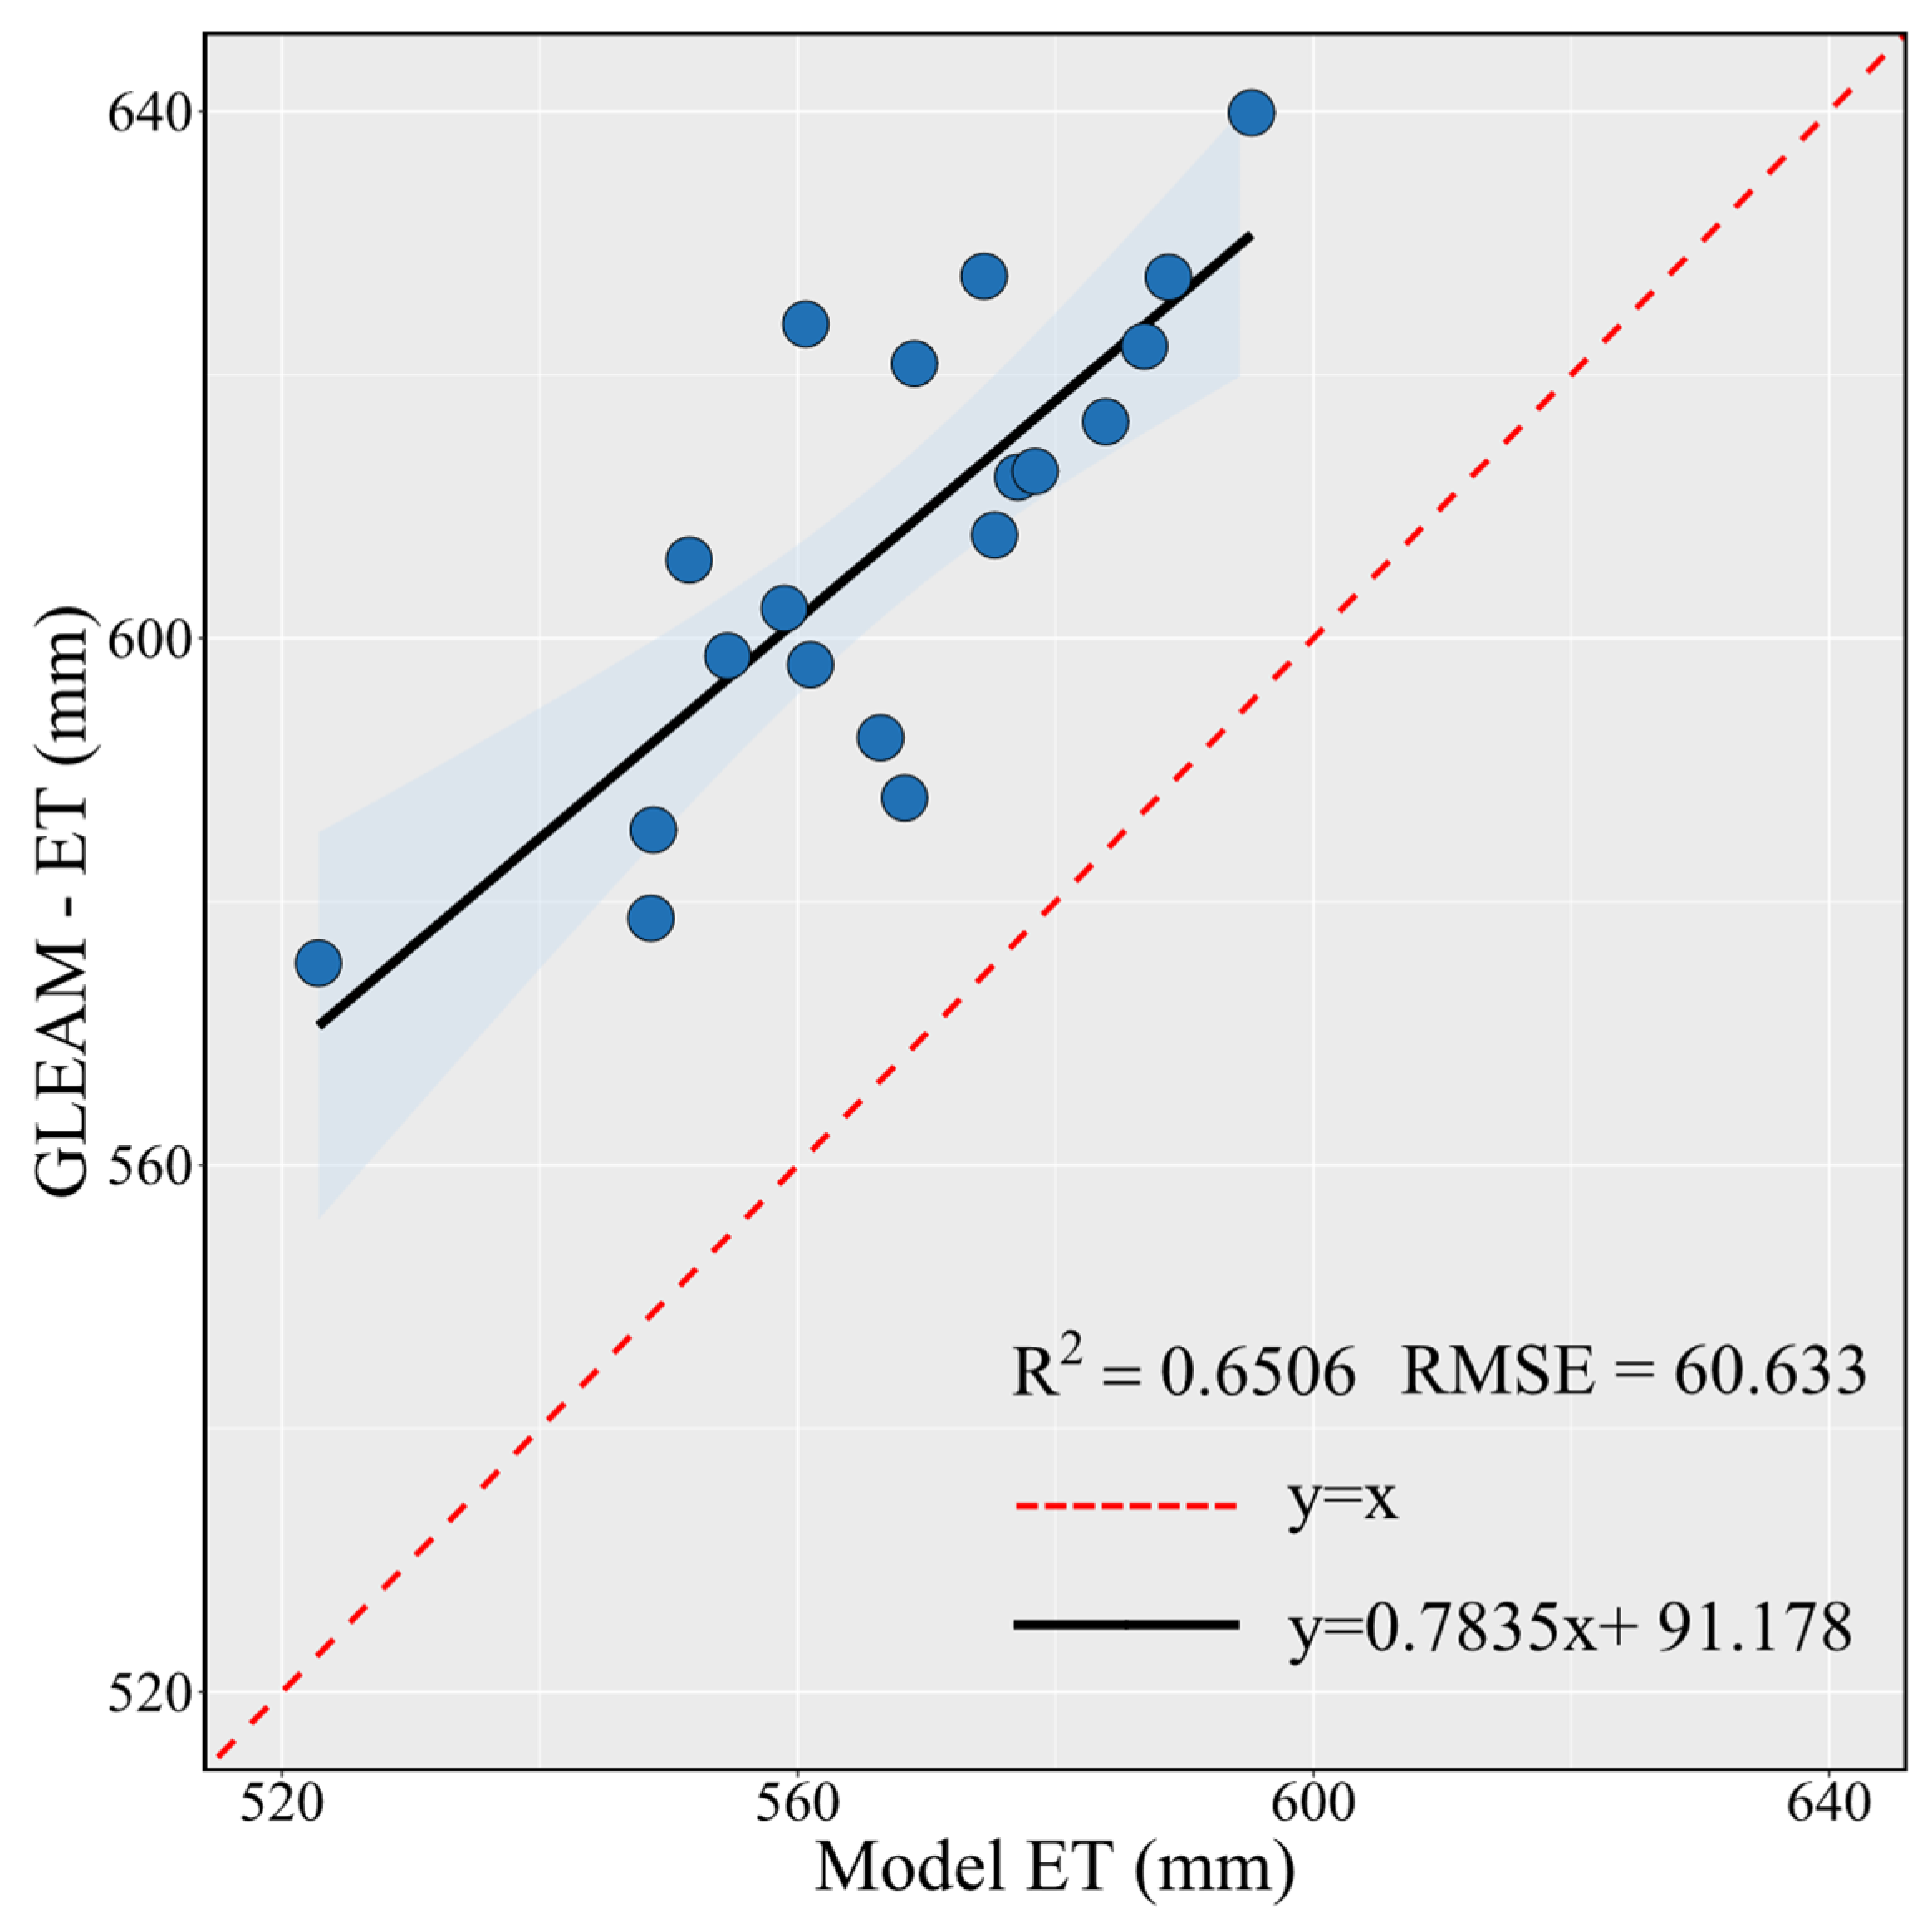
Based on the results of ET analysis over the southwest karst region using the PT-JPL model and GLEAM product shown in Figure 2, the MODIS ET product was validated against the annual ET simulated by the PT-JPL model using the coefficient of determination (R2) and root mean square error (RMSE) as evaluation metrics. The validation yielded an R2 of 0.65 and an RMSE of 60.63 mm/a. These statistically significant correlation coefficients indicate a high degree of consistency between the PT-JPL simulated ET and the GLEAM ET data in this region, demonstrating the reliability of the model simulations.

3.2. Spatiotemporal Patterns of Climatic Factors

The spatial distribution of Tem exhibited pronounced heterogeneity, characterized by higher values in the southeast and lower values in the northwest, with maximum and minimum values of 24.03 °C and 10.14 °C, respectively (Figure S2). Pre ranged from 464.78 mm to 2428.66 mm, exhibiting a northwest-to-southwest increasing gradient, with the driest areas concentrated in northern Sichuan and Yunnan. Rad ranged between 120.06 W/m2 and 221.92 W/m2, with higher values in the west and lower values in the east (Figure S2). RH varied from 42.55% and 88.97%, which is generally lower in the western region (Figure S2).
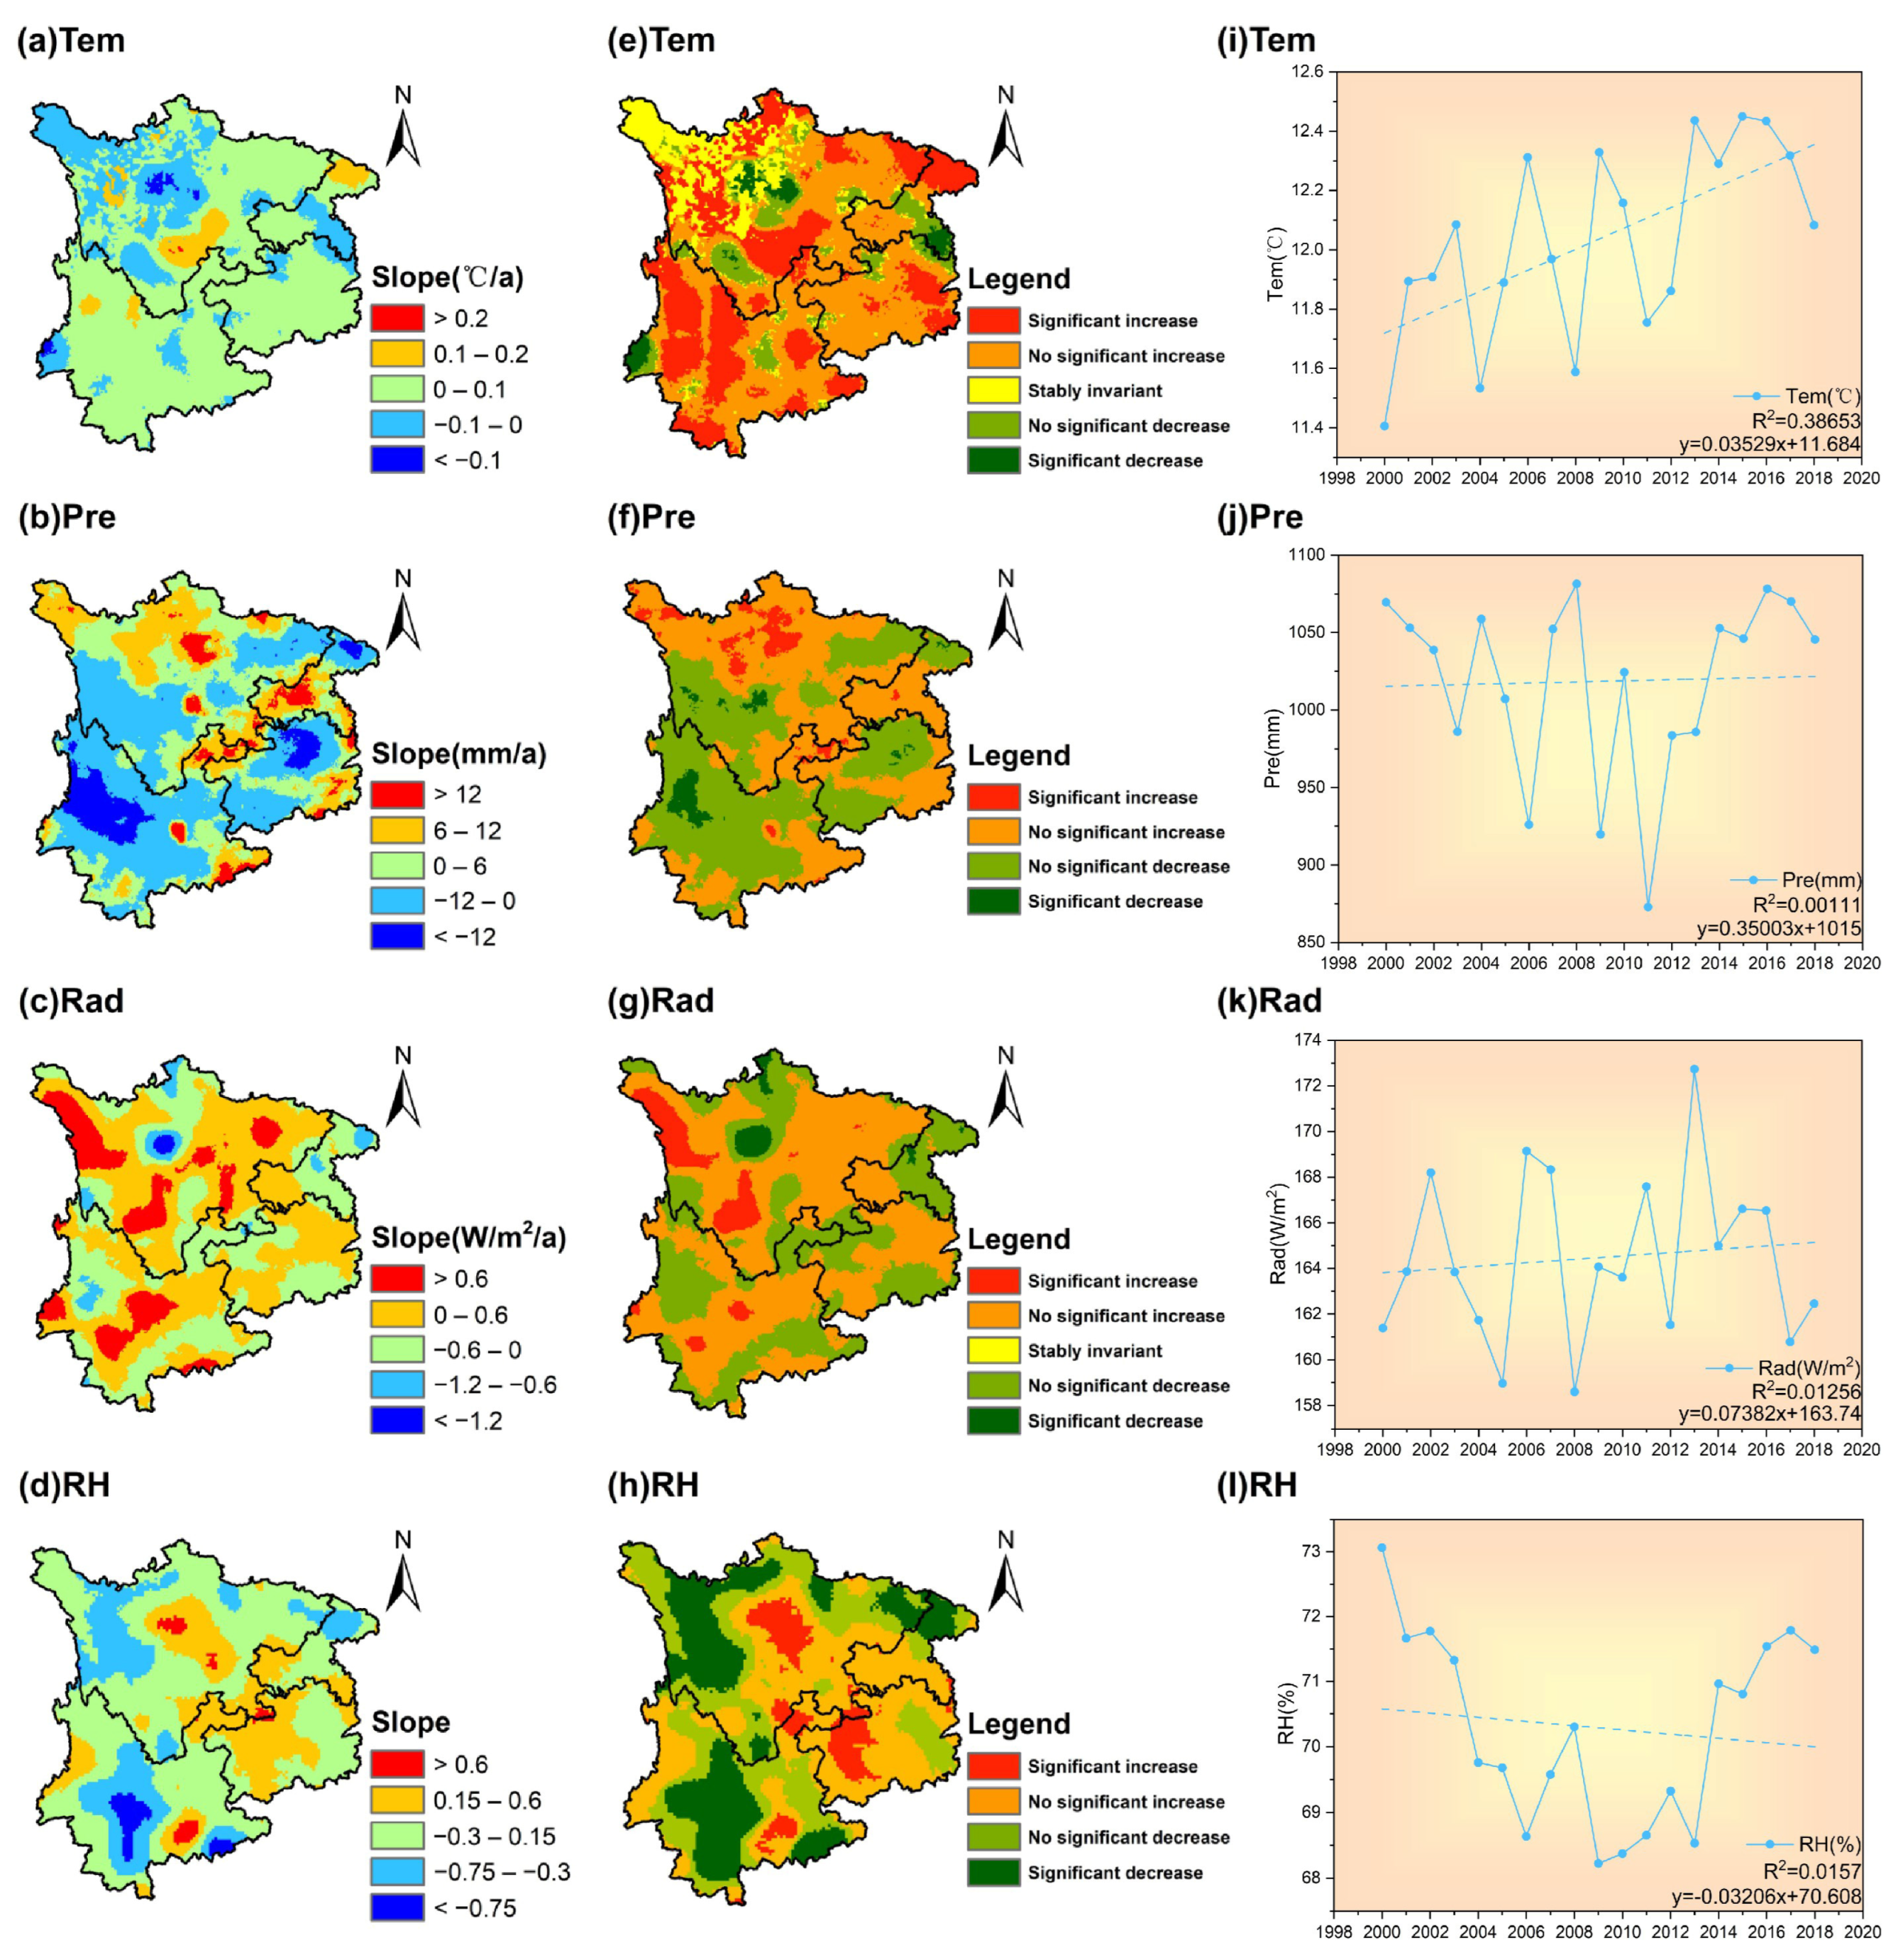
From 2000 to 2018, Tem increased across most of Southwest China’s karst region (Figure 3a), with 30.97% of areas showing a significant increase and only 2.79% decreasing significantly (Figure 3e). Pre increased markedly in northern areas (>6 mm/a) but declined in Yunnan and Guizhou (<−12 mm/a). Rad rose significantly in parts of Sichuan and Yunnan (>0.6 W/m2/a), while decreasing in some Sichuan areas (<−1.2 W/m2/a) (Figure 3c,g). RH decreased notably in all provinces except Guizhou, with 23.92% of areas showing significant reduction (Figure 3h). Regional Tems, Pre, and Rad exhibited upward trends (Figure 3i–k), with growth rates exceeding 0.04 °C/a, 0.35 mm/a and 0.07 W/m2/a.

3.3. Climatic Controls on ET and Its Components

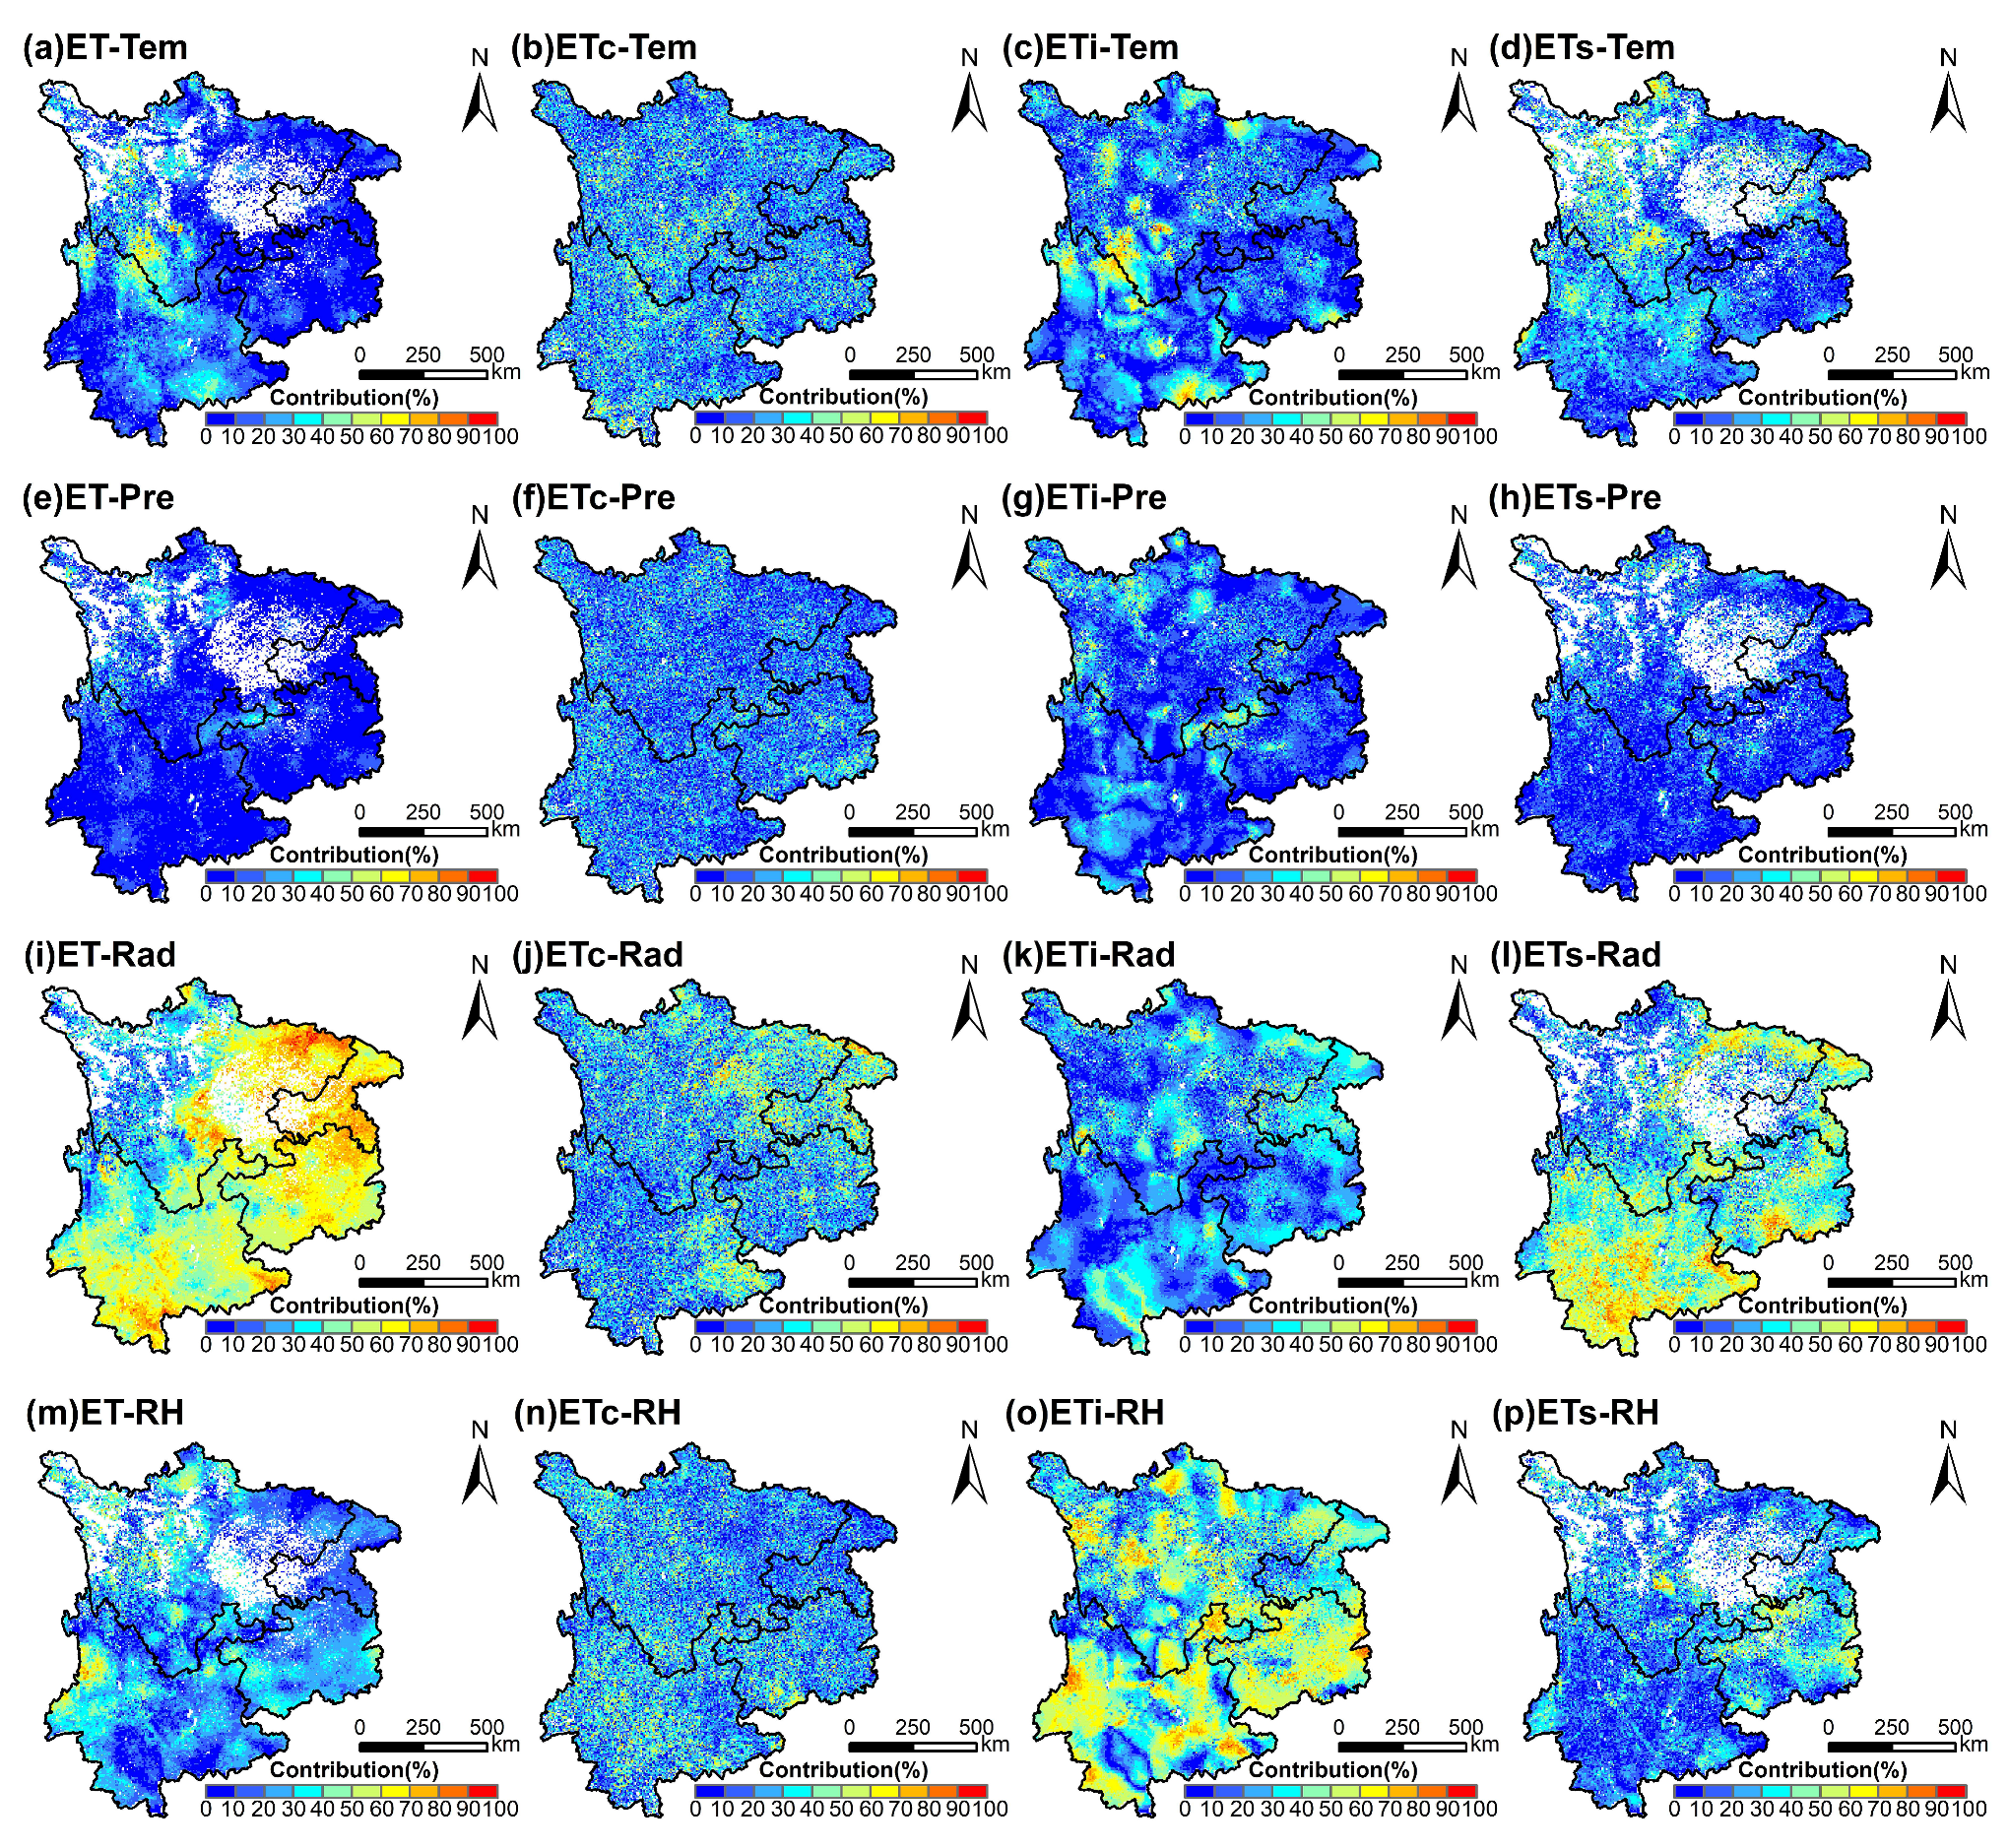
Figure 4 illustrates the spatial distribution of partial correlations between climatic factors (Tem, Pre, Rad, RH) and ET, ETc, ETi, and ETs in the karst region of Southwest China from 2000 to 2018. Tem exerted a strong significant negative correlation with ET, with 17.66% of the area showing a significant negative correlation (Figure 4a), while 5.91% of the region exhibited a significant positive correlation with ETi (Figure 4c). The partial correlation between Pre and ET was generally weak. In contrast, Rad showed a widespread significant positive correlation with ET, observed in 82.08% of the region, followed by ETs (55.03%) (Figure 4i–l). The partial correlations between ET, ETc, ETi, and ETs and RH were relatively strong, with 50.3% of the regions showing a significant positive correlation between ETi and RH, followed by ET (45.08%). The significant positive correlations between ETc and ETs with RH were weaker, at 5.77% and 1.84%, respectively, while ETs showed a higher significant negative correlation of 16.85% (Figure 4m–p).
The contribution of Tem to all ET components was generally below 50% across most regions (Figure 5a–d). Areas where Tem contributed over 50% accounted for only 18.9% (ET), 9.09% (ETc), 7.1% (ETi), and 21.5% (ETs), primarily concentrated in the western part. Pre generally had a limited influence on ET (Figure 5e–h). In contrast, Rad exerted a strong positive contribution to ET, with 66.45% of the area showing contributions greater than 50%, mainly distributed in Chongqing, Guizhou, Yunnan, and eastern Sichuan (Figure 5i). Rad also had a considerable influence on ETs, with 43.54% of the regions exceeding 50% contribution (Figure 5l). The contributions of RH were strong but spatially scattered (Figure 5m–p), with the strongest effect on ETi (34.63% of areas >50%), followed by ETs (21.43%), ET (19.55%), and ETc (10.36%).
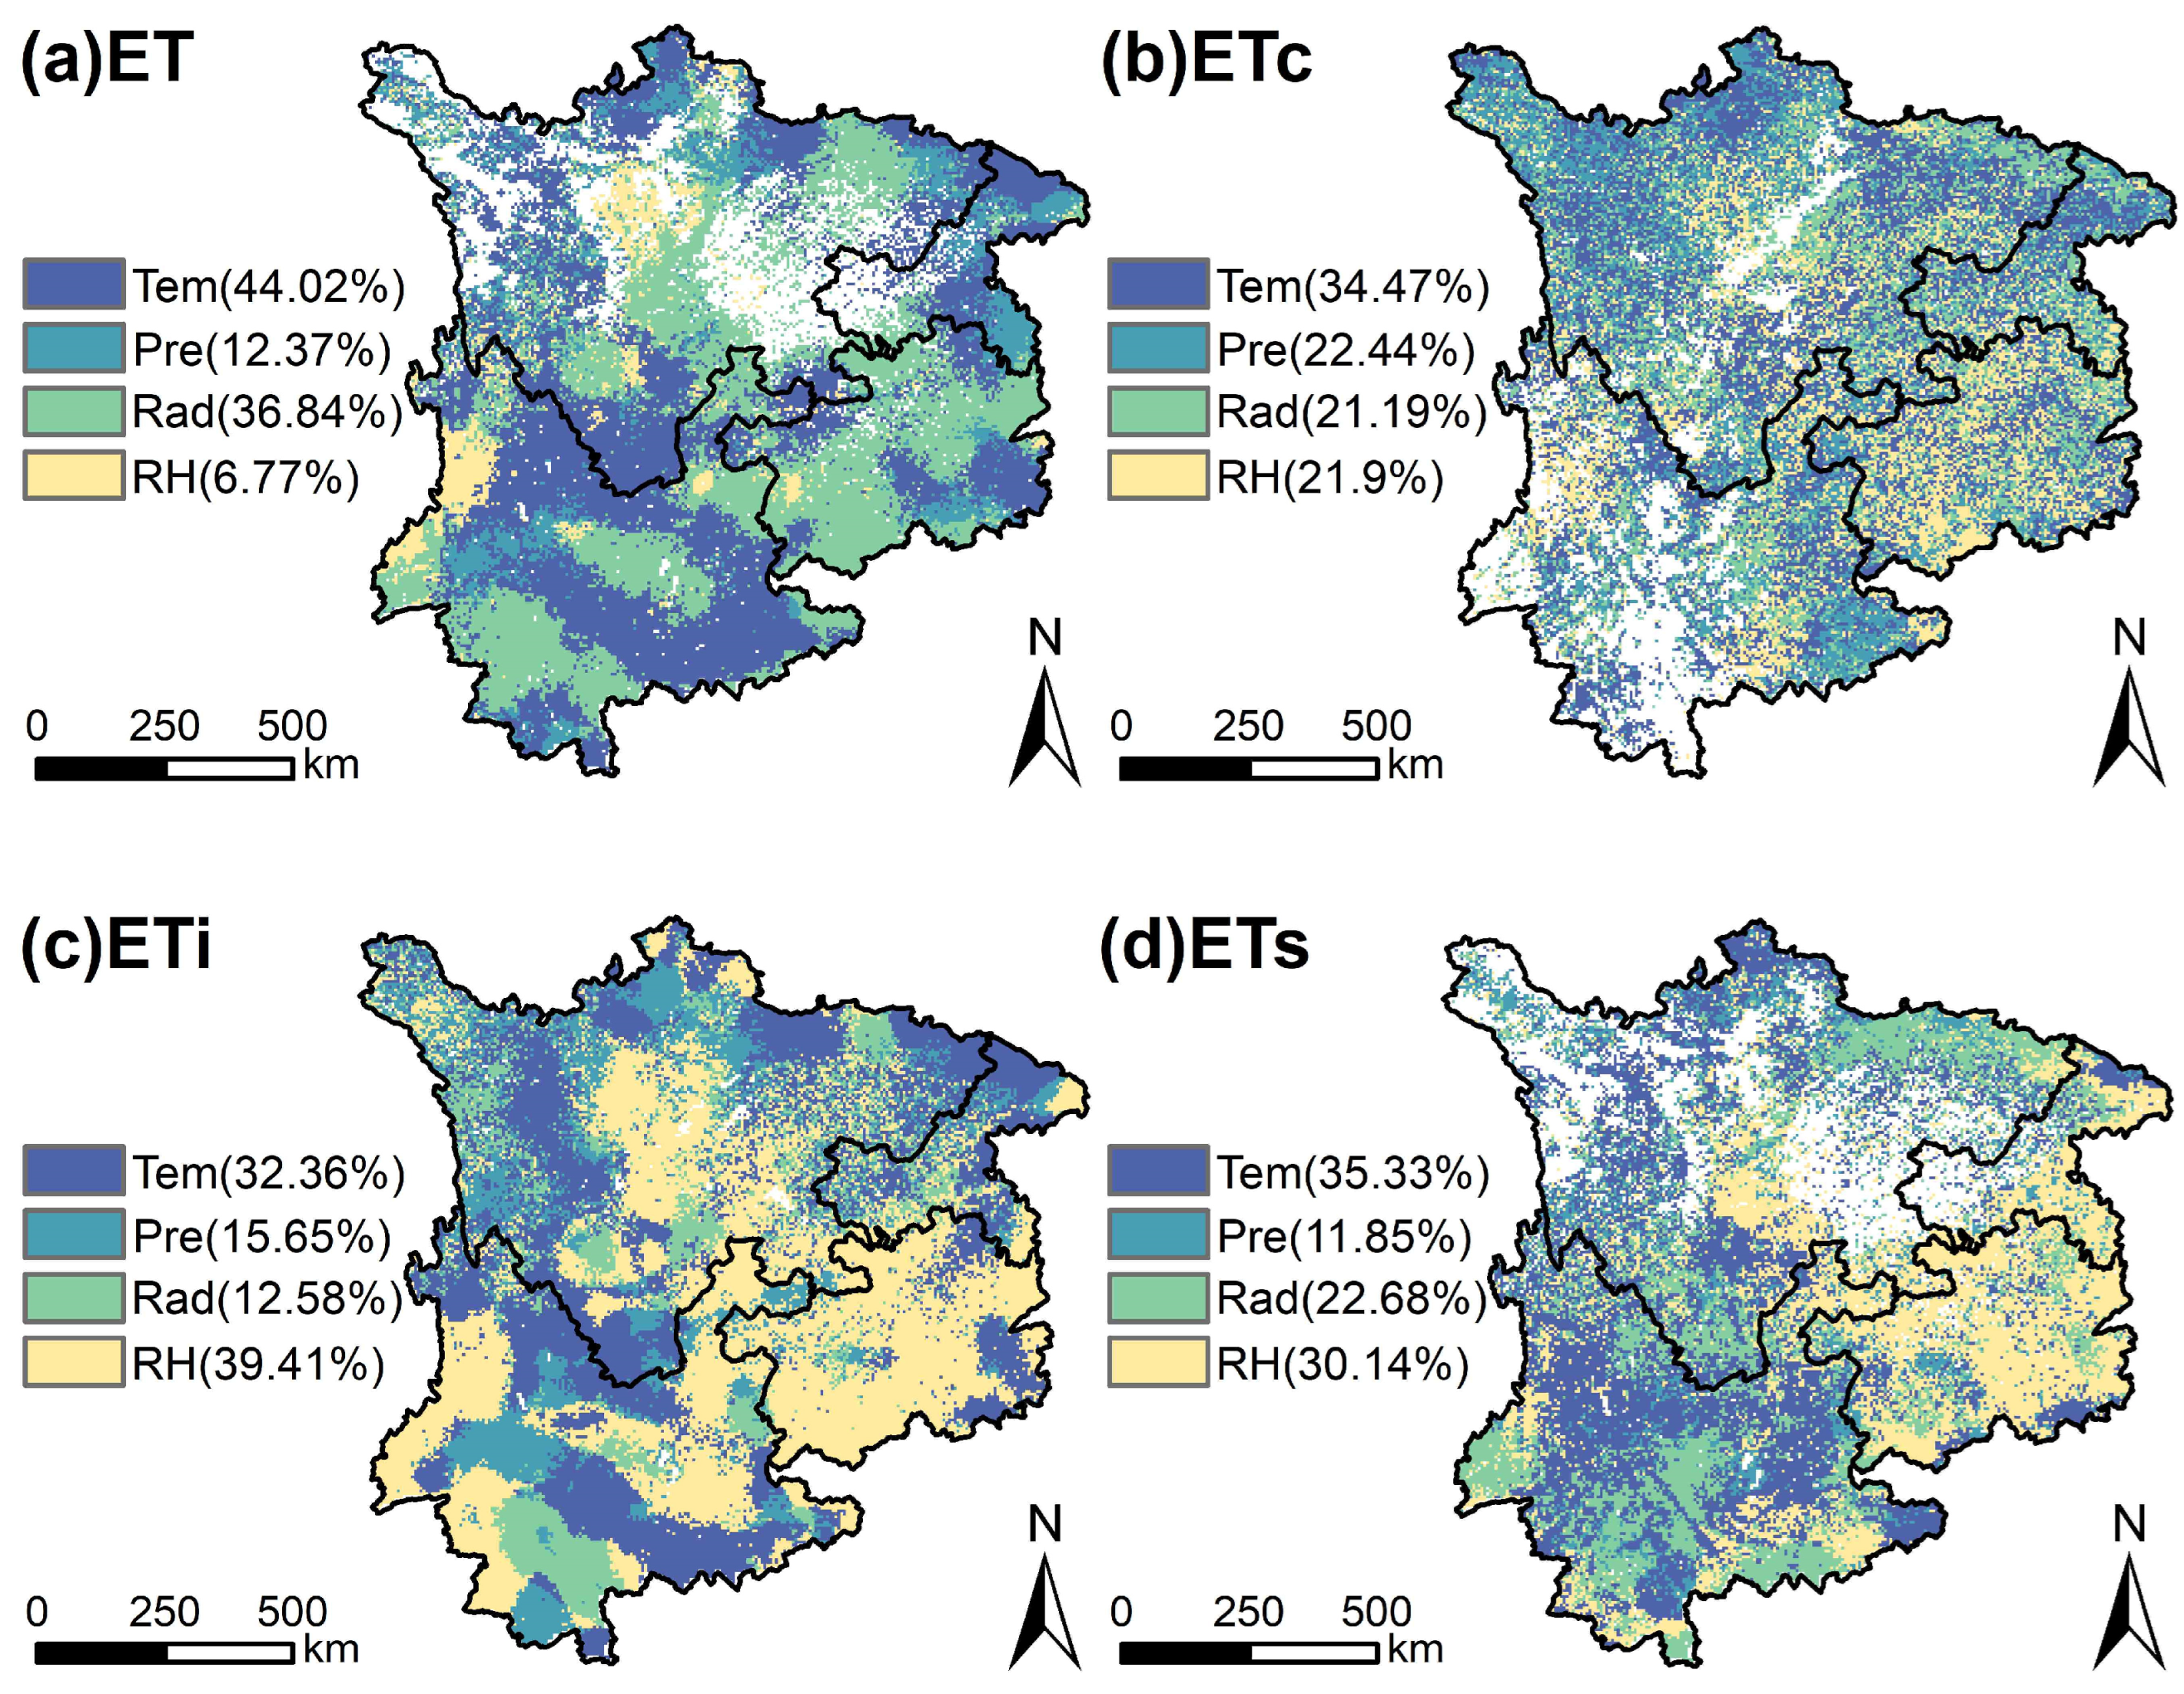
To further elucidate the driving mechanisms of ET and its components in the Southwest China karst region, the primary influencing factors for ET, ETc, ETi, and ETs under vegetation change scenarios simulated by the PT-JPL model were analyzed (Figure 6). Results indicate that Tem was the dominant factor affecting ET, accounting for 44.02% of the area and being primarily distributed in Yunnan and Chongqing. Pre, Rad, and RH accounted for 12.37%, 36.84%, and 6.77% of the influencing areas, respectively (Figure 6a), with Tem and Rad being the dominant drivers in most parts of Guizhou Province. For ETc, the dominant factors were more spatially dispersed, with Tem exhibiting the highest proportion at 34.47%. Compared to ET, the areas dominated by Pre and RH for ETc increased significantly, reaching 22.44% and 21.90%, respectively. RH was the primary controlling factor for ETi (39.41%), followed by Tem (32.36%) (Figure 6c), with Guizhou predominantly influenced by RH and Tem. The main factors influencing ETs were, in descending order, Tem (35.33%), RH (30.14%), Rad (22.68%), and Pre (11.85%) (Figure 6d).

3.4. Impacts of Vegetation Change on ET and Its Components

Figure S3 illustrates the spatiotemporal variation patterns of leaf area index (LAI) and NDVI in the southwest karst region. Overall, LAI and NDVI improved significantly across most of the area (Figure S3a–d). Specifically, 61.24% of the region exhibited an increasing LAI trend, with 17.1% showing a significant increase (p < 0.05). The increase in NDVI was more widespread, observed in 93.9% of the area, with 73.86% being significant (p < 0.05). Time series analyses further confirmed consistent interannual increases in both indices (Figure S2e,f). The mean LAI rose from 2.17 in 2000 to 2.24 in 2018, with an average annual increase of 0.006/a. Similarly, the mean NDVI increased from 0.53 to 0.70, showing a significant upward trend (R2 = 0.62) and an average annual growth rate of 0.01/a.
From 2000 to 2018, ETi in the Southwest China karst region showed a consistent increase under both vegetation change and constant vegetation scenarios, at rates of 1.11 mm/a and 0.9 mm/a, respectively, while ET, ETc, and ETs exhibited declining trends (Figure S4a–d). Minimum values under the vegetation change scenario occurred in 2010 for ET (522.84 mm), ETi (163.41 mm), and ETs (219.57 mm). Under the constant vegetation scenario, ET and ETc reached minima in 2010, ETi in 2009, and ETs in 2018. Vegetation-induced changes in ET, ETi, and ETs increased by 0.44 mm/a, 0.22 mm/a, and 0.37 mm/a, respectively. The years with the largest differences were 2018, 2012, 2016, and 2017, with differences of 9.3 mm, 23.82 mm, 6.63 mm, and 8.54 mm, respectively (Figure S4e–h).
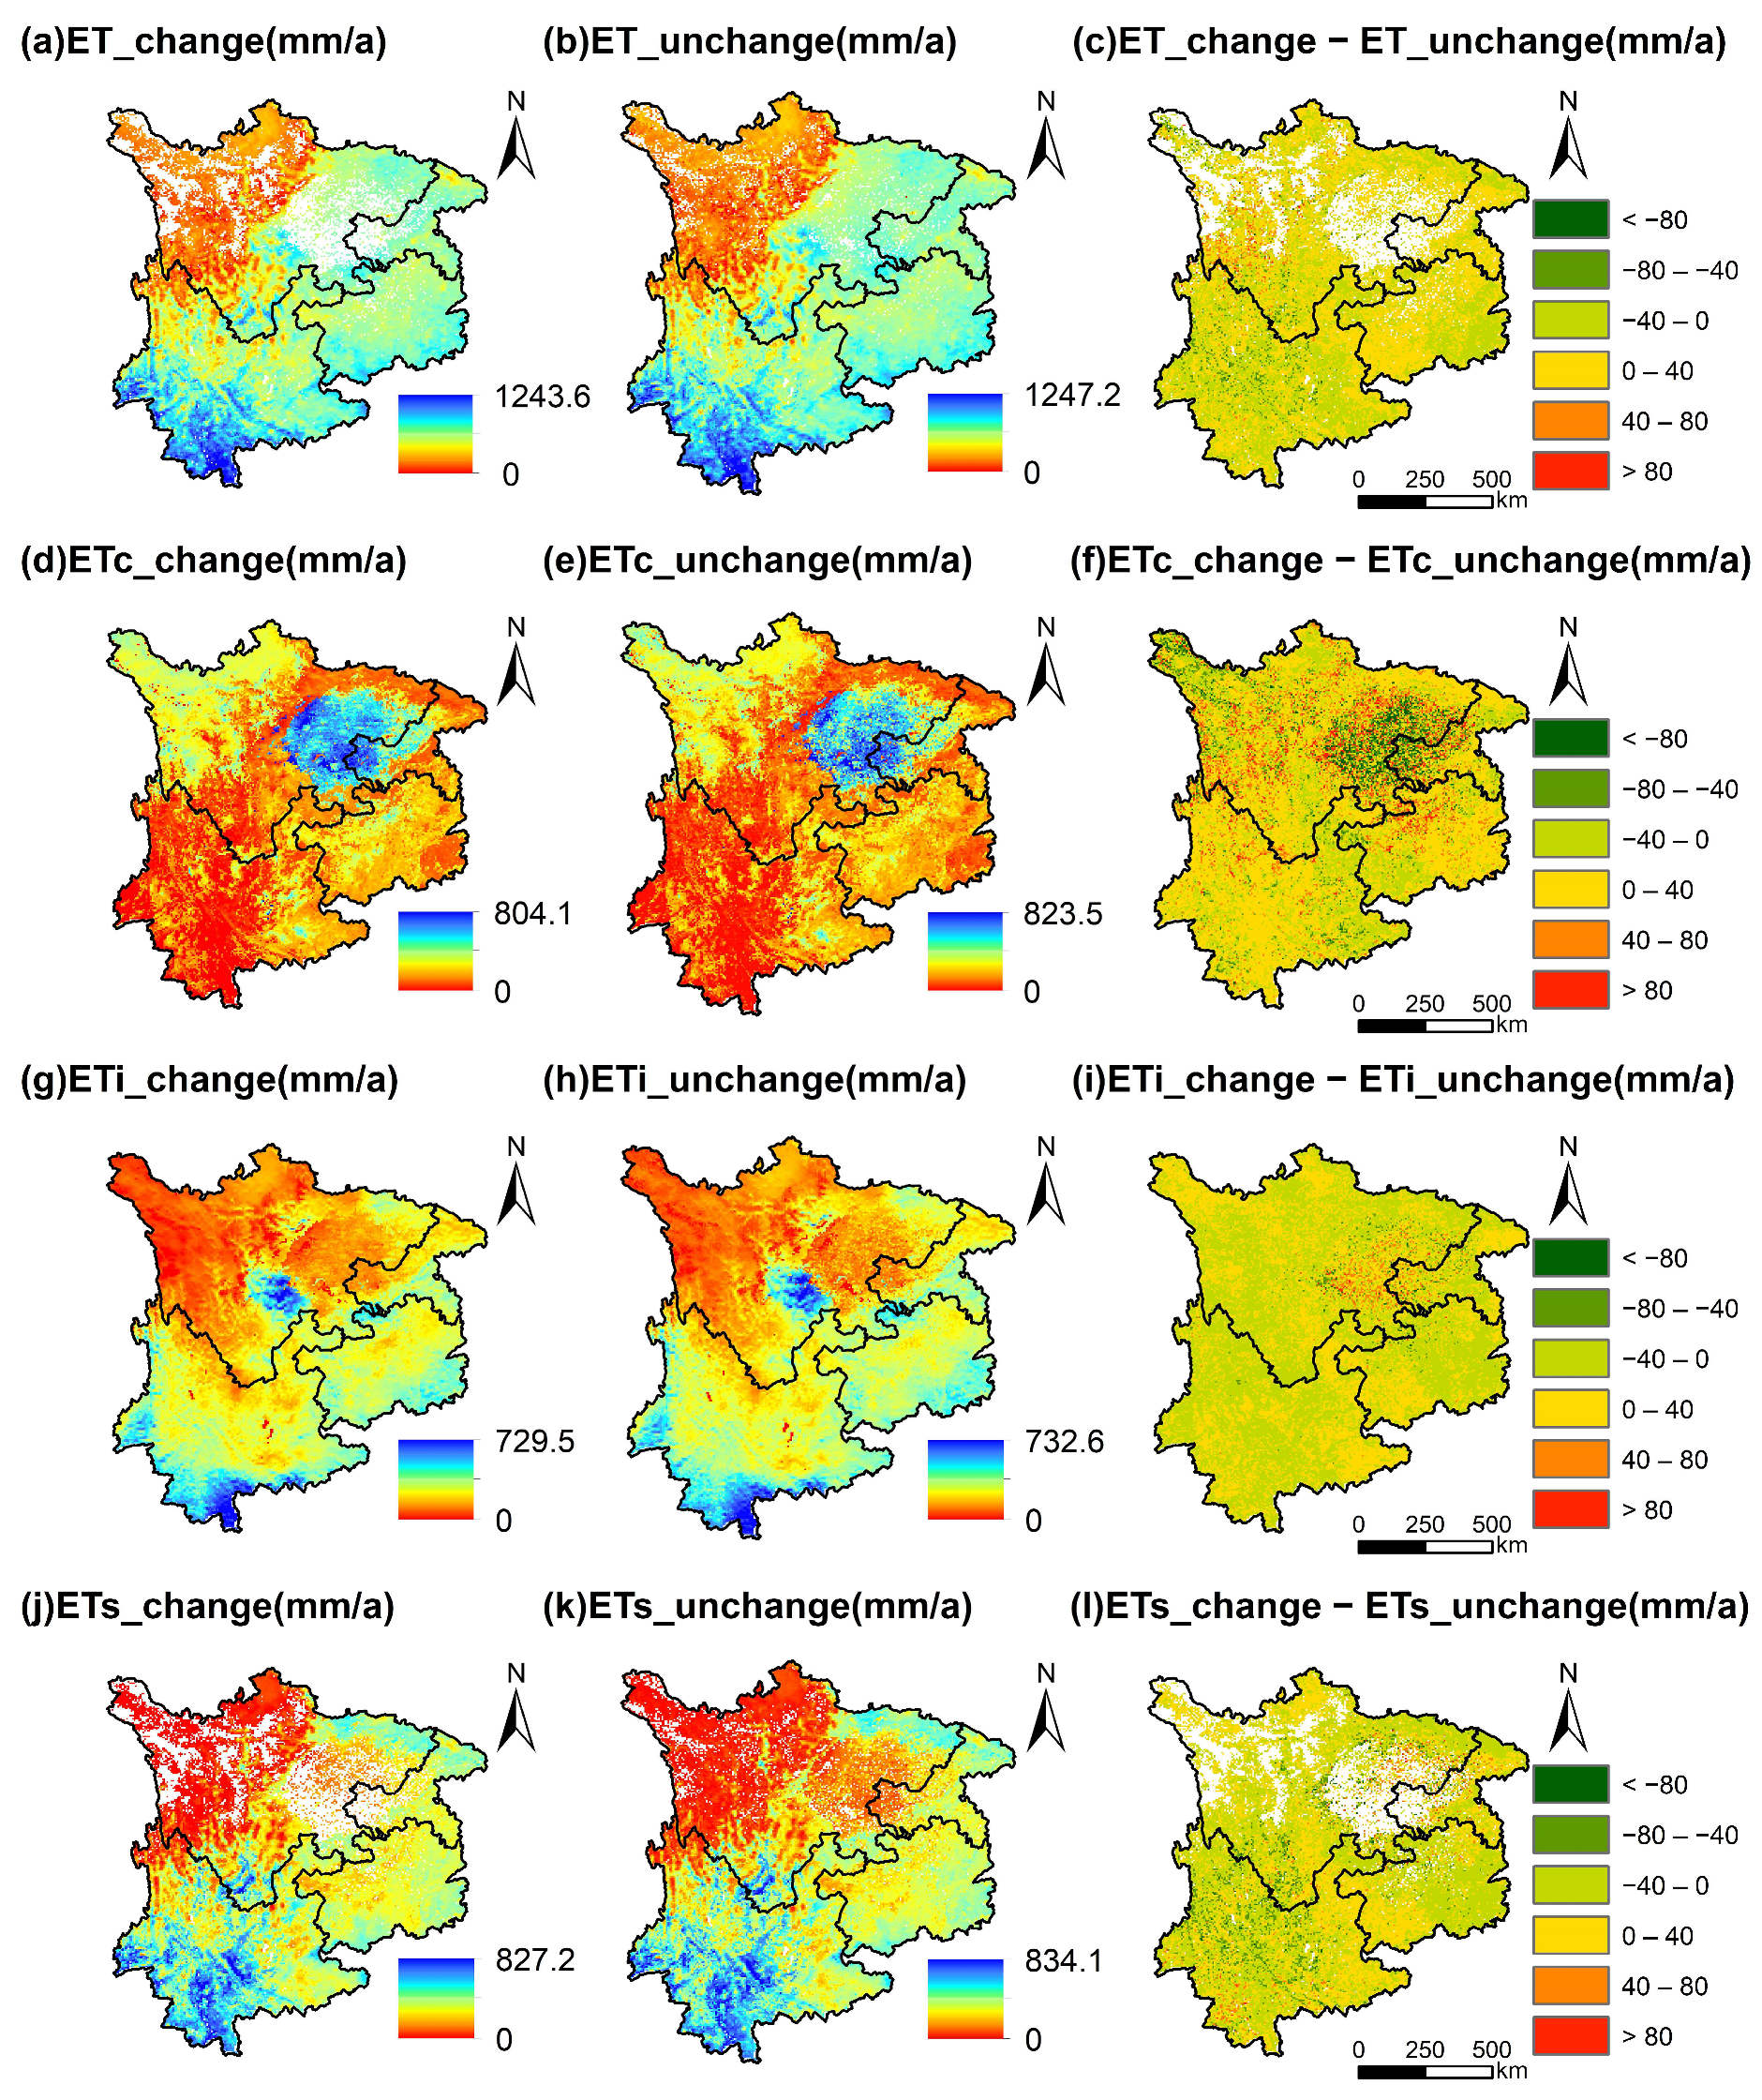
Under the vegetation change scenario, the average ET in the Southwest China karst region during 2000–2018 increased gradually from north to south, reaching up to 1243.6 mm/a and exhibiting strong spatial heterogeneity, with lower values in the northwest (Figure 7a). A similar spatial pattern was observed under the constant vegetation scenario, where ET remained low in the northwest and increased toward the south, peaking at 1247.2 mm (Figure 7b). The multi-year average ETc under constant vegetation also showed higher values in the northeast and northwest and lower values in the southeast, while ETi and ETs under both scenarios were consistently lower in the northwest and higher in the southwest. The differences in multi-year average ET between the two scenarios revealed that ET and ETc under vegetation change were higher in most regions, with areas showing differences of 0–40 mm/a accounting for 51.89% and 46.75% of the total, respectively. In contrast, differences of −40–0 mm/a were most widespread for ETi and ETs, covering 59.59% and 51.79% of the area, respectively. The maximum differences in ET, ETc, and ETi all occurred in the northern regions (Figure 7c,f,i).
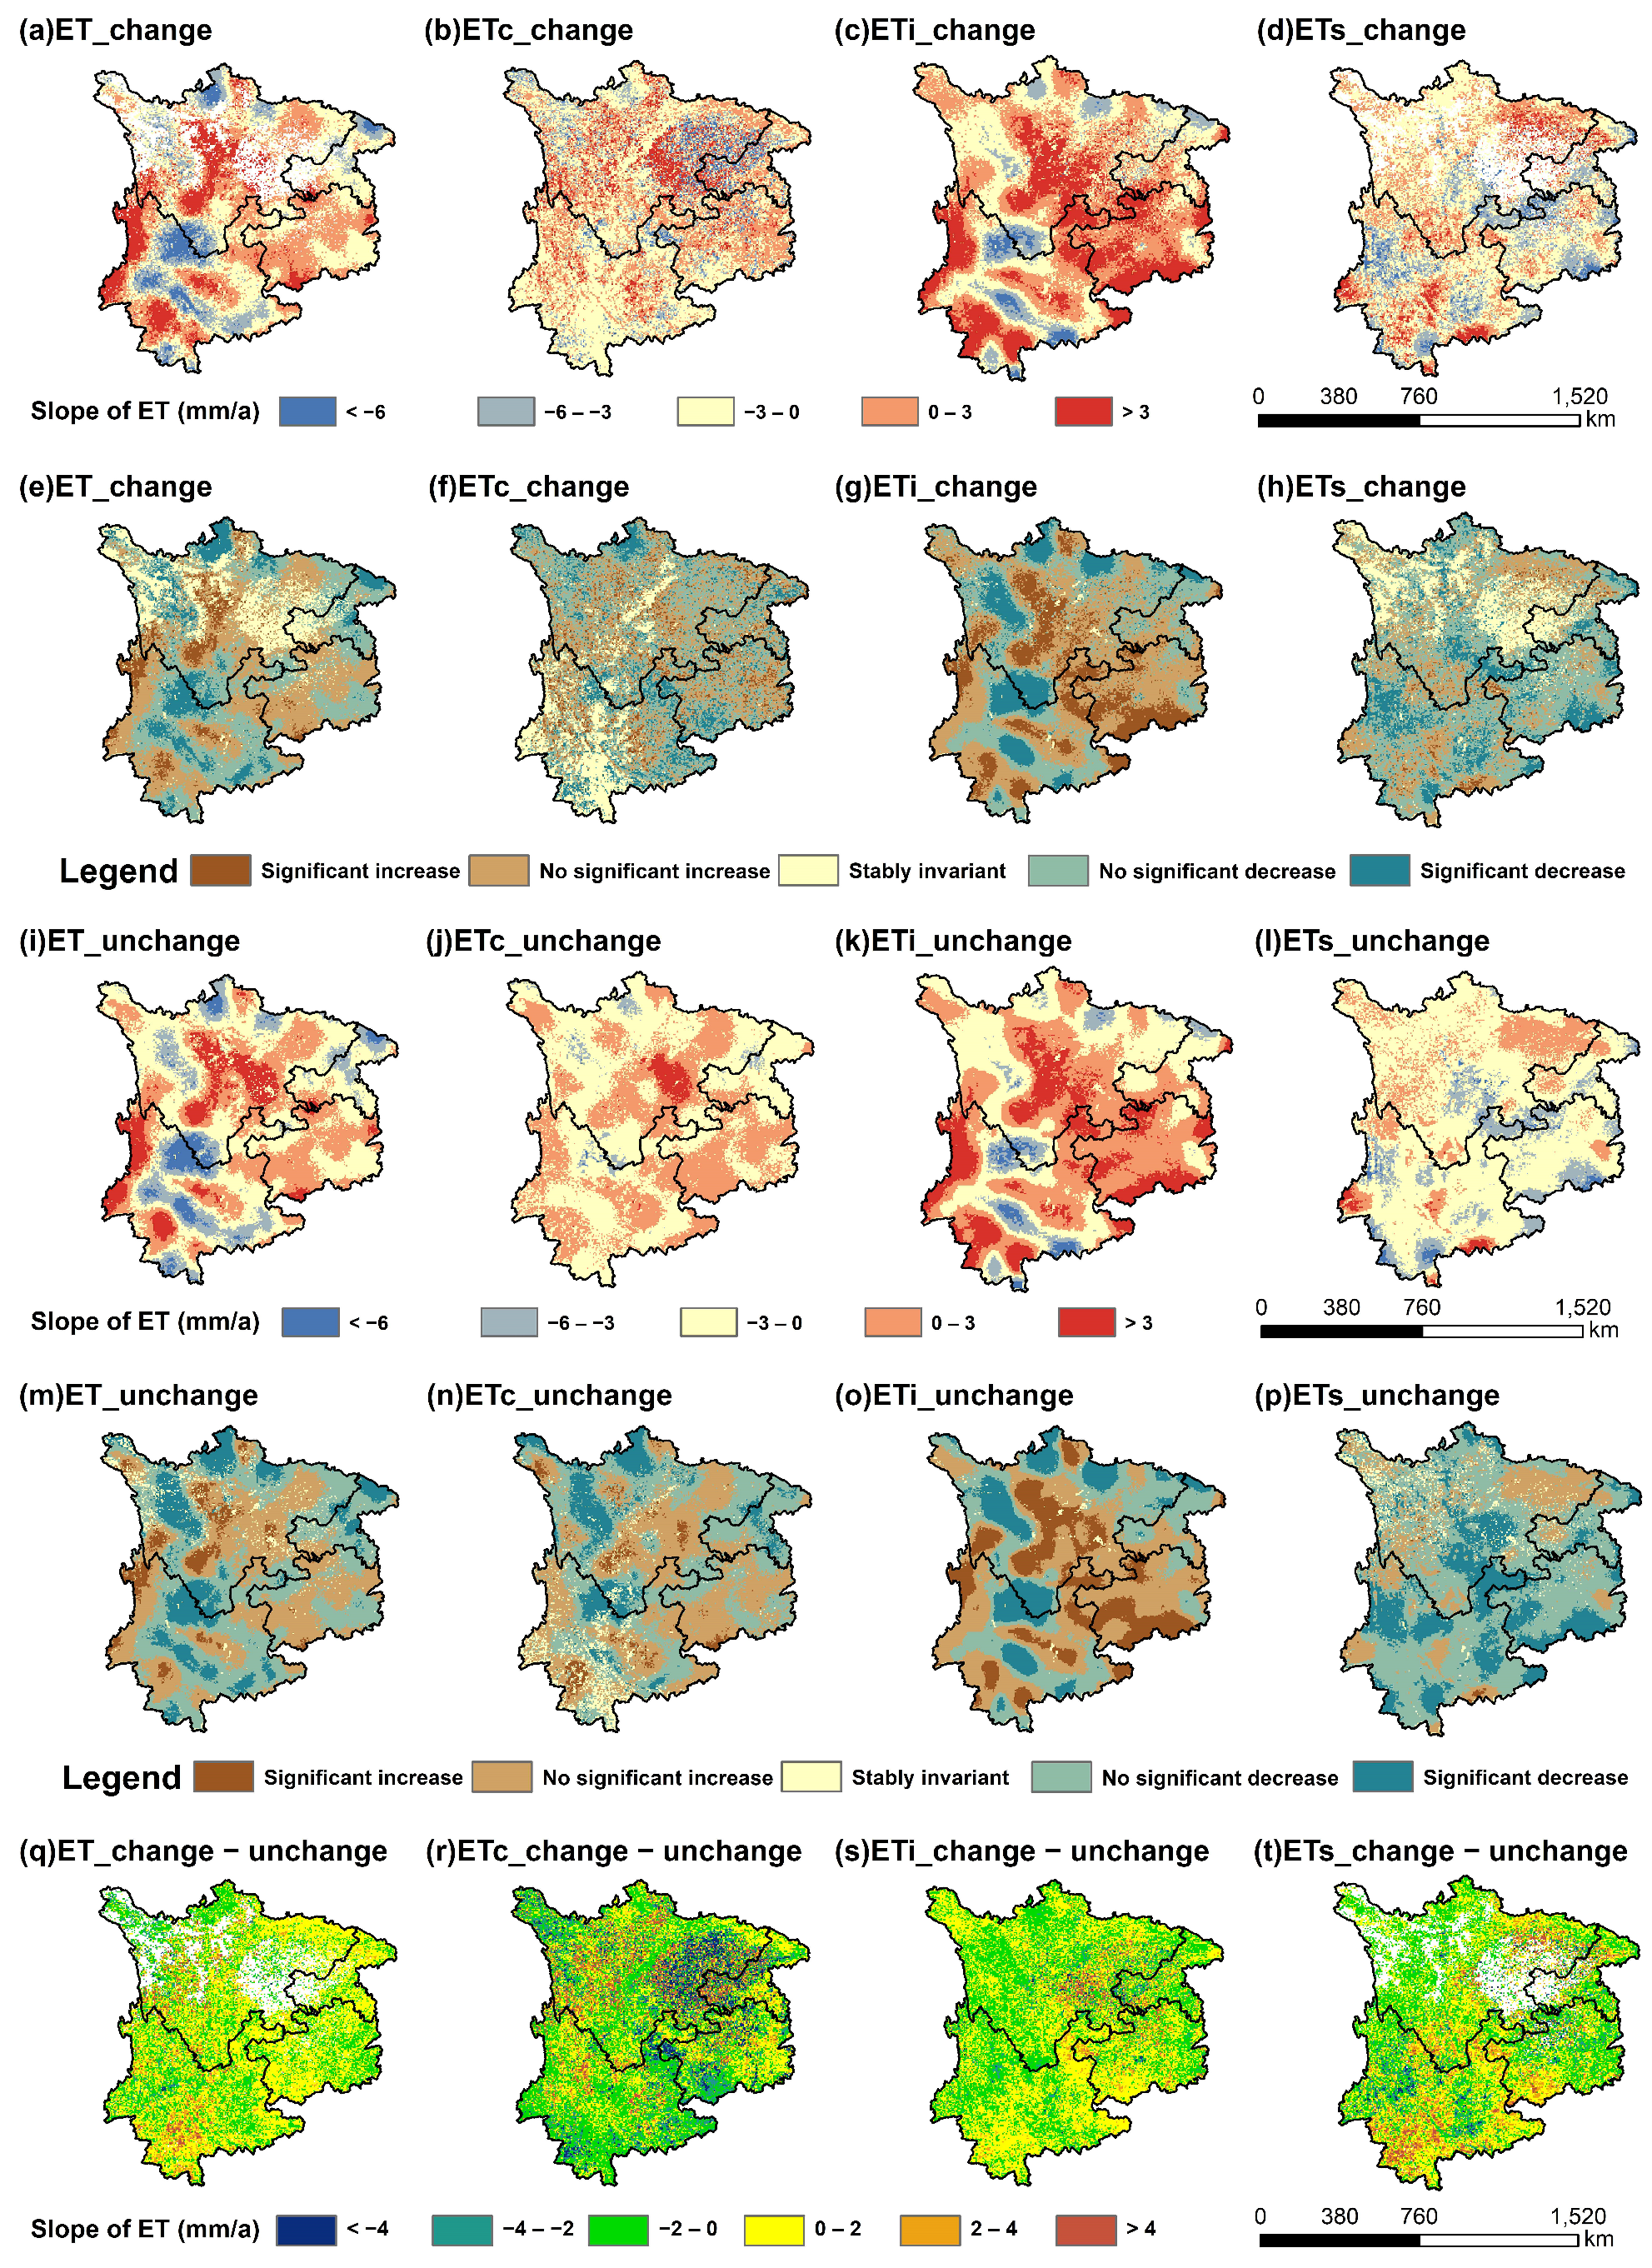
Under vegetation change scenarios, ET and its components (ETc, ETi, ETs) exhibited spatially heterogeneous trends across southwestern China’s karst region (Figure 8a–d). Overall, ET, ETc, and ETi increased in 53.62%, 51.19%, and 57.32% of the area, respectively, while ETs decreased in 61.08%. Significant decreases in ET occurred in 10.61% of the region, compared to only 5.44% with significant increases. ETi increased significantly mainly in central areas (17.3%) and decreased significantly in the west (12.3%). Significantly decreasing ETs was observed in 14.08% of the area. Under the constant vegetation scenario, ET (54.66%), ETc (61.20%), and ETs (75.53%) were predominantly characterized by decreasing trends, while ETi still increased in 56.63% of the region. Among these, ETi had the highest proportion of significant increase (19.3%), and ETs had the highest proportion of significant decrease (23.39%). By subtracting constant-vegetation trends, vegetation dynamics were isolated and showed a positive driving effect on ET and its components in most areas. Positive differences in change rates were highest for ET (62.36%), followed by ETi (59.19%), ETs (59.01%), and ETc (53.74%). In 6.33% of the region, vegetation dynamics increased ETc by over 4 mm/a, indicating strong regulatory influence on transpiration (Figure 8q–t).

3.5. Path Analysis of Direct and Indirect Effects

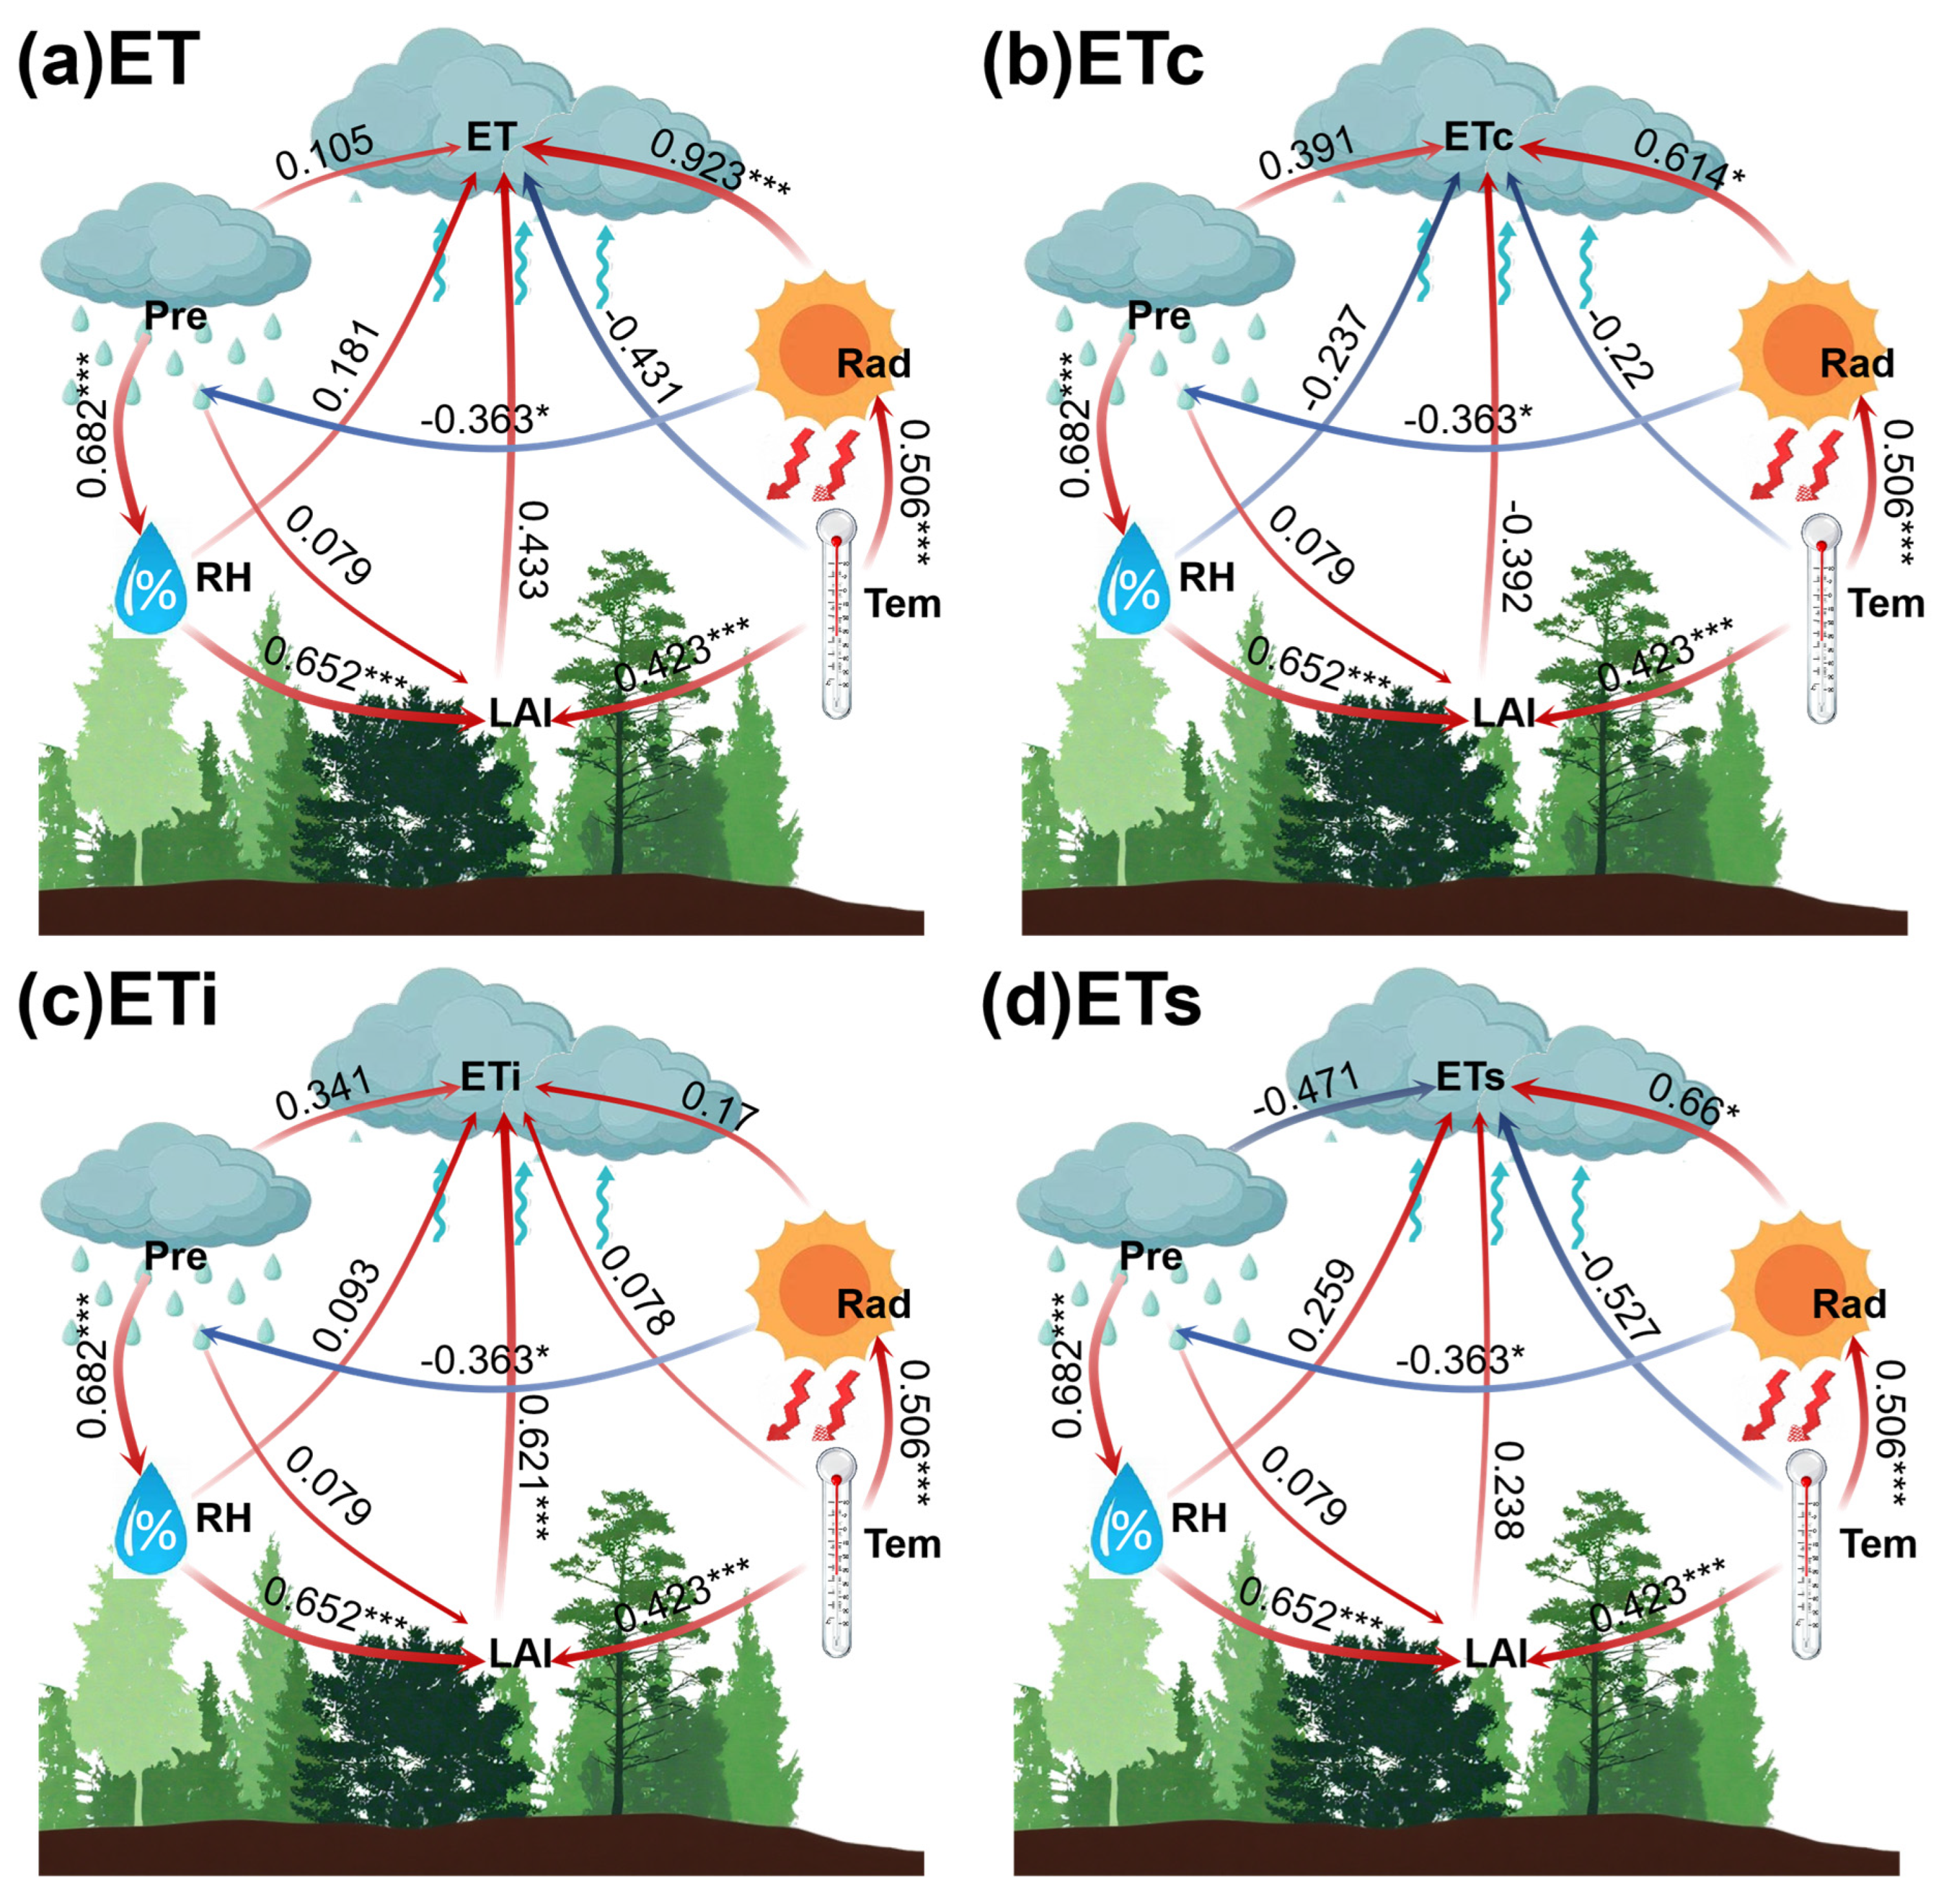
Results from the structural equation model (Figure 9) indicate good model fit for ET, ETc, ETi, and ETs, with SRMR values of 0.065, 0.065, 0.055, and 0.057, respectively. The driving factors included in the model had significant explanatory power for ET and its components, with R2 exceeding 67.5% (ET), 54.1% (ETc), 80% (ETi) and 50% (ETs), respectively. Path analysis revealed that most vegetation and meteorological factors exerted significant positive effects on ET and its components. Rad was the primary driver for ET, ETc, and ETs, with standardized path coefficients of 0.923, 0.614, and 0.66, respectively. For ETi, all climate and vegetation factors showed positive effects, with LAI having the strongest influence (path coefficient = 0.621 ***) and Tem the weakest. In addition, there was a significant interaction between the driving factors: Pre had the strongest positive direct effect on relative RH (path coefficient = 0.682 *), and RH had a significant positive effect on LAI (path coefficient = 0.652 *). At the same time, Tem not only significantly positively affected Rad (path coefficient = 0.506 *) but also significantly positively affected LAI (path coefficient = 0.423 *). Notably, Rad showed a significant negative effect on Pre (path coefficient = −0.363 *).

4. Discussion

4.1. Spatiotemporal Variations in Simulated ET and Its Components

Our study demonstrates the strong applicability of the PT-JPL model for ET estimation in Southwest China’s karst region, with simulations showing high correlation (R2 = 0.65) against GLEAM datasets. This confirms the model’s capability in capturing the unique hydro-thermal processes of karst ecosystems. The analysis revealed the profound impact of vegetation dynamics on ET components. ET, ETc, and ETi showed increasing trends across most of the region, primarily driven by vegetation restoration under large-scale ecological projects such as the Grain-for-Green Program [20]. The ETc increase represents a direct physiological response to enhanced leaf area and biomass accumulation [21], while elevated ETi stems from greater Pre interception by denser canopies [22]. These patterns align well with documented ecohydrological effects following rocky desertification control [23]. Conversely, ETs decreased in 61.08% of the region due to reduced soil exposure and modified microclimate under vegetation cover. Under the constant vegetation scenario, the widespread decline in ET, ETc, and ETs underscores the predominant influence of climatic factors (particularly rising temperatures) coupled with soil moisture constraints. The observed warming trend (>0.04 °C/a) during the study period substantially enhanced atmospheric evaporative demand, leading to increased VPD [24]. However, this effect was counterbalanced by inadequate moisture supply resulting from the characteristic shallow karst soils (average thickness <50 cm) and rapid water loss through well-developed karst fissures [25]. These hydrological limitations were particularly pronounced in areas with underdeveloped root systems, where water stress significantly suppressed both ETc and ETs [26]. The exacerbating effect of reduced Pre in certain regions (Figure 3b) further intensified this moisture deficit. Notably, ETi increased marginally (0.9 mm/a) from accelerated water phase change under warming yet remained substantially lower than under vegetation change (1.11 mm/a), demonstrating the dominant role of vegetation dynamics in governing interception loss [27].
Vegetation restoration resulted in net increases in ET (0.44 mm/a), ETi (0.22 mm/a), and ETs (0.37 mm/a), with positive responses observed across much of the region. These results quantitatively demonstrate how ecological engineering can mitigate climatic aridification [28] (Figure S4e,g,h). However, the net decrease in ETc (–0.08 mm/a) reflects the dual impact of vegetation restoration (Figure S4f): while enhancing overall transpiration capacity, it also intensifies water competition during drought periods, particularly in areas with shallow soils, ultimately suppressing transpiration efficiency at the plant level [29]. The basin in the northeast of the study area is a typical example of this phenomenon. The vegetation project has resulted in a decrease in ETc within the basin. This can likely be attributed to 1. the introduction of deep-rooted plant species that more effectively utilize deep soil water and 2. a reduction in transpiration from the original vegetation (as the shade cast by the newly introduced, more water-efficient trees and shrubs suppressed evapotranspiration from the original herbaceous plants) (Figure 7). This phenomenon occurs against a background of climatic stressors, including intermittent Pre reduction and Tem elevation. Notably, vegetation restoration has induced a net increase in ETs—contrary to the commonly expected suppression. This counterintuitive response can be attributed to comprehensive microclimatic modifications from vegetation recovery. Canopy development reduces near-surface wind speed and Tem while increasing humidity, creating a stabilized microenvironment that decelerates instantaneous soil moisture loss and prolongs evaporation duration. Additionally, vegetation cover extends post-precipitation wetness periods. Foliar transpiration also adds vapor to the near-surface atmosphere, which may locally enhance soil evaporation. Together, these processes explain the observed weak increase in regional average ETs after vegetation restoration [30].
Spatial patterns further highlight heterogeneous drivers across the region. Southern areas (Yunnan and Guizhou), situated on a low-latitude plateau, exhibit superior hydrothermal conditions with higher Tem and greater Pre, supporting forests with high LAI that enhance both ETi and ETc, leading to elevated overall ET. In contrast, most of the heat-restricted and hydrologically restricted northern areas around the Sichuan Basin were converted to low-to-medium cover grasslands, with reduced biomass and transpiration. Notably, substantial vegetation-induced increases in ET and ETc (>80 mm/a) are concentrated in the north, accounting for 0.17% and 3.45% of the total area, respectively—a pattern likely shaped by regional hydrothermal regimes.
In conclusion, the primary driver of increased ET in Southwest China’s karst region during 2000–2018 was vegetation restoration driven by ecological engineering projects, rather than climate change alone [31]. The vegetation recovery has predominantly enhanced ET through increases in both ETc and ETi, while exerting a regionally variable but generally modest positive influence on ETs. This shift in water fluxes, with more moisture returning to the atmosphere through vegetation rather than contributing to surface runoff or groundwater recharge, presents new challenges for water resource management in this “engineering-induced water-scarce” region [32]. Moving forward, conservation strategies should focus on maintaining existing vegetation in areas where ETs has significantly decreased (demonstrating effective vegetation-mediated evaporation suppression), while in areas experiencing ETs increases or ETc decreases (indicative of water competition zones), priority should be given to selecting native species with low water requirements and deep root systems to optimize vegetation allocation and alleviate water stress.

4.2. Climatic Controls on ET in Southwest China’s Karst Region

This study systematically elucidates the primary drivers of ET dynamics in Southwest China’s karst region during 2000–2018 through multidimensional analyses, including correlation assessment, contribution quantification, dominant factor identification, and model path coefficients. Results consistently show that Rad is the primary factor controlling ET variability [33]. Statistically significant positive correlations (p < 0.05) between ET and Rad were observed across 82.08% of the study area. Rad contributed over 50% to ET variations in 66.45% of the region, particularly in southeastern Yunnan, Chongqing, Guizhou, and southeastern Sichuan (Figure 5). The PT-JPL model’s path analysis further confirmed the dominant role of Rad. These results collectively establish Rad as the fundamental control on ET processes, consistent with previous studies [34]. RH emerged as the second most influential factor yet exhibited complex mechanistic behaviors [35]. Positive ET-RH correlations were significant in 50.3% of the region, with RH contributing >50% to ET variations in 34.63% of areas (Figure 5m). Under favorable moisture conditions, elevated RH reduces VPD, thereby enhancing transpiration. The shallow soils in karst areas can temporarily retain moisture, with high RH further slowing desiccation and supporting ETs [36]. However, under drought stress, high RH may suppress ETc (path coefficient = –0.237) by excessively lowering VPD and inducing stomatal closure [37]. Contributions from ETi and ETs partially offset this reduction, explaining the high RH contribution in 19.55% of the region (Figure 5m). Nevertheless, RH was the dominant factor in only 6.77% of the area (Figure 6a), as its positive effects depend strongly on adequate moisture. When RH decreases (often concurrent with VPD increase), soil moisture deficits typically override its energy-regulation effect. Notably, although Tem showed lower correlation and contribution compared to Rad and RH, it exhibited the most extensive spatial dominance, governing ET variations across 44.02% of the region (Figure 6a) [38]. This spatial dominance stems from temperature’s role in enhancing phase-transition processes via VPD elevation, thereby improving the conversion efficiency of radiant energy to ET [39]. This effect is particularly pronounced in karst slopes with thin soil covers and poor water retention capacity, where Tem increases amplify the marginal effects of Rad on ET [40]. However, persistent high temperatures risk accelerating moisture loss in water-limited karst systems, ultimately constraining root water uptake and suppressing ETc and ET through thermal stress [41]. Among the four factors, Pre showed the weakest direct influence at regional scales, with limited significant correlation or dominance.
Crucially, the dominant controls of Rad and Tem on ET, coupled with the remarkably weak direct influence of precipitation (Pre), can be fundamentally attributed to the unique ‘dual hydrological structure’ of karst systems [42]. The widespread subsurface networks of conduits and fractures facilitate rapid infiltration of precipitation into deep groundwater systems, preventing efficient storage in the shallow soil layer that is critical for sustaining ET processes [43]. This leads to the apparent paradox where, despite theoretically sufficient rainfall, the surface and critical zone experience persistent water scarcity (‘engineering water scarcity’). Consequently, the energy available for evaporation (Rad) and the atmospheric demand (influenced by Tem) become the primary drivers of ET variability, as the water supply via precipitation is quickly lost from the surface system. This karst-specific hydrological context is the foundational reason for the observed dominance of energy factors over the water supply factor (Pre) in governing regional ET dynamics. Nevertheless, Pre ranked second (22.44%) among dominant factors for ETc, as it enhances soil moisture and promotes plant growth during wet periods in water-limited areas [44,45], highlighting its importance as a moisture source during surface wetting episodes or in specific locales [46].

4.3. Implications and Recommendations for Regional Water and Vegetation Management

The multidimensional analysis of ET dynamics in Southwest China’s karst region reveals complex interactions between vegetation restoration, climate change, and water resources. These findings offer critical insights for regional-scale ecosystem management and water resource planning. While vegetation restoration enhances carbon sequestration and soil conservation [45], our results indicate potential trade-offs in water availability due to increased ET demands. This underscores the necessity of integrating hydrological considerations into regional ecological restoration strategies. To achieve sustainable water resource management in the karst region, we propose the following recommendations based on the spatiotemporal patterns of ET and its climatic drivers: In areas where vegetation restoration has significantly increased ETc and ETi, such as the northern and central karst regions, priority should be given to selecting native tree species with deep root systems and low water requirements to alleviate water stress and enhance drought resistance. In regions where ETs has decreased due to vegetation recovery, efforts should focus on maintaining existing vegetation cover to sustain soil moisture and reduce non-productive water loss. Furthermore, given the dominant roles of solar radiation and temperature in driving ET variations, regional water resource planning must integrate relevant climate projections [47], particularly trends in radiation and temperature, to scientifically anticipate future water demands. Especially in sub-regions dominated by radiation drivers, such as Yunnan and Guizhou, water allocation strategies should fully account for higher atmospheric evaporative demand, with particular attention during low-rainfall periods.
To further enhance the targeting and adaptability of regional water and vegetation management, it is essential to strengthen monitoring and modeling capabilities and promote the systematic integration of eco-hydrological policies. Long-term monitoring of key climatic factors—such as Rad, Tem, and RH—and vegetation dynamics is crucial for validating and refining regional ET models [48]. Where data permit, subsequent studies should incorporate soil moisture data and hydrogeological characteristics to improve the representation of karst-specific hydrological processes in models such as PT-JPL. At the policy level, concerted integration is needed between ecological restoration programs, such as the Grain for Green Program, and regional water resource management plans to balance carbon sequestration goals with water resource carrying capacity. Local governments and planning departments can refer to the ET simulation results from this study to identify key areas where vegetation restoration may exacerbate water scarcity and adjust afforestation targets accordingly, thereby promoting synergistic and sustainable development of both ecology and hydrology. These integrated approaches aim to reconcile ecological restoration objectives with water resource sustainability, ensuring the long-term viability of karst ecosystems under changing environmental conditions.

5. Conclusions

This study employed the PT-JPL model to simulate and analyze the spatiotemporal evolution of ET and its components in the karst region and systematically investigated the driving mechanisms of vegetation greening and climate change on ET variations. The main conclusions are as follows:
(1) This study demonstrates that vegetation restoration significantly enhanced ET (+0.44 mm/a), ETs (+0.37 mm/a), and ETi (+0.22 mm/a), while ETc exhibited a marginal decrease (–0.08 mm/a). Spatially, vegetation-driven increases dominated across 62.36% (ET), 59.01% (ETs), and 59.19% (ETi) of the karst region, with ETc increases concentrated in northern areas (>80 mm/a; 3.45% coverage).
(2) Rn emerged as the primary driver of ET variations, dominating (>50% contribution) in 66.45% of the region, while Tem controlled dynamics across 44.02% of the area. Conversely, RH operated through complex drought-mediated mechanisms, and Pre exerted the weakest influence (locally significant only).
(3) The vegetation restoration under the Grain-for-Green program has intensified regional evapotranspiration, particularly through ETi and ETs. The marginal decline in ETc, coupled with increased ET, suggests potential water stress risks. Our regional-scale analysis implies that these changes in land surface properties could elevate non-productive water loss and pose a challenge to the sustainability of vegetation growth in this water-sensitive karst environment, highlighting the need for water-resource-conscious restoration strategies.

Supplementary Materials

The following supporting information can be downloaded at: https://www.mdpi.com/article/10.3390/agronomy15102375/s1, Figure S1. Geological map of the study area. Figure S2. Spatial average distribution map of climate factors in the Southwest Karst region from 2000 to 2018. Figure S3. Interannual trends of LAI and NDVI in southwest karst from 2000 to 2018. Figure S4. Effects of vegetation greening on ET in the karst region of Southwest China. Table S1. All data sources used in the study. Table S2. Parameter values. Table S3. Parameter values for k1, k2, and β.

Author Contributions

G.Z.: conceptualization, methodology, software, formal analysis, and writing—original draft. Q.S.: conceptualization, data curation, and software. Z.W. (Zijun Wang): methodology, data curation, and software. H.L.: validation and visualization. Z.W. (Zongsen Wang): data curation, writing—review and editing. T.X.: modifying figures, writing—review and editing. D.W.: validation and visualization. H.S.: supervision and data curation. Y.L.: conceptualization, methodology, and project administration. Z.W. (Zhongming Wen): funding acquisition and project administration. All authors have read and agreed to the published version of the manuscript.

Funding

This work was supported by the General Fund of Key Laboratory of the Evaluation and Monitoring of Southwest Land Resources (Ministry of Education) (No. TDSYS202307); the National Natural Science Foundation of China (No. 42477522); the Key R&D Plan of Shaanxi Province (No. 2024SF-YBXM-621); and the Inner Mongolia Academy of Forestry Sciences Open Research Project, Hohhot 010010, China, Project NO. KF2024MS04.

Data Availability Statement

The data presented in this study are available on request from the corresponding author.

Acknowledgments

We acknowledge the data support provided by the ‘Loess plateau science data center, National Earth System Science Data Sharing Infrastructure, National Science & Technology Infrastructure of China, National Tibetan Plateau Scientific Data Center’.

Conflicts of Interest

The authors declare that they have no known competing financial interests or personal relationships that could have appeared to influence the work reported in this paper.

References

  1. Bhattarai, N.; Wagle, P. Recent Advances in Remote Sensing of Evapotranspiration. Remote Sens. 2021, 13, 4260. [Google Scholar] [CrossRef]
  2. Ma, N.; Zhang, Y.; Szilagyi, J. Water-balance-based evapotranspiration for 56 large river basins: A benchmarking dataset for global terrestrial evapotranspiration modeling. J. Hydrol. 2024, 630, 130607. [Google Scholar] [CrossRef]
  3. Ebrahimian, A.; Wadzuk, B.; Traver, R. Evapotranspiration in green stormwater infrastructure systems. Sci. Total Environ. 2019, 688, 797–810. [Google Scholar] [CrossRef]
  4. Huo, W.; Zhi, X.; Hu, S.; Cai, W.; Yang, F.; Zhou, C.; Mamtimin, A.; He, Q.; Pan, H.; Song, M.; et al. Refined assessment of potential evapotranspiration in the Tarim basin. Front. Earth Sci. 2022, 10, 904129. [Google Scholar] [CrossRef]
  5. Jin, L.; Chen, S.; Yang, H.; Zhang, C. Evaluation and Drivers of Four Evapotranspiration Products in the Yellow River Basin. Remote Sens. 2024, 16, 1829. [Google Scholar] [CrossRef]
  6. Jiao, Y.; Zhu, G.; Qiu, D.; Liu, Y.; Wang, L.; Lu, S.; Meng, G.; Lin, X.; Li, R.; Wang, Q.; et al. Hydrological effects of evapotranspiration in the Qilian Mountains forest belt. Hydrol. Earth Syst. Sci. Discuss. 2023, 2023, 1–24. [Google Scholar] [CrossRef]
  7. Liu, M.; Xu, X.; Wang, D.; Sun, A.Y.; Wang, K. Karst catchments exhibited higher degradation stress from climate change than the non-karst catchments in southwest China: An ecohydrological perspective. J. Hydrol. 2016, 535, 173–180. [Google Scholar] [CrossRef]
  8. Liang, P.; Wang, X.; Xu, Q.; Zhang, J.; Fang, R.; Fu, Z.; Chen, H. Lithology-mediated soil erodibility characteristics after vegetation restoration in the karst region of Southwest China. Land Degrad. Dev. 2024, 35, 1074–1086. [Google Scholar] [CrossRef]
  9. Guan, N.; Cheng, J.; Shi, X. Preferential Flow and Preferential Path Characteristics of the Typical Forests in the Karst Region of Southwest China. Forests 2023, 14, 1248. [Google Scholar] [CrossRef]
  10. Tan, K.; Zhao, X.; Pu, J.; Li, S.; Wang, Q. Zoning regulation and development model for water and land resources in the Karst Mountainous Region of Southwest China. Land Use Policy 2021, 109, 105683. [Google Scholar] [CrossRef]
  11. Huang, B.; Lu, F.; Sun, B.; Wang, X.; Li, X.; Ouyang, Z.; Yuan, Y. Climate Change and Rising CO2 Amplify the Impact of Land Use/Cover Change on Carbon Budget Differentially Across China. Earth’s Future 2023, 11, e2022EF003057. [Google Scholar] [CrossRef]
  12. Zhang, J.; Chen, H.; Fu, Z.; Wang, K. Effects of vegetation restoration on soil properties along an elevation gradient in the karst region of southwest China. Agric. Ecosyst. Environ. 2021, 320, 107572. [Google Scholar] [CrossRef]
  13. Liu, M.; Xu, X.; Sun, A.Y.; Wang, K.; Liu, W.; Zhang, X. Is Southwestern China experiencing more frequent precipitation extremes? Environ. Res. Lett. 2014, 9, 479–489. [Google Scholar] [CrossRef]
  14. Kang, Y.; Shen, L.; Li, C.; Huang, Y.; Chen, L. Effects of vegetation degradation on soil microbial communities and ecosystem multifunctionality in a Karst region, Southwest China. J. Environ. Manag. 2024, 363, 121395. [Google Scholar] [CrossRef]
  15. Cao, Y.; Xiong, K. Soil Quality Assessment Under Different Vegetation Restoration Strategies in the Karst Rocky Deserted Area of Southwestern China. J. Soil Sci. Plant Nutr. 2024, 24, 3249–3264. [Google Scholar] [CrossRef]
  16. Talsma, C.J.; Good, S.P.; Jimenez, C.; Martens, B.; Fisher, J.B.; Miralles, D.G.; Mccabe, M.F.; Purdy, A.J. Partitioning of evapotranspiration in remote sensing-based models. Agric. For. Meteorol. 2018, 260–261, 131–143. [Google Scholar] [CrossRef]
  17. Yu Qiu, G.; Momii, K.; Yano, T.; Lascano, R.J. Experimental verification of a mechanistic model to partition evapotranspiration into soil water and plant evaporation. Agric. For. Meteorol. 1999, 93, 79–93. [Google Scholar] [CrossRef]
  18. Zhang, B.; Tian, L.; Zhao, X.; Wu, P. Feedbacks between vegetation restoration and local precipitation over the Loess Plateau in China. Sci. China Earth Sci. 2021, 64, 920–931. [Google Scholar] [CrossRef]
  19. Khanmohammadi, N.; Rezaie, H.; Montaseri, M.; Behmanesh, J. The application of multiple linear regression method in reference evapotranspiration trend calculation. Stoch. Environ. Res. Risk Assess. 2018, 32, 661–673. [Google Scholar] [CrossRef]
  20. Wang, C.; Liang, W.; Yan, J.; Jin, Z.; Zhang, W.; Li, X. Effects of vegetation restoration on local microclimate on the Loess Plateau. J. Geogr. Sci. 2022, 32, 291–316. [Google Scholar] [CrossRef]
  21. Williams, I.N.; Torn, M.S. Vegetation controls on surface heat flux partitioning, and land-atmosphere coupling. Geophys. Res. Lett. 2015, 42, 9416–9424. [Google Scholar] [CrossRef]
  22. Han, P.; Yang, G.; Liu, Y.; Chen, X.; Wen, Z.; Shi, H.; Hu, E.; Xue, T.; Zhao, Y. Vegetation Restoration Enhanced Canopy Interception and Soil Evaporation but Constrained Transpiration in Hekou–Longmen Section During 2000–2018. Agronomy 2024, 14, 2606. [Google Scholar] [CrossRef]
  23. Wang, K.; Han, L.; Liao, J. Threshold analysis of the key factors of rocky desertification evolution in the typical karst region of China. All Earth 2025, 37, 1–14. [Google Scholar] [CrossRef]
  24. Hsiao, J.; Swann, A.L.S.; Kim, S. Maize yield under a changing climate: The hidden role of vapor pressure deficit. Agric. For. Meteorol. 2019, 279, 107692. [Google Scholar] [CrossRef]
  25. Febles Díaz, J.M.; Febles González, J.M.; González Calvo, T.; Tolón Becerra, A.; Sotelo Pérez, M.; Lastra-Bravo, X. Dual effects of carbon in Red Ferralitic soils in the San José de Las Lajas Polje, Cuba. Geoderma 2022, 407, 115525. [Google Scholar] [CrossRef]
  26. Zhao, M.; Geruo, A.; Liu, Y.; Konings, A.G. Evapotranspiration frequently increases during droughts. Nat. Clim. Change 2022, 12, 1024–1030. [Google Scholar] [CrossRef]
  27. Oliveira, S.; Cunha, J.; Nóbrega, R.L.B.; Gash, J.H.; Valente, F. Enhancing global rainfall interception loss estimation through vegetation structure modeling. J. Hydrol. 2024, 631, 130672. [Google Scholar] [CrossRef]
  28. Yang, Y.; Roderick, M.L.; Guo, H.; Miralles, D.G.; Zhang, L.; Fatichi, S.; Luo, X.; Zhang, Y.; Mcvicar, T.R.; Tu, Z.; et al. Evapotranspiration on a greening Earth. Nat. Rev. Earth Environ. 2023, 4, 626–641. [Google Scholar] [CrossRef]
  29. Sinacore, K.; Asbjornsen, H.; Hernandez-Santana, V.; Hall, J.S. Drought Differentially Affects Growth, Transpiration, and Water Use Efficiency of Mixed and Monospecific Planted Forests. Forests 2019, 10, 153. [Google Scholar] [CrossRef]
  30. Ohta, T.; Maximov, T.C.; Dolman, A.J.; Nakai, T.; van der Molen, M.K.; Kononov, A.V.; Maximov, A.P.; Hiyama, T.; Iijima, Y.; Moors, E.J.; et al. Interannual variation of water balance and summer evapotranspiration in an eastern Siberian larch forest over a 7-year period (1998–2006). Agric. For. Meteorol. 2008, 148, 1941–1953. [Google Scholar] [CrossRef]
  31. Zhang, J.; Zhang, P.; Liu, Y.; Lu, S.; Wu, G. An analysis of the spatiotemporal evolution and driving force of cultivated land green utilization in Karst region of southwest China. J. Clean. Prod. 2024, 434, 140002. [Google Scholar] [CrossRef]
  32. Liu, Y.; Shan, F.; Yue, H.; Wang, X. Characteristics of drought propagation and effects of water resources on vegetation in the Karst area of Southwest China. Sci. Total Environ. 2023, 891, 164663. [Google Scholar] [CrossRef]
  33. Han, X.; Zhang, B.; Liu, T.; Wang, J.; Zhou, Q.; Che, Z. The effect of time scales on the distribution of evapotranspiration and driving factors in desert grasslands. Agric. Water Manag. 2023, 284, 108348. [Google Scholar] [CrossRef]
  34. Kong, Z.; Wang, T.; Han, Q.; Dai, Y.; Zuo, Y.; Wang, L.; Lang, Y. Impacts of environmental factors on ecosystem water use efficiency: An insight from gross primary production and evapotranspiration dynamics. Agric. For. Meteorol. 2025, 362, 110382. [Google Scholar] [CrossRef]
  35. Xiao, M.; Yu, Z.; Kong, D.; Gu, X.; Mammarella, I.; Montagnani, L.; Arain, M.A.; Merbold, L.; Magliulo, V.; Lohila, A.; et al. Stomatal response to decreased relative humidity constrains the acceleration of terrestrial evapotranspiration. Environ. Res. Lett. 2020, 15, 94066. [Google Scholar] [CrossRef]
  36. Li, X.; Zhao, L.; Wang, N.; Liu, H.; Xie, C.; Zhang, Z.; Dong, X. Evapotranspiration partitioning and its influencing factors in an alpine meadow ecosystem: Using laser-based isotope monitoring techniques. Catena 2025, 252, 108834. [Google Scholar] [CrossRef]
  37. Gillner, S.; Vogt, J.; Tharang, A.; Dettmann, S.; Roloff, A. Role of street trees in mitigating effects of heat and drought at highly sealed urban sites. Landsc. Urban Plan. 2015, 143, 33–42. [Google Scholar] [CrossRef]
  38. Cheng, L.; Yang, M.; Wang, X.; Wan, G. Spatial and Temporal Variations of Terrestrial Evapotranspiration in the Upper Taohe River Basin from 2001 to 2018 Based on MOD16 ET Data. Adv. Meteorol. 2020, 2020, 3721414. [Google Scholar] [CrossRef]
  39. Rashid, M.A.; Andersen, M.N.; Wollenweber, B.; Kørup, K.; Zhang, X.; Olesen, J.E. Impact of heat-wave at high and low VPD on photosynthetic components of wheat and their recovery. Environ. Exp. Bot. 2018, 147, 138–146. [Google Scholar] [CrossRef]
  40. Zhu, Z.; Zheng, Y.; Kong, H.; Xiong, J.; Zheng, H. Towards real-weather water-production practice for solar-driven reverse distillation: Effects of ambient temperature and solar radiation. Desalination 2025, 608, 118826. [Google Scholar] [CrossRef]
  41. Cai, X. Water stress, water transfer and social equity in Northern China—Implications for policy reforms. J. Environ. Manag. 2008, 87, 14–25. [Google Scholar] [CrossRef]
  42. Chen, J.; Luo, W.; Zeng, G.; Wang, Y.; Lyu, Y.; Cai, X.; Zhang, L.; Cheng, A.; Zhang, X.; Wang, S. Response of surface evaporation and subsurface leakage to precipitation for simulated epikarst with different rock–soil structures. J. Hydrol. 2022, 610, 127850. [Google Scholar] [CrossRef]
  43. Li, X.; Guo, M.; Wang, H. Impact of soil texture and salt type on salt precipitation and evaporation under different hydraulic conditions. Hydrol. Process. 2022, 36, e14763. [Google Scholar] [CrossRef]
  44. Feng, K.; Siu, Y.L.; Guan, D.; Hubacek, K. Assessing regional virtual water flows and water footprints in the Yellow River Basin, China: A consumption based approach. Appl. Geogr. 2012, 32, 691–701. [Google Scholar] [CrossRef]
  45. Villarreal, S.; Vargas, R.; Yepez, E.A.; Acosta, J.S.; Castro, A.; Escoto-Rodriguez, M.; Lopez, E.; Martínez-Osuna, J.; Rodriguez, J.C.; Smith, S.V.; et al. Contrasting precipitation seasonality influences evapotranspiration dynamics in water-limited shrublands. J. Geophys. Res. Biogeosci. 2016, 121, 494–508. [Google Scholar] [CrossRef]
  46. Wang, Z.; Cui, Z.; He, T.; Tang, Q.; Xiao, P.; Zhang, P.; Wang, L. Attributing the Evapotranspiration Trend in the Upper and Middle Reaches of Yellow River Basin Using Global Evapotranspiration Products. Remote Sens. 2022, 14, 175. [Google Scholar] [CrossRef]
  47. Adinehvand, R.; Raeisi, E.; Hartmann, A. A step-wise semi-distributed simulation approach to characterize a karst aquifer and to support dam construction in a data-scarce environment. J. Hydrol. 2017, 554, 470–481. [Google Scholar] [CrossRef]
  48. Shang, S.; Zhu, G.; Zhang, K.; Chen, H.; Wang, Y.; Chen, Y.; Zhang, Z.; Ma, N. Spatial-temporal variations in evapotranspiration across the continental United States: An atmospheric water balance perspective. J. Hydrol. 2024, 640, 131699. [Google Scholar] [CrossRef]
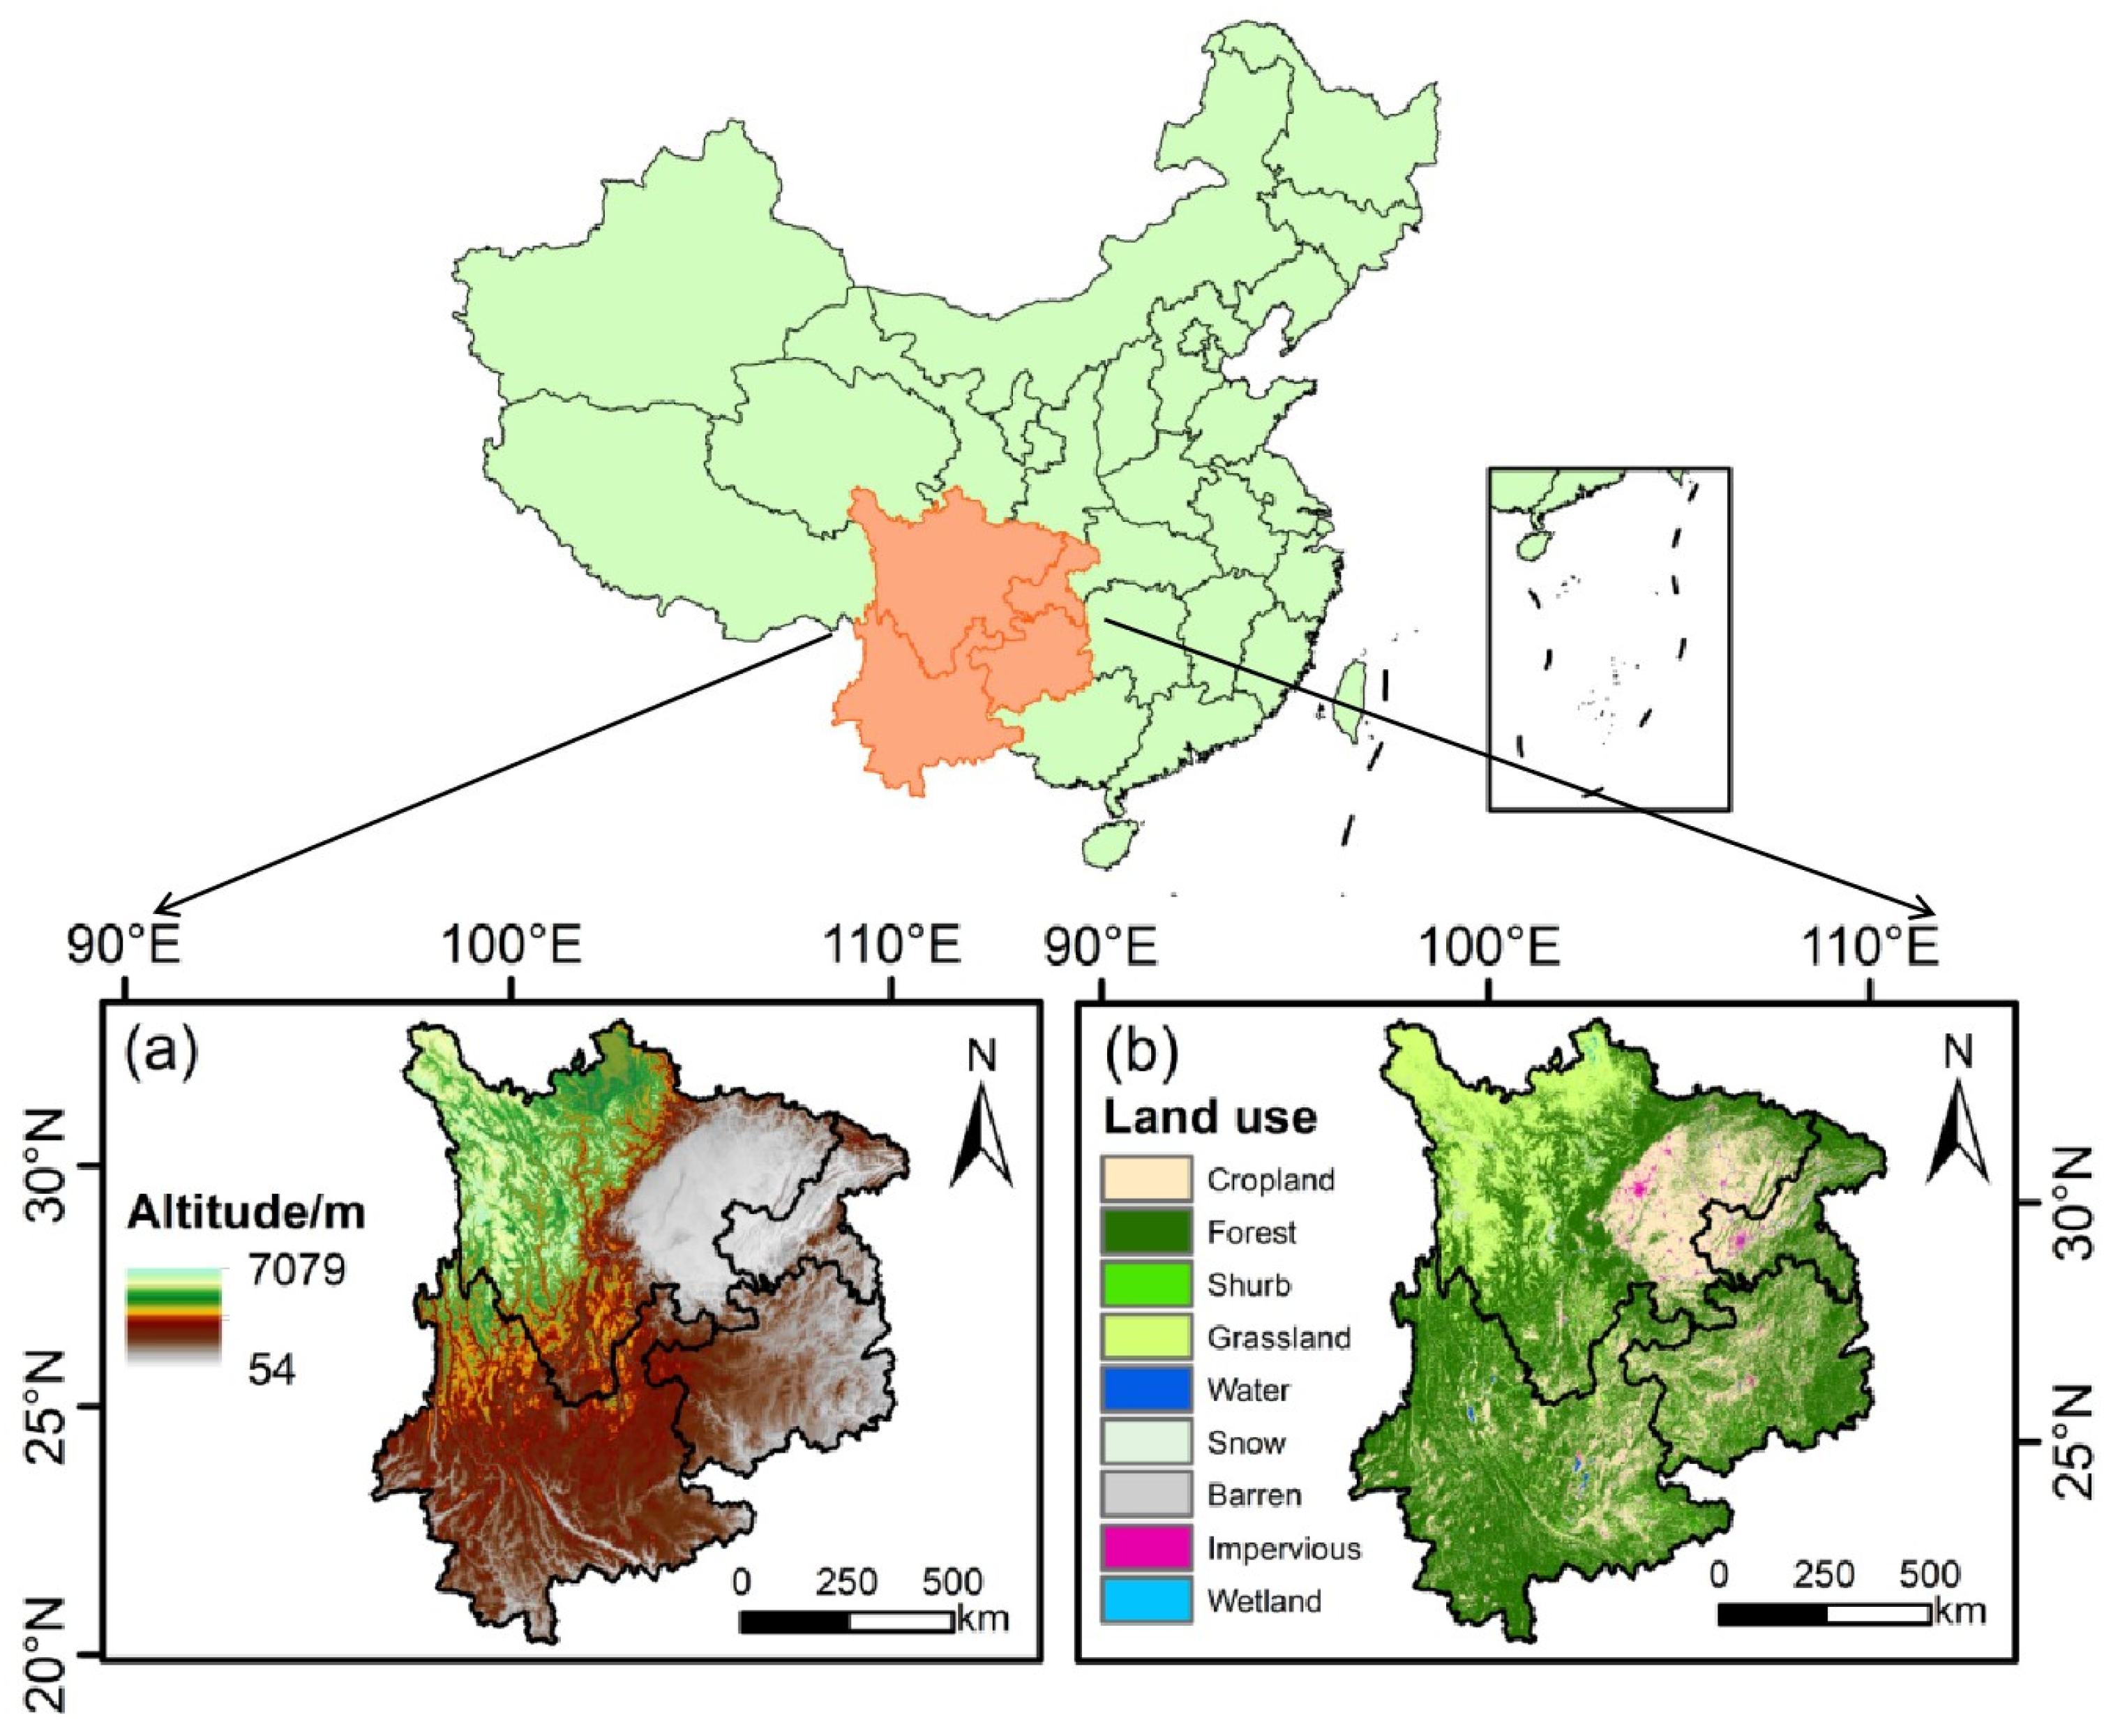
Figure 1. Overview of the southwest Karst region. (a) Elevation map of the study area; (b) Land use types of the study area.
Agronomy 15 02375 g001
Figure 2. ET results simulated by PT-JPL model and GLEAM ET (with linear fitting coefficient of determination R2 and root mean square error RMSE as evaluation indexes).
Agronomy 15 02375 g002
Figure 3. Spatiotemporal trends and interannual variations in Tem, Pre, Rad, and RH. (ad) Spatial dynamics of Tem, Pre, Rad, and RH; (eh) Significance of changes in Tem, Pre, Rad, and RH; (il) Time series of annual Tem, Pre, Rad, and RH from 2000 to 2018.
Agronomy 15 02375 g003
Figure 4. Spatial distributions of partial correlations between climatic factors and ET components. (ad) ET with Tem, Pre, Rad, and RH, respectively; (eh) ETc with Tem, Pre, Rad, and RH; (il) ETi with Tem, Pre, Rad, and RH; (mp) ETs with Tem, Pre, Rad, and RH. Trend categories are defined based on the Theil–Sen slope and Mann–Kendall test: Non-Significant Negative (NSN), Significant Negative (SN, p < 0.05), Non-Significant Positive (NSP), and Significant Positive (SP, p < 0.05).
Agronomy 15 02375 g004
Figure 5. Spatial patterns of the contributions of climatic factors to changes in PT-JPL-simulated ET components. (ad) ET; (eh) ETc; (il) ETi; (mp) ETs. Each row shows the contributions of Tem, Pre, Rad, and RH, respectively.
Agronomy 15 02375 g005
Figure 6. Distribution map of dominant factors: (a) ET, (b) ETc, (c) ETi, and (d) ETs.
Agronomy 15 02375 g006
Figure 7. Spatial distributions of the multi-year mean annual ET and its components (ETc, ETi, ETs) and their differences induced by vegetation change. The first column (a,d,g,j) shows ET, ETc, ETi, and ETs under the vegetation change scenario; the second column (b,e,h,k) shows the corresponding components under the constant vegetation scenario; the third column (c,f,i,l) shows the differences induced by vegetation change for each component.
Agronomy 15 02375 g007
Figure 8. Impacts of vegetation change on ET and its components (ETc, ETi, ETs). (ad) Change rates of ET and its components under vegetation changes from 2000 to 2018. (eh) Significance of changes under vegetation changes. (il) Change rates of ET and its components under constant vegetation from 2000 to 2018. (mp) Significance of changes under constant vegetation. (qt) Change rates of ET and its components caused by vegetation.
Agronomy 15 02375 g008
Figure 9. Path analysis of direct and indirect effects of vegetation and climatic factors on ET components. (a) ET; (b) ETc; (c) ETi; (d) ETs. (*, and *** indicate significance levels at p < 0.05, and p < 0.001, respectively; the larger the path coefficient, the thicker the arrow, with positive arrows in red and negative arrows in blue).
Agronomy 15 02375 g009
Disclaimer/Publisher’s Note: The statements, opinions and data contained in all publications are solely those of the individual author(s) and contributor(s) and not of MDPI and/or the editor(s). MDPI and/or the editor(s) disclaim responsibility for any injury to people or property resulting from any ideas, methods, instructions or products referred to in the content.