Article

Limitations in the Valorization of Food Waste as Fertilizer: Cytogenotoxicity Assessment of Apple and Tomato Juices By-Products

by
Silvica Padureanu
and
Antoanela Patras
*
“Ion Ionescu de la Brad” Iasi University of Life Sciences, 3 M. Sadoveanu Alley, 700490 Iasi, Romania
*
Author to whom correspondence should be addressed.
Agronomy 2025, 15(10), 2364; https://doi.org/10.3390/agronomy15102364
Submission received: 21 August 2025 / Revised: 7 October 2025 / Accepted: 8 October 2025 / Published: 9 October 2025
(This article belongs to the Section Agricultural Biosystem and Biological Engineering)

Abstract

Apples and tomatoes are among the most consumed products all over the world, as well as the natural juices prepared from each of them. The large quantities of resulting by-products should be reused in various directions within the circular economy. In this study, apple and tomato pomaces were tested as potential biofertilizers for agricultural crops. To this end, aqueous extracts of apple pomace and tomato pomace were prepared in two concentrations (0.05% and 0.5%) and used to treat wheat caryopses and sprouts. The following were evaluated: mitotic index, genotoxic index, caryopses germination rate, and wheat sprout growth. The biotic response of wheat to treatments with the apple and tomato pomace extracts consisted of reduced mitotic activity, i.e., cytotoxicity, and the formation of genetic abnormalities, i.e., genotoxicity. The cytotoxicity and the genotoxicity were reflected at the macro level in phytotoxic effects, manifested by a reduction in the germination rate of caryopses and a decrease in the length of wheat roots and shoots. Physiological parameters were positively correlated with the mitotic index and negatively correlated with the genotoxic index. The obtained results point us not to recommend the use of unprocessed apple and tomato pomaces as biofertilizers, but, on the contrary, as bioherbicides.

1. Introduction

By-products from the fruit and vegetable processing industry are a contemporary global concern. Worldwide, half of all fruit and vegetables end up as waste or by-products generated by industrial processing, generating management and economic problems [1]. Plant waste poses problems because of its water content, rapid autoxidation potential, intense enzymatic activity that facilitates microbial spoilage, and greenhouse gas emissions, increasing the risk of environmental pollution [2,3].
Plant waste is increasingly receiving significant attention as the ultimate substrate for the recovery of functional compounds and the development of new products with market value. Functional compounds consist most often of carotenoids, polyphenols, pectin, water-insoluble fibers (hemicelluloses), sugars, enzymes, etc. Their importance is given by their antioxidant, antimicrobial, anti-inflammatory, anticancer, and cardiovascular protective properties [3,4]. Of all the bioactive compounds recovered from plant waste, polyphenols offer considerable benefits, as they are crucial dietary compounds for the prevention and treatment of many human pathologies [5,6]. The low cost and simple availability of this residual biomass encourage the economic prospects of its potentially valuable components. In this respect, vegetable waste is valorized in key economic areas, such as the pharmaceutical industry, for nutraceuticals; the food industry, for functional foods; agriculture, for fertilizers; and wastewater remediation in metallurgical and steel industries.
Appropriate management of plant waste as biofertilizers in agriculture allows the recovery of valuable materials such as nitrogen (valuable amino acids), phosphorus, potassium, microelements, and biologically active substances with properties that stimulate plant growth [7].
The recovery of bioactive compounds from vegetable waste, the recycling and sustainability of high-value-added ingredients in the food chain through functional food products, and the concept of bio-based fertilizers and agrochemicals in an ecological cycle are in line with the sustainable circular bio-economy [4,7,8]. On the contrary, in a linear economy, consumption generates non-recycled waste that harms the environment [9]. The inclusion of vegetable waste/by-products in nutraceuticals, food supplements, and animal feed is encouraged by governmental authorities in order to avoid environmental pollution as much as possible and for the economic advantages resulting from the circular economy [7].
Apple and tomato pomaces are the most common vegetable waste in the temperate zone due to the massive quantities processed every year. Apple and tomato fruits are characterized by a large edible portion and moderate amounts of waste, such as peels, seeds, and pits [10].
Apples (Malus domestica Borkh.) are among the most consumed fruits in the world. The huge quantities of apple waste pose environmental problems, a potential risk to public health, and significant disposal costs [11,12]. The apples and the apple by-products are a potential source of natural antioxidants. The apple pomace is a mixture of peel, core, seeds, calyx, stem, and soft tissue. Biochemically, apple pomace contains polar lipids, pectin, some vitamins (C, E, B12, D), oligosaccharides, dietary fibers, triterpenic acids—especially ursolic acid—phenolic compounds such as hydroxybenzoic and hydroxycinnamic acids, flavonols, anthocyanins, etc. [11,12,13,14,15]. In agreement with Szabo [4], the most representative phenolic compounds in apple pomace are phloridzin, chlorogenic acid, and epicatechin, with major health implications in diabetes, cancer, cardiovascular, and neurocognitive diseases. The richness of bioactive compounds recommends apple pomace as a dietary supplement, functional food, food additive, and cosmetic adjuvant. The foods in which apple pomace is incorporated are cakes, bread, biscuits, yogurt, beer, cider, etc. [16,17,18,19,20,21]. The trend of including apple pomace in food products is rapidly increasing due to governmental pressure on food manufacturers to reduce sugar content [16]. In feed, apple pomace is considered a low-value feedstock due to its low protein and mineral content and low digestibility, linked to its high lignin/cellulose ratio [8,22]. Even after selective extraction of valuable bioactive components, apple wastes are effective as biosorbents for the removal of lead from contaminated waters [9].
Tomatoes (Lycopersicon esculentum Mill.) are the second most important vegetable crop worldwide, with a significant increase in production in recent decades. More than one-third of tomato production is processed, resulting in significant quantities of by-products [23]. Tomato husks and seeds are often used as animal feed, fertilizer, or thrown in landfills [24,25]. The scientific literature reports a diversity of bioactive compounds in tomatoes and tomato pomace, such as carotenoids, flavonols primarily as quercetin, vitamins (A, C, B1, B2, B6, E, folate, B12, niacin, K, H), potassium, etc. Quercetin, naringenin, and rutin are the predominant phenols in tomato by-products, with antioxidant and antimicrobial properties [4,26,27,28]. Lycopene is the most prominent carotenoid in tomatoes, followed by beta-carotene, gamma-carotene and phytoene, and several other minor carotenoids [27,29]. Tomato peels and the water-insoluble fraction directly beneath the skin concentrate lycopene and high amounts of ascorbic acid and phenols [26,30]. Tomatoes are the main available source of lycopene [31,32,33]. Lycopene has a high capacity to scavenge free radicals and prevent cellular oxidative stress, suppress cell proliferation, and interfere with cancer cell growth [31]. Bioactive compounds, especially carotenoids present in by-products derived from tomatoes, are an inexpensive source of functional ingredients [25]. Recovered compounds from tomato pomace can be successfully used for the formulation of functional foods, pharmaceuticals, and cosmetics, replacing some chemically synthesized compounds. The process of improving the extractive techniques for lycopene recovery from tomato pomace is a preoccupation of many groups of researchers [34,35,36,37].
In the scientific literature, there is an acute lack of in-depth studies on the holistic approach to the effects of apple, tomato, and other pomace when they are stored unprocessed in the soil. There is also a lack of techno-economic and environmental studies on the use of apple and tomato pomace. EFSA (European Food Safety Authority) encourages the recycling of biowaste on the one hand, but requires manufacturers to test the biosafety of each new product placed on the market on the other hand [38,39]. The reuse of biowaste should take into account that some parts of the plants could contain compounds that, alone or in synergy with others, could exert toxic effects [40]. Another concern about by-product recovery is that the waste, rather than the fruits, may retain toxic residues (organic substances such as aromatic compounds and others) [41]. Although there are many scientific reports and extensive reviews on biologically active compounds and their extraction technologies from apple, tomato, and other plant by-products, it is also imperative to investigate the direct cellular effects of extracts from apple, tomato, and other plant by-products. In this regard, Bolarinwa [42] and Gumul [43] warn that, in addition to the benefits, the consumption in animal and human diets of apple pomace may raise questions about apple seeds. They contain a cyanogenic glycoside, amygdalin—a potentially toxigenic compound, which interacts with digestive enzymes, leading to the release of hydrocyanic acid. Depending on the concentration, amygdalin can cause dizziness or even paralysis and coma. Skinner [14] and Awasthi [8] show that the effects of pesticide residues, high levels of cyanogenic glycoside amygdalin from apple seeds, and accumulation of patulin from apple seeds are insufficiently addressed so far. Phachonpai [44] indicates the need for further studies to assess whether the beneficial effects of tomato pomace in rats are similar to those in humans. Vilas-Boas [40] warns that bioactive compounds extracted from plant waste must comply with legal requirements and assessments to evaluate risks to human health, and their toxicity must be considered before they are released on the market. Radić [45], considering the influence of processing and pretreatment of raw materials on the quality of tomato pomace, recommends further research on the characteristics of compounds in tomato pomace, which would increase the economic and ecological feasibility of the valorization of this pomace. Thus, it is recognized that significant efforts are needed to close the gap between research and industrial implementation, which will allow the complete utilization of tomato pomace in accordance with the principle of the circular economy. Chojnacka [7] emphasizes that, before they are launched on the market, the waste-derived products which correct the composition of fertilizers, it is necessary to know their effects on plants and to establish the doses. Musto [46] emphasizes that risk assessments on the safety of nutraceuticals derived from bio-waste are quite rare and that their inclusion in the list of permitted products intended for human consumption is very necessary.
Relatively recent studies emphasize that olive pomace is harmful to the environment because it contains phytotoxic components such as mycotoxins, polycyclic aromatic hydrocarbons, and pesticides [47,48].
Wastewater from olive processing, and especially olive pomace, has significant polluting properties, with toxicological effects on soil earthworms, which is why remediation and bioremediation processes are recommended to reduce their toxicity to the environment. In this regard, emphasis is on reducing the level of polyphenols and salinity in olive waste, which will be reflected in the biochemical and cellular parameters of the earthworms [49].
Another study demonstrated that unprocessed grape pomace reduces the mitotic index and induces genotoxicity and phytotoxicity in wheat [50].
Taking into account the above recommendations, we conducted a study focused on the cytogenetic effects of unprocessed apple and tomato pomaces at two different concentrations (on a laboratory scale) on a test plant—common wheat. The aim of this study was to test the possible fertilizing potential of apple and tomato pomace. To this end, we chose two key cytogenetic indicators—the mitotic index and the genotoxic index—to determine the effectiveness of the two types of pomace as potential fertilizers.
According to EFSA, for the safety assessment of any product, the genotoxicity evaluation is essential [38]. The tests for genotoxicity include measuring primary DNA damage that can be repaired and is therefore reversible; identifying stable and irreversible damage, i.e., gene mutations and chromosomal aberrations in somatic cells and in germ cells; and disruption of mechanisms involved in preserving genome integrity [51]. In this respect, in vitro genotoxicity testing of waste is well-suited to verify the ability of a substance to alter the genome of the cells with which it interferes by inducing DNA mutations through chromosomal rearrangements. The accumulation of mutations favors cell transformation and the development of cancer. Therefore, DNA damage is an important parameter for the identification of genotoxins and the prevention of their potential harm [52].
The Ames test and the micronucleus test can be used to confirm the genotoxic safety of nutraceutical products from plant waste, but both tests have limitations imposed by the protocol. The Ames test uses bacterial DNA as a mimic of the human genome. This ignores the fact that human DNA contains introns and is compacted by histones and can be affected differently by mutagens. In addition, the silent mutations and the mutations occurring in the promoter regions of genes could be more dangerous to human cells than the classic point mutations detected by the Ames test. With regard to the micronucleus test, it only identifies massive chromosome changes, not minimal but potentially dangerous chromosome rearrangements [53].
The main objectives pursued in the present study are as follows:
(a)
to determine the mitotic index of the embryonic roots of wheat sprouts treated with apple and tomato pomaces;
(b)
to determine the level of genotoxicity induced by the treatments with apple and tomato pomaces;
(c)
to determine the germination of caryopses, root length, and stem length of wheat sprouts under the influence of treatments with apple and tomato pomaces;
(d)
to establish correlations between the mitotic index and the level of genotoxicity on the one hand and the germination rate of caryopses, root length, and stem length of wheat sprouts on the other hand.

2. Materials and Methods

2.1. Extracts Preparation

The treatments applied during germination were performed with aqueous extracts of apple and, respectively, tomato pomace in two concentrations: 0.05% and 0.5%, prepared according to Padureanu and Patras [50] with modifications.
The apple pomace resulted from juice preparation and was provided by a local small juice producer company from the northeast of Romania, which uses a mixture of local varieties of fresh apples to prepare the natural juice by cold pressing. The tomato pomace is the by-product obtained from tomato juice preparation and was provided by another company from the east of Romania, which also uses a mixture of local varieties of tomatoes to prepare the tomato juice after thermal treatment (95 °C), according to the usual technological procedure. Both pomaces were collected immediately after juice processing and stabilized by drying at 60 °C (10 h) up to constant weight in a convective laboratory oven (Biobase BOV-T30C, Jinan, China).The dried pomaces were ground, sieved (1 mm), and stored in a cold and dry place.
The extraction was performed in 3 steps. A precisely measured quantity of 5 g of dried pomace was mixed with 500 mL of distilled water. The first step was conducted at room temperature (20 °C), under constant shaking, for 3 h. Then, the supernatant was decanted and collected, and the remaining solid residue was mixed with 300 mL of distilled water and re-extracted for 30 min, using an ultrasonic bath (MRC, model AC-120H, Essex, UK) with the ultrasonic frequency of 40 KHz. The supernatant was collected together with the previous one, while the residue was mixed with 200 mL of distilled water and extracted one more time, using the ultrasonic bath, for 30 min. All 3 fractions were mixed together and filtered, and thus the 0.5% solutions were obtained. The 0.05% solutions were prepared similarly, only that the weighted pomace was 0.5 g instead of 5 g.

2.2. Experimental Procedure

The biological material consists of wheat caryopses (Triticum aestivum L., Darnic variety), obtained from the experimental farm of Iaşi University of Life Sciences, Romania. Triticum aestivum (2n = 6x = 42 chromosomes) is a test plant frequently used in cytogenetic research [54].

2.3. Experiment Design

Dry wheat caryopses were placed in 15 Petri dishes of 100 mm diameter on filter paper. For each Petri dish, 100 caryopses were used. The control (C) consisted of 3 Petri dishes, which were irrigated with distilled water. The other 12 Petri dishes represented 4 variants in triplicate, i.e., in 3 dishes, apple pomace extract (APE) 0.05% (APE 1) was used for irrigation; in 3 dishes, APE 0.5% (APE 2); in 3 dishes, tomato pomace extract (TPE) 0.05% (TPE 1); and in 3 dishes, TPE 0.5% (TPE 2).
The caryopses in each Petri dish were initially irrigated with 10 mL distilled water for C, or pomace extracts, respectively (APE 1, APE 2, TPE 1, TPE 2), then incubated in an MRC PGI-500H germination chamber (Ho-lon, Israel) at 25 ± 2 °C, humidity 95% ± 2 °C, in the absence of light for the first 48 h.
For the next 48 h, the climatic parameters were set as follows: 20 ± 2 °C, 95% ± 2 °C humidity, 16 h of light (4780 lux intensity), alternating with 8 h of darkness. In order to maintain their freshness, after the first 24 h of incubation, in all Petri dishes, the distilled water/pomace extracts were removed and replaced with the same solution (25 mL/Petri dish). This operation was repeated every 24 h during the experiment of 96 h. The wheat sprouts were harvested after three different intervals, i.e., 48 h, 72 h, and 96 h.

2.4. Cytogenetic Parameters

Cytogenetic investigations were performed on meristematic cells from the root apices of 48 h old embryonic wheat roots. To this end, were randomly sampled 60 embryonic roots from 60 wheat sprouts/replicate and 180 wheat sprouts/experimental variant, respectively (subsequent to the first measurement of caryopses’ germination rate, as well as the root length and embryonic shoot length).
Genetic material at the nucleus/chromosome level was revealed by applying the standard Feulgen squash protocol [55]. Thus, the 15–17 mm long embryonic roots were immersed in Carnoy fixative I (3:1 v/v, ethanol-glacial acetic acid ethanol) for 24 h at 4 °C, then hydrolyzed with 1N HCl at 60 °C for 15 min, followed by staining with Carr’s reagent (carbol–fucsin solution) for 24 h at 4 °C. From the processed embryonic roots were used only the 2–3 mm tips, which were placed on a slide (3–4 tips/slide), then immersed in a drop of 45% acetic acid. After that, they were squashed under a glass cover. A total of 15 slides/replication and 45 slides/variant were prepared. On these slides, at least 260 cells/slide were examined, i.e., about 3900 cells were examined/replication and about 11700 cells/variant in different mitotic phases as well as in the interphase. The slides were studied under a Leica ICC50 optical microscope (1000 magnification), equipped with a digital camera to capture the images (digital photomicrographs).
Based on the raw data obtained by examining the slides, we determined: the mitotic index (MI), the frequency of each mitotic phase, and the genotoxic index (GI).
To calculate the mitotic index (MI), the following formula [56] was used:
MI (%) = number of dividing cells/total cells (dividing and nondividing) × 100.
In order to evaluate the dynamics of the mitotic cycle influenced by the treatments with apple and tomato pomace extracts, the frequencies of cells in each mitotic phase (prophase, metaphase, anaphase, telophase) were determined by applying the following formulae:
cells in prophase (%) = number of prophase cells/total cells (dividing and nondividing) × 100;
cells in metaphase (%) = number of metaphase cells/total cells (dividing and nondividing) × 100;
cells in anaphase (%) = number of anaphase cells/total cells (dividing and nondividing) × 100;
cells in telophase (%) = number of telophase cells/total cells (dividing and nondividing) × 100.
The genotoxic index (GI) (%) was obtained by summing the frequencies of aberrant cells in different phases of the mitotic cell cycle. In the present study, aberrant cells were identified in metaphases, ana-telophases (A-T), and interphases. Therefore, we applied the following formula to calculate the genotoxic index:
GI (%) = cells with aberrant metaphases (%) + cells with aberrant A-T (%) + cells with aberrant interphases (%).
Aberrant cell frequencies were calculated with the following formulae:
cells with chromosomal aberrations in metaphases (%) = number of cells in aberrant metaphases/total cells (dividing and nondividing) × 100;
cells with chromosomal aberrations in A-T (%) = number of cells in aberrant A-T/total cells (dividing and nondividing) × 100;
cells with aberrant interphases (%) = number of cells with aberrant interphases/total cells (dividing and nondividing) × 100.
The percentage of each type of genetic abnormality detected in aberrant metaphases, or aberrant A-T, or aberrant interphases was also calculated in relation to the number of cells in the mitotic cycle as follows:
the type of genetic abnormality (%) = number of any kind of genetic abnormality observed/total cells observed × 100.
Cells with various genetic abnormalities were photographed with the microscope’s digital camera.

2.5. Determination of the Germination Rate

The germination rate of wheat caryopses was investigated for the three replicates/experimental variant, every 24 h over three days: after 48 h, 72 h, and 96 h (h).
The formula applied for the germination rate of wheat caryopses is [57]:
Germination rate (%) = germinated caryopses/total caryopses × 100

2.6. Measurement of the Embryonic Root and Shoot Lengths

The length of embryonic roots and shoots of wheat sprouts was dynamically evaluated in parallel with the determination of the germination rate of caryopses, i.e., after 48 h, 72 h, and 96 h of culture. Given that wheat germination starts with 3 embryonic roots/caryopses, the length of the longest embryonic root/sprout was measured. The measurement of the shoot was performed from the base of the embryonic root upwards. On the same wheat sprout, both the root and the shoot were measured. The results were expressed in mm.

2.7. Correlations Between Cytogenetic Parameters and Biometric Parameters

The cytogenetic parameters (MI and GI) were correlated with the biometric parameters (germination rate, embryonic root, and shoot lengths) for each variant: after 48 h, 72 h, and 96 h. To establish these correlations, the coefficient R2 was calculated.

2.8. Statistical Analysis

The results (obtained in triplicate) were analyzed through one-way ANOVA and Duncan post hoc multiple comparison test, using IBM SPSS Statistics 21 software (significance level 0.05). Results were expressed as means ± standard deviation. Microsoft Excel 2010 was used to calculate the standard deviations (±SD) and correlation coefficients (R2), and the graphical representations.

3. Results

3.1. Evaluation of the Cytogenetic Parameters

3.1.1. Mitotic Index

MI decreased significantly compared to the control group (C) (15.49%) in APE 2 (8.66%) and TPE 2 (10.33%). In these two variants, the concentration of pomace extracts was 0.5% (Table 1).
Prophases were the most abundant of the four mitotic phases in all cases of the experiment. Compared to C, the lowest frequencies in each phase of mitotic division were recorded in APE 2 and TPE 2.

3.1.2. Genetic Abnormalities

The treatments of wheat caryopses with APE and TPE induced genotoxic effects, which were investigated by quantification of genetically abnormal cells in embryonic root tips. These genetic abnormalities were identified in metaphases, ana-telophases (A-T), and interphases. Table 2 presents the frequencies of cells with genetic abnormalities, also called aberrant cells, in the above-mentioned phases. By summing these frequencies, the genotoxic index was obtained for each variant.
The aberrant metaphases induced by APE and TPE treatments presented subunitary frequencies in all cases analyzed. Of these, in APE 2, the frequency of aberrant metaphases was the highest (0.27%) and statistically assured. In TPE 1, the frequency of aberrant metaphases was the lowest (0.03%). In C, no aberrant metaphases were recorded (Table 2).
APE and TPE treatments also induced aberrant ana-telophases, with overunitary frequencies, the most significant of which were recorded in APE 2 (1.74%) and TPE 2 (1.51%). In C, aberrant anaphase-telophases occurred spontaneously, with an insignificant frequency of 0.14% (Table 2).
Aberrant interphases were present in all APE and TPE treatment variants. In APE 2 and TPE 2 variants, the frequencies of aberrant interphases were significantly higher, namely 1.54% and 1.32%, respectively. Even in C, aberrant interphases appeared spontaneously, but with insignificant frequencies of 0.10% (Table 2).
The genotoxic index (GI) allows the overall assessment of the frequency of cells with genetic abnormalities identified in wheat embryonic roots treated with APE and TPE. The GI recorded values overunitary (1.23–3.54%) for all variants treated with APE and TPE. In descending order, GI values were: 3.54% for APE 2, 2.90% for TPE 2, 1.43% for APE 1, and 1.23% for TPE 1. GI was subunitary, insignificant (0.24%) in C (Table 2).
The correlation between GI (%) and MI (%) is negative and high (R2 =−0.9198) (Figure 1).
Genetic abnormalities detected in meristematic cells of Triticum aestivum induced by treatments with APE and TPE were of various types. Thus, in the aberrant metaphases were identified: chromosomal fragments and laggard chromosomes, all with subunitary frequencies. The chromosomal fragments were recorded in all experimental variants treated with APE and TPE. In APE 2, their frequency was significantly higher, namely 0.21%, while in TPE 1, their frequency was the lowest, namely 0.02%. The laggard chromosomes appeared in metaphase in APE 2, TPE 1, and TPE 2, with frequencies ranging between 0.01% and 0.06%. In C no genetic abnormality in the metaphases (Figure 2).
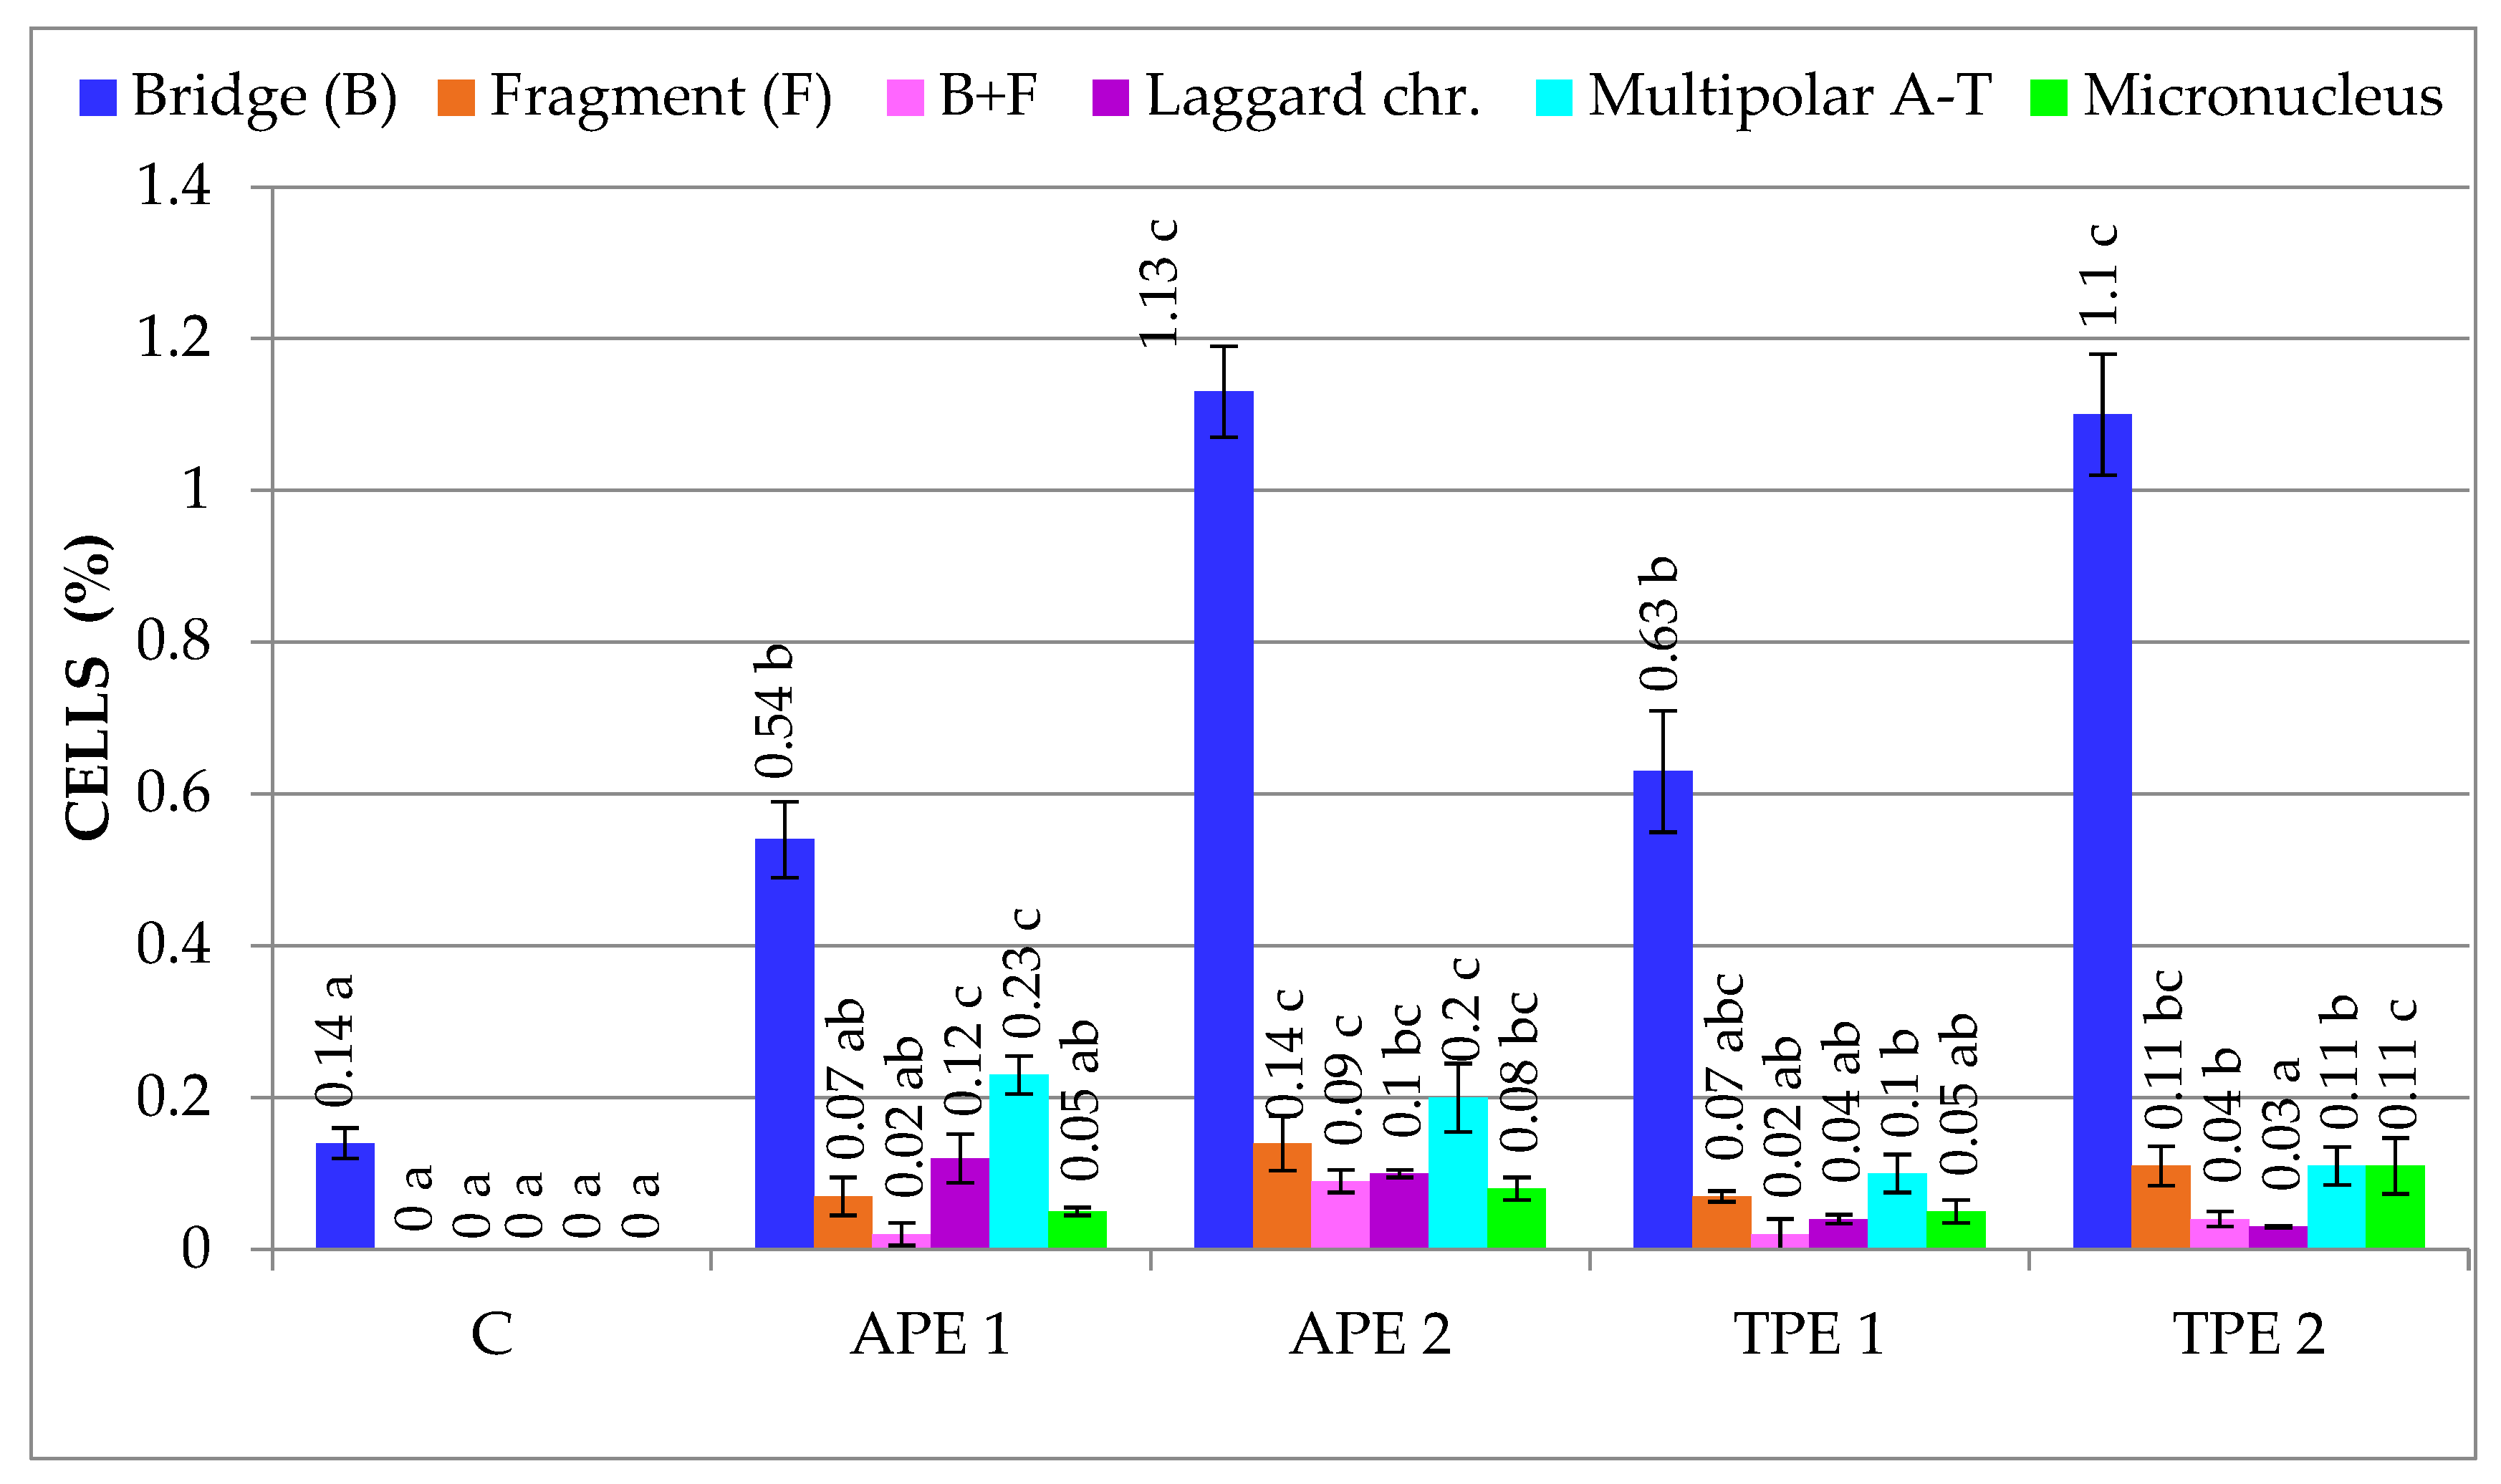
Most genetic abnormalities were present in ana-telophase cells, represented by: chromosomal bridges, chromosomal fragments, associations between bridges and fragments, laggard chromosomes, multipolar ana-telophases, micronuclei (Figure 3).
These genetic abnormalities were present in all four variants of APE and TPE treatments, but with different frequencies. Among these, chromosomal bridges were the most abundant. Their frequency ranged between 0.14% and 1.13%. In APE 2 and TPE 2, chromosomal bridges had overunitary frequencies of 1.13% and 1.1%, respectively. The other types of genetic abnormalities had subunitary frequencies. C showed spontaneously occurring chromosomal bridges with an insignificant frequency of only 0.14%.
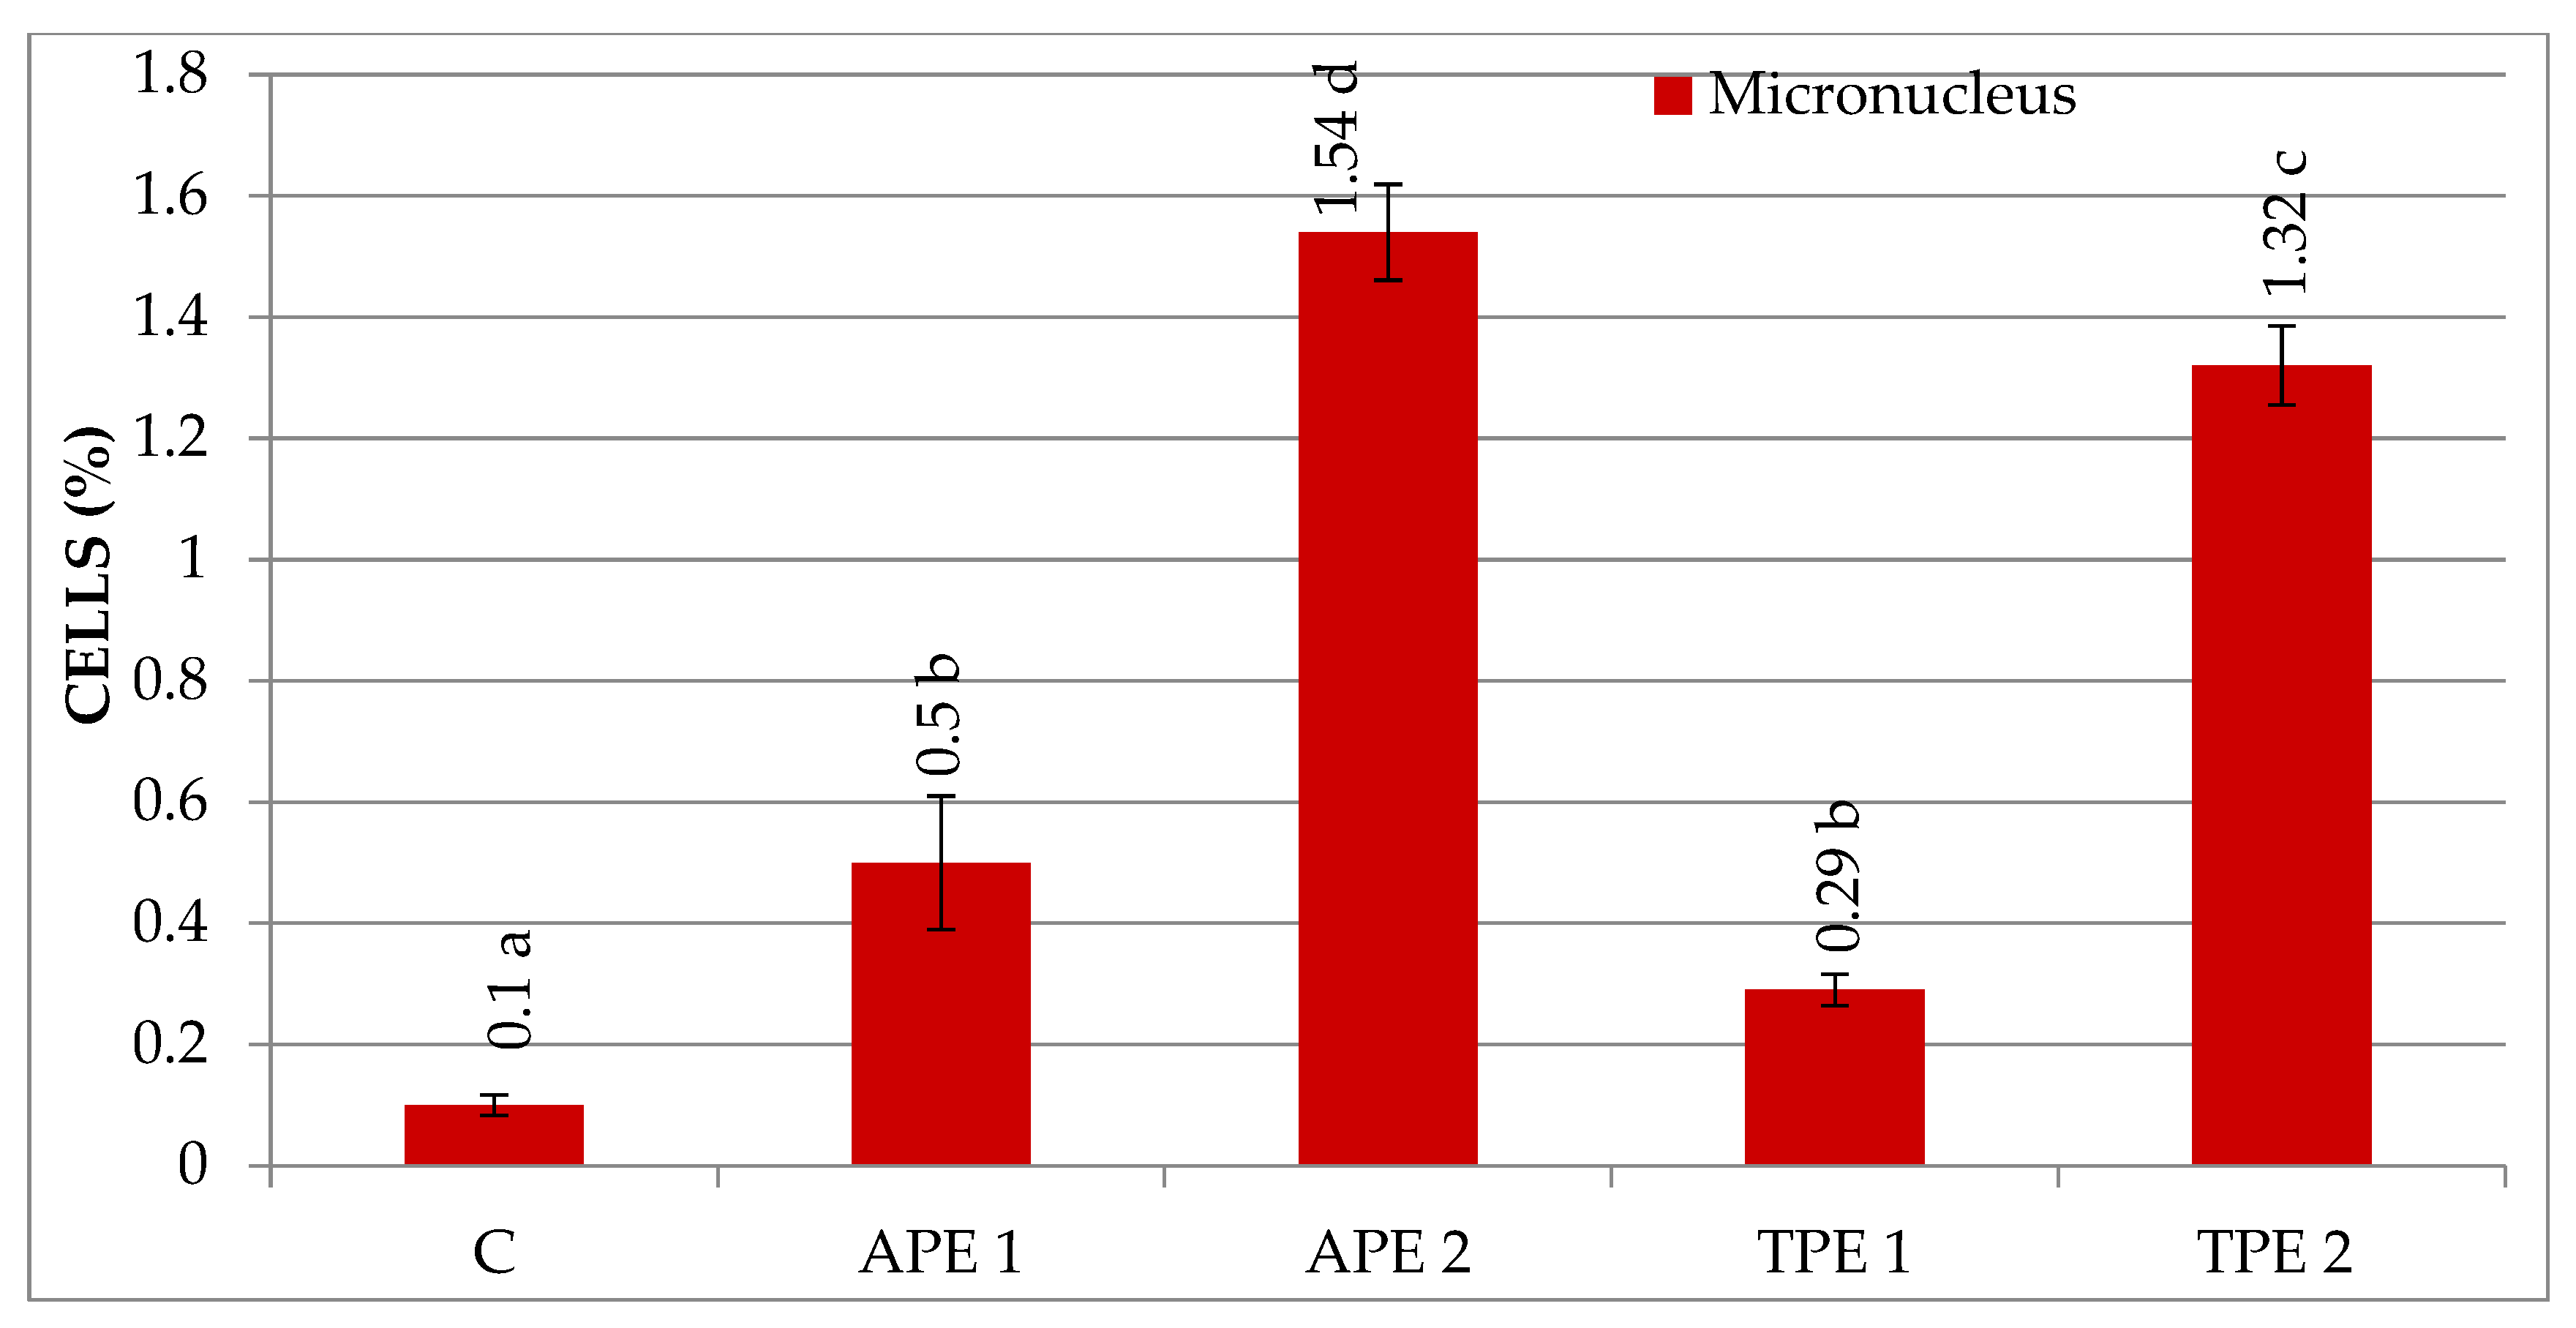
The genetic abnormalities identified in interphase cells were represented by micronuclei (Figure 4). The micronuclei were recorded in all experimental variants, even in C, with different frequencies. In APE 2 and TPE 2 variants, the frequency of micronuclei was significantly higher, namely 1.54% and 1.32%, respectively. APE 1 and TPE 1 had low micronuclei frequencies of 0.50% and 0.29%, respectively. Spontaneously occurring micronuclei in C had the lowest frequency, only 0.1%.
The genetic abnormalities identified in the wheat root meristems treated with APE and TPE demonstrate the genotoxic potential of the two types of pomace at concentrations of 0.05% and 0.5%.
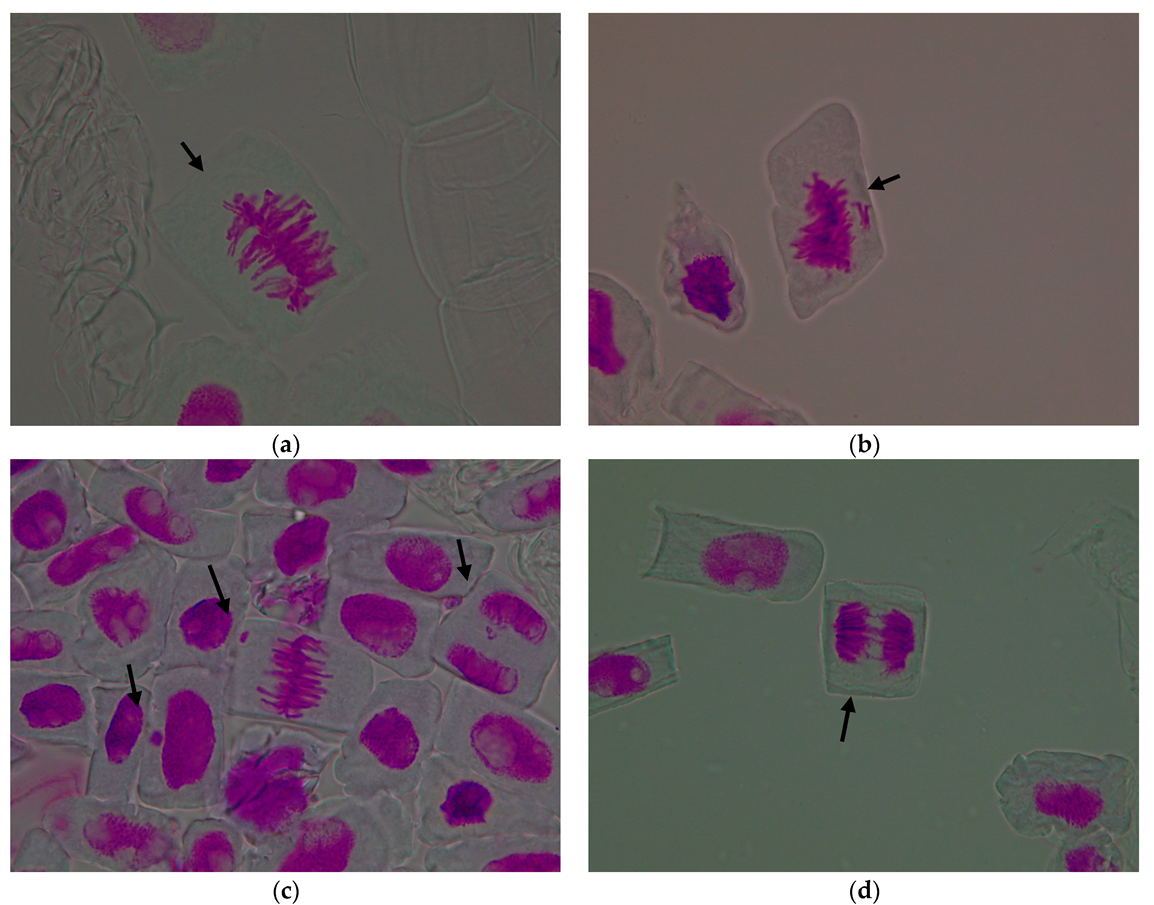
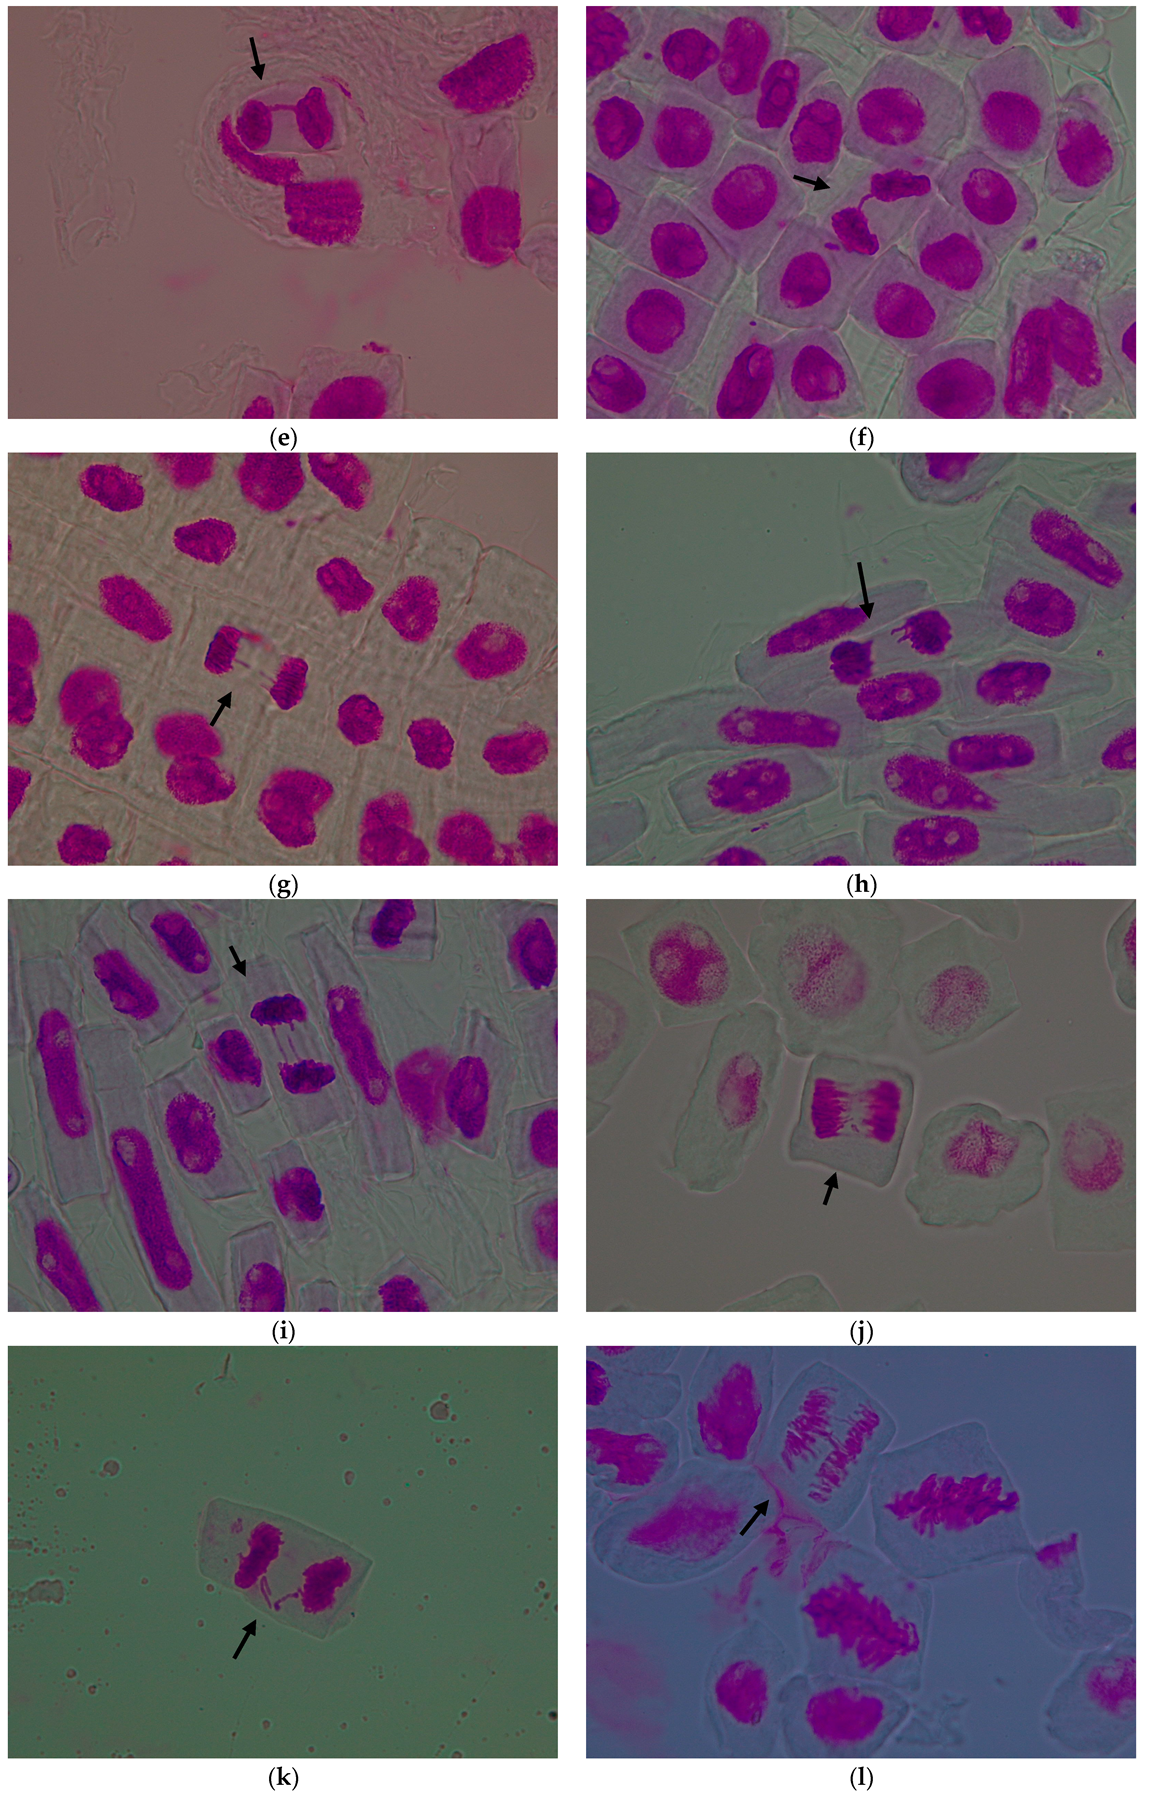
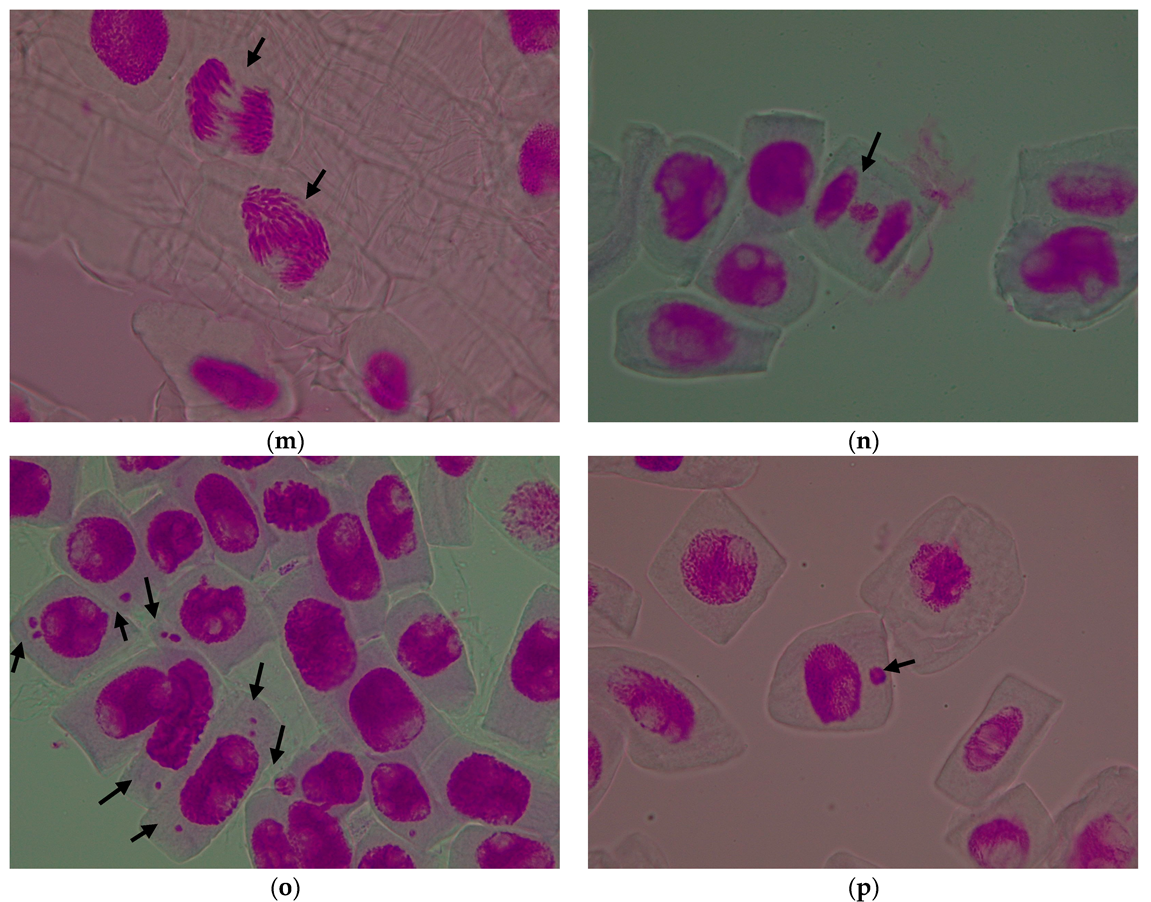
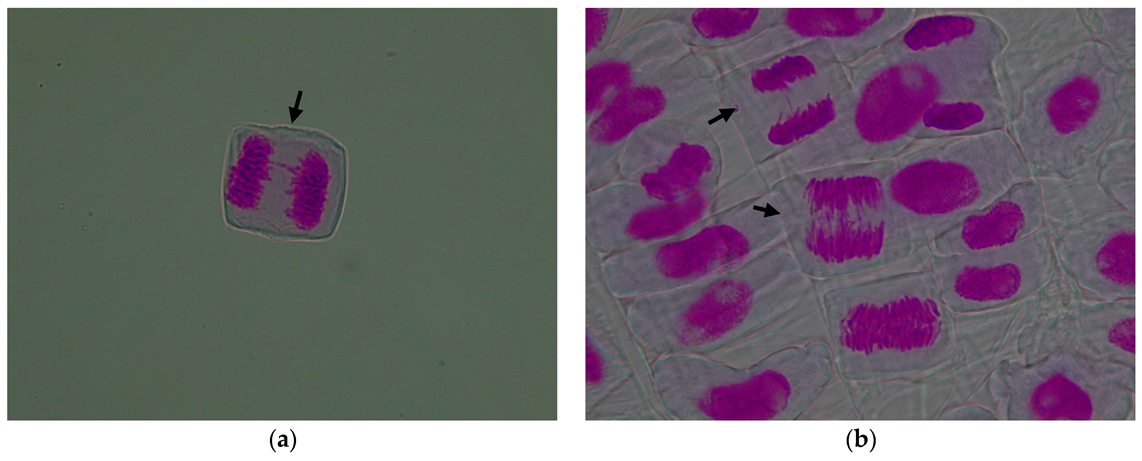
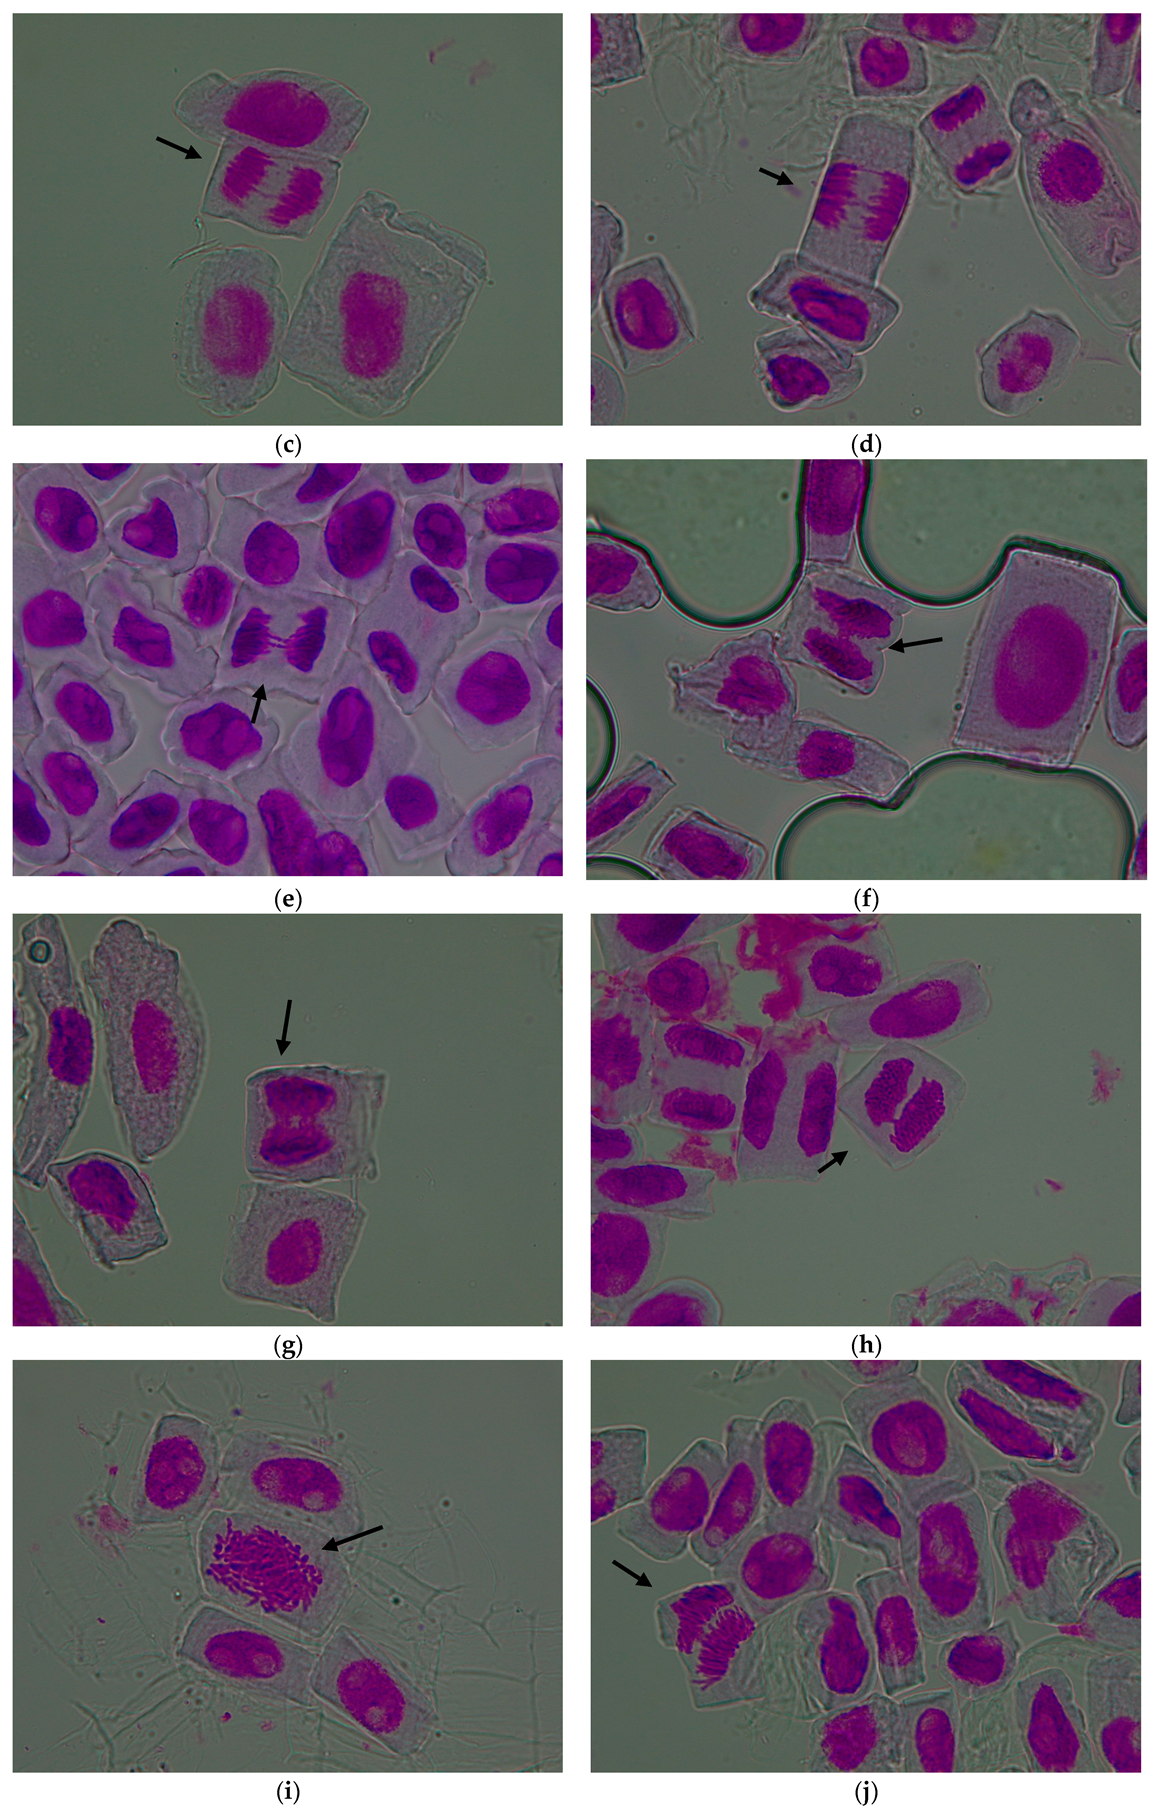
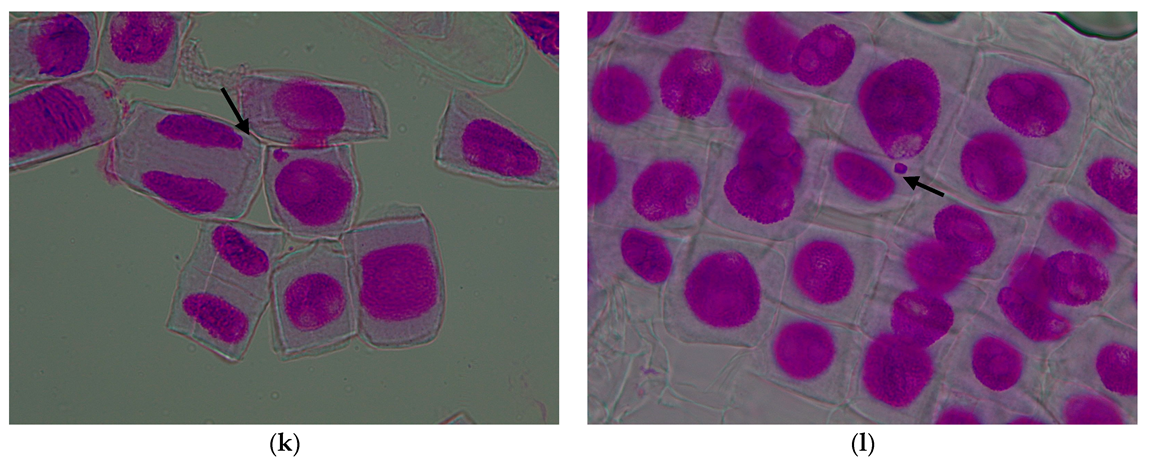
The images shown in Figure 5 and Figure 6 demonstrate the pattern of genomic damage induced by treatments with APE (Figure 5) and TPE (Figure 6) in Triticum aestivum root meristems.

3.2. Evaluation of the Length of the Embryonic Root and Shoot

The length of the embryonic roots and shoots of wheat was dynamically monitored over the course of 96 h of the culture (Table 3 and Table 4).
After 48 h of culture, the roots of C (11.14 mm), APE 1 (11.23 mm), and TPE 1 (11.36 mm) increased significantly compared to APE 2 (10.1 mm) and TPE 2 (10.24 mm).
After 72 h of culture, the longest roots were those of C (30.97 mm), statistically assured, followed by TPE 1 (30.02 mm), APE 1 (29.58 mm), and TPE 2 (28.50 mm). The shortest embryonic roots were in APE 2 (27.24 mm).
After 96 h of culture, the roots of C were significantly longer (53.46 mm), statistically assured. The shortest embryonic roots at this time of monitoring were recorded in APE 2 (39.79 mm) and TPE 2 (42.57 mm).
The dynamics of wheat shoot length growth over 96 h of culture are presented in Table 4.
After 48 h of culture, wheat sprout shoots reached lengths between 3.30 mm and 3.86 mm. In C and APE 1, these were significantly longer, namely 3.80 mm and 3.86 mm, respectively. The shortest shoots were recorded in TPE 2 (3.30 mm).
After 72 h of culture, the shoots had relatively uniform lengths ranging from 15.05 mm to 16.87 mm.
After 96 h of culture, the wheat shoots reached lengths of up to 35.11 mm in C. At the opposite pole was APE 2 with 28.55 mm.

3.3. Correlations Between Cytogenetic Parameters and Biometric Parameters

The cytogenetic investigations presented above are reflected in the biometric investigations (germination rate of caryopses, embryonic root length, and shoot length). To support this statement, we determined the correlation coefficient (R2) between cytogenetic and biometric parameters of wheat sprouts treated with APE and TPE (Table 5, Table S1A–C).
We conclude that the mitotic index correlates positively for all tested periods: with the germination rate of wheat caryopses, when R2 ranged from 0.8163 to 0.9532; with embryonic root length, when R2 ranged from 0.8938 to 0.9608; and with shoot length, when R2 ranged from 0.3516 to 0.9060.
On the contrary, the genotoxic index is negatively correlated for all tested periods: with the germination rate of wheat caryopses, when R2 ranged from−0.8162 to−0.9779; with embryonic root length, when R2 ranged from−0.8050 to−0.9938; and with shoot length, when R2 ranged from−0.3652 to−0.8976.
We also note that after 96 h of growth, the strongest correlations were between MI/GI with caryopsis germination rate and embryonic root length growth. The weakest correlations were realized between MI/GI and the growth in length of the shoot.

4. Discussion

In this study, we tested the effects of four variants of APE and TPE treatments on Triticum aestivum (wheat)— an allohexaploid plant. The interaction of APE and TPE with wheat was monitored by investigating two cytogenetic indices—MI and GI—as well as three physiological parameters, namely the germination rate of caryopses, the length growth of embryonic roots, and the length growth of shoots.
The mitotic index is an important cytogenetic parameter that represents the proportion of dividing cells compared to the proportion of interphase cells observed in the mitotic cycle. MI is a valuable tool for estimating the mitotic activity of a cell population of interest, and mitotic activity is correlated with cell growth activity [58]. Various factors can increase or decrease the MI value. Excessive proliferation of some cells leads to tumor formation. The effect of decreased mitotic activity slows down the growth of the organism. Both situations are manifestations of the cytotoxic effect, accompanied by impaired cellular functions [59,60]. Excessive reduction or increase in MI means cytotoxicity.
In the present experiment, MI decreased in high correlation with APE and TPE concentrations. At both concentrations of pomace extracts, i.e., 0.05% (APE 1, TPE 1) and 0.5% (APE 2, TPE 2), MI decreased compared to the control irrigated with distilled water. The decrease in MI was significant when the concentration was 0.5% for both APE and TPE. In all these cases, the cytotoxic effect of APE and TPE was evident. We note that the cytotoxic effect induced by APE is slightly more pronounced compared to TPE. In a previous study, it was observed that treatments with grape pomace extracts also induced a cytotoxic effect in wheat sprouts [50].
More than the cytotoxic effect, the APE and TPE treatments also induced genotoxicity, which was proved by genetic abnormalities, also known as chromosomal mutations or chromosomal aberrations, identified in metaphases, ana-telophases, and interphases. The frequency of genetic abnormalities depended on the type and concentration of the pomace extract.
In the present study, DNA damage was revealed by cytogenetic analysis, which allowed us to investigate the effects of APE and TPE at the chromosomal and nuclear levels. Analysis of chromosomal aberrations and micronuclei is important because it reveals genotoxicity on the one hand and the mechanism of action of the genotoxicant on the other hand. Thus, various chromosomal aberrations and micronuclei, also known as genetic abnormalities, were detected. In our research, the types of genetic abnormalities induced by treatments with APE and TPE were chromosomal fragments, laggard chromosomes, chromosomal bridges, associations between bridges and fragments, multipolar ana-telophases, and micronuclei.
The chromosome fragments revealed in our experiment are evidence of the clastogenic potential of APE and TPE by breaking DNA phosphodiester bonds. Chromosomal fragments may or may not have centromeres and represent a loss of chromosome integrity [61]. Acentric fragments behave like laggard chromosomes [62]. The chromosome fragments identified in the present study have no centromere, therefore no primary constriction, and are much shorter compared to the laggard chromosomes. They cannot interact with the mitotic spindle; therefore, they cannot contribute to the construction of the mitotic plate nor to the formation of the two daughter nuclei. In this experiment, chromosome fragments were detected in some metaphases and anaphases of the four treatment variants, but not in the control group. The chromosomal fragments detected in the four experimental variants had very low, subunitary frequencies, and of these, APE 2 recorded significantly higher values, which denotes that 0.5% apple pomace has a higher clastogenic potential than tomato pomace.
Laggard chromosomes have inactive centromeres, which is why they behave atypically compared to normal chromosomes. They cannot attach to the mitotic spindle [62] and cannot participate in the formation of the metaphase crown. Laggard chromosomes are the cause of the formation of aneuploid cells. Laggard chromosomes represent a source of loss of genetic material. Laggard chromosomes are complete, have two identical chromatids, have a centromere, have a visible primary constriction and some also have a secondary nucleolar constriction, and have well-formed ends (have telomeres). Based on morphological details, laggard chromosomes cannot be confused with chromosome fragments. In the present study, laggard chromosomes were identified in some metaphases and ana-telophases of the apple and tomato pomace treated variants. The laggard chromosomes detected in metaphases are placed in a completely different plane from the metaphase plate. The laggard chromosomes detected in anaphases and telophases are located at significant distances from the two groups of monochromatid chromosomes (in anaphases) and daughter nuclei (in telophases), respectively. The frequency of laggard chromosomes identified in the present experiment was reduced, subunitary. The existence of laggard chromosomes proves the aneugenic potential of APE and TPE. Therefore, APE and TPE may be involved in the inactivation of chromosome centromeres.
Chromosomal bridges had the highest frequencies of all chromosomal mutations detected in the present experiment. They can result in at least two ways: by the fusion of chromosomes broken at the ends, thus without telomeres, or from a dicentric chromosome. At the molecular level, single-stranded and double-stranded DNA breaks are the cause of the formation of chromosomal bridges [63]. According to Türkoğlu [62], chromosomal bridges can result from unequal chromatid translocation. The chromosomal bridges may also form through chromosomal stickiness followed by non-separation in anaphase, or through the inversion of chromosomal segments [64]. Pickett-Heaps [65] considers that there is a complex balance between the pulling forces of the mitotic spindle and the elasticity of chromatin. Anglada et al. [66], using CRISPR/Cas9 technology, demonstrated that the longer the chromosome bridges, the higher their frequency during mitosis. Chromosomal bridges with less DNA between the two centromeres have a reduced tolerance to the pulling forces of the mitotic spindle, which leads to the separation of the kinetochores of their bridge. These conclusions are confirmed in the present study, where we noted that long and complete chromosome bridges, i.e., originating from long wheat chromosomes, predominate. In a few cases, we identified short chromosome bridges (Figure 6: f, g, h) originating from short wheat chromosomes. These findings are also supported by the standardized Triticum aestivum karyotype [67,68]. The chromosomal bridges were observed in the ana-telophases of the four APE and TPE treatment variants. Their highest frequencies were recorded in the variants treated with APE and TPE at a concentration of 0.5%. APE and TPE induced single, double, multiple, thin, thick, whole, or broken chromosomal bridges. Whole chromosomal bridges can block cell division and cause significant losses of genetic material.
The associations between bridges and chromosomal fragments (B+F) are the result of single-stranded and double-stranded DNA cleavage under the impact of APE and TPE. According to Yi and Meng [69], the fragments could also come from breaks in chromosome bridges. However, this finding is not valid in all cases where chromosome fragments are present, for example, in the case of fragments in metaphases. The existence of associations between bridges and fragments demonstrates once again the clastogenic potential of apple and tomato pomace. In the ana-telophases of the four variants of APE and TPE treatments, but not in the control group, associations between bridges and fragments with subunitary frequencies were identified. Of these, APE 2 induced B+F with a significantly higher frequency compared to the other variants.
APE and TPE acted in an aneugenic manner by inducing multipolar ana-telophases, characterized by disruption of the division spindle, by distortion of cell poles, altering the orientation of chromosomes in anaphase, and thus their segregation [70]. Multipolar movement of chromosomes is an indicator of inactivation of chromosome spindles [71]. The occurrence of this anomaly indicates the ability of APE and TPE to interfere with the spindle apparatus. The multipolar ana-telophases occurred in all experimental variants, not in the control group, with subunitary frequencies, significantly more abundant in the variants treated with APE.
The micronuclei represent another effect of APE and TPE. They had the highest frequencies in all four experimental variants, especially in the 0.5% concentration variants. In the control, they occurred spontaneously, with insignificant frequency. The acentric fragments, as well as the laggard chromosomes, transform into micronuclei, which usually occur in telophases and interphases. Therefore, the micronuclei are the result of the clastogenic and aneugenic effects of APE and TPE. The micronuclei are genetically inactive, so they represent an important loss of DNA. In this experiment, the micronuclei were very small, medium, and large in size, located at different distances from the nucleus, and numbered 1/cell or more than 1 (at APE 0.5%), as shown in the micrographs in Figure 5 and Figure 6. According to Ma [72] and Khanna [73], the micronucleus is the most effective parameter to study genotoxic damage resulting from environmental contamination. This situation may occur if DNA damage is too extensive and the DNA repair mechanism is not efficient enough to repair all the damage [74].
All genetic abnormalities detected in this experiment demonstrate that APE and TPE induce clastogenic and aneugenic effects, which were reflected in the phenotype of wheat sprouts.
Genetic abnormalities were manifested with different frequencies depending on the concentrations of APE and TPE. The 0.5% concentration of the pomace extracts increased the frequency of the chromosomal aberrations. We noted that APE treatments are more aggressive in producing wheat DNA damage compared to TPE treatments. This finding can be explained by the different polyphenol content of the two used pomaces, namely: 1950.19 mg GAE/100 g apple pomace and 781.17 mg GAE/100 g tomato pomace, which were analyzed in one of our previous studies [75].
Damage to DNA by treatment with apple and tomato extracts can be caused by polyphenols found in plants in high concentrations, acting as prooxidants, alone or in the presence of copper ions, catalyzing DNA breakage. The cellular DNA breakage involves the generation of copper and the formation of reactive oxygen species, which generates oxidative stress. The anticancer mechanism induced by plant polyphenols involves the mobilization of endogenous copper, even chromatin-related copper, and the subsequent prooxidant action [76,77]. The prooxidant and mutagenic potential of flavonoids, coumarins, and tannins was also highlighted by Rody [78]. Mitotic abnormalities, such as impaired chromatin organization and mitotic spindle, were induced by a glucoside—oleuropein from raw extract obtained from dried leaves of Jasminum officinale [79].
A number of studies show that polyphenols induce genotoxicity depending on their concentration. Thus, quercetin—a ubiquitous polyphenol in tomatoes and vegetables in general—is not genotoxic up to the concentration of 5 mg/plate in the Ames test, nor up to 2 g/kg in the micronucleus test in mice and rats [53]. Alcaraz [80] demonstrated the genotoxic safety of monomeric, dimeric, trimeric, and polymeric procyanidins using the murine bone marrow micronucleus assay up to the concentration of 300 mg/mL. In our present study, the general effects of the extracts obtained from two pomaces collected directly from the industrial technological processes for juice fabrication were assessed. A further in-depth study on specific apple/tomato varieties, processed in laboratory conditions, is recommended in order to control all parameters and to correlate the content in each specific polyphenol or other compound with the induced genotoxicity.
The concentration of the tested extracts is an important parameter. Thus, the antioxidant activity of tomato waste extracts has been tested on several human cancer cell lines, with antiproliferative effects observed in all cases at concentrations higher than 6.3 mg/mL [81]. Merlot and Sauvignon Blanc grape pomace extracts at concentrations between 0.025 and 0.2% have genotoxic and phytotoxic potential on wheat [50].
The investigated cytogenetic indices (MI and GI) were reflected in the coefficients of correlation with the germination rate of caryopses and the length of embryonic roots and shoots of wheat sprouts treated with extracts of apple and tomato pomace. MI correlated positively in all cases, while GI correlated negatively.

5. Conclusions

Unprocessed apple and tomato pomaces have cytotoxic, genotoxic, and phytotoxic potential on Triticum aestivum at both tested concentrations of aqueous extracts (0.05% and 0.5%), but higher at 0.5%.
Apple pomace was slightly more aggressive compared to tomato pomace, as it presents a higher cytogenotoxic risk.
As the concentration of apple and tomato pomace extracts increases, the mitotic index of treated wheat decreases, the genotoxic index increases, and the rate of germination and the growth of wheat sprouts decrease.
The amplitude of wheat responses to the action of apple and tomato pomaces justifies the recommendation that these unprocessed pomaces should not be used as biofertilizers. We recommend further studies to analyze the possibilities of valorizing apple and tomato pomaces as bioherbicides.

Supplementary Materials

The following supporting information can be downloaded at https://www.mdpi.com/article/10.3390/agronomy15102364/s1, Supplementary Table S1: (A–C) Correlation coefficients.

Author Contributions

Conceptualization, S.P. and A.P.; methodology, S.P. and A.P.; software, S.P. and A.P.; validation, S.P.; formal analysis, S.P.; investigation, S.P.; resources, A.P.; data curation, S.P. and A.P.; writing—original draft preparation, S.P.; writing—review and editing, A.P.; visualization, S.P.; supervision, A.P.; project administration, A.P.; funding acquisition, A.P. and S.P. All authors have read and agreed to the published version of the manuscript.

Funding

This research was funded by the Francophone University Agency (AUF), project AUF—DRECO-7863_SER-ECO_USVIIBI_DECHETJUS.

Data Availability Statement

The original contributions presented in this study are included in the article; further inquiries can be directed to the authors.

Acknowledgments

The authors are grateful for receiving support from “Ion Ionescu de la Brad” Iasi University of Life Sciences, Romania (IULS) and its research centers and laboratories: Horticultural Research Center, Laboratory for Bioactive Compounds Analysis, and Laboratory for Cell Biology.

Conflicts of Interest

The authors declare no conflicts of interest.

Abbreviations

The following abbreviations are used in this manuscript:
Ccontrol;
APEapple pomace extract;
APE 1apple pomace extract 0.05%;
APE 2apple pomace extract 0.5%;
TPEtomato pomace extract
TPE 1tomato pomace extract 0.05%
TPE 2tomato pomace extract 0.5%
MImitotic index;
GIgenotoxic index.

References

  1. Coman, I.V.; Teleky, B.-E.; Mitrea, L.; Martău, G.A.; Szabo, K.; Călinoiu, L.-F.; Vodnar, D.C. Bioactive Potential of Fruit and Vegetable Wastes. In Advances in Food and Nutrition Research; Toldrá, F., Ed.; Academic Press: Cambridge, MA, USA, 2020; Chapter 5; Volume 91, pp. 157–225. ISBN 9780128204702. [Google Scholar] [CrossRef]
  2. Russ, W.; Meyer-Pittroff, R. Utilizing waste products from the food production and processing industries. Crit. Rev. Food Sci. Nutr. 2004, 44, 57–62. [Google Scholar] [CrossRef]
  3. Oleszek, M.; Kowalska, I.; Bertuzzi, T.; Oleszek, W. Phytochemicals Derived from Agricultural Residues and Their Valuable Properties and Applications. Molecules 2023, 28, 342. [Google Scholar] [CrossRef] [PubMed]
  4. Szabo, K.; Mitrea, L.; Călinoiu, L.F.; Teleky, B.-E.; Martău, G.A.; Plamada, D.; Pascuta, M.S.; Nemeş, S.A.; Varvara, R.A.; Vodnar, D.C. Natural Polyphenol Recovery from Apple-, Cereal-, and Tomato-Processing By-Products and Related Health-Promoting Properties. Molecules 2022, 27, 7977. [Google Scholar] [CrossRef]
  5. Chew, B.; Mathison, B.; Kimble, L.; McKay, D.; Kaspar, K.; Khoo, C.; Chen, C.O.; Blumberg, J. Chronic consumption of a low calorie, high polyphenol cranberry beverage attenuates inflammation and improves glucoregulation and HDL cholesterol in healthy overweight humans: A randomized controlled trial. Eur. J. Nutr. 2019, 58, 1223–1235. [Google Scholar] [CrossRef]
  6. Jokioja, J.; Linderborg, K.M.; Kortesniemi, M.; Nuora, A.; Heinonen, J.; Sainio, T.; Viitanen, M.; Kallio, H.; Yang, B. Anthocyanin-rich extract from purple potatoes decreases postprandial glycemic response and affects inflammation markers in healthy men. Food Chem. 2020, 310, 125797. [Google Scholar] [CrossRef]
  7. Chojnacka, K.; Moustakas, K.; Mikulewicz, M. Valorisation of agri-food waste to fertilisers is a challenge in implementing the circular economy concept in practice. Environ. Pollut. 2022, 312, 119906. [Google Scholar] [CrossRef] [PubMed]
  8. Awasthi, M.K.; Ferreira, J.A.; Sirohi, R.; Sarsaiya, S.; Khoshnevisan, B.; Baladi, S.; Sindhu, R.; Binod, P.; Pandey, A.; Juneja, A.; et al. A critical review on the development stage of biorefinery systems towards the management of apple processing-derived waste. Renew. Sustain. Energy Rev. 2021, 143, 110972. [Google Scholar] [CrossRef]
  9. Ungureanu, G.; Enache, I.-M.; Cara, I.G.; Motrescu, I.; Patras, A. Insights into the environmental benefits of using apple pomace for biosorption of lead from contaminated water. Heliyon 2024, 10, e36811. [Google Scholar] [CrossRef] [PubMed Central]
  10. Schieber, A.; Stintzing, F.C.; Carle, R. By-products of plant food processing as a source of functional compounds—Recent developments. Trends Food Sci. Technol. 2001, 12, 401–413. [Google Scholar] [CrossRef]
  11. Tsoupras, A.; Gkika, D.A.; Markopoulos, T.; Curran, R.; Scallon, C.; Karali, M.; Kyzas, G.Z. Apple Products (Apple Juice and Cider) and by-Products (Apple Pomace): Bioactive Compounds and Biological Properties. In Natural Products in Beverages: Botany, Phytochemistry, Pharmacology and Processing; Springer: Berlin/Heidelberg, Germany, 2024; pp. 1–42. [Google Scholar] [CrossRef]
  12. Vandorou, M.; Plakidis, C.; Tsompanidou, I.M.; Adamantidi, T.; Panagopoulou, E.A.; Tsoupras, E.A. Review on Apple Pomace Bioactives for Natural Functional Food and Cosmetic Products with Therapeutic Health-Promoting Properties. Int. J. Mol. Sci. 2024, 25, 10856. [Google Scholar] [CrossRef]
  13. Raudone, L.; Raudonis, R.; Liaudanskas, M.; Janulis, V.; Viskelis, P. Phenolic Antioxidant Profiles in the Whole Fruit, Flesh and Peel of Apple Cultivars Grown in Lithuania. Sci. Hortic. 2017, 216, 186–192. [Google Scholar] [CrossRef]
  14. Skinner, R.C.; Gigliotti, J.C.; Ku, K.M.; Tou, J.C. A Comprehensive Analysis of the Composition, Health Benefits, and Safety of Apple Pomace. Nutr. Rev. 2018, 76, 893–909. [Google Scholar] [CrossRef]
  15. Asma, U.; Morozova, K.; Ferrentino, G.; Scampicchio, M. Apples and Apple By-Products: Antioxidant Properties and Food Aplications. Antioxidants 2023, 12, 1456. [Google Scholar] [CrossRef] [PubMed]
  16. Huc-Mathis, D.; Journet, C.; Fayolle, N.; Bosc, V. Emulsifying properties of food by-products: Valorizing apple pomace and oat bran. Colloids Surf. A Physicochem. Eng. Asp. 2019, 568, 84–91. [Google Scholar] [CrossRef]
  17. Torbica, A.; Škrobot, D.; Janić Hajnal, E.; Belović, M.; Zhang, N. Sensory and physico-chemical properties of wholegrain wheat bread prepared with selected food by-products. LWT—Food Sci. Technol. 2019, 114, 108414. [Google Scholar] [CrossRef]
  18. Lu, Q.; Liu, H.; Wang, Q.; Liu, J. Sensory and physical quality characteristics of bread fortified with apple pomace using fuzzy mathematical model. Int. J. Food Sci. Technol. 2017, 52, 1092–1100. [Google Scholar] [CrossRef]
  19. Wang, X.; Kristo, E.; La Pointe, G. The effect of apple pomace on the texture, rheology and microstructure of set type yogurt. Food Hydrocoll. 2019, 91, 83–91. [Google Scholar] [CrossRef]
  20. Ricci, A.; Cirlini, M.; Guido, A.; Liberatore, C.M.; Ganino, C.M.T.; Lazzi, C.; Chiancone, B. From byproduct to resource: Fermented apple pomace as beer flavoring. Foods 2019, 8, 309. [Google Scholar] [CrossRef] [PubMed]
  21. Benvenutti, L.; Bortolini, D.G.; Nogueira, A.; Zielinski, A.A.F.; Alberti, A. Effect of addition of phenolic compounds recovered from apple pomace on cider quality. LWT—Food Sci. Technol. 2019, 100, 348–354. [Google Scholar] [CrossRef]
  22. Choi, I.S.; Lee, Y.G.; Khanal, S.K.; Park, B.J.; Bae, H.-J. A low-energy, cost-effective approach to fruit and citrus peel waste processing for bioethanol production. Appl. Energy 2015, 140, 65–74. [Google Scholar] [CrossRef]
  23. Saini, R.K.; Moon, S.H.; Keum, Y.S. An updated review on use of tomato pomace and crustacean processing waste to recover commercially vital carotenoids. Food Res. Int. 2018, 108, 516–529. [Google Scholar] [CrossRef]
  24. Strati, I.F.; Oreopoulou, V. Recovery of carotenoids from tomato processing by-products e a review. Food Res. Int. 2014, 65, 311–321. [Google Scholar] [CrossRef]
  25. Trombino, S.; Cassano, R.; Procopio, D.; Di Gioia, M.L.; Barone, E. Valorization of Tomato Waste as a Source of Carotenoids. Molecules 2021, 26, 5062. [Google Scholar] [CrossRef]
  26. Binoy, G.; Kaur, C.; Khurdiya, D.S.; Kapoor, H.C. Antioxidants in tomato (Lycopersicon esculentum) as a function of genotype. Food Chem. 2004, 84, 45–51. [Google Scholar] [CrossRef]
  27. Szabo, K.; Cătoi, A.F.; Vodnar, D.C. Bioactive Compounds Extracted from Tomato Processing by-Products as a Source of Valuable Nutrients. Plant Foods Hum. Nutr. 2018, 73, 268–277. [Google Scholar] [CrossRef]
  28. Chabi, I.B.; Omiyalé, O.J.; Dèdéhou, S.E.C.A.; Ayégnon, B.P.; Idrissou, I.; Boya, B.; Kpoclou, Y.E.; Kayodé, A.P.P. Tomato Seed (Solanum lycopersicum) Meal Derived From Agrifood Waste as Functional Ingredient: Nutritional Value, Antioxidant and Antimicrobial Activities, and Functional Properties. J. Food Process. Preserv. 2024, 2024, 8824581. [Google Scholar] [CrossRef]
  29. Beecher, G.R. Nutrient Content of Tomatoes and Tomato Products. Proc. Soc. Exp. Biol. Med. 1998, 218, 98–100. [Google Scholar] [CrossRef]
  30. Giovanelli, G.; Pagliarini, E. Antioxidant Composition of Tomato Products Typically Consumed in Italy. Ital. J. Food Sci. 2009, 21, 305–316. [Google Scholar]
  31. Dumas, Y.; Dadomo, M.; Di Lucca, G.; Grolier, P. Effects of environmental factors and agricultural techniques on antioxidant content of tomatoes. J. Sci. Food Agric. 2003, 83, 369–382. [Google Scholar] [CrossRef]
  32. Simonne, H.A.; Behe, B.K.; Marshall, M.M. Consumers Prefer Low-Priced and High-Lycopene-Content Fresh-Market Tomatoes. Hort Technol. 2006, 16, 674–681. [Google Scholar] [CrossRef]
  33. Fadupin, T.G.; Osadola, O.T.; Atinmo, T. Lycopene Content of Selected Tomato Based Products, Fruits and Vegetables Consumed in South Western Nigeria. Afr. J. Biomed. Res. 2012, 15, 187–191. [Google Scholar]
  34. Cadoni, E.; De Giorgi, M.R.; Medda, E.; Poma, G. Supercritical CO2 extraction of lycopene and β-carotene from ripe tomatoes. Dyes Pigments 1999, 44, 27–32. [Google Scholar] [CrossRef]
  35. Zuorro, A.; Fidaleo, M.; Lavecchia, R. Enzyme-assisted extraction of lycopene from tomato processing waste. Enzym. Microb. Technol. 2011, 49, 567–573. [Google Scholar] [CrossRef]
  36. Strati, I.F.; Oreopoulou, V. Effect of extraction parameters on the carotenoid recovery from tomato waste. Int. J. Food Sci. Technol. 2011, 46, 23–29. [Google Scholar] [CrossRef]
  37. Løvdal, T.; Droogenbroeck, B.; Eroglu, E.C.; Kaniszewski, S.; Agati, G.; Verheul, M.; Skipnes, D. Valorization of Tomato Surplus and Waste Fractions: A Case Study Using Norway, Belgium, Poland, and Turkey as Examples. Foods 2019, 8, 229. [Google Scholar] [CrossRef]
  38. European Food Safety Authority (EFSA). Opinion of the Scientific Committee on a request from EFSA related to a harmonised approach for risk assessment of substances which are both genotoxic and carcinogenic. EFSA J. 2005, 3, 282. [Google Scholar] [CrossRef]
  39. Badolati, N.; Masselli, R.; Maisto, M.; Di Minno, A.; Tenore, G.C.; Stornaiuolo, M.; Novellino, E. Genotoxicity Assessment of Three Nutraceuticals Containing Natural Antioxidants Extracted from Agri-Food Waste Biomasses. Foods 2020, 9, 146. [Google Scholar] [CrossRef] [PubMed]
  40. Vilas-Boas, A.A.; Pintado, M.; Oliveira, A.L.S. Natural Bioactive Compounds from Food Waste: Toxicity and Safety Concerns. Foods 2021, 10, 1564. [Google Scholar] [CrossRef]
  41. Kirkland, D.; Kasper, P.; Martus, H.J.; Müller, L.; van Benthem, J.; Madia, F.; Corvi, R. Updated Recommended Lists of Genotoxic and Non-Genotoxic Chemicals for Assessment of the Performance of New or Improved Genotoxicity Tests. Mutat. Res. Genet. Toxicol. Environ. Mutagen. 2016, 795, 7–30. [Google Scholar] [CrossRef]
  42. Bolarinwa, I.F.; Orfila, C.; Morgan, M.R.A. Determination of amygdalin in apple seeds, fresh apples and processed apple juices. Food Chem. 2015, 170, 437–442. [Google Scholar] [CrossRef]
  43. Gumul, D.; Ziobro, R.; Korus, J.; Kruczek, M. Apple pomace as a source of bioactive polyphenol compounds in gluten-free breads. Antioxidants 2021, 10, 807. [Google Scholar] [CrossRef]
  44. Phachonpai, W.; Muchimapura, S.; Tong-Un, T.; Sripanidkulchai, B.; Wannanon, P. Acute toxicity study of tomato pomace extract in Rodent. Online J. Biol. Sci. 2013, 1, 28–34. [Google Scholar] [CrossRef]
  45. Radić, K.; Galić, E.; Vinković, T.; Golub, N.; Čepo, D.V. Tomato Waste as a Sustainable Source of Antioxidants and Pectins: Processing, Pretreatment and Extraction Challenges. Sustainability 2024, 16, 9158. [Google Scholar] [CrossRef]
  46. Musto, G.; Schiano, E.; Iannuzzo, F.; Tenore, G.G.; Novellino, E.; Stornaiuolo, M. Genotoxicity Assessment of Nutraceuticals Extracted from Thinned Nectarine (Prunus persica L.) and Grape Seed (Vitis vinifera L.) Waste Biomass. Foods 2023, 12, 1171. [Google Scholar] [CrossRef] [PubMed]
  47. Berbel, J.; Posadillo, A. Review and analysis of alternatives for the valorisation of agro-industrial olive oil by-products. Sustainability 2018, 10, 237. [Google Scholar] [CrossRef]
  48. Schmidt, L.; Prestes, O.D.; Rossini Augusti, P.; Fonseca Moreira, J.C. Phenolic compounds and contaminants in olive oil and pomace—A narrative review of their biological and toxic effects. Food Biosci. 2023, 53, 102626. [Google Scholar] [CrossRef]
  49. Mekersi, N.; Kadi, K.; Casini, S.; Addad, D.; Bazri, K.E.; Marref, S.E.; Lekmine, S.; Amari, A. Effects of single and combined olive mill wastewater and olive mill pomace on the growth, reproduction, and survival of two earthworm species (Aporrectodea trapezoides, Eisenia fetida). Appl. Soil Ecol. 2021, 168, 104123. [Google Scholar] [CrossRef]
  50. Padureanu, S.; Patras, A. Biological Response of Triticum aestivum L. to the Abiotic Stress Induced by Winemaking Waste. Agronomy 2022, 12, 1371. [Google Scholar] [CrossRef]
  51. Corvi, R.; Madia, F. In vitro genotoxicity testing—Can the performance be enhanced? Food Chem. Toxicol. 2017, 106 B, 600–608. [Google Scholar] [CrossRef]
  52. Saks, M.; Upreti, S.; Rajendra, S.V.; Dang, R. Genotoxicity: Mechanisms, Testing Guidelines and Methods. Glob. J. Pharm. Pharm. Sci. 2017, 1, 133–138. [Google Scholar] [CrossRef]
  53. Musto, G.V.; Laurenzi, V.; Annunziata, G.; Novellino, E.; Stornaiuolo, M. Genotoxic Assessment of Nutraceuticals Obtained from Agricultural Biowaste: Where Do We “AMES”? Antioxidants 2022, 11, 1197. [Google Scholar] [CrossRef]
  54. Jitareanu, A.; Caba, I.C.; Trifan, A.; Padureanu, S.; Agoroaei, L. Triticum aestivum assay—A useful tool for environmental monitoring and toxicity assessment. Not. Bot. Horti Agrobot. Cluj-Napoca 2019, 47, 1005–1018. [Google Scholar] [CrossRef]
  55. Maravilla, A.J.; Rosato, M.; Rosselló, J.A. Preparation of Mitotic Chromosomes with the Squash Technique. In Plant Cytogenetics and Cytogenomics; Heitkam, T., Garcia, S., Eds.; Methods in Molecular Biology; Humana: New York, NY, USA, 2023; Volume 2672, pp. 141–149. [Google Scholar] [CrossRef]
  56. Graña, E. Mitotic Index. In Advances in Plant Ecophysiology Techniques; Sánchez-Moreiras, A., Reigosa, M., Eds.; Springer: Cham, Switzerland, 2018; pp. 231–240. [Google Scholar] [CrossRef]
  57. Soltani, E.; Ghaderi-Far, F.; Baskin, C.C.; Baskin, J.M. Problems with using mean germination time to calculate rate of seed germination. Aust. J. Bot. 2015, 63, 631–635. [Google Scholar] [CrossRef]
  58. Kato, T.A.; Haskins, J.S. Mitotic Index Analysis. In Chromosome Analysis; Gotoh, E., Ed.; Methods in Molecular Biology; Humana: New York, NY, USA, 2023; Volume 2519. [Google Scholar] [CrossRef]
  59. Akinboro, A.; Bakare, A.A. Cytotoxic and genotoxic effects of aqueous extracts of five medicinal plants on Allium cepa Linn. J. Ethnopharmacol. 2007, 112, 470–475. [Google Scholar] [CrossRef] [PubMed]
  60. Da Silva Souza, T.; da Silva Figueira Barone, L.; Lacerda, D.; dos Santos Vergilio, C.; de Oliveira, B.C.V.; de Almeida, M.G.; Thompson, F.; de Rezende, C.E. Cytogenotoxicity of the water and sediment of the Paraopeba River immediately after the iron ore mining dam disaster (Brumadinho, Minas Gerais, Brazil). Sci. Total Environ. 2021, 775, 145193. [Google Scholar] [CrossRef]
  61. Janssen, A.; van der Burg, M.; Szuhai, K.; Kops, G.J.P.L.; Medema, R.H. Chromosome Segregation Errors as a Cause of DNA Damage and Structural Chromosome Aberrations. Science 2011, 333, 1895–1898. [Google Scholar] [CrossRef]
  62. Türkoğlu, Ş. Genotoxicity of five food preservatives tested on root tips of Allium cepa L. Mutat. Res.—Genet. Toxicol. Environ. Mutagen. 2007, 626, 4–14. [Google Scholar] [CrossRef]
  63. Pfeiffer, P.; Goedecke, W.; Obe, G. Mechanisms of DNA double-strand break repair and their potential to induce chromosomal aberrations. Mutagenesis 2000, 15, 289–302. [Google Scholar] [CrossRef]
  64. Gömürgen, A.N. Cytological effect of the potassium metabisulphite and potassium nitrate food preservative on root tips of Allium cepa L. Cytologia 2005, 70, 119–128. [Google Scholar] [CrossRef]
  65. Pickett-Heaps, J.D.; Tippit, D.H.; Cohn, S.A.; Spurk, T.P. Microtubule Dynamics in the Spindle. Theoretical Aspects of Assembly/Disassembly Reactions In Vivo. J. Theor. Biol. 1986, 118, 153–169. [Google Scholar] [CrossRef]
  66. Anglada, T.; Rodriguez-Munoz, M.; Pulido-Artola, N.; Genesca, A. Engineering Chromosome Bridges Through CRISPR/Cas9 to Decipher the Impact of Intercentromeric Distance on Resolution Dynamics. FASEB J. 2025, 39, e70599. [Google Scholar] [CrossRef]
  67. Ryu Endo, T.; Gill, B.S. Somatic karyotype, heterochromatin distribution, and nature of chromosome differentiation in common wheat, Triticum aestivum L. em Thell. Chromosoma 1984, 89, 361–369. [Google Scholar] [CrossRef]
  68. Najafi, S.; Ulker, M.; Altuner, F.; Oral, E.; Ozdemir, B.; Jamal Salih, S.; Selem, E. Karyological analysis on wheat Tir (Triticum aestivum var. Aestivum L. spp. Leucospermum Körn.) ecotypes in Lake Van Basin. Int. J. Agric. Technol. 2022, 18, 1093–1102. [Google Scholar]
  69. Yi, H.; Meng, Z. Genotoxicity of hydrated sulfur dioxide on root tips of Allium sativum and Vicia faba. Mutat. Res. 2003, 537, 109–114. [Google Scholar] [CrossRef] [PubMed]
  70. El-Ghamery, A.A.; Mousa, M.A. Investigation on the effect of benzyladenine on the germination, radicle growth and meristematic cells of Nigella sativa L. and Allium cepa L. Ann. Agric. Sci. 2017, 62, 11–21. [Google Scholar] [CrossRef]
  71. Barman, M.; Roy, S.; Ray, S. Mitotic abnormality inducing effects of leaf aqueous extract of Clerodendrum inerme Gaertn. on Allium cepa root apical meristem cells. Cytologia 2021, 86, 113–118. [Google Scholar] [CrossRef]
  72. Ma, T.H.; Xu, Z.; Xu, C.; McConnell, H.; Rabago, E.V.; Arreola, G.A.; Zhang, H. The improved Allium/Vicia root tip micronucleus assay for clastogenicity of environmental pollutants. Mutat. Res.—Genet. Toxicol. Environ. Mutagen. 1995, 334, 185–195. [Google Scholar] [CrossRef]
  73. Khanna, N.; Sharma, S. Allium Cepa Root Chromosomal Aberration Assay: A Review. Indian J. Pharm. Biol. 2013, 1, 105–119. [Google Scholar] [CrossRef]
  74. Huang, S.; Chueh, P.J.; Lin, Y.W.; Shih, T.S.; Chuang, S.M. Disturbed mitotic progression and genome segregation are involved in cell transformation mediated by nano-TiO2 long-term exposure. Toxicol. Appl. Pharmacol. 2009, 241, 182–194. [Google Scholar] [CrossRef] [PubMed]
  75. Nouska, C.; Ciurla, L.; Patras, A.; Biliaderis, C.G.; Lazaridou, A. Physicochemical and Sensory Evaluation of Spreads Derived from Fruit Processing By-Products. Foods 2025, 14, 2224. [Google Scholar] [CrossRef]
  76. Hadi, S.M.; Bhat, S.H.; Azmi, A.S.; Hanif, S.; Shamim, U.; Ullah, M.F. Oxidative breakage of cellular DNA by plant polyphenols: A putative mechanism for anticancer properties. Semin. Cancer Biol. 2007, 17, 370–376. [Google Scholar] [CrossRef] [PubMed]
  77. Hadi, S.M.; Ullah, M.F.; Shamim, U.; Bhatt, S.H.; Azmi, A.S. Catalytic therapy of cancer by ascorbic acid involves redox cycling of exogenous/endogenous copper ions and generation of reactive oxygen species. Chemotherapy 2010, 56, 280–284. [Google Scholar] [CrossRef] [PubMed]
  78. Rody, H.V.S.; da C. Gontijo, D.; de M. Coelho, V.P.; Ventrella, M.C.; de Pádua, R.M.; Fietto, L.G.; Leite, J.P.V. Mutagenic activity and chemical composition of phenolic-rich extracts of leaves from two species of Ficus medicinal plants. J. Toxicol. Environ. Health A 2018, 81, 861–872. [Google Scholar] [CrossRef] [PubMed]
  79. Teerarak, M.; Laosinwattana, C.; Charoenying, P. Evaluation of allelopathic, decomposition and cytogenetic activities of Jasminum officinale L. f. var. grandiflorum (L.) Kob. on bioassay plants. Bioresour. Technol. 2010, 101, 5677–5684. [Google Scholar] [CrossRef]
  80. Alcaraz, M.; Olivares, A.; Achel, D.G.; García-Gamuz, J.A.; Castillo, J.; Alcaraz-Saura, M. Genoprotective Effect of Some Flavonoids against Genotoxic Damage Induced by X-rays In Vivo: Relationship between Structure and Activity. Antioxidants 2021, 11, 94. [Google Scholar] [CrossRef]
  81. Ćetković, G.; Savatović, S.; Čanadanović-Brunet, J.; Djilas, S.; Vulić, J.; Mandić, A.; Četojević-Simin, D. Valorisation of phenolic composition, antioxidant and cell growth activities of tomato waste. Food Chem. 2012, 133, 938–945. [Google Scholar] [CrossRef]
Figure 1. Correlation between the mitotic index (%) and the genotoxic index (%) in meristematic cells of wheat roots treated with apple pomace extract and tomato pomace extract.
Agronomy 15 02364 g001
Figure 2. Frequency of genetic abnormalities in wheat root meristem metaphases induced by apple pomace extract and tomato pomace extract treatments. Bars are means of three replicates/experimental variant ± SD. The letters (a–c) show significant differences, p < 0.05.
Agronomy 15 02364 g002
Figure 3. Frequency of genetic abnormalities in wheat root meristem ana-telophases induced by apple pomace extract and tomato pomace extract treatments. Bars are means of three replicates/experimental variant ± SD. The letters (a–c) show significant differences, p < 0.05.
Agronomy 15 02364 g003
Figure 4. Frequency of genetic abnormalities in wheat root meristem interphases induced by apple pomace extract and tomato pomace extract treatments. Bars are means of three replicates/experimental variant ± SD. The letters (a–d) show significant differences, p < 0.05.
Agronomy 15 02364 g004
Figure 5. Types of genetic abnormalities induced by apple pomace extract identified in the meristematic cells of Triticum aestivum roots: (a) normal metaphase; (b) metaphase with laggard chromosome; (c) metaphase with fragment; interphase with micronucleus; telophase with two fragments; (d) anaphase with multiple bridges; (e,f) telophases with bridges; (g,h) telophases with two broken bridges; (i) telophase with a whole bridge and a broken bridge; (j) anaphase with bridges and a fragment; (k) telophase with two laggard chromosomes; (l,m) multipolar anaphases with bridges; (n) telophase with a big micronucleus; (o,p) interphases with small and medium micronuclei; the microphotographs were taken with a Leica microscope (magnification: 1000×).
Agronomy 15 02364 g005aAgronomy 15 02364 g005bAgronomy 15 02364 g005c
Figure 6. Types of genetic abnormalities induced by tomato pomace extract identified in the meristematic cells of Triticum aestivum roots: (ae) anaphases with thin bridges; (f,g) telophases with multiple bridges; (h) telophase with a whole bridge and a broken bridge; (i) multipolar anaphase with many laggard chromosomes; (j) multipolar anaphase with two bridges; (k,l) interphases with micronuclei; the microphotographs were taken with a Leica microscope (magnification: 1000×).
Agronomy 15 02364 g006aAgronomy 15 02364 g006bAgronomy 15 02364 g006c
Table 1. Mitotic index and mitotic phases distribution in root tips of Triticum aestivum treated with apple pomace extract and tomato pomace extract.
Treatment Variant with Pomace ExtractMean Number of Cells/VariantMitotic Index (%)Cells in Prophase
(%)
Cells in Metaphase
(%)
Cells in Anaphase
(%)
Cells in Telophase
(%)
C11,623.0015.49 ± 2.49 b5.93 ± 0.89 b 3.08 ± 0.20 b2.28 ± 0.76 a4.20 ± 1.36 a
APE 111,835.0014.96 ± 3.01 b5.89 ± 0.85 b3.05 ± 0.67 b2.23 ± 0.35 a3.78 ± 1.65 a
APE 211,728.668.66 ± 0.07 a2.53 ± 0.40 a1.88 ± 0.23 a1.52 ± 0.04 a2.73 ± 0.57 a
TPE 111,774.6615.16 ± 2.01 b5.39 ± 0.43 b3.44 ± 0.68 b1.98 ± 0.56 a4.35 ± 0.84 a
TPE 212,272.6610.33 ± 0.68 a2.45 ± 0.15 a2.21 ± 0.13 a1.92 ± 0.46 a3.75 ± 0.20 a
Data represent mean values ± standard deviation. The letters (a, b) show significant differences, p < 0.05.
Table 2. Frequency of genetic abnormalities in mitotic phases in root tips of Triticum aestivum treated with apple pomace extract and tomato pomace extract treatment.
Treatment Variant with Pomace ExtractCells in Metaphase (%)Cells in A-T (%)Cells in InterphaseGI (%)
Normal Metaphase (%)Aberrant Metaphase (%)Normal
A-T (%)
Aberrant
A-T (%)
Normal Interphase (%)Aberrant Interphase (%)
C3.08 ± 0.20 b0.00 ± 0.00 a6.35 ± 1.65 b0.14 ± 0.03 a 84.41 ± 2.50 a0.10 ± 0.02 a0.24 ± 0.03 a
APE 12.98 ± 0.67 b0.07 ± 0.03 b4.99 ± 1.93 b1.02 ± 0.08 b84.70 ± 3.00 a0.33 ± 0.31 b1.43 ± 0.13 b
APE 21.61 ± 0.26 a0.27 ± 0.04 c2.52 ± 0.49 a1.74 ± 0.16 d89.80 ± 0.08 b1.54 ± 0.08 c3.54 ± 0.26 d
TPE 13.40 ± 0.70 b0.03 ± 0.01 ab5.42 ± 0.14 b0.91 ± 0.17 b84.55 ± 1.99 a0.29 ± 0.03 ab1.23 ± 0.17 b
TPE 22.14 ± 0.13 a0.07 ± 0.02 b4.16 ± 0.50 ab 1.51 ± 0.03 c88.35 ± 0.75 b1.32 ± 0.07 c2.90 ± 0.11 c
Data are presented as mean ± standard deviation. The letters (a–d) show significant differences, p < 0.05.
Table 3. Dynamics of embryonic wheat root length growth under the influence of apple pomace and tomato pomace extract treatments.
Treatment Variant with Pomace ExtractRoot Length (mm)
After 48 hAfter 72 hAfter 96 h
C11.14 ± 0.36 b30.97 ± 0.68 b53.46 ± 0.54 c
APE 111.23 ± 0.17 b29.58 ± 2.85 ab48.28 ± 4.91 b
APE 210.10 ± 0.32 a27.24 ± 1.39 a39.79 ± 1.48 a
TPE 111.36 ± 0.30 b30.02 ± 0.38 ab50.28 ± 1.11 bc
TPE 210.24 ± 0.27 a28.50 ± 0.74 ab42.57 ± 0.40 a
Data are presented as mean ± standard deviation. The letters (a–c) show significant differences at p < 0.05.
Table 4. Dynamics of wheat shoot length growth under the influence of apple pomace and tomato pomace extracts treatments.
Treatment Variant with Pomace ExtractShoot Length (mm)
After 48 hAfter 72 hAfter 96 h
C3.80± 0.17 b16.87± 0.11 a35.11± 0.94 d
APE 13.86± 0.13 b15.97± 0.73 a33.74± 0.29 c
APE 23.57± 0.23 ab15.62± 0.75 a28.55± 0.53 a
TPE 13.50± 0.41 ab16.22± 0.73 a 34.25± 0.46 cd
TPE 23.30± 0.18 a15.05± 1.83 a31.85± 0.41 b
Data are presented as mean ± standard deviation. The letters (a–d) show significant differences at p < 0.05.
Table 5. Correlations between cytogenetic and biometric parameters in wheat treated with apple and tomato pomace extracts.
Correlated ParametersCorrelation Coefficient (R2)
After 48 hAfter 72 hAfter 96 h
MI (%) correlated to Germination Rate (%)0.85510.81630.9532
GI (%) correlated to Germination Rate (%)−0.8162−0.9429−0.9779
MI (%) correlated to Root Length (%)0.96080.89380.9255
GI (%) correlated to Root Length (%)−0.805−0.9757−0.9938
MI (%) correlated to Shoot Length (%)0.35160.60920.906
GI (%) correlated to Shoot Length (%)−0.3652−0.7636−0.8976
Disclaimer/Publisher’s Note: The statements, opinions and data contained in all publications are solely those of the individual author(s) and contributor(s) and not of MDPI and/or the editor(s). MDPI and/or the editor(s) disclaim responsibility for any injury to people or property resulting from any ideas, methods, instructions or products referred to in the content.