Article

Effects of Different Land-Use Types on Soil Properties and Microbial Communities in a Southeastern Tibetan Valley

Agricultural College/Walnut Industry Research Institute of Tibetan Plateau, Yangtze University, No. 266, Jingmi Road, Jingzhou District, Jingzhou 434025, China
*
Author to whom correspondence should be addressed.
Agronomy 2025, 15(10), 2317; https://doi.org/10.3390/agronomy15102317
Submission received: 25 August 2025 / Revised: 25 September 2025 / Accepted: 29 September 2025 / Published: 30 September 2025
(This article belongs to the Section Agricultural Biosystem and Biological Engineering)

Abstract

Land-use type is a key factor influencing soil properties, microbial community composition, and plant nutrient status. In this study, five land-use types (Tibetan barley, rapeseed, walnut, wheat, and weeds) were investigated in a river valley of southeastern Tibet to compare their effects on soil chemical characteristics, microbial communities, and plant nutrients. Soils under walnut trees had significantly higher available phosphorus and microbial biomass phosphorus but lower soil organic matter. Rapeseed fields had higher levels of available potassium and were dominated by the fungal genus Tausonia; rapeseed leaves also contained the highest nitrogen and potassium concentrations. Weed plots supported a distinct fungal community dominated by Helvella. Tibetan barley and wheat increased overall bacterial and fungal diversity, with wheat soils with the highest microbial biomass carbon and nitrogen. Redundancy analysis indicated that soil total nitrogen, available nitrogen, and organic matter were the main drivers of plant nutrient variation, together explaining 93.5% of the total variance. These findings demonstrate how land-use type regulates soil–microbe–plant interactions in alpine valleys and provide empirical references for agricultural management and soil improvement on the Qinghai–Tibet Plateau.

1. Introduction

Land use patterns strongly alter the abundance, diversity, and functional structure of soil microbial communities, which are critical to ecosystem functions such as nutrient cycling, carbon sequestration, and maintaining soil fertility [1]. Global agricultural intensification and land conversion alter microbial community composition and diversity, with important implications for ecological stability and climate adaptation [2]. On the Qinghai–Tibet Plateau, river valleys in southeastern Tibet represent unique high-altitude ecosystems characterized by humid climate, fragile soils, and a variety of land use types including traditional agriculture, pastures, and reforestation [3]. Because of the ecological sensitivity and status as a regional biodiversity hot spot, it is essential to study the effects of land use change on soil microbial dynamics in these ecosystems. While many studies [3] find that land use conversion alters microbial networks in lowland systems, few studies examine land-use effects in high-altitude valleys such as those in Southeast Tibet [4]. Land conversion can disrupt microbial communities in this region, but the effects of changes in land use type on specific responses of microbial community structure and diversity are not yet fully understood. Muñoz-Arenas et al. [4] found a significant correlation between vegetation diversity and soil microbial functional diversity, and Nottingham et al. [5] showed that arboreal, shrub, and herbaceous vegetation use soil microbial carbon differently and have different metabolic functions. Moreover, microbial diversity is closely linked to ecosystem multifunctionality: a meta-analysis found that a 10% increase in microbial diversity corresponds to a 5% to 15% improvement in ecosystem multifunctionality, including nutrient cycling, productivity, and decomposition [6]. In terms of greenhouse gas regulation, conversion of wetlands to croplands decreases methanogen abundance by ~30%, thereby reducing CH4 emissions, but often increases N2O emissions by 20% to 50% because of fertilizer application [7]. According to Delgado-Baquerizo et al. [7], bacterial alpha diversity decreases with increasing altitude, and beta diversity differs significantly between wetland and forest soils, although overall microbial composition remains similar. Wang et al. [8] report that land use change (e.g., forest conversion to cropland) in high-altitude areas significantly reduces soil microbial diversity, particularly within bacterial communities. In a meta-analysis, Choudhury et al. [9] found that converting forests to agricultural land and plantations has complex effects on soil microbial community diversity and composition, with a general trend of decreasing diversity. Díaz-Vallejo et al. [10] reported that altitude plays a dominant role in shaping soil microbial community structure and diversity in high-altitude regions. Therefore, by determining how land use patterns influence soil chemical properties, microbial community structure, and the complex feedback mechanisms with plant nutrients, this study in a southeastern Tibetan river valley can provide crucial theoretical basis and practical guidance for sustainable land management and ecological restoration in fragile alpine ecosystems, with results having direct application value for optimizing land use structures, improving soil health, and ensuring regional ecological security.

2. Materials and Methods

2.1. Study Site Overview

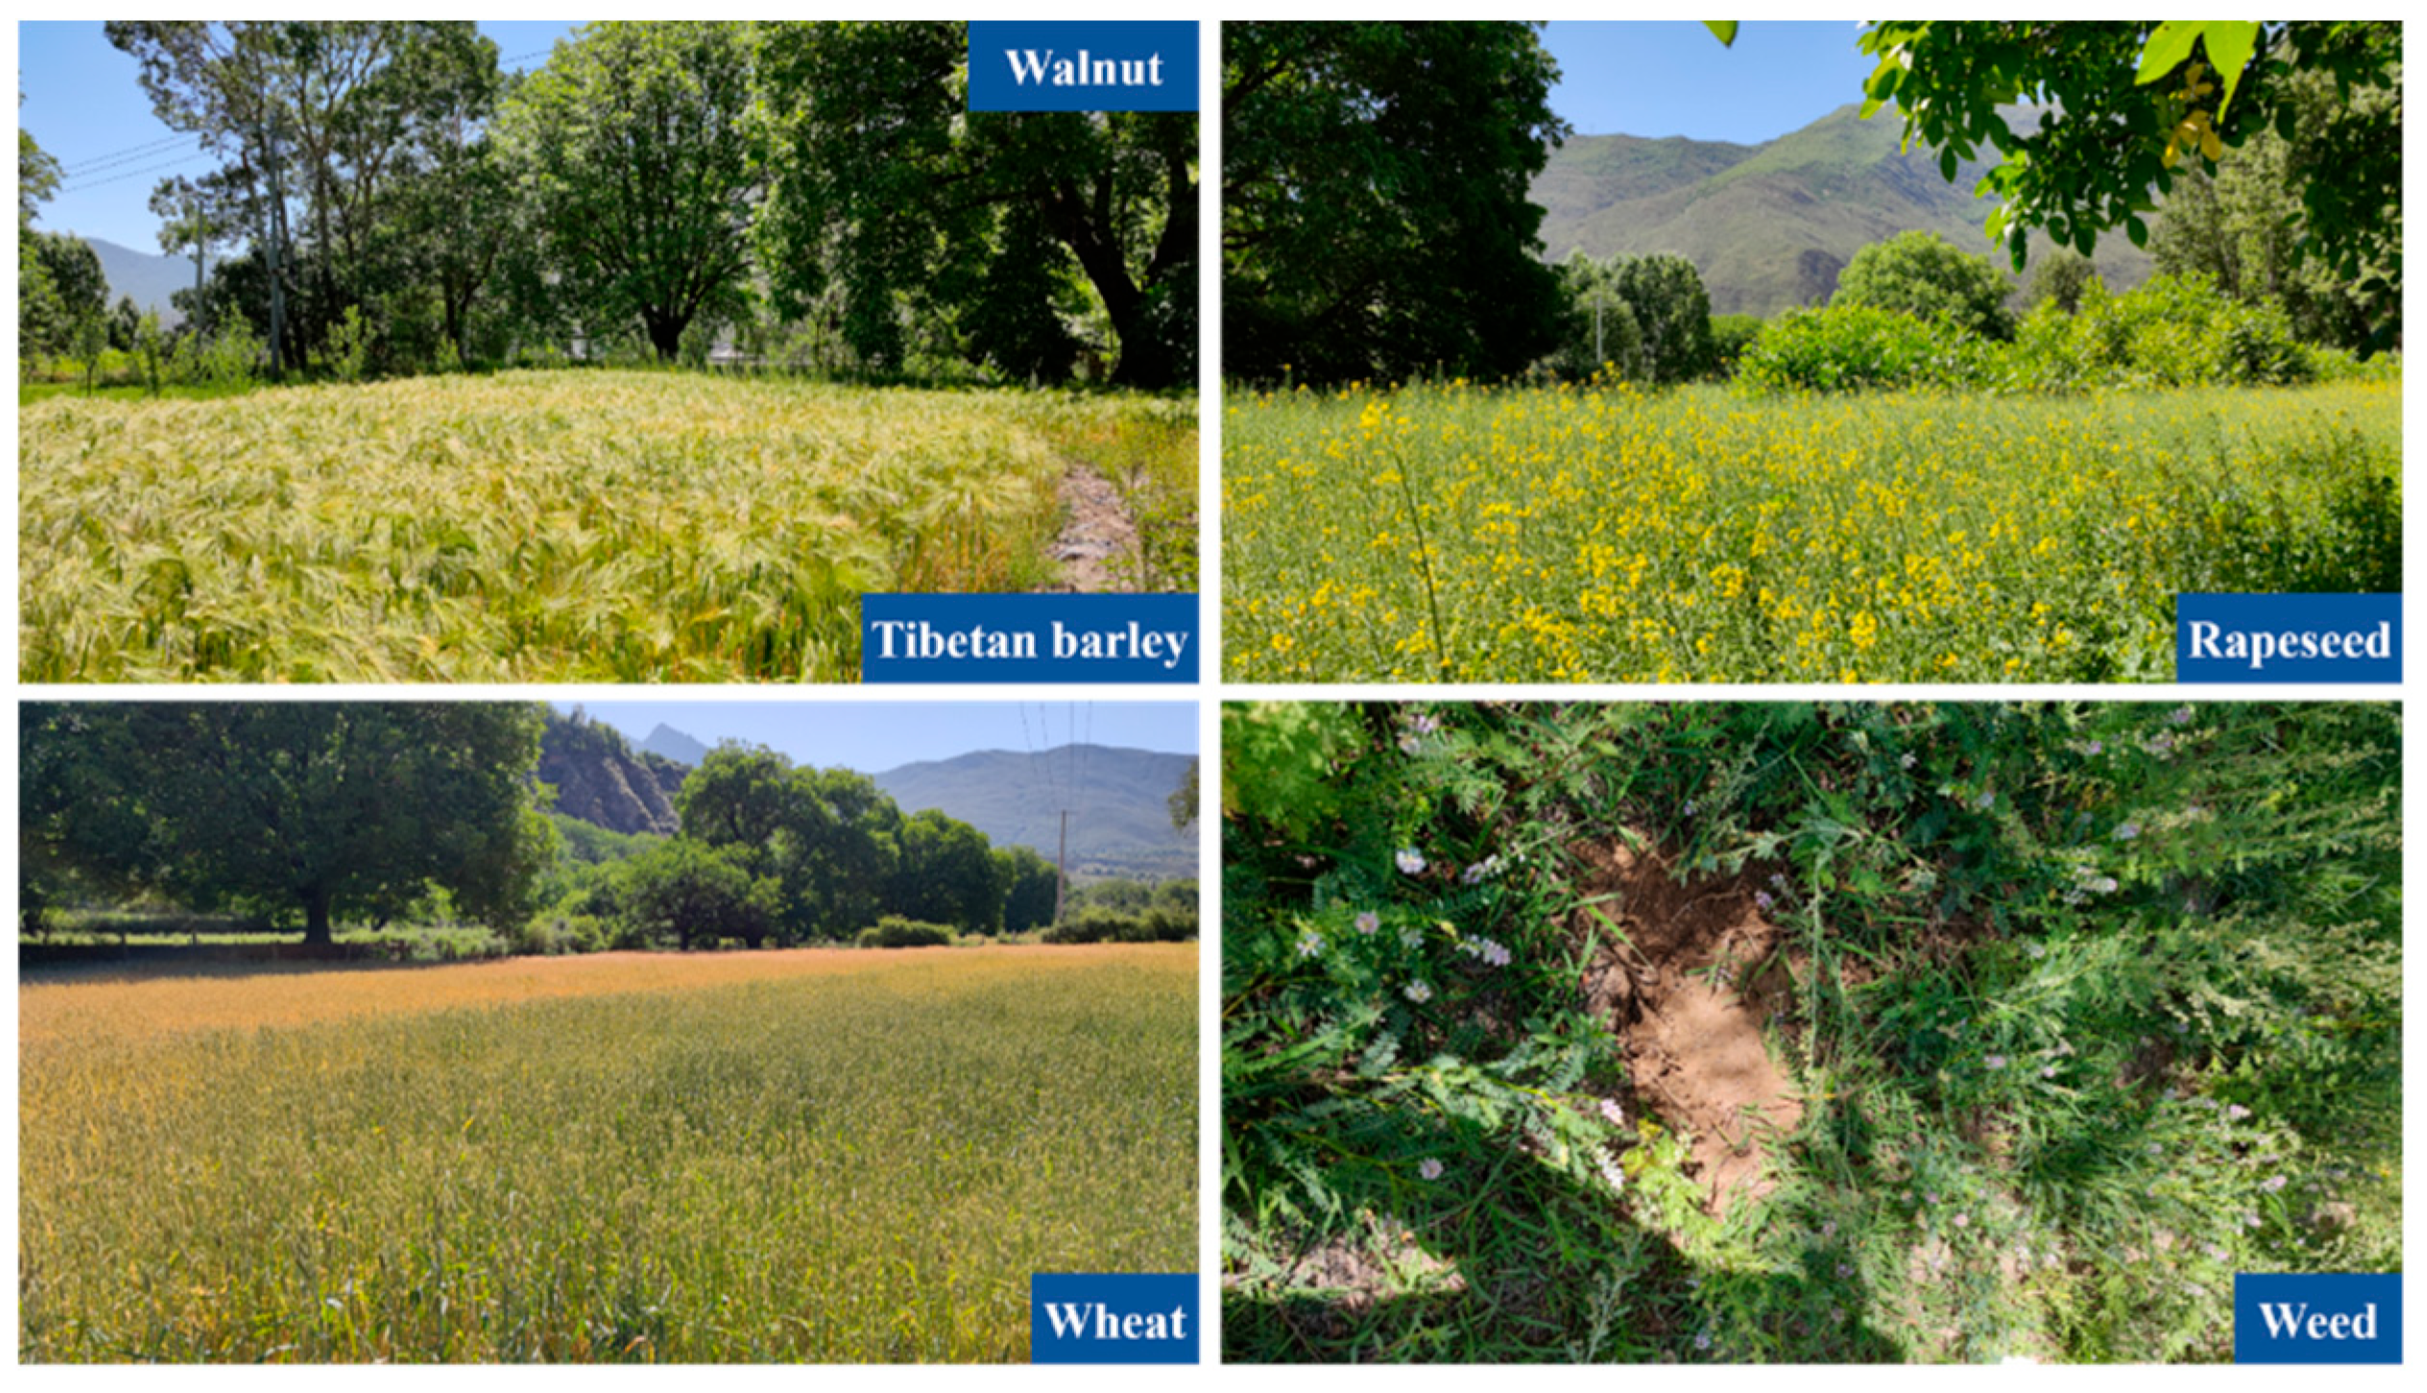
The sampling sites (Figure 1) were in a river valley along the middle reaches of the Brahmaputra River, China (92°33′17″ N, 29°14′35″ E), within Jiachen County, Shannan City, in the southeastern part of the Tibet Autonomous Region. The area has a plateau temperate semiarid monsoon climate, with average annual temperature of 8.9 °C and average annual rainfall of 493 mm. Jiachen County spans the Gandise Mountains, the Brahmaputra suture zone, and the Himalayan plate, resulting in a complex geological structure and soil formation environment. The soil parent material is primarily weathered metamorphic rocks such as slate, gneiss and phyllite, as well as Quaternary loose deposits [11]. The soils in the sampled valley are mostly developed from alluvium, are relatively fertile and are mainly used for cultivating rapeseed, Tibetan barley, walnut, and wheat (Figure 2). Tibetan barley is primarily fertilized with urea (≈165 kg N ha−1 yr−1) and farmyard manure (≈3500 kg ha−1 yr−1). Irrigation is limited, relying mainly on rainfall, and tillage is performed once per season before sowing. Herbicides are applied at low frequency, mainly for grass weed control. Rapeseed fertilization includes urea (≈135 kg N ha−1 yr−1) combined with phosphorus fertilizer (≈70 kg P2O5 ha−1 yr−1). Irrigation is generally unnecessary because of seasonal rainfall. Conventional tillage is practiced before sowing, and pesticides are used occasionally to control aphids and fungal diseases. In walnut orchards, organic manure is applied annually (≈3000 kg ha−1 yr−1), with supplementary nitrogen fertilizer (≈110 kg N ha−1 yr−1). Irrigation is conducted 2–3 times per year depending on precipitation. Herbicides are sometimes used for weed control, while pesticide use is relatively infrequent. Wheat is managed with urea (≈180 kg N ha−1 yr−1) and phosphate fertilizer (≈65 kg P2O5 ha−1 yr−1). Tillage is performed before sowing and occasionally after harvest. Irrigation is applied once or twice depending on rainfall. Pesticides and herbicides are commonly used to manage rust, aphids, and weeds.

2.2. Experimental Design

The experiment was conducted in mid-July 2022 in the Brahmaputra River valley, Anrao Town, Jiachen County, Shannan City, Tibet. Soil and plant samples were collected from five areas with different land-use types. The five areas in the ecological landscape are shown in Figure 2. Ten points were sampled in each plant community, with approximately 1 kg of soil collected from each point using the quartering method. Soils were then taken to the laboratory for analysis. Plant residues, stones and other impurities were removed. One portion of the soil was air-dried and then sieved through 0.85-mm and 0.15-mm mesh screens and then stored in self-sealing bags for nutrient analysis. The other portion was stored at −80 °C for microbial diversity testing and analysis. Concurrently, leaf samples (~500 g) were collected from Tibetan barley, walnut, rapeseed, wheats and weeds. Leaves were washed with deionized water, placed in an oven, blanched at 105 °C for 20 min, and then dried at 50 °C to constant weight. Dried leaves were ground using a plant grinder, passed through a 0.15 mm sieve and stored in self-sealing bags for nutrient analysis.

2.3. Sample Analysis

Soil pH was determined by a pH meter, soil organic matter (SOM) by a potassium dichromate external heating method, and total nitrogen (TN) by a Kjeldahl method. Available nitrogen (AN) was determined using a flow injection analyzer, available phosphorus (AP) using a molybdenum–antimony colorimetric method and available potassium (AK) and slowly available potassium (SAK) using flame photometry [12,13]. Microbial biomass carbon (MBC), nitrogen (MBN) and phosphorus (MBP) were determined by a chloroform fumigation–extraction method combined with a C/N analyzer and colorimetry [11].
For plant nutrient analysis, plant samples were digested with concentrated H2SO4-H2O2. The resulting solution was analyzed using a flow injection analyzer (Agilent Technologies, Santa Clara, CA, USA) to determine the contents of total nitrogen (PN) and total phosphorus (PP). Total potassium (PK) content in the plant leaf samples was measured with a flame photometer (FP640) [14].
To analyze soil microbial communities, total DNA was extracted from soil samples using an Omega Soil DNA Kit (Omega Bio-tek, Norcross, GA, USA). Length and integrity of DNA were verified by 1.2% agarose gel electrophoresis (5 V/cm, 20 min), and concentration and purity were checked with a NanoDrop 2000 spectrophotometer (Thermo Fisher Scientific, Waltham, MA, USA) [15]. The V4 region of the soil bacterial 16S rDNA gene was amplified using the forward primer 515F (5′-GTGYCAGCMGCCGCGGTAA-3′) and the reverse primer 806R (5′-GGACTACNVGGGTWTCTAAT-3′). Fungal ITS amplification [16] used the forward primer ITS5 (5′-GGAAGTAAAAGTCGTAACAAGG-3′) and the reverse primer ITS2 (5′-GCTGCGTTCTTCATCGATGC-3′) [17]. The 16S and ITS amplifications were performed in a 25 µL reaction system with High-Fidelity DNA polymerase (Thermo Fisher Scientific, Waltham, MA, USA). The PCR program was as follows: initial denaturation at 98 °C for 2 min, followed by 27 cycles for bacteria and 35 cycles for fungi. Each cycle consisted of denaturation at 98 °C for 15 s, annealing at 55 °C for 30 s, and extension at 72 °C for 30 s. A final extension was performed at 72 °C for 5 min, and the samples were then held at 10 °C [18,19]. After amplification, the PCR products were purified, checked, and quantified before library construction and sequencing on an Illumina Novaseq platform (PE250) by Wuhan Baiyihuinen Biotechnology Co (Wuhan China)., Ltd.

2.4. Data Processing and Analysis

High-throughput sequencing results were initially quality-filtered, and libraries and samples were demultiplexed based on index and bar code information. Bar code sequences were removed, followed by sequence denoising and clustering. Redundancy analysis (RDA) was performed using Canoco 5.0 software. The taxonomic composition of bacterial and fungal communities in the walnut groves was visualized using Krona (v2.6) software for interactive display [20,21,22]. QIIME2 (v2020.6) software was used with unflattened amplicon sequence variant (ASV) tables to calculate Chao1 and Species indices [23] to represent community species richness and Shannon and Simpson indices [24,25,26,27] to represent community species diversity. All statistical analyses were performed in SPSS 18.0 (SPSS Inc., Chicago, IL, USA). The least significant difference (LSD) method was used to test for significant differences at p < 0.05, with p < 0.01 considered highly significant. Experimental data calculations and processing were performed using MS Excel 2019 and Origin 2024 software. Adobe Illustrator 2024 software was used for image modification and editing.
Shannon diversity index (H′) reflects both species richness and evenness, and is calculated as follows:
H = i = 1 S p i ln ( p i )
where pi is the relative abundance of the i-th species, and S is the total number of species. Higher H′ values indicate greater diversity.
Simpson diversity index (D) measures the probability that two randomly selected individuals belong to the same species and is calculated as follows:
D = 1 i = 1 S p i 2
Values range from 0 to 1, with higher values representing higher diversity.

3. Results

3.1. Soil and Plant Nutrients

The soil at the study sites was alkaline, with pH ranging from 7.32 to 7.91 (Table 1). Soil pH ranking according to land use was wheat ≈ weeds < rapeseed < walnut < Tibetan barley. Soil organic matter across the sites ranged from 38.9 g kg−1 SOM to 48.1 mg kg−1 SOM. Soil organic matter ranking according to land use was walnut < Tibetan barley ≈ wheat < rapeseed ≈ weeds. Soil total nitrogen ranged from 0.03 g kg−1 TN to 0.07 g kg−1 TN, and the ranking according to land use was wheat < rapeseed < walnut = Tibetan barley < weeds. Soil available nitrogen ranged from 297.3 mg kg−1 AN to 398.9 mg kg−1 AN, and the ranking according to land use was Tibetan barley ≈ wheat < rapeseed < weeds < walnut. Available phosphorus varied from 8.43 mg kg−1 AP to 48.73 mg kg−1 AP, and the ranking was Tibetan barley < weed ≈ wheat < rapeseed < walnut. Soil available potassium ranged from 72.1 mg/kg AK to 229.4 mg kg−1 AK, and the ranking was Tibetan barley < weeds < walnut ≈ weeds < rapeseed. Slowly available potassium ranged from 1006.2 mg kg−1 SAK to 1843.9 mg kg−1 SAK, and the land-use ranking was rapeseed ≈ Tibetan barley < walnut ≈ weeds < wheat. MBPranged from 23.2 mg kg−1 MBP to 55.9 mg kg−1 MBP, and the ranking was rapeseed ≈ Tibetan barley < wheat ≈ weeds < walnut. Microbial biomass carbon ranged from 8.0 mg kg−1 MBC to 24.8 mg kg−1 MBC, and the ranking was rapeseed ≈ walnut < Tibetan barley ≈ weeds < wheat. Microbial biomass nitrogen ranged from 36.3 mg kg−1 MBN to 422.1 mg kg−1 MBN, and the land-use ranking was walnut ≈ Tibetan barley < rapeseed < weeds < wheat. The low MBC baseline of 8.0 mg kg−1 under rapeseed might reflect the limitations of the cold climate.
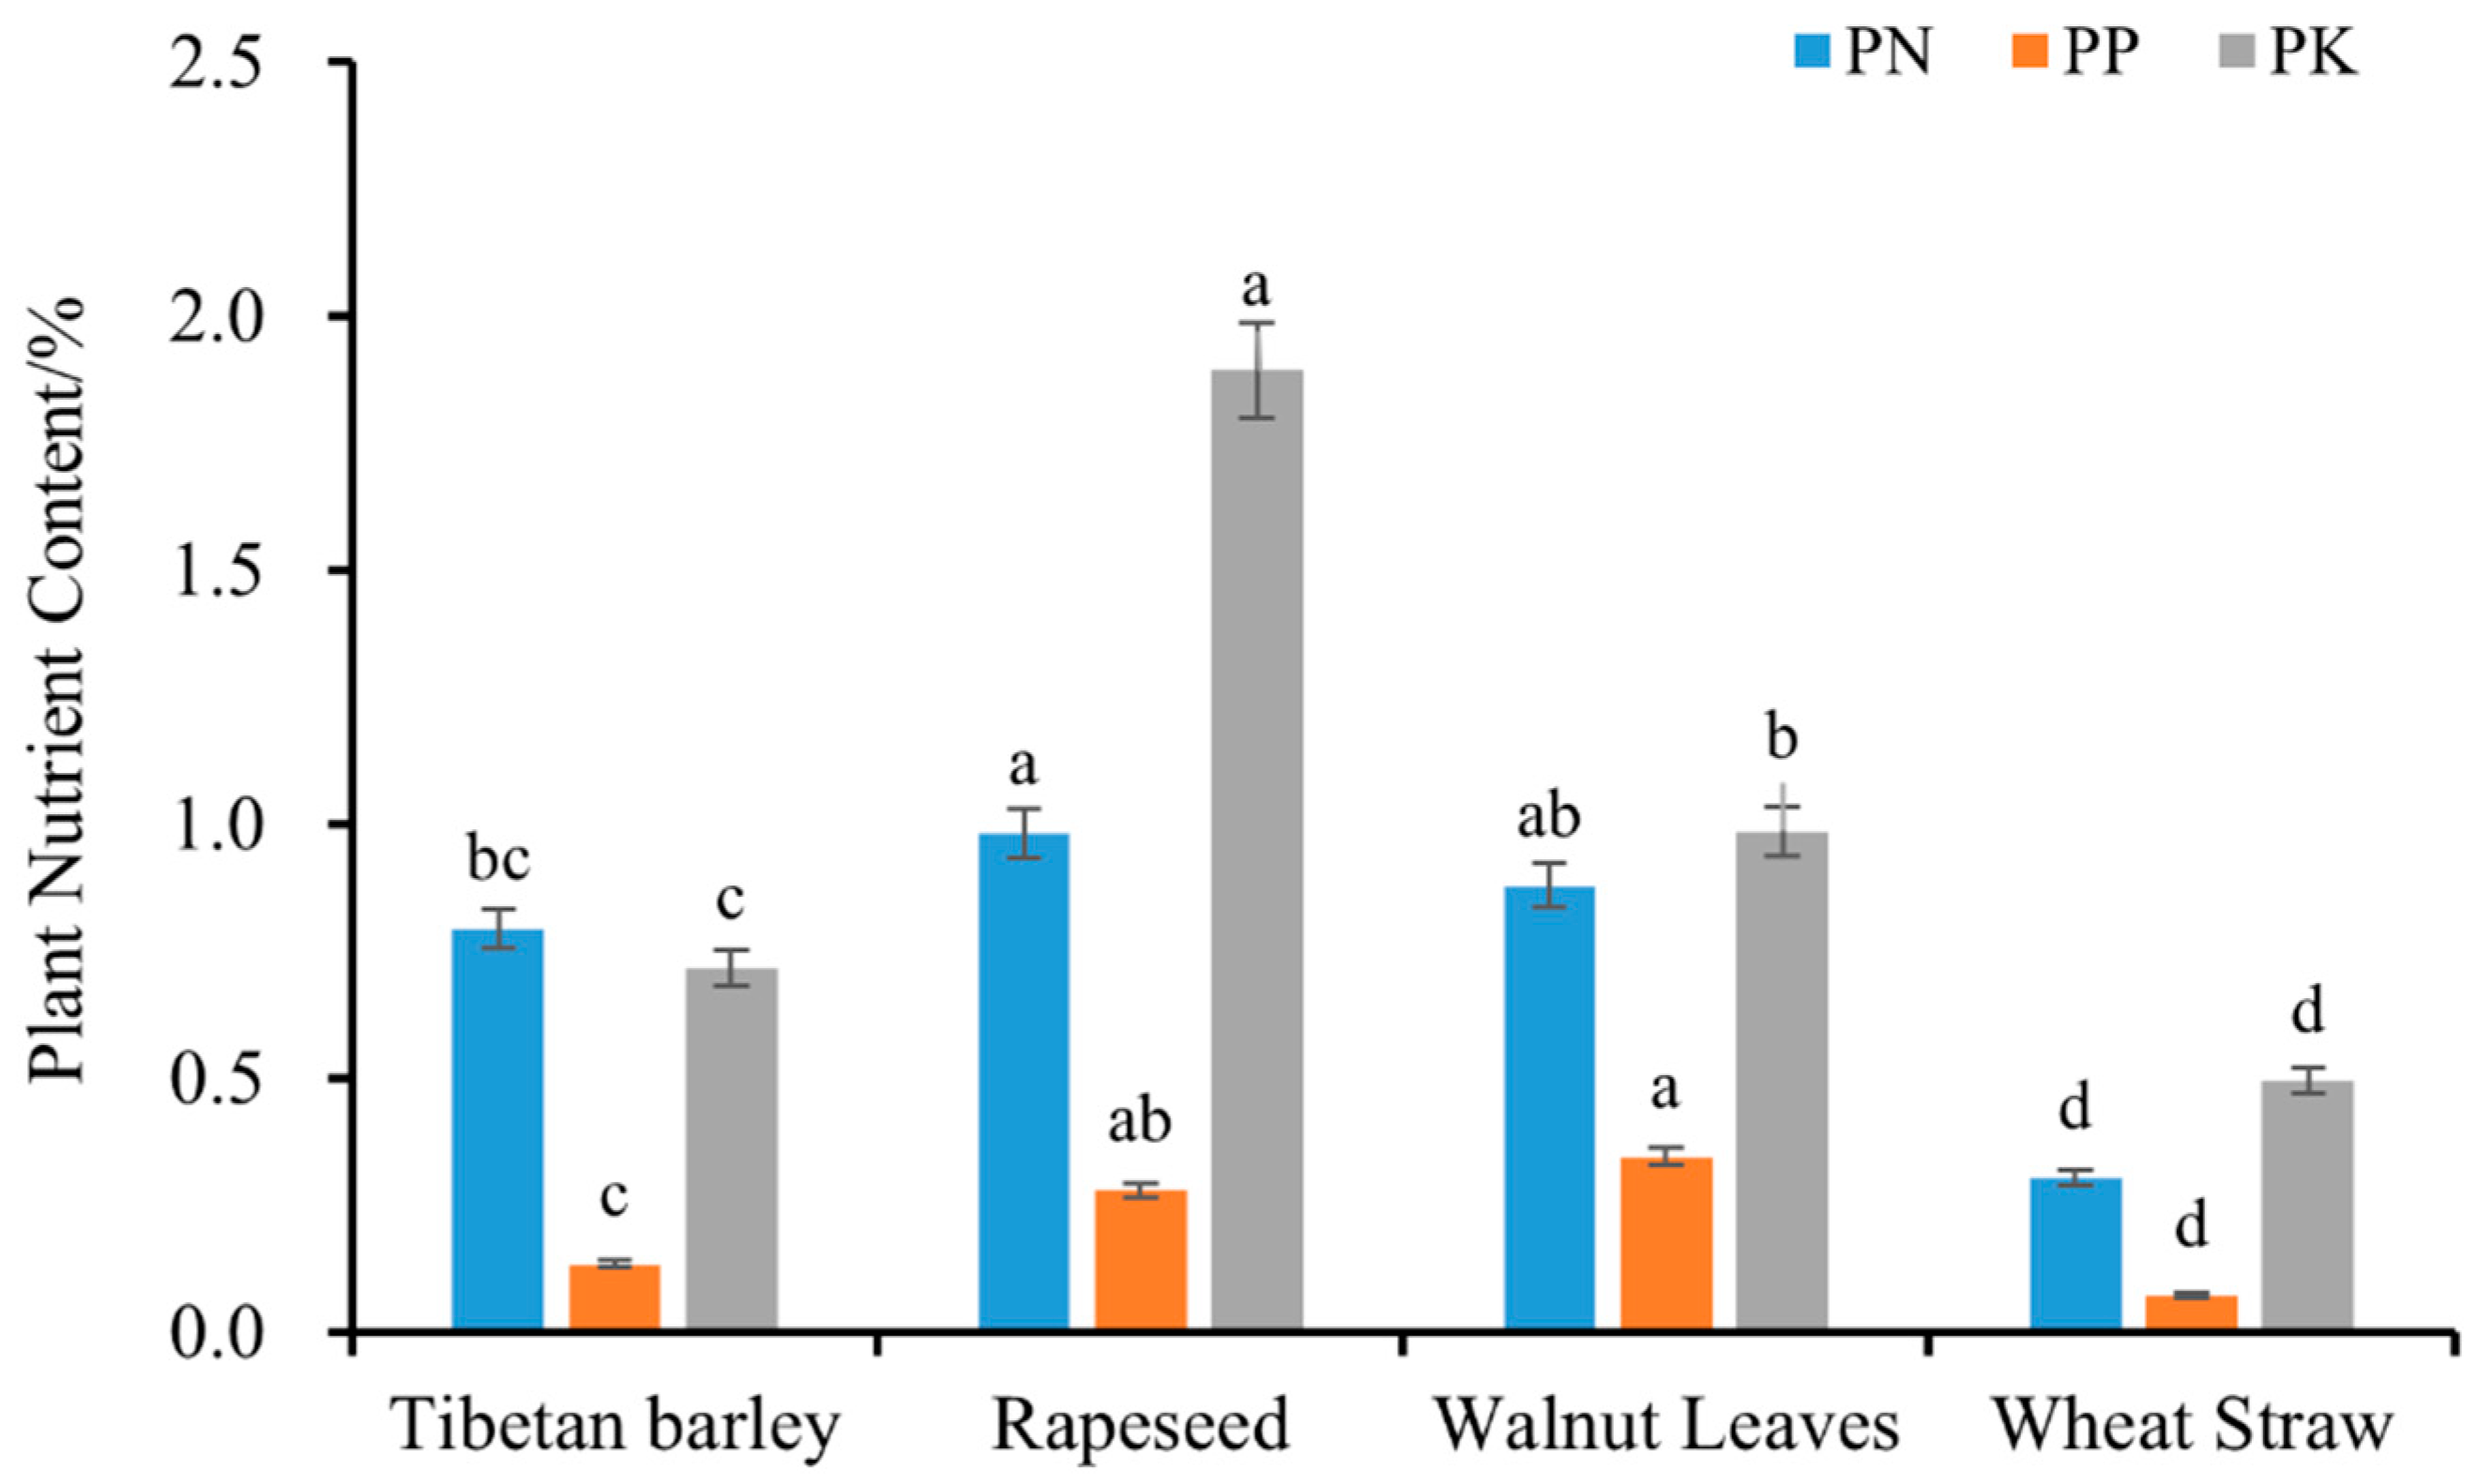
As shown in Figure 3 the PN content ranged from 0.31% to 0.98%, indicating moderate variation. Rapeseed had the highest PN content (0.98%), which might reflect its high N demand during growth. The lowest PN content was in wheat straw (0.31%), which is consistent with nutrient translocation to grains during crop maturation. The PN content of rapeseed leaves (0.98%) was significantly higher than that of Tibetan barley (0.19%) and wheat straw (0.67%). The lowest PN content (0.31%) was in wheat straw, which was significantly lower than that of other plant types. Walnut leaves had the highest PP content (0.35%), which was significantly higher than that of other plant types. The second highest PP (0.28%) was in rapeseed. Rapeseed also had the highest PK content (1.89%), which was significantly higher than that of the other plant types. The PK content of Tibetan barley (0.72%) was significantly lower than that of rapeseed and walnut leaves. The PP ranged from 0.07% in wheat straw to 0.35% in walnut leaves, with a mean of 0.21%. Plant K showed the largest range (0.49% to 1.89%), with rapeseed at 1.89%.

3.2. Relations Between Soil and Plant Nutrients

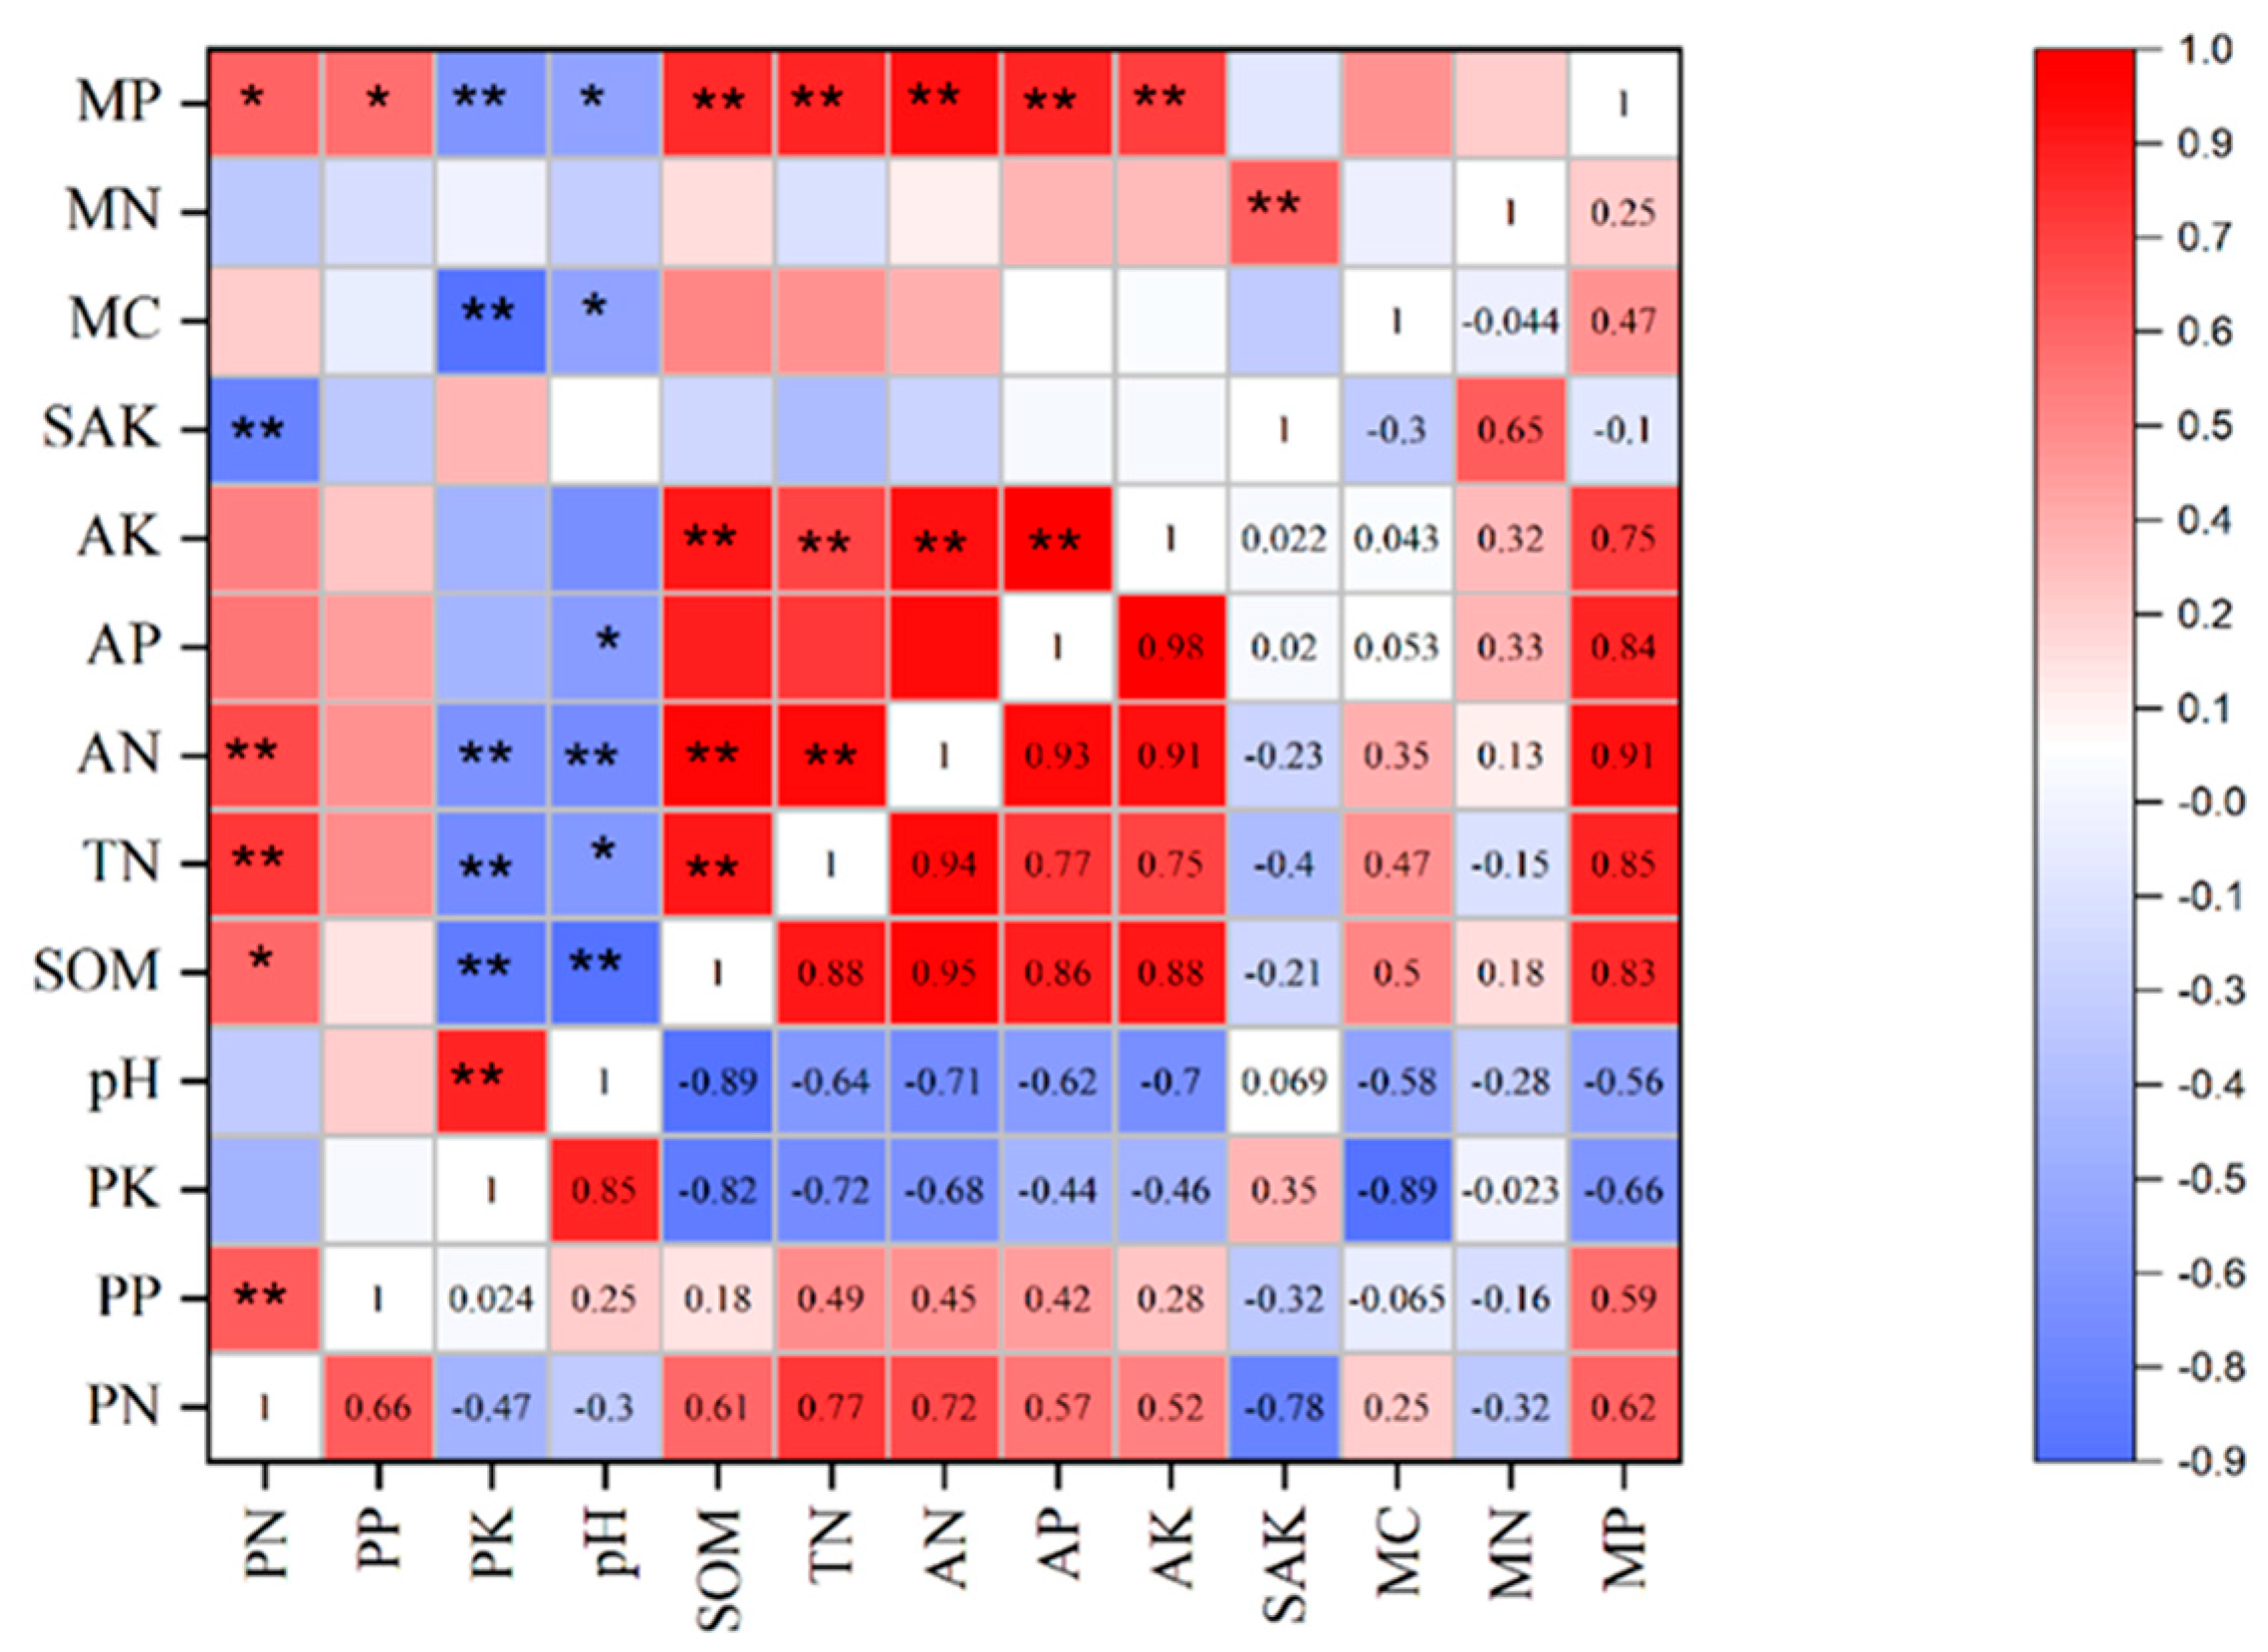
The nitrogen content of walnut leaves (PN) was highly significantly positively correlated with PP, TN, and AN (p < 0.01) (Figure 3). Soil pH was negatively correlated with AN (r = −0.88), AP (r = −0.51), and AK (r = −0.95). Soil organic matter was strongly positively correlated with MBN (r = 0.94). Total N was positively correlated with AN (r = 0.83), AP (r = 0.84), and SAK (r = 0.82), whereas it was negatively correlated with PK (r = −0.98). Available N was positively correlated with AP (r = 0.83), AK (r = 0.84), and MBP (r = 0.71). Available P was strongly positively correlated with MBP (r = 0.91) and PP (r = 0.85). Available K was positively correlated with PP (r = 0.48) and PK (r = 0.56). Microbial biomass P was positively correlated with AP (r = 0.91) and PP (r = 0.63). Microbial biomass C was negatively correlated with PN (r = −0.81), PP (r = −0.96), and PK (r = −0.82). Microbial biomass N was negatively correlated with PN (r = −0.74) and PP (r = −0.59). Plant N was positively correlated with PP (r = 0.80) and PK (r = 0.76). Plant P was positively correlated with PK (r = 0.65) (Figure 4).
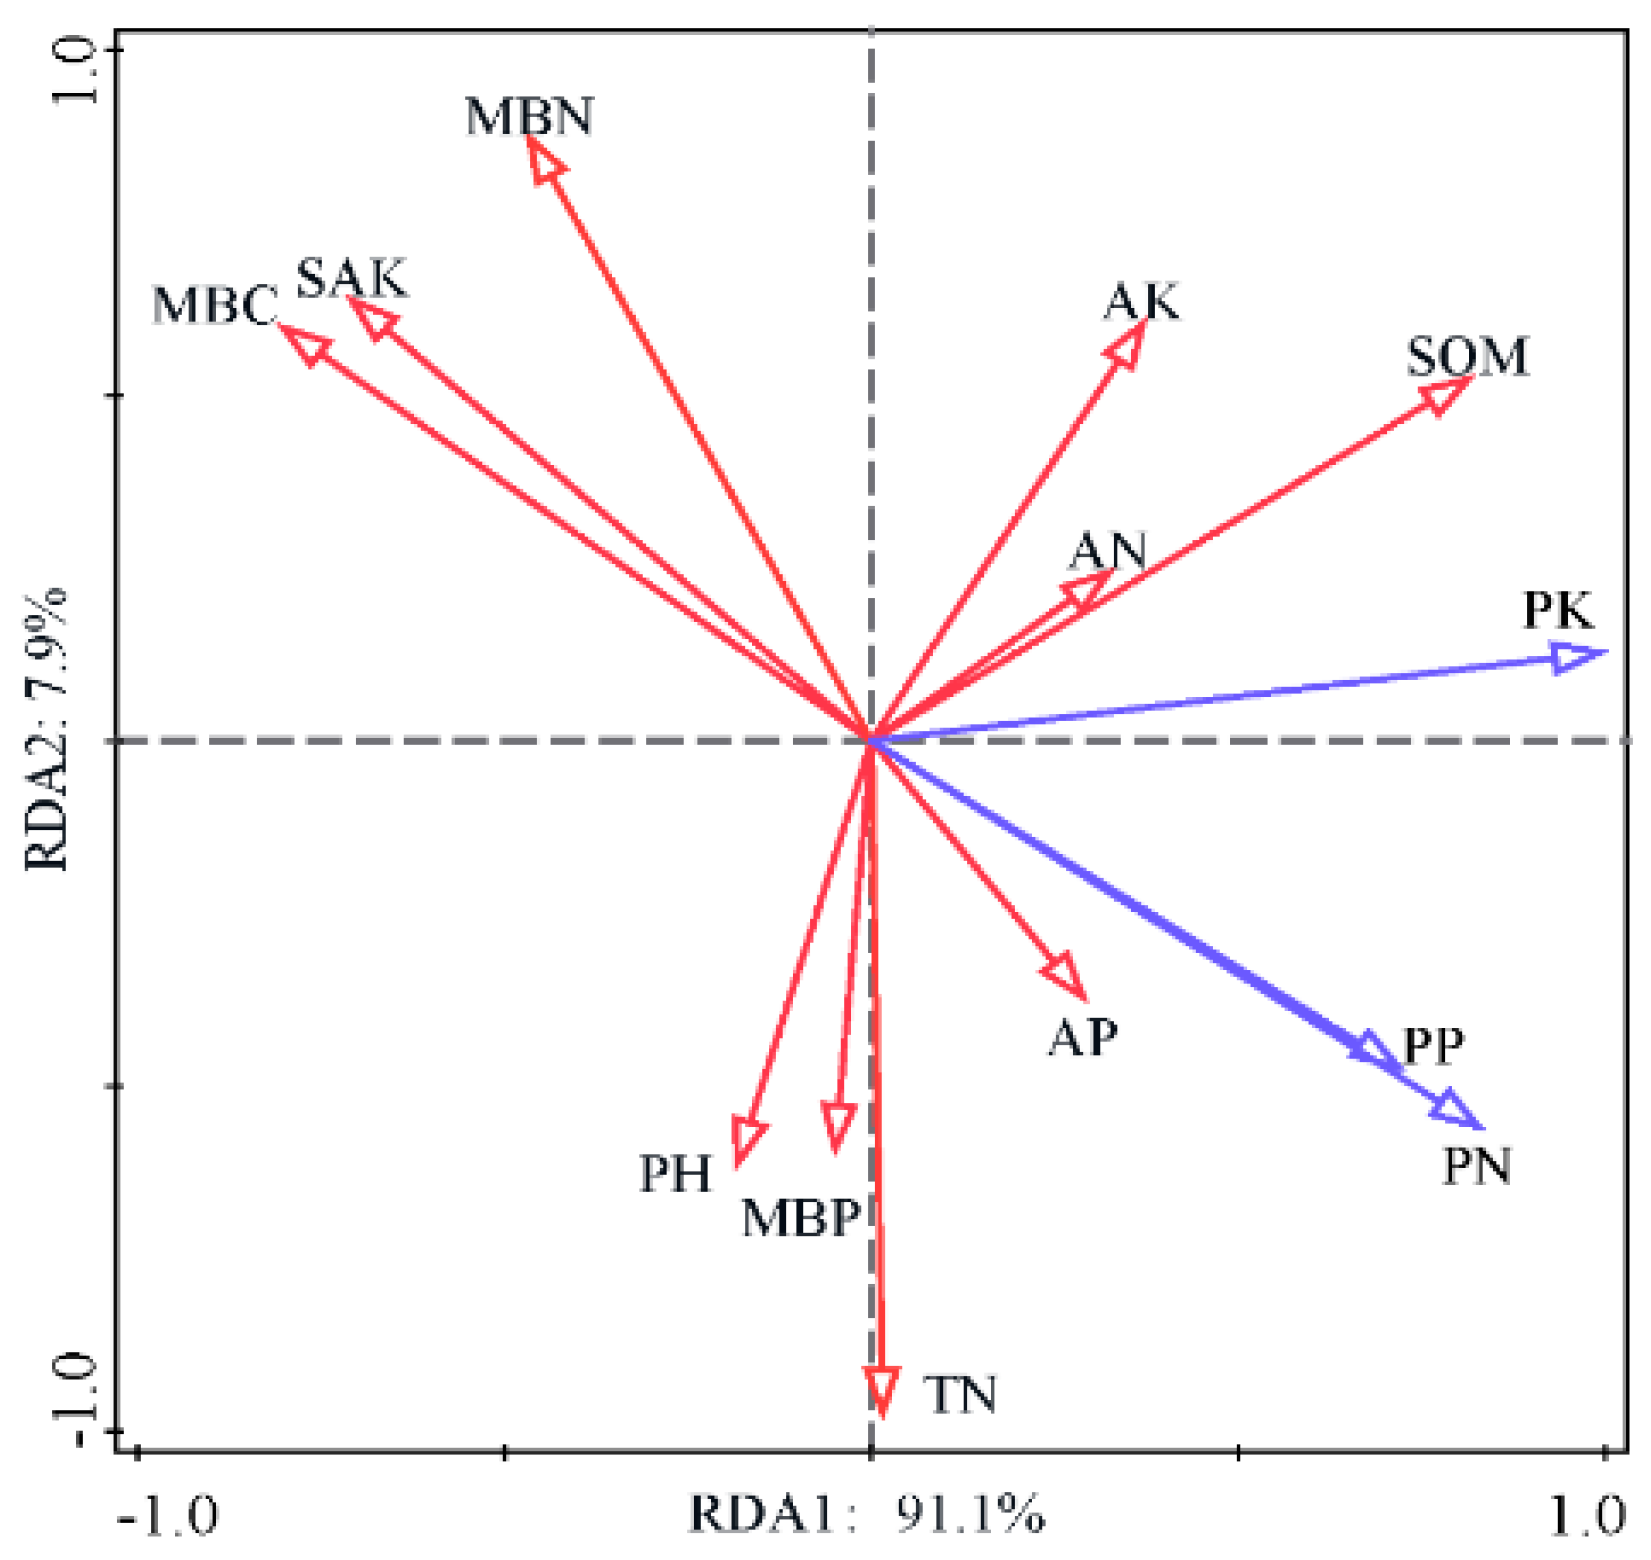
According to the RDA (Figure 5), soil chemical properties and microbial activity indicators combined explained 93.5% of the variability in leaf nutrients, with the first axis explaining 91.1% of the variability and the second axis explaining 7.9%. Thus, those environmental factors explained most of the variation in leaf nutrients. In further analysis, TN, AN, and SOM were the main drivers influencing leaf nutrients, explaining 45.4%, 11.4%, and 36.7%, respectively, of the variation, for the cumulative contribution of 93.5%. The results also indicated a clear positive interaction between PN and PP, while the interaction with PK was not significant.

3.3. Microbial Alpha and Beta Diversity

For the bacterial community, Chao1 richness was highest under wheat and Tibetan barley, intermediate under rapeseed and walnut trees, and lowest under weeds (Table 2). Results for number of observed species were similar with the highest richness indices under wheat and Tibetan barley and the lowest under weeds. The richness of all samples was significantly lower under weeds than that under other land use types (p < 0.05). Land use type did not significantly affect the bacterial Simpson index of diversity. However, the Shannon index of diversity was significantly higher under walnut trees and Tibetan barley than that under the other land use types. The Shannon index was significantly different among the three other land use types and was ranked weed < rapeseed < wheat. The coverage rate of all bacterial samples was high and not significantly different among land use types. In the fungal community, Chao1 richness of wheat and Tibetan barley was significantly higher than that of weeds. The Chao1 index was also relatively high under walnut trees but was lowest under rapeseed. Results were similar for species count, with the highest indices under wheat and Tibetan barley and the lowest under rapeseed. The highest Simpson index of the fungal community was under wheat, which was significantly higher than that under other land use types. The lowest Simpson index was under rapeseed, which was significantly lower than that under other land use types. Similarly, the highest Shannon index was under wheat, which was significantly higher than that under other land use types. The lowest Shannon index was under rapeseed, which was significantly lower than that under other land use types. The coverage rate of all fungal samples was high and not significantly different among land use types.
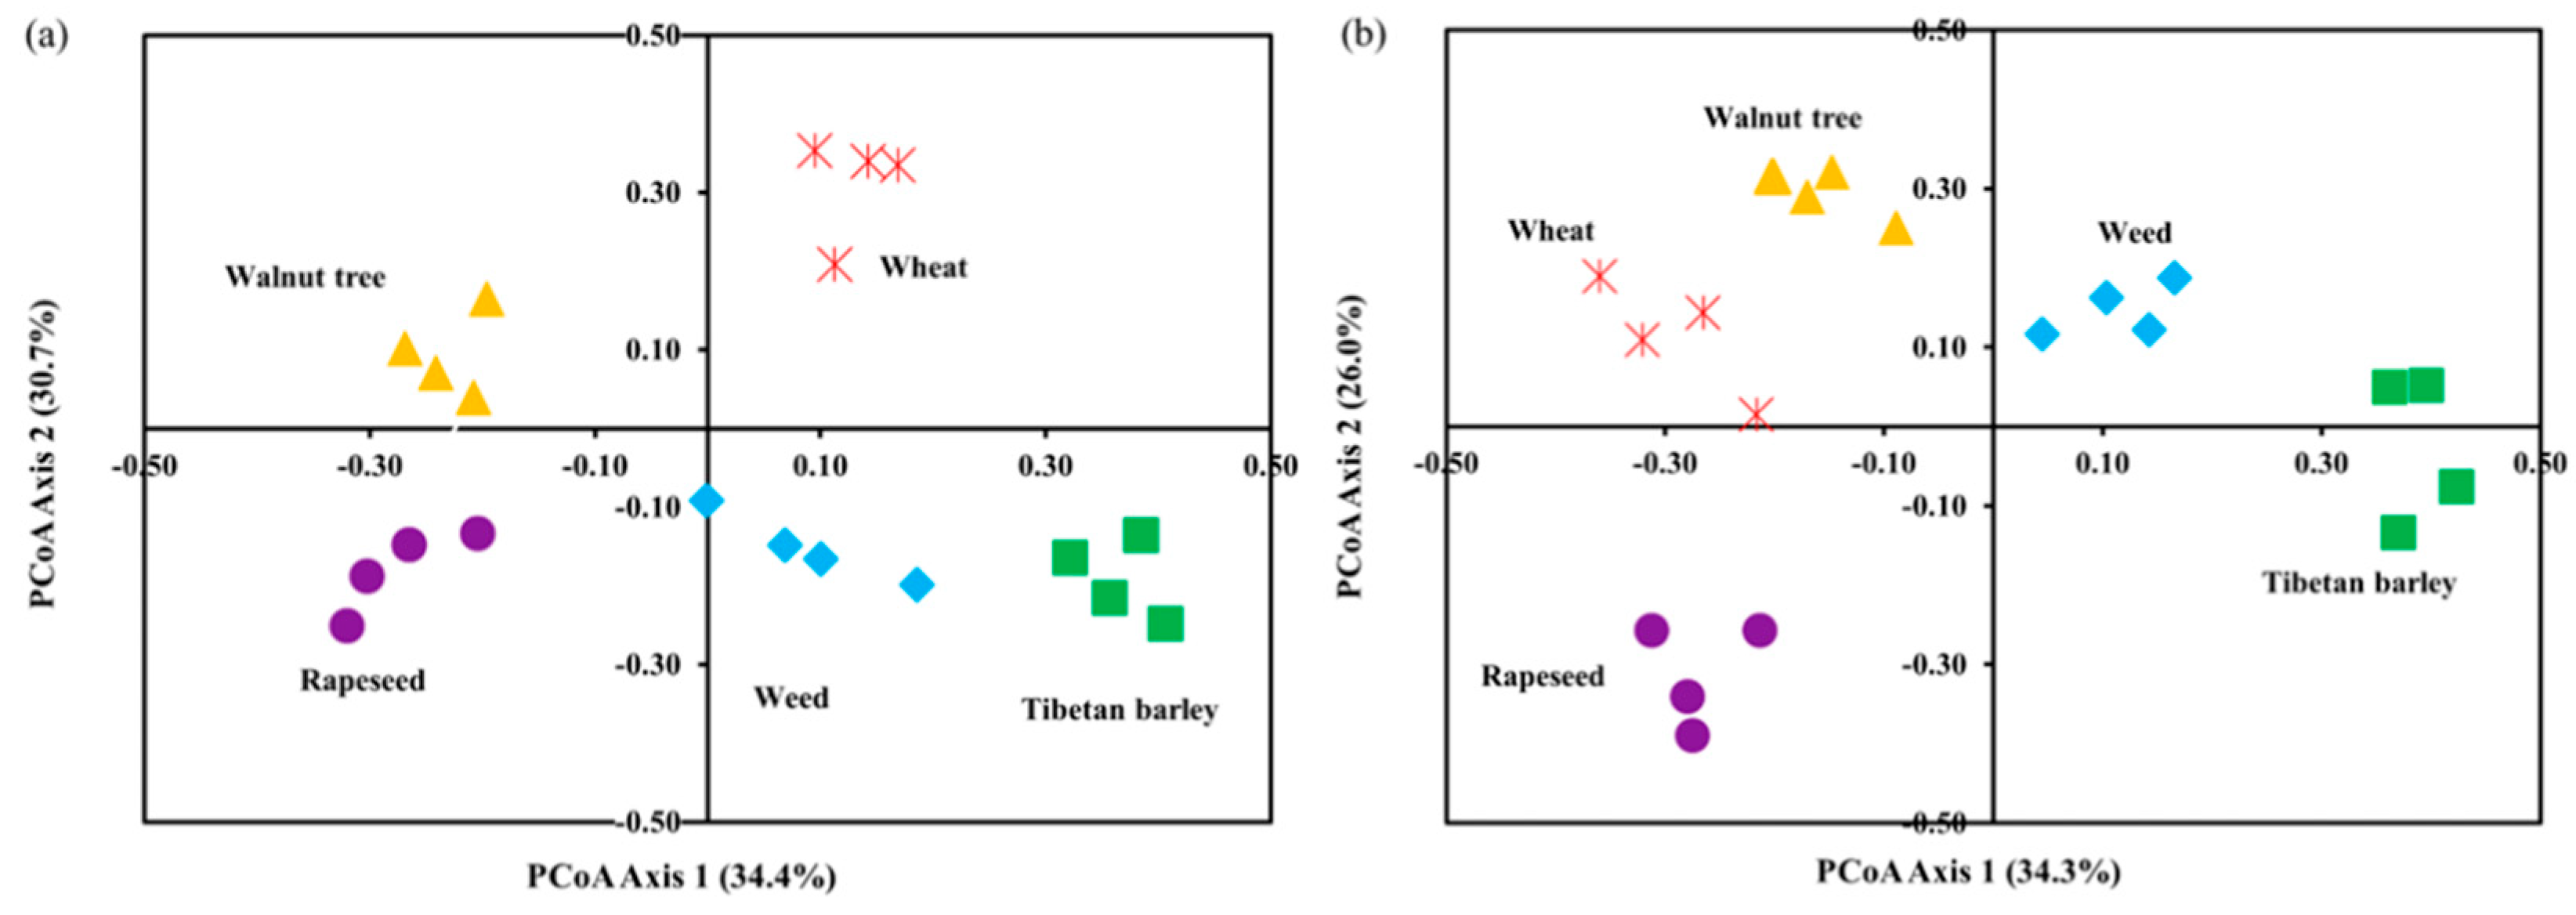
Principal co-ordinates analysis (PCoA) was used to determine differences in the beta diversity of soil microbial communities on a two-dimensional coordinate plot, with the first (PCoA1) and second (PCoA2) principal axes explaining the contributions to variability. The different land-use types significantly affected soil bacterial and fungal communities (Figure 5). In bacterial communities (Figure 6a), PCoA1 explained 34.4% of the variation in the bacterial community and PCoA2 explained 30.7%. The two axes combined explained 65.1% of the variation. The large distances between the different land-use types on the plot indicated that the change in land-use type led to substantial changes in bacterial community composition. In fungal communities (Figure 6b), PCoA1 explained 34.3% of the variation in the fungal community andPCoA2 explained 26.0%. The two axes combined explained 60.4% of the variation. Similarly, the large distances between the fungal communities of different land-use types on the plot suggested considerable differences in their community composition.
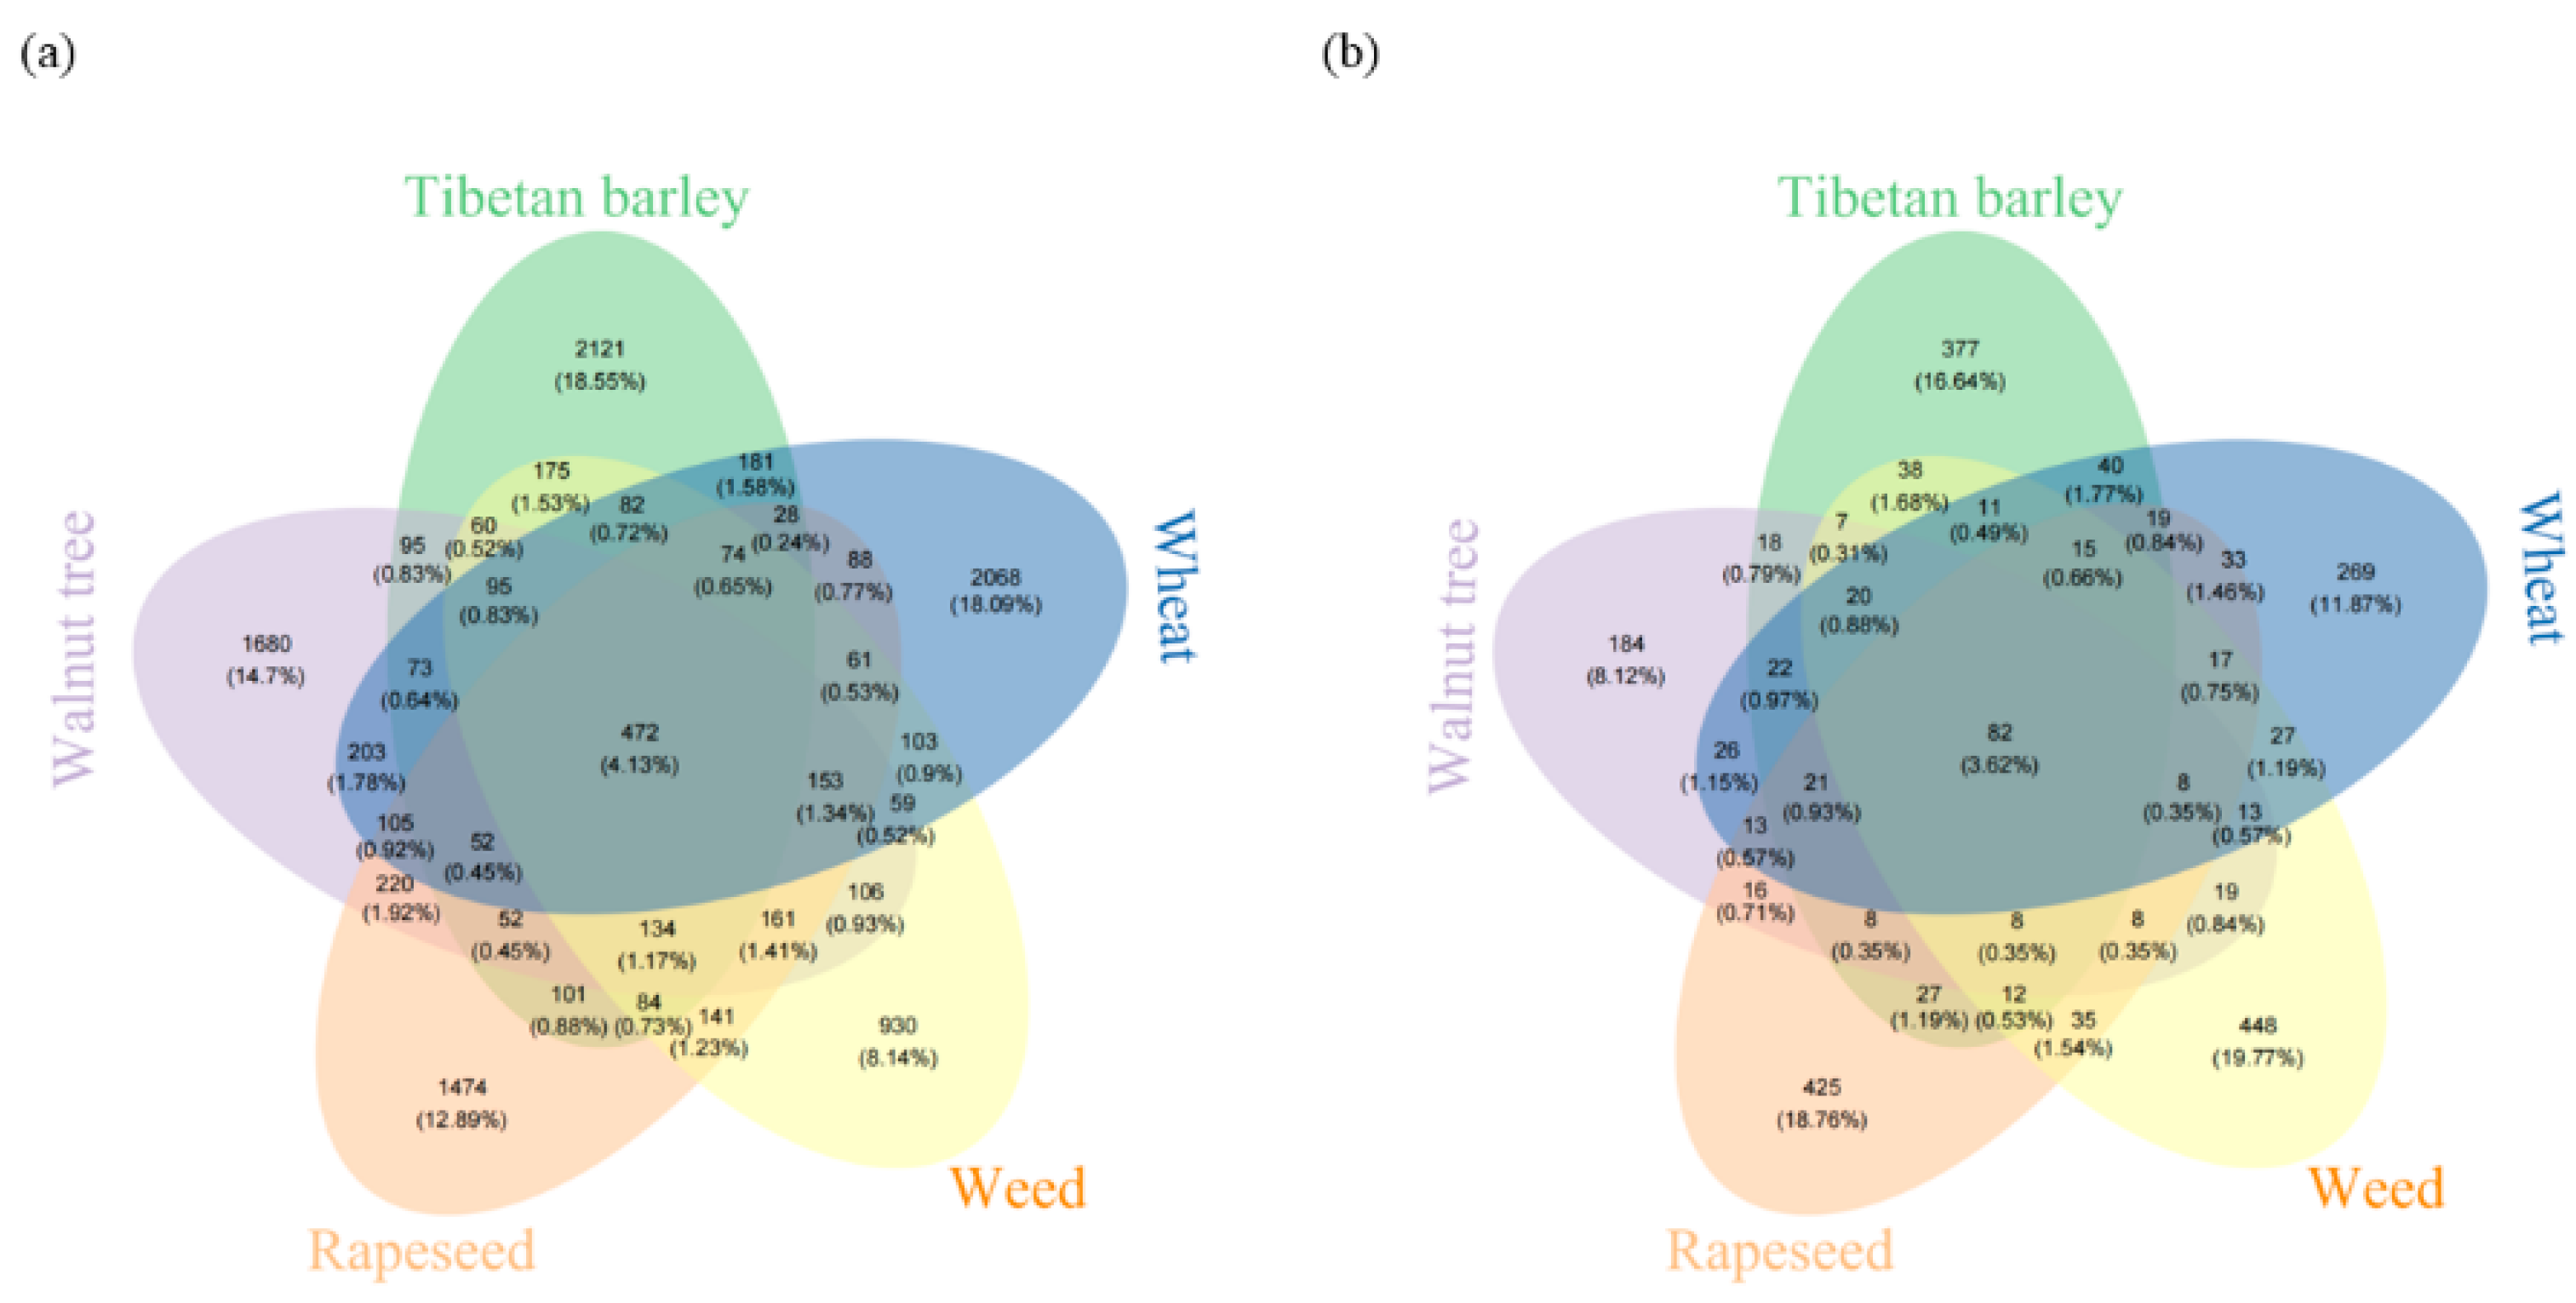
Venn diagram analysis revealed the composition and overlap of bacterial and fungal communities across different land-use types (Figure 7). In bacterial communities (Figure 7a), Tibetan barley contained unique 2121 ASVs, wheat 2068, weeds 930, rapeseed 1474, and walnut 1680. The combined number of bacterial ASVs unique to Tibetan barley and wheat accounted for 36.64% of the total. There were 472 ASVs shared by the five land-use types. The total number of ASVs across the other four land-use types was 56.09% higher than that under weeds. In fungal communities (Figure 7b), Tibetan barley contained 377 unique ASVs wheat 269, weeds 448, rapeseed 425, and walnut 184. The ASVs unique to weeds accounted for 19.77% of the total fungal ASVs. The combined number of ASVs in the other four land-use types accounted for 55.39% of the total. The total number of ASVs across the five land-use types was 1703 (75.16% of the total), whereas the ASVs common to the five land-use types accounted for 3.62%.

3.4. Microbial Community Composition

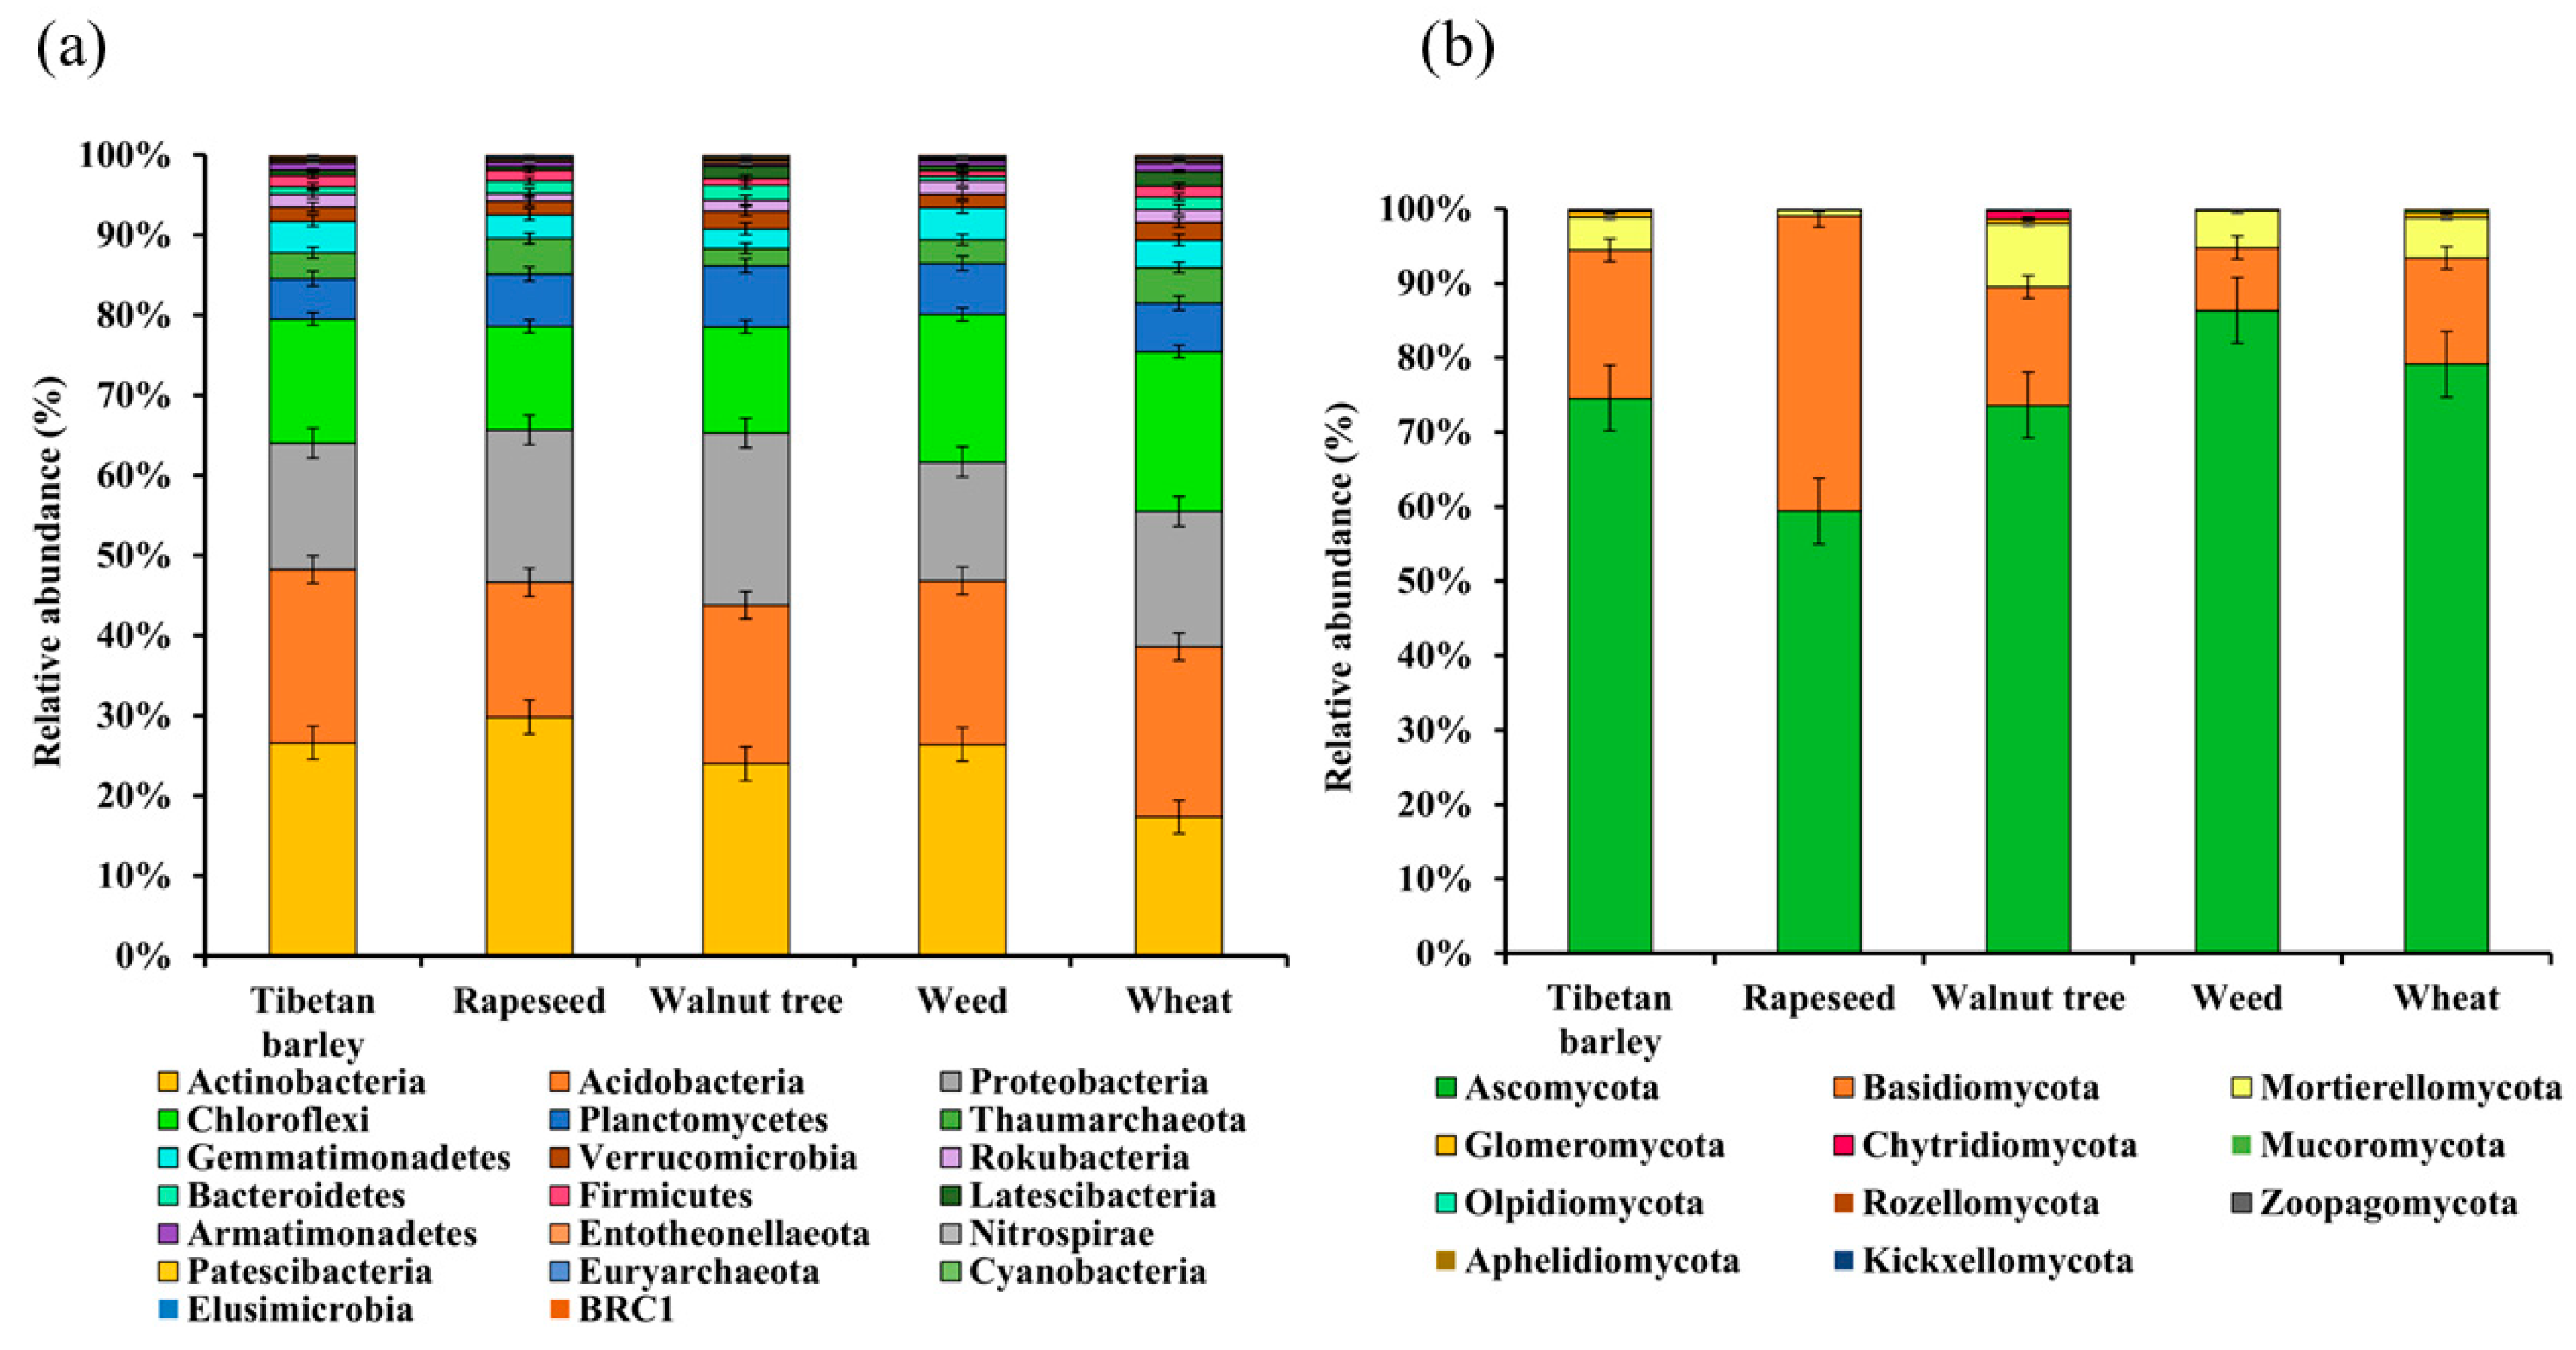
Analysis of the taxonomic composition of soil communities from five different land-use types revealed distinct patterns for both bacteria and fungi. In bacterial communities (Figure 8a), the dominant bacterial phyla were Actinobacteria (17% to 30%, mean 24.8%), Acidobacteria (17% to 22%, mean 20%), and Proteobacteria (15% to 22%, mean 18.2%). The cumulative abundance of the three phyla ranged from 63% to 72%, designating them as core community members. Actinobacteria relative abundance was highest under rapeseed (30%), compared with 26% under weeds. The highest abundance of Proteobacteria (22%) was under walnut, compared with the lowest abundance of 15% under weeds. The highest abundance of Acidobacteria was under Tibetan barley (22%), whereas the lowest abundance was under rapeseed (17%). Other significant bacterial phyla included Chloroflexi (range 13% to 20%, mean 16%) and Planctomycetes (range 5%−8%, mean 6.4%). Chloroflexi abundance was highest under wheat (20%) and lowest under rapeseed (13%). For low-abundance phyla, such as Latescibacteria, abundance reached 2% under wheat and walnut. In fungal communities (Figure 8b), Ascomycota (59% to 86%, mean 74.6%) was the most abundant phylum in all land-use types, confirming its status as a core community taxon. The relative abundance of Basidiomycota ranged from 8% to 40% (mean 19.6%), while that of Mortierellomycota ranged from 1% to 9% (mean 4.8%). The abundance of Glomeromycota was consistently low and uniform (range 0% to 1%, mean 0.6%). Ascomycota reached its highest abundance under weeds (86%), increasing by 45.8% compared with the lowest abundance under rapeseed (59%). Basidiomycota was most abundant under rapeseed (40%) and least abundant under weeds (8%). Mortierellomycota reached its highest abundance under walnut (9%).
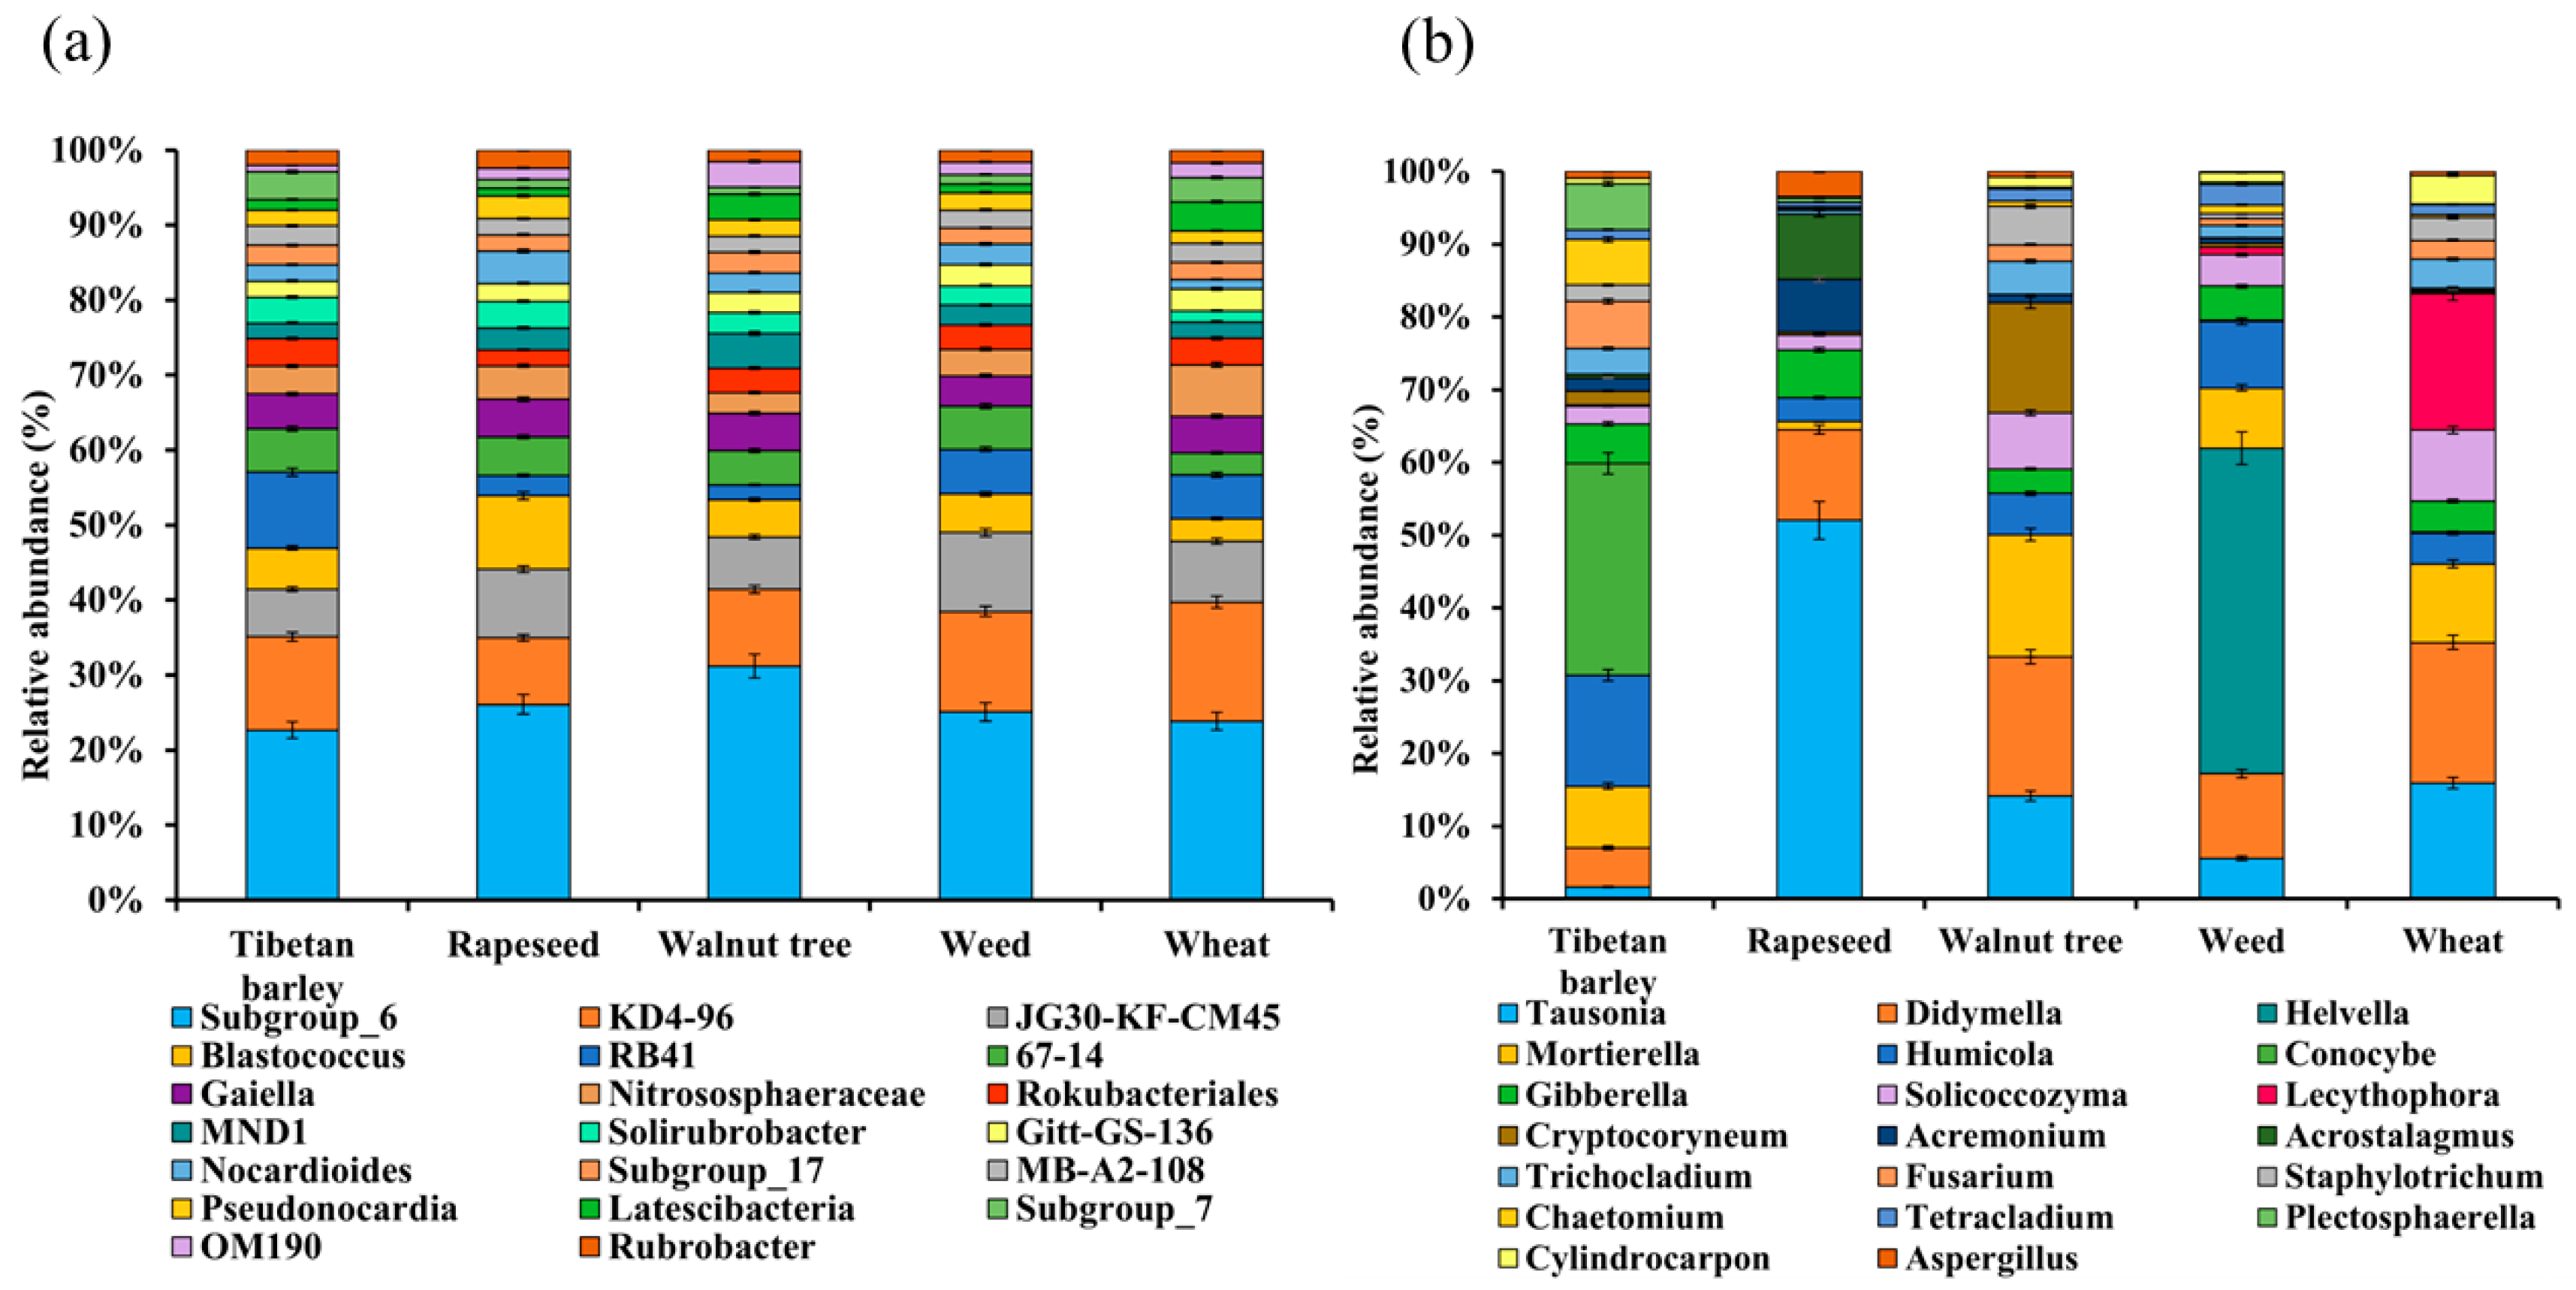
Figure 9 summarizes the relative abundance of genera of bacteria and fungi across the five land-use types. The dominant bacterial genera were Subgroup_6 (23% to 31%, mean 25.8%), KD4-96 (9% to 16%, mean 12%), and JG30-KF-CM45 (6% to 11%, mean 8.2%) (Figure 8a). The combined relative abundance of the three genera accounted for 46% to 60% of the total, establishing them as core members of the bacterial community. Other significant genera included Blastococcus (3% to 10%, mean 5.6%) and RB41 (2% to 10%, mean 5.4%). The highest relative abundance of Subgroup_6 was 31% under walnut, while the highest abundance of KD4-96 was 16% under wheat. Blastococcus reached its highest abundance at 10% under rapeseed. The dominant fungal genera were Tausonia (2% to 52%, mean 18%), Didymella (5% to 19%, mean 13.4%), and Conocybe (0% to 29%, mean 5.8%), which constituted the core fungal community. Other notable genera included Mortierella (1% to 17%, mean 9%) and Humicola (3% to 15%, mean 7.4%). The highest abundance of Tausonia was under rapeseed (52%), which was much higher than that under weeds (6%). Didymella reached its peak abundance under both walnut and wheat, compared with its lowest abundance under Tibetan barley (5%). Conocybe was found only under Tibetan barley, with a relative abundance of 29%. Similarly, Helvella was unique to weeds, with a high relative abundance of 45%. Mortierella was most abundant under walnut (17%), and Lecythophora abundance was significantly higher under wheat (19%) than under other land use types, with its lowest abundance under weeds (1%).
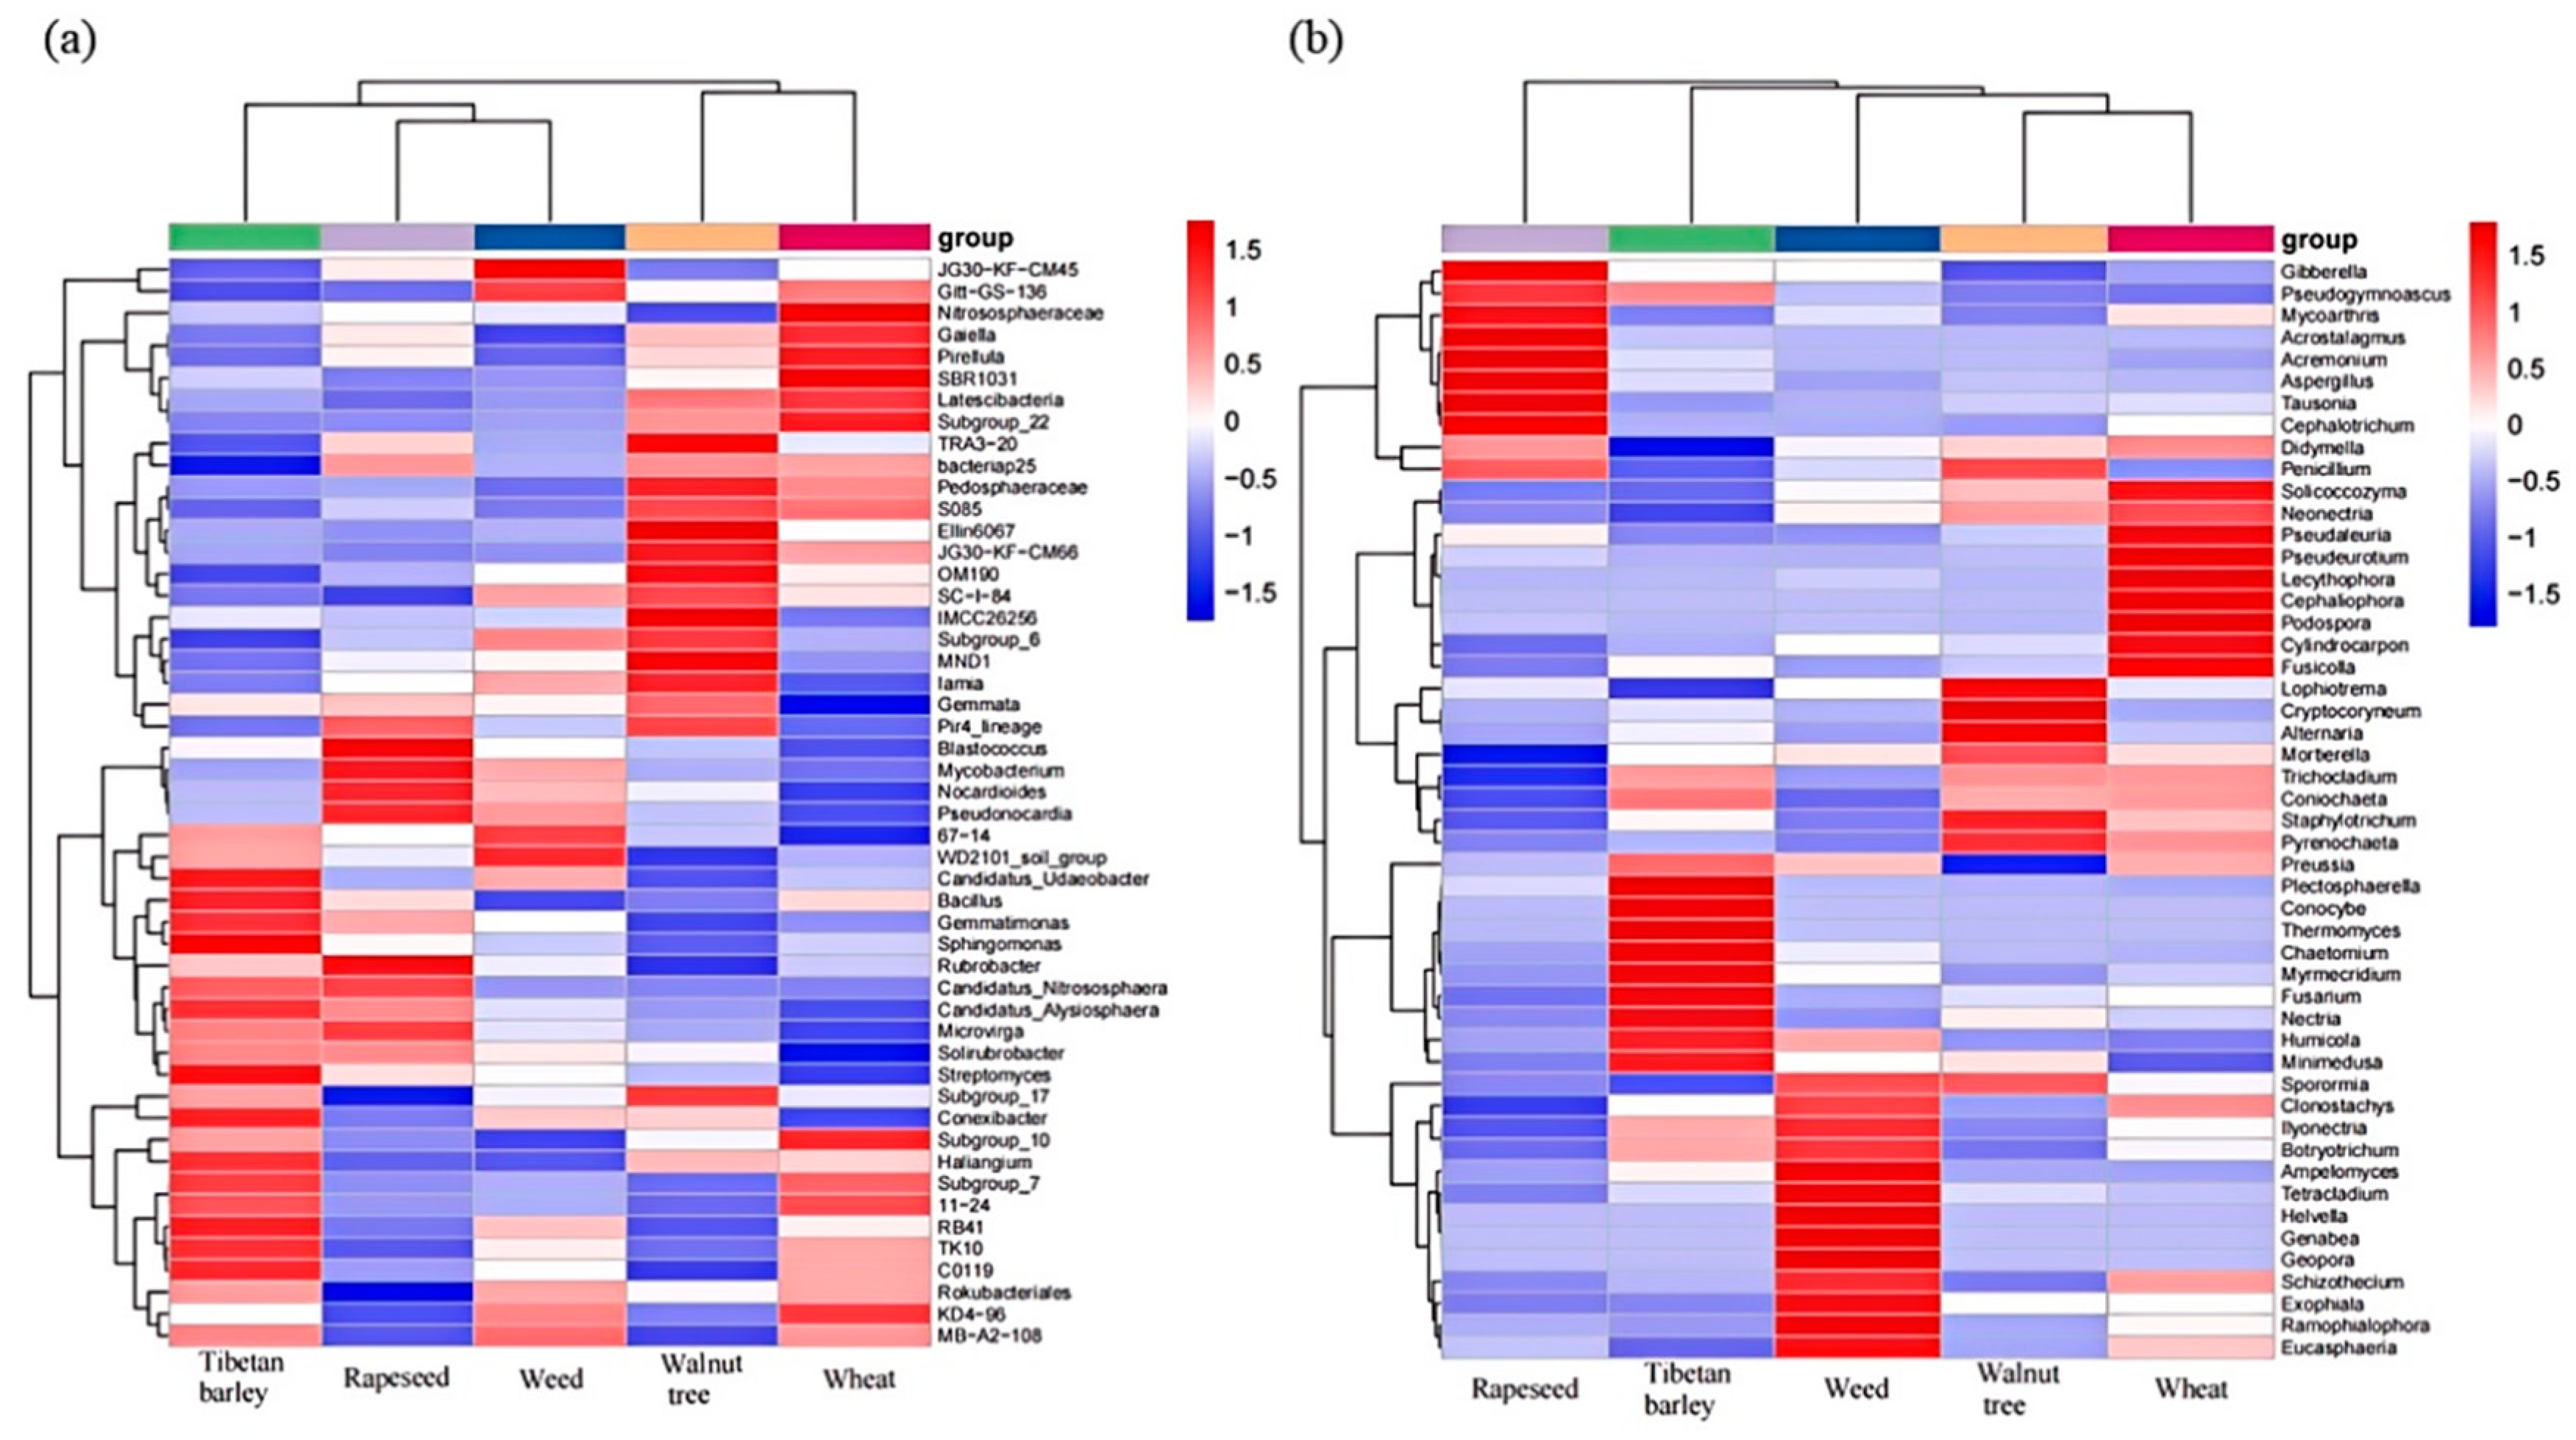
In the heatmap analysis (Figure 9), ASVs of different relative abundances were clustered at the genus level, and the effects of various land-use types on the microbial community in plateau soils were distinct. In bacterial communities (Figure 9a), Tibetan barley was highly significantly positively correlated with Streptomyces, RB41, Sphingomonas, Gemmatimonas, Bacillus, and Candidatus_Udaeobacter but was negatively correlated with bacteriap25. Rapeseed was highly significantly positively correlated with Rubrobacter, Pseudonocardie, Nocardioides, Mycobacterium, and Blastococcus but was highly significantly negatively correlated with Rokubacteriales and Subgroup_17. Weeds were only highly significantly positively correlated with JG30-KF-CM45. Walnut was highly significantly positively correlated with Iamia, MND1, Subgroup_6, IMCC26256, SC-II84, OM190, JG30-KF-CM66, Ellin6067, S085, Pedosphaeraceae, and TRA3-20. Wheat was highly significantly positively correlated with Subgroup_22, Latescibacteria, SBR1031, Pirellula, Gaiella, and Nitrososphaeraceae. In fungal communities (Figure 9b), rapeseed was highly significantly positively correlated with Cephalortrichum, Tausonia, Aspergillus, Acremonium, Acrostalagmus, Mycoarthris, Pseudogymnoascus, and Gibberella but was highly significantly negatively correlated with Trichocladium and Mortierella. Tibetan barley was highly significantly positively correlated with Minimedusa, Humicola, Nectria, Fusarium, Myrmecridium, Chaetomium, Thermomyces, Conocybe, and Plectosphaerella but was highly significantly negatively correlated with Didymella. Weeds were highly significantly positively correlated with Eucasphialophora, Ramophialophora, Exophiala, Schizothecim, Geopora, Genabea, Helvella, Tetracladium, and Ampelomyces. Walnut was highly significantly positively correlated with Alternaria, Cryptocoryneum, and Lophiotrema but was highly significantly negatively correlated with Preussia. Wheat was highly significantly positively correlated with Fusicolla, Cylindrocarpon, Podospora, Cephaliophora, Lecythophora, Pseudeurotium, Pseudaleuria, and Splicoccozyma but was highly significantly negatively correlated with Solirubrobacter and Gemmata.
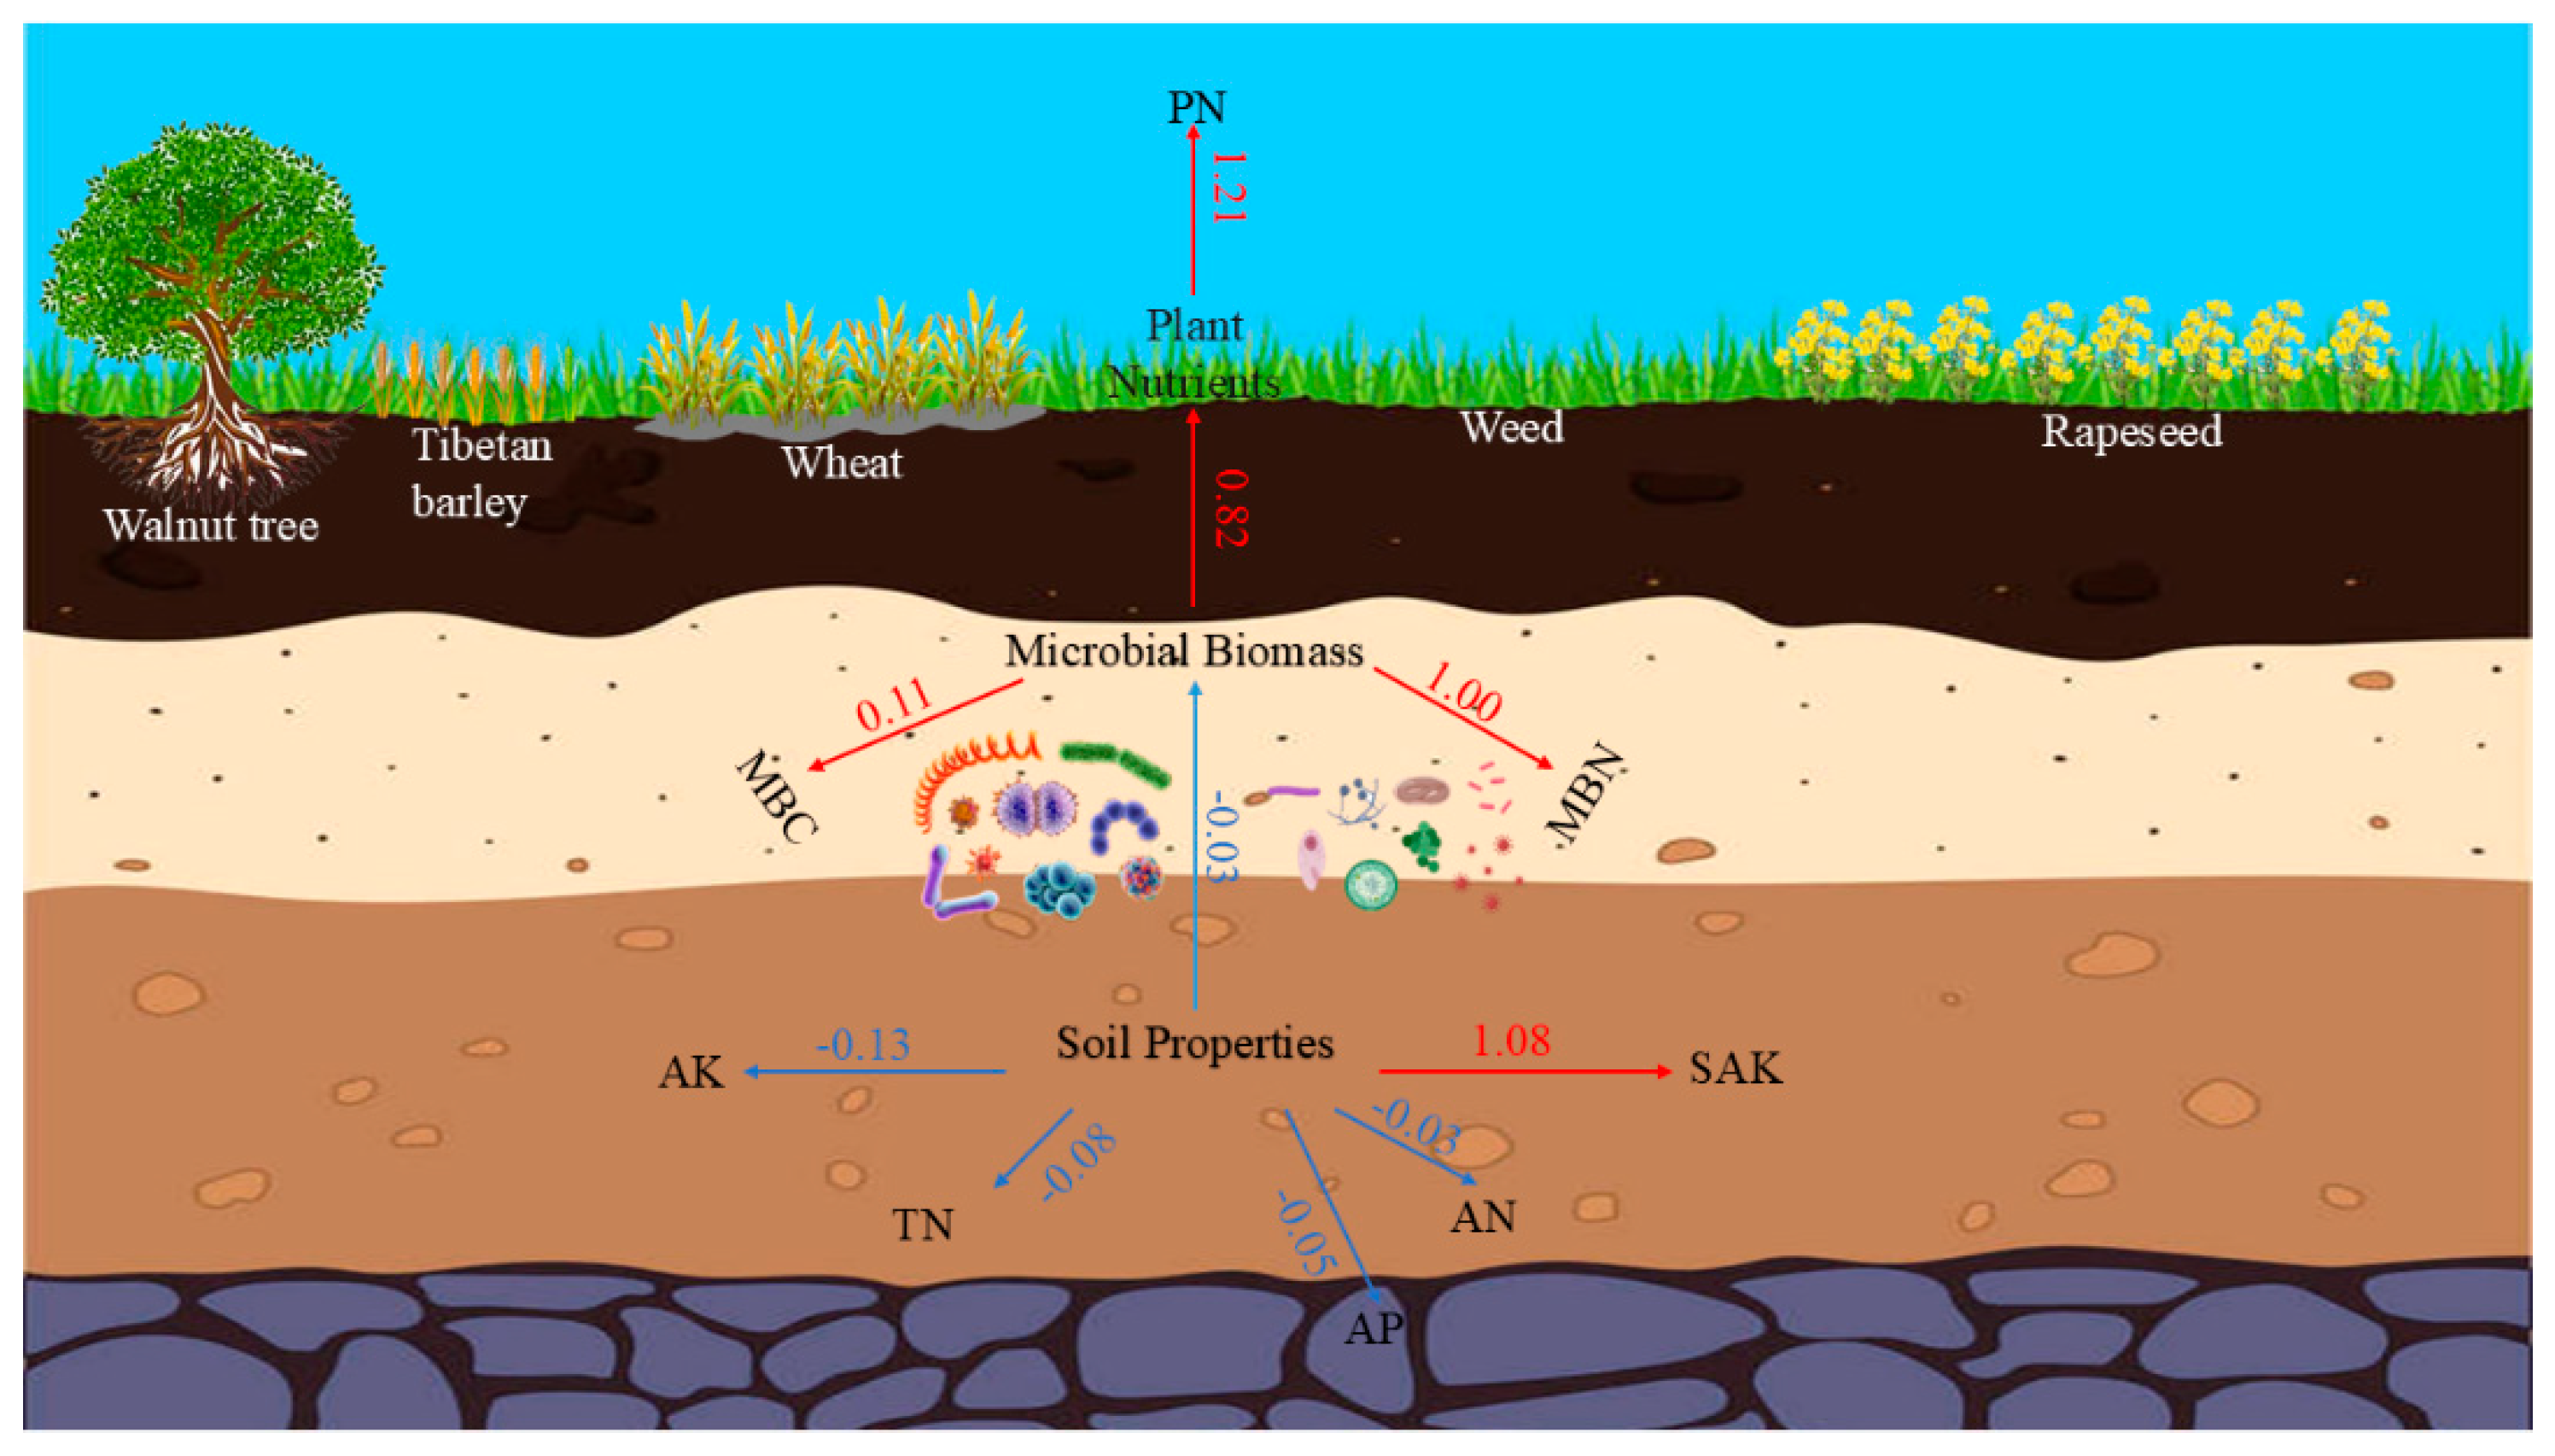
Figure 10 presents a conceptual diagram of land-use types as key drivers regulating soil properties and microbial community structure, which in turn affect plant nutrient acquisition and the entire soil–plant feedback mechanism. The schematic illustrates the multilevel effects of five typical land-use types (Tibetan barley, rapeseed, walnut trees, weeds, and wheat) on the soil ecosystem. The diagram depicts topsoil, subsoil, and bedrock layers and details a complex network of interactions among soil chemical properties (AK, TN, AN, AP, SAK), microbial biomass (MBC, MBN, MBP), and plant nutrients (PN, PP, PK). Plant nutrients and PN are positively correlated (correlation coefficient = 1.21), while soil properties are positively correlated with SAK (correlation coefficient = 1.08). The diagram also indicates the positive influence of microbial biomass on plant nutrients. Soil properties and AK are negatively correlated (correlation coefficient = −0.13), and microbial biomass is positively correlated with MBC and MBN (correlation coefficients of 0.11 and 1.00, respectively). Additionally, the cartoon microbe icons represent the diversity of the soil microbial community and its crucial role in the ecosystem.

4. Discussion

We examined the effects of different land-use types (Tibetan barley, rapeseed, walnut trees, weeds, and wheat) on soil chemical properties, microbial communities, and their interactions with plant nutrients in a southeastern Tibetan river valley. We confirmed that land-use type is a critical driver of soil ecosystem structure and function in alpine regions and further elucidated its specific and profound effects on soil nutrient cycling and microbial diversity. Our core discoveries offer a new perspective for understanding the adaptability and sustainability of vulnerable alpine ecosystems.
The pH range (7.32–7.91) across land-use types is consistent with the geochemical characteristics of soils of the Qinghai–Tibet Plateau. The significantly higher pH under Tibetan barley than that under other land-use types might be related to root exudates or fertilization practices [28]. Walnut tree cultivation significantly increased soil AP and MBP compared with those under other land-use types, which is consistent with previous research findings that long-term forest land use promotes soil P accumulation and activation [1,29]. Several mechanisms may explain this pattern. First, the deep root system of walnut trees can release organic acids and other root exudates that mobilize insoluble phosphates, thereby increasing P availability. Second, the relatively high litter quality of walnut, rich in labile organic matter, may accelerate P mineralization and provide substrates for microbial growth. Third, walnut trees are frequently associated with mycorrhizal fungi, which play a critical role in P solubilization and microbial biomass development. Last, the common practice of not tilling orchards reduces soil disturbance, allowing the gradual accumulation of available P and stabilization of microbial communities. The lowest SOM under walnut trees (38.9 g/kg) suggests a loss of carbon storage due to reduced vegetation cover, which is consistent with findings from forest conversion studies [1]. The deep root system of walnut trees may dissolve low levels of soluble phosphates through root exudates and collaborate with rhizosphere microbes to increase P availability, highlighting its key role in the P cycle [30,31,32,33,34,35]. The high P accumulation under walnut trees might increase P availability locally (Table 1), while the high N and K accumulation under rapeseed may lead to rapid consumption or enrichment of the two nutrients in soil. Rapeseed fields showed high PN and PK accumulation and supported the dominant fungal genus Tausonia. To our knowledge, there is currently no direct evidence that Tausonia is involved in K mobilization. The co-occurrence of high available K and Tausonia under rapeseed is more likely an indirect relation. A plausible explanation is that potassium fertilizer application, which is a common management practice in rapeseed cultivation, results in elevated soil K levels. The nutrient-rich environment created by fertilization may then favor fungal taxa such as Tausonia, which thrive under high nutrient availability. Additionally, the low microbial biomass carbon (MBC) under rapeseed cannot be attributed to climate, because all sites share the same conditions. The low MBC may instead be related to rapeseed-specific management and physiology. For example, rapeseed has high nutrient uptake, especially of N and K, which can reduce labile carbon substrates for microbial growth, while its root exudates may selectively favor certain microbial taxa but suppress overall microbial biomass. Intensive practices such as fertilization and soil disturbance may further influence microbial dynamics, contributing to lower MBC, this might be related to the high nutrient demand of rapeseed as a cash crop and its unique root exudates that recruit specific fungi [32]. Weeds also fostered a unique fungal community, with significant enrichment of the genus Helvella, this unique microbial community is likely driven by multiple factors. First, the lack of human management reduces disturbance, allowing microbial communities to establish and persist naturally. Second, the high plant diversity in weed-dominated fields may create a wider range of microhabitats and root exudates, which in turn support a more diverse microbial community. Thus, both reduced anthropogenic disturbance and increased niche heterogeneity likely contributed to the fungal enrichment. This might reflect the strong shaping effect of micro-environmental filtering on microbial community composition during natural succession without human disturbance [30].
The response of the microbial communities revealed complex interplay between diversity and composition. bacterial and fungal alpha diversity indices (e.g., Chao1 and Shannon) under wheat and Tibetan barley were significantly higher than those under other land-use types (bacterial Chao1 increased by 34.72% and 34.13%, and fungal Shannon increased by 9.97% and 3.55%, respectively), which might be linked to increased nutrient availability from agricultural management practices such as crop rotation and fertilization [34,35]. The lowest fungal richness and diversity under rapeseed could be attributed to the dominance of Tausonia (52%) (Figure 8b), a finding that extends previous observations on nitrogen-driven fungal specialization [36]. According to the Venn diagrams (Figure 6), the number of bacterial ASVs (472) common to the different land use types was greater than that of fungi (82), indicating stronger functional redundancy in bacteria. However, fungal specificity (e.g., Helvella accounting for 45% of total abundance under weeds) emphasized the role of habitat filtering [37]. This differentiation in the ecological roles of the two groups warrants further exploration under different land-use pressures.
Phylum- and genus-level shifts can provide mechanistic insights. The dominance of Proteobacteria and Actinobacteria reflected their adaptability to nutrient gradients. The significantly higher relative abundance of Proteobacteria under walnut might be related to their role in organic matter decomposition [5]. Among fungal phyla (Figure 7), Ascomycota had the highest relative abundance, followed by that of Basidiomycota, suggesting land-use type induced niche differentiation. The highest abundance of Mortierellomycota under walnut is consistent with its contribution to carbon sequestration, which is crucial for alpine soil stability [38]. At the genus level, the positive correlations between Tibetan barley and Conocybe (29%) and Humicola (15%) highlights their adaptation to alkaline soils, while the strong association of rapeseed with Tausonia (52%) is consistent with a nitrogen-rich niche [39,40]. Heatmap analysis (Figure 9) further revealed land-use specific microbial networks, providing a new framework for identifying key species in alpine soils.
The plant–soil–microbe feedback loop is a key finding of the study [41]. The highly significant positive correlations between walnut PN and soil TN and AN (p < 0.01, Figure 3) emphasize microbially mediated N cycling, possibly increased by ammonia-oxidizing groups such as Nitrososphaeraceae (7% in wheat, Figure 8) [42]. The significant positive correlation between leaf PP and MBP (p < 0.05) suggests a P-solubilizing mechanism is operating, while the positive correlation between leaf PK and pH (p < 0.01) reflects alkaline-soil driven bioavailability [42,43]. The RDA (Figure 4) and partial least squares path modeling (PLS-PM, Figure 10) further revealed that soil TN, AN, and SOM are key factors, explaining 93.5% of the variation in plant nutrients, thereby underscoring the importance of the microbe–soil–plant feedback mechanism. To guide readers through the conceptual model in Figure 11, we emphasize the key positive and negative pathways identified in our study. First, soil nutrient availability (TN, AN, SOM) positively influences microbial biomass and activity, which in turn increases plant nutrient uptake, reflecting a positive feedback loop. Second, high nutrient uptake by plants can modify soil nutrient pools, representing a plant-to-soil feedback. Third, certain land-use practices, such as fertilization or reduced disturbance, may indirectly affect microbial communities and soil nutrients, producing either positive or negative effects depending on the context. These pathways integrate our empirical findings with the conceptual model, clarifying how soil–microbe–plant interactions are shaped under different land-use types. The positive relations indicated by the red arrows in Figure 10 conceptual diagram, such as the promoting effect of soil properties on SAK and the positive effect of microbial biomass on plant nutrients, all support the view that the synergy between soil nutrient availability and microbial activity promotes plant growth [4,44,45,46]. Our study demonstrates that land-use patterns in a river valley in Southeast Tibet significantly reshape soil properties and microbial communities, with vegetation cover being a key driver of the changes. Walnut tree cultivation increased P availability and microbial abundance; rapeseed promoted N and K accumulation; and weeds supported a unique fungal community. These findings advance our understanding of global alpine soil ecology and provide information for sustainable land management. Future research should integrate long-term monitoring and molecular techniques to optimize these systems and increase climate resilience and ecological services.

5. Conclusions

We found showed that different land-use types in a southeastern Tibetan valley exerted significant and distinct influences on soil properties, microbial communities, and plant nutrients. Walnut cultivation enhanced phosphorus availability and microbial biomass and rapeseed promoted nitrogen and potassium accumulation and shaped specific fungal communities, while weeds supported unique fungal taxa. Tibetan barley and wheat increased soil microbial diversity. Overall, land-use type is a critical factor regulating soil–microbe–plant feedback mechanisms, and the results provide valuable references for agricultural practices and ecological management in alpine regions.

Supplementary Materials

The following supporting information can be downloaded at: https://www.mdpi.com/article/10.3390/agronomy15102317/s1, Figure S1. Dilution curves of bacteria (a) and fungi (b) in each treatment.

Author Contributions

Conceptualization, W.H.; Methodology, X.Z., W.H. and F.X.; Software, W.H.; Validation, J.Z.; Formal analysis, X.Z.; Investigation, W.H.; Resources, F.X. and J.Z.; Data curation, X.Z. and F.X.; Writing—original draft, X.Z. and J.L.; Writing—review and editing, J.L.; Visualization, F.X.; Supervision, J.Z.; Project administration, J.L.; Funding acquisition, J.Z. and J.L. All authors have read and agreed to the published version of the manuscript.

Funding

This work was supported in part by the Major Science and Technology Aid-Tibet Project of Hubei Province during the “14th Five-Year Plan” period (No. SCXX-XZCG-22016, Research on Walnut Industry Technology in the Tibetan Plateau).

Data Availability Statement

The data are contained within the article and Supplementary Materials.

Conflicts of Interest

The authors declare that they have no conflicts of interest.

References

  1. Bardgett, R.D.; van der Putten, W.H. Belowground biodiversity and ecosystem functioning. Nature 2014, 515, 505–511. [Google Scholar] [CrossRef]
  2. Fierer, N. Embracing the unknown: Disentangling the complexities of the soil microbiome. Nat. Rev. Microbiol. 2017, 15, 579–590. [Google Scholar] [CrossRef]
  3. Sun, Z.K.; Sun, C.Z.; Zhang, T.R.; Liu, J.; Wang, X.N.; Feng, J.; Li, S.C.; Tang, S.M.; Jin, K. Soil microbial community variation among different land use types in the agro-pastoral ecotone of northern China is likely to be caused by anthropogenic activities. Front. Microbiol. 2024, 15, 1390286. [Google Scholar] [CrossRef]
  4. Muñoz-Arenas, L.C.; Fusaro, C.; Hernández-Guzmán, M.; Dendooven, L.; Estrada-Torres, A.; Navarro-Noya, Y.E. Soil microbial diversity drops with land-use change in a high mountain temperate forest: A metagenomics survey. Environ. Microbiol. Rep. 2020, 12, 185–194. [Google Scholar] [CrossRef] [PubMed]
  5. Nottingham, A.T.; Fierer, N.; Turner, B.L.; Whitaker, T.J.; Ostle, N.J.; McNamara, N.P.; Bardgett, R.D.; Leff, W.J.; Salinas, N.; Silman, M.R.; et al. Microbes follow Humboldt: Temperature drives plant and soil microbial diversity patterns from the Amazon to the Andes. Ecology 2018, 99, 2455–2466. [Google Scholar] [CrossRef] [PubMed]
  6. Yang, Y.Y.; Zhou, Y.; Shi, Z.; Viscarra Rossel, R.A.; Liang, Z.Z.; Wang, H.Z.; Zhou, L.Q.; Yu, W. Interactive effects of elevation and land use on soil bacterial communities in the Tibetan Plateau. Pedosphere 2020, 30, 817–831. [Google Scholar] [CrossRef]
  7. Delgado-Baquerizo, M.; Maestre, F.T.; Reich, P.B.; Jeffries, T.C.; Gaitan, J.J.; Encinar, D.; Singh, B.K. Microbial diversity drives multifunctionality in terrestrial ecosystems. Nat. Commun. 2016, 7, 10541. [Google Scholar] [CrossRef]
  8. Wang, X.J.; Zhang, Z.C.; Yu, Z.Q.; Shen, G.F.; Cheng, H.F.; Tao, S. Composition and diversity of soil microbial communities in the alpine wetland and alpine forest ecosystems on the Tibetan Plateau. Sci. Total Environ. 2020, 747, 141358. [Google Scholar] [CrossRef]
  9. Choudhury, B.U.; Ansari, M.A.; Chakraborty, M.; Meetei, T.T. Effect of land-use change along altitudinal gradients on soil micronutrients in the mountain ecosystem of Indian (Eastern) Himalaya. Sci. Rep. 2021, 11, 14279. [Google Scholar] [CrossRef]
  10. Díaz-Vallejo, E.J.; Seeley, M.; Smith, A.P.; Marín-Spiotta, E. A meta-analysis of tropical land-use change effects on the soil microbiome: Emerging patterns and knowledge gaps. Biotropica 2021, 53, 738–752. [Google Scholar] [CrossRef]
  11. Yan, R.Y.; Zhao, X.M.; Li, P.H.; Si, Z.Y.; Gao, Y.; Li, J.F. Composition and Diversity of Soil Microbial Communities in Walnut Orchards at Different Altitudes in Southeastern Tibet. Land 2023, 12, 1419. [Google Scholar] [CrossRef]
  12. Vanegas-León, M.L.; Sulzbacher, M.A.; Rinaldi, A.C.; Roy, M.; Selosse, M.A.; Neves, M.A. Are Trechisporales ectomycorrhizal or non-mycorrhizal root endophytes? Mycol. Prog. 2019, 18, 1231–1240. [Google Scholar] [CrossRef]
  13. Zhao, G.; Wu, P.; Liu, F.; Li, S.Z.; Zhang, J.J.; Dang, Y.; Wang, L.; Wang, S.Y.; Cheng, W.L.; Cai, T.; et al. Plow layer management during the fallow season can enhance the wheat productivity and resource utilization in a semi-arid region. Soil Tillage Res. 2023, 228, 105633. [Google Scholar] [CrossRef]
  14. Cahanovitc, R.; Livne-Luzon, S.; Angel, R.; Klein, T. Ectomycorrhizal fungal mediate belowground carbon transfer between pines and oaks. ISME J. 2022, 16, 1420–1429. [Google Scholar] [CrossRef]
  15. Manirakiza, E.; Ziadi, N.; Hamel, C.; Levesque, V.; Antoun, H.; Karam, A. Soil microbial community dynamics after co-application of biochar and paper mill biosolids. Appl. Soil Ecol. 2021, 165, 103960. [Google Scholar] [CrossRef]
  16. Chen, S.; Zhang, Y.; Yang, Q.; Wang, H.; Li, Y.; Liu, Y.; Wu, J.; Cai, Z. Organic Fertilizer Substitution Enhances Soil Microbial Diversity and Rice Productivity in Paddy Systems. Soil Biol. Biochem. 2023, 185, 109144. [Google Scholar] [CrossRef]
  17. Zhao, J.H.; Chen, L.; Zhou, G.X.; Li, F.; Zhang, J.B.; Zhang, C.Z.; Ma, D.H.; Feng, B. Organic-inorganic fertilization promotes paddy soil macroaggregate organic carbon accumulation associated with key bacterial populations in subtropical China. Pedosphere 2024, 34, 941–950. [Google Scholar] [CrossRef]
  18. Ahmad, S.; Zhai, X.X.; Wang, M.R.; Shi, Y.J.; Chen, Y.M.; Liang, Q.M.; He, B.; Wen, R.H. Biochar amendments improve soil functionalities, microbial community and reduce Pokkah boeng disease of sugarcane. Chem. Biol. Technol. Agric. 2024, 11, 28. [Google Scholar] [CrossRef]
  19. Yang, Q.E.; Ma, X.D.; Li, M.C.; Zhao, M.S.; Zeng, L.S.; He, M.Z.; Deng, H.; Liao, H.P.; Rengsing, C.; Friman, V.P.; et al. Evolution of triclosan resistance modulates bacterial permissiveness to multidrug resistance plasmids and phages. Nat. Commun. 2024, 15, 3654. [Google Scholar] [CrossRef]
  20. Yan, T.; Xue, J.; Zhou, Z.; Wu, Y. Biochar-based fertilizer amendments improve the soil microbial community structure in a karst mountainous area. Sci. Total Environ. 2021, 794, 148757. [Google Scholar] [CrossRef]
  21. Mcbain, A.J.; Bartolo, R.G.; Catrenich, C.E.; Charbonneau, D.; Ledder, R.G.; Price, B.B.; Gilbert, P. Exposure of sink drain micro-cosmos to triclosan: Population dynamics and antimicrobial susceptibility. Appl. Environ. Microbiol. 2003, 69, 5433–54442. [Google Scholar] [CrossRef]
  22. Zhang, J.; Zhang, B.; Liu, Y.; Guo, Y.; Shi, P.; Wei, G. Distinct large-scale biogeographic patterns of fungal communities in bulk soil and soybean rhizosphere in China. Sci. Total Environ. 2018, 644, 791–800. [Google Scholar] [CrossRef]
  23. Jiang, M.; Liu, J.; Sun, H.; Chen, Q.; Jin, H.; Yang, J.; Tao, K. Soil microbial diversity and composition response to degradation of the alpine meadow in the southeastern Qinghai-Tibet Plateau. Environ. Sci. Pollut. Res. 2024, 31, 26076–26088. [Google Scholar] [CrossRef]
  24. Bai, Y.C.; Li, B.X.; Xu, C.Y.; Raza, M.; Wang, Q.; Wang, Q.; Wang, Q.Z.; Fu, Y.N.; Hu, J.Y.; Imoulan, A.; et al. Intercropping walnut and tea: Effects on soil nutrients, enzyme activity, and microbial communities. Front. Microbiol. 2022, 13, 852342. [Google Scholar] [CrossRef] [PubMed]
  25. Baruch, Z.; Liddicoat, C.; Laws, M.; Marker, L.K.; Morelli, H.; Yan, D.F.; Young, J.M.; Breed, M.F. Characterizing the soil fungal microbiome in metropolitan green spaces across a vegetation biodiversity gradient. Fungal Ecol. 2020, 47, 100939. [Google Scholar] [CrossRef]
  26. Shu, X.Y.; Hu, Y.F.; Liu, W.J.; Xia, L.L.; Zhang, Y.Y.; Zhou, W.; Liu, W.L.; Zhang, Y.L. Linking between soil properties, bacterial communities, enzyme activities, and soil organic carbon mineralization under ecological restoration in an alpine degraded grassland. Front. Microbiol. 2023, 14, 1131836. [Google Scholar] [CrossRef] [PubMed]
  27. Wu, C.L.; Luo, A.R.; Zhou, C.N. Variation characteristics of forest soil nutrients and their ecological stoichiometry in sejila mountains of southeast Tibet, China. Appl. Ecol. Environ. Res. 2023, 21, 681–697. [Google Scholar] [CrossRef]
  28. Toonen, J.; Francioli, D.; Hannula, S.E.; Bel, N.; van Bodegom, P.M.; Yang, X.; Bezemer, T.M. Mycorrhizal Fungi Mediate Carbon Transfer Between Tree Species in a Mixed Forest Ecosystem. New Phytol. 2023, 239, 186–198. [Google Scholar] [CrossRef]
  29. Liu, J.; Kang, L.Y.; Du, L.F.; Liao, S.Q.; Dong, W.; Ma, M.T.; Zou, G.Y.; Li, S.J. Distribution, Accumulation and Translocation of the Heavy Metal Cd in Various Varieties of Edible Rapeseed under Cd Stress. Sustainability 2024, 16, 2876. [Google Scholar] [CrossRef]
  30. Zhou, J.; Deng, Y.; Shen, Q.; Tu, C. Responses of soil microbial community composition and enzyme activities to land-use change in the eastern Tibetan Plateau, China. Forests 2019, 10, 483. [Google Scholar] [CrossRef]
  31. Ishizuka, S.; Hashimoto, S.; Kaneko, S.; Tsuruta, K.; Kida, K.; Aizawa, S.; Hashimoto, T.; Ito, E.; Umemura, M.; Shinomiya, Y.; et al. Soil Carbon Stock Change Due to Afforestation in Japan by Paired-Sampling Method in an Equivalent Mass Basis. Biogeochemistry 2021, 153, 263–281. [Google Scholar] [CrossRef]
  32. Jeffery, S.; van de Voorde, T.F.; Harris, W.E.; Mommer, L.; Van Groenigen, J.W.; De Deyn, G.B.; Ekelund, F.; Briones, M.J.; Bezemer, T.M. Biochar application differentially affects soil micro-, meso-macro-fauna and plant productivity within a nature restoration grassland. Soil Biol. Biochem. 2022, 174, 108789. [Google Scholar] [CrossRef]
  33. Zhang, Y.; Wang, X.; Pan, K.; Justine, M.F.; Zhao, F.; Olatunji, O.A.; Gong, Y.; Li, Y.; Chen, L.; Han, X.; et al. Unraveling Key Functional Bacteria across Land-Use Types on the Tibetan Plateau. Ecosyst. Health Sustain. 2023, 9, 020708. [Google Scholar] [CrossRef]
  34. Zhang, X.; Wang, H.; Li, M.; Wu, J.; Liu, Y.; Zhang, Y.; Zhao, H.; Cai, T.; Dang, Y.; Wang, L. Effects of Fallow Tillage Practices on Soil Properties and Wheat Yield in a Semi-Arid Region. Agric. Syst. 2024, 214, 103819. [Google Scholar] [CrossRef]
  35. Li, Y.; Zhang, Q.; Cai, Y.; Yang, Q.; Gao, C.; Chen, X.; Luo, Y.; Wang, Z. Soil Microbial Community Responses to Long-Term Tillage and Crop Rotation in a Subtropical Rice Ecosystem. Appl. Soil Ecol. 2021, 167, 104098. [Google Scholar] [CrossRef]
  36. Zhang, Y.; Wang, H.; Zhang, J.; Zhu, K.; Liu, L.; Chen, Y.; Li, J.; Wang, R. Effects of Potassium Fertilization on Rapeseed (Brassica napus L.) Yield and Nutrient Uptake under Drought Stress. Field Crops Res. 2022, 287, 108656. [Google Scholar] [CrossRef]
  37. Sun, H.; Jiang, J.; Wang, Y.; Zhang, Y.; Liu, Y.; Ma, Y.; Zhang, C. Soil Bacterial Community Response to Land-Use Change in Subtropical and Temperate Forests. Appl. Soil Ecol. 2023, 181, 104647. [Google Scholar] [CrossRef]
  38. Wang, Y.; Liu, L.; Yang, J.; Wang, H.; Zhang, Y.; Luo, Y.; Chen, X.; Gao, C. Soil Microbial Community Structure and Functioning in Response to Long-Term Organic and Inorganic Fertilization in a Rice-Wheat Cropping System. Appl. Soil Ecol. 2023, 182, 104705. [Google Scholar] [CrossRef]
  39. Gu, H.H.; He, Z.Y.; Lu, Z.F.; Liao, S.P.; Zhang, Y.Y.; Li, X.K.; Cong, R.H.; Ren, T. Growth and survival strategies of oilseed rape (Brassica napus L.) leaves under potassium deficiency stress: Trade-offs in potassium ion distribution between vacuoles and chloroplasts. Plant J. 2025, 121, e70009. [Google Scholar] [CrossRef]
  40. Dukunde, A.; Schneider, D.; Schmidt, M.; Veldkamp, E.; Daniel, R. Tree species shape soil bacterial community structure and function in temperate deciduous forests. Front. Microbiol. 2019, 10, 1519. [Google Scholar] [CrossRef]
  41. Govednik, A.; Potočnik, Ž.; Eler, K.; Suhadolc, M. Combined effects of long-term tillage and fertilisation regimes on soil organic carbon, microbial biomass, and abundance of the total microbial communities and N-functional guilds. Appl. Soil Ecol. 2023, 188, 104876. [Google Scholar] [CrossRef]
  42. Zumeaga, H.; Azcárate, F.M.; Concepción, E.D.; Hevia, V.; Díaz, M. Landscape and agri-environmental scheme effects on ant communities in cereal croplands of central Spain. Agric. Ecosyst. Environ. 2021, 312, 107345. [Google Scholar] [CrossRef]
  43. Zhang, M.; Liu, Y.; Wei, Q.; Liu, L.; Gu, X.; Gou, J.; Zhang, M.; Wang, Y.; Zhou, Z. Biochar Amendment Enhances Soil Microbial Diversity and Function in a Degraded Karst Ecosystem. Appl. Soil Ecol. 2022, 178, 104568. [Google Scholar] [CrossRef]
  44. Jarecke, K.M.; Loecke, T.D.; Burgin, A.J. Coupled soil oxygen and greenhouse gas dynamics under variable hydrology. Soil Biol. Biochem. 2016, 95, 164–172. [Google Scholar] [CrossRef]
  45. Sharma, P.; Singh, R.; Kumar, S.; Laishram, J.; Meetei, T.T.; Das, A.; Choudhury, B.U. Soil Micronutrient Dynamics and Stocks Under Land-Use Change in the Subtropical Foothills of Eastern Himalaya. Geoderma 2023, 429, 116255. [Google Scholar] [CrossRef]
  46. Sharma, A.; Kumar, S.; Pandey, A.; Thakur, A.; Kaur, S. Rhizospheric Microbial Diversity and Plant Growth-Promoting Bacteria for Sustainable Agriculture in Himalayan Agroecosystems. Microbiol. Res. 2021, 252, 126860. [Google Scholar] [CrossRef]
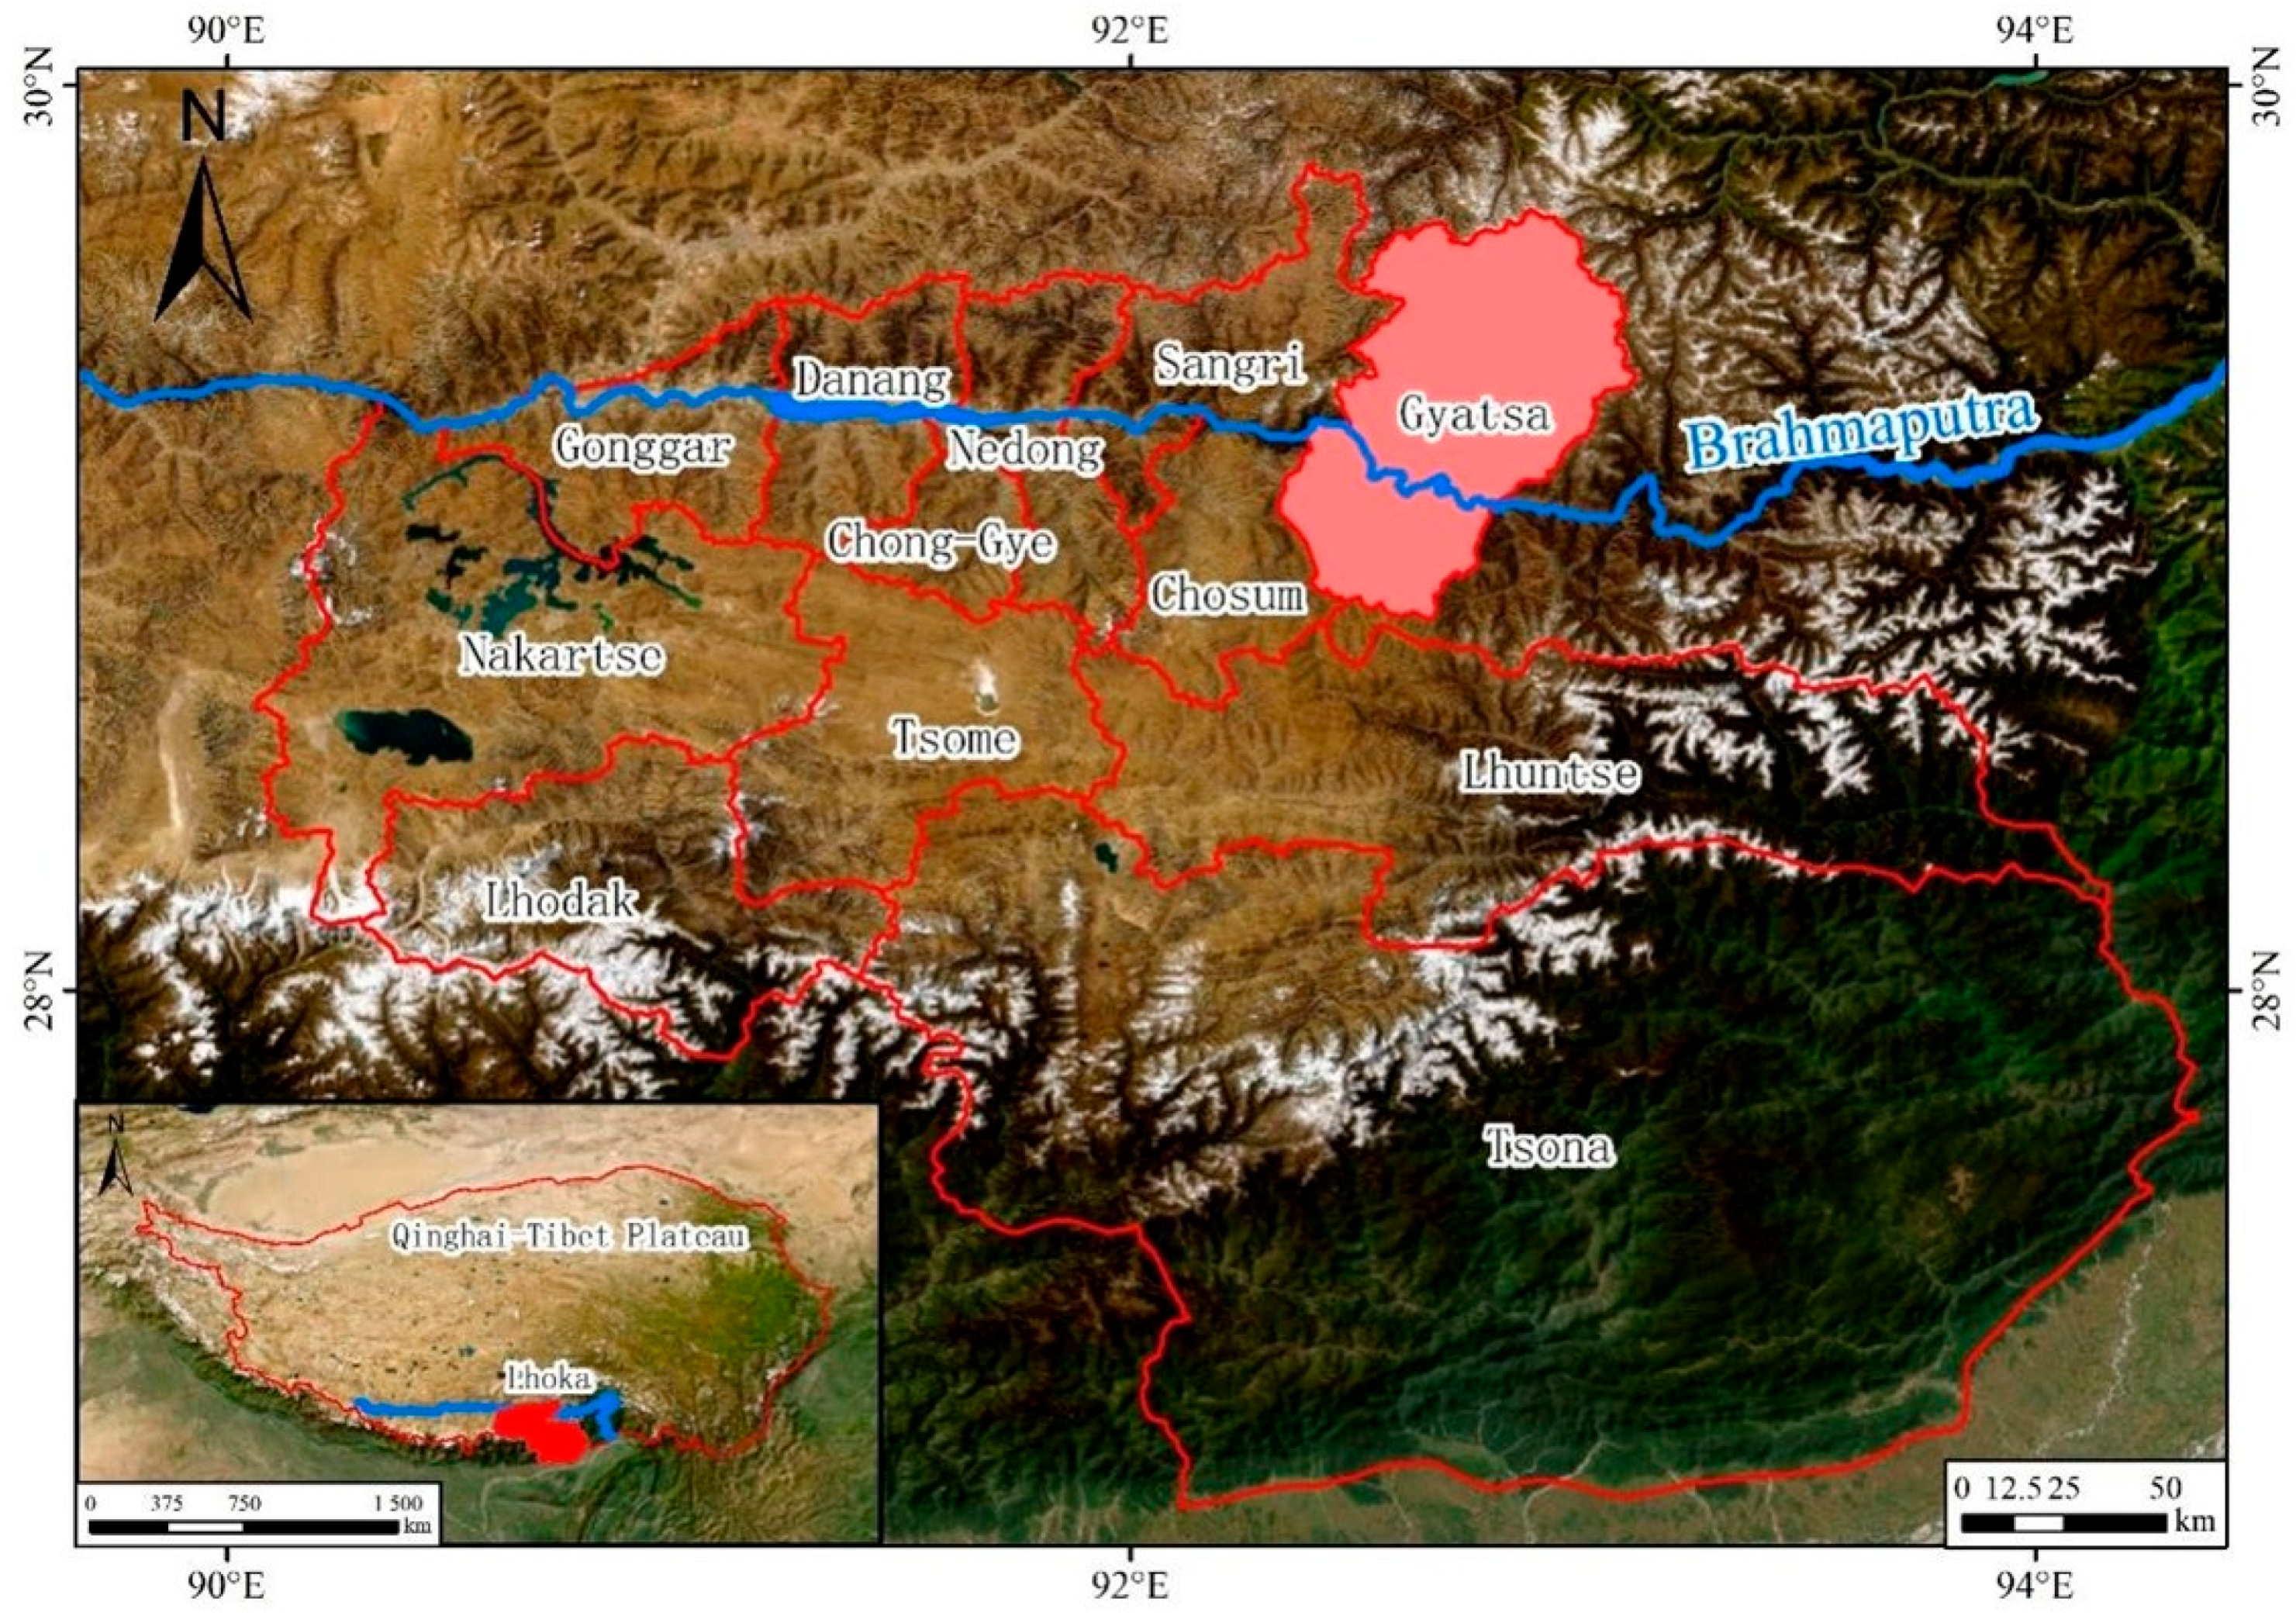
Figure 1. Distribution of sampling points in the Brahmaputra River.
Agronomy 15 02317 g001
Figure 2. Land use types sampled for soil biological and chemical properties.
Agronomy 15 02317 g002
Figure 3. Effects of land use types on leaf nutrients. Note: PN: plant total nitrogen, PP: plant total phosphorus; PK: plant total potassium (PK). Treatments with different lowercase letters are significantly different at the 0.05 significance level.
Agronomy 15 02317 g003
Figure 4. Correlation analysis of soil properties and plant nutrients. Note: PN: plant total nitrogen; PP: plant total phosphorus; PK: plant total potassium; SOM: soil organic matter; TN: soil total nitrogen; AN: soil available nitrogen; AP: soil available phosphorus; AK: soil available potassium; SAK: soil slowly available potassium; MC: soil microbial biomass carbon; MN: soil microbial biomass N; MP: soil microbial biomass P. * p < 0.05 and ** p < 0.01. Each column represents a treatment, and each row represents a taxonomic level. The color depth indicates the relative abundance, ranging from low to high. Only includes walnut plots, not across all land-use types.
Agronomy 15 02317 g004
Figure 5. Redundancy analysis (RDA) of soil properties and plant nutrients. Note: PN: plant total nitrogen; PP: plant total phosphorus; PK: plant total potassium; SOM: soil organic matter; TN: soil total nitrogen; AN: soil available nitrogen; AP: soil available phosphorus; AK: soil available potassium; SAK: soil slowly available potassium; MBC: soil microbial biomass carbon; MBN: soil microbial biomass N; MBP: soil microbial biomass P. Red lines represent soil properties, and blue lines represent plant nutrients.
Agronomy 15 02317 g005
Figure 6. Principal co-ordinates analysis (PCoA) analysis to determine beta diversity of (a) bacterial and (b) fungal communities under different land-use types.
Agronomy 15 02317 g006
Figure 7. Venn diagrams based on numbers of amplicon sequence variants in (a) bacterial and (b) fungal communities under different land-use types.
Agronomy 15 02317 g007
Figure 8. Relative abundance of phyla in (a) bacterial and (b) fungal communities under different land-use types.
Agronomy 15 02317 g008
Figure 9. Relative abundance of genera in (a) bacterial and (b) fungal communities under different land-use types.
Agronomy 15 02317 g009
Figure 10. Heatmap analysis of dominant genera in (a) bacterial and (b) fungal communities under different land-use types.
Agronomy 15 02317 g010
Figure 11. Partial least squares path analysis of the effects of land use types on soil nutrients and soil microbes in a river valley in southeastern Tibet. Note: Red arrows indicate a positive relation or promotion, while blue arrows represent a negative relation or inhibition.
Agronomy 15 02317 g011
Table 1. Effects of land use types on soil chemical properties.
pHSOM (g/kg)TN (g/kg)AN (mg/kg)AP (mg/kg)AK (mg/kg)SAK (mg/kg)MBP (mg/kg)MBC (mg/kg)MBN (mg/kg)
Tibetan barley7.91 a40 b0.06 b297.3 d8.43 d72.1 d1031.9 c23.8 c12.9 b50.3 d
Rapeseed7.38 c47 a0.04 c361 c24.43 b229.4 a1006.2 cd23.2 c8 c142.6 c
Walnut trees7.42 b38.9 c0.06 b398.9 a48.73 a194.8 b1126.2 b55.9 a8.3 c36.3 d
Weeds7.34 d48.1 a0.07 a369.6 b16.16 c189.2 c1158.6 b28.6 b13.7 b243.2 b
Wheat7.32 d40.3 b0.03 d352 d17.75 c212.4 b1843.9 a27.3 b24.8 a422.1 a
Note: SOM: soil organic matter; TN: total nitrogen; AN: available nitrogen; AP: available phosphorus; AK: available potassium; SAK: slowly available potassium; MBP, soil microbial biomass P; MBC, soil microbial biomass C; MBN, soil microbial biomass N. Treatments with different lowercase letters in the same column are significantly different at the 0.05 significance level.
Table 2. Alpha diversity indices of bacteria and fungi in different land use types.
SampleRichnessDiversityCoverage
Chao1SpeciesSimpsonShannon
BacteriaTibetan barley3911 a3880 ab0.9984 a10.75 ab0.9985 a
Rapeseed3411 c3400 d0.9976 a10.53 d0.9993 a
Walnut trees3753 b3719 c0.9986 a10.79 a0.9985 a
Weeds2895 d2889 e0.9979 a10.36 e0.9996 a
Wheat3920 a3894 a0.9983 a10.67 c0.9986 a
FungiTibetan barley755 a745 ab0.9742 b6.738 b0.9995 a
Rapeseed482 e474 d0.8885 e4.897 e0.9996 a
Walnut trees733 c723 b0.9732 bc6.538 c0.9995 a
Weeds636 d636 c0.9475 d6.502 cd0.9999 a
Wheat773 ab767 a0.9801 a7.156 a0.9997 a
Note: Treatments with different lowercase letters in the same column are significantly different at the 0.05 significance level.
Disclaimer/Publisher’s Note: The statements, opinions and data contained in all publications are solely those of the individual author(s) and contributor(s) and not of MDPI and/or the editor(s). MDPI and/or the editor(s) disclaim responsibility for any injury to people or property resulting from any ideas, methods, instructions or products referred to in the content.