Article

The Impact of Natural Factors on Net Primary Productivity in Heilongjiang Province Under Different Land Use and Land Cover Changes

1
School of Water Conservancy and Civil Engineering, Northeast Agricultural University, Harbin 150030, China
2
International Cooperation Joint Laboratory of Health in Cold Region Black Soil Habitat of the Ministry of Education, Harbin 150030, China
*
Authors to whom correspondence should be addressed.
Agronomy 2025, 15(10), 2304; https://doi.org/10.3390/agronomy15102304
Submission received: 27 August 2025 / Revised: 26 September 2025 / Accepted: 28 September 2025 / Published: 29 September 2025

Abstract

Net primary productivity (NPP) is a vital indicator of carbon sequestration and ecosystem resilience. However, the dynamics of NPP across different land use types and especially the interactive function of natural drivers remain insufficiently quantified in regions with significant land use change. Therefore, this study selected Heilongjiang Province in China as the research area. Utilizing multi-source data from 2001 to 2022, it identified the primary land use types, analyzed the mean values and trends of vegetation NPP for each type, and quantified the driving effects of natural factors on NPP across these land types. Results show that forests had the highest mean NPP (514.01 gC m−2·a−1) and shrub–grass–wetland composites the lowest (269.2 gC m−2·a−1); cropland-to-forest transitions boosted NPP most notably. Critically, precipitation–temperature interactions dominated NPP variation, while elevation acted mainly through modulating other factors. This study offers a strategic framework for spatial planning and ecosystem management, supporting climate mitigation and carbon sequestration policies.

1. Introduction

Terrestrial ecosystems are integral to the global carbon cycle, with vegetation serving as both an indicator of ecosystem health and a mediator of energy and material fluxes [1]. Net Primary Productivity (NPP), which measures the amount of carbon fixed by vegetation per unit area and time, is a key metric for assessing ecosystem carbon sequestration capacity [2]. As a key determinant of photosynthetic output in terrestrial ecosystems, NPP offers critical insight into carbon flux dynamics and allows for comparative analysis of regional ecosystem performance [3]. Spatiotemporal analysis of NPP variability thus serves as an effective proxy for understanding land system changes and assessing ecosystem integrity [4]. This study establishes a theoretical foundation for clarifying regional carbon dynamics, supporting ecosystem restoration, and guiding sustainable land use policies aimed at climate change mitigation.
Recent years have seen extensive research on NPP at the global and regional scales, with widespread focus on its relationships with climatic, hydrological, and topographic factors [5]. In terms of climate change, temperature and precipitation jointly shape the spatiotemporal patterns of NPP. Temperature primarily influences vegetation photosynthesis and respiration rates, while precipitation affects water availability [6,7]. Notably, NPP responses to climatic factors exhibit significant spatial heterogeneity. Studies have shown that tropical regions are more sensitive to extreme precipitation, whereas high-latitude and high-altitude areas in the Northern Hemisphere respond more strongly to temperature variations [8,9,10]. Among hydrological elements, evapotranspiration and soil moisture content are key variables influencing NPP [11]. Evapotranspiration affects vegetation water use efficiency by regulating surface energy balance and water dissipation processes [12], while soil moisture participates directly in plant physiological activities, such as maintaining turgor pressure and supporting root water uptake, thereby indirectly modulating NPP [13]. Beyond climate and hydrology, topography also significantly affects NPP by altering hydrothermal conditions and soil properties. The increase in elevation causes a decrease in temperature and changes in precipitation patterns, which, for instance, act as major constraints on the NPP of mountainous vegetation [14]. These studies frequently employ multisource remote sensing data such as MODIS, models based on physiological processes, and data fusion techniques [15], which together provide robust methodological support for large-scale NPP analysis.
Existing studies have extensively investigated the relationship between NPP and climate change [16,17,18,19], yet two major limitations remain. First, most research has focused on regional-scale NPP while overlooking differences in vegetation community structure across land use types such as cropland, forest, and grassland, as well as their distinct sensitivities to climatic, hydrological, and topographic factors. Second, there is a lack of systematic analysis on the quantitative relationships between NPP and natural drivers—including mean annual temperature, precipitation, evapotranspiration, soil moisture, and elevation—under specific land use types in Heilongjiang Province, a critical grain production base and ecological barrier zone. Against the backdrop of global warming, which is exacerbating ecosystem instability in cold regions and increasing the frequency of extreme climate events [20], the dynamics of vegetation NPP in Heilongjiang Province directly influence regional carbon sink capacity, food security, and ecosystem service provision. Therefore, quantitatively analyzing the spatial dynamics of vegetation NPP under major land use types and their responses to natural drivers is essential for addressing the research gap on land-type-specific NPP mechanisms in cold regions, assessing ecosystem quality, and supporting targeted land management strategies.
Based on this context, the present study selects Heilongjiang Province as the research area and focuses on five natural factors: mean annual temperature, annual precipitation, evapotranspiration, soil moisture, and elevation. By integrating MODIS-based land use and land cover change (LUCC) and NPP data from 2001 to 2022, we aim to (1) identify and classify the major land use types in Heilongjiang Province; (2) quantify and compare the average NPP and its changing trends across different land use types; and (3) apply the Optimal Parameter-based Geographical Detector to quantify the influence of natural factors on vegetation NPP under each land use type. The findings are expected to provide a scientific basis for formulating targeted land management policies, assessing terrestrial ecosystem carbon sink potential, and supporting climate adaptation strategies in Heilongjiang Province.

2. Materials and Methods

2.1. Study Area

Heilongjiang Province, which is situated in the northeast of China, stretches from 121°11′ E to 135°05′ E, and between 43°26′ N and 53°33′ N. The region exhibits a cold temperate to temperate continental monsoon climate. Precipitation is notably lower in the western and northern regions. The landscape features prominent highlands in the northwest, north, and southeast, contrasting with low-lying areas in the northeast and southwest sections. Altitudes vary from 25 to 1623 m, with the landscape mainly consisting of plains and hills. Heilongjiang Province is rich in natural resources and has diverse land use types, showing significant spatial heterogeneity across its landscape (Figure 1). Farmland is predominantly distributed in two key regions: the Sanjiang Plain to the east and the Songnen Plain to the southwest. Serving as critical ecological buffers within terrestrial carbon cycling systems, arboreal ecosystems demonstrate concentrated geographic distribution within the western sector of the Lesser Khingan massif and the northern reaches of the Changbai Mountain range, exhibiting significant biogeographic clustering patterns. Anthropogenic surface modifications and adjacent ecologically sensitive zones, including palustrine ecosystems and graminoid-dominated systems, demonstrate predominant distribution across the Songnen Plain’s southwestern quadrant, revealing distinct terrestrial surface configuration patterns in this provincial administrative division.
Given its central role in China’s “Two Barriers and Three Belts” ecological security strategy as a core area of the “Northeast Forest Belt,” its status as a climate-sensitive region and important carbon sink, and its critical functions in water conservation and biodiversity preservation [21], an in-depth study of this region is of great significance. As a critical biogeographic buffer within China’s northern biogeopolitical transition zone, Heilongjiang’s ecological stewardship is essential for maintaining national environmental integrity, safeguarding agricultural production sustainability, and advancing regional development equilibrium [22]. This strategic positioning necessitates scholarly investigation into developing adaptive socio-ecological governance frameworks capable of addressing the province’s complex environmental–climatic pressures and transitional economic development imperatives [23].

2.2. Data

2.2.1. LUCC and NPP

The land use and land cover change (LUCC) data for the period 2001–2022 were obtained from the MODIS global land cover product MCD12Q1 [24] provided by the NASA EOSDIS LP DAAC in Sioux Falls, South Dakota, USA. This dataset has a spatial resolution of 500 m. The product adopts the International Geosphere-Biosphere Programme (IGBP) classification scheme, which includes 17 land cover types (Table A1). While the IGBP system provides detailed primary classification, it increases data processing complexity and may obscure macro-level trends—an important consideration given our focus on large-scale LUCC dynamics.
To more clearly identify the macro-level changes in dominant land cover types, we simplified the original 17 IGBP classes into six broad categories, following the reclassification approach proposed by Jing et al. [25] and considering type descriptions in both MCD12Q1 and the ESACCI-LC product. The six consolidated types are: Cropland, Forest, Shrub–grass–wetland complex (SGO), Urban, Bare area, and Water bodies (WIS), as summarized in Table A2. This reclassification helps reduce redundancy while retaining ecologically meaningful categories appropriate for regional-scale analysis in Heilongjiang Province.
The NPP data employed in this study were obtained from the Chinese MYD17A3H NPP dataset, accessible via the Google Earth Engine (GEE) platform (https://code.earthengine.google.com/). The dataset is sourced from the National Aeronautics and Space Administration (NASA) and the United States Geological Survey (USGS) in the USA. The dataset adopts the GCS_WGS_1984 coordinate system, has a spatial resolution of 500 m, and uses gC·m−2·a−1 as its unit. This product is derived from MODIS sensor data and is estimated using a light use efficiency model. It features high interannual temporal resolution and strong global consistency, making it widely applicable in ecosystem productivity studies.

2.2.2. Impact Factor Dataset

Natural factors including elevation (EL), evapotranspiration (ET), mean annual precipitation (MAP), mean annual temperature (TEMP), and soil moisture content (SMC) were selected as influencing factors of vegetation NPP. The data sources of each factor are summarized in Table 1.
All datasets were resampled to 1 km spatial resolution, projected to the same geographic coordinate system, and masked to the study area boundary to ensure spatial consistency and comparability.

2.3. Methods

2.3.1. Identification of Study Land Use Types

The temporal change of LUCC and NPP from 2001 to 2022 in Heilongjiang Province was studied with ArcGIS 10.8. Time paths were represented by assigning a trajectory code to every pixel in the grid. The methodology is as follows: five time points—2001, 2006, 2011, 2016, and 2022—were selected, and the reclassified land use types were processed through raster calculations to derive a unique trajectory code for each pixel. Each digit in the trajectory code represents LUCC classification for a specific pixel at a given time point [26]. This approach delineates the land use or land cover classification for individual pixels across distinct time points while also capturing temporal trends in land use changes throughout the sequence. For every pixel, the path code was determined by the formula below:
T x y = ( G 1 ) x y × 10   n 1 + ( G 2 ) x y × 10   n 2 + + ( G n ) x y × 10   n n
Txy represents the trajectory code assigned to a pixel at row x and column y in the trajectory layer, and it does not hold mathematical significance. The parameter n denotes the number of time nodes, which is set to n = 5. Additionally, (Gn)xy represents the LUCC classification codes for each time node at the given pixel location.
Among all possible trajectories, if the land use/cover type codes remain consistent across all time steps (e.g., 11111, 22222, 33333), this indicates that the land use type for that pixel has remained unchanged. On the other hand, other trajectory codes (e.g., 12223, 21111, 32222) suggest that the land use or cover classification of the pixel has varied throughout the time period. For instance, the code 21111 reflects a transition from forestland to cropland at the second time step, with the pixel remaining as cropland from the third to the fifth time step. Through the calculation of trajectory codes for each pixel, a map illustrating the distribution of land use trajectories across the study area is created. This approach facilitates the analysis and quantification of LUCC within the study area, enabling the identification of predominant dynamic and stable land use classifications.

2.3.2. Spatiotemporal Trends in NPP Changes

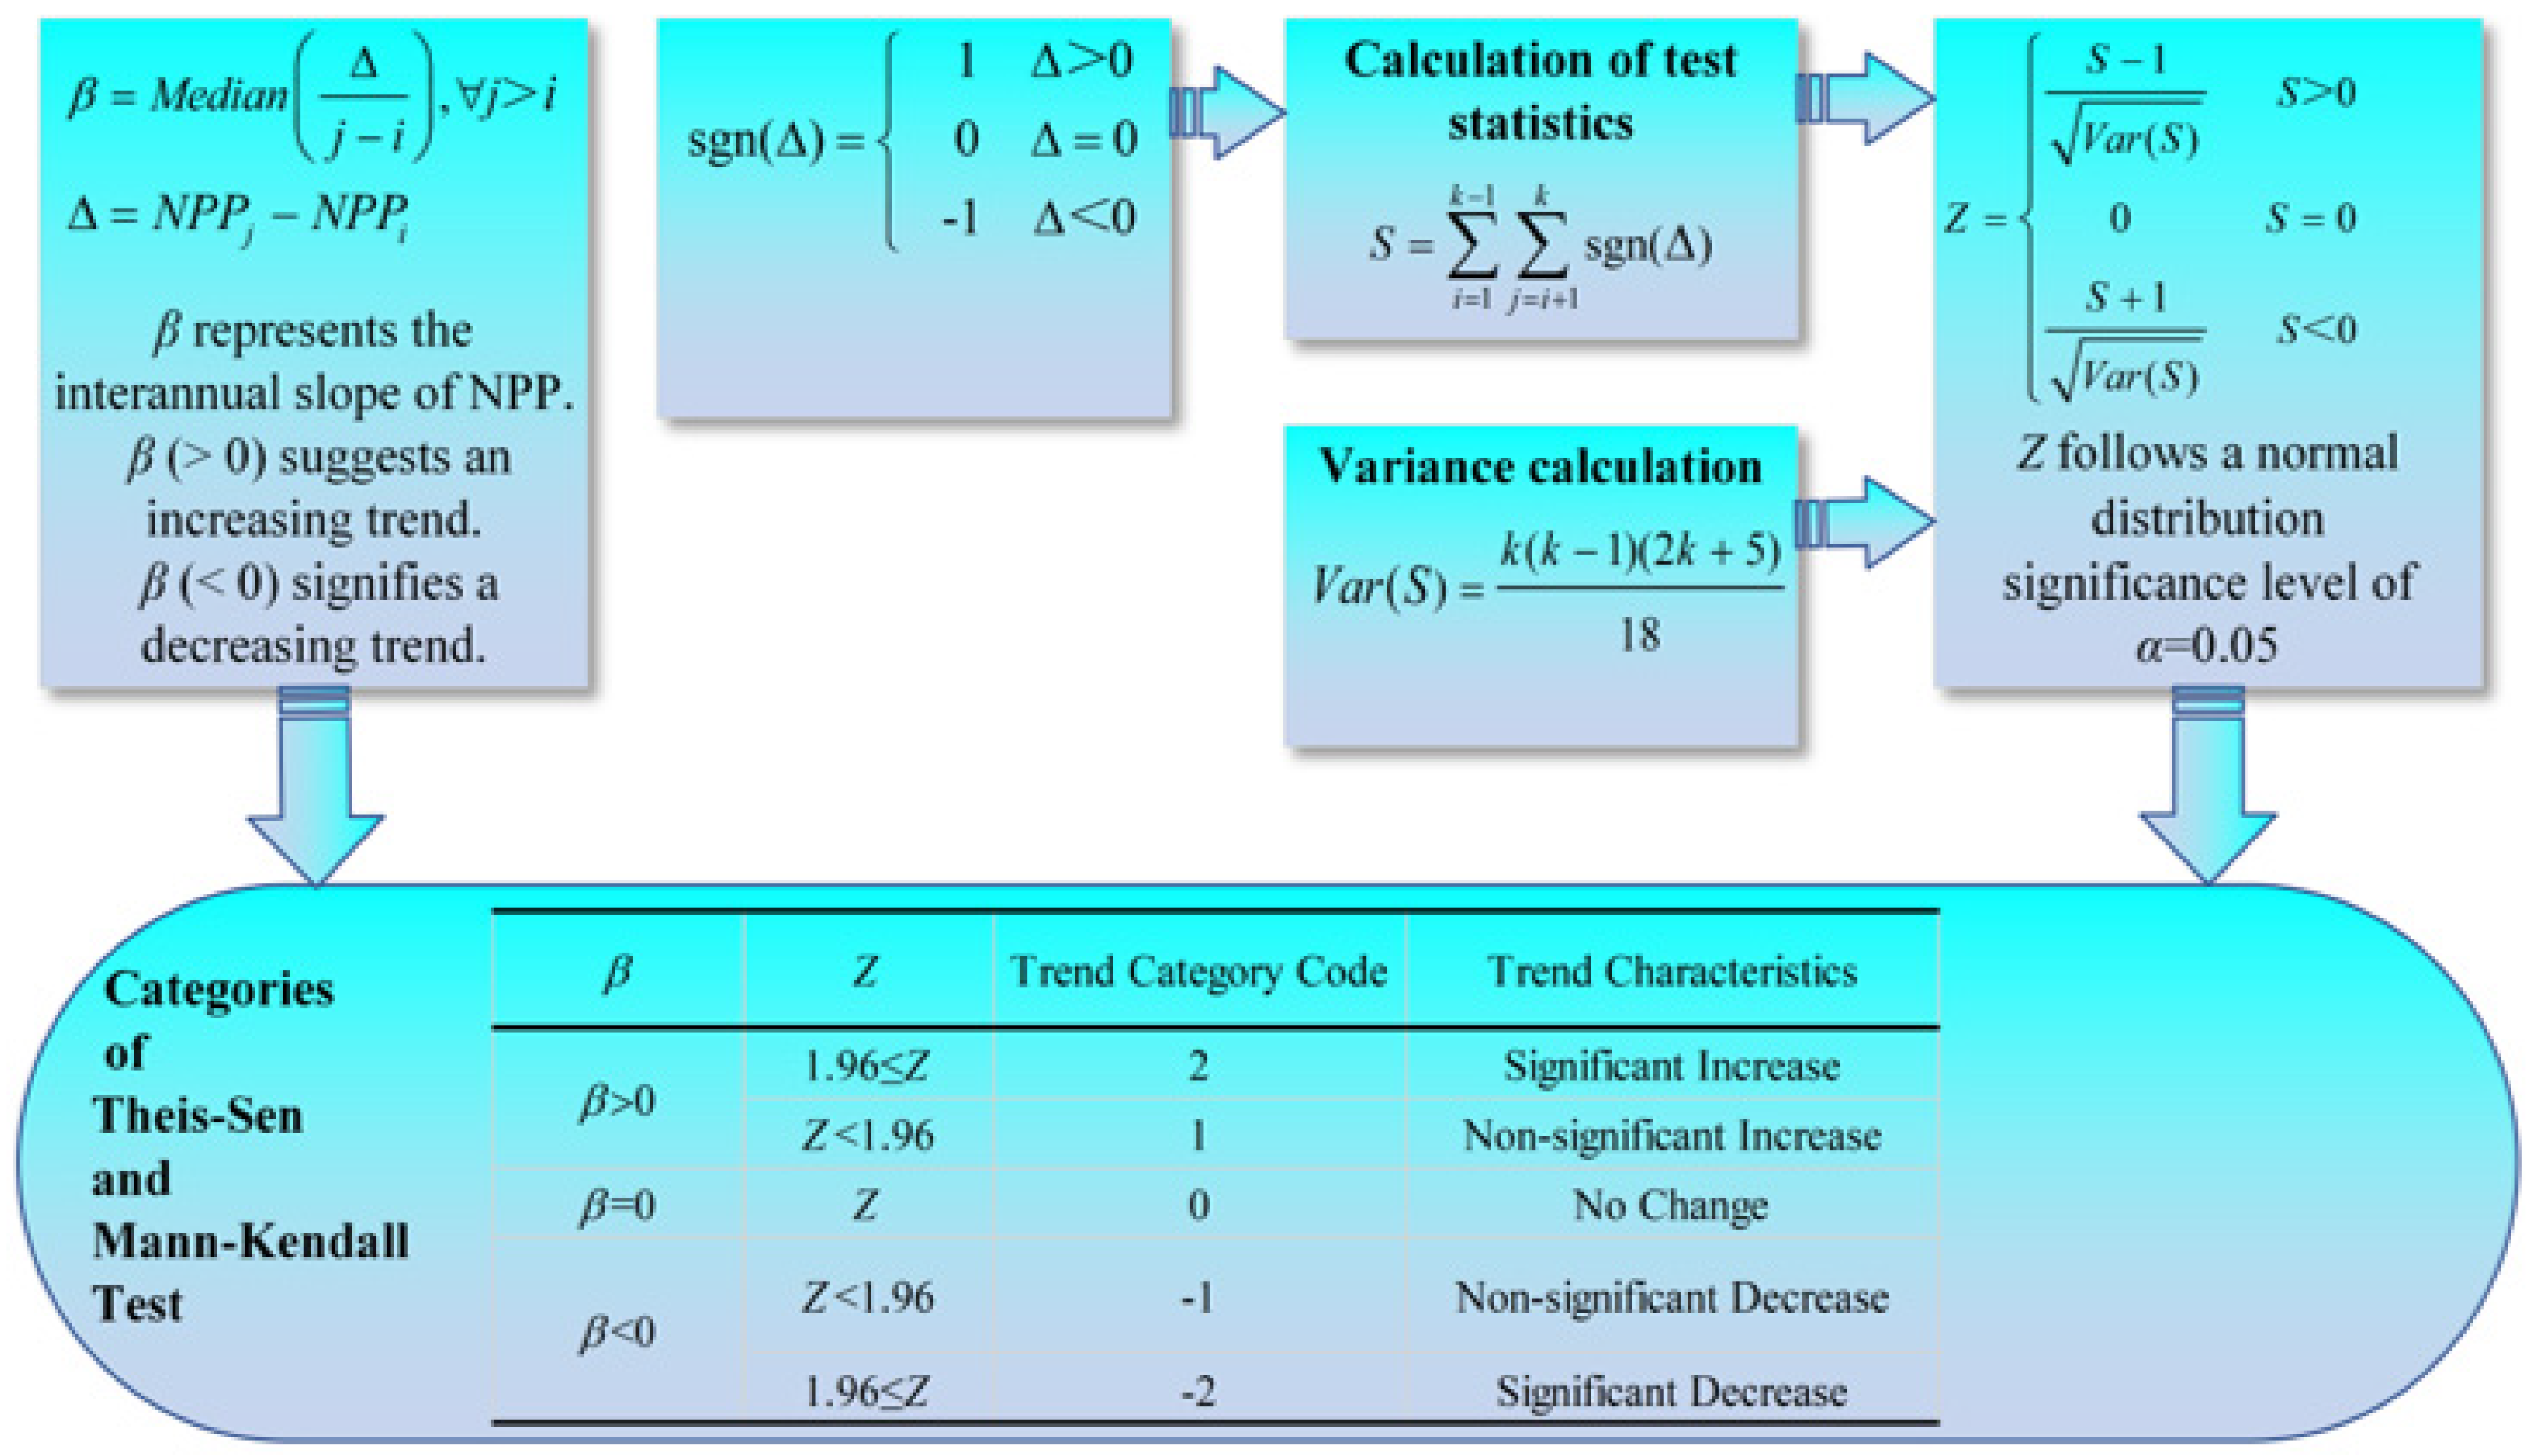
This study applied the Theil–Sen Median estimator to evaluate pixel-based trends in NPP throughout Heilongjiang Province between 2001 and 2022. Following this, the Mann–Kendall test was used to determine the statistical significance of the identified trends. These methods combine to provide a solid basis for studying long-term patterns in time series data. What’s important is that they do not have to assume a particular pattern of data, and they are especially efficient at minimizing the effect of the data’s outliers [27]. The computation procedure for the combination of these two approaches is illustrated in Figure A1.
Based on the experimental results, the NPP tendency of Heilongjiang Province between 2001 and 2022 was calculated as a 5-by-5 km grid. The values from each grid were then extracted as point data. Finally, NPP trends are summed up according to designated land use types within the research region.

2.3.3. Detection of Impact Factors on NPP

Geographical Detector is an instrument for analysis of spatial variation and identification of underlying drivers [28]. Traditional Geographical Detector methods depend on random numbers of sequential variables, resulting in sub-optimal results. In order to address this issue, we use an improved Geographical Detector model proposed by Song et al. [29], which incorporates optimum parameters. In this study, we have applied differential, factor detection, and interaction methods to determine and evaluate the major impact factors of NPP for different land use.
Differential and Factor Detector a statistical technology which can evaluate the extent to which a particular element can affect the spatial variability of NPP [30]. The calculation formula is presented as follows:
q = 1 1 N σ 2 h = 1 L N h σ h 2
In the formula, q measures the degree to which a specific factor accounts for the spatial variation in NPP, with values between 0 and 1. A larger q value indicates a stronger explanatory capacity of the factor, and vice versa. Here, N denotes the total number of samples, σ2 denotes the overall variance of NPP, and h represents the stratification of natural factors X or NPP. Additionally, Nh refers to the number of samples in stratum h, and σ h 2 corresponds to the variance of natural factors within stratum h.
Furthermore, based on Muller’s classification of correlation strength [31], the explanatory power of each factor is categorized into four levels: no explanatory power (q < 0.1), weak explanatory power (0.1 ≤ q < 0.3), moderate explanatory power (0.3 ≤ q < 0.5), and strong explanatory power (q ≥ 0.5). This categorization provides a clear and systematic approach for evaluating the impact of different factors on the spatial variability of NPP.
The interaction detector is used to assess whether the combined effect of multiple factors enhances or reduces their explanatory capacity regarding NPP, or whether these factors function independently without influencing each other. The criteria for determining interaction effects are presented in Table 2. This analysis elucidates the relationships among various factors and their combined influence on the variability of NPP.

2.4. Research Workflow Chart

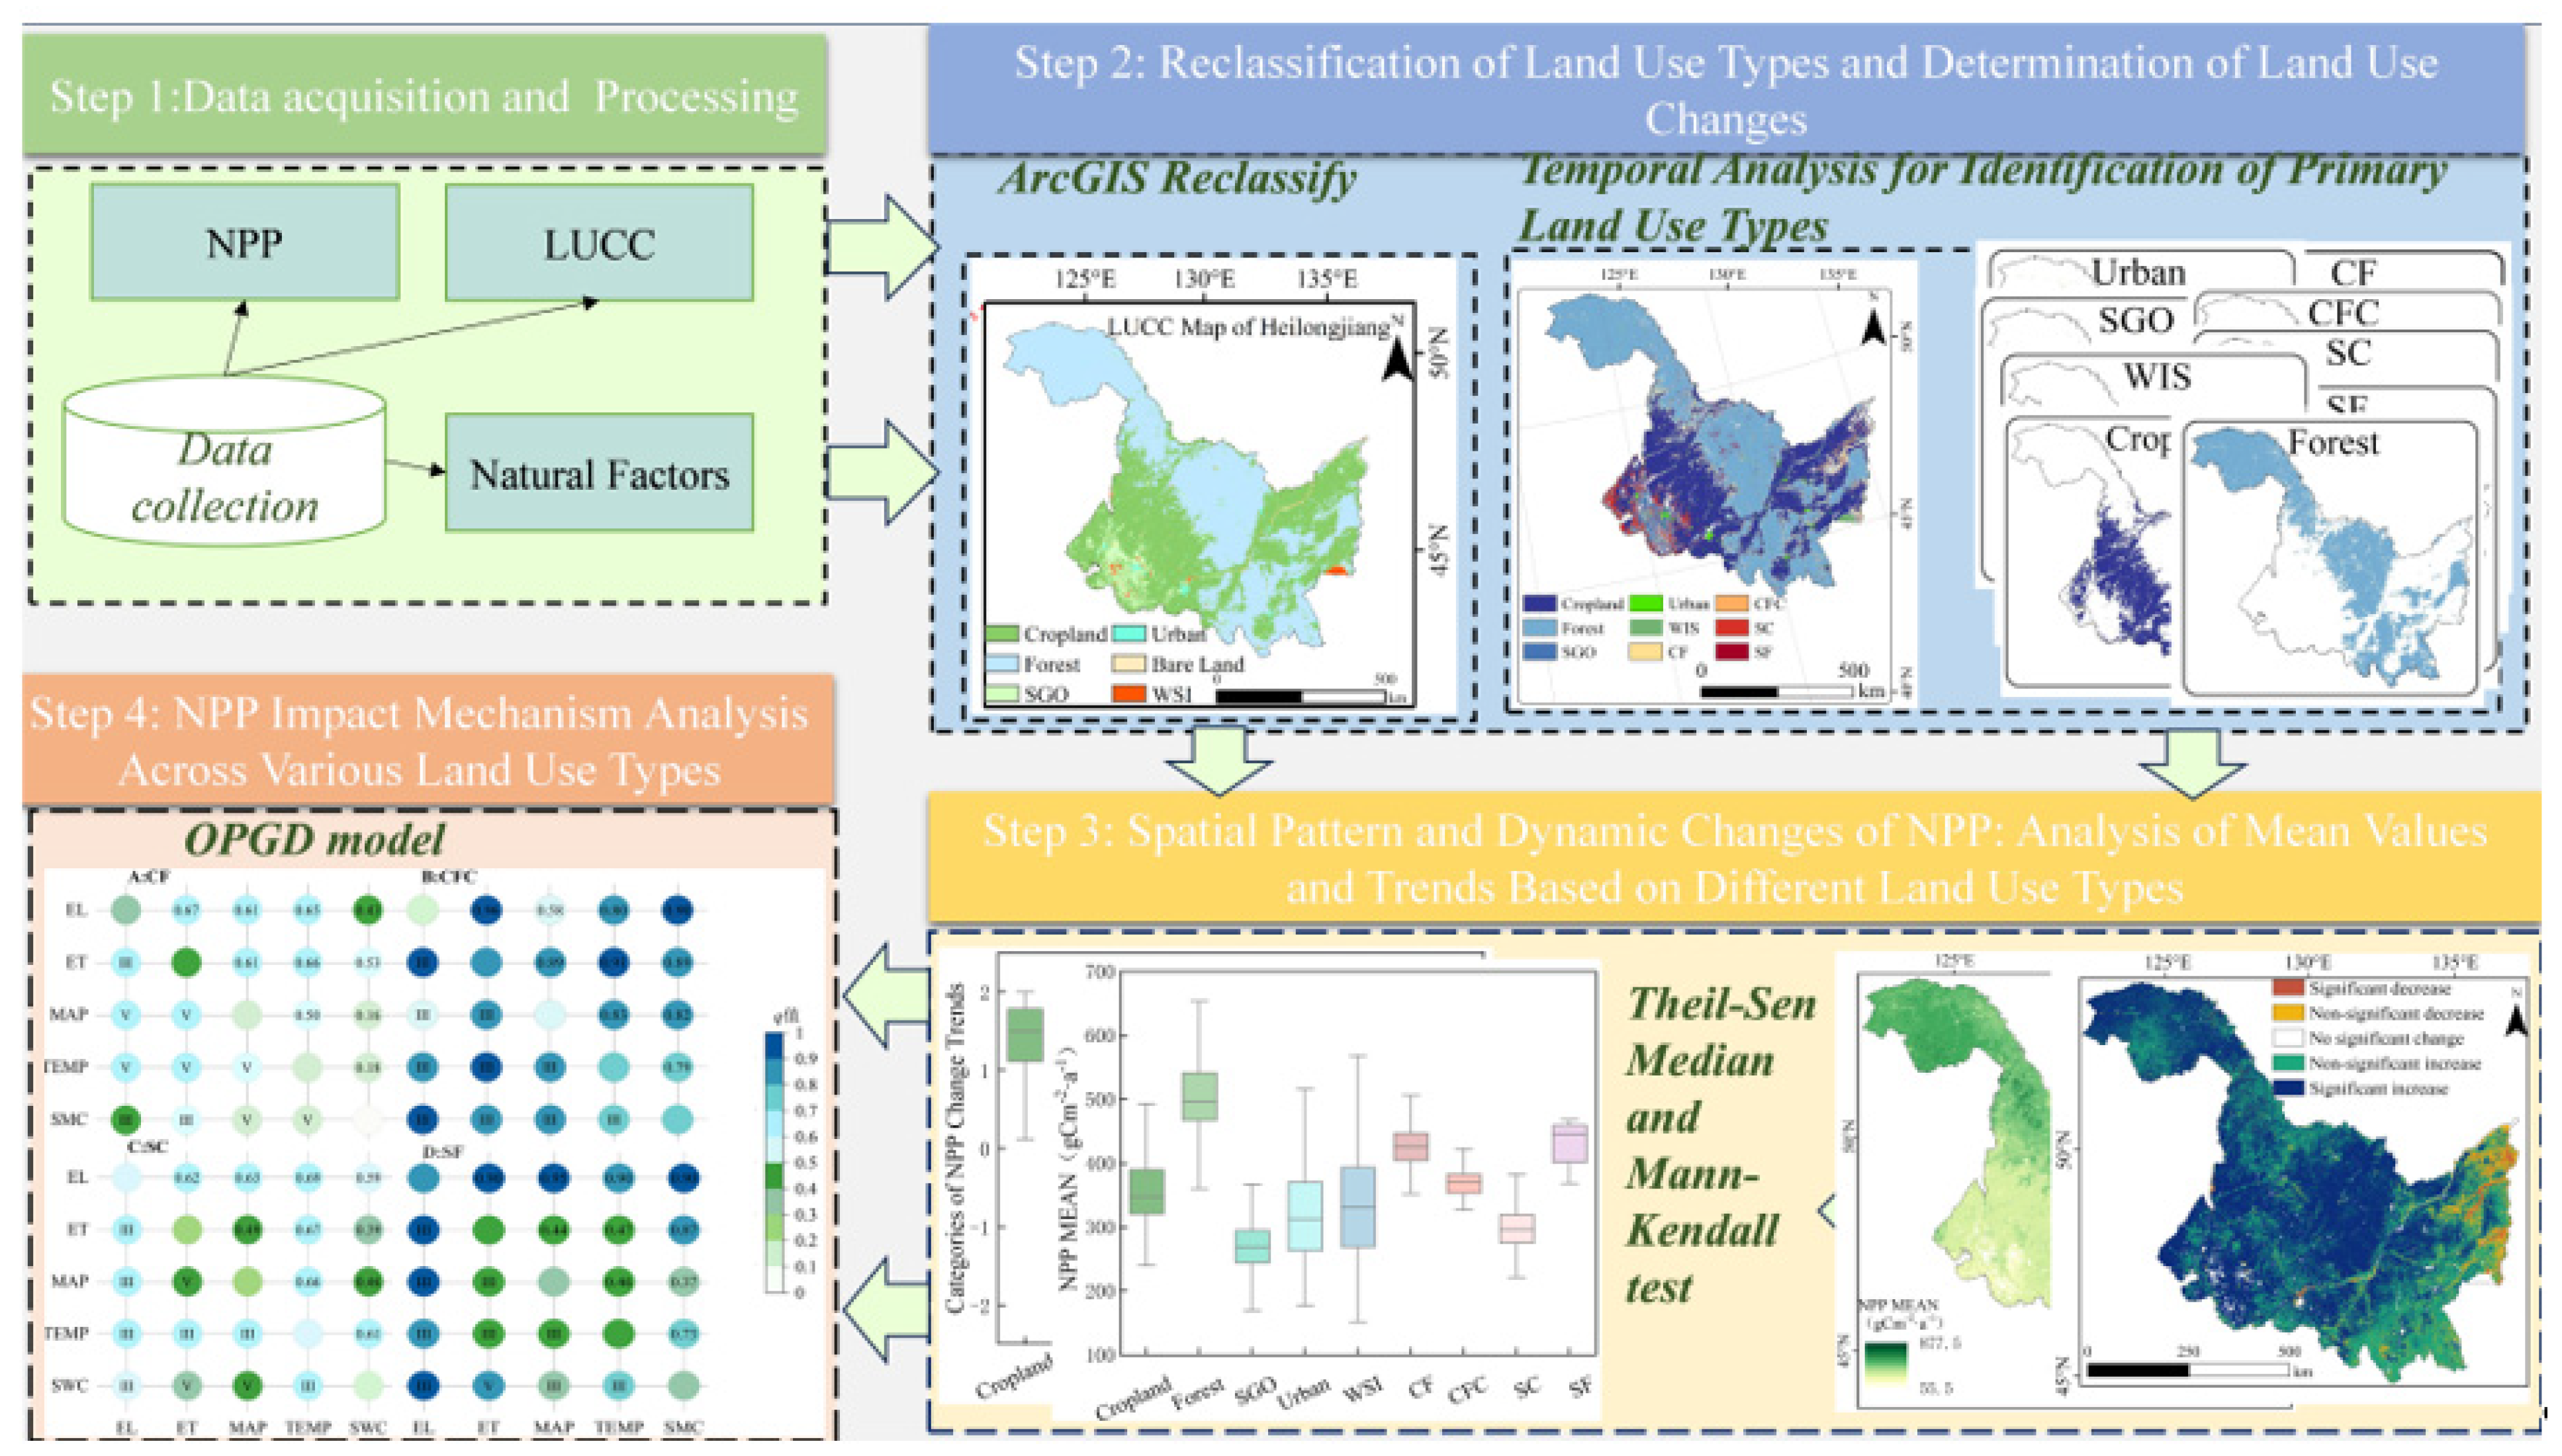
A schematic diagram outlining the specific research procedure is provided in Figure 2.

3. Results

3.1. Determination of Study Land Types

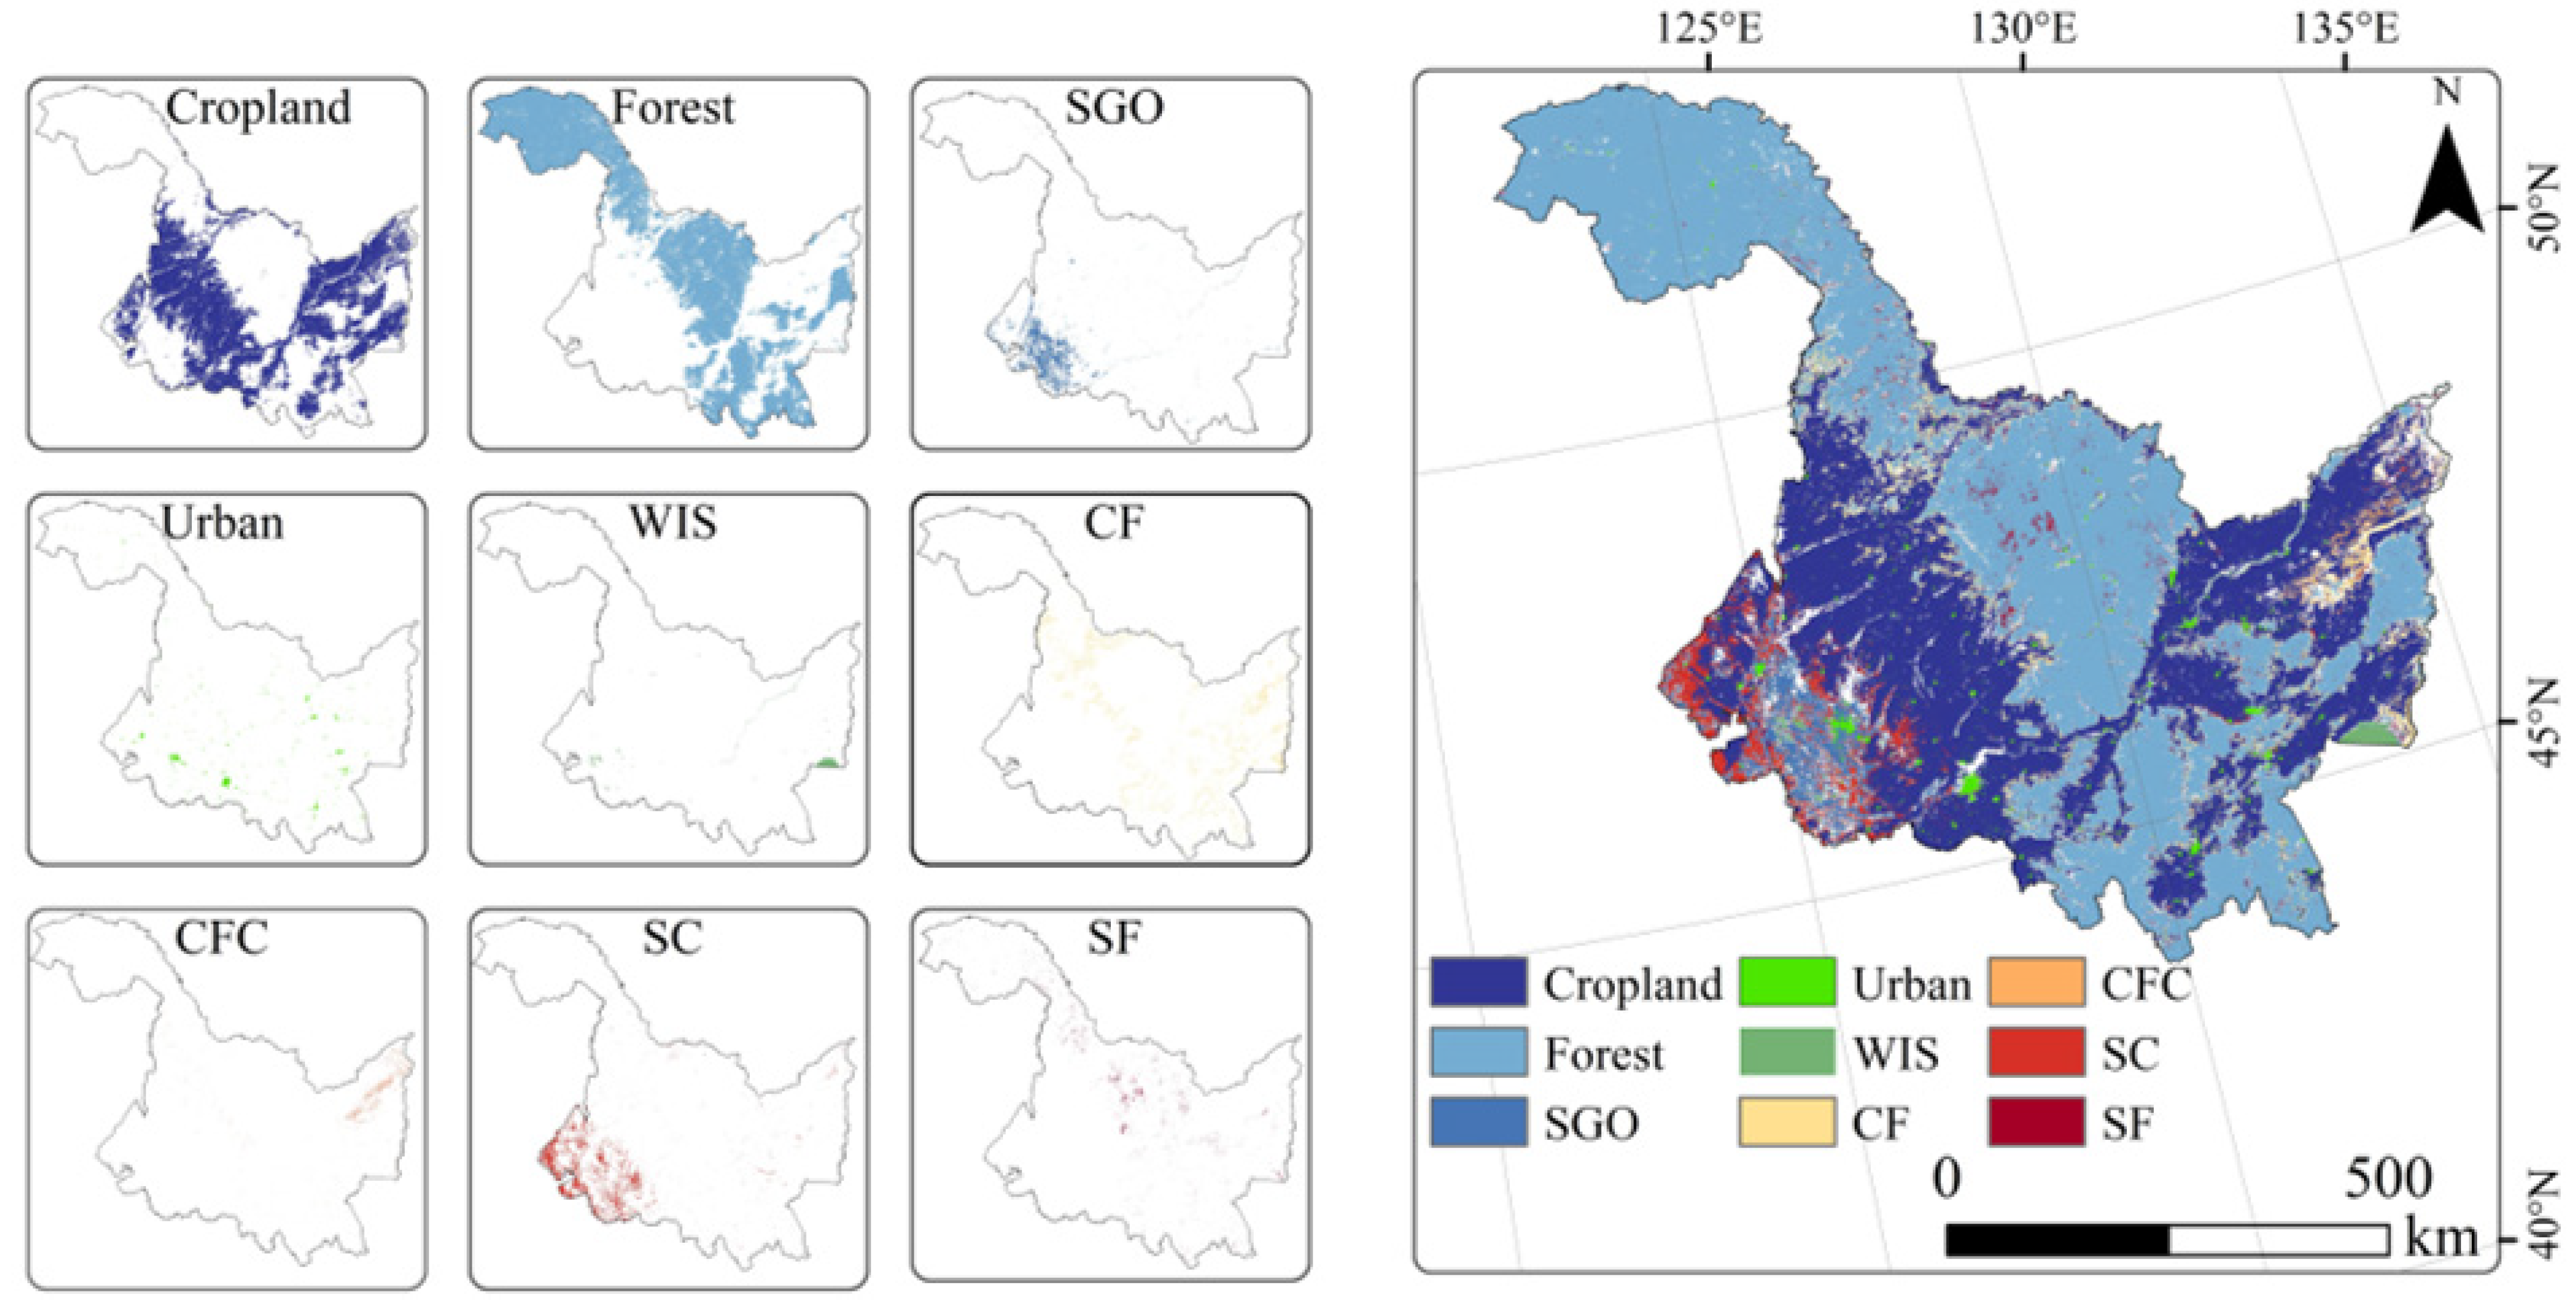
The results of land use change in Heilongjiang Province from 2001 to 2022 fall into two types: areas that remained unchanged and areas that underwent change. The unchanged land study types include five categories: cropland, forest, shrub–grass–wetland complex (SGO), urban, and water bodies (WIS). The changed land types consist of four categories: shrub–grass–wetland complex converted to cropland (SC), cropland converted to forest (CF), shrub–grass–wetland complex converted to forest (SF), and cropland converted to forest and then back to cropland (CFC). The analyzed land systems encompass 418,291 km2 of Heilongjiang Province, representing 92.5% of its total area. This comprehensive coverage includes both stable ecosystems and areas undergoing land cover transitions. This methodology effectively pinpoints the dominant land use types in the study region. In Figure 3, the geographical distribution of key land use patterns across Heilongjiang Province during the 2001–2022 period is presented.
Spatial analysis identifies cropland as the predominant land cover in Heilongjiang Province, accounting for 35.08% of the total area (Figure 3). This agricultural dominance is spatially constrained to low-elevation plains (<200 m), particularly the Sanjiang Plain (47.2% of provincial cropland) and Songnen Plain (38.5%), where fertile chernozem soils and favorable hydrologic conditions prevail. In contrast, forests are exclusively distributed across high-altitude regions (>500 m), including the Lesser Khingan Range (32.4% of forest cover), Greater Khingan Range (28.1%), and the Changbai–Wandashan–Yilehuli mountain complex (39.5% combined). SGO complexes are primarily concentrated in the southwestern plains. Urban areas and WIS, which make up 0.95% and 0.64% of the total area respectively, show a more scattered spatial distribution.
The four transitional land cover types exhibit distinct biogeographical distributions: SC complexes converted to cropland are mainly concentrated in the southwest. CFC is located in the plains between the Songhua and Naoli Rivers in the northeast. SF is largely found in mountainous regions, such as the Yilehuli Mountains in the northwest and the central Lesser Khingan Range, with some scattered areas in the northwest and northeast. Similarly, CF is distributed across mountainous regions throughout the study area, except for the southwest.

3.2. Spatiotemporal Distribution of NPP and Differences Across Land Types

3.2.1. Geospatial Dynamics in Multiyear NPP Averages and Land-Type Heterogeneity

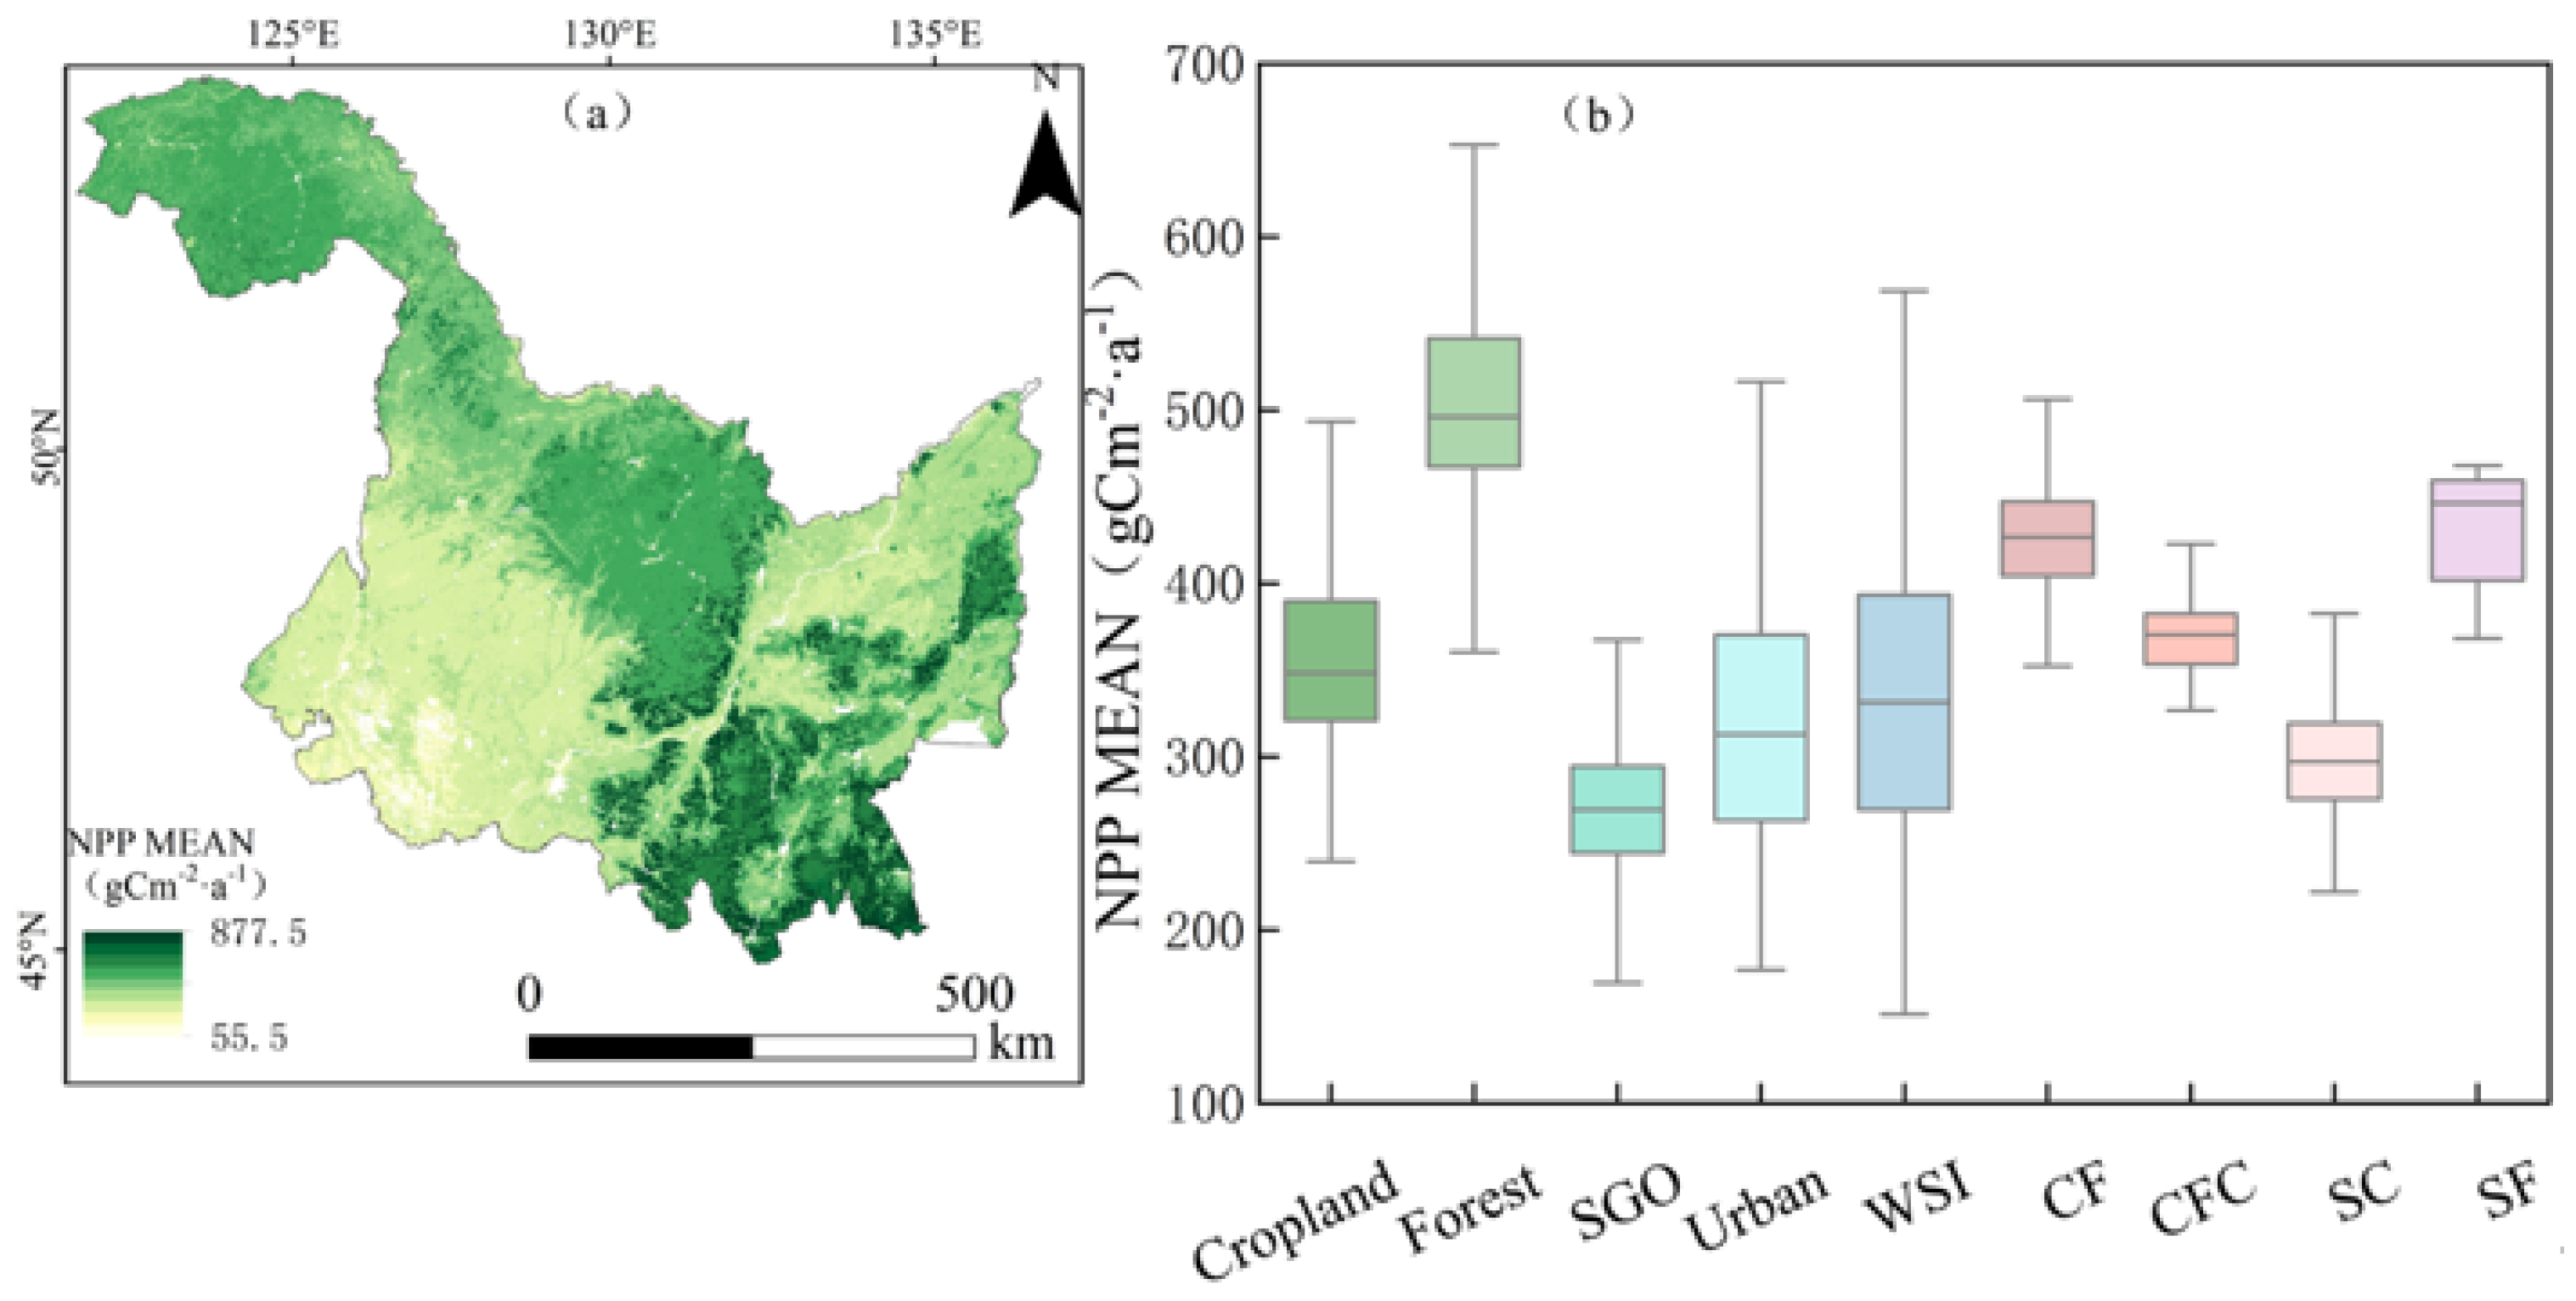
ArcGIS-based analysis quantified the average NPP values across Heilongjiang Province during the 22-year observational period (2001–2022). Spatial analysis, as vividly depicted in Figure 4a through its gradient color scheme in which deeper green indicates higher NPP, reveals significant heterogeneity in the annual mean NPP distribution, with a general decline from the southeastern to the northwestern regions. Forested areas in the northern Lesser Khingan Range, the southern Changbai Mountains, and the northeastern Wandashan region show relatively high NPP values. In contrast, the Sanjiang Plain in the northeast and the Songnen Plain in the southwest, which are primarily composed of cropland, shrub–grass–wetland complex (SGO), and urban areas, show relatively lower vegetation NPP. After gridding the NPP data, the mean NPP for each land use type was analyzed, as illustrated in Figure 4b via a boxplot that displays the distribution of NPP values, including median, quartiles, and outliers for each category. Among the stable land types, forested areas demonstrate the highest NPP (514.1 gC m−2·a−1), with cropland (359.0 gC m−2·a−1), urban areas (321.2 gC m−2·a−1), water bodies (WIS, 329.3 gC m−2·a−1), and SGO complexes (269.2 gC m−2·a−1) following in descending order. Among the changed land types, areas where shrub–grass–wetland complex converted to forest (SF) and cropland converted to forest (CF) exhibit the highest annual NPP, reaching 431.4 and 430.9 gC m−2·a−1, respectively. These values are higher than those of unchanged SGO and cropland but lower than forested areas. The NPP of cropland converted to forest and then back to cropland (CFC) is 370.3 gC m−2·a−1, slightly higher than cropland but significantly lower than forest. The lowest NPP was recorded in the shrub–grass–wetland complex converted to cropland (SC) areas, at 299.1 gC m−2·a−1, which was only marginally higher than that of the unchanged SGO.

3.2.2. Geospatial Variability in NPP Transition Dynamics and Inter-Category Disparities

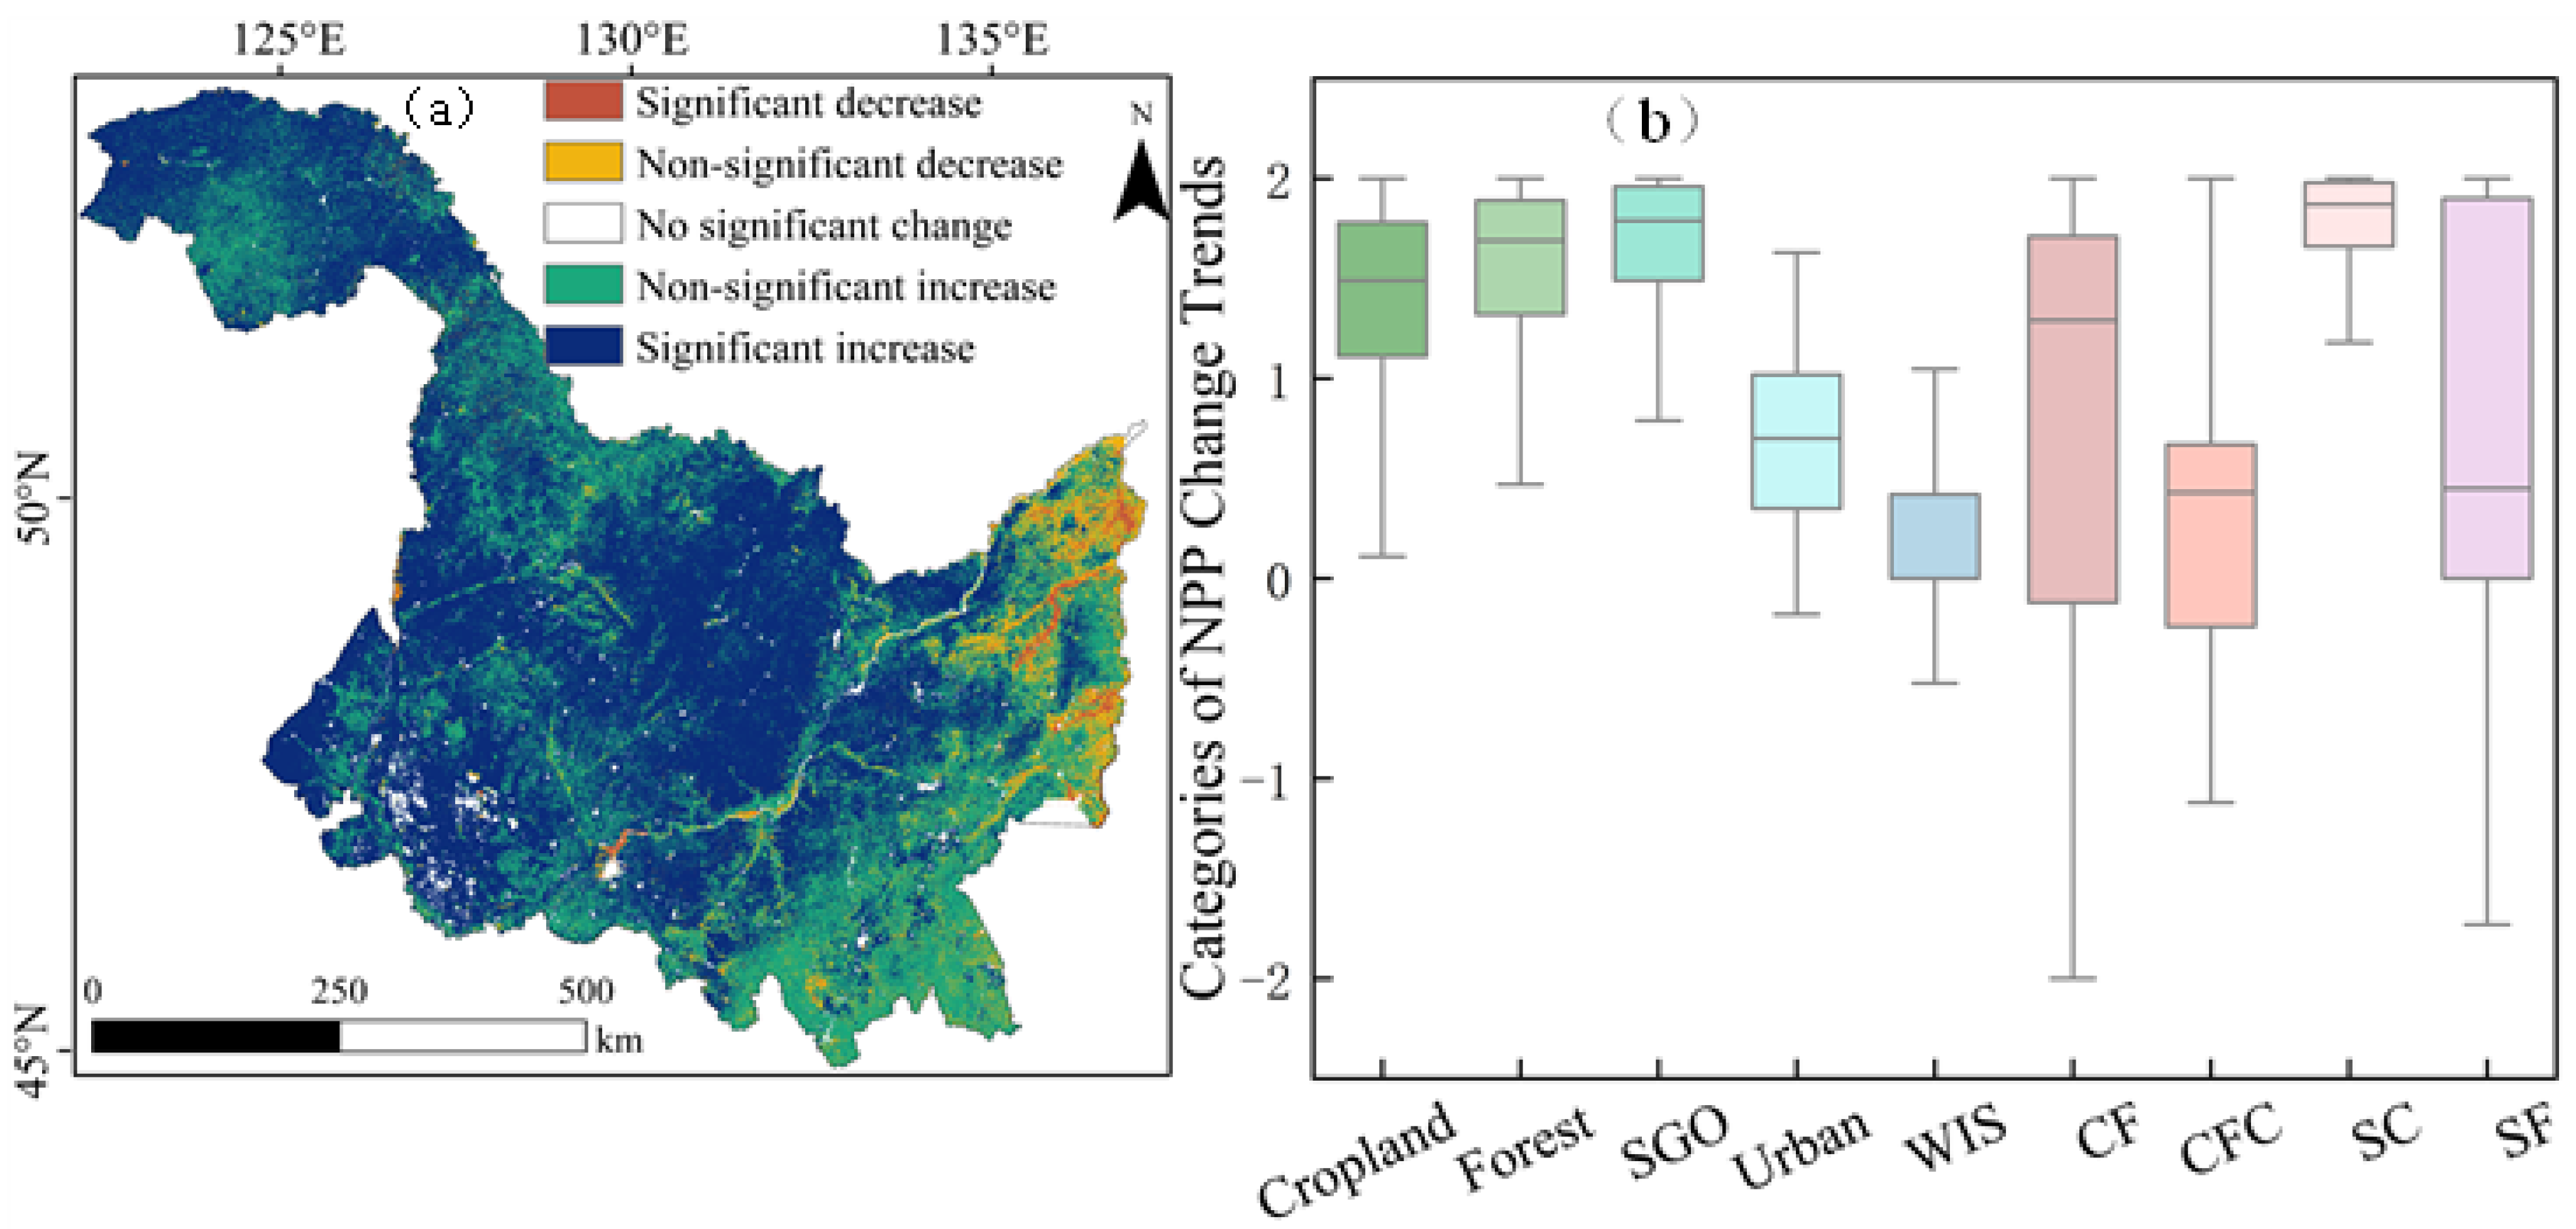
Geostatistical analysis integrating Sen’s slope estimator and Mann–Kendall tests revealed distinct spatial–temporal evolution patterns of NPP dynamics in Heilongjiang Province, with significant vegetation productivity variations observed among different terrestrial ecosystem classifications (Figure 5). As depicted in Figure 5a, the NPP in Heilongjiang Province exhibited a general upward trend during the period from 2001 to 2022. Significant increases accounted for 58.55% of the total area, while non-significant increases covered 32.92%. Areas showing a substantial rise in NPP were primarily located in the central, northwestern, and southwestern sections of the research region. Conversely, areas with non-significant increases were more prevalent in the southeastern portion. Decreasing trends in NPP were primarily observed in the eastern part of the province. Non-significant decreases covered 7.43% of the total area, while significant decreases accounted for just 1.10%.
Following the gridding of NPP trend data, we conducted an analysis of trends across various land use types. The findings reveal that all land use types displayed an increasing trend in NPP (see Figure 5b). Figure 5b uses a boxplot to illustrate the distribution of NPP change trend values for each land use type, with the box representing the interquartile range, the line inside the box being the median, and the whiskers showing the range of data excluding outliers. Among the land use types that remained unchanged, those with higher vegetation cover—such as cropland, forestland, and SGO complexes—showed significant increases, with median trend values of 1.32, 1.55, and 1.67, respectively. In contrast, urban areas and WIS displayed minimal changes, with median trend values of only 0.68 and 0.17. Among the land use types that underwent changes, the conversion of SF and CF demonstrated significant increases in NPP, with median trend values of 1.77 and 1.29, respectively. Other land use changes showed slight but non-significant increases in vegetation NPP.

3.3. Analysis of Factors Influencing NPP Across Land Categories

3.3.1. Assessment of the Separate Influence of Natural Factors on NPP

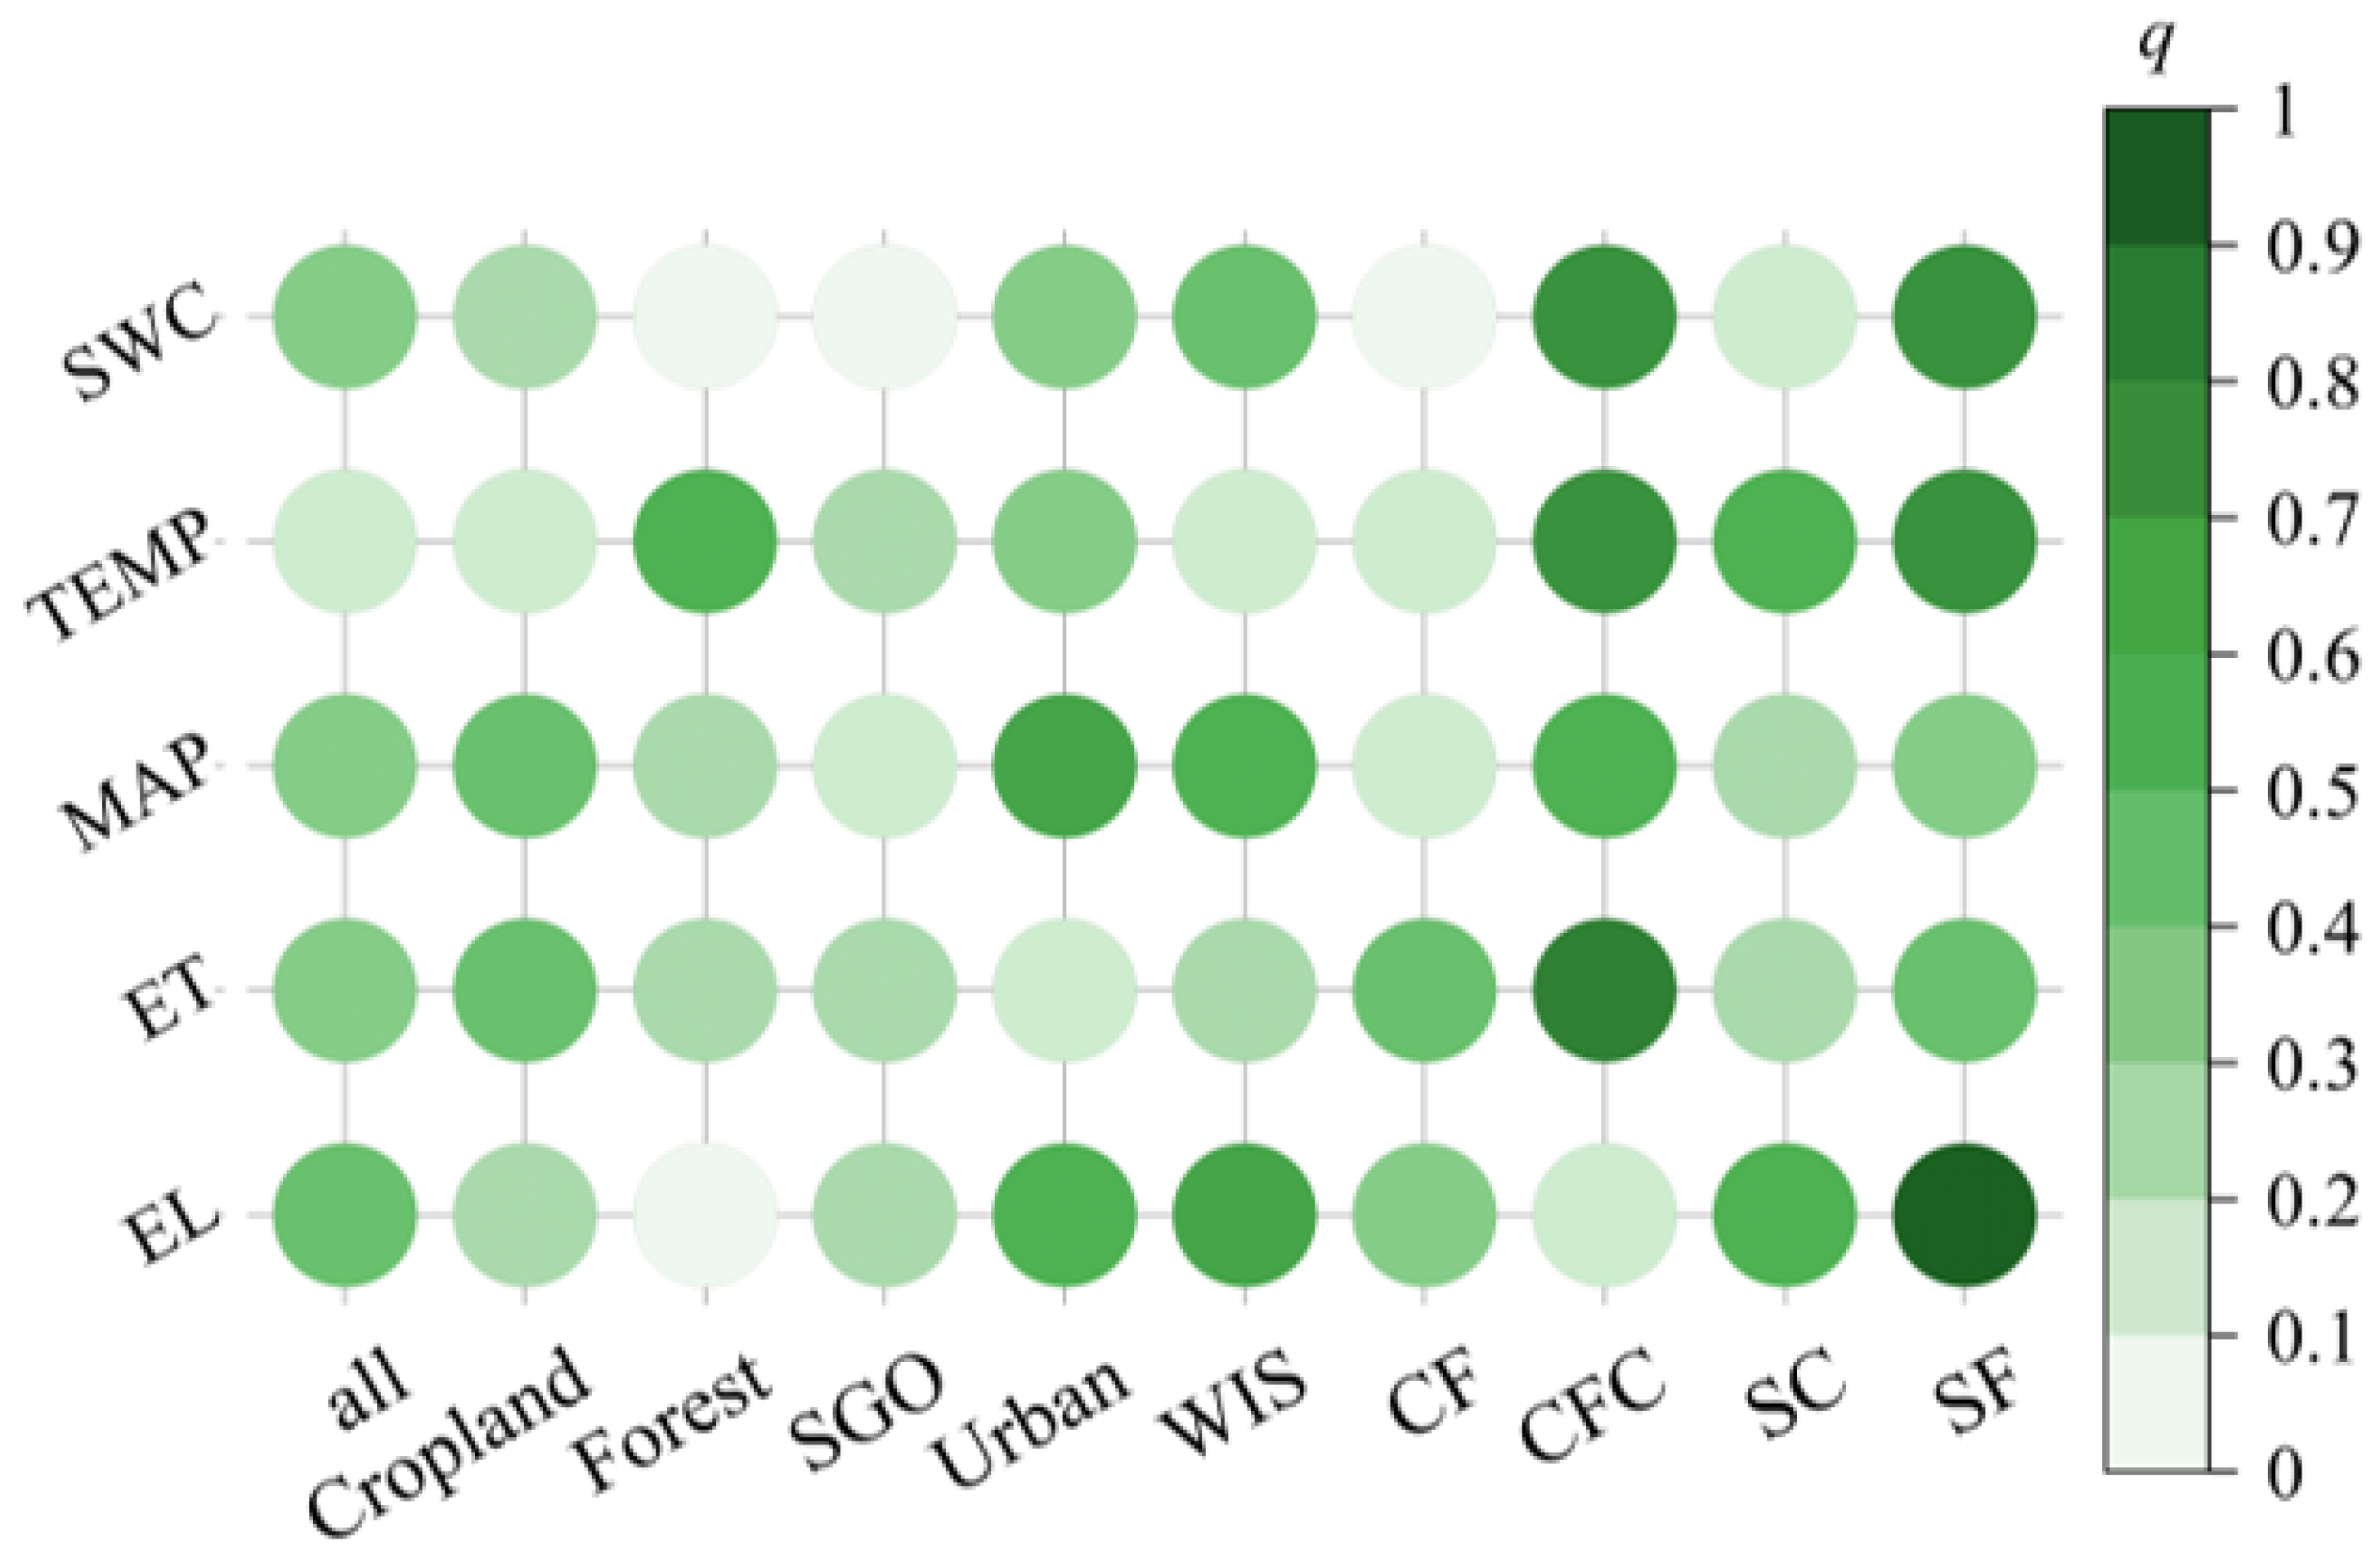
The single-factor analysis revealed that the explanatory power (q-value) of each natural factor on NPP was statistically significant (p < 0.05) for all land use types and within each specific category. As shown in Figure 6, across all land use types, mean annual temperature exhibited a weak explanatory power (q = 0.15) on NPP, while the other factors demonstrated moderate explanatory power (0.34 < q < 0.49). In general, the impact of natural factors on NPP across all land use types showed consistent explanatory power, indicating a balanced contribution of these factors to vegetation productivity within the study area.
Our analysis reveals systematic variations in environmental control over NPP across LUCC trajectories. In general, these factors tend to have a stronger influence on unaltered land use types than on those that have undergone changes. This indicates that stable land use types are influenced more consistently by natural factors, whereas land use changes may introduce additional variability, thereby reducing their explanatory power.
In unchanged land use types: Cropland was moderately influenced by evapotranspiration and mean annual temperature, with q-values of 0.49 and 0.41, respectively. Other factors demonstrated weak explanatory power. In forestland, mean annual temperature demonstrated strong explanatory power (q = 0.51), followed by mean annual precipitation and evapotranspiration, indicating that NPP in this category is highly sensitive to climate change. For shrub–grass–wetland complex (SGO), the soil moisture content demonstrated negligible explanatory power (q < 0.1), whereas the remaining factors exhibited weak explanatory power, with q-values ranging from 0.19 to 0.28. In urban areas, mean annual precipitation and elevation showed strong explanatory power (q-values of 0.60 and 0.59), mean annual temperature and soil moisture content moderate explanatory power, and evapotranspiration displayed weak explanatory power (q = 0.17). For water bodies (WIS, 329.3 gC m−2·a−1), elevation and mean annual precipitation demonstrated strong explanatory power, with q-values of 0.60 and 0.55, respectively.
In changed land use types: For cropland converted to forest (CF), evapotranspiration and elevation exhibited moderate explanatory power (q-values of 0.49 and 0.31), while mean annual temperature and precipitation showed weak explanatory power. Soil moisture content had negligible explanatory power (q = 0.04), indicating that it did not contribute to NPP changes in this category. For cropland converted to forest and then back to cropland (CFC), elevation exhibited weak explanatory power, whereas the remaining factors demonstrated strong explanatory power, with q-values ranging from 0.52 to 0.71. For shrub–grass–wetland complex converted to cropland (SC), elevation and mean annual temperature demonstrated the highest explanatory power, whereas the remaining factors exhibited weak explanatory power. For shrub–grass–wetland complex converted to forest (SF), only elevation showed strong explanatory power (q = 0.83), and the other factors had moderate explanatory power (q = 0.32–0.45).

3.3.2. Analysis of the Interactive Effects of Natural Factors on NPP

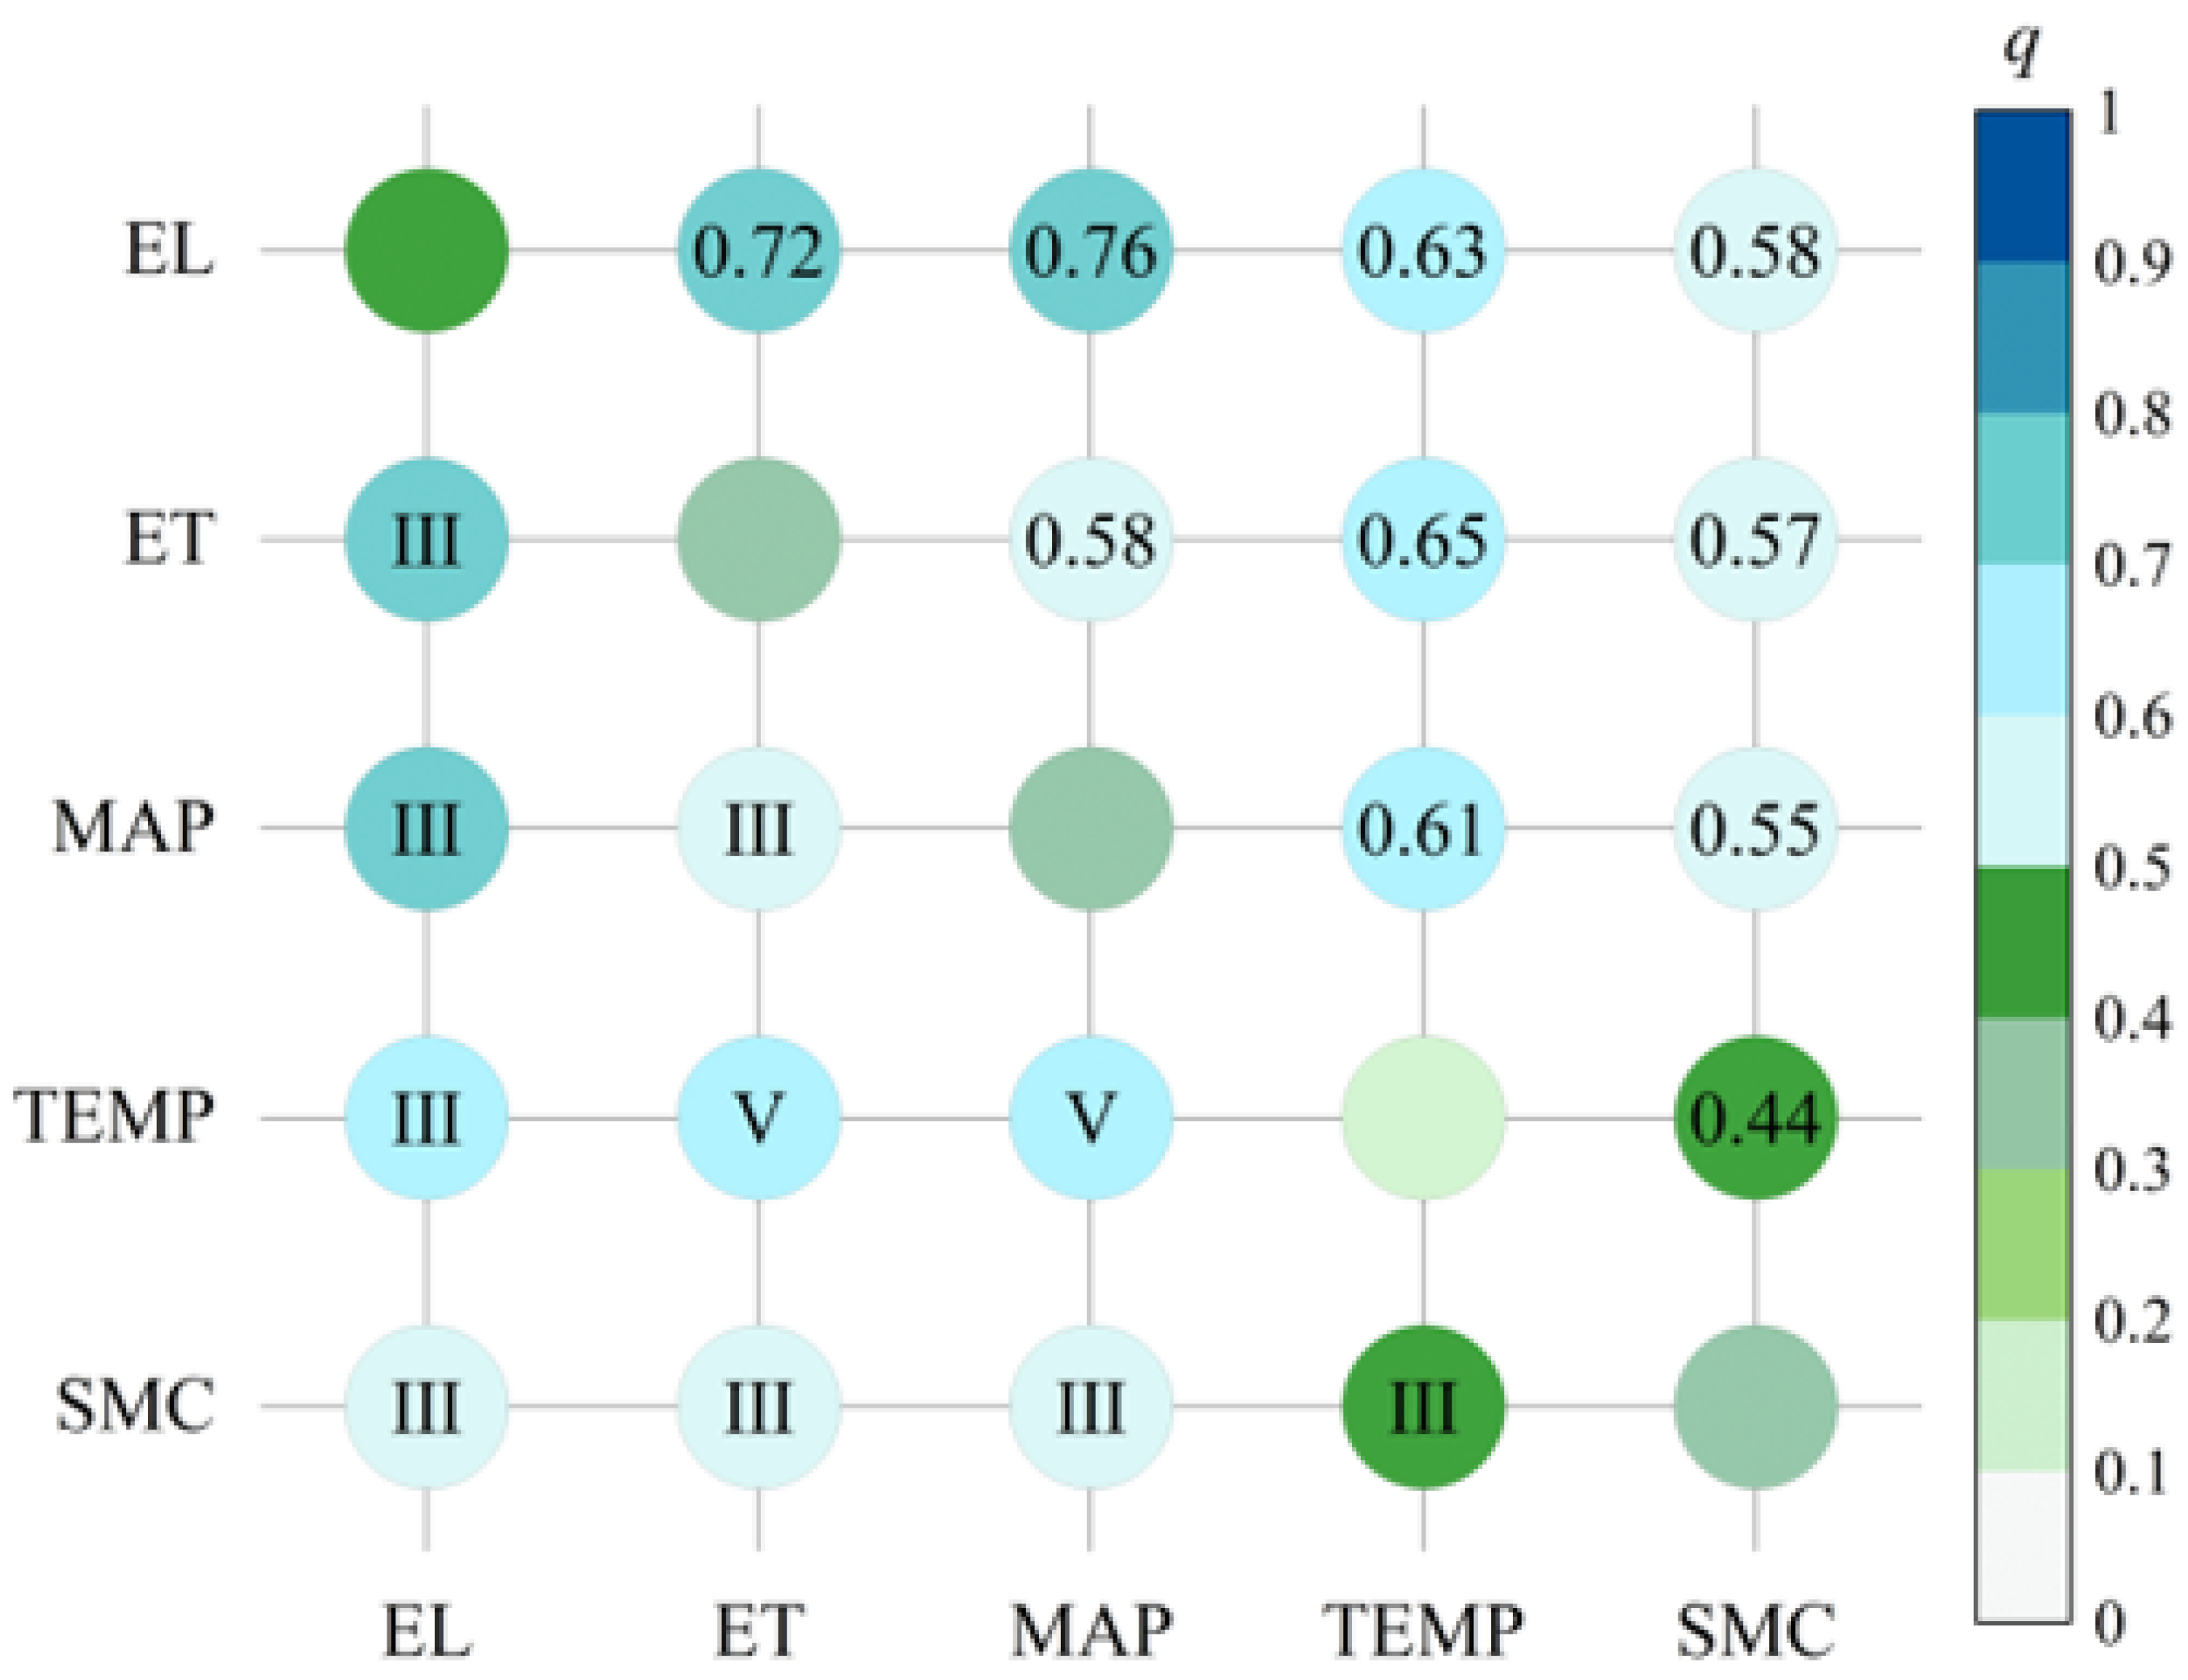
To analyze the interactive effects of natural factors on NPP, we applied an interaction detector to assess how major natural drivers, as independent variables, influence NPP. As shown in Figure 7, interactions among the five natural factors mainly resulted in two-factor enhancement or nonlinear enhancement, with q-values ranging from 0.44 to 0.76. The most influential interactions were mean annual precipitation ∩ elevation, evapotranspiration ∩ elevation, and evapotranspiration ∩ mean annual temperature. This highlights that NPP is largely controlled by climate–topography interactions. All factor pairs showed enhanced effects relative to individual impacts, with no independent or weakening effects observed.
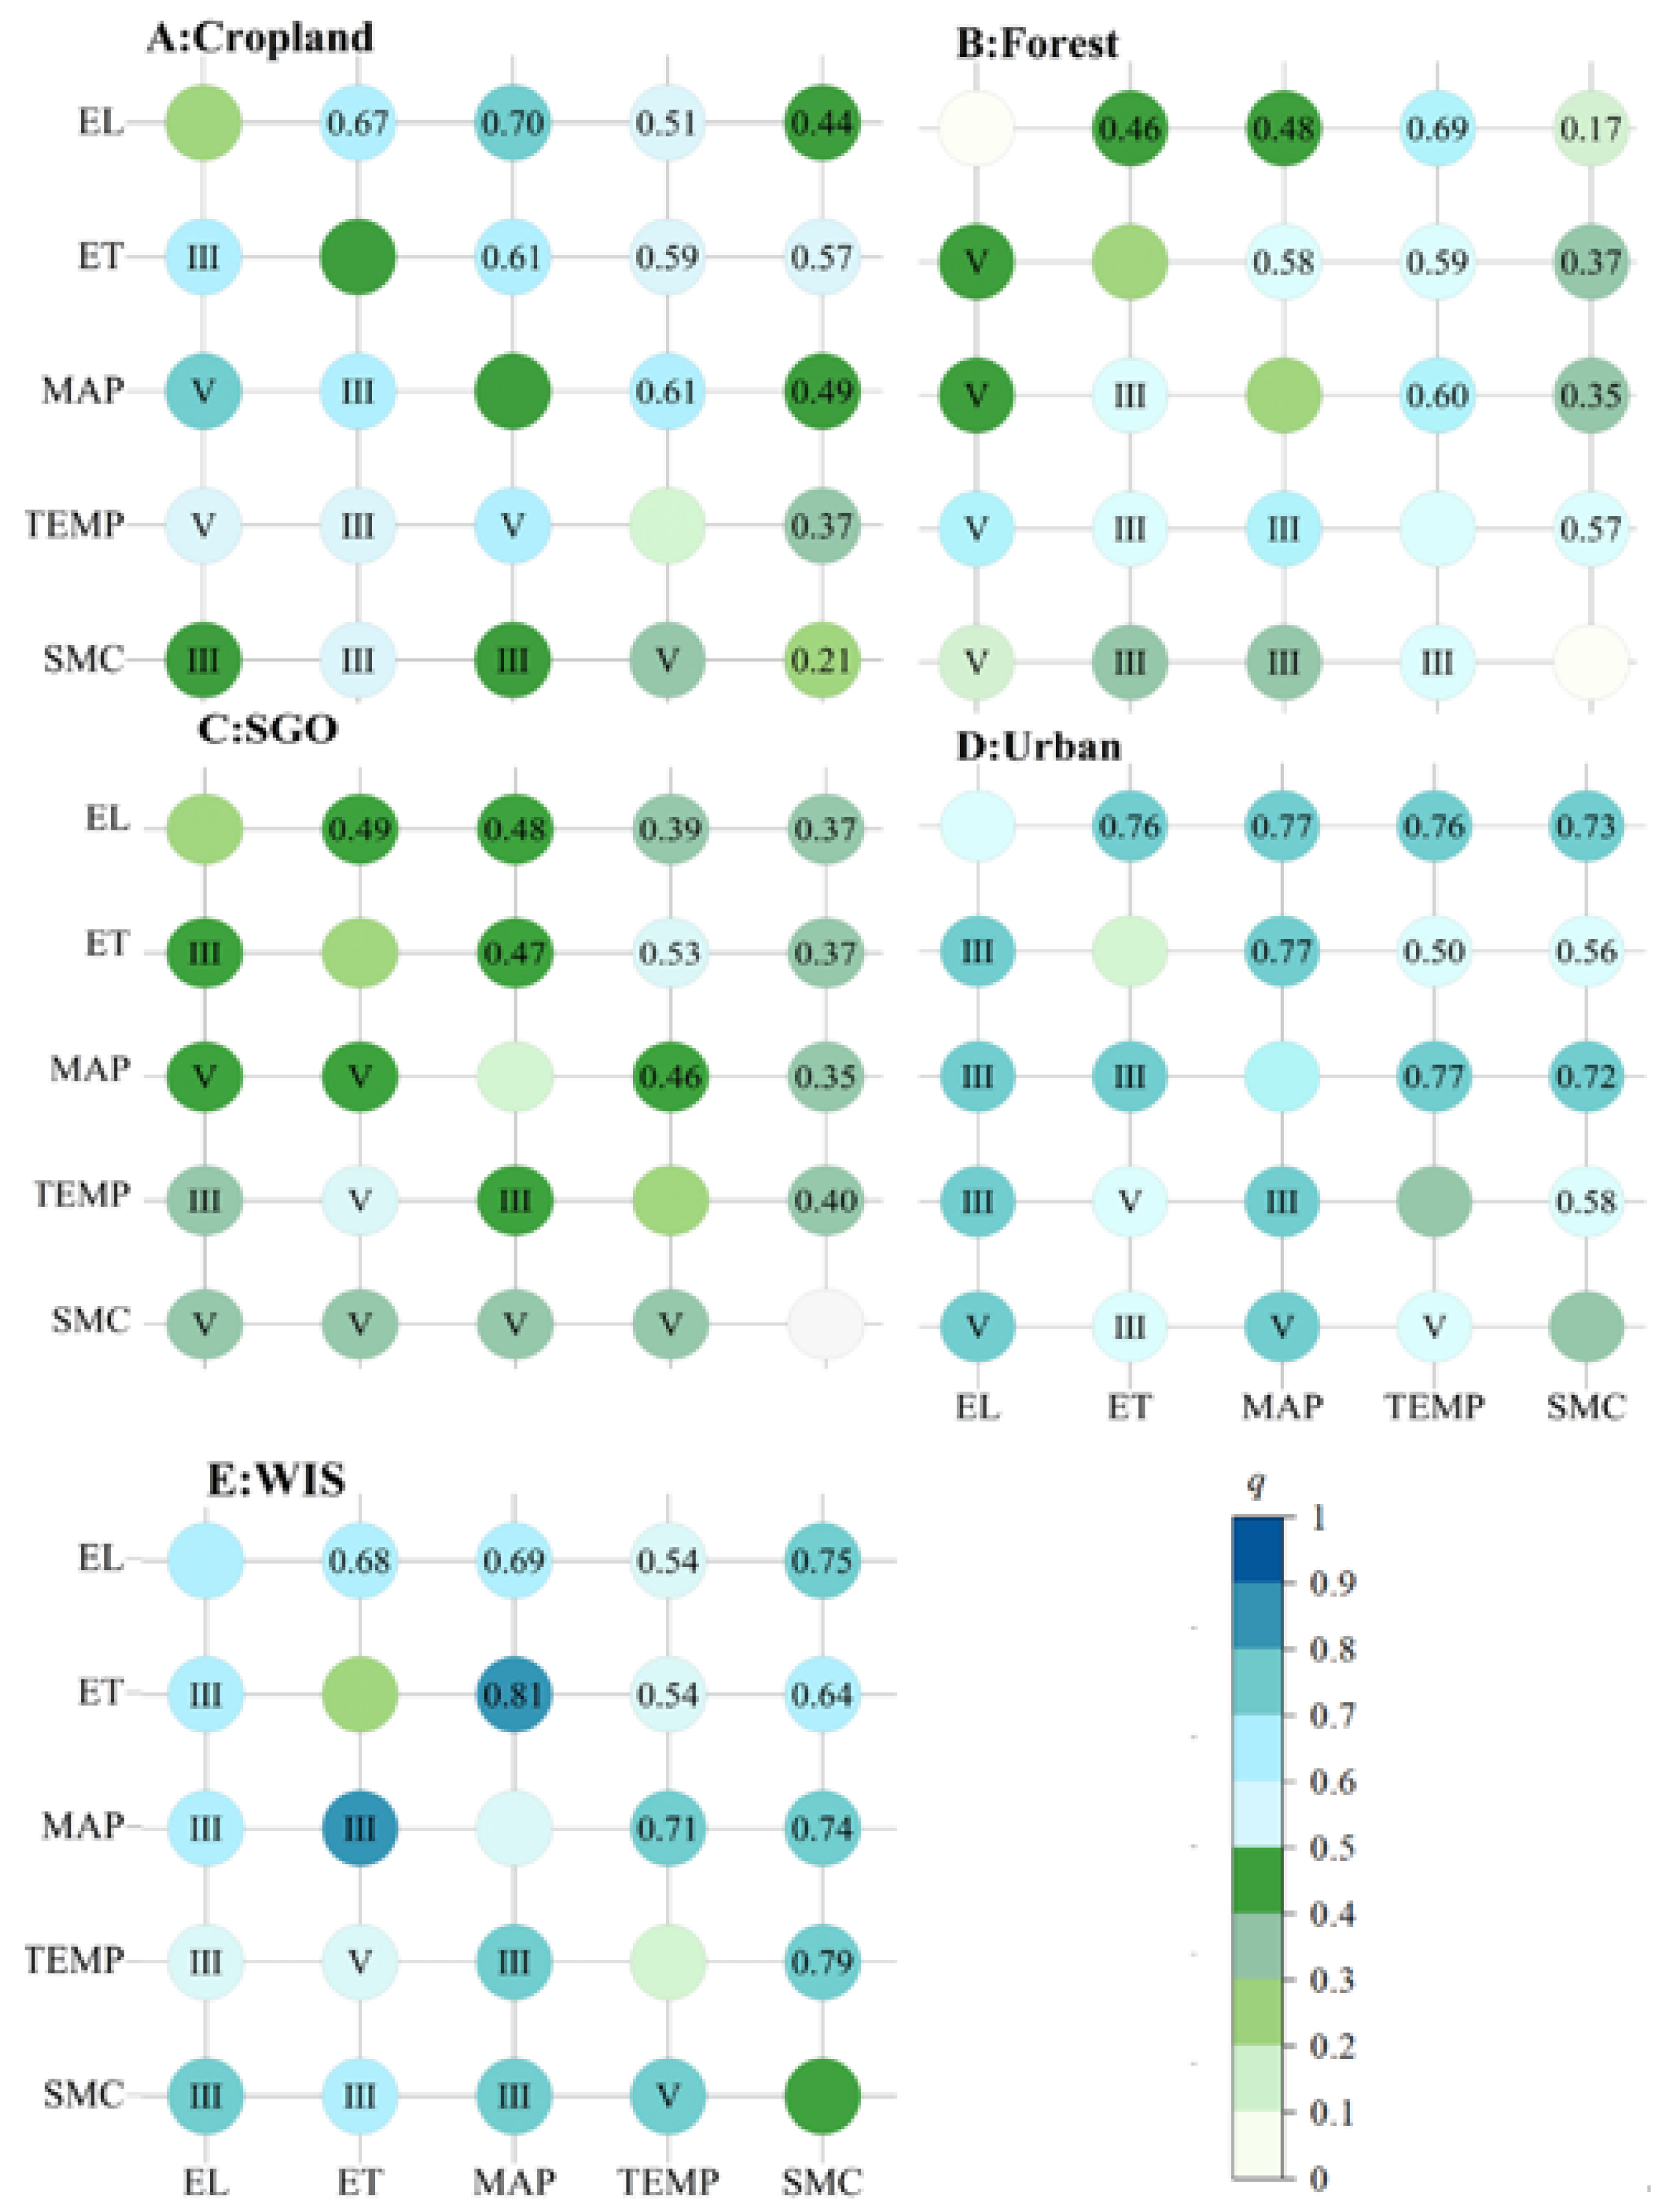
Notably, the driving interactions varied significantly across land use types, as detailed below. For unchanged land types (Figure 8): In cropland, the strongest interactions were elevation ∩ mean annual precipitation (q = 0.70), elevation ∩ evapotranspiration (q = 0.67), and mean annual temperature ∩ mean annual precipitation (q = 0.61). In forestland, though elevation had a weak individual effect (q = 0.07), it played a key role in interactions with climate factors. SGO showed moderate explanatory power (q: 0.35–0.53) with predominantly nonlinear enhancement. Urban areas and water bodies (WIS) both had strong interactive effects (q > 0.5), and two-factor combinations consistently outperformed single factors.
Analysis of the interaction results for dynamic land use types (Figure 9) reveals distinct patterns.
For CF, only two interactions had limited explanatory power: soil moisture ∩ mean annual temperature (q = 0.18) and soil moisture ∩ mean annual precipitation (q = 0.16). All other pairs were highly explanatory, with the top three being evapotranspiration ∩ elevation, evapotranspiration ∩ mean annual precipitation, and mean annual precipitation ∩ elevation (0.65 ≤ q ≤ 0.68)—all showing nonlinear enhancement. This confirms that climate–topography synergies strongly influence NPP during cropland-to-forest conversion.
For CFC, all five natural factors’ pairwise interactions were highly explanatory, showing two-factor enhancement. Notably, elevation had limited individual explanatory power but significantly strengthened its influence when interacting with other factors.
In the SC type, two interactions had moderate explanatory power (nonlinear enhancement): soil moisture ∩ evapotranspiration (q = 0.39) and soil moisture ∩ mean annual precipitation (q = 0.46). The strongest three were mean annual temperature ∩ elevation (q = 0.69), mean annual temperature ∩ evapotranspiration (q = 0.67), and mean annual temperature ∩ mean annual precipitation (q = 0.66)—all highly explanatory. This suggests that temperature synergizes with other factors to boost NPP impact in agricultural conversion areas.
Under SF, the interactions between elevation and each of the other variables demonstrated exceptionally strong predictive capability, with q-values ranging from 0.89 to 0.95. The interaction between evapotranspiration and soil moisture content displayed bivariate enhancement, while all others were nonlinearly enhanced.

4. Discussion

4.1. Land Use Change Analysis

Land use/cover change (LUCC) represents a fundamentally spatial process, as extensively documented in foundational studies [32]. Achieving sustainable land management requires systematic quantification of the key socio-ecological drivers governing these transformations [33]. This study examines land use transitions in Heilongjiang Province between 2001 and 2022, and the calculated areas for each land use category are shown in Table 3.
Heilongjiang Province contains part of one of the world’s three major black soil belts [34], and is a vital grain-producing region in China, contributing more than 10% of the national total grain output [35]. According to Heilongjiang’s territorial spatial planning (2021–2035), the province is mandated to preserve a minimum cropland inventory of 166,703 km2 by 2035, including 135,581 km2 designated as permanent basic farmland. The findings of this study indicate that the conversion of grassland–wetland complex areas to cropland in the Songnen Plain and the recultivation of lands previously under the Grain-for-Green Program (GFGP) in the Sanjiang Plain were the primary sources of new cropland, while the GFGP remained the key driver of cropland loss. As of 2022, the stable cropland area in Heilongjiang Province had reached 158,696 km2, and the total conserved area (including Cropland, SC, and CFC) amounted to 178,132 km2—already exceeding the territorial spatial planning target set for 2035, which indicates a sufficient total reserve of cropland resources. The dynamic balance between cropland gain and loss reveals the complexity of optimizing land use structure. It is noteworthy that while the GFGP has effectively promoted ecological restoration, it has also imposed pressure on maintaining the cropland quota, highlighting the need to balance ecological security and food security.
Against the broader backdrop of China’s cropland protection goals, Heilongjiang Province faces the dual challenge of supporting economic growth while advancing ecological conservation. To fulfill its strategic role in national food security, the province should adopt a scientifically grounded approach to cropland management. This includes identifying stable, productive cropland that meets legal and policy standards for designation as permanent basic farmland, thus ensuring its long-term protection. It is equally important to tailor strategies to regional conditions—particularly the differing land use change patterns and NPP dynamics observed in the Songnen and Sanjiang Plains. By optimizing land use structures, protecting high-yield cropland, and developing reserve resources in a rational manner, Heilongjiang can strengthen the sustainability of grain production while balancing ecological and food security objectives.

4.2. Analysis of NPP Change Trends

Between 2001 and 2022, Heilongjiang Province’s NPP exhibited a progressive upward trajectory, corroborating trends identified in prior ecological studies across the region [36,37,38]. Across different land use categories, forests demonstrated the highest average NPP, highlighting their essential and sustained role in carbon sequestration. In both CF and CFC regions, the average NPP was higher than that of cropland, with the transformation of cropland into forest leading to increased NPP values. These findings are consistent with data from Lu et al. [39]. The increase is mainly attributed to improved soil carbon from above-ground litter and root systems after afforestation, coupled with decreased soil carbon loss [40]. The NPP of SGO is significantly lower than that of the others. The lower productivity is mainly attributable to the fact that pastures account for more than 90% of SGO. In the past few years, the Songnen Plain’s grassland ecosystem has been subjected to more and more deterioration of its ecology, with its characteristic of desertification and salinization [41], which has severely reduced grazing productivity and reduced NPP in these areas. Additionally, the large-scale conversion of SGO to cropland and forest has also reduced their surface area, which has aggravated the deterioration of pasture and leads to a lower NPP than for other types of land. These results align with those of earlier studies [36,42].
In order to solve the ecological problems caused by the degradation of vegetation, wind-blown desertification, and soil salinization in the Songnen Plain, priority must be given to the utilization of grassland ecosystems. Integrated actions like restoring vegetation, improving soil quality, and managing water resources should be part of these efforts. Concurrently, it is critical to control the conversion of grasslands into croplands and forested areas to safeguard existing grassland resources [43]. While ensuring food production, efforts should also focus on ecological conservation and enhancing carbon sequestration capabilities. Through the implementation of policy guidance and technical support, the advancement of multi-objective coordinated land use management can effectively balance ecological, economic, and social benefits.

4.3. Response of NPP Changes to Natural Factors

Determining the relative impact of nature on NPP for various land use patterns is crucial for dealing with climate change and for policy making. The Optimal Parameter-based Geographical Detector is used in this research to assess the impact of nature on NPP in various types of land use. Between 2001 and 2022, NPP increased across most of the region, consistent with observations that global warming has promoted vegetation photosynthesis in high-latitude zones by elevating accumulated temperature and alleviating low-temperature constraints [44]. Further analysis revealed distinct dominant mechanisms governing NPP among land use types, reflecting underlying differences in eco-hydrological processes. For example, in Heilongjiang Province, forested areas are predominantly distributed in mountainous regions, and their NPP shows high sensitivity to air temperature (q = 0.51). This is primarily due to the critical role of temperature in controlling the growing season length and photosynthetic efficiency in high-latitude forests [45]. In contrast, urban vegetation such as lawns and green spaces was more strongly influenced by precipitation (q = 0.60), a pattern attributable to shallow root systems and water stress associated with impervious surfaces [46]. These contrasts highlight the ecosystem-specific mechanisms driving vegetation responses to climate.
The study also identified significant synergistic effects between elevation and climatic variables such as temperature and precipitation on vegetation NPP. In a region of complex topography like Heilongjiang, terrain-induced heterogeneity in solar radiation and soil moisture distribution strongly modulates local hydrothermal conditions [47], a finding consistent with earlier work emphasizing topography–climate coupling [48]. We quantitatively evaluated the strength of these interactions, showing that during the conversion of cropland to forest, the interactive explanatory power of elevation and evapotranspiration reached 0.67. Even more notably, during the transition of shrub–grass–wetland complexes to forest, the interaction q-values between elevation and other factors ranged from 0.80 to 0.96, indicating a very strong synergistic interpretation capacity.

4.4. Limitations and Future Prospects

The limitations of this study primarily stem from data resolution and the completeness of driving factors. First, the MODIS NPP data used in this study have a spatial resolution of 500 m. When a single pixel contains multiple land cover types (e.g., adjacent cropland and grassland, forest and small water bodies), the retrieved NPP value essentially represents a weighted average of different vegetation types. As a result, the actual productivity of a single land class may be smoothed or obscured—for example, forest NPP may be underestimated, while grassland NPP may be overestimated. Additionally, higher-resolution datasets such as Sentinel, Landsat, and the CASA model, which could address these biases, were not integrated for complementary analysis. Furthermore, the selection of driving factors remains incomplete. In reality, vegetation NPP is influenced by a combination of numerous factors, including urban expansion intensity, population, and GDP. Future studies should explore a wider range of potential drivers to better clarify the underlying mechanisms.
To address the above limitations, future research should focus on the following directions: (1) Integrating higher-resolution remote sensing data (e.g., Landsat, Sentinel series) to mitigate the mixed-pixel effect and improve the accuracy of NPP estimation and its association with land classes; (2) Systematically incorporating multi-dimensional indicators of human activity to establish a nature–society coupled analytical framework, aiming to more comprehensively unravel the driving mechanisms of vegetation dynamics; (3) Applying the methodology validated in this study—particularly the advantage of the geographical detector in identifying interaction effects—to other ecologically contrasting regions (e.g., the Tibetan Plateau) to test its generalizability and reveal similarities and differences in dominant drivers and their interactions across regions; (4) Combining future climate scenarios and land use simulations to predict potential trends in vegetation NPP, thereby providing forward-looking decision support for regional ecological security and sustainable development.

5. Conclusions

This study applied land use change trajectory analysis to characterize the spatial distribution of major land use types in Heilongjiang Province. Spatiotemporal variations in NPP from 2001 to 2022 were assessed using Theil–Sen slope estimation and Mann–Kendall trend testing. The influences of natural factors on vegetation NPP were quantified using an Optimal Parameter-based Geographical Detector. The main findings are summarized as follows:
(1)
NPP showed clear spatial heterogeneity across land use types. Forest areas—the dominant ecosystem—exhibited the highest mean annual NPP (514.05 g C·m−2·a−1), followed by croplands (359.01 g C·m−2·a−1), while shrub–grass–other areas had the lowest (269.18 g C·m−2·a−1). Among changing land types, forest- and cropland-derived categories showed relatively high NPP, whereas secondary cropland remained the lowest.
(2)
Over the study period, vegetation NPP across study area displayed a significant increasing trend. This was especially evident in areas where land use remained stable, underscoring the positive effect of land use consistency on ecosystem carbon sequestration.
(3)
Among natural factors, mean annual temperature, precipitation, soil water content, evapotranspiration, and elevation all have significant impacts on variations in vegetation NPP. Specifically, the interaction between mean annual precipitation and mean annual temperature exhibits strong explanatory power across multiple land use types, indicating that the synergistic effect of hydrothermal conditions is a key factor driving changes in vegetation productivity. Additionally, elevation often interacts with other factors to jointly influence NPP, highlighting the importance of topography in regulating the functions of regional ecosystems.
These findings offer concrete insights for ecological management and climate-adaptive land use planning. The stable and high NPP observed in forests supports the need to strengthen forest conservation as a core carbon sink strategy. The rising NPP in certain cropland categories suggests potential for sustainable agroecological practices that maintain productivity while enhancing resilience. Furthermore, the identified key drivers and their interactions can inform regional vegetation restoration and climate mitigation efforts—for instance, by prioritizing areas where coupled natural conditions favor higher carbon uptake. This study underscores the value of integrating spatial optimization and factor interaction analysis into land use policy design, providing a transferable framework for other regions facing similar climate and land use pressures.

Author Contributions

B.L.: Conceptualization, Methodology, Investigation, Resources, Software, Writing—original draft, Writing—review and editing; Q.J.: Funding acquisition, Supervision, Writing—review and editing; Z.W.: Conceptualization, Methodology, Resources, Validation. Y.Z.: Conceptualization, Resources, Writing—review and editing; M.T.: Resources; Y.Q.: Methodology. All authors have read and agreed to the published version of the manuscript.

Funding

This research was funded by the National Natural Science Foundation of China [grant number 52479006 (Q.J.), 52409011 (Y.Z.)].

Data Availability Statement

The original contributions presented in this study are included in the article. Further inquiries can be directed to the corresponding authors.

Conflicts of Interest

The authors declare that they have no known competing financial interests or personal relationships that could have appeared to influence the work reported in this paper.

Appendix A

Table A1. Land cover types classified by IGBP.
ValueNameDescription
1Evergreen Needleleaf ForestsDominated by evergreen conifer trees (canopy > 2 m). Tree cover >60%.
2Evergreen Broadleaf ForestsDominated by evergreen broadleaf and palmate
trees (canopy > 2 m). Tree cover >60%.
3Deciduous Needleleaf ForestsDominated by deciduous needleleaf (larch) trees
(canopy > 2 m). Tree cover >60%.
4Deciduous Broadleaf ForestsDominated by deciduous broadleaf trees (canopy > 2 m). Tree cover >60%.
5Mixed ForestsDominated by neither deciduous nor evergreen
(40–60% of each) tree type (canopy > 2 m). Tree
cover >60%.
6Closed ShrublandsDominated by woody perennials (1–2 m height)
> 60% cover.
7Open ShrublandsDominated by woody perennials (1–2 m height)
10–60% cover.
8Woody SavannasTree cover 30–60% (canopy > 2 m).
9SavannasTree cover 10–30% (canopy > 2 m).
10GrasslandsDominated by herbaceous annuals (<2 m).
11Permanent WetlandsPermanently inundated lands with 30–60% water
cover and >10% vegetated cover.
12CroplandsAt least 60% of area is cultivated cropland.
13Urban and Built-up LandsAt least 30% impervious surface area including
building materials, asphalt, and vehicles.
14Cropland/Natural Vegetation MosaicsMosaics of small-scale cultivation 40–60% with
natural tree, shrub, or herbaceous vegetation.
15Permanent Snow and IceAt least 60% of area is covered by snow and ice
for at least 10 months of the year.
16BarrenAt least 60% of area is non-vegetated barren
(sand, rock, soil) areas with less than 10% vegetation.
17Water BodiesAt least 60% of area is covered by permanent water bodies.
Table A2. Reclassification of land cover types based on IGBP classification.
CategoryCoding inMCD12Q1Recoded Classification in Study
Cropland12, 141
Forest1, 2, 3, 4, 5, 8, 92
SGO6, 7, 10, 113
Urban134
Bare area165
WIS15, 176
Figure A1. Calculation steps of Theil–Sen median–Mann–Kendall test.
Agronomy 15 02304 g0a1

References

  1. Cao, M.; Woodward, F.I. Dynamic responses of terrestrial ecosystem carbon cycling to global climate change. Nature 1998, 393, 249–252. [Google Scholar] [CrossRef]
  2. Liu, J.; Chen, J.M.; Cihlar, J.; Chen, W.; Liu, J.; Chen, J.M.; Cihlar, J.; Chen, W. Net primary productivity distribution in the BOREAS region from a process model using satellite and surface data. J. Geophys. Res. 1999, 104, 27735–27754. [Google Scholar]
  3. Field, C.B.; Behrenfeld, M.J.; Randerson, J.T.; Falkowski, P. Primary Production of the Biosphere: Integrating Terrestrial and Oceanic Components. Science 1998, 281, 237–240. [Google Scholar] [CrossRef]
  4. Zhu, W.Q.; Pan, Y.Z.; Long, Z.H.; Chen, Y.H.; Li, J.; H, H.B. Estimating Net Primary Productivity of Terrestrial Vegetation Based on GIS and RS:A Case Study in Inner Mongolia, China. Natl. Remote Sens. Bull. 2005, 3, 300–307. [Google Scholar]
  5. Bejagam, V.; Sharma, A. Impact of climatic changes and anthropogenic activities on ecosystem net primary productivity in India during 2001–2019. Ecol. Inform. 2022, 70, 101732. [Google Scholar] [CrossRef]
  6. Lehnert, L.W.; Wesche, K.; Trachte, K.; Reudenbach, C.; Bendix, J. Climate variability rather than overstocking causes recent large scale cover changes of Tibetan pastures. Sci. Rep. 2016, 6, 24367. [Google Scholar] [CrossRef] [PubMed]
  7. Byrne, K.M.; Adler, P.B.; Lauenroth, W.K. Contrasting effects of precipitation manipulations in two Great Plains plant communities. J. Veg. Sci. 2017, 28, 238–249. [Google Scholar] [CrossRef]
  8. Jiang, H.; Xu, X.; Guan, M.; Wang, L.; Huang, Y.; Jiang, Y. Determining the contributions of climate change and human activities to vegetation dynamics in agro-pastural transitional zone of northern China from 2000 to 2015. Sci. Total Environ. 2020, 718, 134871. [Google Scholar] [CrossRef]
  9. Yuan, M.; Zhu, Q.; Zhang, J.; Liu, J.; Chen, H.; Peng, C.; Li, P.; Li, M.; Wang, M.; Zhao, P. Global response of terrestrial gross primary productivity to climate extremes. Sci. Total Environ. 2021, 750, 142337. [Google Scholar] [CrossRef]
  10. Kumar, D.; Pfeiffer, M.; Gaillard, C.; Langan, L.; Scheiter, S. Climate change and elevated CO2 favor forest over savanna under different future scenarios in South Asia. Biogeosciences 2021, 18, 2957–2979. [Google Scholar] [CrossRef]
  11. Liu, Y.; Li, Z.; Chen, Y. Continuous warming shift greening towards browning in the Southeast and Northwest High Mountain Asia. Sci. Rep. 2021, 11, 17920. [Google Scholar] [CrossRef] [PubMed]
  12. Zhang, Y.; Peña-Arancibia, J.L.; McVicar, T.R.; Chiew, F.H.S.; Vaze, J.; Liu, C.; Lu, X.; Zheng, H.; Wang, Y.; Liu, Y.Y.; et al. Multi-decadal trends in global terrestrial evapotranspiration and its components. Sci. Rep. 2016, 6, 19124. [Google Scholar] [CrossRef] [PubMed]
  13. Stocker, B.D.; Zscheischler, J.; Keenan, T.F.; Prentice, I.C.; Peñuelas, J.; Seneviratne, S.I. Quantifying soil moisture impacts on light use efficiency across biomes. New Phytol. 2018, 218, 1430–1449. [Google Scholar] [CrossRef] [PubMed]
  14. Körner, C. The use of ‘altitude’ in ecological research. Trends Ecol. Evol. 2007, 22, 569–574. [Google Scholar] [CrossRef]
  15. Yi, M.; Zhang, D.; An, Z.; Li, K.; Shang, L.; Sui, K. Analysis of Spatiotemporal Variation and Driving Forces of Vegetation Net Primary Productivity in the North China Plain over the Past Two Decades. Agronomy 2025, 15, 975. [Google Scholar] [CrossRef]
  16. Liang, W.; Yang, Y.T.; Fan, D.M.; Guan, H.D.; Zhang, T.; Long, D.; Zhou, Y.; Bai, D. Analysis of spatial and temporal patterns of net primary production and their climate controls in China from 1982 to 2010. Agric. For. Meteorol. 2015, 204, 22–36. [Google Scholar] [CrossRef]
  17. Yan, J.X.; Huang, H.; Gao, Y.H.; Zhang, Y. Estimation and Spatial-Temporal Dynamics of Long-term Sequenced Vegetation Net Primary Productivity in Jilin Province. J. Soil Water Conserv. 2021, 35, 172–180. [Google Scholar]
  18. Shao, J.H.; Li, J.; Yan, X.G.; Ma, T.; Zhang, Z. Analysis of Spatiotemporal Variation Characteristics and Driving Forces of NPP in Shanxi Province from 2000 to 2020 Based on Geodetector. Environ. Sci. 2023, 44, 312–322. [Google Scholar]
  19. Zhou, Y.Y.; Yue, D.X.; Li, C.; Mu, X.L.; Guo, J.J. Identifying the spatial drivers of net primary productivity: A case study in the Bailong River Basin, China. Glob. Ecol. Conserv. 2021, 28, e01685. [Google Scholar] [CrossRef]
  20. Guo, Y.; Yang, Y.; Yang, D.; Zhang, L.; Zheng, H.; Xiong, J.; Ruan, F.; Han, J.; Liu, Z. Warming leads to both earlier and later snowmelt floods over the past 70 years. Nat. Commun. 2025, 16, 3663. [Google Scholar] [CrossRef]
  21. Cui, N.B.; Wang, S.N. Dynamic change and trend analysis of cultivated land pressure in typical black soil areas of Northeast China under food security. Trans. Chin. Soc. Agric. Eng. 2022, 38, 220–230. [Google Scholar]
  22. Wang, Z.Q.; Liu, B.Y.; Wang, X.Y.; Gao, X.F.; Liu, G. Erosion effect on the productivity of black soil in Northeast China. Sci. China Ser. D Earth Sci. 2009, 52, 1005–1021. [Google Scholar] [CrossRef]
  23. Sun, B.F.; Zhao, H.; Lu, F.; Wang, X.K. Spatial and temporal patterns of carbon sequestration in the Northeastern Forest Regions and its impact factors analysis. Acta Ecol. Sin. 2018, 38, 4975–4983. [Google Scholar] [CrossRef]
  24. Friedl, M.; Sulla-Menashe, D. MCD12Q1 MODIS/Terra+Aqua Land Cover Type Yearly L3 Global 500m SIN Grid V006 2019; NASA Land Processes Distributed Active Archive Center: Sioux Falls, SD, USA, 2019.
  25. Jing, Q.Q.; He, J.J.; Li, Y.R.; Yang, X.Y.; Peng, Y.; Wang, H.; Yu, F.; Wu, J.; Gong, S.; Che, H.; et al. Analysis of the spatiotemporal changes in global land cover from 2001 to 2020. Sci. Total Environ. 2024, 908, 168354. [Google Scholar] [CrossRef]
  26. Wang, D.C.; Gong, J.H.; Chen, L.D.; Zhang, L.H.; Song, Y.Q.; Yue, Y.J. Spatio-temporal pattern analysis of land use/cover change trajectories in Xihe watershed. Int. J. Appl. Earth Obs. Geoinf. 2012, 14, 12–21. [Google Scholar] [CrossRef]
  27. Cai, B.F.; Yu, R. Advance and evaluation in the long time series vegetation trends research based on remote sensing. Natl. Remote Sens. Bull. 2009, 13, 1170–1186. [Google Scholar]
  28. Wang, J.F.; Xu, C.D. Geodetector: Principle and prospective. Acta Geogr. Sin. 2017, 72, 116–134. [Google Scholar]
  29. Song, Y.Z.; Wang, J.; Ge, Y.; Xu, C.D. An optimal parameters-based geographical detector model enhances geographic characteristics of explanatory variables for spatial heterogeneity analysis: Cases with different types of spatial data. GIScience Remote Sens. 2020, 57, 593–610. [Google Scholar] [CrossRef]
  30. Duan, Y.Y.; Pei, X.; Luo, J.; Zhang, X.C.; Luo, L.G. Disentangling the Spatiotemporal Dynamics, Drivers, and Recovery of NPP in Co-Seismic Landslides: A Case Study of the 2017 Jiuzhaigou Earthquake, China. Forests 2024, 15, 1381. [Google Scholar] [CrossRef]
  31. Muller, K. Statistical Power Analysis for the Behavioral Sciences. Technometrics 1989, 31, 499–500. [Google Scholar] [CrossRef]
  32. Verburg, P.H.; Soepboer, W.; Veldkamp, A.; Limpiada, R.; Espaldon, V.; Mastura, S.S.A. Modeling the spatial dynamics of regional land use: The CLUE-S model. Environ. Manag. 2002, 30, 391–405. [Google Scholar] [CrossRef]
  33. Castella, J.-C.; Verburg, P.H. Combination of process-oriented and pattern-oriented models of land-use change in a mountain area of Vietnam. Ecol. Model. 2007, 202, 410–420. [Google Scholar] [CrossRef]
  34. Wang, J.K.; Xu, X.R.; Pei, J.B.; Li, S.Y. Current Situations of Black Soil Quality and Facing Opportunities andChallenges in Northeast China. Chin. J. Soil Sci. 2021, 52, 695–701. [Google Scholar]
  35. Xu, Z.Y. Study on development potential and layout of farmland irrigation in Heilongjiang Province. Heilongjiang Hydraul. Sci. Technol. 2025, 53, 65–68. [Google Scholar]
  36. Luo, P.P.; Liu, Y.K.; Chen, Y.; Liu, Y.L.; Tian, S.Y.; Qi, F.K. Spatiotemporal patterns and influencing factors of vegetation NPP in Heilongjiang Province. Environ. Ecol. 2024, 6, 19–29+36. [Google Scholar]
  37. Chen, C.X.; Yu, M.; Wu, M.X.; Yu, B.; Mao, Z.J. Analysis of driving factors of terrestrial vegetation NPP in Heilongjiang Province from 2000 to 2020. J. Northeast Agric. Univ. 2022, 53, 20–28+75. [Google Scholar]
  38. Chen, C.X.; Yu, M.; Mao, Z.J.; Xie, L.N.; Zhang, Y.C.; Sun, T.; Xu, Z.; Wu, S.; Li, Q.; Xu, J. Spatial-Temporal Evolution and Patterns of Abrupt Changs of NPP in Heilongjiang Province in the Process of Ecological Protection and Restoration in China. Sci. Silvae Sin. 2022, 58, 23–31. [Google Scholar]
  39. Lu, F.; Hu, H.F.; Sun, W.J.; Zhu, J.J.; Liu, G.B.; Zhou, W.; Zhang, Q.; Shi, P.; Liu, X.; Wu, X.; et al. Effects of national ecological restoration projects on carbon sequestration in China from 2001 to 2010. Proc. Natl. Acad. Sci. USA 2018, 115, 4039–4044. [Google Scholar] [CrossRef]
  40. Deng, L.; Liu, G.; Shangguan, Z. Land use conversion and changing soil carbon stocks in China’s ‘Grain-for-Green’ Program: A synthesis. Glob. Change Biol. 2014, 20, 3544–3556. [Google Scholar] [CrossRef]
  41. Wang, J.F.; Huang, Q.Y.; Xi, L.H.; Cao, H.J.; Wang, J.B.; Dong, H.; Zeng, S.; Ni, H. Relationship between Plant Community Species Diversity and Vegetation Carbon Storage in Songnen Grassland. Chin. J. Grassl. 2022, 44, 33–42. [Google Scholar]
  42. He, C.; Tian, J.; Gao, B.; Zhao, Y. Differentiating climate- and human-induced drivers of grassland degradation in the Liao River Basin, China. Environ. Monit. Assess. 2015, 187, 4199. [Google Scholar] [CrossRef] [PubMed]
  43. Hou, L.L.; Xia, F.; Chen, Q.H.; Huang, J.; He, Y.; Rose, N.; Rozelle, S. Grassland ecological compensation policy in China improves grassland quality and increases herders’ income. Nat. Commun. 2021, 12, 4683. [Google Scholar] [CrossRef] [PubMed]
  44. Piao, S.; Wang, X.; Park, T.; Chen, C.; Lian, X.; He, Y.; Bjerke, J.W.; Chen, A.; Ciais, P.; Tømmervik, H.; et al. Characteristics, drivers and feedbacks of global greening. Nat. Rev. Earth Environ. 2019, 1, 14–27. [Google Scholar] [CrossRef]
  45. Bonan, G.B. Forests and Climate Change: Forcings, Feedbacks, and the Climate Benefits of Forests. Science 2008, 320, 1444–1449. [Google Scholar] [CrossRef] [PubMed]
  46. Wang, Z.; Liang, C.; Liu, J.; Liu, H.; Xu, X.; Xue, P.; Gong, H.; Jiao, F.; Zhang, M. How urbanization shapes the ecosystem carbon sink of vegetation in China: A spatiotemporal analysis of direct and indirect effects. Urban Clim. 2024, 55, 101896. [Google Scholar] [CrossRef]
  47. Bennie, J.; Huntley, B.; Wiltshire, A.; Hill, M.O.; Baxter, R. Slope, aspect and climate: Spatially explicit and implicit models of topographic microclimate in chalk grassland. Ecol. Model. 2008, 216, 47–59. [Google Scholar] [CrossRef]
  48. Wiesmeier, M.; Urbanski, L.; Hobley, E.; Lang, B.; von Lützow, M.; Marin-Spiotta, E.; van Wesemael, B.; Rabot, E.; Ließ, M.; Garcia-Franco, N.; et al. Soil organic carbon storage as a key function of soils—A review of drivers and indicators at various scales. Geoderma 2019, 333, 149–162. [Google Scholar] [CrossRef]
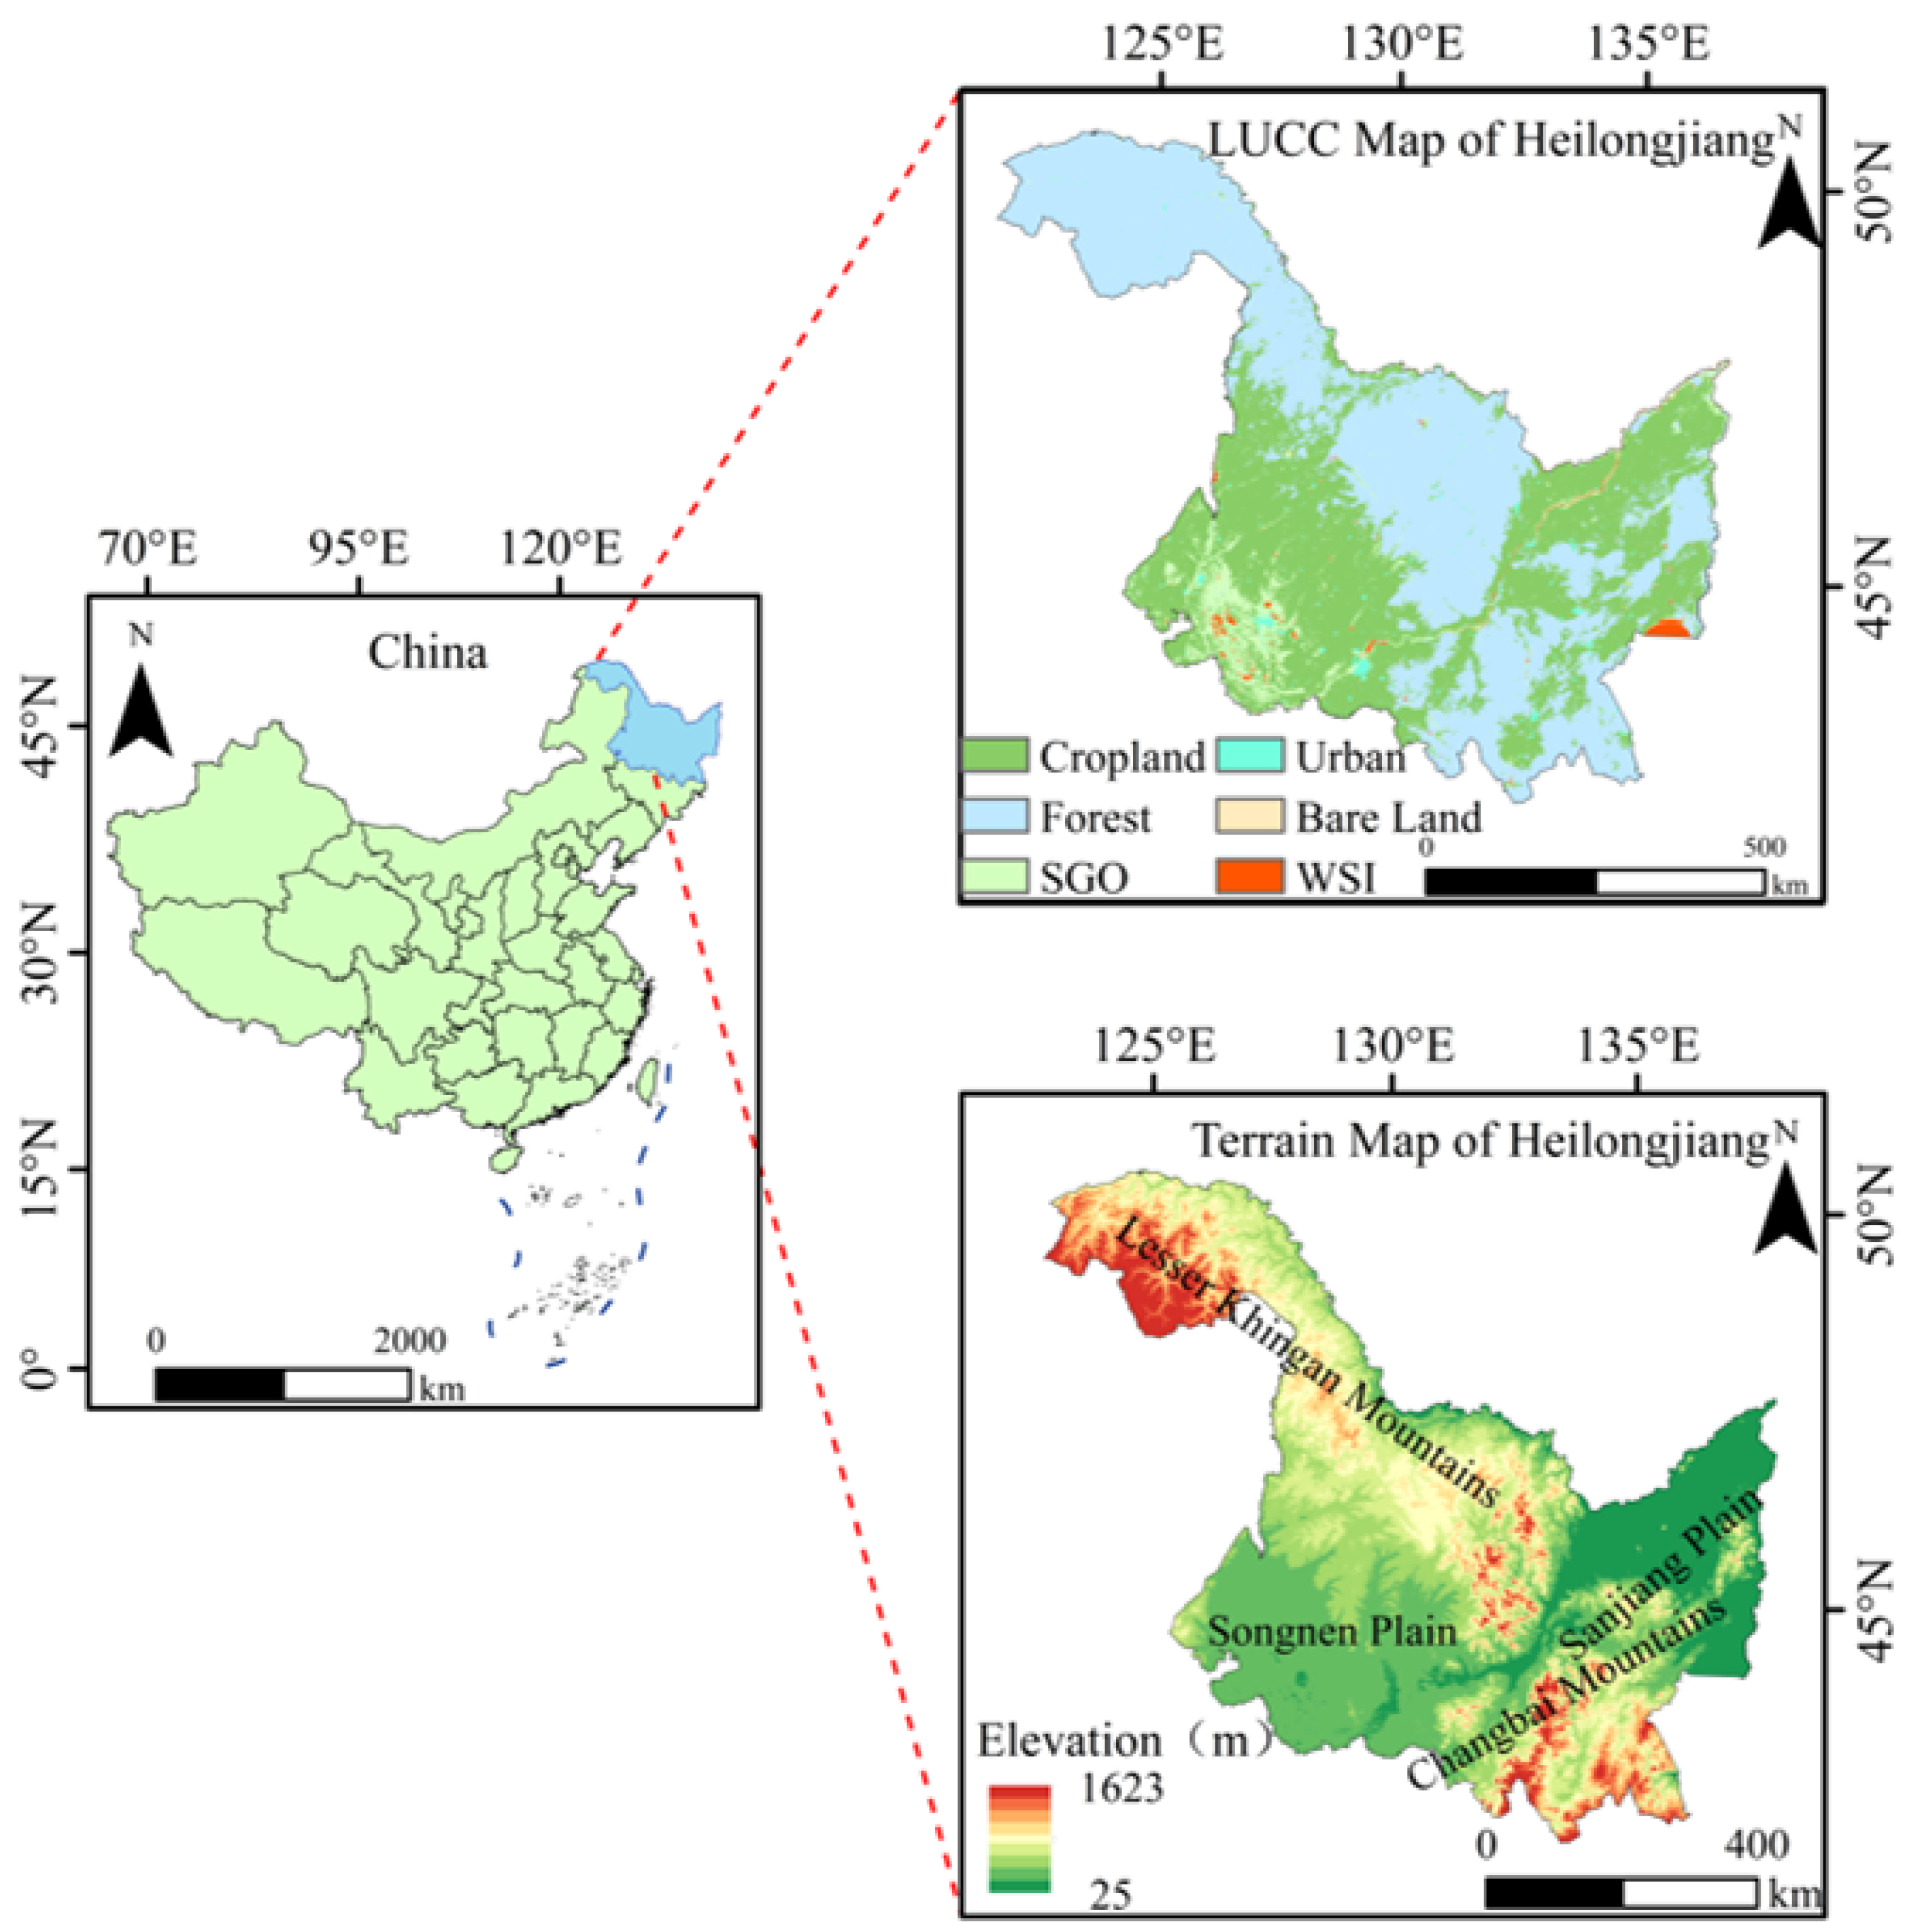
Figure 1. Overview of the research area.
Agronomy 15 02304 g001
Figure 2. Research process diagram.
Agronomy 15 02304 g002
Figure 3. Spatial distribution of predominant land use types in Heilongjiang Province from 2001 to 2022.
Agronomy 15 02304 g003
Figure 4. (a) Spatial distribution of mean NPP; (b) Mean NPP across different land use types.
Agronomy 15 02304 g004
Figure 5. (a) Spatial distribution of NPP trends; (b) NPP trends across different land use types. Note: Category 2, significant increase; Category 1, non-significant increase; Category 0, no significant change; Category 1, non-significant decrease; Category 2, significant decrease.
Agronomy 15 02304 g005
Figure 6. Single factor detection results of NPP across different regions.
Agronomy 15 02304 g006
Figure 7. Interaction factor detection results of total land type NPP.
Agronomy 15 02304 g007
Figure 8. Interaction factor detection results of NPP in unchanged land types.
Agronomy 15 02304 g008
Figure 9. Interaction factor detection results of NPP in altered land types.
Agronomy 15 02304 g009
Table 1. Sources and processing of influencing factor data.
Natural FactorsData SourceResolutionUnit
ELGeospatial Information Authority of Japan (https://globalmaps.github.io/el.html, accessed on 20 August 2025)1 kmm
ETMODIS/Terra Evapotranspiration Product (https://doi.org/10.5067/MODIS/MOD16A3GF.061)500 mkg/m−2·a−1
MAPNational Tibetan Plateau Data Center (https://doi.org/10.5281/zenodo.3185722)1 kmmm
TEMPNational Tibetan Plateau Data Center (https://doi.org/10.5281/zenodo.3185722)1 km°C
SMCNational Tibetan Plateau Data Center (https://doi.org/10.11888/Terre.tpdc.272415)1 kmmm
Table 2. Types of interaction detection.
Criterion for DiscriminationType of InteractionNumber
q (X1 ∩ X2) < Min [q (X1), q (X2)]Nonlinear WeakeningI
Min [q (X1), q (X2)] < q (X1 ∩ X2) < Max [q (X1), q (X2)]Single-Factor Nonlinear WeakeningII
q (X1 ∩ X2) > Max [q (X1), q (X2)]Two-Factor EnhancementIII
q (X1 ∩ X2) = q (X1) + q (X2)IndependentIV
q (X1 ∩ X2) > q (X1) + q (X2)Nonlinear EnhancementV
Table 3. Area and proportion of various land types.
Land TypeCroplandForestSGOUrbanWISSCCFSFCFC
Area (km2)158,696201,67713,8304305291516,41713,64137863019
Percentage (%)35.0844.593.060.950.643.633.020.830.67
Disclaimer/Publisher’s Note: The statements, opinions and data contained in all publications are solely those of the individual author(s) and contributor(s) and not of MDPI and/or the editor(s). MDPI and/or the editor(s) disclaim responsibility for any injury to people or property resulting from any ideas, methods, instructions or products referred to in the content.