Article

Later Incorporation of Astragalus sinicus with Flooding Reduces Rice-Associated Weed Infestation and Increases Rice Yield in the Green Manure–Rice Rotation System

1
Jiangsu Key Laboratory of Crop Cultivation and Physiology, Jiangsu Key Laboratory of Crop Genetics and Physiology, Jiangsu Co-Innovation Center for Modern Production Technology of Grain Crops, Key Laboratory of Saline-Alkali Soil Reclamation and Utilization in Coastal Areas, Research Institute of Rice Industrial Engineering Technology, Yangzhou University, Yangzhou 225009, China
2
Agricultural and Rural Bureau of Jintan District, Changzhou 213200, China
3
Rural Bureau of Zhiqian Town, Changzhou 213215, China
4
Joint International Research Laboratory of Agriculture, Agri-Product Safety of the Ministry of Education of China, Institutes of Agricultural Science and Technology Development, Yangzhou University, Yangzhou 225009, China
*
Author to whom correspondence should be addressed.
Agronomy 2025, 15(10), 2291; https://doi.org/10.3390/agronomy15102291
Submission received: 27 August 2025 / Revised: 24 September 2025 / Accepted: 25 September 2025 / Published: 27 September 2025
(This article belongs to the Section Weed Science and Weed Management)

Abstract

Chinese milk vetch (CMV; Astragalus sinicus L.), serving as winter green manure in rice cropping systems, is widely adopted in the southern China. Field experiments including different incorporation regimes (CMV incorporation, urea substitution incorporation and fertilizer-free incorporation), times (45 days, 30 days and 15 days before rice transplanting) and methods (no flooding, intermittent flooding and continuous flooding) were conducted from 2022 to 2024 to determine the optimal time and method for CMV incorporation that could improve soil nutrients, reduce rice-associated weed infestation, and increase rice yield. Delaying CMV incorporation was beneficial to the accumulation of dry matter and organic matter content in CMV shoots and the increase in the total nitrogen content of the soil before rice transplanting. Broadleaf weed infestation was significantly influenced by flooding method, CMV incorporation and incorporation time. Delaying CMV incorporation combined with flooding significantly reduced the density of broadleaf weeds. Grassy weed infestation was only significantly affected by the flooding method, with significantly lower density under flooding conditions compared to non-flooding conditions when other treatments were consistent. Sedge weed infestation was not affected by any of the experimental treatments. Compared with conventional CMV incorporation (incorporated 30 days before rice transplanting without flooding), incorporating CMV 15 days before rice transplanting with flooding (continuous or intermittent flooding) resulted in a 59.20–66.86% reduction in rice-associated weed infestation. Rice yield was also increased with a delay in CMV incorporation, which mainly manifested in increases in panicle number and seed setting rate. Incorporating CMV 15 days before rice transplanting increased rice yield by 5.34–13.24% compared to conventional CMV incorporation. Therefore, considering the comprehensive effects on soil nutrients, weed infestation and rice yield, incorporating CMV 15 days before rice transplanting combined with intermittent flooding is a recommended green manure management practice in green manure–rice rotation systems.

1. Introduction

Rice (Oryza sativa L.) serves as a worldwide food crop, covering more than 30% of the world’s total cereal planting area [1] and providing staple food for over half of the global population [2]. China is the world’s largest rice producing country, contributing approximately 30% of global rice production [3]. In the past 30 years, China’s rice production has grown slowly, but the application of chemical fertilizers in rice fields has increased by more than 50% [4,5]. To pursue higher yields, an increasing amount of chemical fertilizer has been applied to paddy fields and the amounts of chemical fertilizers used in rice production in China are about 75% higher than the world average level [6]. Injudicious and excessive fertilization has not only led to low nutrient utilization efficiency, but also resulted in environmental problems such as soil acidification, increased greenhouse effects, and imbalances in aquatic ecosystems in farmland [7,8,9]. Therefore, the optimal fertilizer application for high and stable rice yields to maximize fertilizer use efficiency and reduce its adverse impact on the environment has become the focus of current research.
Weed infestation is another main factor limiting rice yields. The use of chemical herbicides is the main method of weed control in rice fields in China. In recent years, due to the rapid development of small seedling mechanical transplanting and direct seeding of rice, the dependence on chemical herbicides has become more severe [10], resulting in a significant increase in weed control costs for rice production [5]. The long-term and extensive use of chemical herbicides in paddy fields has also led to the development of resistant weeds, occurrence of pesticide injury, water pollution, and decreased species biodiversity [11,12,13], posing a serious threat to food and biological safety, ecological environment protection and sustainable development of rice production. How to effectively control weeds and significantly reduce the application of chemical herbicides has become a major challenge that urgently needs to be solved in rice production.
Green manure serving as a winter cover crop is an effective measure to reduce rice production costs and environmental degradation [14]. Green manure is an important organic fertilizer material that increases soil organic matter content, supplements soil nutrients and maintains agricultural fertility [15,16,17,18]. After incorporating green manure into soil it changes the soil’s structure and physical and chemical properties [19,20] and releases allelopathic substances [21], which could also have impacts on weed germination and growth. Norsworthy et al. [22] illustrated the potential for using Brassicaceae green manures (Brassica juncea L. and Sinapis alba L.) as weed suppressants in cowpea (Vigna unguiculate) fields. Wang et al. [23] demonstrated that the water leachates of the shoots of three legume green manures (Trifolium repens, Medicago sativa and Vicia villosa) displayed significantly inhibitory effects on the germination and seedling growth of four common cropland weeds (Cynodon dactylon, Echinochloa crusgalli, Digitaria sanguinalis and Eleusine indica). Chen et al. [24] compared the effects of several green manures on early rice yields and weed communities in rice fields, which indicated that using Astragalus sinicus as green manure had significant inhibitory effects on the infestation of Monochoia vaginalis and Echinochloa crus-galli in early season rice fields.
Chinese milk vetch (CMV, Astragalus sinicus L.) has been widely used as green manure and winter cover crop rotated with rice in most Asian countries, and has the unique ability to input N into the agroecosystem through biological nitrogen fixation [25]. Previous studies have demonstrated that A. sinicus is an excellent choice as an alternative to synthetic N fertilizer [16,26], altering the soil environment, increasing the N and organic matter content of the soil [16,27,28] and indicating potential for weed control during organic matter decomposition [24,29]. Most of the above studies focused on the impacts of the incorporation amount of A. sinicus or organic–inorganic fertilizer substitution ratio on soil nutrients, rice yield, or weed infestation. Usually, CMV is sown 10–20 days before rice harvesting and incorporated into soil at the blooming stage, and sometimes flooding is also conducted to accelerate its decomposition after the incorporation. However, studies on the optimal timing of CMV incorporation and whether flooding during incorporation could maximize soil nutrient improvement, reduce weed occurrence and enhance rice yield are scarce. Our objectives in the present study were to (1) identify the differences in dry weight, nitrogen and organic matter content of CMV at different incorporation times; (2) evaluate the effects of different incorporation times and methods of CMV on soil N content, rice-associated weed infestation and rice yield; and (3) determine the optimal time and method for CMV incorporation that could improve soil N content, reduce rice-associated weed infestation and increase rice yield.

2. Materials and Methods

2.1. Experimental Site

The experiment was conducted at Zhixian Town (31.67° N, 119.49° E) Changzhou City, Jiangsu Province, China. This region experiences a humid subtropical monsoon climate. The average altitude is 10 m, the mean annual temperature is 15.3 °C, the mean annual humidity is 78% and the mean annual precipitation is 1084 mm. The test soil was a gleyed paddy soil (Wushan soil), characterized by a clay loam texture, containing 9.8% sand (1 mm–0.05 mm), 38.5% coarse silt (0.05 mm–0.01 mm) and 51.7% clay (<0.01 mm). The mean, maximum and minimum temperature, rainfall, and sunlight duration of the experimental site during the different growth stages of CMV and rice from 2022 to 2024 are presented in Table 1.

2.2. Experimental Design

Normally, CMV incorporation was performed by growing CMV, ploughing or tilling it (including aboveground and underground parts) into the topsoil (15–20 cm) while blooming and allowing it to decompose to release nutrients and improve soil conditions for the next crop. The experiment started in the CMV growing season on 14 October 2022. CMV was cultivated from October 14 to May 1 of the following year, followed by summer rice cultivation from 15 June to 20 October. The field experiments were carried out with a 3 (three incorporation times) × 3 (three flooding methods) × 3 (three incorporation regimes) factorial design with four replications from 2022 to 2024 (two experimental seasons). The three incorporation times were 45 days (mid-vegetative stage of CMV), 30 days (blooming stage of CMV, conventional method) and 15 days (maturity stage of CMV) before rice transplanting. The three flooding methods were no flooding (NF, conventional method), intermittent flooding (IF, flooding in every five days with a depth of 2–3 cm above the soil surface) and continuous flooding (CF, maintaining 2–3 cm of standing water above the soil surface until rice transplanting). Flooding (IF and CF) started after CMV incorporation and ended before rice transplanting. The three incorporation regimes were CMV incorporation (GM), urea substitution incorporation (UR, replace the aboveground parts of CMV with urea of equal nitrogen content) and fertilizer-free incorporation (CK, remove the aboveground parts of CMV). At each incorporation time, the experiment plots were laid out in a split-plot design with four blocks (replications), with the flooding method as the main factor and the incorporation regime as a sub-factor (Figure 1). Each plot measured 16 m2 (4 m × 4 m) and was isolated by plastic film-wrapped ridges to prevent water and nutrient exchange between plots. CMV (Yujiangdayezi) was broadcast-seeded at a rate of 45 kg·ha−1. Rice (Nanjing 5055) was transplanted manually with a hill spacing of 12 cm and a row spacing of 30 cm (277,500 hills·ha−1), with three rice seedlings per hill. No additional fertilization was applied during the experiment. Weeds were manually removed in all plots after weed infestation surveys were completed at the mid-tillering stage of rice (approximately 28 days after transplanting). Other field management practices followed conventional rice production methods.

2.3. Data Collection

Before each incorporation, aboveground parts of CMV were sampled from each plot using the diagonal five-point sampling method (each point covering 0.25 m2) in 2022 and 2023. Samples were weighed for fresh weight, then oven-dried at 70 °C to constant weight to determine dry weight. The dried samples were ground, total nitrogen was analyzed by Kjeldahl digestion [30] and organic matter content was measured using the titration method after oxidation with K2Cr2O7 [31].
To determine the effects of different treatments on soil total nitrogen, soil samples were taken before rice transplanting (on 15 June 2023 and 15 June 2024). Six soil cores that were 3.5 cm in diameter and 15 cm deep, which is equal to the plough layer, were collected following an equidistant sampling pattern in each plot. Soil samples from each individual treatment were air-dried, ground and passed through a 4 mm sieve to remove large debris and stones.
Weed infestation was quantified by measuring weed density at the mid-tillering stage of the rice (approximately 28 days after transplanting). The diagonal five-point sampling method (each point covering 0.25 m2) was also used to record weed species and the number of individuals per species within each plot.
At rice maturity, five 1 m2 quadrats were sampled per plot using the same method as the weed survey to determine rice panicle number. Within each quadrat, five random rice hills were selected to determine the number of grains per panicle, seed-setting rate (filled and unfilled grains were separated and recorded by immersing them in clean water and seed-setting rate was calculated by the percentage of filled grains to the total grains per panicle) and 1000-grain weight. All rice plants within each quadrat were harvested and threshed, and the grain yield was determined for standard moisture content of 14.5%.

2.4. Data Analysis

Two-way analysis of variance (two-way ANOVA, p < 0.05) was used to analyze the effects of the year factor, incorporation time, their interaction on shoot biomass and organic matter content of CMV and soil total nitrogen content. Multivariate analysis of variance (MANOVA, p < 0.05) was used to analyze the effects of the year factor, incorporation time, flooding method, nitrogen incorporation, CMV incorporation, and the interactions between two of them on weed infestation, rice yield, panicle number, grains per panicle and 1000-grain weight. Prior to ANOVA, all data were tested for normality (Shapiro–Wilk test, p > 0.05) and homogeneity of variance (Levene’s test, p > 0.05). Data with unequal variances were log (x + 1) transformed to meet the assumption of homogeneity of variance. The Least Significant Difference (LSD) test (p < 0.05) was applied for multiple comparisons among treatment means. All statistical analyses were performed using SPSS 20 software (SPSS, Chicago, IL, USA) and figures were generated using OriginPro 2024b software (OriginLab, Hampton, MA, USA).

3. Results

3.1. Shoot Biomass, Nitrogen Fixation and Organic Matter Yield of Chinese Milk Vetch and Soil Total Nitrogen

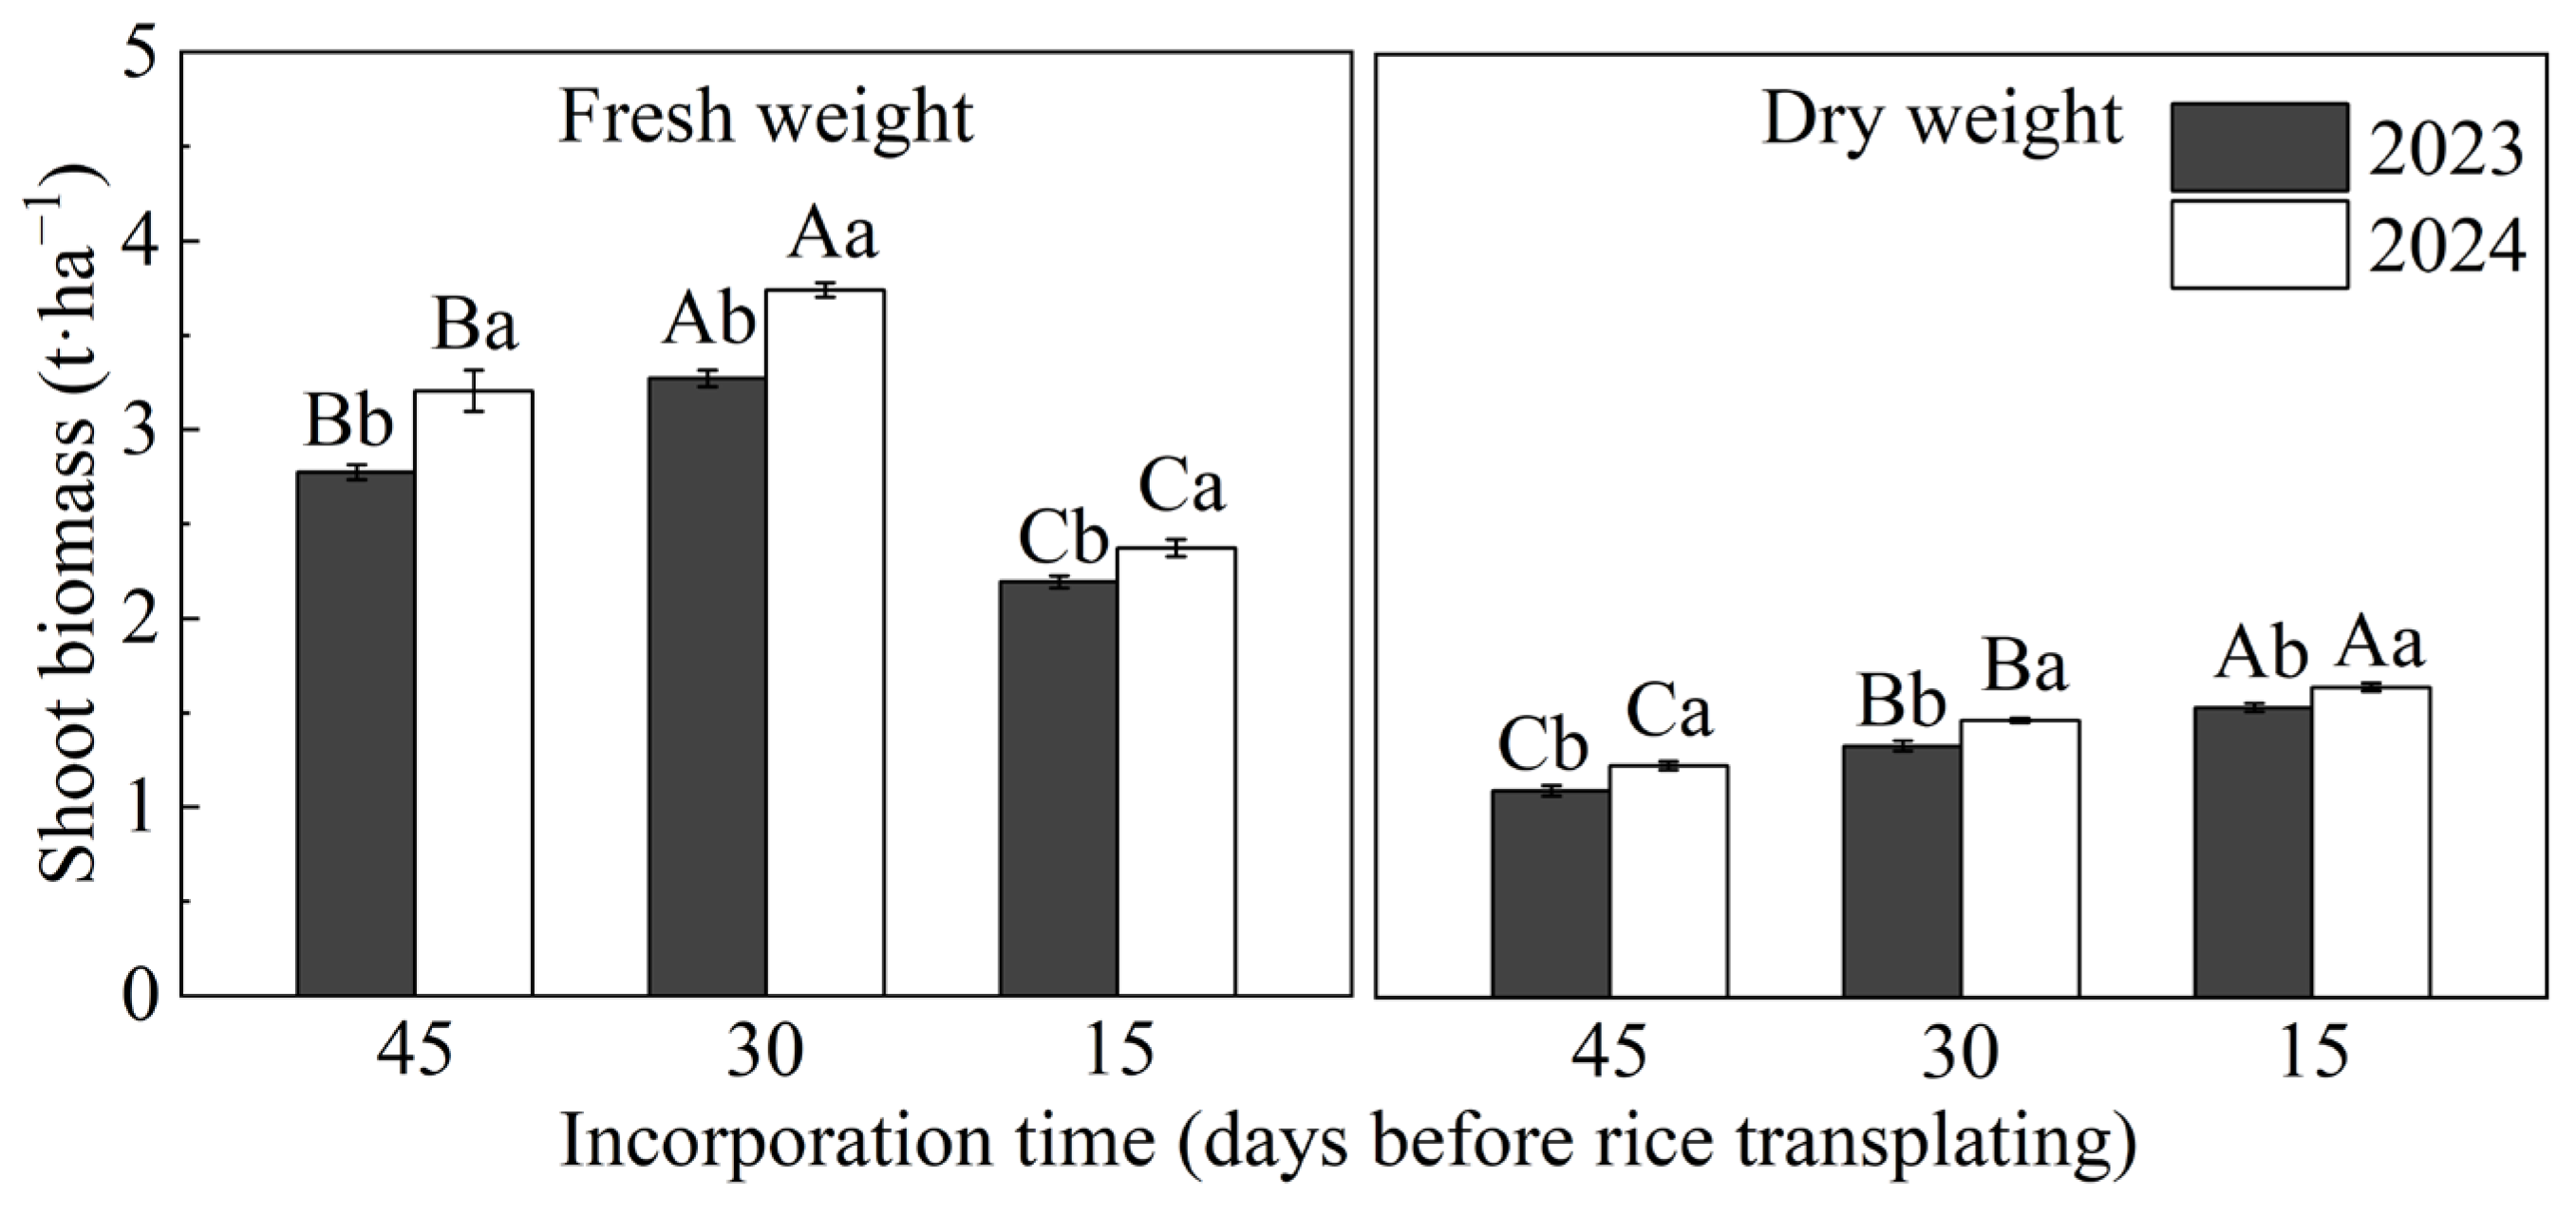
Two-way ANOVA indicated that incorporation time significantly affected the fresh weight (p < 0.01) and dry weight (p < 0.01) of CMV shoot biomass. The fresh weight initially increased and then decreased with delayed incorporation time (from mid-vegetative to blooming and then maturity of CMV; Figure 2), reaching its highest value 30 days before rice transplanting (conventional CMV incorporation time) and its lowest 15 days before transplanting. However, the dry weight of CMV shoot biomass increased with the incorporation delay, which reached its highest in 15 days before transplanting. There were significant differences in fresh weight (p < 0.01) and dry weight (p < 0.01) of CMV shoot biomass between years, with higher values in 2024 than those in 2023. Overall, compared to the conventional CMV incorporation (30 days before transplanting), delaying incorporation by 15 days increased the shoot dry weight of CMV by 12–15%.
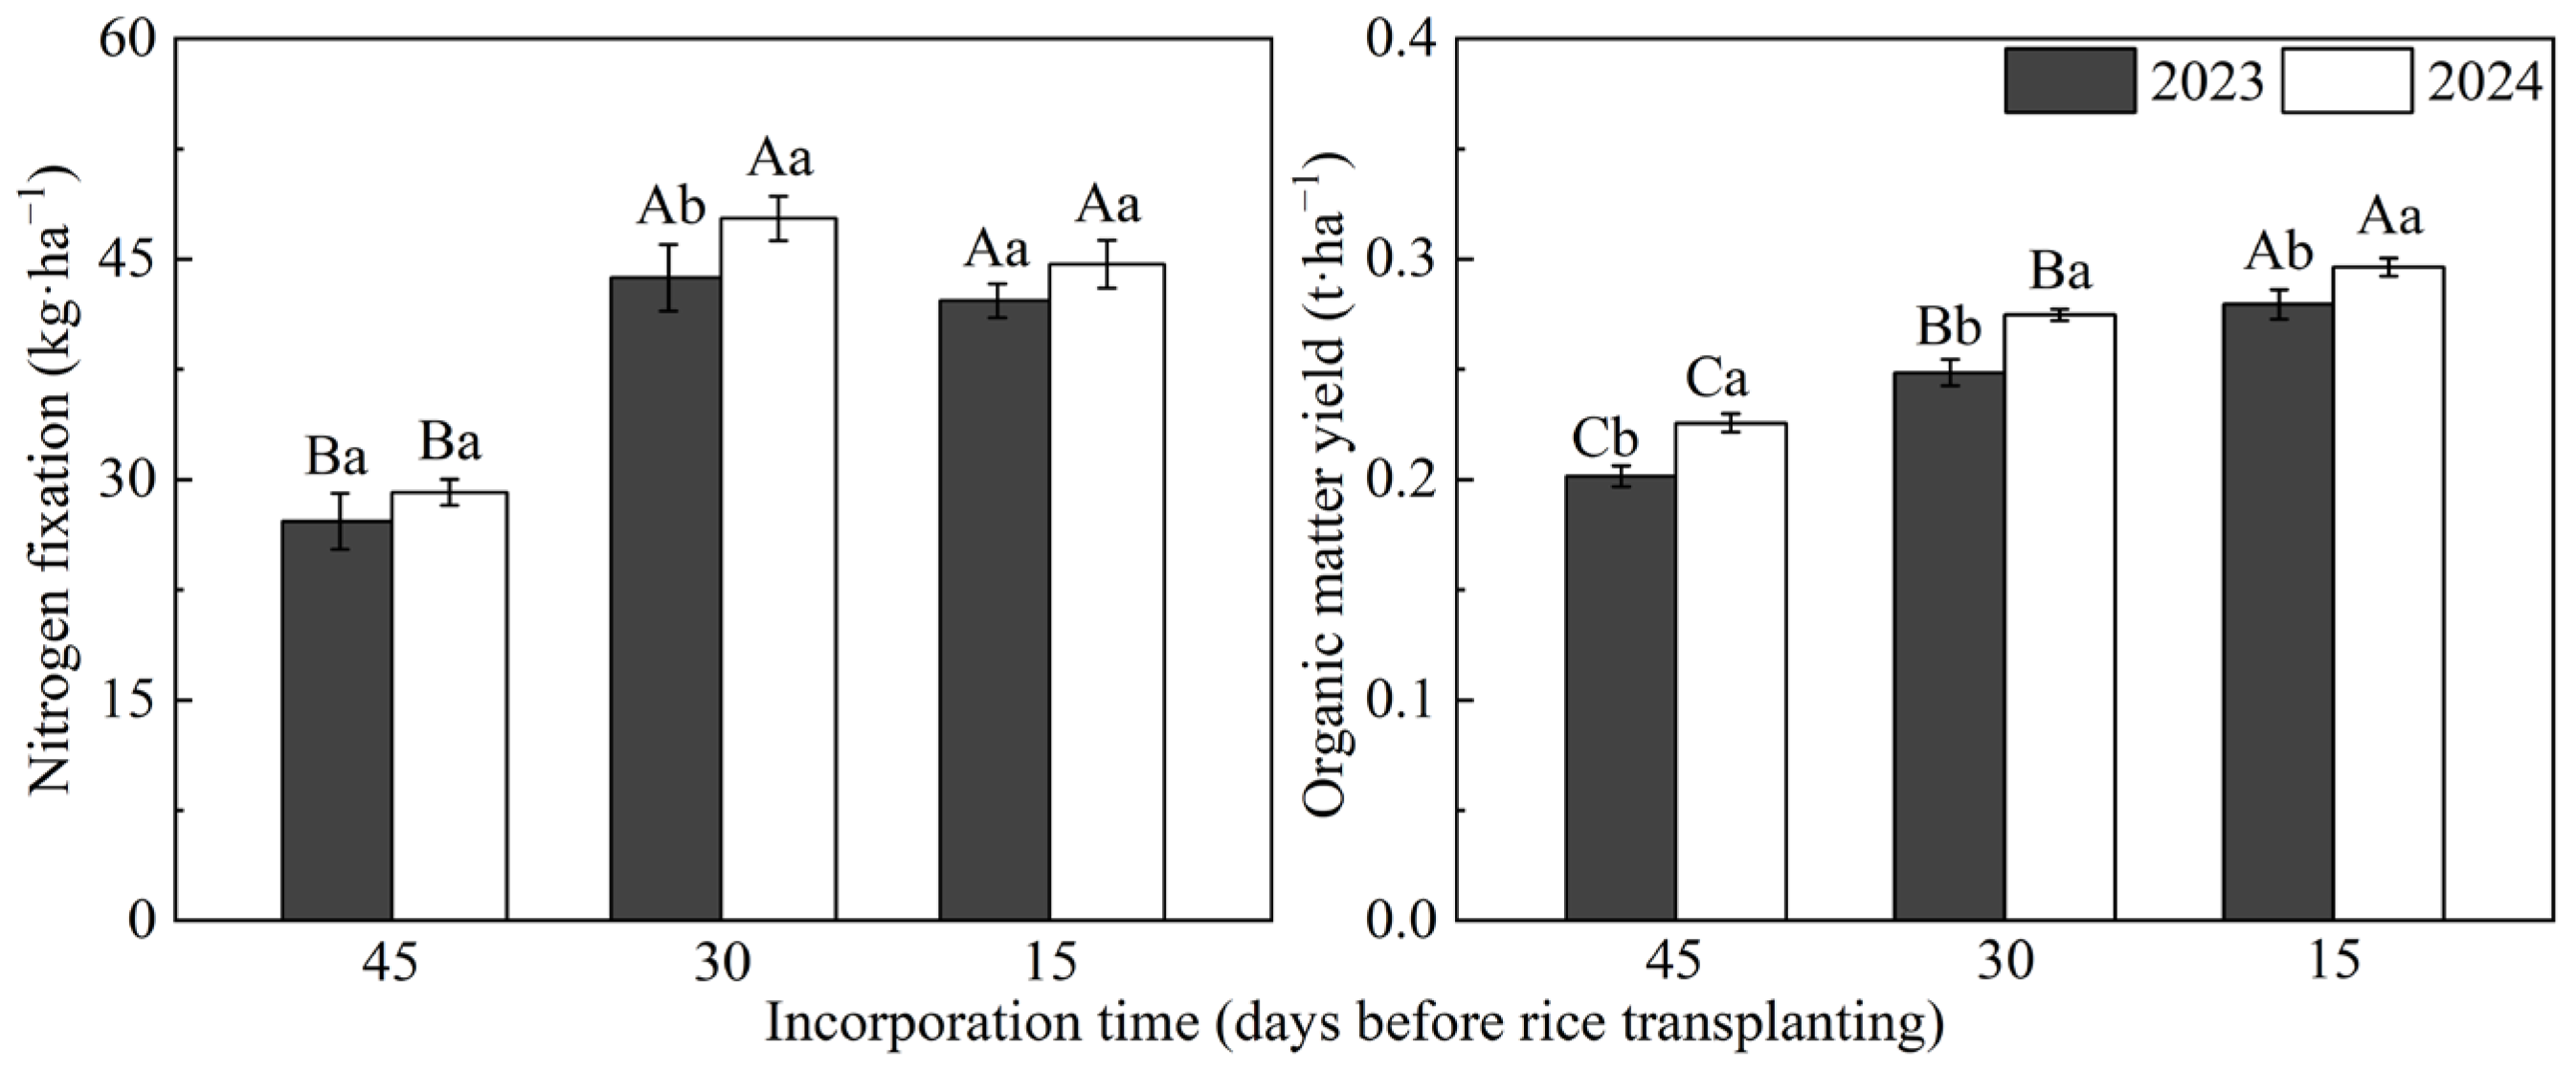
The nitrogen fixation in the aboveground parts of CMV was significantly affected by incorporation time (p < 0.001) and growing year (p = 0.042). In the same year, when milk vetch was incorporated 45 days before rice transplanting, the amount of nitrogen fixed in its aboveground parts was significantly lower than that at other incorporation times. When incorporation was carried out 15 days before transplanting, the nitrogen fixation amount in the aboveground parts showed a slight decrease compared to incorporation 30 days before transplanting, but this difference did not reach a statistically significant level. Between different years, a significant difference in the amount of nitrogen fixed in the aboveground parts of milk vetch was observed only under the treatment of incorporation 30 days before transplanting. The average nitrogen fixation amounts for the aboveground parts with incorporation 30 days before transplanting were 43.7 kg/ha and 47.8 kg/ha in 2023 and 2024, respectively. Incorporation time and growing year significantly influenced the organic matter content in the aboveground parts of CMV (p < 0.001, p < 0.001), but no significant effect of their interaction (p = 0.855) was detected. The organic matter content in the aboveground parts of CMV increased with the incorporation delay, and was significantly higher in 2024 than in 2023 across all incorporation times (Figure 3). Compared to conventional incorporation time, postponing incorporation CMV to 15 days before transplanting increased the organic matter content by 15–19%, representing an increase of 0.036–0.048 t·ha−1 organic matter returned to the field.
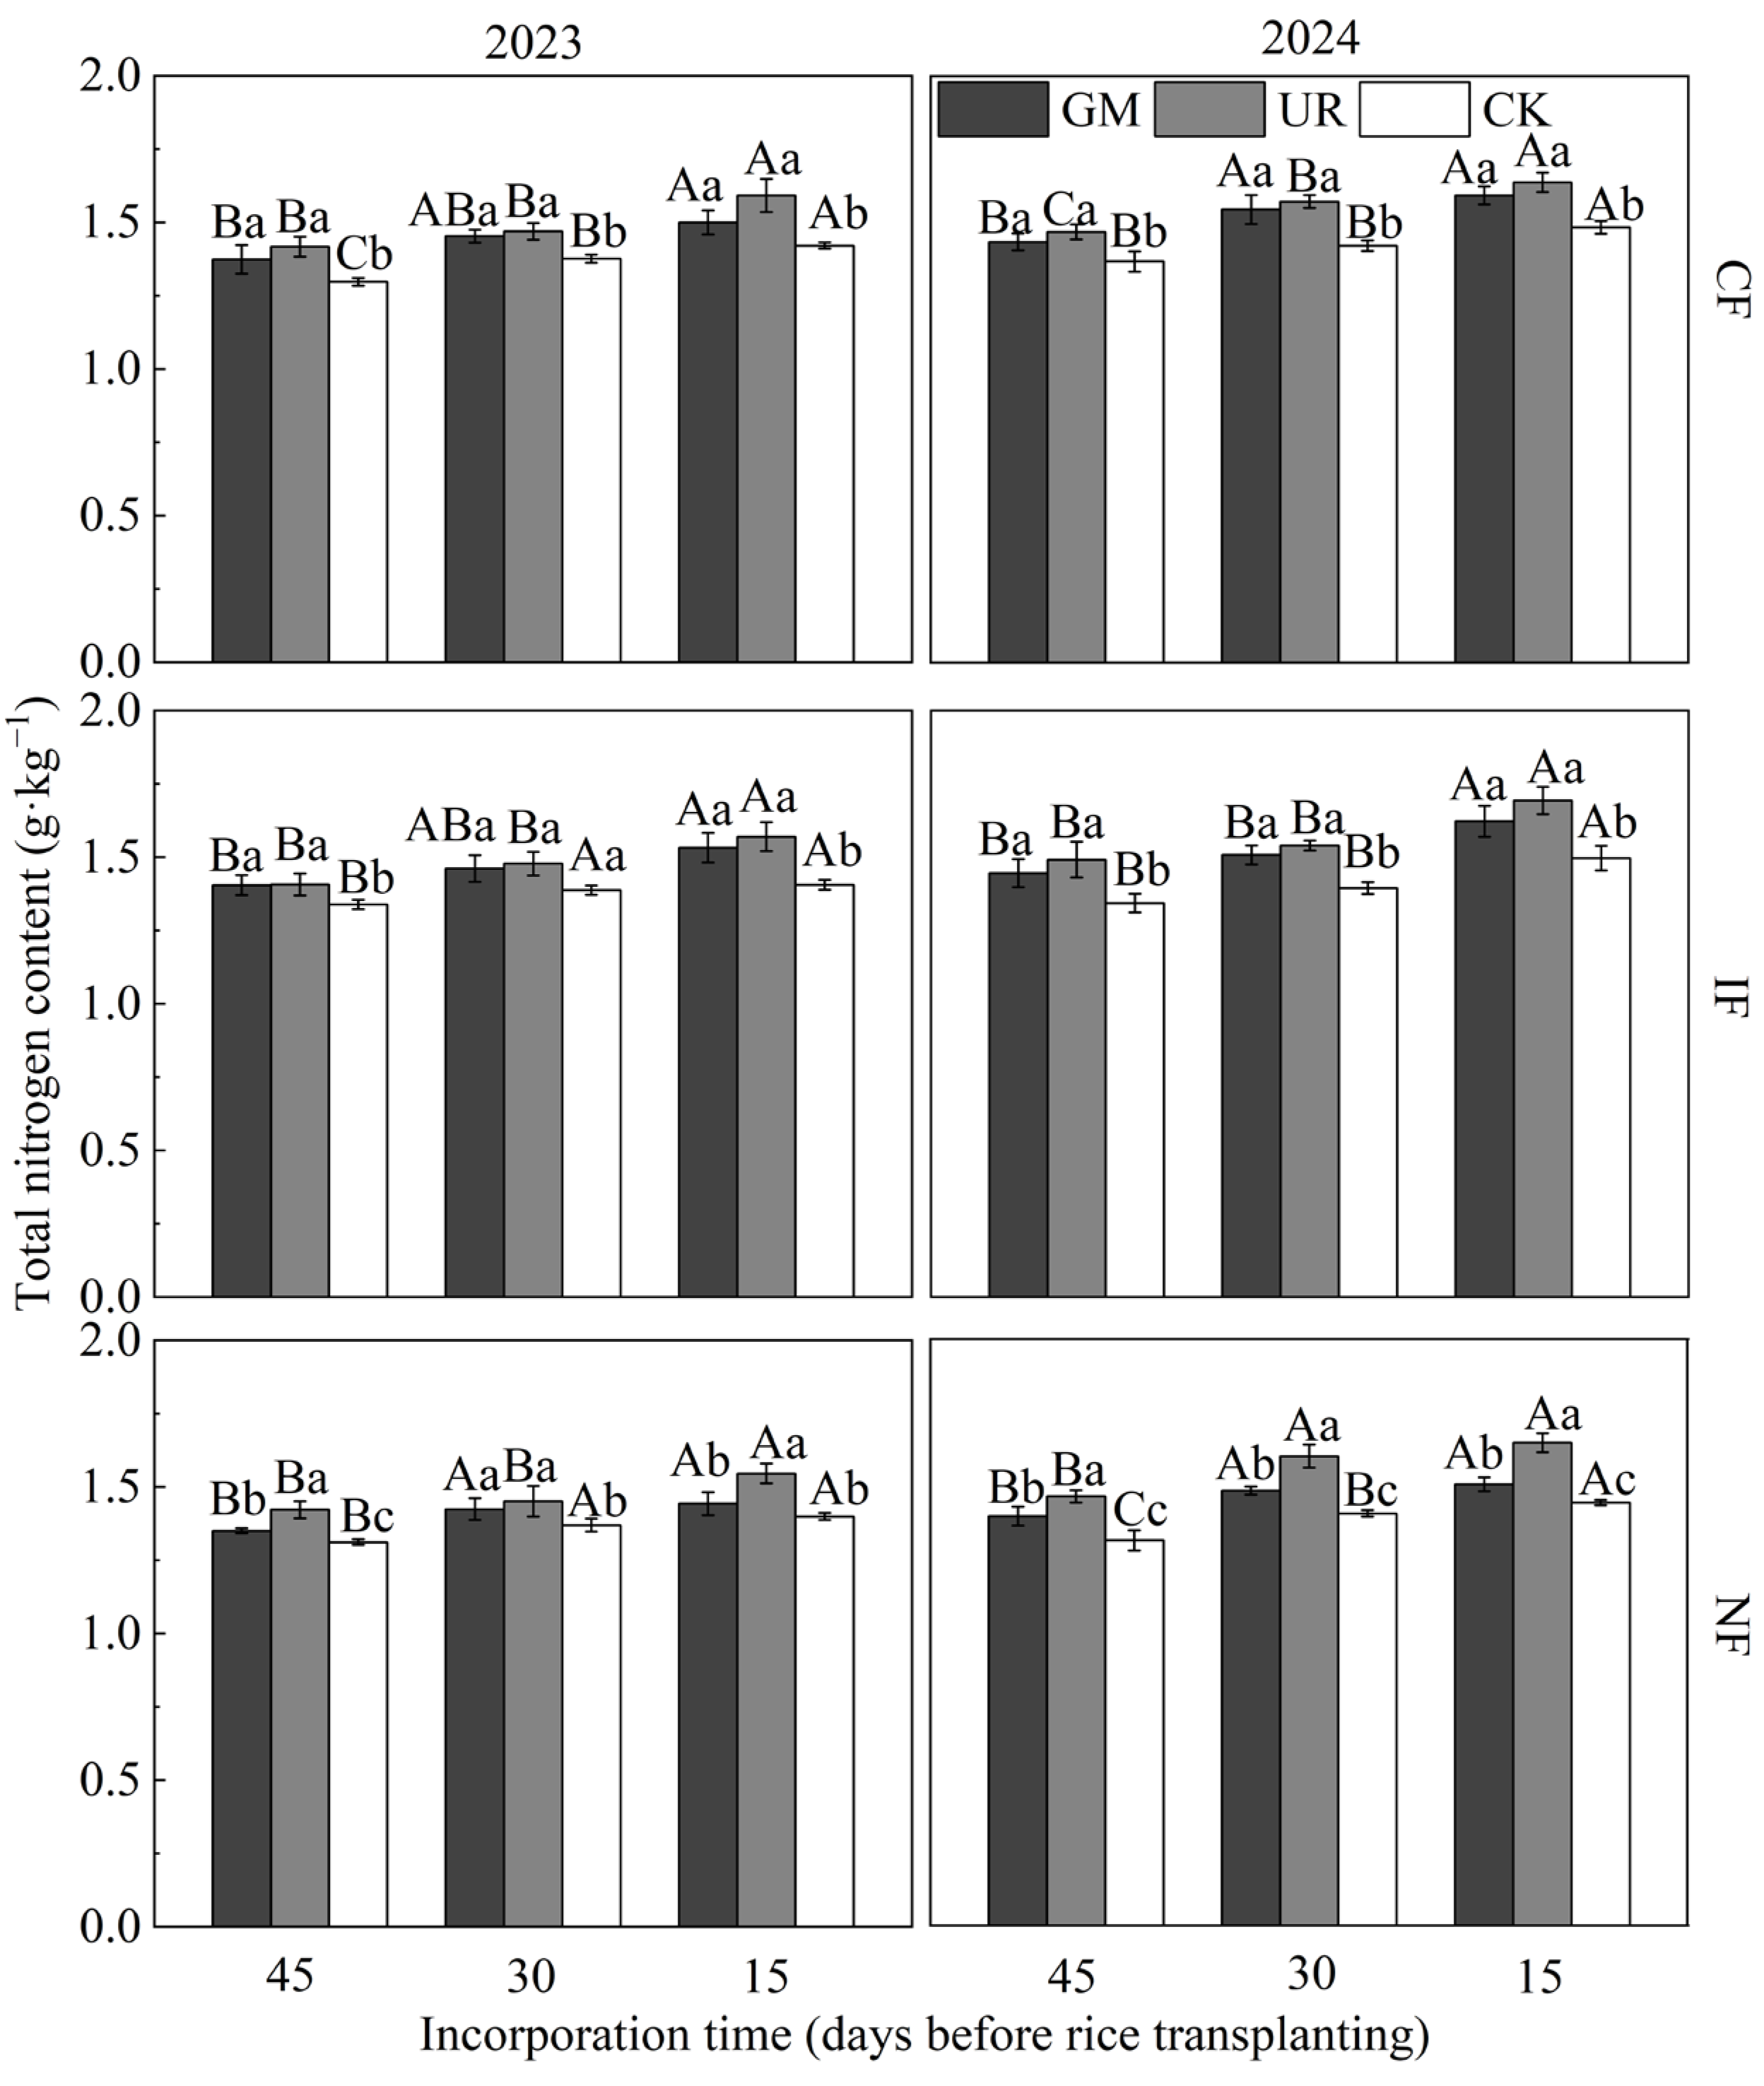
The total nitrogen (TN) content in soil before rice transplantation was significantly affected by year (p < 0.001) and incorporation time (p < 0.001). The TN content was higher in 2024 than 2023 across all treatments. Under the same incorporation regimen and flooding method, soil TN content increased with delayed incorporation time (Figure 4). In particular, soil TN content still showed a significant increasing trend with delayed incorporation time, even without CMV incorporation under the same flooding method, which indicated that postponing the incorporation contributes to an increase in nitrogen fixation in the soil by CMV. CMV incorporation (p < 0.001) and urea substitution incorporation (p < 0.001) also significantly influenced the soil TN content before rice transplantation. Under the same flooding conditions, the soil TN content in both the CMV incorporation and urea substitution incorporation regimes was higher than that in the CK treatment for each incorporation time. The urea substitution incorporation regime showed the highest TN content, which was likely due to the relatively short incorporation time for CMV, resulting in a slower release of nitrogen during decomposition compared to urea substitution. The soil TN content before rice transplantation was also significantly affected by flooding method (p = 0.006), which was lower in the no-flooding condition than those in continuous and intermittent flooding with CMV incorporation for each incorporation time.

3.2. Weed Infestation

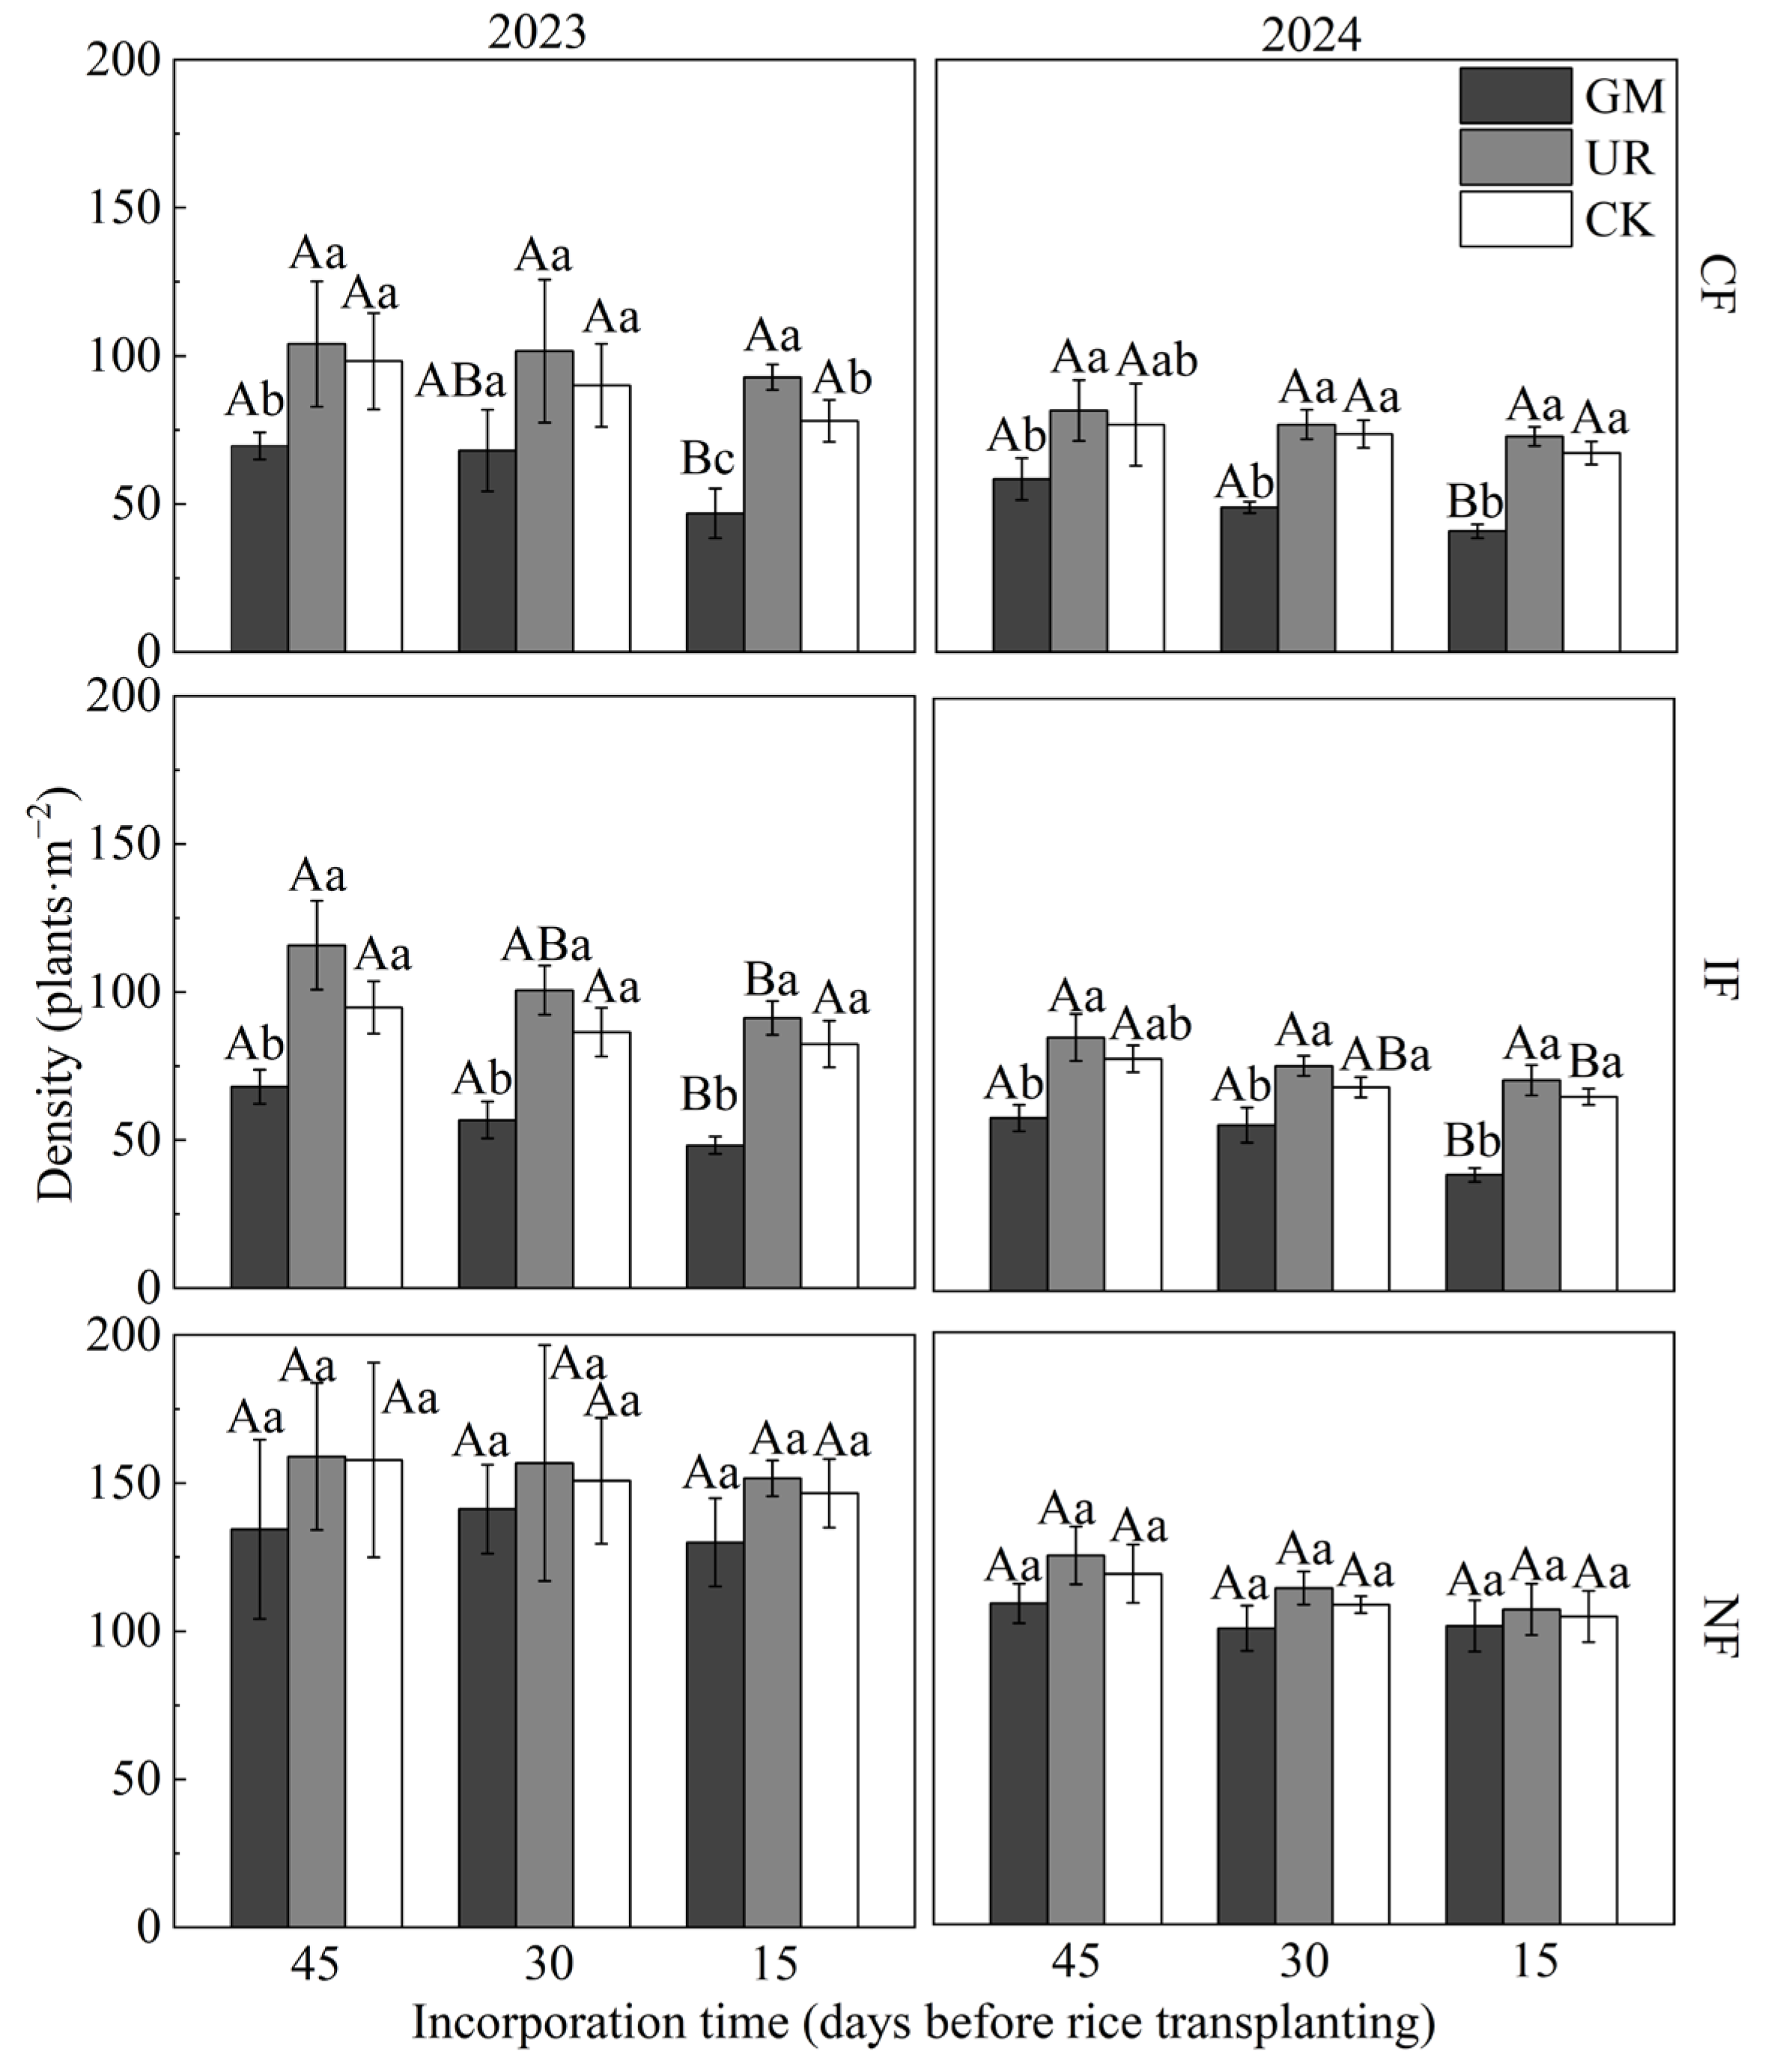
A total of 21 species belonging to 19 genera and 13 families were found in the experimental paddy fields in 2023 and 19 weed species representing 18 genera and 12 families were found in 2024 (Table 2). The total weed density in paddy fields was significantly affected by the year (p < 0.001), incorporation timing (p = 0.002), flooding method (p < 0.001), nitrogen incorporation (p = 0.043), CMV incorporation (p < 0.001) and the interaction effect between year and flooding method (p = 0.006) (Table 3). Analysis of the mean square values for variables affecting total weed density revealed that flooding method, CMV incorporation and year were the primary factors influencing variations in total weed occurrence, which accounted for 50.40%, 21.87% and 19.02% of the total variation in total weed density among treatments, respectively. The total density of rice-associated weed in 2023 was higher than in 2024 under identical treatments, but the trends in weed differences among treatments were similar across both years (Figure 5). Given the same incorporation timing and treatment, the total density of rice-associated weed under continuous and intermittent flooding was significantly lower than that under the no-flooding condition. Under continuous or intermittent flooding methods, the total density of rice-associated weed in the CMV incorporation regime was significantly lower than in treatments with urea substitution incorporation or no fertilizer incorporation for the same incorporation timing and significantly decreased with delayed incorporation timing. In contrast, no significant differences the total density of rice-associated weed were observed among treatments under the no-flooding regime within the same year. In summary, CMV incorporation contributed to reduced total weed density in paddy fields, but this effect was only significant under flooding conditions and showed a decreasing trend with delayed incorporation timing. Compared with conventional CMV incorporation (incorporated 30 days before rice transplanting without flooding), incorporating CMV 15 days before rice transplanting with flooding (continuous or intermittent flooding) resulted in a 59.20–66.86% reduction in rice-associated weed infestation.
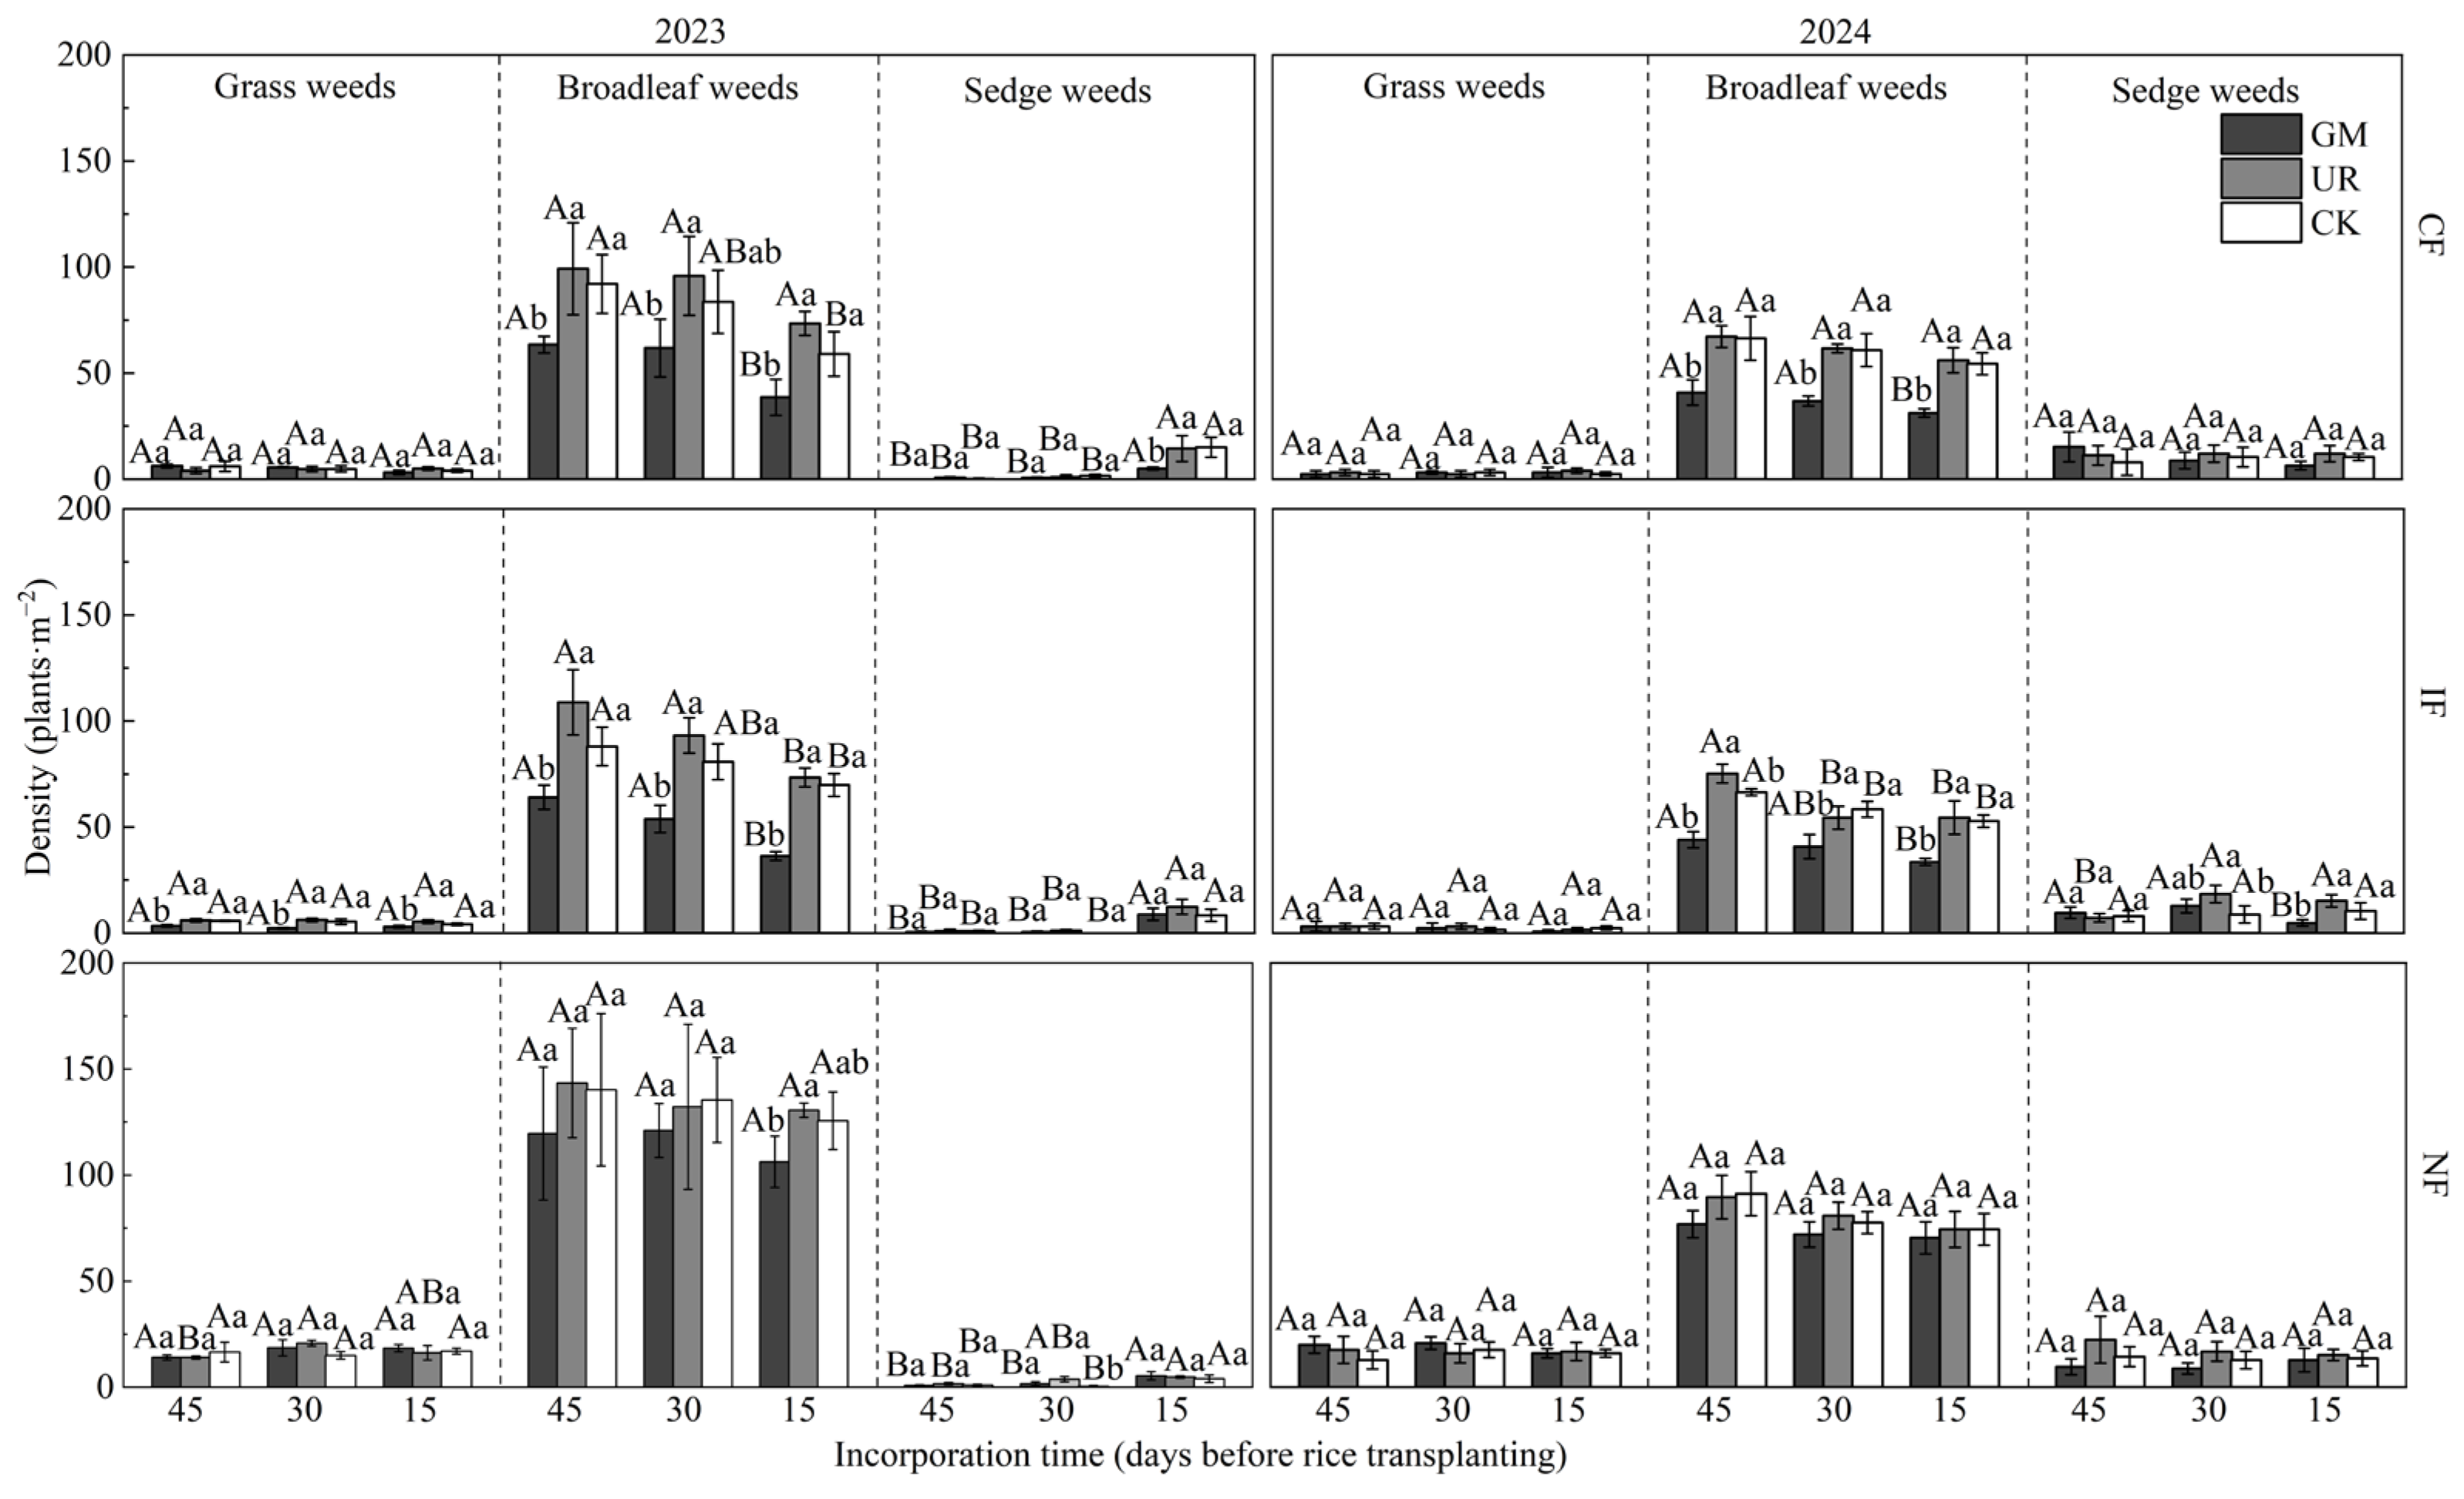
During the field surveys, we observed that the broadleaf weeds monochoria [Monochoria vaginalis (Burm. f.) C. Presl ex Kunth] and monarch redstem (Ammannia baccifera L.) infested all plots regardless of treatment and their density was higher than that of other wheat-associated weeds. Barnyardgrass [Echinochloa crus-galli (L.) P. Beauv.] and Chinese sprangletop [Leptochloa chinensis (L.) Nees] were the most dense grass weeds, while smallflower umbrella-sedge (Cyperus difformis L.) and water chestnut (Eleocharis plantagineiformis Tang & F.T. Wang) were the most dense sedge weeds. The infestation of grass weeds was significantly influenced only by flooding method (p < 0.001), which accounted for 93.27% of the variation in grass weed density among treatments (Table 3). With identical incorporation regime and timing, grass weed density was significantly lower under continuous and intermittent flooding than under the no-flooding method (Figure 6). Broadleaf weed infestation was significantly affected by year (p < 0.001), incorporation timing (p < 0.001), flooding method (p < 0.001) and CMV incorporation (p < 0.001) (Table 3), as well as by the interaction between year and flooding method. Among these, year, flooding method and CMV incorporation were the primary drivers of variation, accounting for 35.99%, 31.82% and 19.21%, respectively, of the treatment differences in broadleaf weed density. Similar to total weed occurrence, broadleaf weed density was higher in 2023 than in 2024 under identical treatments, but inter-treatment variation trends remained consistent across both years (Figure 6). With the same incorporation regime and timing, broadleaf weed density was significantly lower under continuous or intermittent flooding than under no flooding. Under continuous or intermittent flooding with identical incorporation timing, broadleaf weed density was lower in CMV incorporation than in urea substitution or no-fertilizer treatments and exhibited a declining trend with delayed incorporation timing. Sedge weed infestation was significantly influenced only by year (p < 0.001) (Table 3), explaining 62.09% of the variation in sedge weed density. Sedge weed density was higher in 2024 than in 2023 across all treatments, which may be related to the lower density of broadleaf weeds in 2023, which reduced inter-specific competition and facilitated an increase in the infestation of sedge weeds.

3.3. Rice Yield and Yield Components

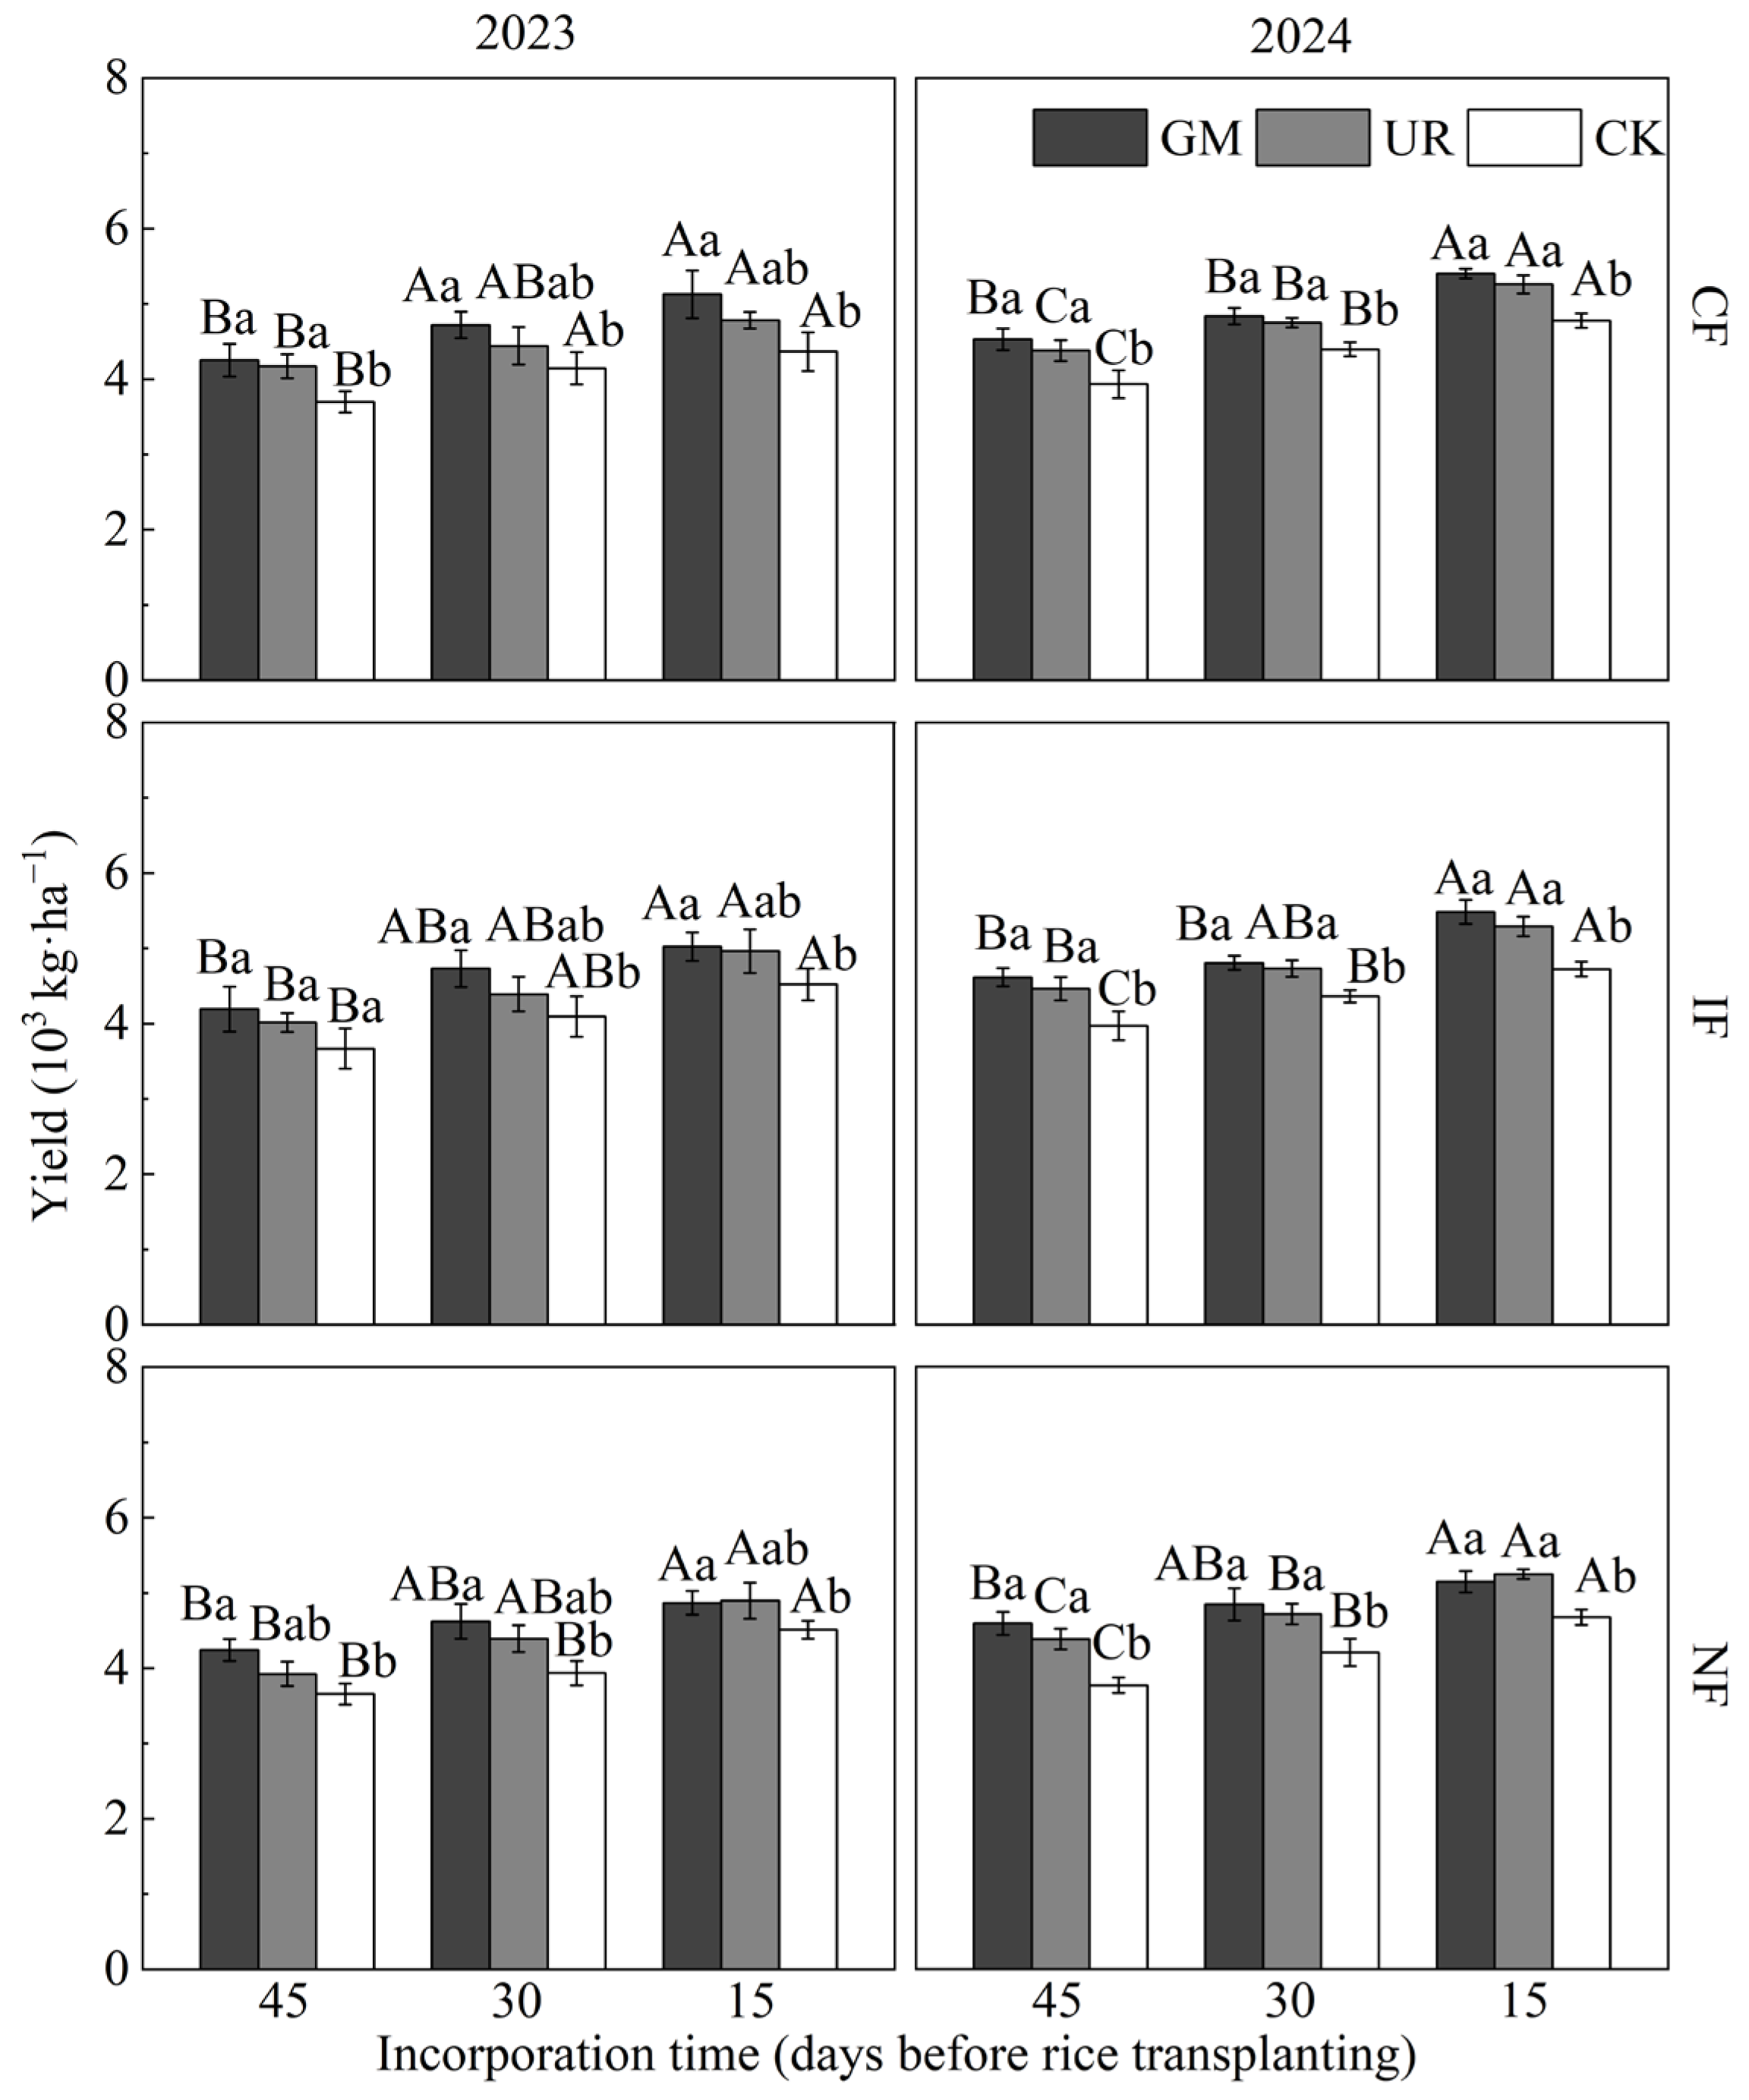
Rice yield was significantly affected by year (p < 0.001), incorporation timing (p < 0.001), flooding method (p < 0.001), nitrogen incorporation (p < 0.001) and CMV incorporation (p = 0.008) (Table 4). Among these factors, nitrogen incorporation, incorporation timing and year were the primary drivers of yield variation, accounting for 46.82%, 29.36% and 17.16% of the treatment differences, respectively. Regardless of the flooding method, rice yield was lower for the no-fertilizer treatment regime than for urea substitution and CMV incorporation and achieved the highest in CMV incorporation within the same incorporation time (Figure 7). Rice yields in 2024 were higher than in 2023 under identical treatments, but the trends in yield differences among treatments were similar across both years. Under identical incorporation methods, rice yield consistently increased with delayed incorporation timing across all flooding methods. This yield increase with delayed incorporation may be associated with enhanced soil nitrogen fixation by CMV. Overall, regardless of the flooding method, incorporating CMV 15 days before rice transplanting increased rice yield by 5.34–13.24% compared to conventional CMV incorporation.
Rice panicle number was significantly affected by year (p < 0.001), incorporation time (p < 0.001), nitrogen incorporation (p < 0.001), CMV incorporation (p = 0.002) and the interaction between incorporation time and nitrogen incorporation (p = 0.003) (Table 4). Among these factors, incorporation time, nitrogen incorporation, and year were the primary drivers of variation in rice yield, accounting for 55.61%, 25.65%, and 12.54% of the variation in rice panicle number among treatments, respectively. Under identical flooding method and fertilizer incorporation regime, rice panicle number increased with delayed incorporation time (Table 5). With identical incorporation times and flooding methods, rice panicle number was higher in urea substitution and CMV incorporation than the no-fertilizer treatment and achieved the highest in CMV incorporation. Rice panicle number in 2024 were also higher than in 2023 under identical treatment, but inter-treatment variation trends remained consistent across both years.
Grain number per panicle was significantly affected by incorporation time (p < 0.001) and nitrogen incorporation (p < 0.001), explaining 52.16% and 39.82% of its inter-treatment variation, respectively (Table 4). Under identical flooding and incorporation regimes, grain number per panicle tended to decrease with delayed incorporation time (Table 5). With identical incorporation times and flooding methods, fertilizer incorporation showed a tendency to increase grain number per panicle, but this increase did not reach statistical significance in all treatments.
Rice seed-setting rate was significantly influenced by year (p < 0.001) and incorporation time (p < 0.001), accounting for 57.89% and 36.84% of the inter-treatment variation, respectively (Table 4). The seed-setting rate in 2023 was significantly higher than in 2024 with identical treatments (Table 6). Under identical flooding methods and incorporation regimes, seed-setting rates significantly increased with delayed incorporation time. Rice thousand-grain weight was significantly affected by incorporation time (p = 0.005) and CMV incorporation (p = 0.015), explaining 30.64% and 27.51% of the inter-treatment variation, respectively. Under identical flooding methods and fertilizer incorporation regimes, thousand-grain weights increased with delayed incorporation time (Table 6). Fertilizer incorporation regimes yielded higher thousand-grain weights than the no-fertilizer treatment, with CMV incorporation producing the highest values under identical incorporation times and flooding methods.

4. Discussion

The growth of CMV as green manure crop during fallow times in paddy fields can fully exploit natural resources (e.g., light, water and heat), input N into the agroecosystem through biological nitrogen fixation [25,32] and improve rice yield at a minimum environmental and economic cost [33,34]. A previous study demonstrated that the fresh biomass of CMV could reach 3–6 t·ha−1 with biological N fixation of 20–146 kg·ha−1 in the field at the blooming stage [35,36,37]. The present study indicated that the fresh shoot biomass of CMV reached its highest (3.2–3.7 t·ha−1) at the blooming stage (conventional CMV incorporation time), with N fixation of 34.7–37.8 kg·ha−1, which falls within the range of values reported in the above studies. Legume species differ in their patterns of aboveground biomass accumulation. During the growth stages from the mid-vegetative stage to mid-flowering and then to pod-setting, the aboveground biomass (including both fresh and dry weight) of cowpeas exhibited an initial increase followed by a decrease, whereas that of soybeans showed a continuous increasing trend [38]. In this study, the aboveground dry weight of CMV increased throughout its developmental progression (from the mid-vegetative stage to blooming stage and then to maturity), which is consistent with the findings reported by Yuan et al. [37]. The observed decrease in fresh aboveground biomass of CMV at maturity compared to the full-bloom stage in our study can be attributed to the spontaneous dehydration of the plant after maturation. We also revealed that delayed incorporation of milk vetch resulted in no significant loss in aboveground nitrogen fixation but an increase of 36–48 kg/ha in the amount of organic matter returned to the soil. The decomposition of CMV residues and N release after incorporation into fields is a complex process, influenced by external factors such as soil type, water and thermal conditions, CO2 concentration and fertilization [36,39,40]. Under the same incorporation time, the soil TN in CMV incorporation with flooding was higher than without flooding, which might be attributed to the faster decomposition of CMV under flooding conditions. A study of CMV incorporation in the double rice cropping system showed that 67.7–76.5% of CMV dry matter was decomposed and 81.9–88.0% of total N was released within the first 28 days after incorporation, and 84.8–88.8% of dry matter was lost and 94.1–95.7% of N was released within 133 days of incorporation [41]. In this study, with the same flooding conditions, the soil TN in urea substitution incorporation was higher than that of CMV incorporation at all incorporation times, and the difference was greatest at 15 days before rice transplanting, indicating the similar characteristics of N release during CMV decomposition. When analyzing the biological nitrogen fixation of CMV and N release after incorporation, the fixed N contained in roots, nodules and rhizodeposition should be considered in addition to the shoot’s N content [42,43]. In the present study, under the same incorporation regimen and flooding method, soil TN content increased with delayed incorporation time. Particularly, soil TN content still showed a significant increasing trend with delayed incorporation time even without CMV incorporation under the same flooding method, which indicated that postponing the incorporation contributes to an increase in nitrogen fixation in the soil by CMV.
Crop residues (straw, bran or green manure, etc.) applied on the soil surface and/or incorporated into the soil inhibit the germination and seedling growth of weeds through the release of certain allelochemicals [44,45], producing microbial phytotoxins during decomposition, and physically obstructing the growth of seedlings [46]. A laboratory experiment demonstrated that the incorporation of CMV significantly suppressed weed germination (most weeds seeds were M. vaginalis) in the flooded paddy soil, and it was assumed that the suppression rate was positively related to the increase in the electrical conductivity of surface water during the decomposition of CMV, whose value initially increases and then decreases with the number of days after CMV incorporation, reaching its maximum on the 16th day after incorporation [47]. Studies on Astragalus sinicus incorporated as green manure for weed control in corn indicated that within 15 days after CMV incorporation, its inhibitory effect on the germination of goosegrass (Eleusine indica L.) increased with the number of days after incorporation [30]. However, this effect began to decline after 15 days due to the fact that the concentration of the allelopathic substance (2-Hydroxyethyl acrylate) which inhibited goosegrass germination in the decomposition leachates of CMV reached its peak at 15 days after incorporation and subsequently decreased [30,48]. From the above findings, it can be inferred that the inhibition of weed germination by CMV incorporation has a time-sensitive effect. Specifically, around 15 days after incorporation, the inhibitory effect of CMV decomposition liquid on weed germination is the strongest. In this study, under the CMV incorporation treatment and with the same flooding method, the lowest infestation of broadleaf weeds (with M. vaginalis being one of the dominant weeds) was observed when incorporation was performed 15 days before transplanting, compared to other incorporation times. This may also be attributed to the strong inhibitory effect of CMV decomposition leachates on broadleaf weed germination at this time, resulting in the greatest competitive advantage of rice over weeds. Correspondingly, incorporating CMV too early causes the optimal period for inhibiting broadleaf weed germination by the decomposition leachates to be missed by the time of rice transplanting, reducing the competitive advantage of rice over weeds and leading to an increase in weed infestation. Additionally, the impact of different CMV incorporation times on broadleaf weed occurrence may also be related to differences in the content of germination-inhibiting substances in CMV plants at different growth stages, which requires further research. The inhibitory effect of CMV incorporation on weed germination varied by weed species. In this study, the infestation of grass weeds was only influenced by the flooding method that was under an identical incorporation regime and timing. The grass weed infestation in flooded treatments was significantly lower than that in non-flooded treatments. The stale seedbed technique, also known as a “false seedbed”, is a promising weed management strategy in conservation agriculture systems used to reduce weed infestation before planting a desired crop by allowing weeds to germinate after light irrigation and then eliminating them through shallow tillage or nonselective herbicides [49,50]. Similar flooding conditions during the incorporation period provided more suitable germination conditions for grass weeds, while the subsequent tillage operations performed for rice transplanting eliminated these germinated weeds, thus resulting in lower weed infestation in flooded treatments compared to non-flooded treatments. Additionally, the overall weed infestation decreased with delayed incorporation time, which may also be related to the fact that newly germinated weeds are more easily eliminated by tillage operations.
In this study, the higher soil TN content before rice transplanting in 2024 under the same treatment conditions compared to 2023 was one of the primary reasons for the higher rice yields across all treatments in 2024. The climatic conditions (including mean temperature, maximum temperature, minimum temperature, rainfall and sunshine duration) during the entire growth period of CMV in 2023 and 2024 showed little variation. However, during the post-overwintering growth period in 2024 rainfall was 1.9 times that of 2023, while sunshine duration decreased by only 20%. Compared to 2023, the increased rainfall and relatively sufficient sunshine duration during the post-overwintering growth period of CMV in 2024 likely contributed to its higher shoot biomass, thus leading to higher soil TN content before rice transplanting under the same treatment conditions in 2024. Our study demonstrated that under identical water management practices, the soil TN content before rice transplanting increased with delayed CMV incorporation and the enhanced nitrogen availability promotes greater tillering and panicle formation in rice, thereby leading to increased grain yield. Green manuring can also improve soil fertility and aeration by reducing soil bulk density [20] and increasing soil microbial and enzymatic activity [51]. Although CMV incorporation does not directly supplement phosphorus (P) and potassium (K) in the cropping system, it enhances the uptake of existing soil P and K, thereby improving their availability and utilization by subsequent crops [3,52]. The above findings may explain why the CMV incorporation treatment resulted in higher rice yields than substitution with equal nitrogen content of urea at the same incorporation time.

5. Conclusions

The findings of the present study showed that delaying the incorporation of green manure Chinese milk vetch until 15 days before rice transplanting can increase the dry matter weight and the amount of organic matter returned to the field, enhance soil total nitrogen content and thereby improve rice yield. Furthermore, delayed incorporation combined with flooding (either intermittent or continuous) significantly reduced weed infestation in paddy fields. Therefore, considering the comprehensive effects on soil nutrients, rice-associated weed infestation, and rice yields, incorporating Chinese milk vetch 15 days before rice transplanting in combination with intermittent flooding is a recommended green manure management practice in green manure–rice rotation systems.

Author Contributions

Investigation and data curation, L.D., Z.J., Y.D. and F.Z.; formal analysis, H.W. and S.D.; funding acquisition, P.G. and Q.D.; methodology, G.S. and Q.D.; writing—original draft, P.G., L.D., Z.J., F.Z., H.W. and S.D.; writing—review and editing, G.S. and Q.D. All authors have read and agreed to the published version of the manuscript.

Funding

This research was financially supported by the National Key Research and Development. Project (2021YFD1700805), the Jiangsu Natural Science Foundation (BK20220565), and the Project Funded by the Priority Academic Program Development of Jiangsu Higher Education Institutions (PAPD).

Data Availability Statement

The original contributions presented in this study are included in the article. Further inquiries can be directed to the corresponding author.

Conflicts of Interest

The authors declare no conflicts of interest.

References

  1. Yang, W.; Yao, L.; Zhu, M.Z.; Li, C.W.; Li, S.Q.; Wang, B.; Dijkstra, P.; Liu, Z.Y.; Zhu, B. Replacing urea-N with Chinese milk vetch (Astragalus sinicus L.) mitigates CH4 and N2O emissions in rice paddy. Agric. Ecosyst. Environ. 2022, 336, 108033. [Google Scholar] [CrossRef]
  2. Su, P.; Zhang, A.; Wang, R.; Wang, J.; Gao, Y.; Liu, F. Prediction of future natural suitable areas for rice under representative concentration pathways (RCPs). Sustainability 2021, 13, 1580. [Google Scholar] [CrossRef]
  3. Fan, Q.U.; Xu, C.X.; Zhang, L.; Xie, J.C.; Zhou, G.P.; Liu, J.; Hu, F.; Gao, S.J.; Cao, W.D. Application of milk vetch (Astragalus sinicus L.) with reduced chemical fertilizer improves rice yield and nitrogen, phosphorus, and potassium use efficiency in southern China. Eur. J. Agron. 2023, 144, 126762. [Google Scholar] [CrossRef]
  4. Fang, K.M.; Shen, H.F.; Shuang, Q.Y.; Zhong, G.M.; Qiu, S.S.; Yu, J.X. Problem of fertilizer application increase in rice and countermeasures of “zero increase”. Chin. Agric. Sci. Bull. 2016, 32, 200–204. [Google Scholar]
  5. NBS. National Bureau of Statistics of China. 2023. Available online: https://data.stats.gov.cn (accessed on 25 July 2025).
  6. Peng, S.B.; Huang, J.L.; Zhong, X.H.; Yang, J.C.; Wang, G.H.; Zou, Y.B.; Zhang, F.S.; Zhu, Q.S.; Buresh, R.; Witt, C. Research strategy in improving fertilizer-nitrogen use efficiency of irrigated rice in China. Sci. Agric. Sin. 2002, 35, 1095–1103. [Google Scholar]
  7. Chen, C.; Xiao, W.Y.; Chen, H.Y.H. Mapping global soil acidification under N deposition. Glob. Change Biol. 2023, 29, 4652–4661. [Google Scholar] [CrossRef]
  8. Wang, W.; Zeng, C.; Sardans, J.; Wang, C.; Zeng, D.; Peñuelas, J. Amendment with industrial and agricultural wastes reduces surface-water nutrient loss and storage of dissolved greenhouse gases in a subtropical paddy field. Agric. Ecosyst. Environ. 2016, 231, 296–303. [Google Scholar] [CrossRef]
  9. Wang, W.; Sardans, J.; Zeng, C.; Zhong, C.; Li, Y.; Peñuelas, J. Responses of soil nutrient concentrations and stoichiometry to different human land uses in a subtropical tidal wetland. Geoderma 2014, 232, 459–470. [Google Scholar] [CrossRef]
  10. Rao, A.N.; Johnson, D.E.; Sivaprasad, B.; Ladha, J.K.; Mortimer, A.M. Weed management in direct-seeded rice. Adv. Agron. 2007, 93, 153–255. [Google Scholar]
  11. Chauhan, B.S.; Johnson, D.E. The role of seed ecology in improving weed management strategies in the tropics. Adv. Agron. 2010, 105, 221–262. [Google Scholar]
  12. Oerke, E.C. Crop losses to pests. J. Agric. Sci. 2006, 144, 31–43. [Google Scholar] [CrossRef]
  13. Zhang, C.X.; Huang, H.J.; Cui, H.L.; Wei, S.H.; Huang, Z.F.; Chen, J.C.; Yang, L.; Chen, J.Y. Herbicide-resistant weeds and their management. Plant Prot. 2013, 39, 99–102. [Google Scholar]
  14. Tejada, M.; Gonzalez, J.L.; García-Martínez, A.M.; Parrado, J. Effects of different green manures on soil biological properties and maize yield. Bioresour. Technol. 2008, 99, 1758–1767. [Google Scholar] [CrossRef] [PubMed]
  15. Ma, Y.Q.; Qian, C.C.; Deng, L.P.; Huang, G.Q. Effects of combining Chinese milk vetch with N fertilizer on grain and dry matter yield, N absorption and utilization of double cropping rice. J. Nucl. Agric. 2017, 31, 2399–2407. [Google Scholar]
  16. Meng, X.; Li, Y.; Zhang, Y.; Yao, H. Green manure application improves rice growth and urea nitrogen use efficiency assessed using N–15 labeling. Soil Sci. Plant Nutr. 2019, 65, 511–518. [Google Scholar] [CrossRef]
  17. Zhou, G.; Gao, S.; Chang, D.; Rees, R.M.; Cao, W. Using milk vetch (Astragalus sinicus L.) to promote rice straw decomposition by regulating enzyme activity and bacterial community. Bioresour. Technol. 2020, 319, 124215. [Google Scholar] [CrossRef] [PubMed]
  18. Zhou, G.; Gao, S.; Chang, D.; Shimizu, K.Y.; Cao, W. Succession of fungal community and enzyme activity during the co-decomposition process of rice (Oryza sativa L.) straw and milk vetch (Astragalus sinicus L.). Waste Manag. 2021, 134, 1–10. [Google Scholar] [CrossRef]
  19. Askegaard, M.; Eriksen, J. Residual effect and leaching of N and K in cropping systems with clover and ryegrass catch crops on a coarse sand. Agric. Ecosyst. Environ. 2008, 123, 99–108. [Google Scholar] [CrossRef]
  20. Wang, Y.F.; Liu, X.M.; Butterly, C.; Tang, C.X.; Xu, J.M. pH change, carbon and nitrogen mineralization in paddy soils as affected by Chinese milk vetch addition and soil water regime. J. Soils Sediment. 2013, 4, 654–663. [Google Scholar] [CrossRef]
  21. Álvarez-Iglesias, L.; Puig, C.G.; Revilla, P.; Reigosa, M.J.; Pedrol, N. Faba bean as green manure for field weed control in maize. Weed Res. 2018, 58, 437–449. [Google Scholar] [CrossRef]
  22. Norsworthy, J.K.; Brandenbergerb, L.; Burgosc, N.R.; Riley, M. Weed suppression in Vigna unguiculata with a spring-seeded brassicaceae green manure. Crop Prot. 2005, 24, 441–447. [Google Scholar] [CrossRef]
  23. Wang, R.L.; Zhang, M.X.; Song, Y.Y.; Hu, L.; Su, Y.J.; Zeng, R.S. Allelopathic effect of forage legumes on four common cropland weeds and rice. Ecol. Environ. 2010, 19, 2307–2312. [Google Scholar]
  24. Chen, H.J.; Huang, G.Q.; Yang, B.J.; Wang, X.W. Effects of different winter planting-green manure on the grain yield of rice and weed community of paddy field. Sci. Agric. Sin. 2014, 47, 1976–1984. [Google Scholar]
  25. Voisin, A.S.; Gu’eguen, J.; Huyghe, C.; Jeuffroy, M.H.; Magrini, M.B.; Meynard, J.M.; Mougel, C.; Pellerin S and Pelzer, E. Legumes for feed, food, biomaterials and bioenergy in Europe: A review. Agron. Sustain. Dev. 2014, 34, 361–380. [Google Scholar] [CrossRef]
  26. Mishra, B.; Sharma, P.K.; Bronson, K.F. Kinetics of wheat straw decomposition and nitrogen mineralization in rice field soil. J. Indian Soc. Soil Sci. 2001, 49, 49–54. [Google Scholar]
  27. Ma, Q.; Li, J.; Aamer, M.; Huang, G. Increasing methane (CH4) emissions and altering rhizosphere microbial diversity in paddy soil by combining Chinese milk vetch and rice straw. PeerJ 2020, 8, e9653. [Google Scholar] [CrossRef]
  28. Zhang, X.; Zhang, R.; Gao, J.; Wang, X.; Fan, F.; Ma, X. Thirty-one years of rice-rice-green manure rotations shape the rhizosphere microbial community and enrich beneficial bacteria. Soil Biol. Biochem. 2017, 104, 208–217. [Google Scholar] [CrossRef]
  29. Liu, S.L.; Ma, Z.Y.; Zhang, Y.; Chen, Z.W.; Du, X.; Mu, Y.H. Astragalus sinicus incorporated as green manure for weed control in corn. Front. Plant Sci. 2022, 13, 829421. [Google Scholar] [CrossRef]
  30. Bremner, J.M. Determination of nitrogen in soil by the Kjeldahl method. J. Agric. Sci. 1960, 55, 11–33. [Google Scholar] [CrossRef]
  31. Yeomans, J.C.; Bremner, J.M. A rapid and precise method for routine determination of organic carbon in soil. Commun. Soil Sci. Plant Anal. 1988, 19, 1467–1476. [Google Scholar] [CrossRef]
  32. Yang, L.; Zhou, X.; Liao, Y.; Lu, Y.; Nie, J.; Cao, W. Co-incorporation of rice straw and green manure benefits rice yield and nutrient uptake. Crop Sci. 2019, 59, 749–759. [Google Scholar] [CrossRef]
  33. Crews, T.E.; Peoples, M.B. Legume versus fertilizer sources of nitrogen: Ecological tradeoffs and human needs. Agric. Ecosyst. Environ. 2004, 102, 279–297. [Google Scholar] [CrossRef]
  34. Xie, Z.J.; Tu, S.X.; Shah, F.; Xu, C.X.; Chen, J.R.; Han, D.; Liu, G.R.; Li, H.L.; Muhammada, I.; Cao, W.D. Substitution of fertilizer-N by green manure improves the sustainability of yield in double-rice cropping system in south China. Field Crop Res. 2016, 188, 142–149. [Google Scholar] [CrossRef]
  35. Yang, L.; Nie, J.; Xu, C.X.; Cao, W.D. Biological nitrogen fixation of Chinese Milk Vetch (Astragalus sinicus L.) as affected by exogenous carbon and nitrogen input. Symbiosis 2021, 85, 69–77. [Google Scholar] [CrossRef]
  36. Cai, S.; Pittelkow, C.M.; Zhao, X.; Wang, S. Winter legume-rice rotations can reduce nitrogen pollution and carbon footprint while maintaining net ecosystem economic benefits. J. Clean. Prod. 2018, 195, 289–300. [Google Scholar] [CrossRef]
  37. Yuan, M.; Liu, Q.; Zhang, S. Characteristics of nitrogen fixation of winter green manure in paddy soil in the Taihu Lake area. Chin. J. Soil Sci. 2010, 41, 1115–1119. [Google Scholar]
  38. Tamiru, H.; Heluf, G.; Kindie, T.; Asfaw, H. Biomass and nutrient accumulation of green manuring legumes terminated at different. East Afr. J. Sci. 2009, 3, 18–28. [Google Scholar] [CrossRef]
  39. Reichstein, M.; Bednorz, F.; Broll, G.; Kätterer, T. Temperature dependence of carbon mineralisation: Conclusions from a long-term incubation of subalpine soil samples. Soil Biol. Biochem. 2000, 32, 947–958. [Google Scholar] [CrossRef]
  40. Sowerby, A.; Blum, H.; Gray, T.R.G.; Ball, A.S. The decomposition of Lolium perenne in soils exposed to elevated CO2: Comparisons of mass loss of litter with soil respiration and soil microbial biomass. Soil Biol. Biochem. 2000, 32, 1359–1366. [Google Scholar] [CrossRef]
  41. Zhu, B.; Yi, L.X.; Hu, Y.G.; Zeng, Z.H.; Lin, C.W.; Tang, H.M.; Yang, G.L.; Xiao, X.P. Nitrogen release from incorporated 15N-labelled Chinese milk vetch (Astragalus sinicus L.) residue and its dynamics in a double rice cropping system. Plant Soil 2014, 374, 331–344. [Google Scholar] [CrossRef]
  42. Herridge, D.F.; Peoples, M.B.; Boddey, R.M. Global inputs of biological nitrogen fixation in agricultural systems. Plant Soil 2008, 311, 1–18. [Google Scholar] [CrossRef]
  43. Unkovich, M.J.; Baldock, J.; Peoples, M.B. Prospects and problems of simple linear models for estimating symbiotic N2 fixation by crop and pasture legumes. Plant Soil 2010, 329, 75–89. [Google Scholar] [CrossRef]
  44. Bilalis, D.; Sidiras, N.; Economou, G.; Vakali, C. Effect of different levels of wheat straw soil surface coverage on weed flora in Vicia faba crops. J. Agron. Crop Sci. 2003, 189, 233–241. [Google Scholar] [CrossRef]
  45. Teasdale, J.R.; Mohler, C.L. The quantitative relationship between weed emergence and the physical properties of mulches. Weed Sci. 2000, 48, 385–392. [Google Scholar] [CrossRef]
  46. Narwal, S.S. Role of allelopathy in crop production. J. Herbol. 2005, 6, 31. [Google Scholar]
  47. Utami, A.I.; Bimantara, P.O.; Umemoto, R.; Sabri, R.K.; Kautsar, V.; Tawaraya, K.; Hanudin, K.; Cheng, W.G. Incorporation of winter grasses suppresses summer weed germination and affects inorganic nitrogen in flooded paddy soil. Soil Sci. Plant Nutr. 2020, 66, 389–397. [Google Scholar] [CrossRef]
  48. Liu, S.L.; Wang, W.H.; Chen, J.Y.; Ma, Z.Y.; Xiao, Y.P.; Chen, Z.W.; Zhang, Y.; Du, X.; Mu, Y.H. Weed suppression and antioxidant activity of Astragalus sinicus L. decomposition leachates. Front. Plant Sci. 2022, 13, 1013443. [Google Scholar] [CrossRef]
  49. Buhler, D.D. 50th Anniversaryâ Invited Article: Challenges and opportunities for integrated weed management. Weed Sci. 2002, 50, 273–280. [Google Scholar] [CrossRef]
  50. Mahajan, G.; Bhagirath, S.C.; Kumar, V. Integrated weed management in rice. In Recent Advances in Weed Management; Chauhan, B.S., Mahajan, G., Eds.; Springer: New York, NY, USA, 2014; pp. 125–153. [Google Scholar]
  51. Kim, M.K.; Lee, Y.H.; Kang, T.H.; Yun, H.D. Influence of Chinese Milkvetch (Astragalus sinicus L.) with no-tillage on soil biotic factors and rice yield. J. Korean Soc. Appl. Biol. Chem. 2011, 54, 899–909. [Google Scholar] [CrossRef]
  52. Eichler-Löbermann, B.; Gaj, R.; Schnug, E. Improvement of soil phosphorus availability by green fertilization with catch crops. Commun. Soil Sci. Plant Anal. 2009, 40, 70–81. [Google Scholar] [CrossRef]
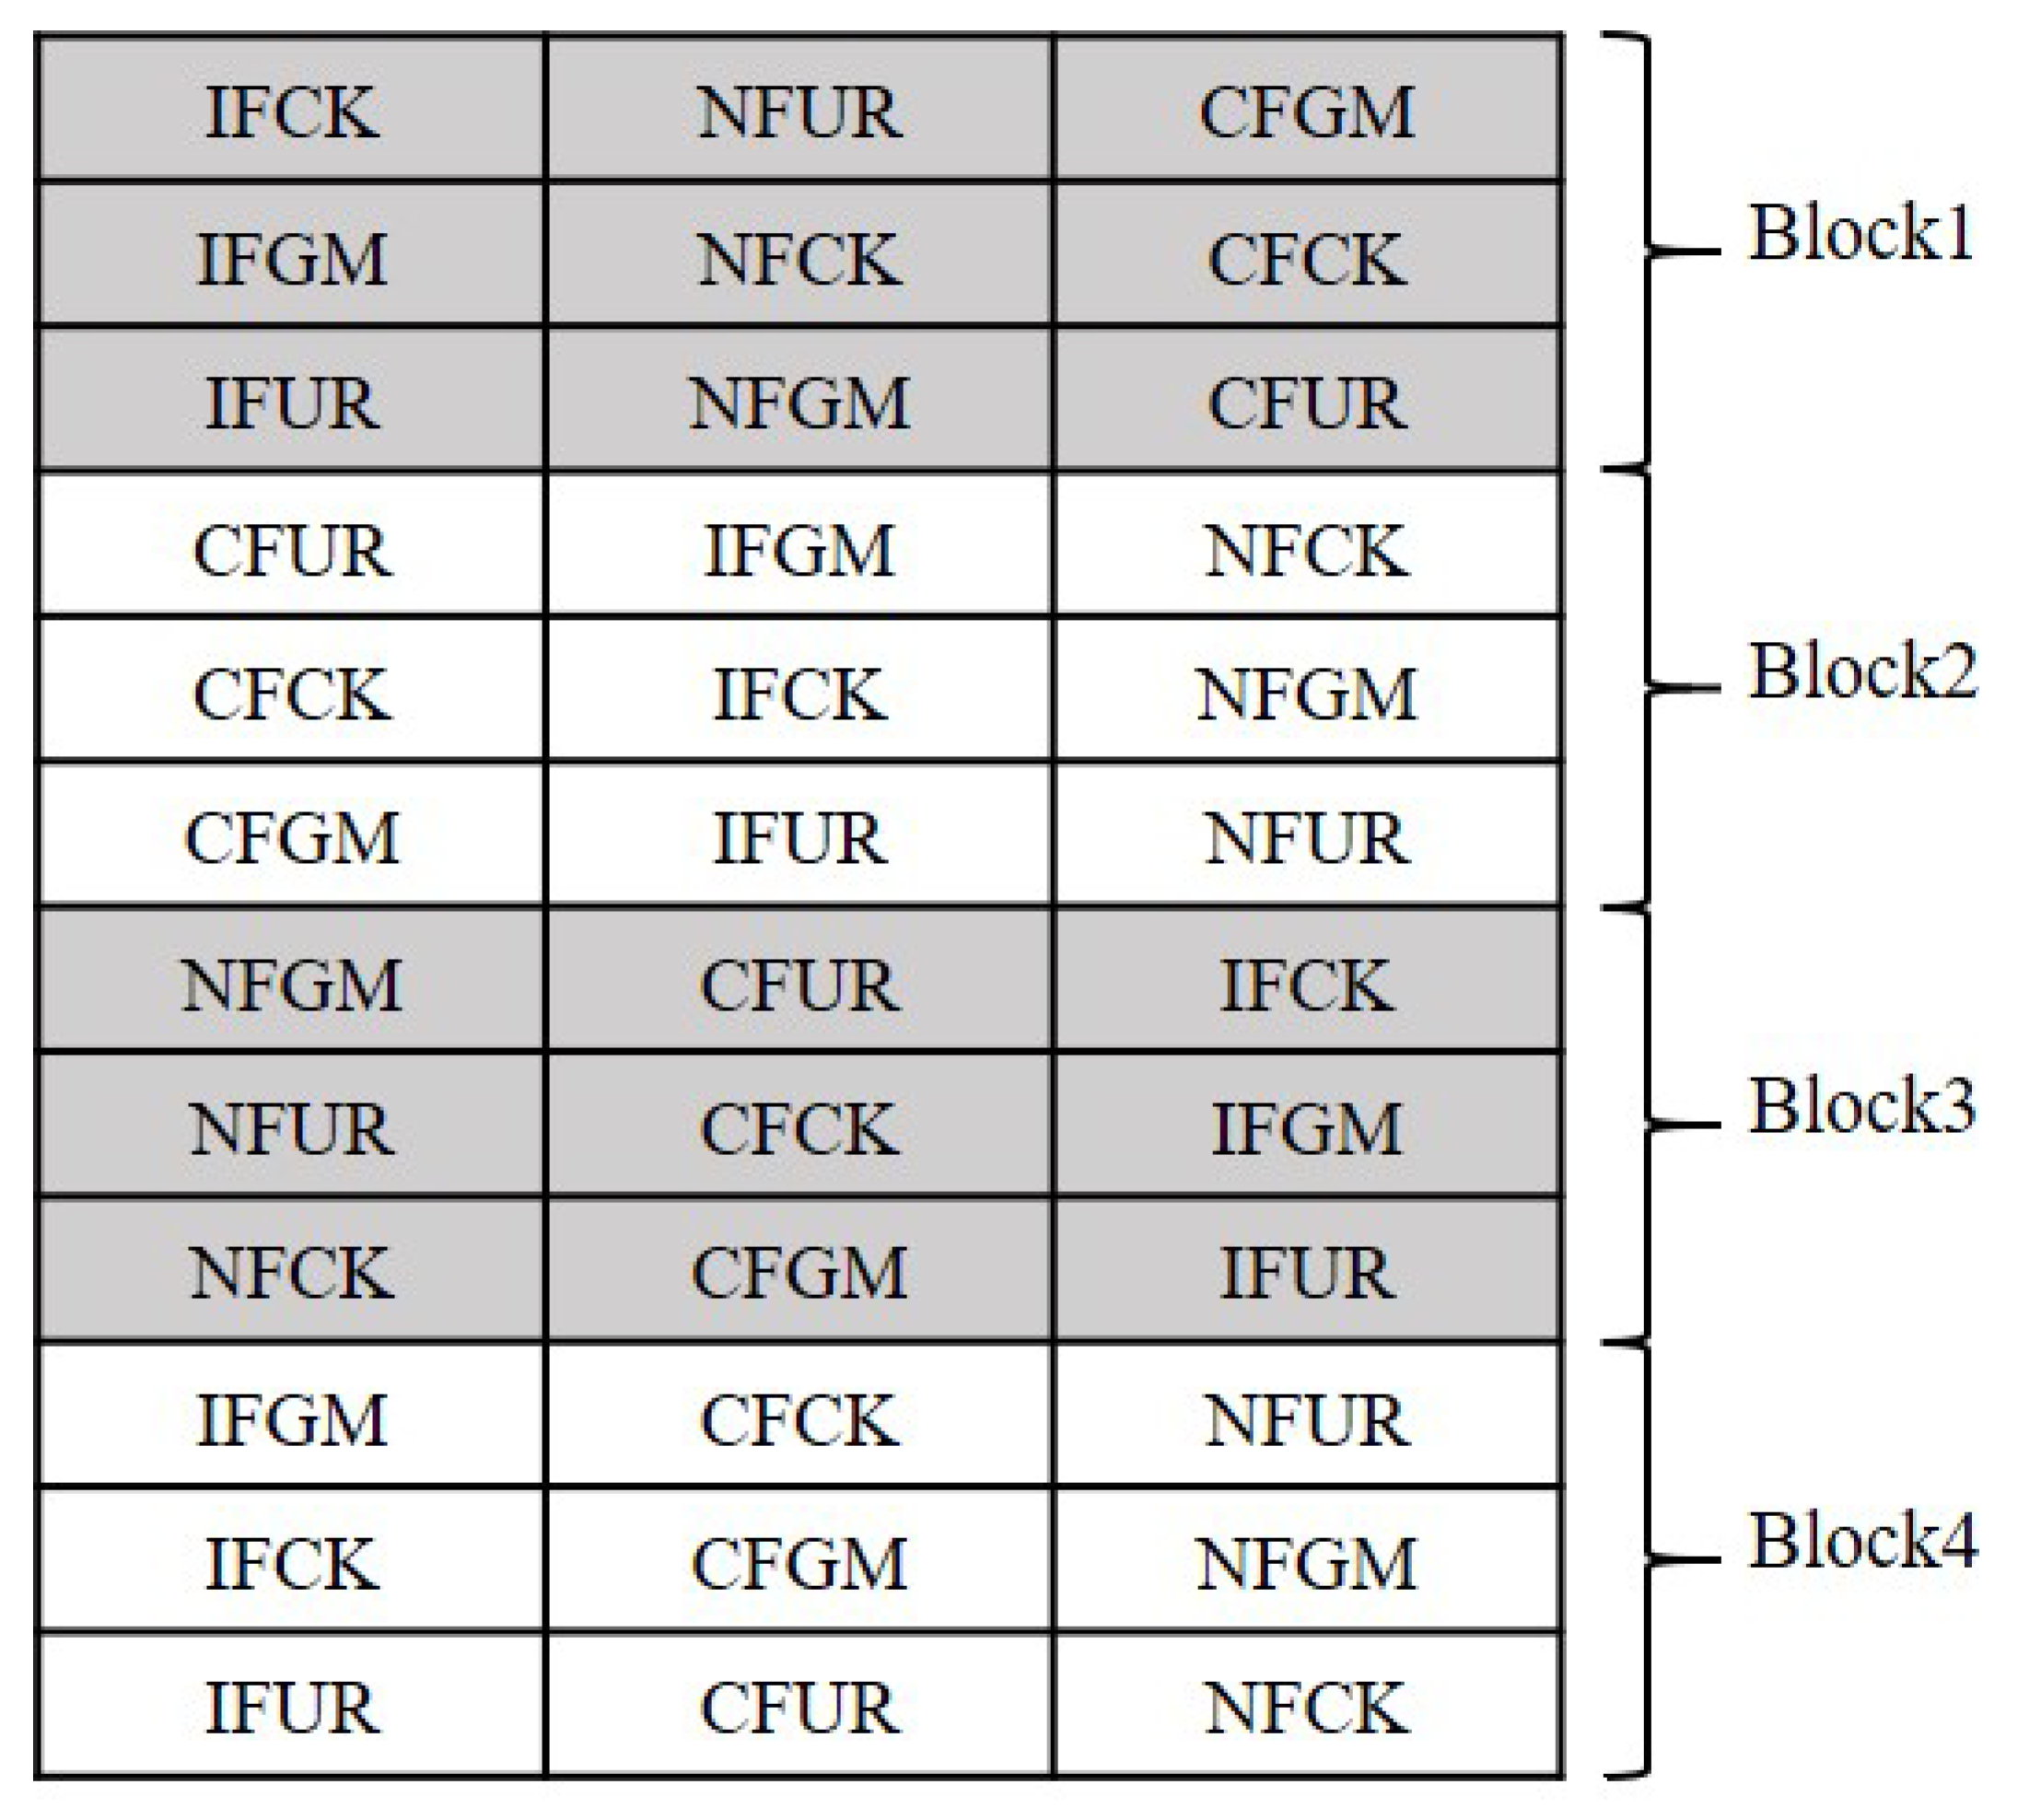
Figure 1. Plot layout diagram of the treatments for each incorporation time. NF, IF and CF represent no flooding, intermittent flooding and continuous flooding, respectively. GM, UR and CK represent green manure, urea substitution incorporation and fertilizer-free incorporation, respectively.
Agronomy 15 02291 g001
Figure 2. Shoot biomass of Chinese milk vetch (Astragalus sinicus L.) under different incorporation times in 2023 and 2024. Bar represents mean value and error line denotes standard error. Bars with different uppercase letters indicate differences between different incorporation times in the same year, while those with different lowercase letters represent differences between the same incorporation times in different years, according to the LSD test at p = 0.05.
Agronomy 15 02291 g002
Figure 3. Nitrogen fixation (left) and organic matter yield (right) in the aboveground parts of Chinese milk vetch (Astragalus sinicus L.) in 2023 and 2024. Bar represents mean value and error line denotes standard error. Bars with different uppercase letters indicate differences between different incorporation times in the same year, while those with different lowercase letters represent differences between the same incorporation time in different years, according to the LSD test at p = 0.05.
Agronomy 15 02291 g003
Figure 4. Total nitrogen content in the soil under different treatments during green manure incorporation in 2023 and 2024. In the figure, GM, UR and CK represent green manure, urea substitution incorporation and fertilizer-free incorporation, respectively; CF, IF and NF indicate continuous flooding, intermittent flooding and no flooding, respectively; bar represents mean value and error line denotes standard error. Within the same years, bars with different uppercase letters indicate differences between different incorporation times in the same incorporation regimes and flooding methods, while those with different lowercase letters represent differences between different incorporation regimes for the same flooding methods and incorporation times according to the LSD test at p = 0.05.
Agronomy 15 02291 g004
Figure 5. Total density of rice-associated weeds under different treatments during green manure incorporation in 2023 and 2024. In the figure, GM, UR and CK represent green manure, urea substitution incorporation and fertilizer-free incorporation, respectively; CF, IF and NF indicates continuous flooding, intermittent flooding and no flooding, respectively; bar represents mean value and error line denotes standard error. Within the same years, bars with different uppercase letters indicate differences between different incorporation times in the same incorporation regimes and flooding methods, while those with different lowercase letters represent differences between different incorporation regimes for the same flooding methods and incorporation times, according to the LSD test at p = 0.05.
Agronomy 15 02291 g005
Figure 6. Density of grass, broadleaf and sedge weeds in paddy field under different treatments during green manure incorporation in 2023 and 2024. In the figure, GM, UR and CK represent green manure, urea substitution incorporation and fertilizer-free incorporation, respectively; CF, IF and NF indicate continuous flooding, intermittent flooding and no flooding, respectively; bar represents mean value and error line denotes standard error. Within the same weed types in a year, bars with different uppercase letters indicate differences between different incorporation times in the same incorporation regimes and flooding methods, while those with different lowercase letters represent differences between different incorporation regimes for the same flooding methods and incorporation times, according to the LSD test at p = 0.05.
Agronomy 15 02291 g006
Figure 7. Rice yields under different treatments during green manure incorporation in 2023 and 2024. In the figure, GM, UR and CK represent green manure, urea substitution incorporation and fertilizer free incorporation, respectively; CF, IF and NF indicate continuous flooding, intermittent flooding and no flooding, respectively; bar represents mean value and error line denotes standard error. Within the same years, bars with different uppercase letters indicate differences between different incorporation times in the same incorporation regimes and flooding methods, while those with different lowercase letters represent differences between different incorporation regimes for the same flooding methods and incorporation times, according to the LSD test at p = 0.05.
Agronomy 15 02291 g007
Table 1. Mean (Tmean), maximum (Tmax) and minimum (Tmin) temperature, rainfall (prec) and sunlight duration (SD) of the experimental site in different growth periods of Chinese milk vetch and rice from 2022 to 2024.
CropGrowth PeriodYearTmeanTmaxTminPrecSD
°Cmmh
Chinese milk vetchOverwintering a2022–20238.713.05.5204.3580.9
2023–20248.213.34.6183.3671.8
After winter b202314.019.010.1107.9391.7
202413.217.69.9205.4312.1
Whole c202310.615.17.2312.2972.6
202410.114.96.5388.7983.9
RiceVegetative d202328.031.725.3574.4147.6
202428.631.925.9369.8171.9
Reproductive e202329.533.526.468.3225.7
202431.636.127.997.7282.2
Ripening f202323.327.320.4213.8216.3
202425.028.822.1332.3282.9
Whole g202326.330.223.4856.5589.6
202427.731.624.8799.8737.0
a From sowing to the end of winter was from 14 October in 2022 to 20 February in 2023 and 14 October in 2023 to 20 February in 2024. b From the end of winter to incorporation was from 21 February to 1 May in 2023 and 21 February to 1 May in 2024. c From sowing to incorporation was from 14 October in 2022 to 1 May in 2023 and 14 October in 2023 to 1 May in 2024. d From transplant to panicle initiation was from 15 June to 24 July in 2023 and 15 June to 24 July in 2024. e From panicle initiation to grain filling was from 25 July to 25 August in 2023 and 25 July to 25 August in 2024. f From grain filling to harvest was from 26 August to 20 October in 2023 and 26 August to 20 October in 2024. g From transplant to harvest was from 15 June to 27 October in 2023 and 15 June to 26 October in 2024.
Table 2. Rice-associated weed occurrence in the experiment field in 2023 and 2024.
Weed Species20232024Weed Species20232024
Aeschynomene indica a++Digitaria sanguinalis b+
Alternanthera philoxeroides a++Echinochloa crus-galli b++
Ammannia baccifera a++Eleusine indica b+
Eclipta prostrata a++Leersia hexandra b+
Lindernia procumbens a++Leptochloa chinensis b++
Ludwigia prostrata a++Oryza sativa b+
Murdannia triquetra a++Cyperus difformis c++
Persicaria hydropiper a+Cyperus iria c++
Persicaria lapathifolia var. salicifolia a+Eleocharis plantagineiformis c++
Monochoria vaginalis a++Fimbristylis littoralis c++
Rotala indica a++Schoenoplectiella juncoides c++
Sagittaria pygmaea a++
In this table, + and − represent occurrence and no occurrence, respectively, of the listed weed species in the experiment field; a, b and c indicate broadleaf weeds, grass weeds and sedge weeds, respectively.
Table 3. Mean square values from analysis of variance for density of total, grass, broadleaf and sedge weeds in paddy field with different treatments during green manure incorporation in 2023 and 2024.
SourceTotal WeedsGrass WeedsBroadleaf WeedsSedge Weeds
Year1786.21 *5.102970.38 *210.61 *
IT233.12 *0.77349.74 *17.15
FM4734.53 *271.96 *2626.37 *1.34
NI152.1 *0.7759.2114.27
GMI2054.27 *0.101585.58 *26.98
Year × IT3.720.0749.826.31
Year × FM193.9 *2.37333.44 *7.82
Year × NI10.220.0631.214.52
Year × GMI84.711.03106.194.47
IT × FM6.151.0010.141.42
IT × NI0.560.121.920.41
IT × GMI5.770.1910.542.89
FM × NI6.570.209.041.27
FM × GMI81.871.6676.040.65
Residue39.626.1934.819.1
In this table, IT, FM, NI and GMI represent incorporation time, flooding method, nitrogen incorporation and green manure incorporation, respectively. * indicates significance at p < 0.005.
Table 4. Mean square values from analysis of variance for rice yield and yield component with different treatments during green manure incorporation in 2023.
SourceYieldPanicle NumberGrain Number per PanicleSeed-Setting RateThousand-Grain Weight
Year17,548.31 *62.78 *8.630.11 *0.02
IT47,894.75 *278.49 *1330.20 *0.07 *4.47 *
FM688.752.6731.270.000.16
NI30,027.14 *128.44 *1015.48 *0.003.13
GMI3954.38 *9.61 *2.560.004.98 *
Year × IT172.592.0729.290.010.08
Year × FM38.480.4810.420.000.61
Year × NI513.091.100.000.000.32
Year × GMI287.800.699.400.000.14
IT × FM47.400.9010.260.000.30
IT × NI125.576.14 *8.190.000.01
IT × GMI122.340.5620.970.000.10
FM × NI47.860.601.450.000.70
FM × GMI43.010.412.580.000.10
Residue773.855.8669.7501.14
In this table, IT, FM, NI and GMI represent incorporation time, flooding method, nitrogen incorporation and green manure incorporation, respectively. * indicates significance at p < 0.005.
Table 5. Rice panicle number and grain number per panicle under different treatments during green manure incorporation in 2023 and 2024.
FMITIRPN 2023PN 2024GN 2023GN 2024
CF45GM9.18 ± 0.48 Ca10.43 ± 0.48 Ca93.85 ± 4.71 Aa94.25 ± 2.58 Aa
CF45UR9.20 ± 0.49 Ca10.33 ± 0.42 Ca93.60 ± 5.95 Aa95.06 ± 2.42 Aa
CF45CK7.20 ± 0.34 Cb9.38 ± 0.38 Cb87.35 ± 4.15 ABa89.81 ± 2.59Aa
CF30GM12.63 ± 0.50 Ba12.75 ± 0.52 Ba89.60 ± 4.74 ABab91.44 ± 3.03 Aa
CF30UR11.36 ± 0.57 Bb12.50 ± 0.57 Ba90.00 ± 1.38 Aa86.56 ± 3.22 Bab
CF30CK8.86 ± 0.37 Bc10.58 ± 0.50 Bb82.15 ± 2.80 Ab80.63 ± 3.51 Bb
CF15GM14.04 ± 0.50 Aa14.65 ± 0.55 Aa85.25 ± 2.77 Ba84.50 ± 2.13 Ba
CF15UR13.34 ± 0.34 Aa14.93 ± 0.58 Aa87.35 ± 3.90 Aa83.75 ± 3.12 Ba
CF15CK10.88 ± 0.58 Ab12.30 ± 0.40 Ab82.25 ± 2.37 Ba80.69 ± 1.78 Ba
IF45GM8.93 ± 0.47 Ca10.48 ± 0.52 Ca95.00 ± 2.91 Aa93.13 ± 3.94 Aa
IF45UR8.49 ± 0.43 Ca9.35 ± 0.42 Cb94.05 ± 3.25 Aa94.75 ± 2.37 Aa
IF45CK7.16 ± 0.45 Cb9.30 ± 0.49 Bb85.65 ± 3.65 Ab90.13 ± 3.00 Aa
IF30GM12.79 ± 0.45 Ba12.40 ± 0.57 Ba88.85 ± 4.93 Aa90.38 ± 2.74 Aa
IF30UR11.03 ± 0.58 Bb12.35 ± 0.64 Ba88.10 ± 4.44 ABa87.88 ± 2.71 ABa
IF30CK8.90 ± 0.36 Bc10.08 ± 0.44 Bb83.90 ± 1.81 Aa80.63 ± 1.76 Bb
IF15GM14.39 ± 0.48 Aa14.55 ± 0.55 Aa82.70 ± 0.54 Ba82.50 ± 2.60 Bab
IF15UR13.58 ± 0.29 Aa14.50 ± 0.52 Aa84.50 ± 2.37 Ba86.13 ± 2.83 Ba
IF15CK10.71 ± 0.25 Ab11.45 ± 0.59 Ab82.10 ± 3.17 Aa79.63 ± 2.21 Bb
NF45GM8.55 ± 0.38 Ca9.80 ± 0.50 Ba91.40 ± 4.73 Aa92.56 ± 2.58 ABa
NF45UR8.30 ± 0.33 Ca9.35 ± 0.38 Bab91.90 ± 4.01 Aa93.25 ± 3.35 Aa
NF45CK6.96 ± 0.63 Bb8.53 ± 0.46 Cb85.90 ± 3.43 Aa86.75 ± 2.85 Ab
NF30GM11.76 ± 0.42 Ba13.33 ± 0.61 Aa86.45 ± 5.23 Aa89.94 ± 2.24 Aa
NF30UR11.11 ± 0.52 Ba12.70 ± 0.45 Aa87.00 ± 5.06 ABa88.50 ± 2.65 ABab
NF30CK9.68 ± 0.51 Ab10.10 ± 0.41 Bb83.45 ± 4.02 Aa82.94 ± 3.02 Abb
NF15GM13.10 ± 0.41 Aa14.30 ± 0.63 Aa83.75 ± 3.38 Aa83.31 ± 2.03 Ba
NF15UR13.05 ± 0.46 Aa13.28 ± 0.64 Aab82.55 ± 3.42 Ba81.81 ± 3.36 Ba
NF15CK10.53 ± 0.33 Ab12.15 ± 0.58 Ab78.55 ± 4.23 Aa77.94 ± 3.09 Ba
In this table, FM indicates flooding method; CF, IF and NF represent continuous flooding, intermittent flooding and no flooding, respectively; IT indicates incorporation time, whose unit is days before rice transplanting; IR indicates incorporation regime; GM, UR and CK represent green manure, urea substitution incorporation and fertilizer-free incorporation, respectively; PN 2023 and PN 2024 represent panicle number of rice in 2023 and 2024, respectively; GN 2023 and GN 2024 represent grain numbers per panicle in 2023 and 2024, respectively. Within the same columns, values with different uppercase letters indicate differences between different incorporation times in the same incorporation regimes and flooding methods, while those with different lowercase letters represent differences between different incorporation regimes for the same flooding methods and incorporation times, according to the LSD test at p = 0.05.
Table 6. Seed-setting rate and thousand-grain weight of rice under different treatments during green manure incorporation in 2023 and 2024.
FMITIRSR 2023 (%)SR 2024 (%)T-GW 2023 (g)T-GW 2024 (g)
CF45GM0.90 ± 0.00 Ca0.84 ± 0.01 Ca25.69 ± 0.16 Aa25.25 ± 0.08 Ba
CF45UR0.90 ± 0.01 Ca0.84 ± 0.03 Ba24.79 ± 0.18 Bb25.01 ± 0.07 Ab
CF45CK0.90 ± 0.00 Ca0.84 ± 0.02 Ba24.59 ± 0.18 Ab24.50 ± 0.08 Ac
CF30GM0.92 ± 0.01 Ba0.87 ± 0.00 Ba25.56 ± 0.13 Aa25.46 ± 0.06 Ba
CF30UR0.91 ± 0.01 Ba0.88 ± 0.02 ABa25.37 ± 0.10 ABb25.01 ± 0.10 Ab
CF30CK0.92 ± 0.01 Ba0.87 ± 0.02 Ba24.60 ± 0.11 Ac24.69 ± 0.07 ABc
CF15GM0.94 ± 0.01 Aa0.92 ± 0.02 Aa25.77 ± 0.12 Aa25.83 ± 0.06 Aa
CF15UR0.95 ± 0.00 Aa0.92 ± 0.02 Aa25.50 ± 0.12 Aa25.16 ± 0.05 Ab
CF15CK0.95 ± 0.01 Aa0.93 ± 0.01 Aa24.82 ± 0.14 Ab24.88 ± 0.07 Ac
IF45GM0.89 ± 0.01 Ca0.85 ± 0.02 Ba24.94 ± 0.11 Ba25.35 ± 0.04 Ba
IF45UR0.92 ± 0.01 Ba0.85 ± 0.02 Ba24.76 ± 0.27 Ba24.77 ± 0.05 Bb
IF45CK0.89 ± 0.01 Ca0.84 ± 0.01 Ba24.52 ± 0.19 Bb24.57 ± 0.08 Bc
IF30GM0.92 ± 0.01 Ba0.87 ± 0.02 Ba25.07 ± 0.19 Ba25.53 ± 0.02 ABa
IF30UR0.92 ± 0.01 Ba0.88 ± 0.01 Ba24.60 ± 0.25 Ba24.99 ± 2.19 ABb
IF30CK0.92 ± 0.01 Ba0.86 ± 0.02 Ba24.58 ± 0.27 ABb24.76 ± 0.10 ABb
IF15GM0.96 ± 0.01 Aa0.94 ± 0.01 Aa25.56 ± 0.09 Aa25.57 ± 0.08 Aa
IF15UR0.95 ± 0.00 Aab0.93 ± 0.01 Aa25.48 ± 0.18 Aa25.44 ± 0.05 Aa
IF15CK0.95 ± 0.01 Ab0.93 ± 0.02 Aa25.07 ± 0.29 Ab24.93 ± 2.66 Ab
NF45GM0.90 ± 0.00 Cb0.84 ± 0.04 Ba25.29 ± 0.22 Ba25.32 ± 0.08 Ba
NF45UR0.91 ± 0.00 Ba0.84 ± 0.02 Ba24.91 ± 0.06 Bb25.02 ± 0.08 Bb
NF45CK0.89 ± 0.01 Bb0.85 ± 0.02 Ba24.51 ± 0.27 Bc24.72 ± 0.09 Ac
NF30GM0.95 ± 0.00 Ba0.88 ± 0.03 ABa25.71 ± 0.13 Aa25.20 ± 0.05 Ba
NF30UR0.95 ± 0.01 Aa0.87 ± 0.01 Ba25.33 ± 0.06 ABb25.14 ± 0.07 Ba
NF30CK0.96 ± 0.01 Aa0.87 ± 0.01 Ba24.89 ± 0.07 Bc24.74 ± 0.07 Ab
NF15GM0.97 ± 0.00 Aa0.92 ± 0.01 Aa25.74 ± 0.19 Aba25.65 ± 0.03 Aa
NF15UR0.95 ± 0.00 Ab0.93 ± 0.01 Aa25.55 ± 0.28 Aa25.39 ± 0.07 Ab
NF15CK0.95 ± 0.01 Ab0.92 ± 0.01 Aa25.20 ± 0.07 Ab24.91 ± 0.08 Ac
In this table, FM indicates flooding method; CF, IF and NF represent continuous flooding, intermittent flooding and no flooding, respectively; IT indicates incorporation time, whose unit is days before rice transplanting; IR indicates incorporation regime; GM, UR and CK represent green manure, urea substitution incorporation and fertilizer free incorporation, respectively; SR 2023 and SR 2024 represent seed-setting rates of rice in 2023 and 2024, respectively; T-GW 2023 and T-GW 2024 represent thousand-grain weights of rice in 2023 and 2024, respectively. Within the same columns, values with different uppercase letters indicate differences between different incorporation times in the same incorporation regimes and flooding methods, while those with different lowercase letters represent differences between different incorporation regimes for the same flooding methods and incorporation times, according to the LSD test at p = 0.05.
Disclaimer/Publisher’s Note: The statements, opinions and data contained in all publications are solely those of the individual author(s) and contributor(s) and not of MDPI and/or the editor(s). MDPI and/or the editor(s) disclaim responsibility for any injury to people or property resulting from any ideas, methods, instructions or products referred to in the content.