Article

Integrated Transcriptomic and Metabolomic Analyses of Seed-Filling Disorders in Soybeans Under Different Ecological Conditions

1
Soybean Research Institute, Shenyang Agricultural University, Shenyang 110866, China
2
Jiamusi Branch of Heilongjiang Academy of Agricultural Sciences, Jiamusi 154007, China
3
College of Agronomy, Shenyang Agricultural University, Shenyang 110866, China
*
Authors to whom correspondence should be addressed.
Agronomy 2025, 15(10), 2266; https://doi.org/10.3390/agronomy15102266
Submission received: 29 August 2025 / Revised: 22 September 2025 / Accepted: 23 September 2025 / Published: 24 September 2025

Abstract

Disorders in soybean seed-filling can lead to wrinkled seeds, affecting yield and quality. Previous studies have demonstrated that some soybean cultivars from Jiamusi, Heilongjiang Province (cold-temperate continental monsoon, ~3.5 °C mean annual temperature, ~530 mm precipitation) exhibit seed-filling disorders when cultivated in Shenyang, Liaoning Province (mid-temperate semi-humid continental monsoon, ~8.3 °C, ~610 mm). However, the causes and regulatory mechanisms remain unclear. In this study, Henong 76 (a soybean cultivar with seeds less prone to wrinkling) and Heihe 43 (a soybean cultivar with seeds prone to wrinkling) were used as experimental materials. They were sown simultaneously in Jiamusi and Shenyang, respectively, to explore the causes of seed-filling disorders in Heihe 43. The results indicated that there were significant differences in the contents of soluble sugars and starch, as well as in the activities of sucrose synthase and invertase, between the seeds of Henong 76 and Heihe 43 grown in Shenyang. However, no significant differences were found between them in Jiamusi. Transcriptomic and metabolomic analyses suggested that genes related to controlling starch hydrolysis (isoamylase, α-amylase, and glycogen phosphorylase) and sucrose synthesis and decomposition (sucrose synthase, invertase, glucose-6-phosphate isomerase, and phosphoglucomutase) in Heihe 43 were upregulated in Shenyang. In contrast, genes regulating plant hormone signal transduction (auxin, gibberellin, abscisic acid, and cytokinin) were generally downregulated. These changes led to differences in metabolites, resulting in the occurrence of seed-filling disorders. Furthermore, we analyzed the climatic conditions of the two cultivars during the soybean seed-filling period. The results indicated that high temperature might be the primary meteorological factor contributing to the occurrence of seed-filling disorders. All results indicated that the insufficient accumulation of sugars in seeds due to exposure to high temperatures during the seed-filling period is the primary cause of the prone-to-wrinkling phenomenon of the Heihe 43 cultivar under the ecological conditions of Shenyang.

1. Introduction

Soybean (Glycine max) represents a crucial food and oilseed crop of substantial economic value [1]. In recent years, concomitant with rapid economic growth and the ascent of living standards, China’s demand for soybeans has been on a continuous upward trajectory. Moreover, soybeans assume a pivotal role in ensuring the nation’s edible oil security [2]. In the realm of crop breeding, the incidence of wrinkled or shrunken seeds is prevalent and has been recurrently reported in soybean [3], rice [4], peanut [5], wheat [6], pea [7,8], and maize [9]. Seed wrinkling, alternatively designated as “pod-filling obstruction,” pertains to the phenomenon wherein developing seeds do not achieve normal plumpness upon reaching maturity, giving rise to a wrinkled and uneven seed coat, as well as an irregular seed shape. The development of wrinkled seeds not only significantly compromises their visual quality but also substantially diminishes seed vigor, germination rate, and germination potential [10,11,12,13,14,15]. Prior research has demonstrated that the seed-filling phase represents a crucial stage for grain development. In the seed-filling phase, the growth of soybean vegetative organs, namely roots, stems, and leaves, gradually halts. Meanwhile, internal translocation becomes highly dynamic, and as a result, the organic matter and mineral nutrients accumulated within these organs are continuously relocated to the pods and developing seeds [16,17,18,19]. This phase denotes the period characterized by the most substantial dry-matter accumulation in soybeans. The normal progression of this phase directly dictates the ultimate plumpness of the seeds [20,21]. Consequently, examining the growth of soybean seeds within this crucial period may elucidate the mechanisms underpinning seed wrinkling.
Seed development represents a multifaceted process that encompasses alterations in seed dimensions and the accretion of storage reserves. In plants, the development of fruits is predominantly regulated by cell division and cell expansion [22]. Conversely, the plumpness or wrinkling of a seed is determined by multiple factors. Investigations regarding the maize shrunken-kernel mutants sh2019 and sh2021 suggest that the shriveled and wrinkled seeds of these mutants are probably regulated by a single recessive nuclear gene [23]. In maize, the ZmBT1 and sh2 genes have likewise been demonstrated to play a role in kernel development. These genes exert an influence on endosperm development and starch synthesis, consequently impacting grain formation [24]. Nonetheless, alternative research suggests that seed development may be impeded by variations in external light, temperature, and humidity. In the presence of intense light, excessive water loss within the seed gives rise to cellular dehydration and shriveling, consequently disturbing normal seed development [25]. Furthermore, when short-day plants are subjected to overly long photoperiods, their internal circadian rhythms are perturbed. This perturbation impairs the accumulation and conversion of nutrients within the seeds, thus retarding seed development [26]. In the context of heat stress, the pace of grain development in foxtail millet decelerates, giving rise to kernels that are smaller and lighter in weight [27]. In the face of high-temperature stress, the photosynthetic rate of wheat declines, consequently influencing the accumulation of photosynthetic products and their conveyance to the grains [28]. High-temperature stress has the potential to impede the development of tassels and ears in maize. This results in a decrease in the dry weight of tassels and ears, damage to the morphological structure of pollen and silks, and impairment of the fertilization and grain-setting processes [29]. An overly high day-night temperature differential results in suboptimal plant growth and a decrease in yield [30]. When the external humidity drops to an excessively low level, seeds experience water loss. This water loss then inhibits their physiological activities and impedes seed development [31]. It is currently unclear whether the cause of grain shrinkage is genetic factors or environmental factors.
Sugars serve as the primary energy source enabling plants to execute diverse biochemical processes [32]. In the course of seed development, the provision of sugars is of vital importance for cell division, growth, and the synthesis of storage substances [33]. For instance, the over-accumulation of small-molecule substances, like soluble sugars, in the endosperm of maize gives rise to a high osmotic pressure. This, in turn, impacts the accumulation of dry matter during the growth of grains [34]. A substantial decline in sucrose content impedes the accumulation of grain biomass. This, in turn, inhibits the buildup of cottonseed grain biomass, ultimately resulting in a reduction in cottonseed grain biomass at maturity [35]. Furthermore, enzymes involved in sugar metabolism assume a pivotal role in the development of crop grains. Through modulating the synthesis, transportation, and degradation of sucrose, these enzymes influence grain filling, plumpness, and ultimate yield. For instance, sucrose synthase influences the grain-filling process of wheat through modulating the decomposition of sucrose and the synthesis of starch [36]. Sugar-metabolizing enzymes influence grain development not only by directly catalyzing reactions but also by regulating gene expression through signal-transduction pathways. For instance, TaTPP-7A modulates the decomposition of sucrose and the synthesis of starch via the T6P-SnRK1 signaling pathway, thus influencing grain filling. Cell-wall invertase (CWIN) and vacuolar invertase (VIN) modulate cell division and grain development through the generation of glucose-signaling molecules [36,37]. This suggests that any disruption to sugar metabolism may result in an inadequate energy supply [38], consequently impeding the normal development of seeds.
Previous experiments conducted by the research group demonstrated that soybean varieties cultivated in Jiamusi (latitude 49°49′ N, longitude 130°17′ E) do not develop wrinkled seeds when grown in the Jiamusi region. However, when introduced to Shenyang (latitude 41°82′ N, longitude 123°57′ E) for cultivation, certain cultivars (e.g., Heihe 43) exhibit wrinkled seeds, whereas others (e.g., Henong 76) do not. Nevertheless, the physiological and ecological mechanisms underlying this phenomenon remain elusive. To explore the molecular-level mechanism of soybean wrinkled-seed formation, this study utilized the non-wrinkling cultivar Henong 76 and the wrinkling-prone cultivar Heihe 43. This “genotype × environment” interaction phenomenon suggests that the light-temperature rhythms and ecological factors associated with latitude differences may trigger specific seed-filling disorders. However, the physiological and ecological mechanisms remain unclear. Based on this, the following hypothesis is proposed in this paper: The ecological conditions in Shenyang may induce a decline in the activity of the seed sink in sensitive cultivars (Heihe 43) by interfering with the sucrose-starch metabolism balance and phytohormone signal transduction, resulting in hindered seed filling. In contrast, tolerant cultivars (Henong 76) possess the ability to maintain the efficient unloading and storage of carbon assimilation products, thus avoiding wrinkling. To verify this hypothesis, in this study, Heihe 43 and Henong 76 were simultaneously planted in the experimental fields of Jiamusi Branch and Shenyang Agricultural University, respectively. The sugar content, key enzyme activities, the sucrose-starch metabolic pathway, as well as the gene expression and metabolite accumulation patterns related to the hormone signaling pathway during the seed-filling stage under the environments of the two locations were systematically compared. The aim is to decipher the molecular mechanisms by which ecological differences trigger soybean seed-filling disorders and provide a theoretical basis for the improvement of cultivar adaptability.

2. Materials and Methods

2.1. Plant Materials and Growth Conditions

The experiment was conducted simultaneously at the experimental sites of the Jiamusi Branch of the Heilongjiang Academy of Agricultural Sciences (latitude 49°49′ N, longitude 130°17′ E) and Shenyang Agricultural University (latitude 41°82′ N, longitude 123°57′ E) during 2021–2022. In this experiment, the randomized block design method was adopted. The materials employed were the Henong 76 cultivar, which is less prone to wrinkling, and the Heihe 43 cultivar, which is more likely to develop wrinkles. The planting density was set at 300,000 plants per hectare. The planting pattern consisted of two-row planting on a small ridge, with a ridge spacing of 60 cm and a seedling-belt distance within the small ridge of 13 cm. The experimental plot had a 6-row configuration, with each row being 5 m in length. Three replications were conducted. In each hole, 2 grains were sown, and through inter-planting, a single plant was left. The climate at the Shenyang experimental site is of the temperate semi-humid continental type. It has an annual average temperature of 8.5 °C and an annual rainfall of 750 mm. The basic soil fertility parameters are as follows: total nitrogen content, 1.28 g·kg−1; organic matter content, 12.15 g·kg−1; available phosphorus content, 35.30 mg·kg−1; and available potassium content, 151.78 mg·kg−1. The climate at the Jiamusi experimental site is classified as a mid-temperate continental monsoon climate, characterized by an annual average temperature of 3.0 °C and annual rainfall of 530 mm. The basic soil fertility parameters are as follows: total nitrogen content, 1.22 g·kg−1; organic matter content, 18.17 g·kg−1; available phosphorus content, 25.57 mg·kg−1; and available potassium content, 160.38 mg·kg−1. The meteorological data on temperature and precipitation at the experimental sites are presented in Supplementary Table S1.

2.2. Determination of Physiological Indicators

To assess the influence of grain-filling disorder on physiological parameters, we measured the contents of sucrose and starch, the activities of sucrose synthases (SPS and SuSy) and invertases (AI and NI) in soybean grains during the grain-filling stage. During the grain-filling stage, 10 plants exhibiting uniform growth were chosen between 8:00 and 9:00 a.m. Grains from the same node were collected, thoroughly mixed, wrapped in tin foil, quick-frozen in liquid nitrogen, and subsequently stored in an ultra-low temperature refrigerator at −80 °C for the determination of sugar content and enzyme activity. The method described by Liu [39] was modified for the extraction and determination of sugar content in soybean grains. The contents of soluble sugars and starch were determined via the anthrone colorimetric method, while the sucrose content was measured using the resorcinol method. Following the method described by Yang [40], enzymes in the samples were extracted, and the activities of sucrose phosphate synthase (SPS) and sucrose synthase (SuSy) in soybean grains were determined. The activities of acid invertase (AI) and neutral invertase (NI) in the samples were determined by referring to the methods described by Hu [41] and Li [42]. During the maturity stage, 10 plants exhibiting uniform growth from each of the two varieties were chosen from both experimental sites. The number of grains per plant and the number of wrinkled seeds per plant were determined. Subsequently, the wrinkled-seed rate per plant was calculated, and the 100-seed weight was measured. For each treatment, three biological replicates were established.

2.3. Transcriptome Sequencing

Total RNA was extracted from soybean leaves and roots using the MiniBEST Universal RNA Extraction Kit (Takara, Kusatsu, Japan). The concentrations of RNA were measured using an ultrafine spectrophotometer, the NanoDrop 2000C (Thermo Fisher Scientific, Waltham, MA, USA). The integrity of RNA was assessed by subjecting 3 μL of the RNA in the lysis solution to electrophoresis on a 1% agarose gel at 180 V for 10 min. Single-stranded cDNA was synthesized with the PrimeScriptTM RT Reagent Kit (Perfect Real Time) (Takara, Kusatsu, Japan). Subsequently, DNA polymerase I and RNase H were utilized to synthesize the second-strand cDNA and eliminate the mRNA template. Following the adenosinylation of the 3′ end of the DNA fragment, it was ligated to a NEBNext adapter featuring a hairpin-ring structure for hybridization. To preferentially select cDNA fragments with lengths of 250–300 bp, the library fragments were purified by means of the AMPure XP system (Beckman Coulter, Beverly, MA, USA). Subsequently, 3 μL of the USER enzyme (NEB, Ipswich, MA, USA) was employed to ligate the size-selected cDNA to the adaptor at 37 °C for 15 min. This was then followed by PCR at 95 °C for 5 min. Subsequently, PCR was carried out using Phusion high-fidelity DNA polymerase, along with universal PCR primers and Index (X) primers. Ultimately, the PCR products were purified using the AMPure XP system, and the quality of the library was assessed on the Agilent Bioanalyzer 2100 system (Agilent Technologies, Inc., Santa Clara, CA, USA). The TruSeq PE Cluster Kit v3-cBot-HS (Illumina, San Diego, CA, USA) was employed to perform clustering. Following clustering, sequencing was carried out on the Illumina platform. Subsequently, quality control, sequence alignment, transcript assembly, expression estimation, and differential expression analysis were conducted. The screening criteria for differentially expressed genes were set as |log2Fold Change| ≥ 1 and FDR < 0.05.

2.4. Metabolome Determination and Analysis

Biological samples were placed in a freeze-dryer (Scientz-100F, Ningbo Scientz Biotechnology Co., Ltd., Ningbo, China) using vacuum freeze-drying technology. Subsequently, the samples were ground into powder using a grinding machine (MM 400, Retsch, Retsch GmbH, Haan, DE, USA) operating at 30 Hz for 1.5 min. Using an electronic balance (MS105D μ), weigh 50 mg of sample powder. Then, add 1200 μL of −20 °C pre-cooled 70% methanol internal-standard extract. Note that the ratio of 1200 μL of extractant per 50 mg of sample should be such that the amount of sample is less than 50 mg. Rotate for 30 s every 30 min, and repeat this process 6 times. Following centrifugation at 12,000 rpm for 3 min, the supernatant was aspirated. Subsequently, the sample was filtered through a microporous membrane with a pore size of 0.22 μm and then stored in an injection bottle for UPLC-MS/MS analysis. The sample extracts were analyzed using a UPLC-ESI-MS/MS system. The UPLC component was the ExionLCTMAD (https://sciex.com.cn/), and the MS component was the Applied Biosystems 4500 Q TRAP (https://sciex.com.cn/). The identified metabolites were annotated by means of the KEGG compound database (http://www.kegg.jp/kegg/compound/, accessed on 28 December 2022). Subsequently, these annotated metabolites were mapped onto the KEGG Pathway database (http://www.kegg.jp/kegg/pathway.html, accessed on 28 December 2022). Subsequently, the pathways containing significant regulatory metabolites were subjected to MSEA (Metabolite Set Enrichment Analysis). The significance was determined based on the p-value of the hypergeometric test. The screening criterion for differential metabolites was set as Log2FC with |Log2FC| ≥ 1.0.

2.5. Analysis of Gene Expression by RT-qPCR

Total RNA was extracted from approximately 0.1 g of seed samples using Trizol reagent (Invitrogen, Waltham, MA, USA). Three biological replicates were set for each treatment, and samples were collected during the grain-filling stage. To eliminate genomic DNA contamination, the extracted RNA was treated with DNase I. The concentration and purity of the RNA were determined using a NanoDrop ND-1000 UV-Vis spectrophotometer (Thermo Fisher Scientific, Wilmington, MA, USA). Then, 2.5 μg of RNA was subjected to reverse transcription using Hifair III First-Strand cDNA Synthesis SuperMix (Yesen, Nanjing, China), which already contains an enzyme for removing genomic DNA. qPCR analysis was performed on a QuantStudio 6 Real-Time PCR System (ABI, Foster City, CA, USA) using SYBR Green PCR Master Mix (Takara Bio Inc., Shiga, Japan). The primers used are shown in Supplementary Table S2. The reaction conditions were as follows: 95 °C for 10 min, followed by 40 cycles of 95 °C for 15 s and 60 °C for 30 s. Each sample was run in triplicate. The relative expression levels among different samples were calculated using the 2-ΔΔCT method.

2.6. Statistical Analyses

All data were processed and analyzed using Microsoft Excel 2019. One-way analysis and two-way analysis of variance were conducted using SPSS 26.0, and Origin 22.0 was utilized for plotting. Each sample underwent three biological replicates.

3. Results

3.1. Analysis of Physiological Parameters

As can be observed from Figure 1, Heihe 43 (T2 treatment) planted in Shenyang exhibited severe seed-filling disorders (i.e., the phenomenon of seed wrinkling) (as shown in Figure 1B). In contrast, Henong 76 planted in Shenyang (T1 treatment) and Henong 76 planted in Jiamusi (Q1 treatment) did not show the phenomenon of seed wrinkling (Figure 1A). After measuring the physiological parameters related to seed-filling disorders, the results indicated that for Heihe 43 (T2 treatment) planted in Shenyang, the wrinkled-seed rate per plant was as high as 20.74% (Figure 1C), and the 100-seed weight also decreased significantly (Figure 1D). Significant differences in sugar content and sugar-enzyme activity were also observed among the various treatments. The sucrose content of Heihe 43 cultivated in Shenyang (T2 treatment) was significantly higher than that of Heihe 43 cultivated in Jiamusi (Q2 treatment). In contrast, the starch content was significantly lower (Figure 1E,F). The activity of SPS decreased significantly (Figure 1G). The activity of SuSy increased significantly (Figure 1H). Moreover, the activities of α-amylase, β-amylase, acid invertase, and neutral invertase increased significantly (Figure 1I,L).

3.2. Correlation Analysis Between Ecological Factors and Soybean Wrinkled-Seed

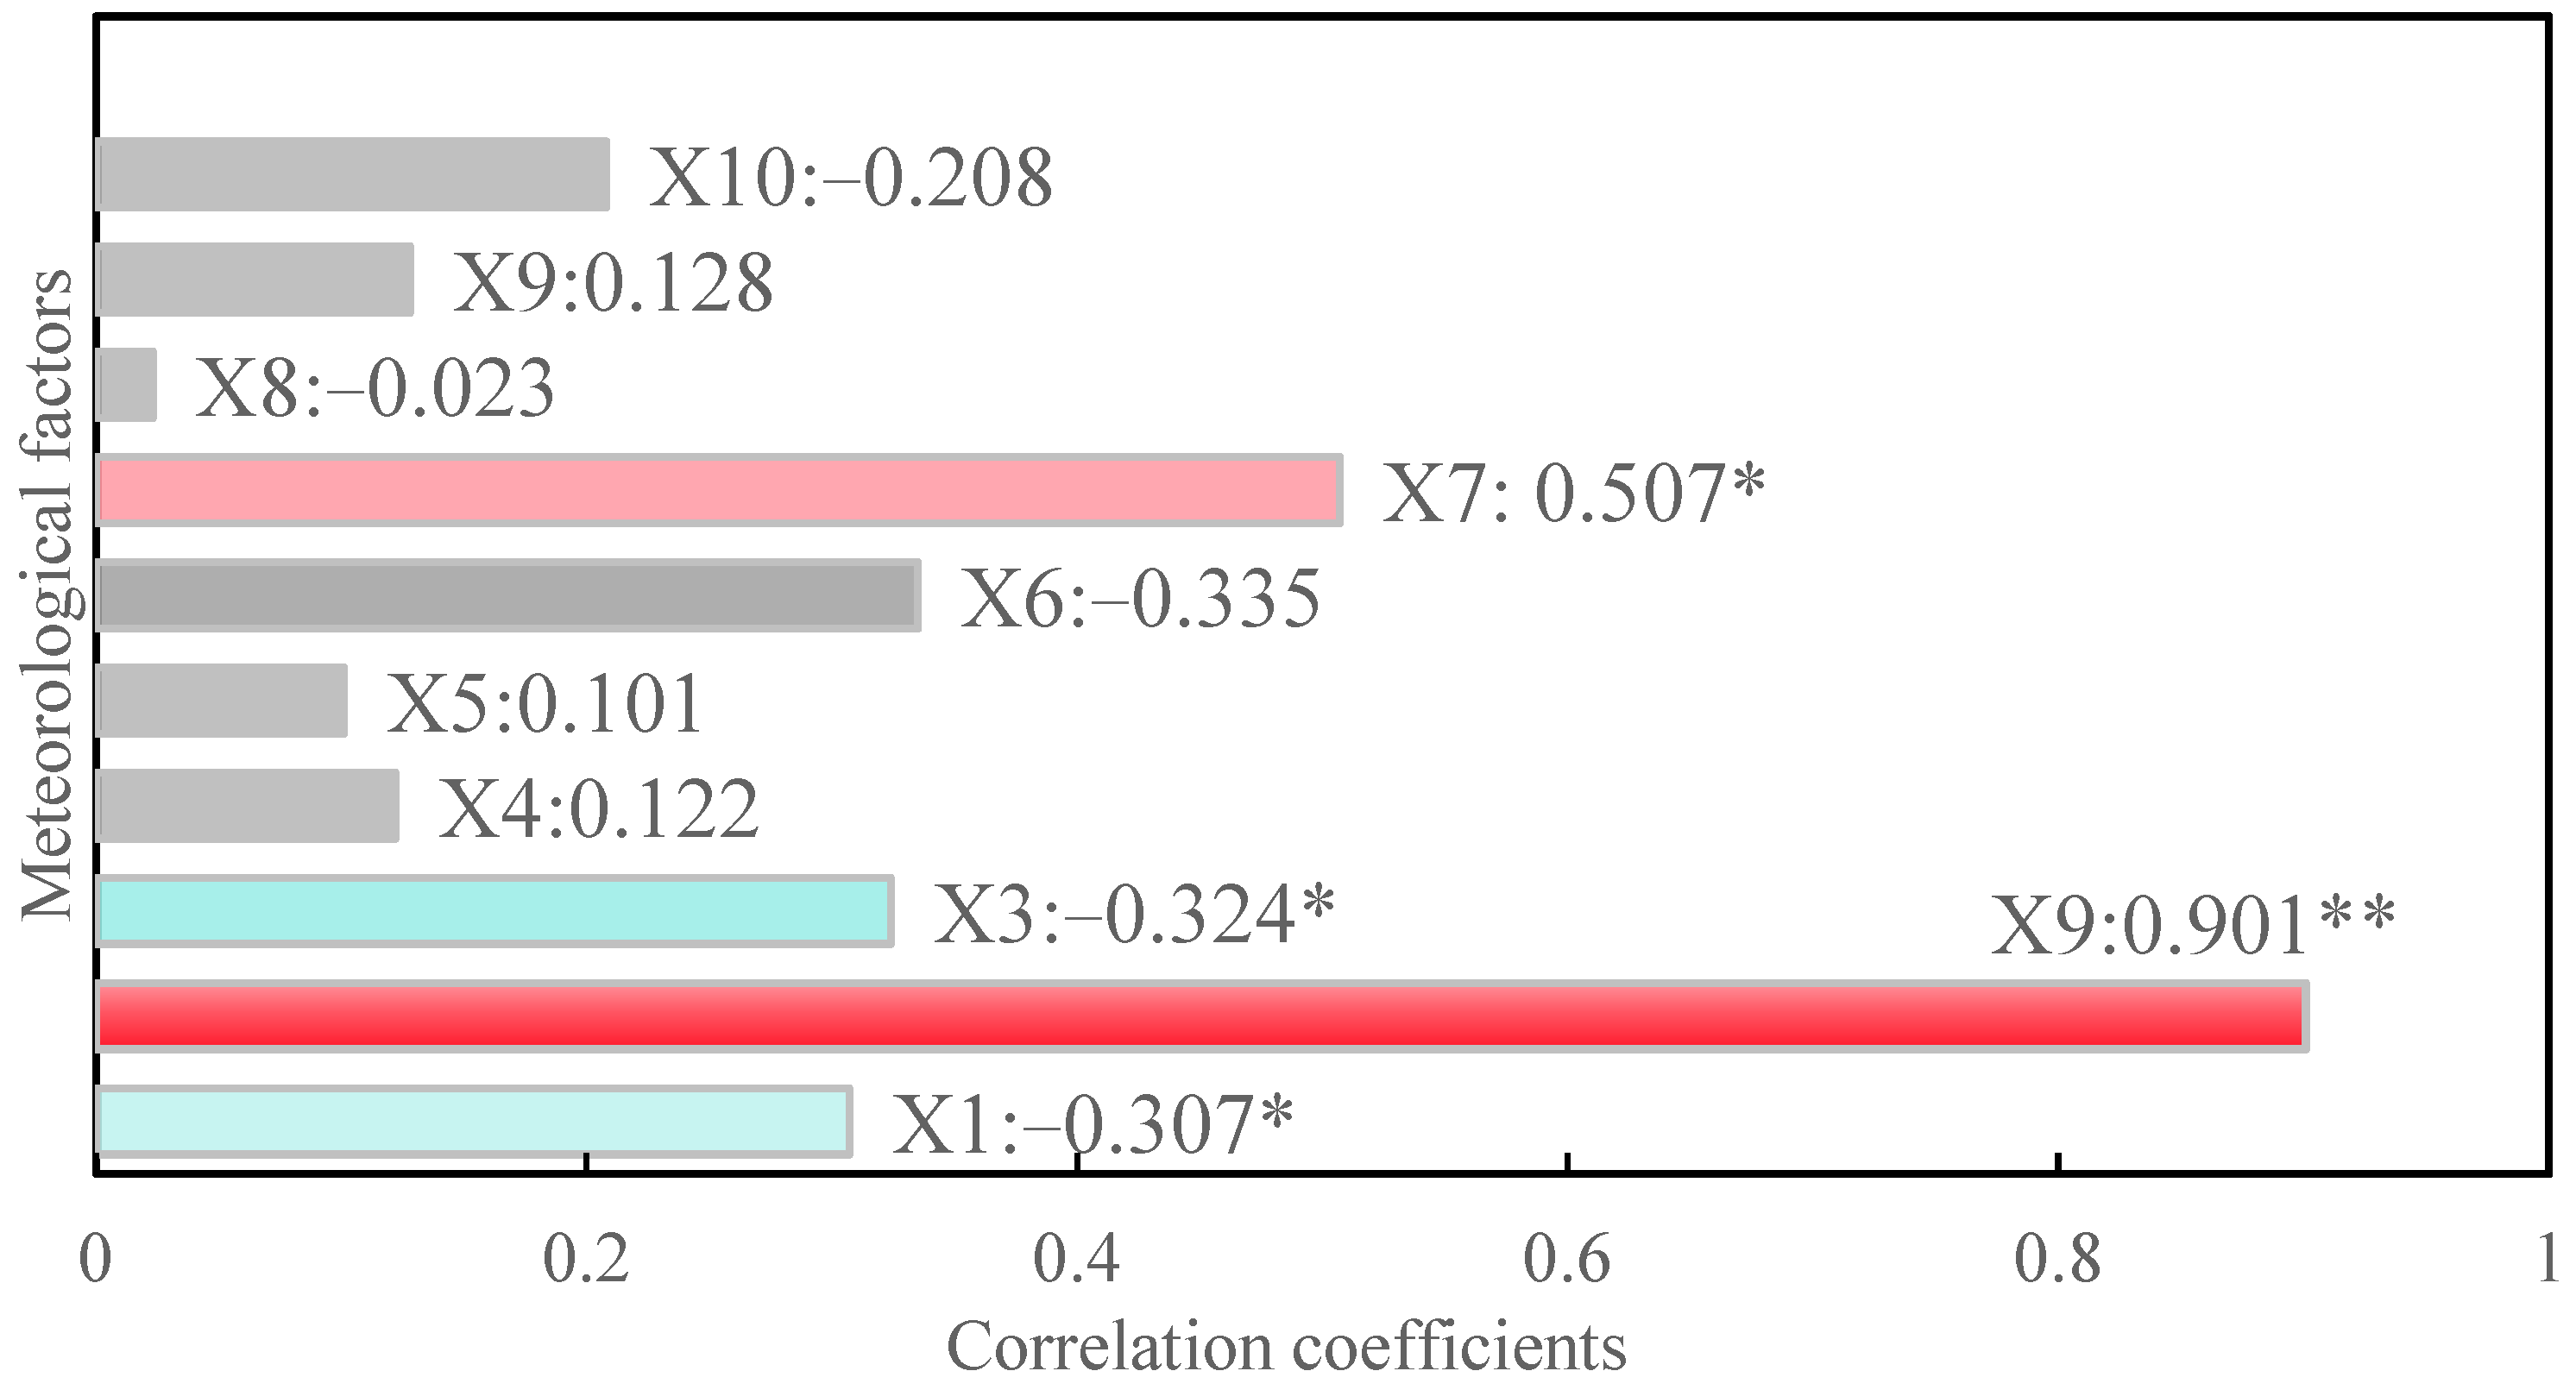
As depicted in Table 1, before the soybean pod-setting stage, no significant temperature disparity was observed between the two experimental sites. Nevertheless, during the soybean grain-filling phase, a notable difference became apparent. Furthermore, in 2022, during the soybean grain-filling stage in Shenyang, the daily average temperature and maximum temperature attained values as high as 25.65 °C and 31.36 °C (Supplementary Table S1), respectively. During all three reproductive growth stages, the temperature at the Shenyang experimental site was consistently higher than that at the Jiamusi experimental site (Table 1). For instance, during the grain-filling stage, the daily average temperature in Shenyang was 24% higher than that in Jiamusi (22.25 °C and 20.66 °C, respectively; two-way ANOVA: location effect F1,8 = 8.92, p = 0.016, η2 = 0.53). A significant location× cultivar interaction effect was also detected during this growth stage (F1,8 = 9.55, p = 0.013). The results of the Tukey HSD test showed that within the Shenyang experimental site, the average temperature of Henong 76 was 0.24 °C higher than that of Heihe 43 (26.00 ± 0.01 °C and 25.76 ± 0.01 °C, respectively, p = 0.012). A similar pattern was observed for the daily maximum temperature (p = 0.012). However, in the other two growth stages, no such differences were detected among the varieties (p ≥ 0.34). A more in-depth analysis was performed to examine the correlation between the quantity of shriveled soybean grains and the ecological factors during the grain-filling stage (Figure 2). The findings indicated that the daily maximum temperature exhibited an extremely significant positive correlation with the quantity of wrinkled seeds per plant (r = 0.901 **). The effects of the remaining meteorological factors were not significant.

3.3. Transcriptome Analysis

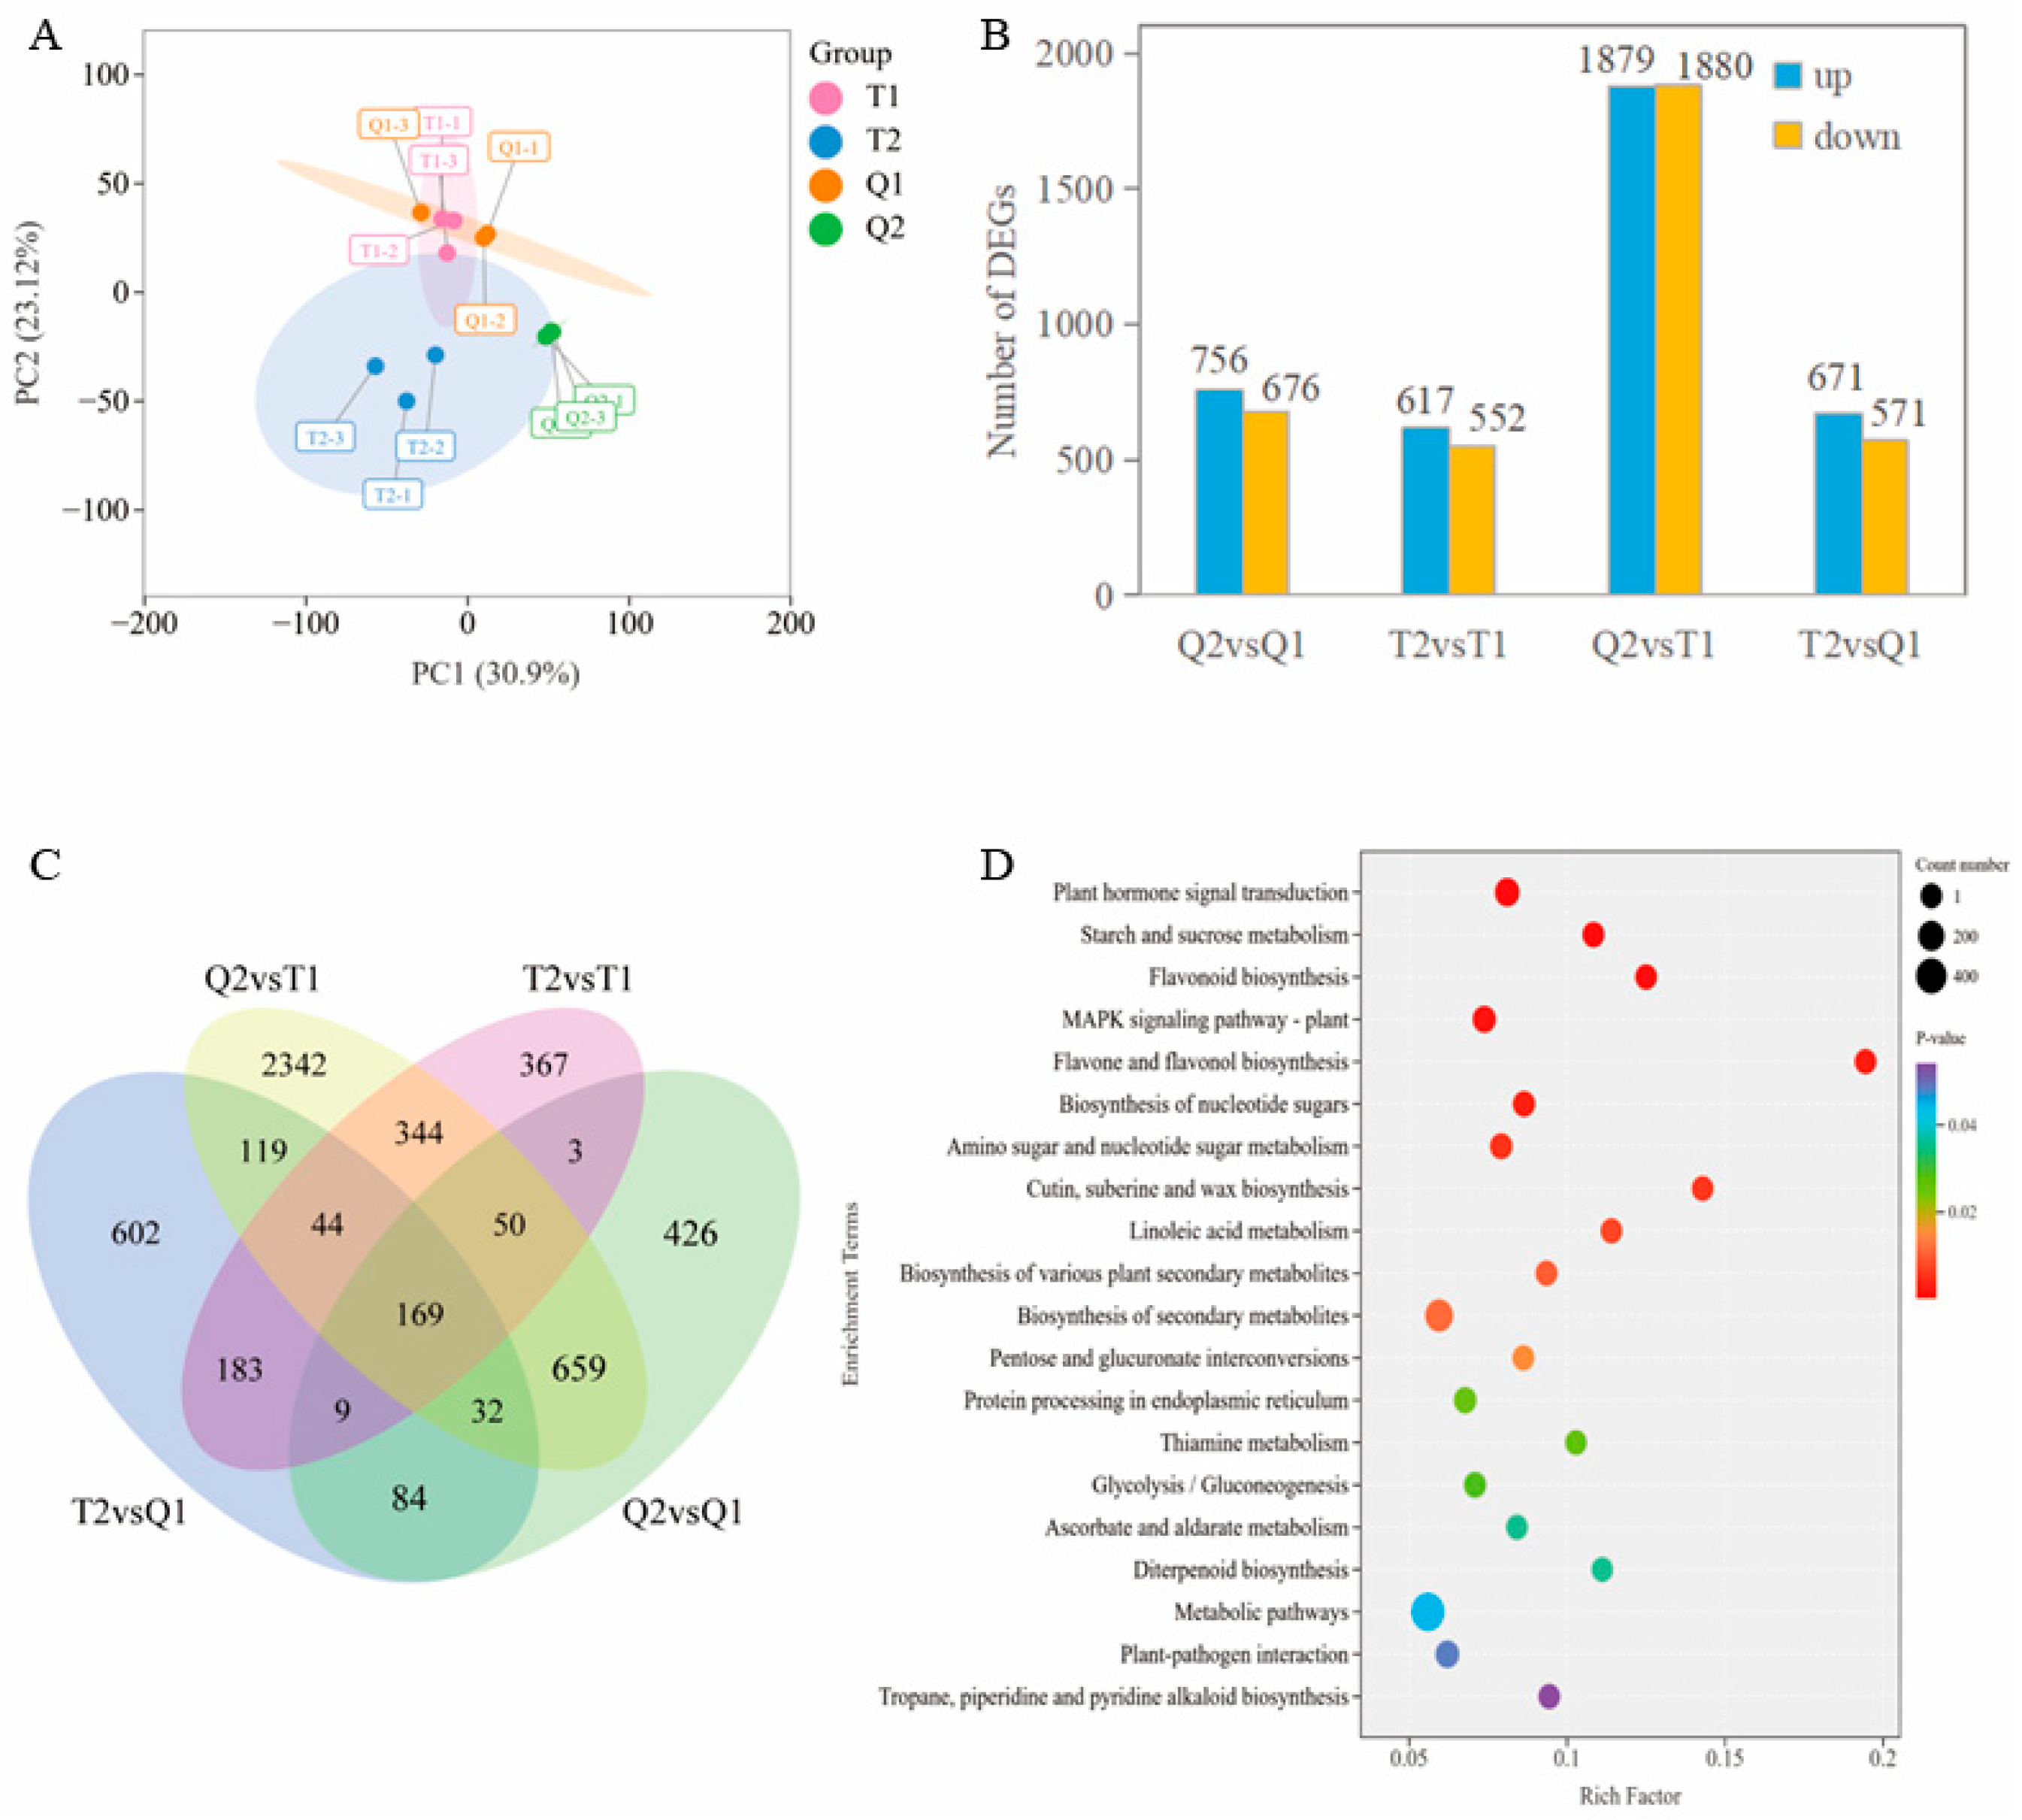
In an attempt to identify genes potentially linked to seed wrinkling, we performed a genome-wide transcriptome analysis of soybean seeds from four treatments (T1, T2; Q1, Q2). An analysis of the PCA results presented in Figure 3A reveals that the replicate samples within each group exhibit a high degree of correlation, as indicated by close clustering. In contrast, a substantial distance is observed between different groups. This suggests that transcript expression varies among different treatments. Through pairwise comparisons, we successfully identified 24,423 differentially expressed genes in soybean seeds. Among these comparisons, namely T2vsT1, Q2vsQ1, T2vsQ1, and Q2vsT1, the results indicated that 617, 756, 671, and 1879 genes were up-regulated, while 552, 676, 571, and 1880 genes were down-regulated, respectively (Figure 3B). The KEGG pathway enrichment analysis indicated that within each comparison group, the differentially expressed genes (DEGs) of Henong 76 and Heihe 43 were significantly enriched in several key metabolic pathways. These pathways included plant hormone signal transduction, the mitogen-activated protein kinase (MAPK) signaling pathway in plants, as well as starch and sucrose metabolism (Figure 3D). Subsequent analysis indicated that, when cultivated in the same location, 1169 differentially expressed genes (DEGs) were identified between Henong 76 and Heihe 43 in Shenyang, and 1432 DEGs were identified between the two varieties in Jiamusi. When cultivated in distinct locations, 1243 and 3759 differentially expressed genes (DEGs) were identified between Henong 76 and Heihe 43, respectively. Among these, 364 genes were overlapping DEGs (Figure 3C). This suggests that when the two varieties are cultivated in distinct locations, the quantity of differentially expressed genes (DEGs) between them increases. The annotation of overlapping genes indicated that material transport was the most highly enriched pathway (ko03013) and biological process (GO:0043228), as presented in Supplementary Table S4. The GO enrichment analysis of all differentially expressed genes (DEGs) in the four comparison groups indicated that these DEGs were predominantly enriched in transport (GO:0006810), small-molecule transport (GO:0006812), potassium-ion transport (GO:0006813), ion-channel activity (GO:0005216), calcium-ion transport (GO:0006816), sucrose-stimulated cellular response (GO:0071329), and starch metabolic process (GO:0005982), as depicted in Supplementary Figure S1A,D and Supplementary Table S5. The KEGG pathway analysis categorized the differentially expressed genes (DEGs) into 123, 119, 126, and 133 pathways, respectively, as presented in Supplementary Table S3. Notably, the metabolism of sucrose and starch was significantly enriched in all four comparison groups. This finding indicates that sucrose and starch play crucial roles in regulating seed wrinkling in soybeans. Furthermore, plant hormone signal transduction and the mitogen-activated protein kinase (MAPK) signaling pathway in plants were identified as enriched in the four comparison groups, as shown in Figure 3D.

3.4. Metabolome Analysis

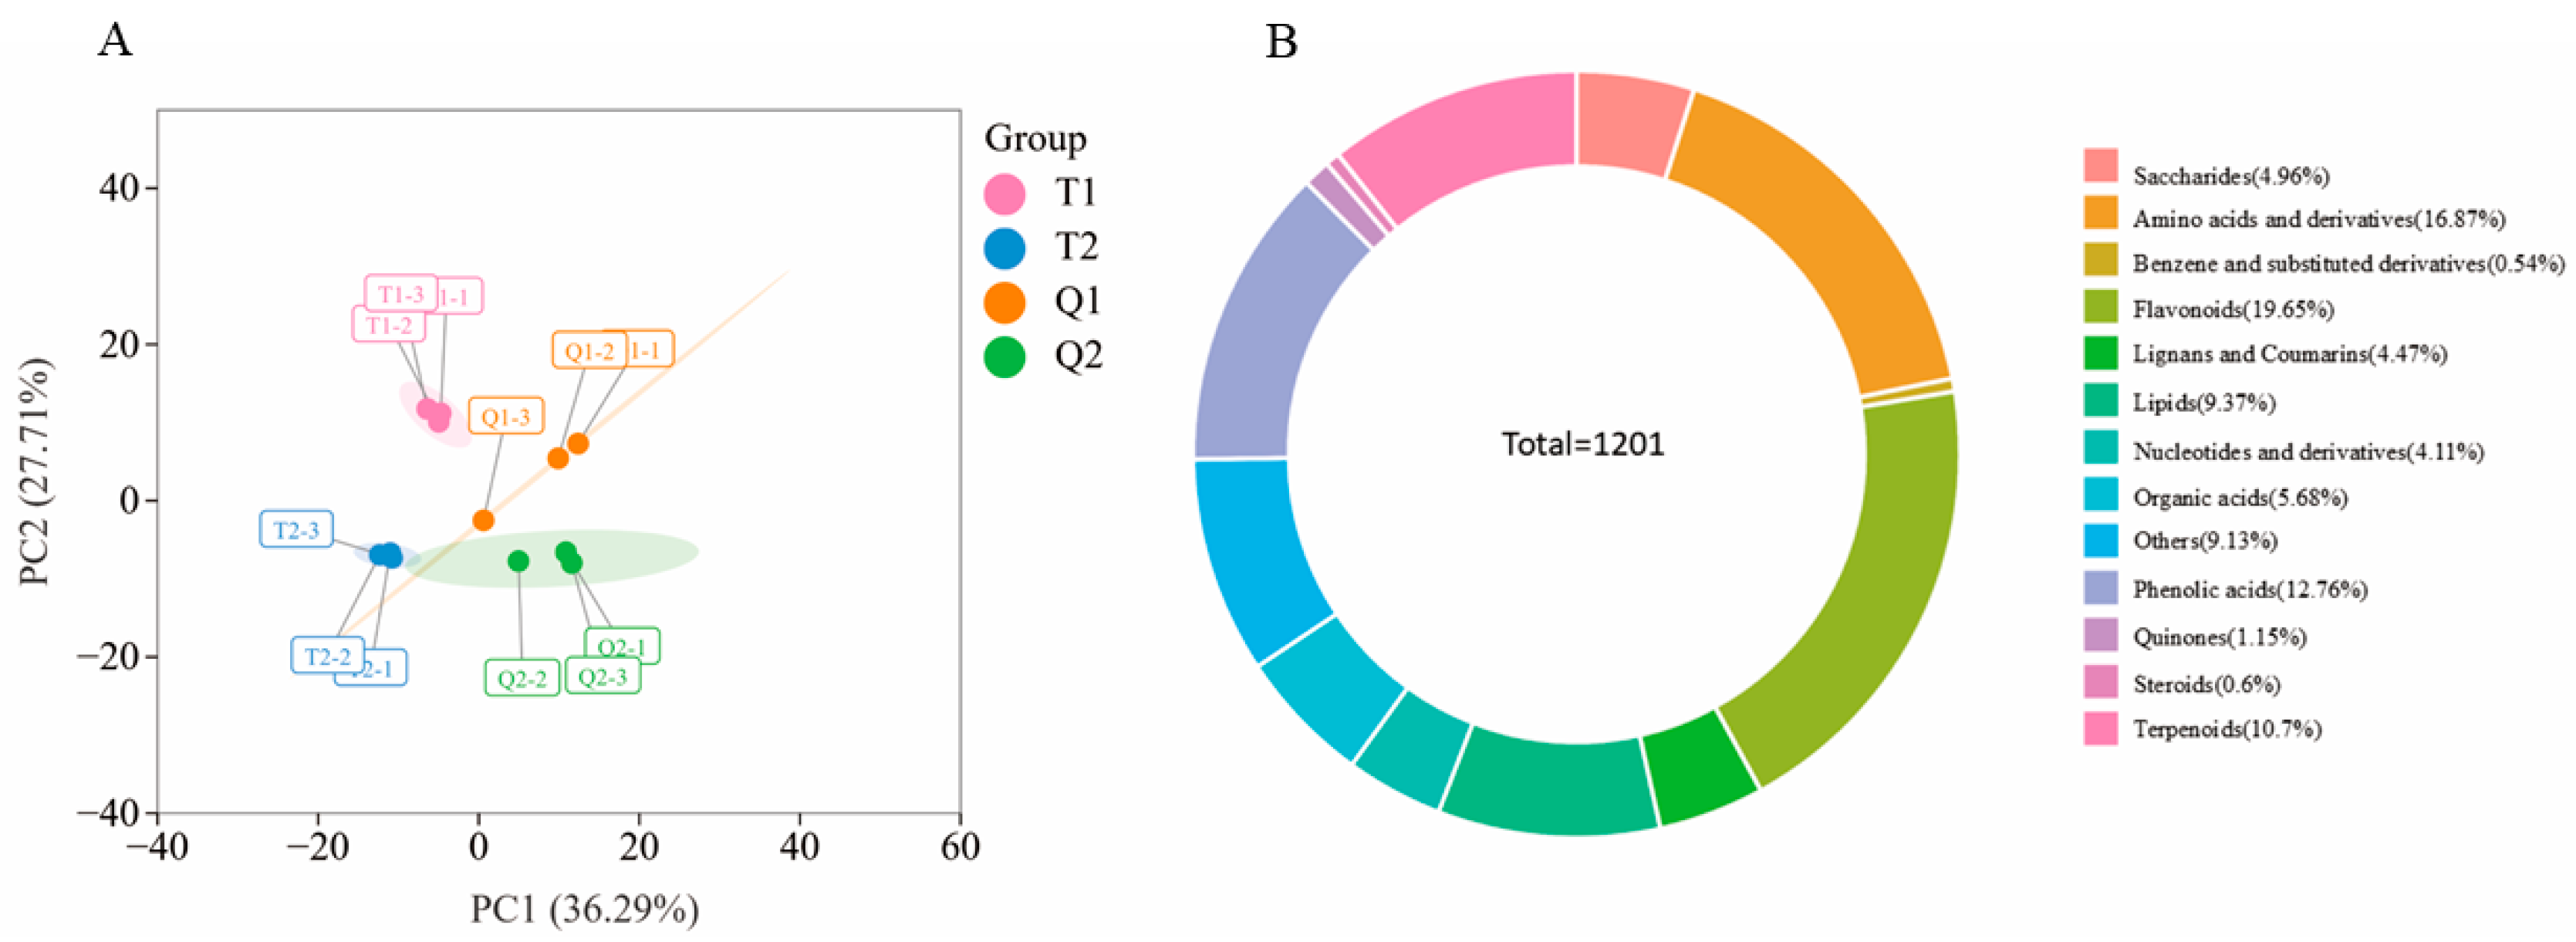
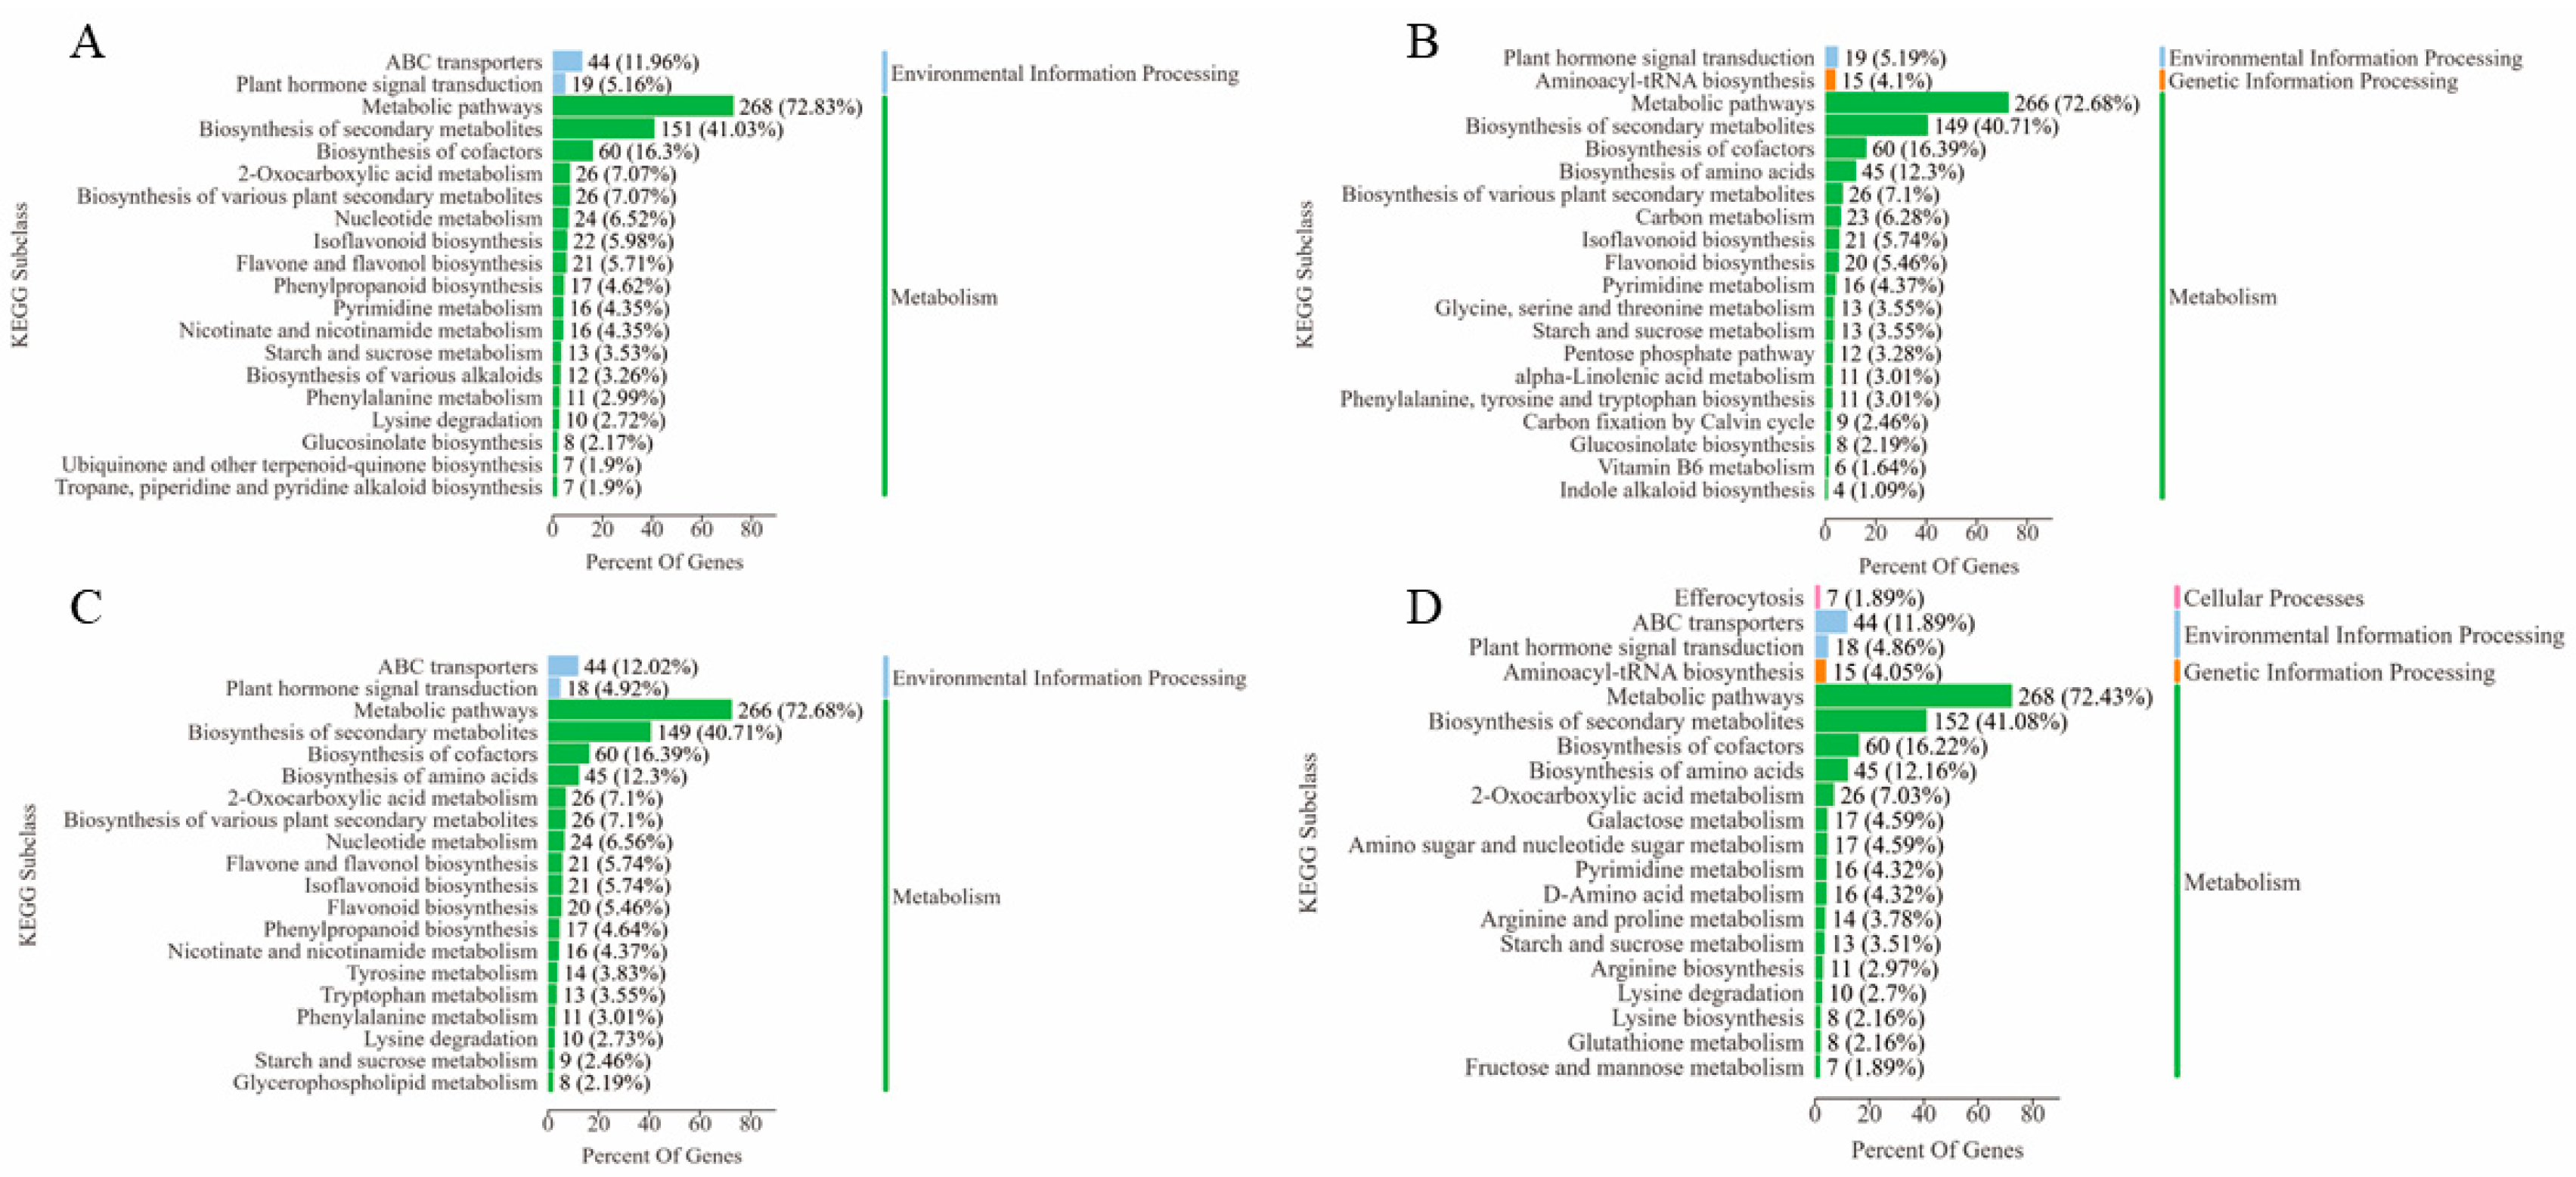
In an effort to uncover the metabolic mechanism underpinning soybean seed wrinkling, we utilized metabolome sequencing technology to analyze soybean seeds from four treatments. The PCA results presented in Figure 4A indicated that replicate samples within each group exhibited a high degree of correlation, as evidenced by close clustering. Conversely, a substantial distance was observed between different groups, suggesting the reliability of the metabolome data. In total, 1201 metabolites were detected within the metabolome, as presented in Figure 4B. Notably, differentially accumulated metabolites (DAMs) associated with amino acids and their derivatives, flavonoids, phenolic acids, terpenoids, and carbohydrates exhibited relatively high occurrence frequencies, contributing 16.87%, 19.65%, 12.76%, 10.7%, and 4.96% to the total number of DAMs, respectively. Subsequently, we conducted a further comparison of the differentially accumulated metabolites (DAMs) across the four comparison groups. Our findings revealed that the DAMs within the top 20 KEGG-enriched pathways were predominantly enriched in metabolism-related pathways, as depicted in Figure 5A,D. Overall, multiple metabolic pathways were significantly enriched across all four comparison groups. These included general metabolic pathways, the biosynthesis of secondary metabolites, the biosynthesis of cofactors, pyrimidine metabolism, glucoside biosynthesis, as well as starch and sucrose metabolism. Furthermore, within the classification of environmental information-processing pathways, the differentially accumulated metabolites (DAMs) in all four comparison groups exhibited significant enrichment in the plant hormone signal-transduction pathway. Based on the KEGG enrichment analysis of DEGs and DAMs, it is inferred that under varying geographical planting conditions, starch and sucrose metabolism play a key role in regulating gene expression and metabolite accumulation during seed development in Henong 76 and Heihe 43. Therefore, it is intended to conduct further in-depth analysis on starch and sucrose metabolism, with the aim of comprehensively exploring the role of these key pathways in the context of seed wrinkling induced by planting across different geographical locations.

3.5. Combined Transcriptome and Metabolome Analysis

3.5.1. KEGG Enrichment Analysis

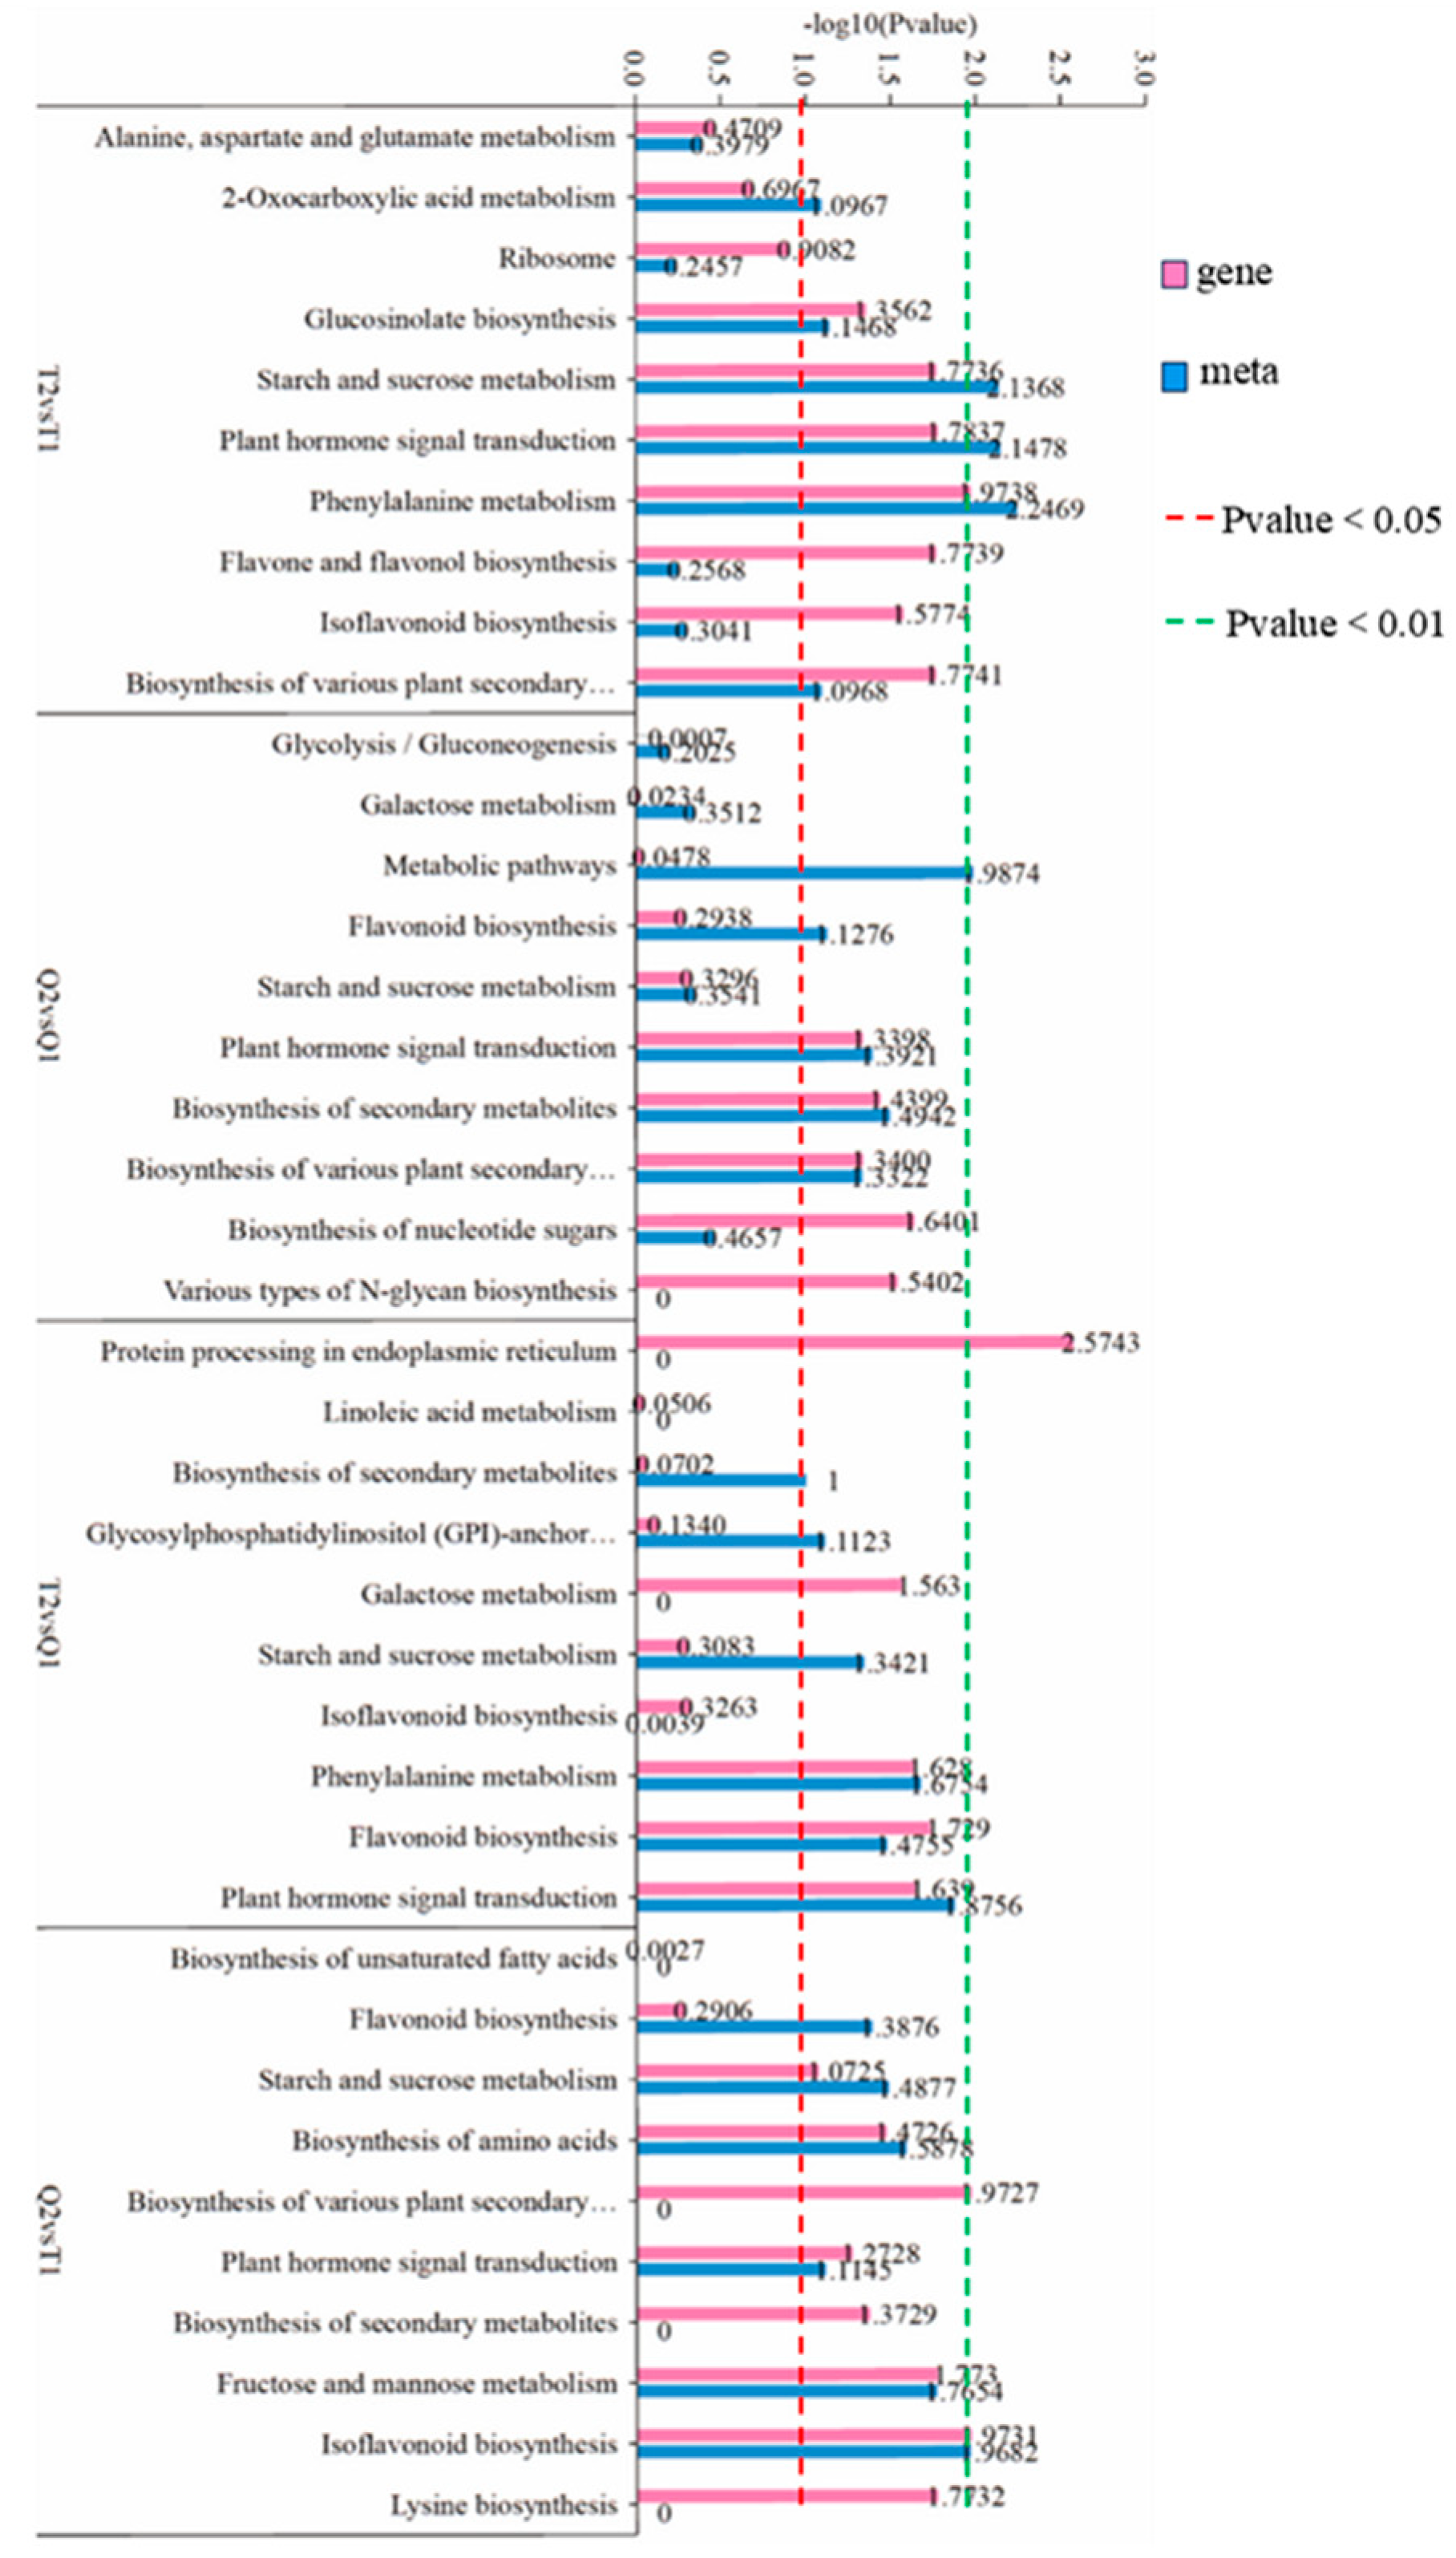
To further identify the metabolic pathways co-enriched by differentially expressed genes (DEGs) and differentially expressed metabolites (DEMs), the top 10 KEGG pathways co-enriched by DEGs and DEMs across the four comparison groups were mapped, revealing a total of 31 enriched pathways (Figure 6). In the T2vsT1 comparison group, the top three pathways in which differentially expressed genes (DEGs) and differentially expressed metabolites (DEMs) are predominantly enriched are “Phenylalanine metabolism”, “Plant hormone signal transduction”, and “Starch and sucrose metabolism”. Within the Q2vsQ1 comparison group, the top three pathways in which differentially expressed genes (DEGs) and differentially expressed metabolites (DEMs) are predominantly enriched are “Biosynthesis of secondary metabolites”, “Plant hormone signal transduction”, and “Biosynthesis of diverse plant secondary metabolites”. Within the T2vsQ1 comparison group, the top three pathways in which differentially expressed genes (DEGs) and differentially expressed metabolites (DEMs) are predominantly enriched are “Plant hormone signal transduction”, “Phenylalanine metabolism”, and “Flavonoid biosynthesis”. Within the Q2vsT1 comparison group, the top three pathways in which differentially expressed genes (DEGs) and differentially expressed metabolites (DEMs) are predominantly enriched are “Isoflavonoid biosynthesis”, “Fructose and mannose metabolism”, and “Biosynthesis of amino acids”. Nevertheless, within the four comparison groups, the “Starch and sucrose metabolism pathway” and “Plant hormone signal transduction” emerged with the highest frequency (four times). Consequently, it can be inferred that “sucrose and starch metabolism” and “plant hormone signal transduction” might be the key metabolic pathways implicated in seed wrinkling.

3.5.2. Analysis of Key Metabolic Pathways

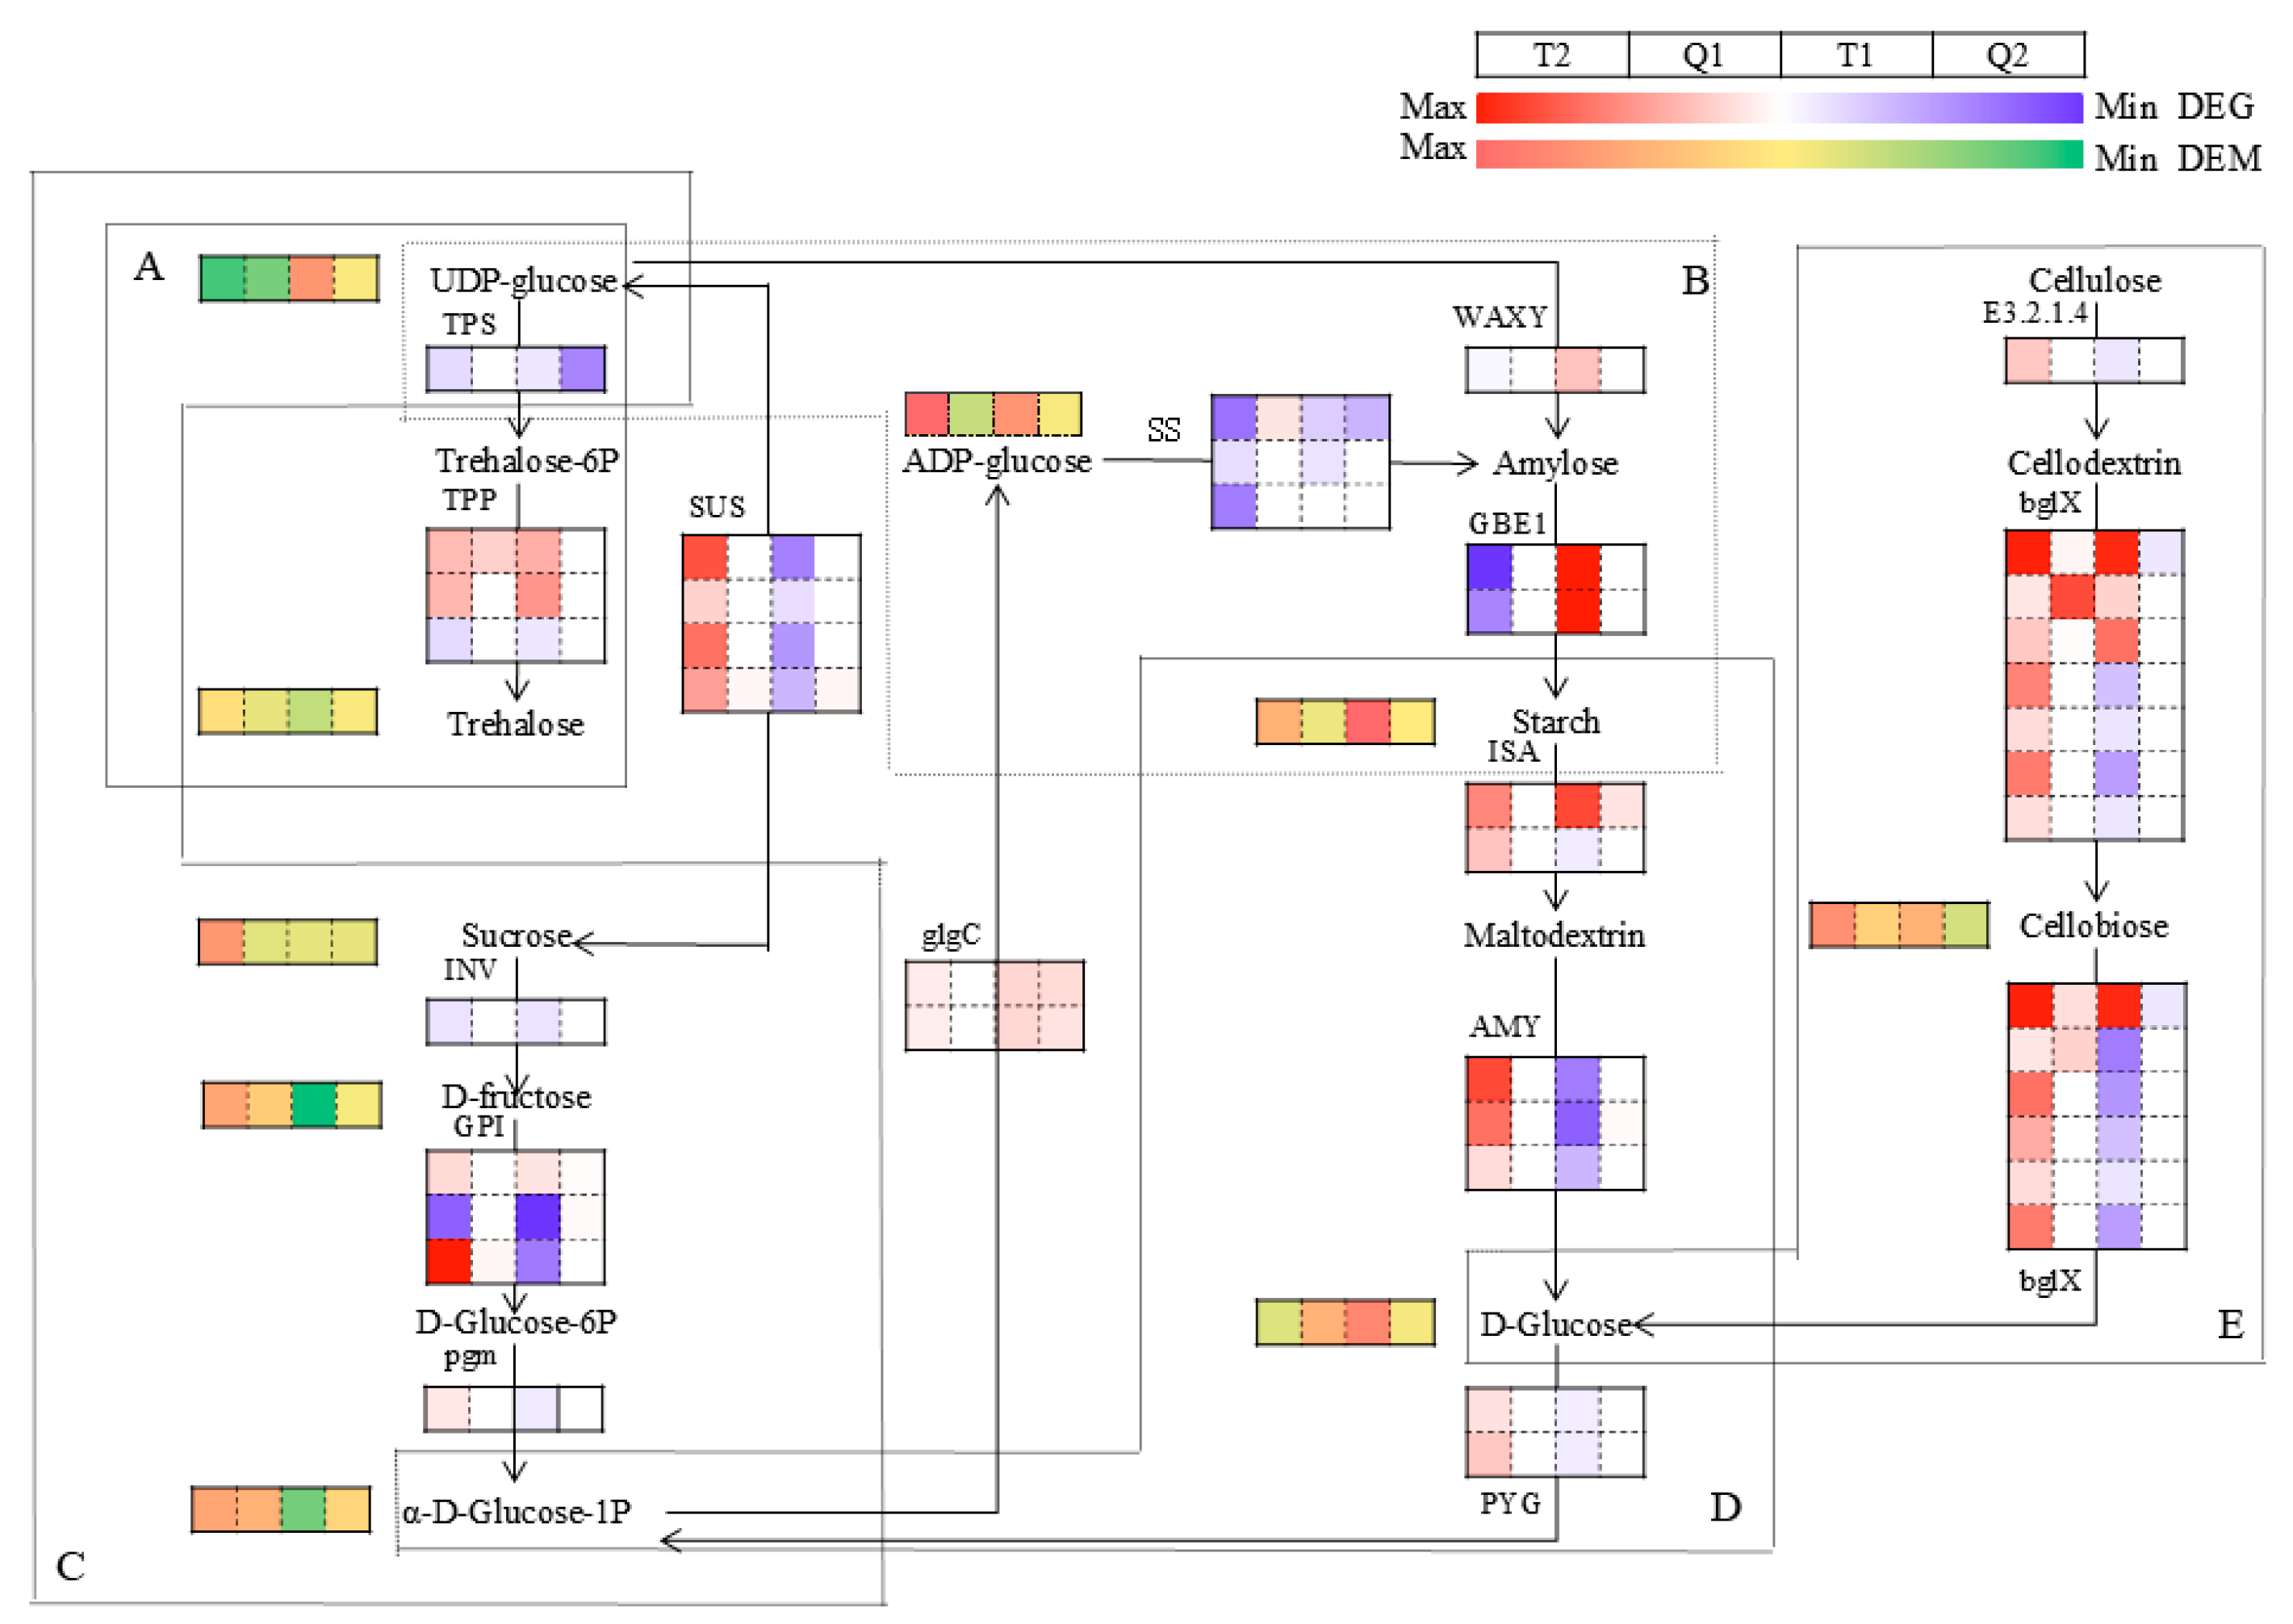
To present the changes in key differentially expressed genes (DEGs) and differentially expressed metabolites (DEMs) associated with seed wrinkling more clearly and intuitively, we mapped the sucrose-and-starch metabolism pathways and generated heatmaps of the DEGs and DEMs. In total, 40 differentially expressed genes (DEGs) and 9 differentially expressed metabolites (DEMs) were identified within the starch-and-sucrose metabolism pathway, as shown in Figure 7 and Supplementary Table S6A. This pathway principally consists of five processes: the trehalose synthesis process, the starch synthesis process, the sucrose synthesis and hydrolysis process, the starch hydrolysis process, and the cellulose hydrolysis process. Within the four treatments, the expression of genes associated with the regulation of trehalose-6-phosphate synthase (TPS) and trehalose-6-phosphate phosphatase (TPP) was either up-regulated or down-regulated, as depicted in Figure 7A. This finding suggests that trehalose is implicated in the mechanism underlying soybean seed wrinkling. In comparison to the T1 treatment, the T2 treatment led to a down-regulation of the expression of genes associated with the regulation of trehalose-6-phosphate synthase (TPS), sucrose synthase (SS), granule-bound starch synthase (WAXY), and glycogen branching enzyme 1 (GBE1). In comparison to the Q2 treatment, the T2 treatment likewise led to a down-regulation of the expression of genes associated with starch synthesis, as shown in Figure 7B. During the starch-hydrolysis process, in comparison to the T1 treatment, the T2 treatment significantly increased the expression of genes associated with the regulation of isoamylase (ISA), α-amylase (AMY), and glycogen phosphorylase (PYG), as depicted in Figure 7D. This finding suggests that substantial changes in starch synthesis and hydrolysis took place in both varieties when they were planted in Shenyang. During the sucrose synthesis and decomposition process, in comparison to the T1 treatment, the T2 treatment significantly increased the expression of genes associated with the regulation of sucrose synthase (SUS), invertase (INV), glucose-6-phosphate isomerase (GPI), and phosphoglucomutase (PGM). In comparison to the Q2 treatment, the T2 treatment likewise increased the expression of genes associated with sucrose synthesis and hydrolysis, along with the accumulation of metabolites, as depicted in Figure 7C. In total, 14 genes underwent either up-regulation or down-regulation during the cellulose-hydrolysis process. In comparison to the T1 treatment, the T2 treatment increased the expression of genes associated with the regulation of endoglucanase (E3.2.1.4) and β-glucosidase (BglX). Compared with the Q2 treatment, the T2 treatment also upregulated the expression of genes related to the regulation of endoglucanase (E3.2.1.4) and β-glucosidase (bglX) (Figure 7E). During metabolomic analysis, the up-regulation of differentially expressed genes (DEGs) facilitated the accumulation of associated metabolites (trehalose, glucose, sucrose, fructose), whereas the down-regulation of DEGs impeded the accumulation of related metabolites (starch). In the context of the T2 treatment, the abundances of five metabolites (trehalose, sucrose, α-D-glucose-1-phosphate, glucose, and cellulose) were significantly greater than those under the T1 treatment. Within the starch-and-sucrose metabolism pathway, the distinct responses of Henong 76 and Heihe 43 to seed wrinkling induced by off-site introduction lead to alterations in the content of seed sugars (sucrose and starch).
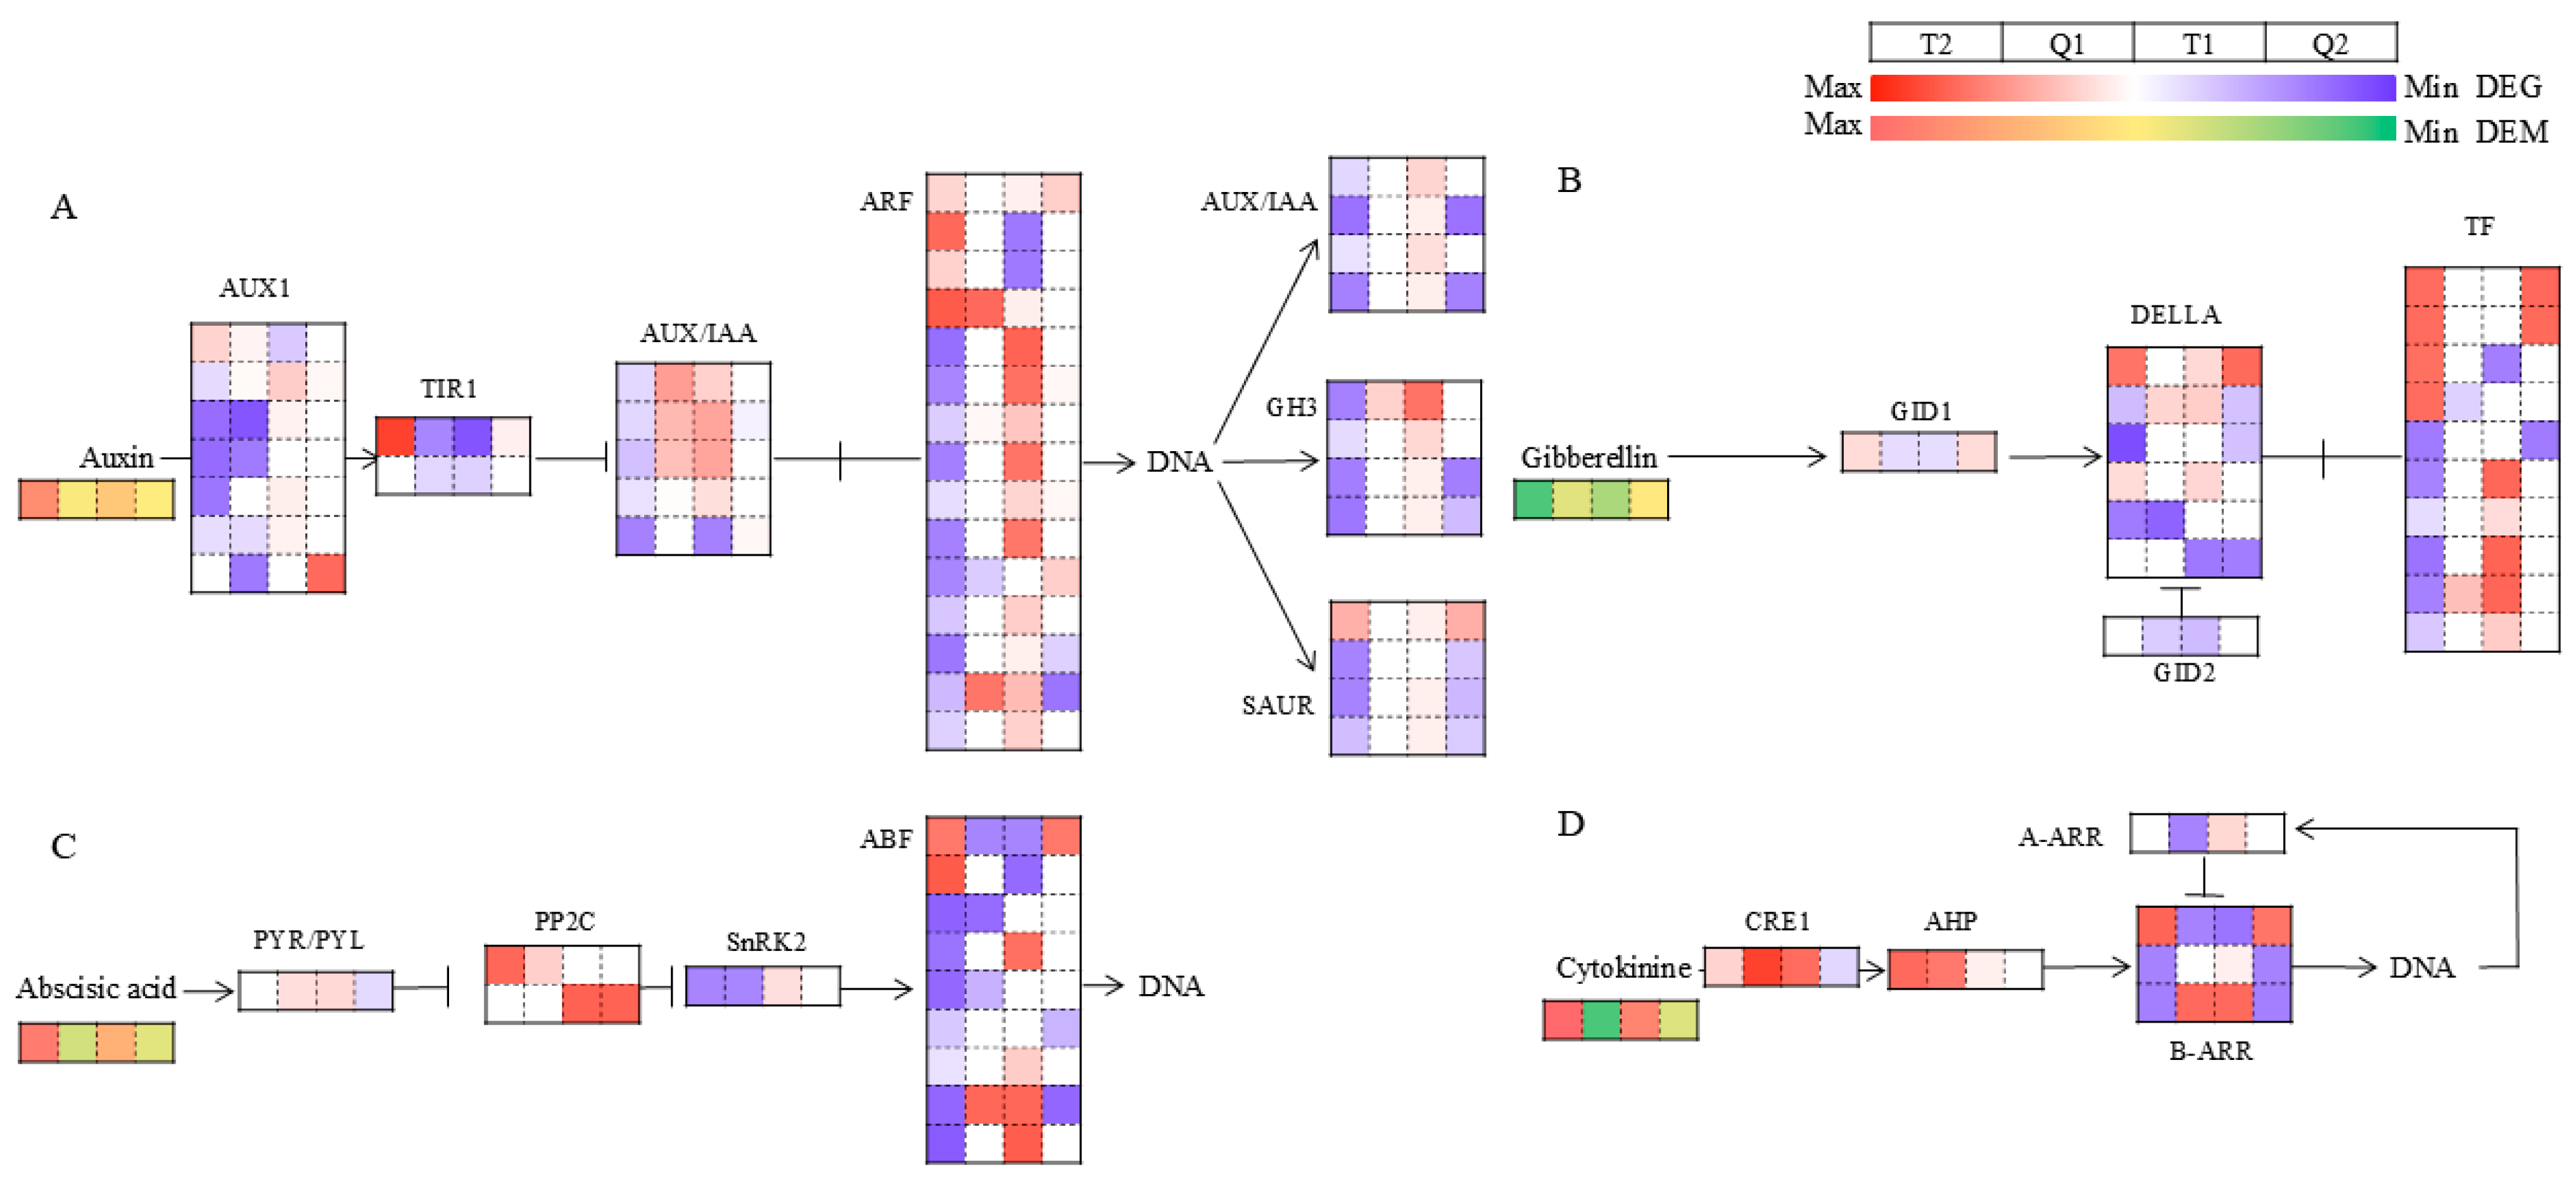
Furthermore, the plant-hormone signal-transduction pathway was found to be enriched within the four comparison groups. The KEGG analysis conducted in this study offers evidence of substantial alterations in the gene expression of auxin (IAA), cytokinin (CK), gibberellin (GA), and abscisic acid (ABA) within signal-mediated transduction pathways. Consequently, our focus was directed towards the differentially expressed genes (DEGs) within the biosynthesis and signal-transduction pathways of these plant hormones. Within the plant-hormone signal-transduction pathway, 136 genes in total were annotated, as shown in Figure 8. Within the signal pathways of auxin, gibberellin, abscisic acid, and cytokinin, 41, 18, 13, and 6 genes were identified, respectively, as presented in Supplementary Table S6B. Within the auxin pathway, in comparison to the T1 treatment, 31 genes (5 AUX1s, 8 AUX/IAAs, 11 ARFs, 4 GH3s, and 3 SAURs) were down-regulated under the T2 treatment, whereas 7 genes (1 AUX1, 1 TIR1, 4 ARFAHs, and 1 SAUR) were up-regulated. In comparison to the Q2 treatment, 26 genes (5 AUX1s, 6 AUX/IAAs, 10 SAURs, 3 GH3s, and 2 ARFs) were down-regulated under the T2 treatment, whereas 6 genes (1 AUX1, 1 TIR1, and 4 ARFs) were up-regulated, as depicted in Figure 8A. Within the gibberellin pathway, in comparison to the T1 treatment, 9 genes (3 DELLAs and 6 TFs) were down-regulated under the T2 treatment, whereas 7 genes (1 GID1, 1 GID2, 1 DELLA, and 4 TFs) were up-regulated. In comparison to the Q2 treatment, 6 genes (1 DELLA and 5 TFs) were down-regulated under the T2 treatment, whereas 2 genes (2 TFs) were up-regulated, as shown in Figure 8B. Within the abscisic-acid pathway, in comparison to the T1 treatment, 10 genes (1 PYR/PYL, 1 PP2C, 1 SnRK2, and 7 ABFs) were down-regulated under the T2 treatment, whereas 3 genes (1 PP2C and 2 ABFs) were up-regulated. In comparison to the Q2 treatment, under the T2 treatment, seven genes (one PP2C, one SnRK2, and five ABFs) were down-regulated, whereas three genes (one PYR/PYL, one PP2C, and one ABF) were up-regulated, as shown in Figure 8C. Within the cytokinin pathway, in comparison to the T1 treatment, four genes (one CRE1, two B-ARRs, and one A-ARR) were down-regulated under the T2 treatment, whereas three genes (one CRE1, one AHP, and one B-ARR) were up-regulated, as depicted in Figure 8D.
In summary, within the four treatments, the disparities in gene-expression levels were most conspicuous when comparing T2 with T1 and T2 with Q2. Specifically, when comparing T2 with T1, the genes regulating IAA, GA, ABA, and CK generally exhibited down-regulated expression. Nevertheless, within the metabolite analysis, the accumulation of IAA, ABA, and CK was augmented, whereas the accumulation of GA was diminished. Specifically, within the T2-versus-Q2 comparison group, the expression of genes regulating IAA, GA, ABA, and CTK was down-regulated. Nevertheless, within the metabolite analysis, the accumulation of IAA, ABA, and CK increased, whereas the accumulation of GA decreased.

3.6. RT-qPCR Validation of Selected Differentially Expressed Genes

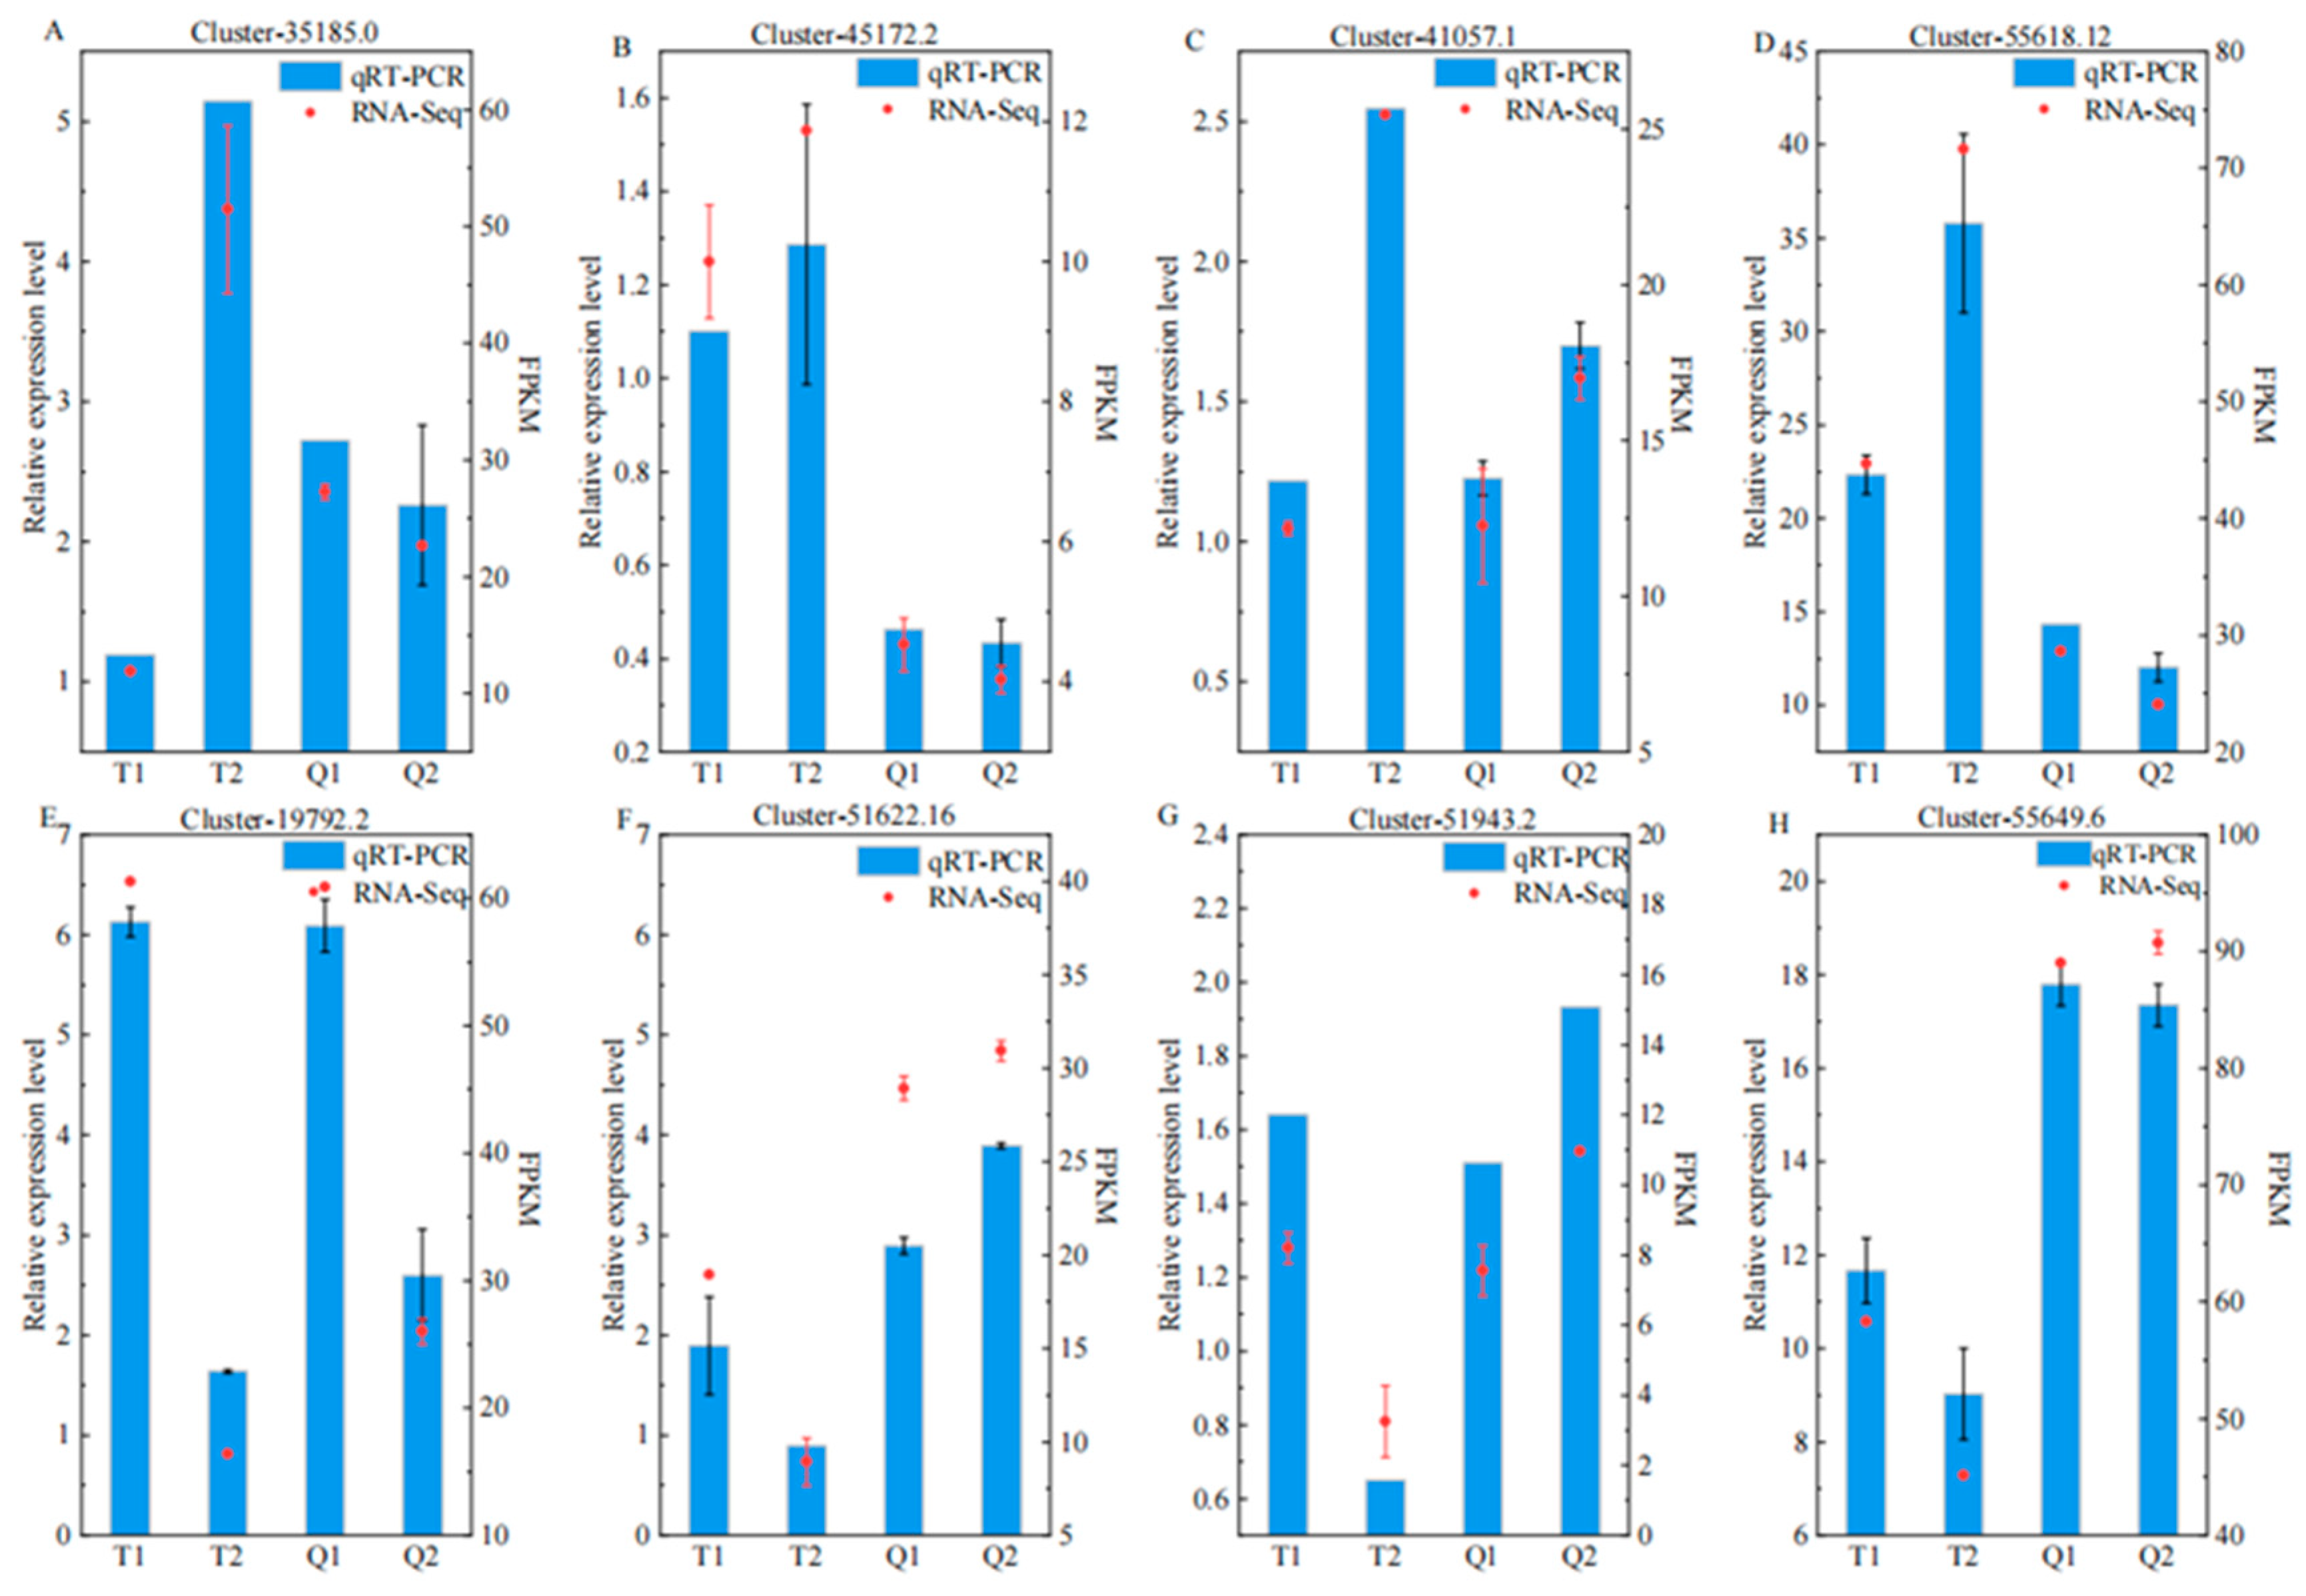
To validate the reliability of the RNA-seq data, eight differentially expressed genes were randomly selected, and their expression levels were analyzed by qRT-PCR. As shown in Figure 9, the expression patterns of four key genes in the starch-sucrose metabolic pathway were as follows: compared with the T1 treatment, their expressions were upregulated under the T2 treatment (Figure 9A,D). The expression patterns of three key genes in the phytohormone signal transduction pathway and Cluster-19792.2 were as follows: compared with the T1 treatment, their expressions were downregulated under the T2 treatment (Figure 9E,H). Although there were numerical differences between the qRT-PCR expression levels and the transcriptional FPKM values of the eight genes, the overall trends were consistent, indicating that the transcriptome data were accurate and reliable.

4. Discussion

The wrinkled-seed trait is closely associated with environmental factors, encompassing multiple aspects including temperature, climate, soil conditions, moisture levels, and light stress. These environmental factors impact the physiological and metabolic processes of seeds, thus affecting the morphology and quality of seeds [43]. In this study, through cross-latitude synchronous experiments, it was found that during the seed-filling period, the daily maximum temperature at the Shenyang condition was, on average, 3.8 °C higher than that at the Jiamusi condition, and it was extremely significantly positively correlated with the number of wrinkled seeds per plant (Figure 2). This result is highly consistent with the findings of Girousse et al. [44] in their study on wheat, where endosperm cell division was significantly inhibited above 29 °C and grain weight decreased linearly with increasing temperature. This indicates that the temperature fluctuations in natural fields are sufficient to trigger poor seed development or even abortion. From an ecological perspective, this finding confirms that seed-filling disorders are not merely inherent traits of the genotype but rather the result of the interaction between “heat-sensitive genotypes” and “ high temperatures”. The impact of high temperature on the plumpness of soybean seeds is often attributed to “insufficient carbohydrate supply.” However, in this study, in the Shenyang ecological condition with a slightly higher temperature, a reverse phenotype of “sucrose enrichment-starch deficiency” was discovered: the starch content in the seeds of Heihe 43 decreased, while the sucrose content increased. Additionally, the SPS activity decreased, and the activities of α-/β-amylase and invertase increased significantly. Based on previous research, three common understandings can be reached: (1), the enzymes at the starch-synthesis end (phosphorylase, branching enzyme) are sensitive to high temperatures. However, the decrease in their activity alone is insufficient to explain the sucrose accumulation. The key reason lies in the increase in the activity of α-amylase, which disrupts the “synthesis-degradation” balance, resulting in net starch hydrolysis. This is the direct driving force for seed wrinkling [45]; (2), the increase in invertase activity promotes the hydrolysis of sucrose, provides additional substrates for α-amylase, and may amplify starch degradation through positive feedback of sugar signals, there-by forming a vicious cycle of “sugar accumulation-enzyme activation” rather than the conventionally believed “sucrose shortage” [46]; (3), independent studies on peanut shrunken mutants and soybean male sterile lines have both confirmed that an increase in the activity of α-amylase might be one of the main causes of seed wrinkling [5,47]. In summary, the “wrinkle” of seeds in high-temperature regions is not due to limited sucrose supply at the source end, but rather to the active hydrolysis of starch storage at the sink end. Targeted inhibition of α-amylase or enhancement of its thermostatic stability is expected to become a common strategy for alleviating high-temperature-induced grain abortion and increasing grain weight.
To explore the molecular mechanism underlying seed wrinkling, we performed transcriptome and metabolome analyses of soybeans during the seed-filling stage in the two regions. The results indicated that the quantity of differentially expressed genes (DEGs) between the readily wrinkled-seed cultivar and the less-readily wrinkled-seed cultivar increased substantially. KEGG pathway enrichment analysis indicated that a substantial number of these differentially expressed genes (DEGs) were enriched in pathways including starch and sucrose metabolism, as well as plant hormone signal transduction. KEGG pathway enrichment analysis indicated that a substantial number of these differentially expressed genes (DEGs) were enriched in pathways including starch and sucrose metabolism, as well as plant hormone signal transduction. Alterations in the activity of these enzymes directly impact the synthesis and accumulation of starch. This, in turn, affects the morphology, structure, and development of seeds, potentially culminating in seed wrinkling. In peas, wrinkled-seed phenotypes are associated with anomalies in the gene encoding starch-branching enzyme. A segment of DNA sequence is inserted into this gene, leading to the expression of an abnormal or inactive starch-branching enzyme by the gene. This impedes the synthesis of amylopectin, ultimately resulting in seed wrinkling [7]. In rice, mutations in starch-synthesis genes can cause abnormal endosperm development, including floury, white-core, or chalky endosperm phenotypes. These anomalies might induce alterations in starch content, consequently influencing the morphology and structure of seeds [48]. In wheat grains, the expression of starch-synthase genes exhibits a positive correlation with starch-synthase activity and starch accumulation. This indicates that these enzymes jointly contribute to the synthesis of grain starch [49]. The transcript-metabolic characteristics of “premature starch hydrolysis, up-regulated sucrose metabolism, and down-regulated phytohormone signaling” observed under the high-temperature conditions in Shenyang in this study are highly consistent with recent omics research on grains under high-temperature stress. Zhao et al. [50] conducted a transcriptome analysis of rice grains treated with high temperature and found that the expression levels of isoamylase ISA3, α-amylase AMY3, and glycogen phosphorylase PYGL increased significantly, accompanied by an 18% decrease in amylose content. Similarly, the metabolome results of Chen et al. [51] showed that high temperature increased the levels of sucrose and glucose in grains by 25–40%, while the contents of cytokinin and auxin decreased by more than 30%, directly inhibiting endosperm cell division. These changes in the same direction once again demonstrate that temperature is the main influencing factor determining the grain storage pattern.
Plant hormones, such as auxins, cytokinins, and gibberellins, play a complex role in relation to seed wrinkling, entailing interactions and a balance among multiple hormones. Plant hormones indirectly influence seed morphology, including the incidence of wrinkling, by regulating seed growth and development. In peanut studies, it was discovered that the maximum content of endogenous auxin (IAA) in the seed-wrinkling mutant line 05D677 was significantly higher than that in normal varieties (lines) [52]. Auxin Response Factor (ARF) and Gretchen Hagen 3 (GH3) function downstream within the IAA signaling pathway and play a role in plant growth [53]. Prior research has demonstrated that auxin predominantly regulates seed size via auxin-response factors (ARFs) [54]. Furthermore, GH3 is regulated by ARF and participates in tissue or organ development within leguminous plants [55,56]. Under the T2 treatment, the expression levels of 11 ARFs (auxin-response factors) and 4 GH3s (Gretchen Hagen 3 genes) were down-regulated. Prior research has demonstrated that during the mid-to-late stages of peanut pod expansion, the levels of cytokinins (Z + ZR), gibberellins (GA), and abscisic acid (ABA) are highly significantly positively correlated with the dry-matter accumulation rates of pods and kernels (PKW and KKW), whereas auxin (IAA) shows a highly significant negative correlation. This suggests that ABA exerts a positive regulatory function in the development and ripening of crop grains. It is capable of facilitating the transfer of carbohydrates to grains, governing grain maturation, and expediting grain filling. Variations in ABA content assume a “switch-like” role in grain filling. Adequately increasing the ABA content and the ABA/GA ratio within grains during the early phase of filling can enhance grain filling [57,58]. In this research, in comparison to the T1 treatment, the expression of ten ABA-associated genes was down-regulated under the T2 treatment. Gibberellins participate in diverse aspects of plant growth and development. They are capable of facilitating cell elongation and division, thus influencing the size and weight of grains [59]. Proteins encoded by DELLA genes serve as crucial negative regulatory elements within the gibberellin signal-transduction pathway [60]. Under the T2 treatment, the expression of DELLA genes is up-regulated. This up-regulation leads to an enhanced accumulation of DELLA proteins, potentially causing a reduction in gibberellin levels. Gibberellins might exert a positive influence on grain plumpness. Conversely, an inadequate gibberellin content could result in grain wrinkling [61]. Cytokinins assume a crucial role in the processes of cell division and expansion. A reduction in their content directly influences cell growth and development. This leads to a decrease in cell volume and hardening of the cell wall, which subsequently affects grain size and shape [62]. In this research, when compared to the T1 treatment, the expression of four cytokinin-associated genes (CKs) was down-regulated under the T2 treatment. As a cytokinin receptor, the down-regulated expression of CRE1 might attenuate the perception and transmission of cytokinin signals. B-ARR serves as a positive regulatory element within the cytokinin signal-transduction pathway. A decrease in its expression might impede the amplification of cytokinin signal transduction. Consequently, cytokinins might exert a positive influence on grain plumpness. Conversely, an inadequate cytokinin content could result in seed wrinkling.
Furthermore, sugar signal transduction and endogenous hormone signal transduction assume crucial roles in plant development and response to high temperatures [63,64]. Alterations in these signals might impact sugar metabolism and endogenous hormone signal transduction within grains during the grain-filling phase of crops, ultimately resulting in seed wrinkling. In conclusion, seed wrinkling represents a complex phenomenon. It is not merely related to the internal genetic and biochemical mechanisms within seeds but is also intricately associated with external environmental conditions. Variations in environmental factors, including temperature conditions, might impact sugar metabolism and hormone signal transduction within crops during crucial growth phases. Consequently, this influences the ultimate morphology and quality of seeds [65,66,67]. The Sixth Assessment Report of the IPCC states that under the scenario of a 1.5 °C global temperature increase, the number of days with extreme high temperatures (≥35 °C) during the seed-filling stage in the major soybean-producing areas of Northeast Asia will increase from the current 7 days to more than 15 days, directly threatening yield stability [68]. Therefore, the threat of high temperatures to soybean yield and breeding has become one of the core challenges under climate change. In the future, there is an urgent need to integrate the candidate genes and metabolic pathways revealed in this study and accelerate the cultivation of new soybean varieties with climate resilience through molecular marker-assisted selection or gene-editing methods.

5. Conclusions

In this study, a comprehensive analysis was conducted on the physiological and biochemical measurements of seeds, the correlation analysis between meteorological factors throughout the entire growth period and seed-wrinkling traits, as well as the transcriptomics and metabolomics of the wrinkle-prone cultivar Heihe 43 and the wrinkle-resistant cultivar Henong 76, which were planted in Jiamusi and Shenyang. The results indicated that there was a highly significant positive correlation between the daily maximum temperature and the number of wrinkled seeds per plant, and this correlation was most significant during the seed-filling period. There were significant differences in the contents of soluble sugars and starch, as well as in the activities of sucrose synthase and invertase, in the seeds of Henong 76 and Heihe 43 grown in Shenyang. However, such differences were not significant for the same cultivars grown in Jiamusi. In Heihe 43, it was observed that genes associated with controlling starch hydrolysis (isoamylase, α-amylase, and glycogen phosphorylase) and sucrose synthesis and decomposition (sucrose synthase, invertase, glucose-6-phosphate isomerase, and phosphoglucomutase) were upregulated when the cultivar was planted in Shenyang. This upregulation could lead to the premature or excessive hydrolysis of starch in the seeds, reducing starch accumulation. Genes regulating plant hormone signal transduction (auxin, gibberellin, abscisic acid, and cytokinin) were generally downregulated. This downregulation could inhibit the development of endosperm and the accumulation of storage substances. These two factors act synergistically, resulting in the occurrence of seed-filling disorders. Therefore, it is speculated that for the soybean cultivar Heihe 43 planted in Shenyang, exposure to high temperatures during the seed-filling period might lead to insufficient sugar accumulation in the seeds, consequently causing the seeds to wrinkle.

Supplementary Materials

The following supporting information can be downloaded at: https://www.mdpi.com/article/10.3390/agronomy15102266/s1, Figure S1: GO enrichment analysis of DEGs in different comparison groups; Table S1: The meteorological data on temperature and precipitation at the experimental sites; Table S2: The primer sequences used in the PCR; Table S3: KEGG pathway enrichment in four comparison groups; Table S4: Overlapping differential gene enrichment analysis; Table S5: Total GO enrichment analysis of four comparison groups; Table S6: Metabolic gene details information.

Author Contributions

Conceptualization, H.Z., H.W. and X.A.; methodology, F.X., X.Y. and J.H.; software, J.H. and Z.L.; investigation, J.H., Z.Z., J.L. and W.Z.; resources, W.Z.; data curation, J.H., Z.L., Z.Z. and J.L.; formal analysis, H.Z., H.W. and X.A.; writing—original draft preparation, J.H.; writing—review and editing, F.X., X.Y. and J.H.; funding acquisition, F.X. and X.Y. All authors have read and agreed to the published version of the manuscript.

Funding

This research was funded by the National Key Research and Development Plan of the Ministry of Science and Technology (2021YFD1201102).

Data Availability Statement

The RNA-Seq data have been submitted to the NCBI Sequence Read Archive (BioProject PRJNA1199776).

Acknowledgments

During the preparation of this manuscript, the authors used OpenAI’s ChatGPT (GPT-4 Turbo) for the purposes of grammatical polishing. The authors have reviewed and edited the output and take full responsibility for the content of this publication.

Conflicts of Interest

The authors declare no conflicts of interest.

References

  1. Kumar, V.; Singh, T.R.; Hada, A.; Jolly, M.; Ganapathi, A.; Sachdev, A. Probing phosphorus efficient low phytic acid content soybean genotypes with phosphorus starvation in hydroponics growth system. Appl. Biochem. Biotechnol. 2015, 177, 689–699. [Google Scholar] [CrossRef] [PubMed]
  2. Luan, J.; Zhang, B.; Hu, Y. Development Trend, Policy Evolution and Trend Prospect of China’s Soybean Industry. Agric. Outlook 2022, 18, 35–41. [Google Scholar]
  3. Peng, Y.; Hu, S. Research on Seed Wrinkling of Northern Soybean Germplasm after Introduction to the South. Soybean Sci. 1997, 16, 343–347. [Google Scholar]
  4. Du, Y.; Pan, T.; Tian, Y.; Liu, S.; Liu, X.; Jiang, L.; Zhang, W.; Wang, Y.; Wan, J. Phenotypic Analysis and Gene Cloning of Rice Floury Endosperm Mutant fse4. Chin. J. Rice Sci. 2019, 33, 499–512. [Google Scholar]
  5. Cui, G. Research on Formation Mechanism and Genetic Analysis of Wrinkled Seed of Mutant in Peanut (Arachis hypogaea L.). Master’s Thesis, Shandong Agricultural University, Taian, China, 2010. [Google Scholar]
  6. Zhang, X. Study on the Grain of Wheat. Acta Agron. Sin. 1982, 2, 87–93. [Google Scholar]
  7. Bhattacharyya, M.K.; Smith, A.M.; Elis, T.H. The wrinkled-seed character of pea described by Mendel is caused by a transposon-like insertion in a gene encoding starch branching enzyme. Cell 1990, 60, 115. [Google Scholar] [CrossRef] [PubMed]
  8. Bhattacharyya, M.; Martin, C.; Smith, A. The importance of starch biosynthesis in the wrinkled seed shape character of peas studied by Mendel. Plant Mol. Biol. 1993, 22, 525–531. [Google Scholar] [CrossRef]
  9. Chen, W.; Chen, Z.; Song, W.; Dai, J.; Lai, J. Molecular Mapping and Candidate Genes Prediction of Maize Endosperm Mutant Wrk1. J. Maize Sci. 2013, 21, 27–31. [Google Scholar]
  10. Chen, H.; Zhu, D.; Lin, X.; Zhang, Y. Effects of seed plumpness on germinating rate, seedling rate and growth of hybrid rice. Fujian J. Agric. Sci. 2004, 19, 65–67. [Google Scholar]
  11. Sun, X.; Gu, J.; Liu, Q.; Hu, A. Effect of seed fullness and water content on germination of rice seeds. Jiangsu Agric. Sci. 2014, 42, 96–97. [Google Scholar]
  12. Zhao, X.; Peng, B.; Zhang, J.; Yan, H.; Zhang, C.; Zhao, L. Influence of Out-crossing Rate on Seed Quality in Sterile Soybean Lines and Regulating Ways. Soybean Sci. 2017, 36, 487–493. [Google Scholar]
  13. Li, Z.; Wang, Z.; Yang, T. Studies of Shriveled Seeds of Maie-Sterile Lines and their Hybrids with T. timopheevi Cytoplasm in Wheat. J. Northwest AF Univ. 1987, 2, 1–9. [Google Scholar]
  14. Liu, Z.; Rao, S.; Pu, Z. Effects of nuclear and cytoplasmic factors on seed quality of hybrid wheat with T. timopheevi cytoplasm. Southwest China J. Agric. Sci. 1999, 12, 26–31. [Google Scholar]
  15. Fan, L.; Yan, Q.; Xu, Y.; Ruan, S. Studies on seed treatments for improving field seedling emergence of sh2sweet corn (Zea mays L). J. Zhejiang Univ. 1997, 23, 100–104. [Google Scholar]
  16. Cernac, A.; Benning, C. WRINKLED 1 encodes an AP2/EREB domain protein involved in the control of storage compound biosynthesis in Arabidopsis. Plant J. 2004, 40, 575–585. [Google Scholar] [CrossRef]
  17. Focks, N.; Benning, C. A Novel, Low-Seed-Oil Mutant of Arabidopsis with a Deficiency in the seed-specific regulation of carbohydrate metabolism. Plant Physiol. 1998, 118, 91–101. [Google Scholar]
  18. Hedley, C.L.; Smith, C.M.; Ambrose, M.J. An analysis of seed development in Pisum sativum II. The effect of the r-Locus on the growth and development of the seed. Ann. Bot. 1986, 58, 371–379. [Google Scholar] [CrossRef]
  19. Li, X. Difference of Gene Expression Profiling in the Endosperm of ae/wx and sh1 Mutants and Starch Biosynthesis in Maize. Ph.D. Thesis, Shandong Agricultural University, Taian, China, 2008. [Google Scholar]
  20. Yano, M.; Isono, Y.; Satoh, H. Gene analysis of sugary and shrunken mutants of rice, Oryze sativa L. Jpn. J. Breed. 1984, 34, 43–49. [Google Scholar] [CrossRef]
  21. Wang, T.; Hedley, C.L. Seed development in peas: Knowing your three “r” s (or four, or five). Seed Sci. Res. 1991, 1, 3–14. [Google Scholar] [CrossRef]
  22. Jiang, S.; An, H.; Luo, J. Comparative Analysis of Transcriptomes to Identify Genes Associated with Fruit Size in the Early Stage of Fruit Development in Pyrus pyrifolia. Int. J. Mol. Sci. 2018, 19, 2342. [Google Scholar] [CrossRef]
  23. Guan, H.Y.; Dong, R.; Liu, T.S.; He, C.M.; Wang, J.; Liu, Q.; Xu, Q.; Zhang, M.L.; Wang, L.M. Preliminary Mapping of Molecular in Maize Kernel Shrunken Mutant sh2019. Shandong Agric. Sci. 2024, 56, 8–13. [Google Scholar]
  24. Sun, Z.L. Functional Study of the ZmBT1 Gene Affecting the Shrunken Phenotype of Maize Kernels. Master’s Thesis, Jilin Agricultural University, Changchun, China, 2024. [Google Scholar]
  25. Rossini, M.A.; Curin, F.; Otegui, M.E. Ear reproductive development components associated with kernel set in maize: Breeding effects under contrasting environments. Field Crops Res. 2023, 304, 109150. [Google Scholar] [CrossRef]
  26. Han, T.F.; Jiang, B.J. Identification of GmLUX2 paves the way for north-to-south adaption of soybeans. Sci. Sin. Vitae 2021, 51, 472–475. [Google Scholar] [CrossRef]
  27. Luan, R.W. Effects of Heat Stress on Grain Development and Yield Formation of Setaria italica and Regulation of Exogenous Substances. Master’s Thesis, Shandong Agricultural University, Taian, China, 2024. [Google Scholar]
  28. Dwivedi, S.K.; Basu, S.; Kumar, S.; Kumar, G.; Prakash, V.; Kumar, S.; Mishra, J.S.; Bhatt, B.P.; Malviya, N.; Singh, G.P.; et al. Heat stress induced impairment of starch mobilisation regulates pollen viability and grain yield in wheat: Study in Eastern Indo-Gangetic Plains. Field Crops Res. 2017, 206, 106–114. [Google Scholar] [CrossRef]
  29. Wang, H.Q.; Liu, P.; Zhang, J.W.; Zhao, B.; Ren, B.Z. Endogenous Hormones Inhibit Differentiation of Young Ears in Maize (Zea mays L.) Under Heat Stress. Front. Plant Sci. 2020, 11, 533046. [Google Scholar] [CrossRef]
  30. Mahajan, G.; Wenham, K.; Chauhan, B.S. Mungbean (Vigna radiata) Growth and Yield Response in Relation to Water Stress and Elevated Day/Night Temperature Conditions. Agronomy 2023, 13, 2546. [Google Scholar] [CrossRef]
  31. Zhuang, T.X.; Zhao, B.; Syed Tahir, A.U.K.; Gilles, L.; Liu, X.J.; Tian, Y.C.; Zhu, Y.; Cao, W.X.; Cao, Q. Exploring the allometry between ear saturated water accumulation and dry mass for diagnosing winter wheat water status during the reproductive growth. Agric. Water Manag. 2025, 309, 109364. [Google Scholar] [CrossRef]
  32. Singer, W.M.; Lee, Y.C.; Shea, Z.; Vieira, C.C.; Lee, D.; Li, X.; Cunicelli, M.; Kadam, S.S.; Khan, M.A.W.; Shannon, G.; et al. Soybean genetics, genomics, and breeding for improving nutritional value and reducing antinutritional traits in food and feed. Plant Genome 2023, 16, e20415. [Google Scholar] [CrossRef]
  33. Zhu, L.; Liao, Y.; Lin, K.; Wu, W.; Duan, L.; Wang, P. Cytokinin promotes anthocyanin biosynthesis via regulating sugar accumulation and MYB113 expression in Eucalyptus. Tree Physiol. 2024, 44, 154. [Google Scholar] [CrossRef]
  34. Feng, W.; Xue, W.; Zhao, Z.; Shi, Z.; Wang, W.; Bai, Y.; Wang, H.; Qiu, P.; Xue, J.; Chen, B. Nitrogen fertilizer application rate affects the dynamic metabolism of nitrogen and carbohydrates in kernels of waxy maize. Front. Plant Sci. 2024, 15, 1416397. [Google Scholar] [CrossRef]
  35. Li, Y.; Hu, W.; Zou, J.; He, J.; Zhu, H.; Zhao, W.; Wang, Y.; Chen, B.; Meng, Y.; Wang, S.; et al. Effects of soil drought on cottonseed kernel carbohydrate metabolism and kernel biomass accumulation. Plant Physiol. Biochem. 2023, 195, 170–181. [Google Scholar] [CrossRef]
  36. Liu, H.; Si, X.; Wang, Z.; Cao, L.; Gao, L.; Zhou, X.; Wang, W.; Wang, K.; Jiao, C.; Zhuang, L.; et al. TaTPP-7A positively feedback regulates grain filling and wheat grain yield through T6P-SnRK1 signalling pathway and sugar-ABA interaction. Plant Biotechnol. J. 2023, 21, 1159–1175. [Google Scholar]
  37. Feng, Y.L.; Yin, F.; Xu, K.; Jia, X.Z.; Zhou, S.; Ma, C. Role of Sucrose Metabolism and Signal Transduction in Plant Development and Stress Response. J. Nucl. Agric. Sci. 2021, 35, 2044–2055. [Google Scholar]
  38. Lan, G.Q.; Wu, M.Z.; Zhang, Q.H.; Yuan, B.; Shi, G.X.; Zhu, N.; Zheng, Y.B.Y.; Cao, Q.; Qiao, Q.; Zhang, T.C. Tanscriptomic and Physiological Analyses for the Role of Hormones and Sugar in Axillary Bud Development of Wild Strawberry Stolon. Plants 2024, 13, 2241. [Google Scholar]
  39. Liu, J.; Ma, Y.; Lv, F.; Chen, J.; Zhou, Z.; Wang, Y. Changes of sucrose metabolism in leaf subtending to cotton boll under cool temperature due to late planting. Field Crops Res. 2013, 144, 200–211. [Google Scholar]
  40. Yang, H.; Gu, X.; Ding, M.; Lu, W.; Lu, D. Heat stress during grain filling affects activities of enzymes involved in grain protein and starch synthesis in waxy maize. Sci. Rep. 2018, 8, 15665. [Google Scholar] [CrossRef]
  41. Hu, W.; Loka, D.A.; Fitzsimons, T.R.; Zhou, Z.; Oosterhuis, D.M. Potassium deficiency limits reproductive success by altering carbohydrate and protein balances in cotton (Gossypium hirsutum L.). Environ. Exp. Bot. 2018, 145, 87–94. [Google Scholar] [CrossRef]
  42. Li, X.; Jiang, H.; Liu, F.; Cai, J.; Dai, T. Induction of chilling tolerance in wheat during germination by pre-soaking seed with nitric oxide and gibberellin. Plant Growth Regul. 2013, 71, 31–40. [Google Scholar] [CrossRef]
  43. Sloat, L.L.; Davis, S.J.; Gerber, J.S.; Moore, F.C.; Ray, D.K.; West, P.C.; Mueller, N.D. Climate adaptation by crop migration. Nat. Commun. 2020, 11, 1243. [Google Scholar] [CrossRef] [PubMed]
  44. Girousse, C.; Inchboard, L.; Deswarte, J.C.; Chenu, K. How does post-flowering heat impact grain growth and its deter-mining processes in wheat? J. Exp. Bot. 2021, 72, 6596–6610. [Google Scholar]
  45. Yu, J.; Du, T.; Zhang, P.; Ma, Z.; Chen, X.; Cao, J.; Li, H.; Li, T.; Zhu, Y.; Xu, F. Impacts of High Temperatures on the Growth and Development of Rice and Measuresfor Heat Tolerance Regulation: A Review. Agronomy 2024, 14, 2811. [Google Scholar]
  46. Li, C.Y.; Fu, K.Y.; Zhang, R.Q.; Xu, F.F.; Zhu, X.Y.; Zhu, Y.Q.; Qin, A.X.; Li, C. Effect of High Temperature Post Anthesis on the Development of Starch Granules in Winter Wheat. J. Triticeae Crops 2015, 35, 1395–1402. [Google Scholar]
  47. Wu, Y.L.; Yu, Z.Y.; Lei, F.Y. Effects of Agronomic and Physiological Characters of Soybean Sterile Lines on the Percentage of Wrinkled Kernels per Plant. J. Inn. Mong. Minzu Univ. 2023, 38, 423–427. [Google Scholar]
  48. Liu, Z.; Jiang, S.; Jiang, L.; Li, W.; Tang, Y.; He, W.; Wang, M.; Xing, J.; Cui, Y.; Lin, Q.; et al. Transcription factor OsSGL is a regulator of starch synthesis and grain quality in rice. J. Exp. Bot. 2022, 73, 3417–3430. [Google Scholar] [CrossRef]
  49. Mega, R.; Kim, J.S.; Tanaka, H.; Ishii, T.; Abe, F.; Okamoto, M. Metabolic and transcriptomic profiling during wheat seed development under progressive drought conditions. Sci. Rep. 2023, 13, 15001. [Google Scholar] [CrossRef]
  50. Zhao, S.; Cao, R.; Sun, L.; Zhuang, D.; Zhong, M.; Zhao, F.; Jiao, G.; Chen, P.; Li, X.; Duan, Y.; et al. An Integrative Analysis of the Transcriptome and Proteome of Rice Grain Chalkiness Formation Under High Temperature. Plants 2024, 13, 3309. [Google Scholar] [CrossRef]
  51. Chen, Y.H.; Wang, Y.L.; Chen, H.Z.; Xiang, J.; Zhang, Y.K.; Wang, Z.G.; Zhu, D.F.; Zhang, Y.P. Brassinosteroids Mediate Endogenous Phytohormone Metabolism to Alleviate High Temperature Injury at Panicle Initiation Stage in Rice. Rice Sci. 2023, 30, 70–86. [Google Scholar] [CrossRef]
  52. Luo, B.; Liu, F.; Wan, Y.; Zhang, K.; Zhao, W. Dynamic Changes of Endogenous Hormones Content and Dry Matter Accumulation of Pods and Kernels in Different Varieties (Lines) of Peanut (Arachis hypogaea L.). Acta Agron. Sin. 2013, 39, 2083–2093. [Google Scholar] [CrossRef]
  53. Xing, M.; Su, H.; Liu, X.; Yang, L.; Zhang, Y.; Wang, Y.; Fang, Z.; Lv, H. Morphological, transcriptomics and phytohormone analysis shed light on the development of a novel dwarf mutant of cabbage (Brassica oleracea). Plant Sci. 2020, 290, 110283. [Google Scholar] [CrossRef]
  54. Chandler, W.J. Auxin response factors. Plant Cell Environ. 2016, 39, 1014–1028. [Google Scholar] [CrossRef] [PubMed]
  55. Sorin, C.; Bussell, J.D.; Camus, I.; Ljung, K.; Kowalczyk, M.; Geiss, G. Auxin and Light Control of Adventitious Rooting in Arabidopsis Require ARGO NAUTE1. Plant Cell 2005, 17, 1343–1359. [Google Scholar] [CrossRef] [PubMed]
  56. Singh, V.K.; Jain, M.; Garg, R. Genome-wide analysis and expression profiling suggest diverse roles of GH3 genes during development and abiotic stress responses in legumes. Front. Plant Sci. 2015, 5, 789. [Google Scholar] [CrossRef] [PubMed]
  57. Li, Y.B.; Cui, D.Z.; Huang, C.; Sui, X.X.; Fan, Q.Q.; Chu, X.S. Dynamic Changes of Cell Morphology and Endogenous Hormones during Grain Development of New Wheat Variety Jimai 70. Shandong Agric. Sci. 2021, 5, 117–121. [Google Scholar]
  58. Yang, T.; Wang, H.; Guo, L.; Wu, X.; Xiao, Q.; Wang, J.; Wang, Q.; Ma, G.; Wang, W.; Wu, Y. ABA-induced phosphorylation of basic leucine zipper 29, Abscisic Acid Insensitive 19, and Opaque2 by SnRK2.2 enhances gene transactivation for endosperm filling in maize. Plant Cell 2022, 34, 1933–1956. [Google Scholar] [CrossRef]
  59. Sarma, B.; Kashtoh, H.; Lama, T.T.; Bhattacharyya, P.N.; Mohanta, Y.K.; Baek, K.H. Abiotic Stress in Rice: Visiting the Physiological Response and Its Tolerance Mechanisms. Plants 2023, 12, 3948. [Google Scholar] [CrossRef]
  60. Gilroy, E.; Breen, S. Interplay between phytohormone signalling pathways in plant defence-other than salicylic acid and jasmonic acid. Essays Biochem. 2022, 66, 657–671. [Google Scholar]
  61. Liu, Y.; Xiao, W.H.; Cai, W.L.; Zhang, W.Y.; Wang, Z.Q.; Xu, Y.J. Advances in Studies on the Roles of Plant Hormones in Grain Filling, Grain Weight and Quality of Rice. China Rice 2023, 29, 9–14. [Google Scholar]
  62. Wu, C.; Tang, S.; Li, G.; Wang, S.; Fahad, S.; Ding, Y. Roles of phytohormone changes in the grain yield of rice plants exposed to heat: A review. PeerJ 2019, 7, e7792. [Google Scholar] [CrossRef]
  63. Cao, T.X.; Wang, S.L.; Asjad, A.L.; Shan, N.; Sun, J.Y.; Chen, X.; Wang, P.T.; Zhu, Q.L.; Xiao, Y.; Luo, S.; et al. Transcriptome and metabolome analysis reveals the potential mechanism of tuber dynamic development in yam (Dioscorea polystachya Turcz.). LWT 2023, 181, 114764. [Google Scholar] [CrossRef]
  64. Wang, J.; Luo, Q.; Liang, X.; Liu, H.; Wu, C.; Fang, H.; Zhang, X.; Ding, S.; Yu, J.; Shi, K. Glucose-G protein signaling plays a crucial role in tomato resilience to high temperature and elevated CO2. Plant Physiol. 2024, 195, 1025–1037. [Google Scholar] [CrossRef] [PubMed]
  65. Sharma, A.; Samtani, H.; Sahu, K.; Sharma, A.K.; Khurana, J.P.; Khurana, P. Functions of Phytochrome-Interacting Factors (PIFs) in the regulation of plant growth and development: A comprehensive review. Int. J. Biol. Macromol. 2023, 244, 125234. [Google Scholar] [CrossRef] [PubMed]
  66. Iqbal, A.; Bao, H.; Wang, J.; Liu, H.; Liu, J.; Huang, L.; Li, D. Role of jasmonates in plant response to temperature stress. Plant Sci. 2025, 355, 112477. [Google Scholar] [CrossRef] [PubMed]
  67. Li, R.; Cai, Z.; Huang, X.; Liao, J.; Huang, L.; Liu, D.; Zhao, Z.; Chen, Y.; Lu, C. Carbohydrate and hormone regulatory networks driving dormancy release of Cardiocrinum giganteum (Wall.) Makino bulbs induced by low temperature. Physiol. Plant. 2025, 177, e70108. [Google Scholar] [CrossRef] [PubMed]
  68. IPCC. Climate Change 2021: The Physical Science Basis; Cambridge University Press: Cambridge, UK, 2021. [Google Scholar]
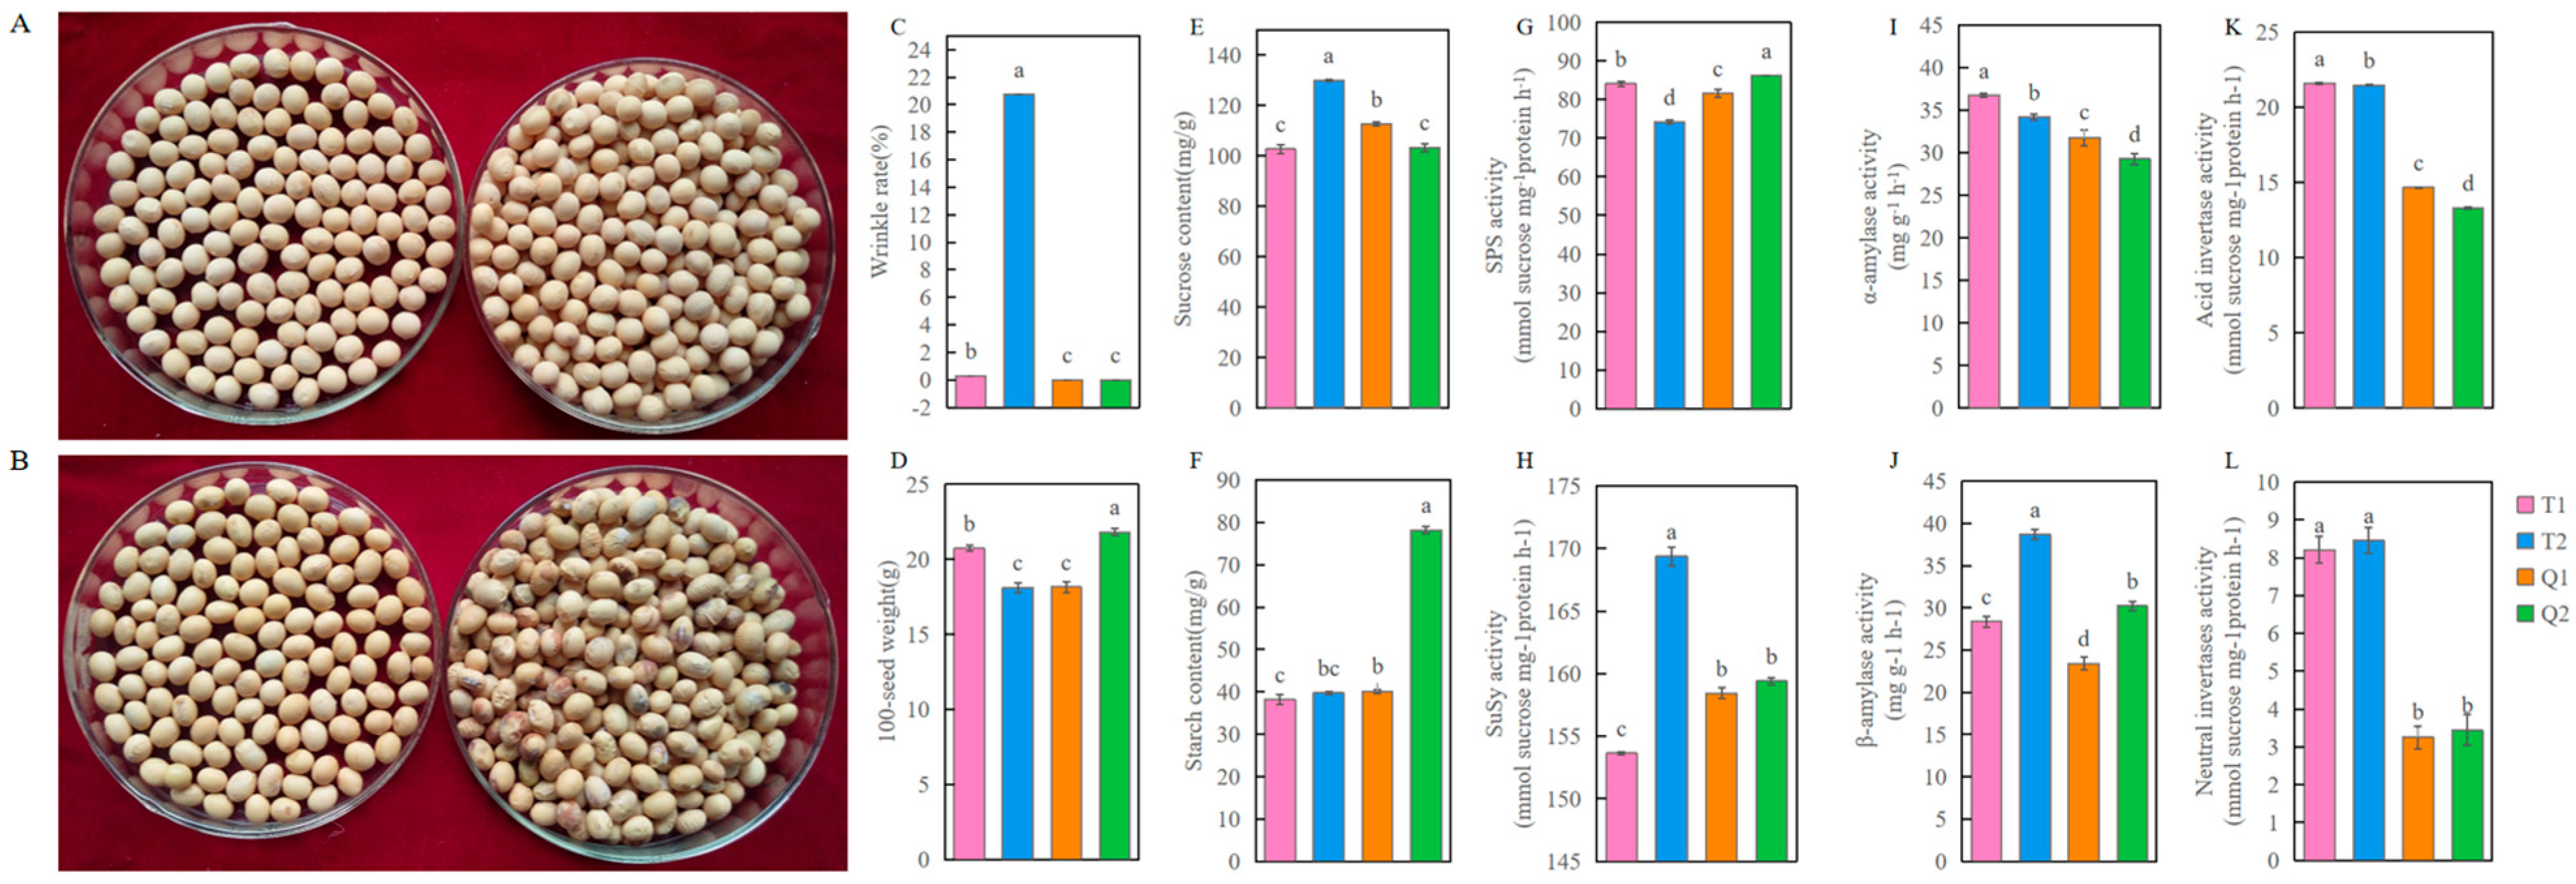
Figure 1. Physiological parameters of different treatments. (A) Non-wrinkle grain cultivar Henong 76 (left: Jiamusi, right: Shenyang). (B) Wrinkle grain cultivar Heihe 43 (left: Jiamusi, right: Shenyang). (C) Wrinkle rate per plant. (D) 100-grain weight. (E) Sucrose content. (F) Starch content. (G) Sucrose phosphate synthase activity. (H) Sucrose synthase activity. (I) α-amylase activity. (J) β-amylase activity. (K) Acid invertase activity. (L) Neutral invertase activity. T1: Henong 76 planted in Shenyang. T2: Heihe 43 planted in Shenyang. Q1: Henong 76 planted in Jiamusi. Q2: Heihe 43 planted in Jiamusi (the same below). Identical 90-mm Petri dishes were used; 150–200 representative seeds per dish are shown for phenotype display only, not for yield comparison. Data are the mean of three replicates; different letters represent statistically significant differences within one column (p < 0.05).
Agronomy 15 02266 g001
Figure 2. Correlation coefficients between number of wrinkles per plant and meteorological factors. X1: daily mean temperature, X2: daily maximum temperature, X3: daily minimum temperature, X4: daily diurnal temperature difference, X5: relative air humidity, X6: soil temperature, X7: ≥ 10 °C effective cumulative temperature, X8: daily precipitation, X9: hours of sunshine, X10: average wind speed, The bands representing significant positive correlations are red, those representing significant negative correlations are green. The stronger the correlation, the darker the color. Bands with non-significant correlations are gray. * p ≤ 0.05 **; p ≤ 0.01.
Agronomy 15 02266 g002
Figure 3. Summary of differentially expressed genes under different treatments. (A) PCA analysis. (B) Cluster heat map of differentially expressed genes. (C) DEGs in 4 treatments. (D) KEGG enrichment analysis of two species at three growth stages.
Agronomy 15 02266 g003
Figure 4. Summary of differential metabolites under different treatments. (A) PCA analysis. (B) classification of differentially accumulated metabolites (DAMs).
Agronomy 15 02266 g004
Figure 5. Enrichment analysis of the differential accumulation metabolites. (A) T2 vs. T1. (B) Q2 vs. Q1. (C) Q2 vs. T1. (D) T2 vs. Q1.
Agronomy 15 02266 g005
Figure 6. KEGG enrichment pathways of differentially expressed genes and differential metabolites in four comparison groups (each displaying the top 10).
Agronomy 15 02266 g006
Figure 7. Heatmap of annotated differentially expressed genes (red and blue) and differential metabolites (red and green) in starch and sucrose metabolic pathways. (A) Trehalose synthesis process. (B) Starch synthesis process. (C) Sucrose synthesis and hydrolysis process. (D) Starch hydrolysis process. (E) Cellulose hydrolysis process.
Agronomy 15 02266 g007
Figure 8. Heatmap of annotated differentially expressed genes (red and blue) and differentially expressed metabolites (red and green) in plant hormone signal transduction pathway. (A) Auxin. (B) Gibberellin. (C) Abscisic acid. (D) Cytokinin.
Agronomy 15 02266 g008
Figure 9. Transcriptional abundances of differentially expressed genes in soybean. (AE) Key genes in the starch-sucrose metabolic pathway; (FH) Key genes in the phytohormone signal transduction pathway. The blue bar graphs represent the expression levels of differentially expressed genes. The red dots denote the transcriptional FPKM values. The black vertical bars indicate the error bars of the expression levels of differentially expressed genes, while the red vertical bars represent the error bars of the transcriptional FPKM values.
Agronomy 15 02266 g009
Table 1. Two-way analysis of variance (ANOVA) for temperature traits at different growth stages.
Experimental Factors Sowing-Pod SettingGrain-Filling StageMature Stage
Average Daily Temperature (°C)Daily Maximum Temperature (°C)Average Daily Temperature (°C)Daily Maximum Temperature (°C)Average Daily Temperature (°C)Daily Maximum Temperature (°C)
LocationJiamusi19.35 b24.70 b20.66 b25.66 c15.61 b21.51 b
Shenyang22.25 a25.79 a25.71 a30.83 a21.82 a26.58 a
CultivarHenong 7620.7925.2323.1728.23 b18.7024.03
Heihe 4320.8225.2623.2029.19 b18.7324.04
Mean
squares
(ANO-VA)
Location (df = 1)23.52 ***12.54 ***8.92 ***24.3 ***117.34 ***67.11 ***
Cultivar (df = 1)nsnsns7.18 **nsns
Location × Cultivar (df = 1)nsnsns9.55 **nsns
MS error (df = 8)0.1040.2030.1120.2890.1480.198
Letters indicate statistical significance at 0.05 level within the same column. ns indicates p ≥ 0.05; ** indicates p < 0.01; *** indicates p < 0.001. The mean square error (MS error) is provided for readers to verify the F-values.
Disclaimer/Publisher’s Note: The statements, opinions and data contained in all publications are solely those of the individual author(s) and contributor(s) and not of MDPI and/or the editor(s). MDPI and/or the editor(s) disclaim responsibility for any injury to people or property resulting from any ideas, methods, instructions or products referred to in the content.