Article

Effects of Long-Term Nitrogen Fertilization on Nitrous Oxide Emission and Yield in Acidic Tea (Camellia sinensis L.) Plantation Soils

1
Tea Research Institute, Fujian Academy of Agricultural Sciences, Fuzhou 350013, China
2
Tea Research Institute, Chinese Academy of Agriculture Sciences, Key Laboratory of Biology, Genetics and Breeding of Special Economic Animals and Plants, Ministry of Agriculture and Rural Affairs, Hangzhou 310008, China
3
National Agricultural Experimental Station for Soil Quality, Fu’an 355015, China
*
Authors to whom correspondence should be addressed.
Agronomy 2025, 15(1), 7; https://doi.org/10.3390/agronomy15010007
Submission received: 1 December 2024 / Revised: 13 December 2024 / Accepted: 23 December 2024 / Published: 24 December 2024

Abstract

:
The responses of nitrous oxide (N2O) emissions to nitrogen (N) application in acidic, perennial agricultural systems, and the factors driving these emissions, remain poorly understood. To address this gap, a 12-year field experiment was conducted to investigate the effects of different N application rates (0, 112.5, 225, and 450 kg N ha−1 yr−1) on N2O emissions, tea yield, and the associated driving factors in a tea plantation. The study found that soil pH significantly decreased with long-term N application, dropping by 0.32 to 0.85 units. Annual tea yield increased significantly, by 148–243%. N application also elevated N2O emission fluxes by 33–277%, with notable seasonal fluctuations observed. N2O flux was positively correlated with N rates, water-filled pore space (WFPS), soil temperature (Tsoil), and inorganic N (NH4+-N and NO3-N), while showing a negative correlation with soil pH. Random forest (RF) modeling identified WFPS, N rates, and Tsoil as the most important variables influencing N2O flux. The cumulative N2O emissions for N112.5, N225, and N450 were 1584, 2791, and 45,046 g N ha−2, respectively, representing increases of 1.33, 2.34, and 3.77 times compared to N0. The N2O-N emission factors (EF) were 0.35%, 0.71%, and 0.74%, respectively, and increased with higher N rates. These findings highlight the importance of selecting appropriate fertilization timing and improving water and fertilizer management as key strategies for mitigating soil acidification, enhancing nitrogen use efficiency (NUE), and reducing N2O emissions in acidic tea-plantation systems. This study offers a theoretical foundation for developing rational N fertilizer management practices and strategies aimed at reducing N2O emissions in tea-plantation soils.

1. Introduction

In recent years, global climate change has become a major focus, especially the impact of global warming caused by increasing greenhouse gases (GHG). Identifying effective strategies to reduce human emissions of these gases has become a key research priority. N2O is a potent GHG, with an atmospheric lifespan of up to 131 years. It is approximately 298 times more effective at trapping heat than is carbon dioxide (CO₂), and nine times more effective than methane (CH₄) over the period of a century [1]. Agriculture, especially through its application of N fertilizers, is the largest source of N2O emissions, accounting for 59.4% of anthropogenic N2O emissions [1]. The tea plant (Camellia sinensis L.) is extensively cultivated in tropical and subtropical regions characterized by acidic soil conditions. China is the largest tea-producing country, with a planting area covering 3.165 million hectares [2]. As a leaf-harvested crop, tea plants require substantial amounts of N to achieve both yield and quality, particularly in amino acid formation. However, excessive N input not only reduces the N use efficiency of tea plants but also poses environmental risks such as N2O emissions [3]. Furthermore, there is a notable increase in N2O emissions due to the inhibition of N2O reductase activity under acidic conditions [4]. Additionally, tea plantations are characterized by periodic pruning, with all material left in situ after each pruning, which may significantly affect N2O emissions in the presence of N fertilizer. Therefore, it is essential to investigate the impact of N fertilizer application on N2O emissions and identify the key influencing factors in acidic perennial tea-plantation soils.
Evidence indicates that N2O emissions from agricultural soils are primarily driven by synthetic N fertilizers and manure, and are expected to increase by about 50% from 2000 to 2050 [5,6]. Tea-plantation soils, which often receive high N supply, are more prone to acidification and become significant sources of N2O. Tea plantations are characterized by higher N application compared to cereal-cropping systems, with an average of 553 kg N ha−1yr−1 [7,8]. Studies have shown that a high N input rate can directly enhance N2O emissions [9,10]. Furthermore, a meta-analysis revealed that the elevated N2O emissions from tea-plantation soils are primarily attributed to their high levels of N application [11]. However, the N2O emission factor (EF) is still highly uncertain in the current research, particularly regarding those factors that influence it in tea-plantation soils. Previous research has reported that the average N2O EF in tea plantations is 1.92% [11]. The value significantly exceeds the 1% threshold recommended by the IPCC [12]. However, the relationship between N rates and N2O EF remains unclear. For example, Gu et al. [13] suggested that the N2O EF is not directly linked to N rates but is significantly affected by the soil C/N ratio and clay content. In contrast, other studies have reported that higher synthetic N inputs in upland soils can lead to increases in N2O EF, with emissions growing exponentially as N rates rise. Han et al. [7] observed that N2O EF increases with the amount of N fertilizer applied in tea plantations. To accurately assess N2O emissions and develop effective reduction strategies in tea-plantation soils, further research is needed to understand how N fertilizer application rates influence the N2O emission process and EF in field conditions.
The excessive application of N fertilizers significantly increases N2O emissions from tea-plantation soils [14]. However, N application rates vary widely across different tea-growing regions and cultivation practices. Numerous studies have investigated the impacts of varying N application levels on the N2O EF through controlled experiments or short-term field observations [15,16]. However, the results demonstrate significant variability and uncertainty. There is a notable lack of long-term field studies examining how different fertilization regimes influence N2O emissions and EFs in tea-plantation soils. This underscores the necessity for more extensive in situ research to elucidate the complex interactions between N application, soil dynamics, and N2O emissions in tea-plantation systems.
This study investigates the N2O emissions, tea yield, and soil properties of a tea plantation subjected to a 12-year field trial with varying N application rates. The purposes of the study were to (1) assess the responses of N2O emissions, tea yield, and soil properties to long-term N application, and (2) identify key factors driving changes in N2O emissions flux. We hypothesize that the relationship between N2O emissions and tea yield in response to N rates is non-linear rather than linear, and that denitrification of the substrate inorganic N (NH4+-N and NO3-N) is a significant factor influencing N2O emissions. The findings of this study will enhance our understanding of the impacts of N addition on N2O emissions in acidic tea-plantation soils, and will serve as a foundation for developing effective management strategies to mitigate N2O emissions in perennial agricultural systems.

2. Materials and Methods

2.1. Site Description

The field trial was located in Shekou town, Fu’an City, Fujian Province, China (22°22′ N, 119°57′ E, altitude of 46 m) (Figure 1), and was affiliated with the Tea Research Institute of the Fujian Academy of Agricultural Sciences. The site features a subtropical monsoon climate, with a mean annual precipitation (MAP) and temperature (MAT) of 1426 mm and 26 °C from 2013 to 2022. These 10-year datasets were obtained from WorldClim (https://www.worldclim.org) (accessed on 25 June 2024), a global weather and climate data database with high spatial resolution. Additionally, meteorological data for the experimental period (January to December 2023) were collected using a WS-MC01 compact automatic weather station installed on-site (Figure 2). During 2023, daily mean temperatures varied from 2.65 °C to 31.74 °C, with a MAT of 19.72 °C. The MAP for 2023 was 1550.7 mm. The soil at the site is classified as Alisol, which developed from a Quaternary eolian red deposit, and has a loamy clay texture.
The long-term experiment was established in 2009. Each experimental plot consists of a cement pool measuring 200 cm × 90 cm and with a depth of 90 cm (Figure 1c). Five tea bushes were planted in each plot, with a spacing of 30 cm between them. The tea cultivar “Yucui” (You 4) was transplanted in March 2010. At the start of N2O monitoring (December 2022), the surface (0–20 cm) soil properties were as follows: pH 4.85, soil organic carbon (SOC) 3.69 g kg−1, total nitrogen (TN) 0.30 g kg⁻1, available phosphorus (AP) 4.8 mg kg⁻1, available potassium (AK) 60.3 mg kg⁻¹, and an initial C/N ratio of 12.38.

2.2. Experiment Design

The experiment was conducted using a randomized design with four N fertilizer rates (N0, N112.5, N225, and N450; 0, 112.5, 225, and 450 kg N ha−1 yr−1). Each treatment was replicated three times, with each replicate plot covering an area of 1.8 m2, resulting in a total of 12 plots (Figure 1c). For all treatments, P and K fertilizer were applied at rates of 150 kg P2O5 ha−1 and 300 kg K2O ha−1, respectively. Generally, the N (urea) and K (sulfate of potash) fertilizers were applied in three splits: 40% in March, 30% in August, and 30% in November. The P (superphosphate) fertilizer was applied in November as the base fertilizer. All fertilizers were evenly broadcast on the soil surface and then incorporated to a depth of about 5 cm through tillage. In our study, the base fertilizer was applied on 8 December 2022, and top-dressings were applied on 7 March and 10 August 2023.

2.3. Tea Shoot Sampling and Yield Calculation

In our study, tea shoots with one bud and two leaves were picked by hand, and their fresh weights represented tea yield. Spring tea was obtained from 28 March to 25 April, and autumn tea was obtained from 10 September to 7 October. The annual tea yield was the sum of spring and autumn tea yields.

2.4. Measurement of N2O Emissions and Calculation of Indicators

The N2O emissions from the tea-plantation soil were monitored monthly from January to December 2023 to analyze the impacts of different fertilization strategies comprehensively. The frequency of monitoring was increased following fertilization and the precipitation events. The soil N2O flux was measured using an infrared, laser-based gas analyzer (Li-7810, Li-COR Biosciences, Lincoln, NE, USA), with an optical feedback cavity-enhanced absorption spectroscopy (OF-CEAS) apparatus connected to a Smart Chamber (8200-01 S, Li-COR Biosciences, Lincoln, NE, USA). The Smart Chamber was positioned on the top of PVC collars (5.0 cm × 20 cm; height × diameter). At least two minutes were required per plot to perform the measurement, and an interval of approximately 20 seconds was enforced between two consecutive measurements, based on the observed change in gas concentration. All measurements were taken between 9:00 am and 11:00 am.
Soil N2O emission flux was estimated using the SoilFluxPro-4.2.1 software, employing the exponential regression method as the primary technique to calculate the soil greenhouse gas diffusion rate [17]. The formula used was
c t = c x + c 0 c x e a ( t t 0 )
where c(t) is the concentration of N2O inside the test chamber, cx is the asymptote parameter, and c0 is the concentration of atmospheric N2O at the moment the soil chamber is closed.
The soil N2O emission flux is equivalent to the initial slope of the exponential regression, as demonstrated in Equation (2), i.e., ( Ə c Ə t ) :
Ə c Ə t = a ( c x c 0 )
N2O cumulative emissions were calculated using a linear interpolation approach [18]. This method estimated the N2O emissions on the non-sampling days between two consecutive sampling days. Subsequently, the total of the daily emissions was calculated to determine the annual cumulative N2O emission.
M = i = 1 n F i + 1 + F i 2 × d i + 1 d i × ( 8.64 × 10 4 ) × 10 9 × 28 × 10 4
where M is the N2O cumulative emissions during the observation period (g N ha−1), F is the N2O gas emission rate (nmol m−2 s−1), i is the observation number, and di+1di is the interval in days between successive observations. The constants used are 8.64 × 10⁴ (for converting seconds to days), 10⁻9 (for converting nmol to mol), 28 (for converting mol N2O to the mass of N), and 104 (for converting m2 to ha).
The N2O-N emission factor (EF) is calculated using the following formula [19]:
E F = M N M 0 N × 100 %
where EF is the N2O emission factor (%); MN and M0 are the cumulative N2O emissions (g N ha−1) for N-treated and untreated plots, respectively; and N is the applied N amount (g N ha−1).
The yield-scaled N2O emission (YSNE) (g N2O-N kg−1 tea shoots) was calculated as follows:
YSNE = E/Y
where E represents the annual N2O emission in kg N ha−1, and Y represents the tea yield in kg ha−1.

2.5. Measurement of Environmental Factors

The data for air temperature and precipitation at the experimental site were obtained from a meteorological observatory located at the experimental station. The soil temperature was measured using a digital thermometer following N2O monitoring. The soil sample was collected from a 0–10 cm depth using a stainless-steel corer (inner diameter 5 cm), and triplicates were collected from each plot. The collected sample was dried in an oven at 105 °C for 48 h to determine the soil gravimetric water content (GWC), and the GWC was then converted to water-filled pore space (WFPS) as follows:
WFPS (%) = GWC × bulk density/(1 − bulk density/2.65) × 100%
where GWC represents the gravimetric water content (%), bulk density is the bulk density of the soil of each plot, and 2.65 represents the accepted particle density of the soil.
To assess soil pH and the inorganic N (NH4+ and NO3), soil samples were collected around PVC collars 20 cm in diameter and at a depth of 10 cm following N2O monitoring. Surface soil (0–10 cm depth) samples were collected using a 3 cm diameter auger. Each time, a total of 12 composite samples were taken, each composed of three cores randomly selected from different locations within a plot. Each composite sample was thoroughly mixed, and stones, plant debris, and roots were manually removed. The soil was then passed through a 2 mm sieve and divided into two parts. One was immediately analyzed for NH4+ and NO3, while the other part was air-dried and used to measure soil pH.
Soil pH was measured using the potentiometric method with a water-to-soil ratio of 2.5:1. NH4+ and NO3 were extracted by shaking the soil with 2 M KCl at a soil-to-solution ratio of 1:10 (w/v) for one hour, and their concentrations were determined using continuous flow analysis (Seal Analytical AA3, Norderstedt, Germany).

2.6. Statistical Analysis

One-way analysis of variance (ANOVA) was employed to assess significant differences (p < 0.05) in soil properties, tea yield, YSNE, and EF and cumulative N2O emission across four different N application rates. Pearson correlation analysis was performed to assess the relationship between N2O flux and various environmental factors, including Tsoil, WFPS, pH, NH4+-N, and NO3-N. Additionally, random forest (RF) modeling was used to identify the most important soil variables for the prediction of N2O emission under fertilization. All statistical analyses were performed using the R platform (version 4.1.2), with the ‘stats’ package for one-way ANOVA and Pearson correlation, and the ‘randomforest’ package for RF modeling.

3. Results

3.1. Changes in Tsoil, WFPS, Soil pH, and Inorganic N Under Different N Rates

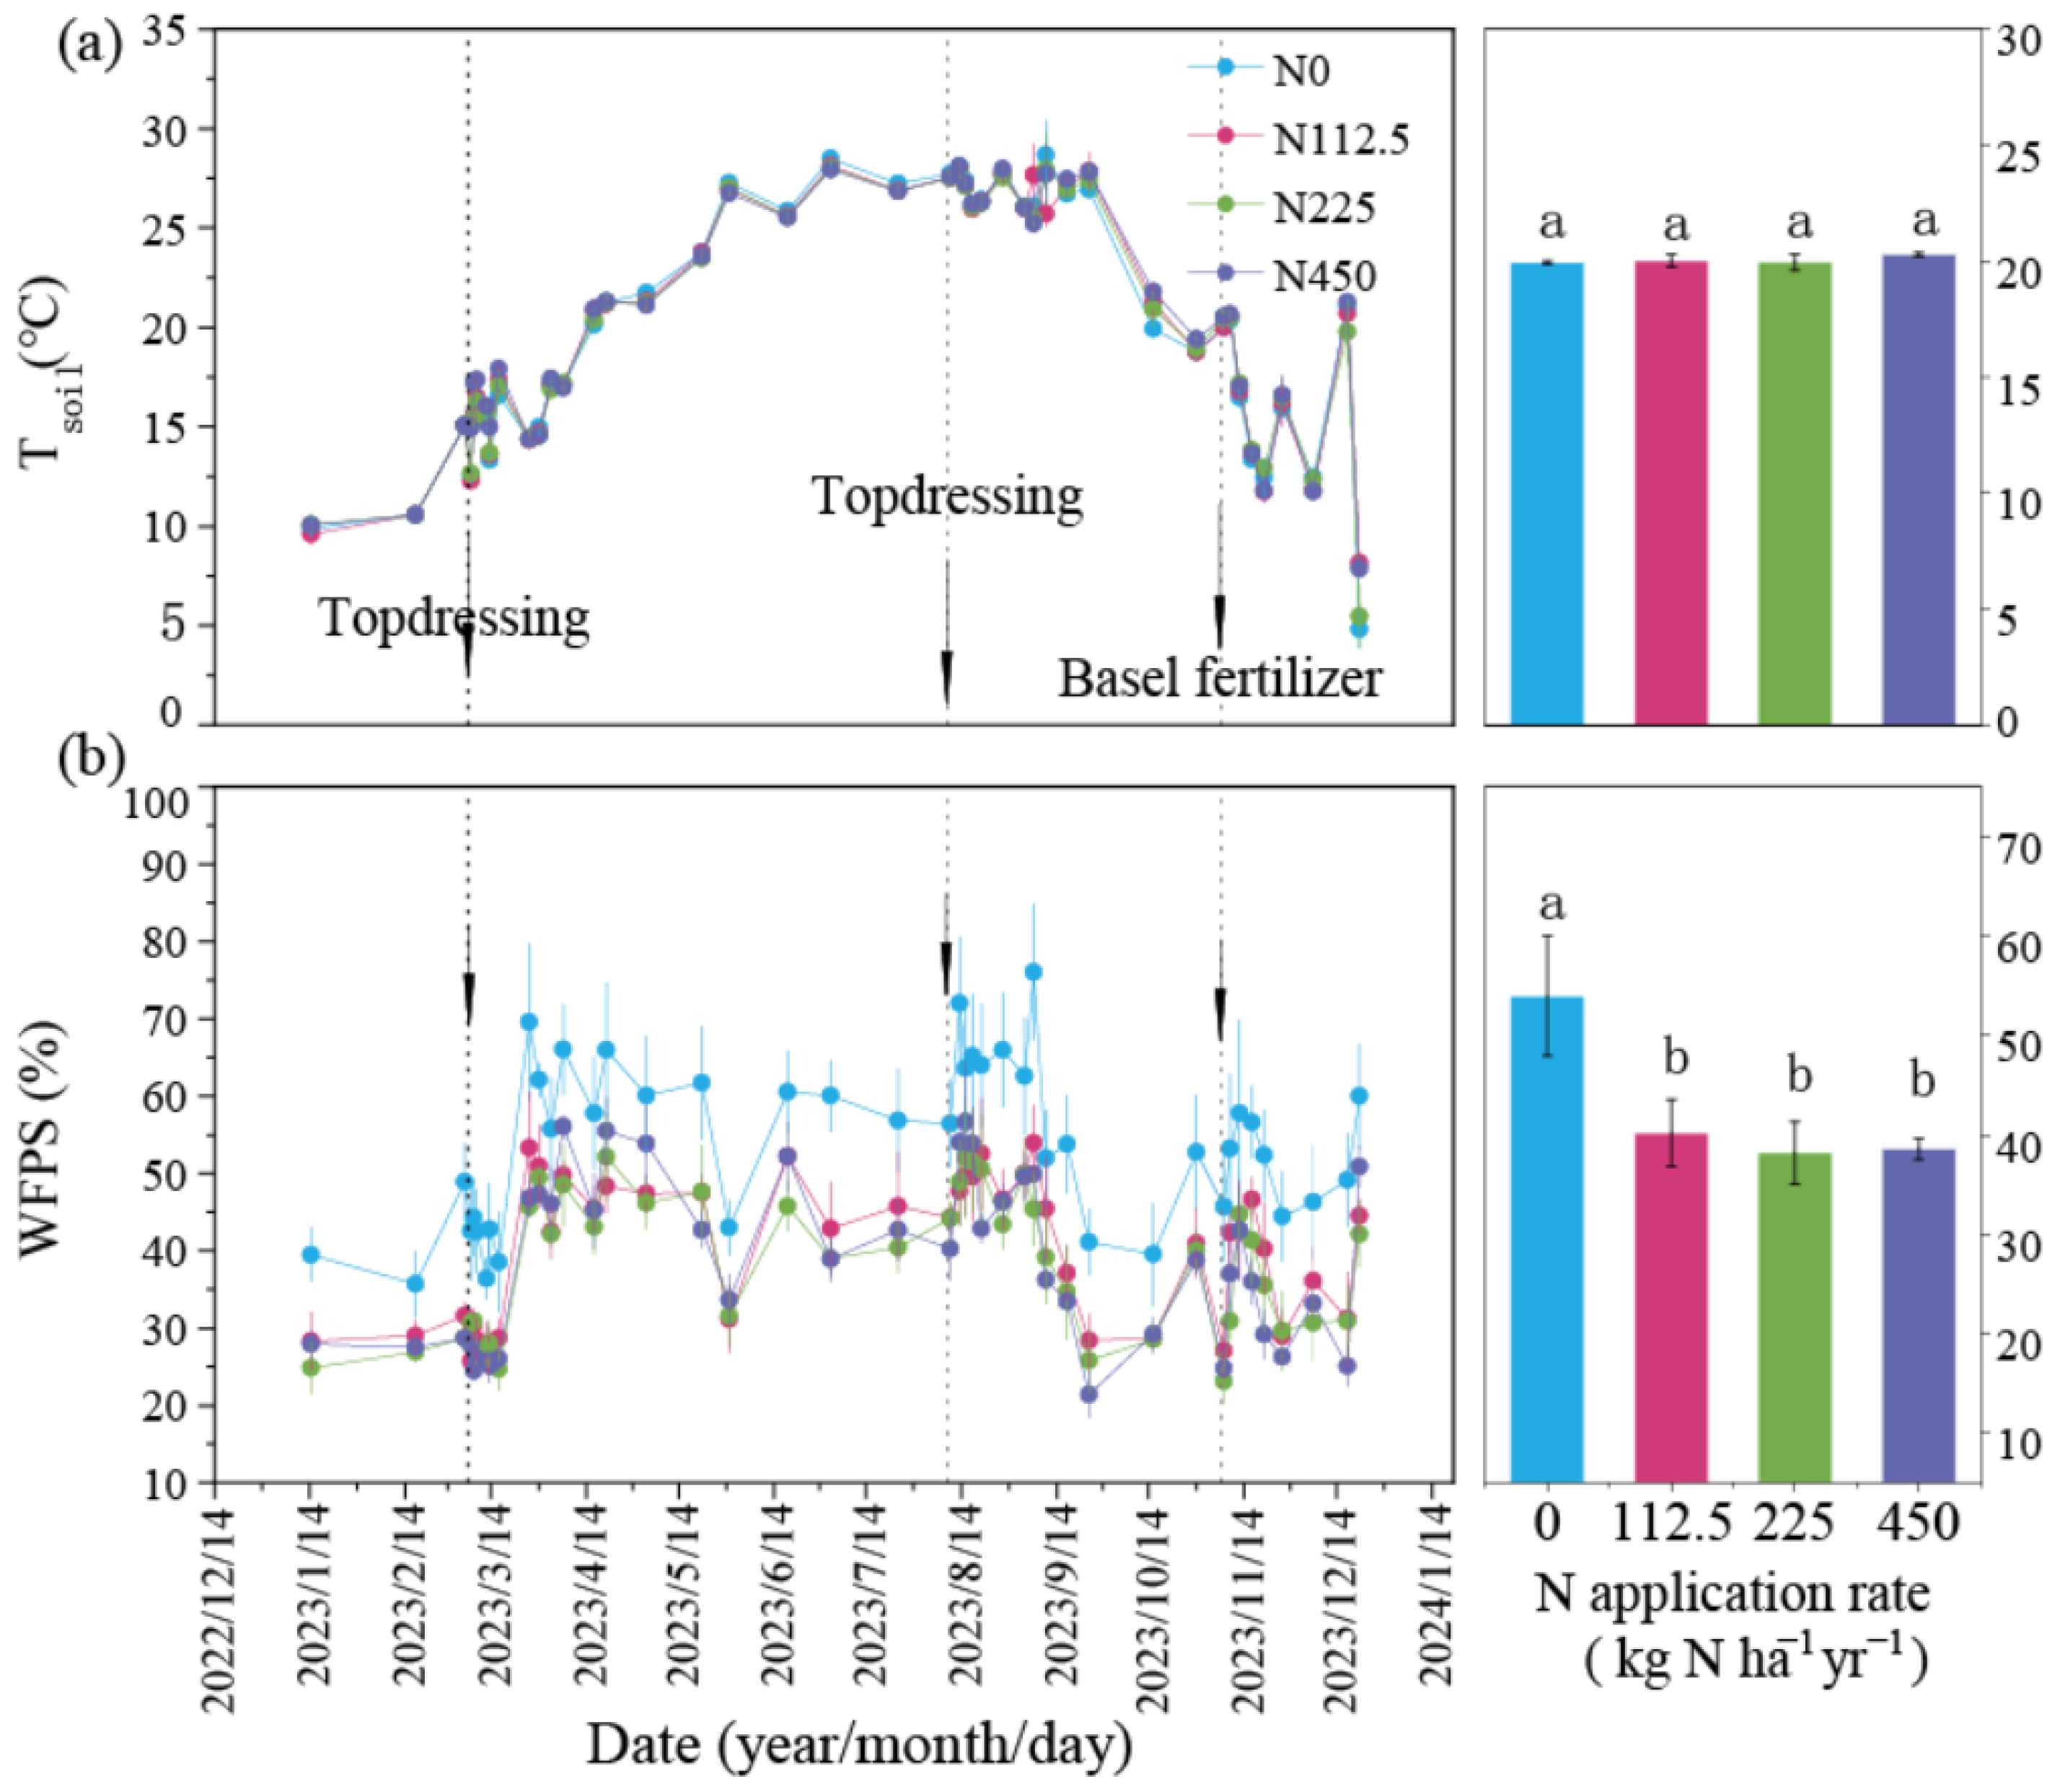
The Tsoil and WFPS (10 cm depth) were continuously monitored throughout the whole experimental period (Figure 3). The observed Tsoil values for each treatment were as follows: 4.81–28.66 °C (N0), 7.54–30.31 °C (N112.5), 2.82–30.31 °C (N225), and 7.07–30.61 °C (N450). The corresponding mean Tsoil values were 19.94 °C (N0), 20.02 °C (N112.5), 19.96 °C (N225), and 20.27 °C (N450). The WFPS ranges varied as follows: 35.68–76.04% (N0), 25.71–53.93% (N112.5), 23.13–52.15% (N225), and 21.41–56.67% (N450). Additionally, the mean WFPS values were significantly lower under the N application treatments, compared to the control (p < 0.05).
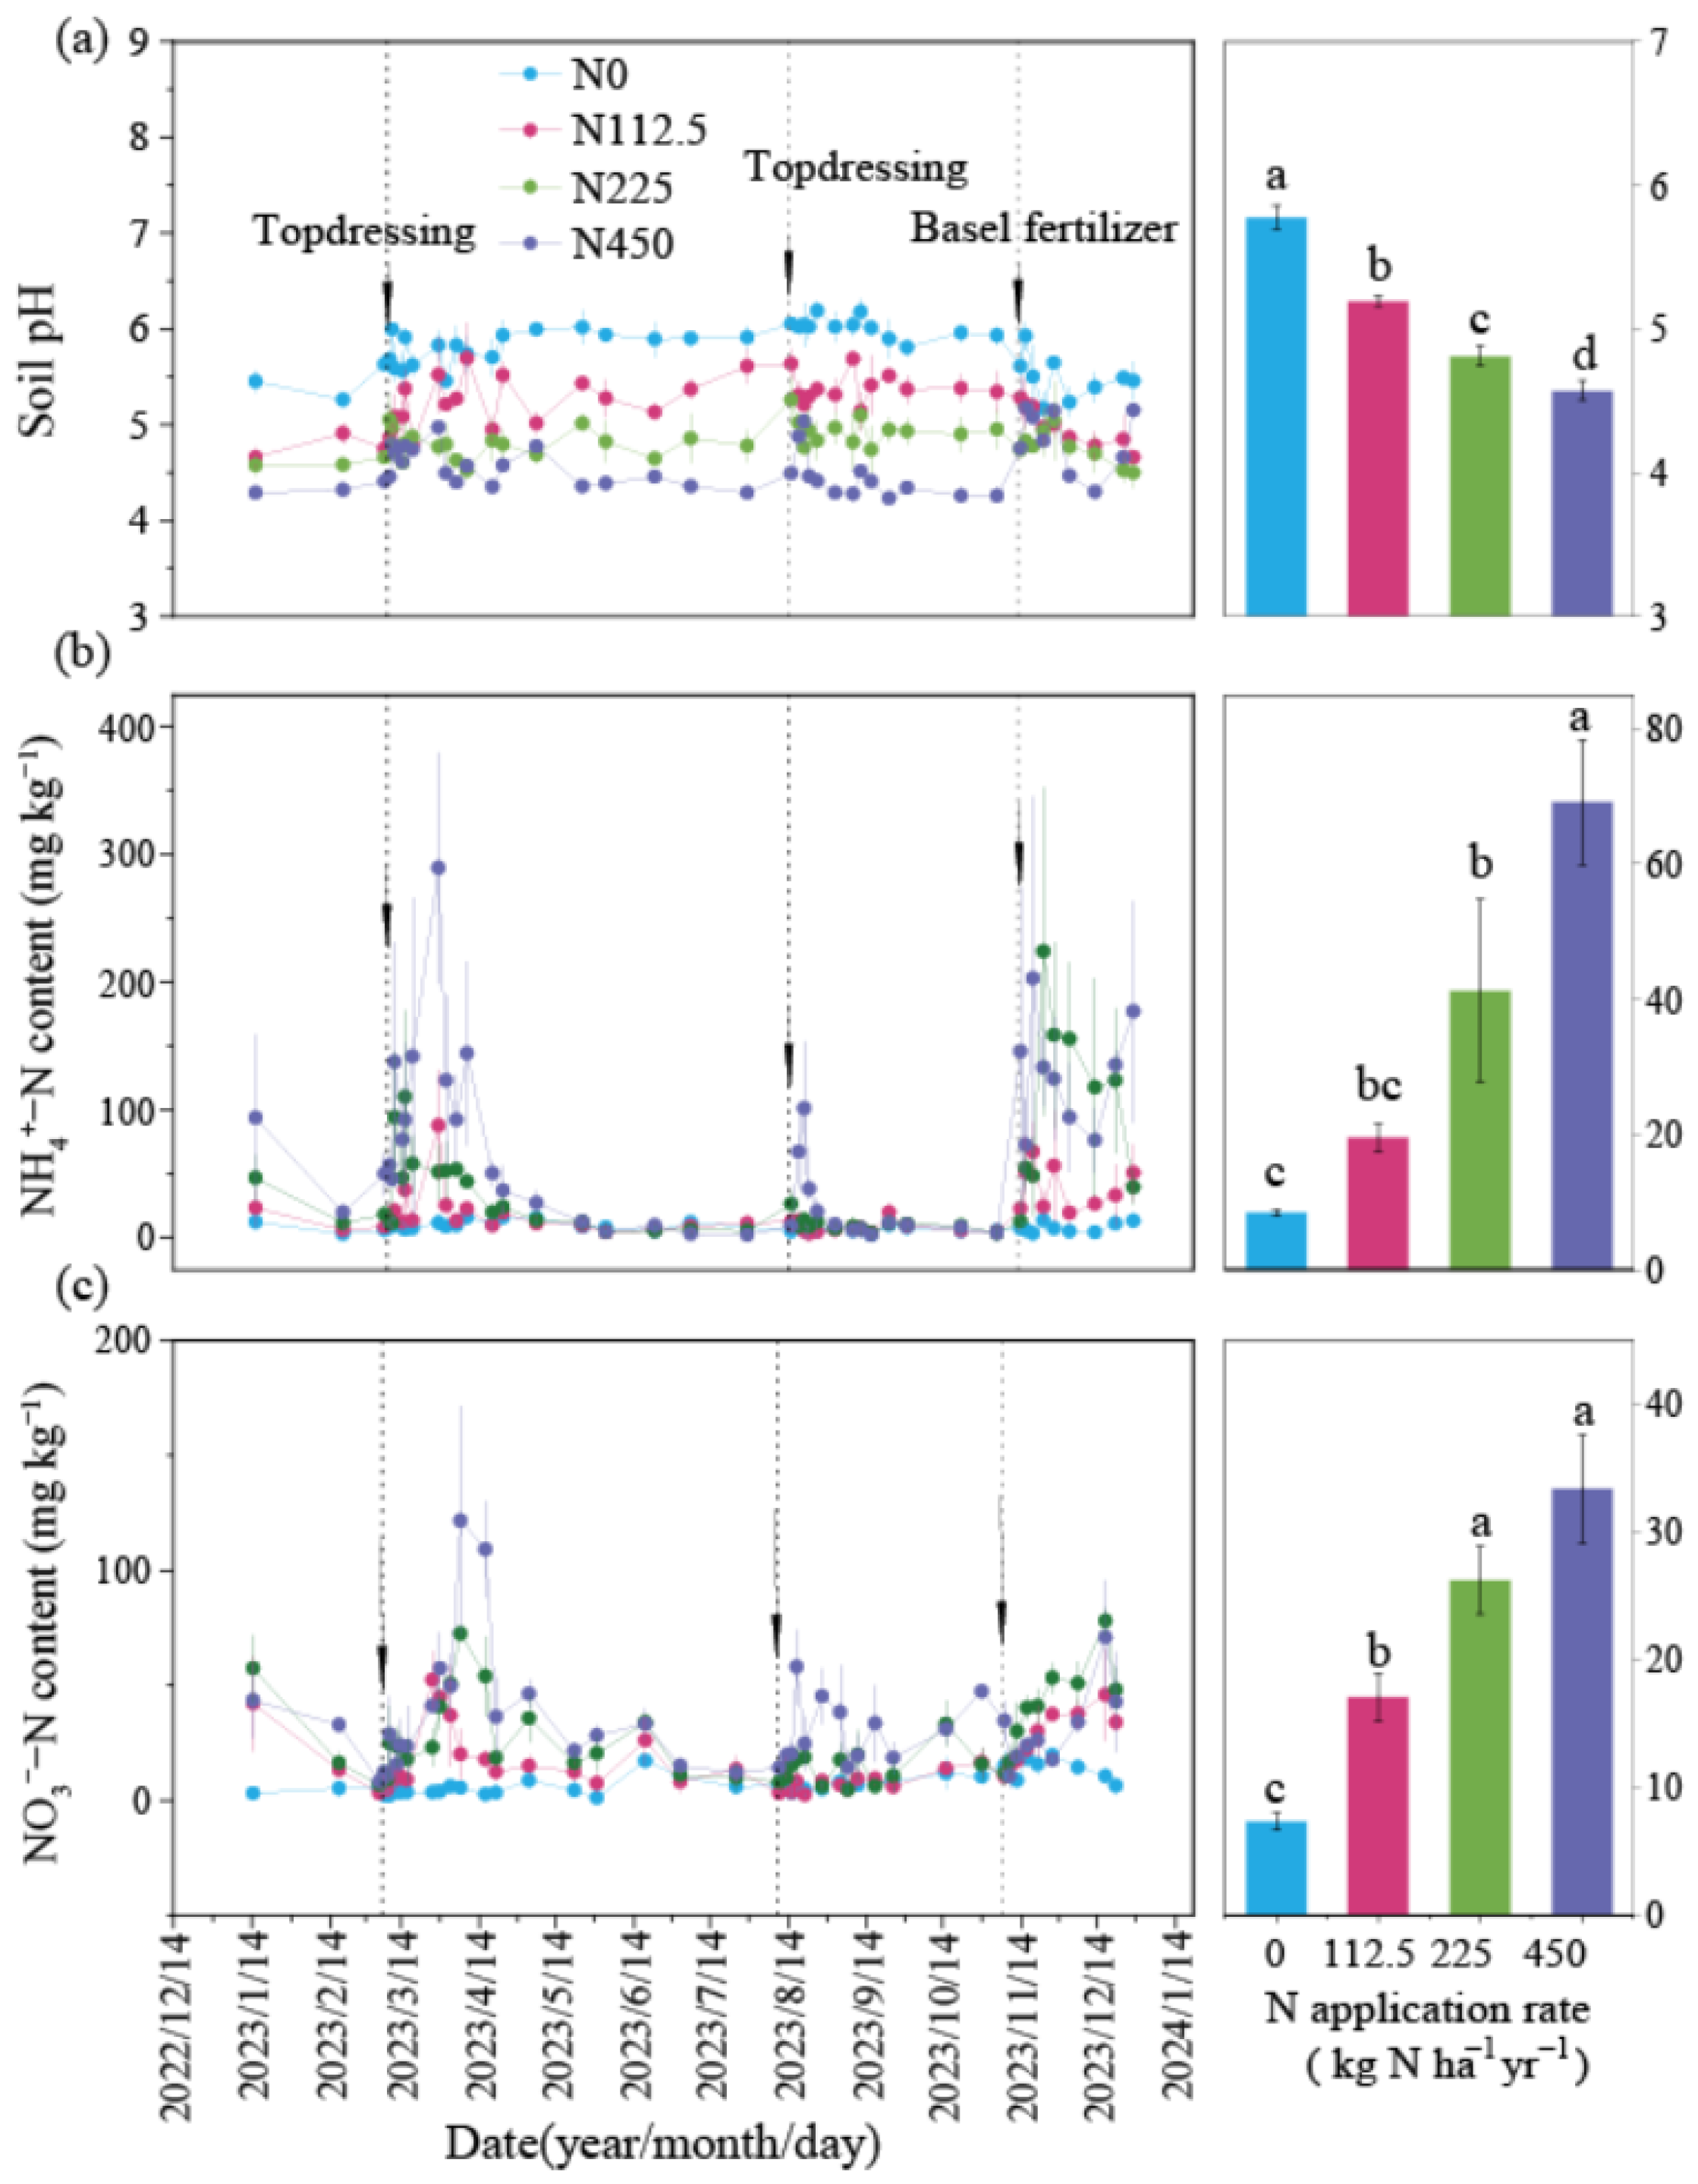
The seasonal fluctuation in soil pH under N fertilization showed an initial increase followed by a steady decrease (Figure 4a). On average, the annual mean soil pH values in the N112.5, N225, and N450 treatments were significantly lower, by 10.16%, 16.68%, and 20.89%, respectively (p < 0.05), compared to the N0 treatment. A significant negative correlation was observed between the annual mean soil pH and N rates (R2 = 0.82, p < 0.01) (Figure S1a).
Similarly, the annual mean contents of NH4+-N (R2 = 0.77, p < 0.01) and NO3-N (R2 = 0.79, p < 0.01) exhibited significant positive correlations with N rates (Figure S1b,c). The N0 treatment had minimal impacts on the seasonal variation of NH4+-N and NO3-N contents (Figure 4b,c), while N fertilization significantly increased the fluctuation of these nutrients. Under N fertilization, soil NH4+-N and NO3-N contents were significantly higher than in the N0 treatment (p < 0.05). Specifically, soil NH4+-N levels in the N112.5, N225, and N450 treatments were 2.31, 4.87, and 8.16 times higher than in the N0 treatment, and the NO3-N were 2.01, 3.09, and 3.93 times higher. Furthermore, continuous monitoring showed that after spring fertilization, NH4+-N content in the 0–10 cm soil layer peaked between 7 and 20 days, while NO3-N content values reached their maximum at points between 20 and 30 days. In contrast, after autumn fertilization, NH4+-N content peaked within 2 to 6 days, and NO3-N content peaked between 8 and 17 days. For base fertilization, NH4+-N peaked at 6 to 12 days, and NO3-N peaked between 30 and 38 days.

3.2. Changes in N2O Flux and Cumulative N2O Emissions Under Different N Rates

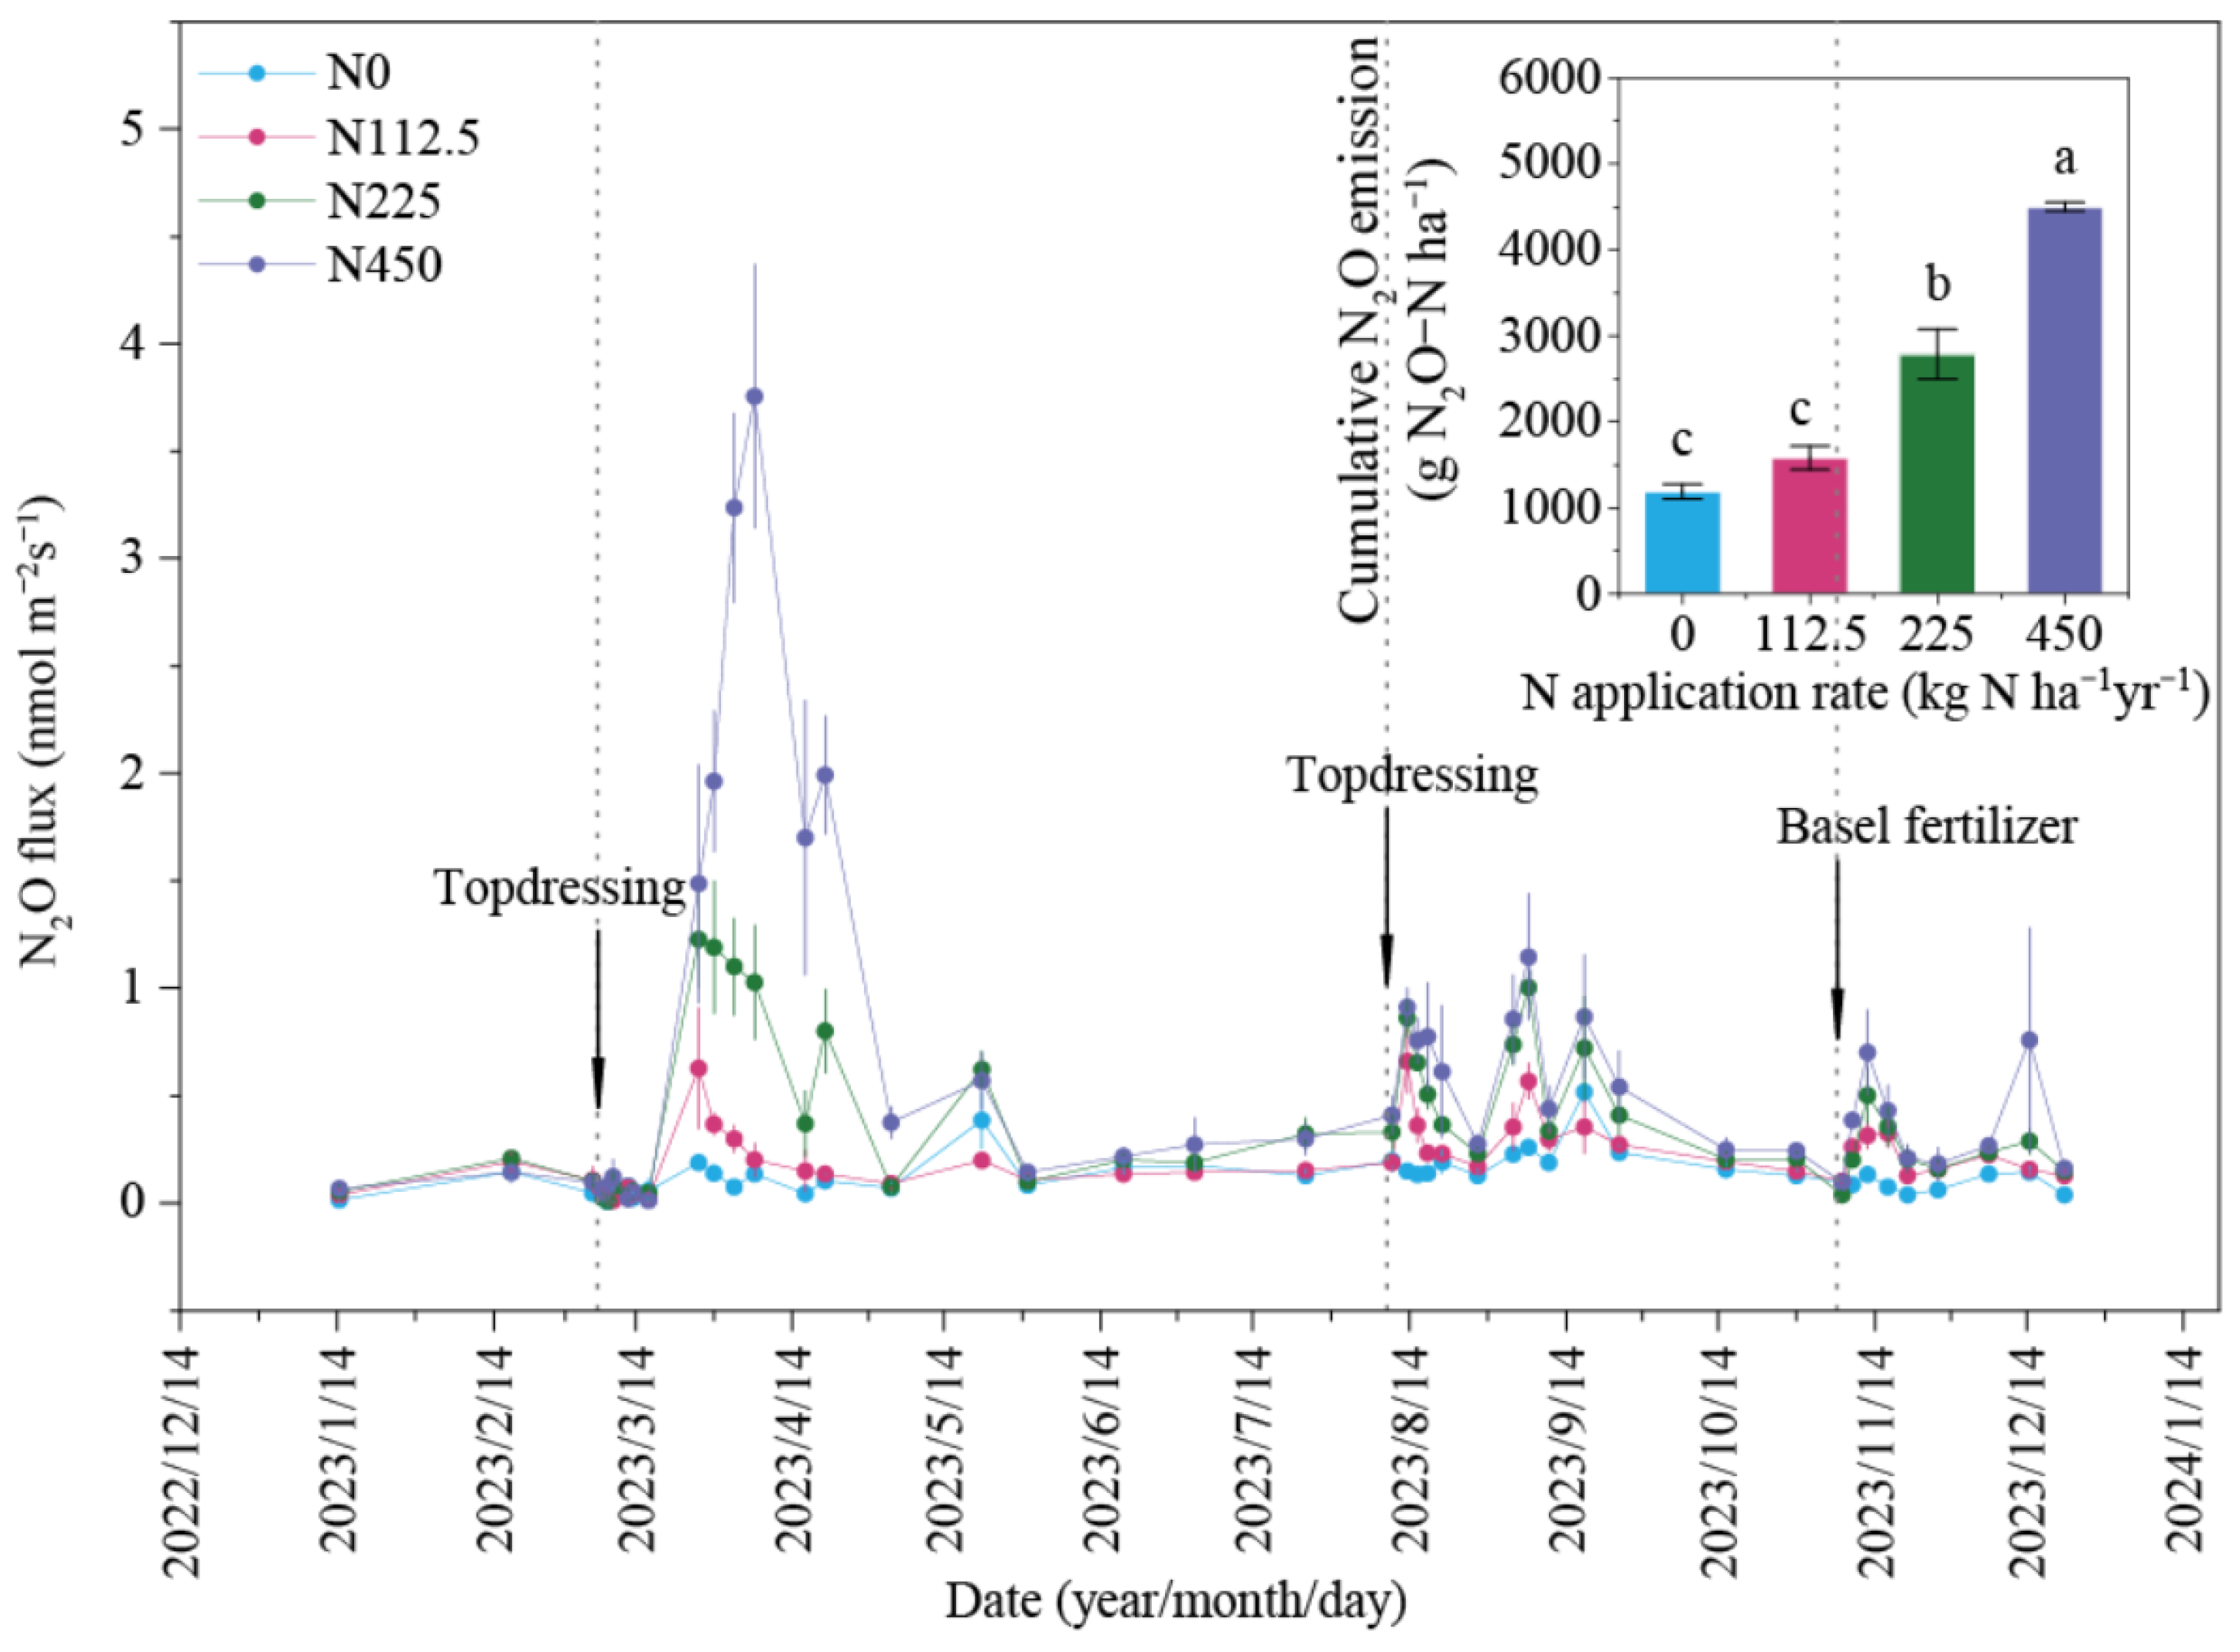
The N2O emission flux in tea-plantation soil varied with different N rates (Figure 5). The N0 treatment exhibited a relatively low flux, ranging from 0.006 to 0.516 nmol m−2 s−1, with an annual mean of 0.130 nmol m−2 s−1. Brief emission peaks occurred after rainfall and temperature increases. In contrast, N fertilizer treatments showed consistent patterns, with three annual peaks following fertilization, influenced by environmental factors. After spring top-dressing (7 March), seasonal drought suppressed N2O emissions until rainfall events (19–23 March) led to rapid increases, peaking in the interval of 3–7 April. This spring peak was higher than those in other periods. Following autumn top-dressing and base fertilization, N2O emissions rose quickly within two days, peaking 4 to 11 days later with two to three emission maxima. N fertilizer significantly increased N2O emission, with higher application rates leading to greater emissions. Mean fluxes for N112.5, N225, and N450 treatments were 0.209, 0.385, and 0.649 nmol m−2 s−1, respectively, −1.61, 2.96, and 4.99 times higher than the N0 treatment.
Furthermore, annual cumulative N2O emissions also rose with higher N rates (Figure 5). The N0 treatment resulted in 1195.14 g N2O-N ha−1, while the N112.5, N225, and N450 treatments yielded 1584, 2791, and 4504 g N2O-N ha−1, respectively, which are approximately 1.33, 2.34, and 3.77 times higher than the N0 treatment. A significant quadratic relationship was observed between cumulative N2O emissions and N rates (R2 = 0.94, p < 0.01) (Figure S2).

3.3. Tea Yield, YSNE, and N2O EF Under Different N Rates

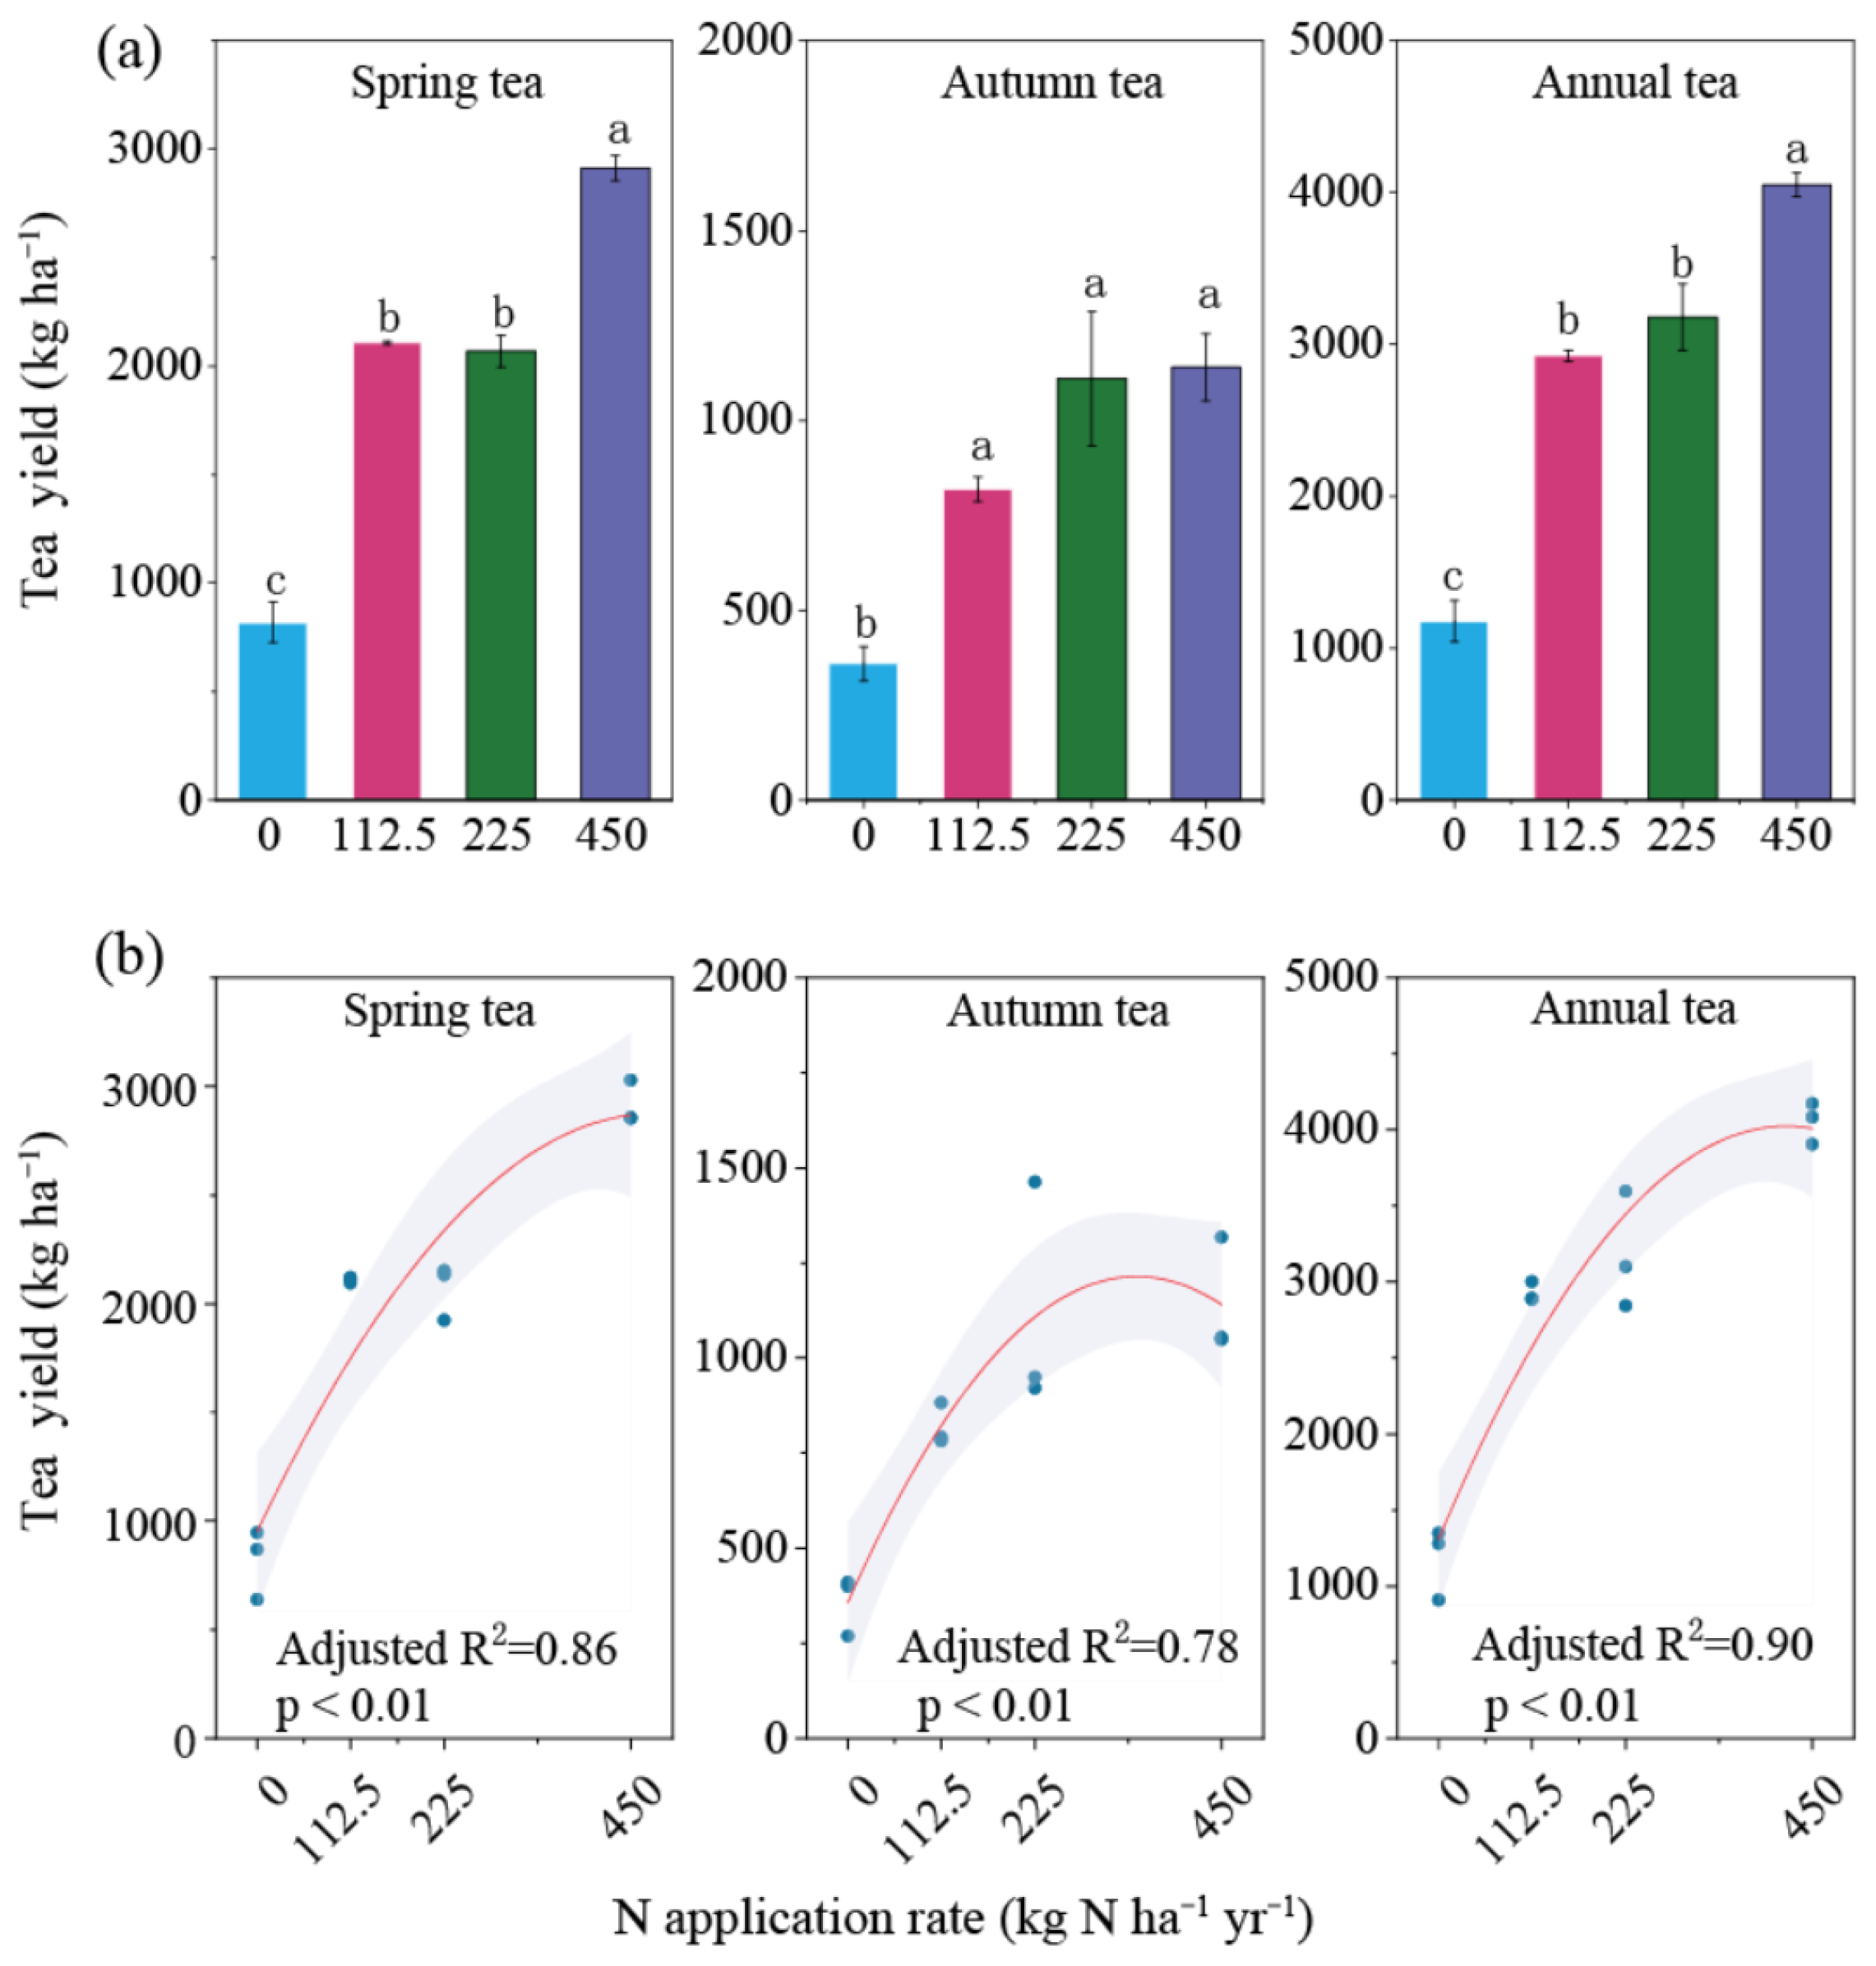
Different N rates significantly affected tea yield (Figure 6). Compared to the N0 treatment, spring tea yields increased by 157.34%, 152.65%, and 255.70% under the N112.5, N225, and N450 treatments, respectively. A quadratic relationship was observed between yield and N rates (R2 = 0.86, p < 0.01). Autumn tea yields also rose by 127.65%, 208.82%, and 216.72% with the same treatments, following a similar quadratic trend (R2 = 0.78, p < 0.01). Overall, annual tea yield improved by 37.48%, 241.32%, and 270.91% with increasing N rates, showing a strong quadratic correlation (R2 = 0.90, p < 0.01).
Long-term N input significantly affected the Yield-Scaled Nitrogen Efficiency (YSNE), which decreased by 47.57% and 14.56% for the N112.5 and N225 treatments, respectively, compared to N0 (p < 0.05) (Table 1). However, there was no significant difference between the N0 and N450 treatments. Additionally, the N2O EF increased with higher N rates, i.e., N112.5 (0.35%) < N225 (0.71%) < N450 (0.74%). Significant differences in EF were observed between the N225, N450, and N0 treatments, but not between N225 and N450.

3.4. Driving Factors for Influencing N2O Flux in Tea Plantations

Pearson correlation analysis showed that the N2O emission flux was significantly positively correlated with N rates, soil WFPS, Tsoil, and inorganic N contents (NH4+-N and NO3-N) (Figure 7a). Conversely, it was significantly negatively correlated with soil pH. The correlation between soil N2O flux and environmental factors varied with different N rates (Figure S3). Under the N0 treatment, N2O flux was significantly correlated with Tsoil, WFPS, and pH. For the N112.5 and N225 treatments, N2O flux was only significantly correlated with Tsoil and WFPS. In the N450 treatment, NH4+-N and NO3-N also exhibited significant correlations with N2O flux, in addition to Tsoil and WFPS.
The RF model further demonstrated that soil environmental factors significantly influenced N2O flux changes, with an R² value of 45.2% (p < 0.001) (Figure 7b). Key factors contributing to N2O flux were soil WFPS (%IncMSE = 27.11%, p < 0.01), N rates (%IncMSE = 20.57%, p < 0.01), and Tsoil (%IncMSE = 13.60%, p < 0.01).

4. Discussion

Nitrogen is a vital mineral nutrient for plants, and applying N fertilizer is essential for boosting tea yield and regulating quality. In this study, we found that tea yield increased with higher N application rates (0 to 450 kg ha⁻¹) (Figure 6), which is consistent with previous findings [20]. However, the impacts of N application on tea plants and soils are complex, as N-containing compounds in tea directly affect its color, aroma, and taste. Long-term N application significantly alters soil properties, notably causing a marked decrease in soil pH (Figure 4). Excessive N use leads to H⁺ accumulation, accelerating soil acidification—a major issue in tea plantations [21]. Moreover, low pH reduces nitrous oxide reductase (NOS) activity, hindering the conversion of N2O to N₂ and resulting in N2O accumulation and higher emissions [4,22]. To mitigate these effects, tea production must adhere to N fertilizer limits based on desired yield and quality. This approach can slow soil acidification and reduce N2O emissions, which is crucial for sustainable tea cultivation.
N2O is produced through both nitrification and denitrification, which occur simultaneously in soils [22]. This study found a strong positive correlation between N2O flux and soil NH4+-N and NO3-N (Figure 7), which is consistent with previous findings showing that N fertilizers increase these nutrient levels [23], thereby promoting nitrification and denitrification and subsequently increasing N2O emissions [24]. However, our research also revealed that the relationship between N rates and N2O emissions is not straightforward. For example, high N treatment (N450) showed significant correlations, while other treatments did not. This suggests that at lower N levels, rapid uptake of NH₄⁺-N and NO₃⁻-N by tea roots limits the accumulation of these nutrients in the soil, potentially explaining the lack of significant correlations under these conditions. Additionally, environmental factors such as soil temperature and humidity influence N2O emissions, particularly at lower N levels, where they may overshadow the impact of inorganic N content. Therefore, optimizing the absorption of N fertilizers by tea plants and minimizing residual NH₄⁺-N and NO₃⁻-N levels in the soil are effective strategies for reducing N2O emissions in tea plantations.
Numerous studies have demonstrated that soil moisture is a critical factor affecting N2O emission from tea-plantation soils. It affects soil aeration, redox potential, nutrient availability, and microbial activity, thereby impacting nitrification, denitrification, and N2O production. The optimal soil moisture for N2O emissions is typically between 60% and 80% of the WFPS [25]. When soil NO3-N levels are high, precipitation often triggers significant N2O emissions [26]. Machon et al. [27] observed a significant N2O emission peak in tea-plantation soils following rainfall, indicating that rainfall acts as a trigger for these emissions. In this study, N2O fluxes were significantly positively correlated with soil WFPS across all treatments (Figure 7). In early to mid-March, seasonal drought conditions reduced both soil moisture and N2O emissions (Figure 2). However, subsequent rainfall improved soil moisture, leading to a rapid increase in N2O emission. Therefore, effective water management and integrated water–fertilizer strategies are essential for mitigating N2O emission in tea plantations.
In addition, soil temperature is widely recognized as a key factor influencing nitrification and denitrification processes, with optimal ranges of 25–35 °C and 30–67 °C, respectively [28]. However, our study found that the correlation between N2O flux and Tsoil diminishes with higher N input. Specifically, significant positive correlations with Tsoil were observed in the control and low-to-medium N treatments (N112.5 and N225). In contrast, this correlation was not significant in the high N treatment (N450). This suggests that tea plantations, as artificial ecosystems, are strongly influenced by human management practices regarding N2O emissions. In the N450 treatment, the high levels of soil inorganic N likely played a dominant role in N2O emissions, potentially overshadowing the effect of Tsoil.
The application rate of N fertilizer is a crucial factor in regulating soil N2O emissions in tea plantations, and this study has extensively investigated its impact. The significant increase in annual cumulative N2O emissions under N treatments compared to the N0 treatment confirms the strong positive effect of N fertilization on N2O emissions in tea plantations. This finding is consistent with previous findings which indicated that higher N application rates lead to increased annual N2O emissions, with the N application rate being the most influential factor controlling these emissions [11].
While higher N application can boost tea yields, the NUE of tea plants typically ranges from only 25% to 30% [29], indicating that a significant portion of the applied N remains unutilized. Excessive N fertilizer leads to elevated soil NH₄⁺-N and NO₃⁻-N levels, providing abundant substrates for nitrification and denitrification, and thus intensifying N2O emissions [30,31]. Additionally, excessive N can cause significant soil acidification [21], which may activate denitrifying bacteria and inhibit nitrous oxide reductase activity [4], further accelerating N2O production and release. Notably, this study found that N2O emissions increase gradually at low N levels but rise sharply once a certain threshold is exceeded. This highlights the importance of N management strategies, such as selecting fertilizers that tea plants can readily absorb, and optimizing the timing, placement, and quantity of fertilizer applications based on the growth characteristics of tea plants. These practices can enhance NUE and effectively reduce N2O emissions [32].
In our study, the N2O EF increased with higher N rates, ranging from 0.35% to 0.74% (Table 1). However, these values are significantly lower than the previously reported average N2O EF of 1.92% for Chinese tea-plantation soils [33]. The global N-induced N2O EF for tea plantations shows even greater variability, spanning from 0.1% to 11.5%, with an average of 2.31% [11]. This wide range underscores the complexity of N2O emissions in agricultural soils, which are influenced by a multitude of interacting factors, including soil properties (such as total N content and C/N ratio), management practices (like irrigation and fertilization), and other environmental variables. While our findings are consistent with previous studies showing that N2O EF increases with higher N application rates [33], other research suggests that in tea plantations, the N2O EF is primarily driven by soil C/N ratio and clay content rather than the N application rate [34]. Consequently, accurately estimating the current N2O EF in tea-plantation soils remains a highly uncertain practice due to the complex interplay of the various factors affecting N2O emission mechanisms under field conditions.
In addition to these abiotic factors, multiple biotic factors, such as soil microbes, soil enzyme activities, and soil rhizosphere processes, play important roles in regulating soil N2O production. Future studies should comprehensively analyze the effects of biotic and abiotic factors on the soil N2O emissions of acidic tea-plantation systems.

5. Conclusions

In this study, soil pH significantly decreased with increasing N rates, while tea yields increased. The N2O flux, cumulative emissions, and EF also rose significantly with higher N rates and showed notable seasonal fluctuations. The N2O flux was positively correlated with N rates, WFPS, Tsiol, and inorganic N, and negatively correlated with soil pH. RF modeling further identified WFPS, N rates, and Tsiol as key factors influencing N2O flux. To optimize tea production, it is essential to adhere to N application limits tailored to the target yields for different tea varieties. Selecting N fertilizers that tea plants can readily absorb and utilize is crucial. Additionally, optimizing the timing of fertilizer application based on the specific characteristics of tea production and improving the water–fertilizer integration are key strategies. These approaches can help mitigate soil acidification, enhance NUE, and reduce N2O emissions in acidic tea plantations.

Supplementary Materials

The following supporting information can be downloaded at www.mdpi.com/article/10.3390/agronomy15010007/: Figure S1: Trend lines show the curve regressions of soil pH, NH4+-N, and NO3-N levels against different N rates, and grey shading represents 95% confidence intervals. Figure S2: Trend lines show the curve regressions of the cumulative N2O emissions against different N rates, and grey shading represents 95% confidence intervals. Figure S3: Heatmap shows the Pearson correlations between N2O flux and Tsoil, WFPS, soil pH, NH4+-N, NO3-N, and N2O flux under different levels of N application, * p < 0.05, ** p < 0.01.

Author Contributions

F.J.: experimental design, investigation, writing—original draft; Y.C.: investigation, data curation; J.H.: date analysis; X.Y.: supervision, funding acquisition, writing—review and editing; Z.W.: supervision, funding acquisition, writing—review and editing. All authors have read and agreed to the published version of the manuscript.

Funding

This research was supported by the Technology Plan Project of Fujian Province (2022R1029006, 2023R1027001), the China Agriculture Research System of MOF and MARA (CARS-19), the Science and Technology Specific Project of Fujian Academy of Agricultural Sciences (DKBF-2024-08), and the National Natural Science Foundation of China (42407459).

Data Availability Statement

The data that support the findings of this study are available on request from the corresponding author.

Conflicts of Interest

The authors declare no conflicts of interest.

Abbreviations

N2O, nitrous oxide; N0, no nitrogen fertilizer; N112.5, 112.5 kg N ha⁻1; N225, 225 kg N ha⁻1; N450, 450 kg N ha⁻1; SOC, soil organic carbon; TN, total nitrogen; C/N, the ratio of total carbon to total nitrogen; AP, available phosphorus; AK, available potassium; NH4+-N, ammonium; NO3-N, nitrate; YSNE, yield-scaled N2O emissions; N2O-EF, N2O emission factors; RF, random forest; WFPS, waterfilled pore space; Tsoil, soil temperature; ANOVA, one-way analysis of variance.

References

  1. IPCC. Climate Change 2013: The Physical Science Basis. Contribution of Working Group I to the Fifth Assessment Report of the Intergovernmental Panel on Climate Change; Cambridge University Press: Cambridge, UK, 2013; p. 714. [Google Scholar]
  2. Huang, X.H.; Zheng, Y.T.; Li, P.F.; Cui, J.X.; Sui, P.; Chen, Y.Q.; Gao, W.S. Organic management increases beneficial microorganisms and promotes the stability of microecological networks in tea plantation soil. Front. Microbiol. 2023, 14, 1237842. [Google Scholar] [CrossRef] [PubMed]
  3. Ruan, J.Y.; Ma, L.F.; Shi, Y.Z. Potassium management in tea plantations: Its uptake by field plants, status in soils, and efficacy on yields and quality of teas in China. J. Plant Nutr. Soil Sci. 2013, 176, 450–459. [Google Scholar] [CrossRef]
  4. Tokuda, S.; Hayatsu, M. Nitrous oxide production from strongly acid tea field soils. Soil Sci. Plant Nutr. 2000, 46, 835–844. [Google Scholar] [CrossRef]
  5. Davidson, E.A. The contribution of manure and fertilizer nitrogen to atmospheric nitrous oxide since 1860. Nat. Geosci. 2009, 2, 659–662. [Google Scholar] [CrossRef]
  6. Syakila, A.; Kroeze, C. The global nitrous oxide budget revisited Greenhouse. Gas Meas. Manage 2011, 1, 17–26. [Google Scholar]
  7. Han, W.Y.; Xu, J.M.; Wei, K.; Shi, Y.X.; Ma, L.F. Estimation of N2O emission from tea garden soils, their adjacent vegetable garden and forest soils in eastern China. Environ. Earth Sci. 2013, 70, 2495–2500. [Google Scholar] [CrossRef]
  8. Yao, Z.; Wei, Y.; Liu, C.; Zheng, X.; Xie, B. Organically fertilized tea plantation stimulates N2O emissions and lowers no fluxes in subtropical China. Biogeosciences 2015, 12, 5915–5928. [Google Scholar] [CrossRef]
  9. Hou, M.; Ohkama-Ohtsu, N.; Suzuki, S.; Tanaka, H.; Schmidhalter, U.; Bellingrath-Kimura, S.D. Nitrous oxide emission from tea soil under different fertilizer managements in Japan. Catena 2015, 135, 304–312. [Google Scholar] [CrossRef]
  10. Zaw, A.O.; Shigeto, S.; Hiroko, A.; Thuzar, W.K.; Akira, S.; Akinori, Y.; Tomohito, S.; Yuhei, H.; Jorge, P.F. Effect of dolomite and biochar addition on N2O and CO2 emissions from acidic tea field soil. PLoS ONE 2018, 13, e0192235. [Google Scholar]
  11. Wang, Y.; Yao, Z.S.; Pan, Z.L.; Wang, R.; Yan, G.X.; Liu, C.Y.; Su, Y.Y.; Zheng, X.H.; Klaus, B.B. Tea-planted soils as global hotspots for N2O emissions from croplands. Environ. Res. Lett. 2020, 15, 104018. [Google Scholar] [CrossRef]
  12. Intergovernmental Panel on Climate Change (IPCC). 2006 IPCC Guidelines for National Greenhouse Gas Inventories; Eggleston, H.S., Buendia, L., Miwa, K., Ngara, T., Tanabe, K., Eds.; IGES: Hayama, Japan ; Cambridge University Press: Cambridge, UK, 2006. [Google Scholar]
  13. Gu, J.X.; Nie, H.H.; Guo, H.J.; Xu, H.H.; Gunnathorn, T. Nitrous oxide emissions from fruit orchards: A review. Atmos. Env. 2019, 201, 166–172. [Google Scholar] [CrossRef]
  14. Ding, W.C.; Xu, X.P.; He, P.; Zhang, J.; Zhou, W. Estimating regional N application rates for rice in China based on target yield, indigenous N supply, and N loss. Environ. Pollut. 2020, 263 Pt B, 114408. [Google Scholar] [CrossRef] [PubMed]
  15. Yamamoto, A.; Naokawa, M.; Honda, S.; Nakajima, Y. Lime-nitrogen application affects nitrification, denitrification, and N2O emission in an acidic tea soil. Biol. Fertil. Soils 2014, 50, 53–62. [Google Scholar] [CrossRef]
  16. Zhang, W.; Yao, Z.; Zheng, X.; Liu, C.; Shi, J. Effects of fertilization and stand age on N2O and NO emissions from tea plantations: A site-scale study in a subtropical region using a modified biogeochemical model. Atmos. Chem. Phys. 2020, 20, 6903–6919. [Google Scholar] [CrossRef]
  17. Agusto, L.E.; Qin, G.M.; Thibodeau, B.; Tang, J.W.; Zhang, J.F.; Zhou, J.G.; Wu, J.T.; Zhang, L.L.; Thapa, P.; Wang, F.M.; et al. Fiddling with the blue carbon: Fiddler crab burrows enhance CO2 and CH4 efflux in saltmarsh. Ecol. Indic. 2022, 144, 109538. [Google Scholar] [CrossRef]
  18. Bao, Q.; Ju, X.; Gao, B.; Qu, Z.; Christie, P.; Lu, Y. Response of nitrous oxide and corresponding bacteria to managements in an agricultural soil. Soil Sci. Soc. Am. J. 2012, 76, 130–141. [Google Scholar] [CrossRef]
  19. Wang, X.Z.; Zou, C.Q.; Gao, X.P.; Guan, X.L.; Zhang, W.S.; Zhang, Y.Q.; Shi, X.J.; Chen, X.P. Nitrous oxide emissions in chinese vegetable systems: A meta-analysis. Environ. Pollut. 2018, 239, 375–383. [Google Scholar] [CrossRef]
  20. Ma, L.F.; Yang, X.D.; Shi, Y.Z.; Yi, X.Y.; Ji, L.F.; Cheng, Y.; Ruan, J.Y. Response of tea yield, quality and soil bacterial characteristics to long-term nitrogen fertilization in an eleven-year field experiment. Appl. Soil Ecol. 2021, 166, 103976. [Google Scholar] [CrossRef]
  21. Yang, X.D.; Ni, K.; Shi, Y.Z.; Yi, X.Y.; Zhang, Q.F.; Fang, L.; Ma, L.F.; Ruan, J.Y. Effects of long-term nitrogen application on soil acidification and solution chemistry of a tea plantation in China. Agric. Ecosyst. Env. 2018, 252, 74–82. [Google Scholar] [CrossRef]
  22. Hayatsu, M.; Kosuge, N. Autotrophic nitrification in acid tea soils. Soil Sci. Plant Nutr. 1993, 39, 209–217. [Google Scholar] [CrossRef]
  23. Aulakh, M.S.; Rennie, D.A.; Paul, E.A. Acetylene and n-serve effects upon N2O emissions from NH4+ and NO3 treated soils under aerobic and anaerobic conditions. Soil Biol. Biochem. 1984, 16, 351–356. [Google Scholar] [CrossRef]
  24. Wang, Y.S.; Cheng, S.L.; Fang, H.J.; Yu, G.R.; Xu, M.J.; Dang, X.S.; Li, L.S.; Wang, L. Simulated Nitrogen Deposition Reduces CH4 Uptake and Increases N2O Emission from a Subtropical Plantation Forest Soil in Southern China. PLoS ONE 2014, 9, e93571. [Google Scholar] [CrossRef] [PubMed]
  25. Dobbie, K.E.; Smith, K.A. The effects of temperature, water-filled pore space and land use on N2O emissions from an imperfectly drained gleysol. Eur. J. Soil Sci. 2010, 52, 667–673. [Google Scholar] [CrossRef]
  26. Dobbie, K.E.; Smith, K.A. Nitrous oxide emission factors for agricultural soils in Great Britain: The impact of soil water-filled pore space and other controlling variables. Glob. Change Biol 2003, 9, 204–218. [Google Scholar] [CrossRef]
  27. Machon, A.; Horváth, L.; Weidinger, T.; Grosz, B.; Pintér, K.; Tuba, Z.; Führer, E. Estimation of net nitrogen flux between the atmosphere and a semi-natural grassland ecosystem in Hungary. Eur. J. Soil Sci. 2010, 61, 631–639. [Google Scholar] [CrossRef]
  28. Granli, T.; Bockman, O.C. Nitrous oxide from agriculture. Nor. J. Agric. Sci. 1994, 12, 128. [Google Scholar]
  29. Wang, B.; Wang, S.; Li, G.Y.; Fu, L.B.; Chen, H.; Yin, M.; Chen, J.F. Reducing nitrogen fertilizer usage coupled with organic substitution improves soil quality and boosts tea yield and quality in tea plantations. J. Food Agric. 2024, 25, 1228–1238. [Google Scholar] [CrossRef]
  30. Wang, F.E.; He, Z.L.; Zhang, X.L.; Iqbal, J.; Shaaban, M.; Hu, R.G.; Lin, S.; Yan, Z.W. Comparative effects of straw and biochar on N2O emissions from acidic soils. J. Soil Sci. Plant Nutr. 2024, 24, 2080–2090. [Google Scholar] [CrossRef]
  31. Shcherbak, I.; Millar, N.; Robertson, G.P. Global metaanalysis of the nonlinear response of soil nitrous oxide (N2O) emissions to fertilizer nitrogen. Proc. Natl. Acad. Sci. USA 2014, 111, 9199–9204. [Google Scholar] [CrossRef]
  32. Yang, X.D.; Tang, S.; Ni, K.; Shi, Y.Z.; Yi, X.Y.; Ma, Q.X.; Cai, Y.J.; Ma, L.F.; Ruan, J.Y. Long-term nitrogen addition increases denitrification potential and functional gene abundance and changes denitrifying communities in acidic tea plantation soil. Environ. Res. 2023, 216, 114679. [Google Scholar] [CrossRef]
  33. Yao, Z.S.; Wang, Y.; Wang, R.; Liu, C.Y.; Zheng, X.H. Nitrous oxide emissions and controlling factors of tea plantations in China. J. Agro-Environ. Sci. 2020, 39, 715–725. (In Chinese) [Google Scholar]
  34. Duan, P.P.; Wang, D.B.; Xiao, K.C.; Zheng, L.; Chen, H.; Wang, K.L.; De, J. Responses of soil nitrous oxide e mission to nitrogen addition at two topographic positions of a subtropical forest. JGR Biogeosci. 2022, 127, e2021JG006539. [Google Scholar] [CrossRef]
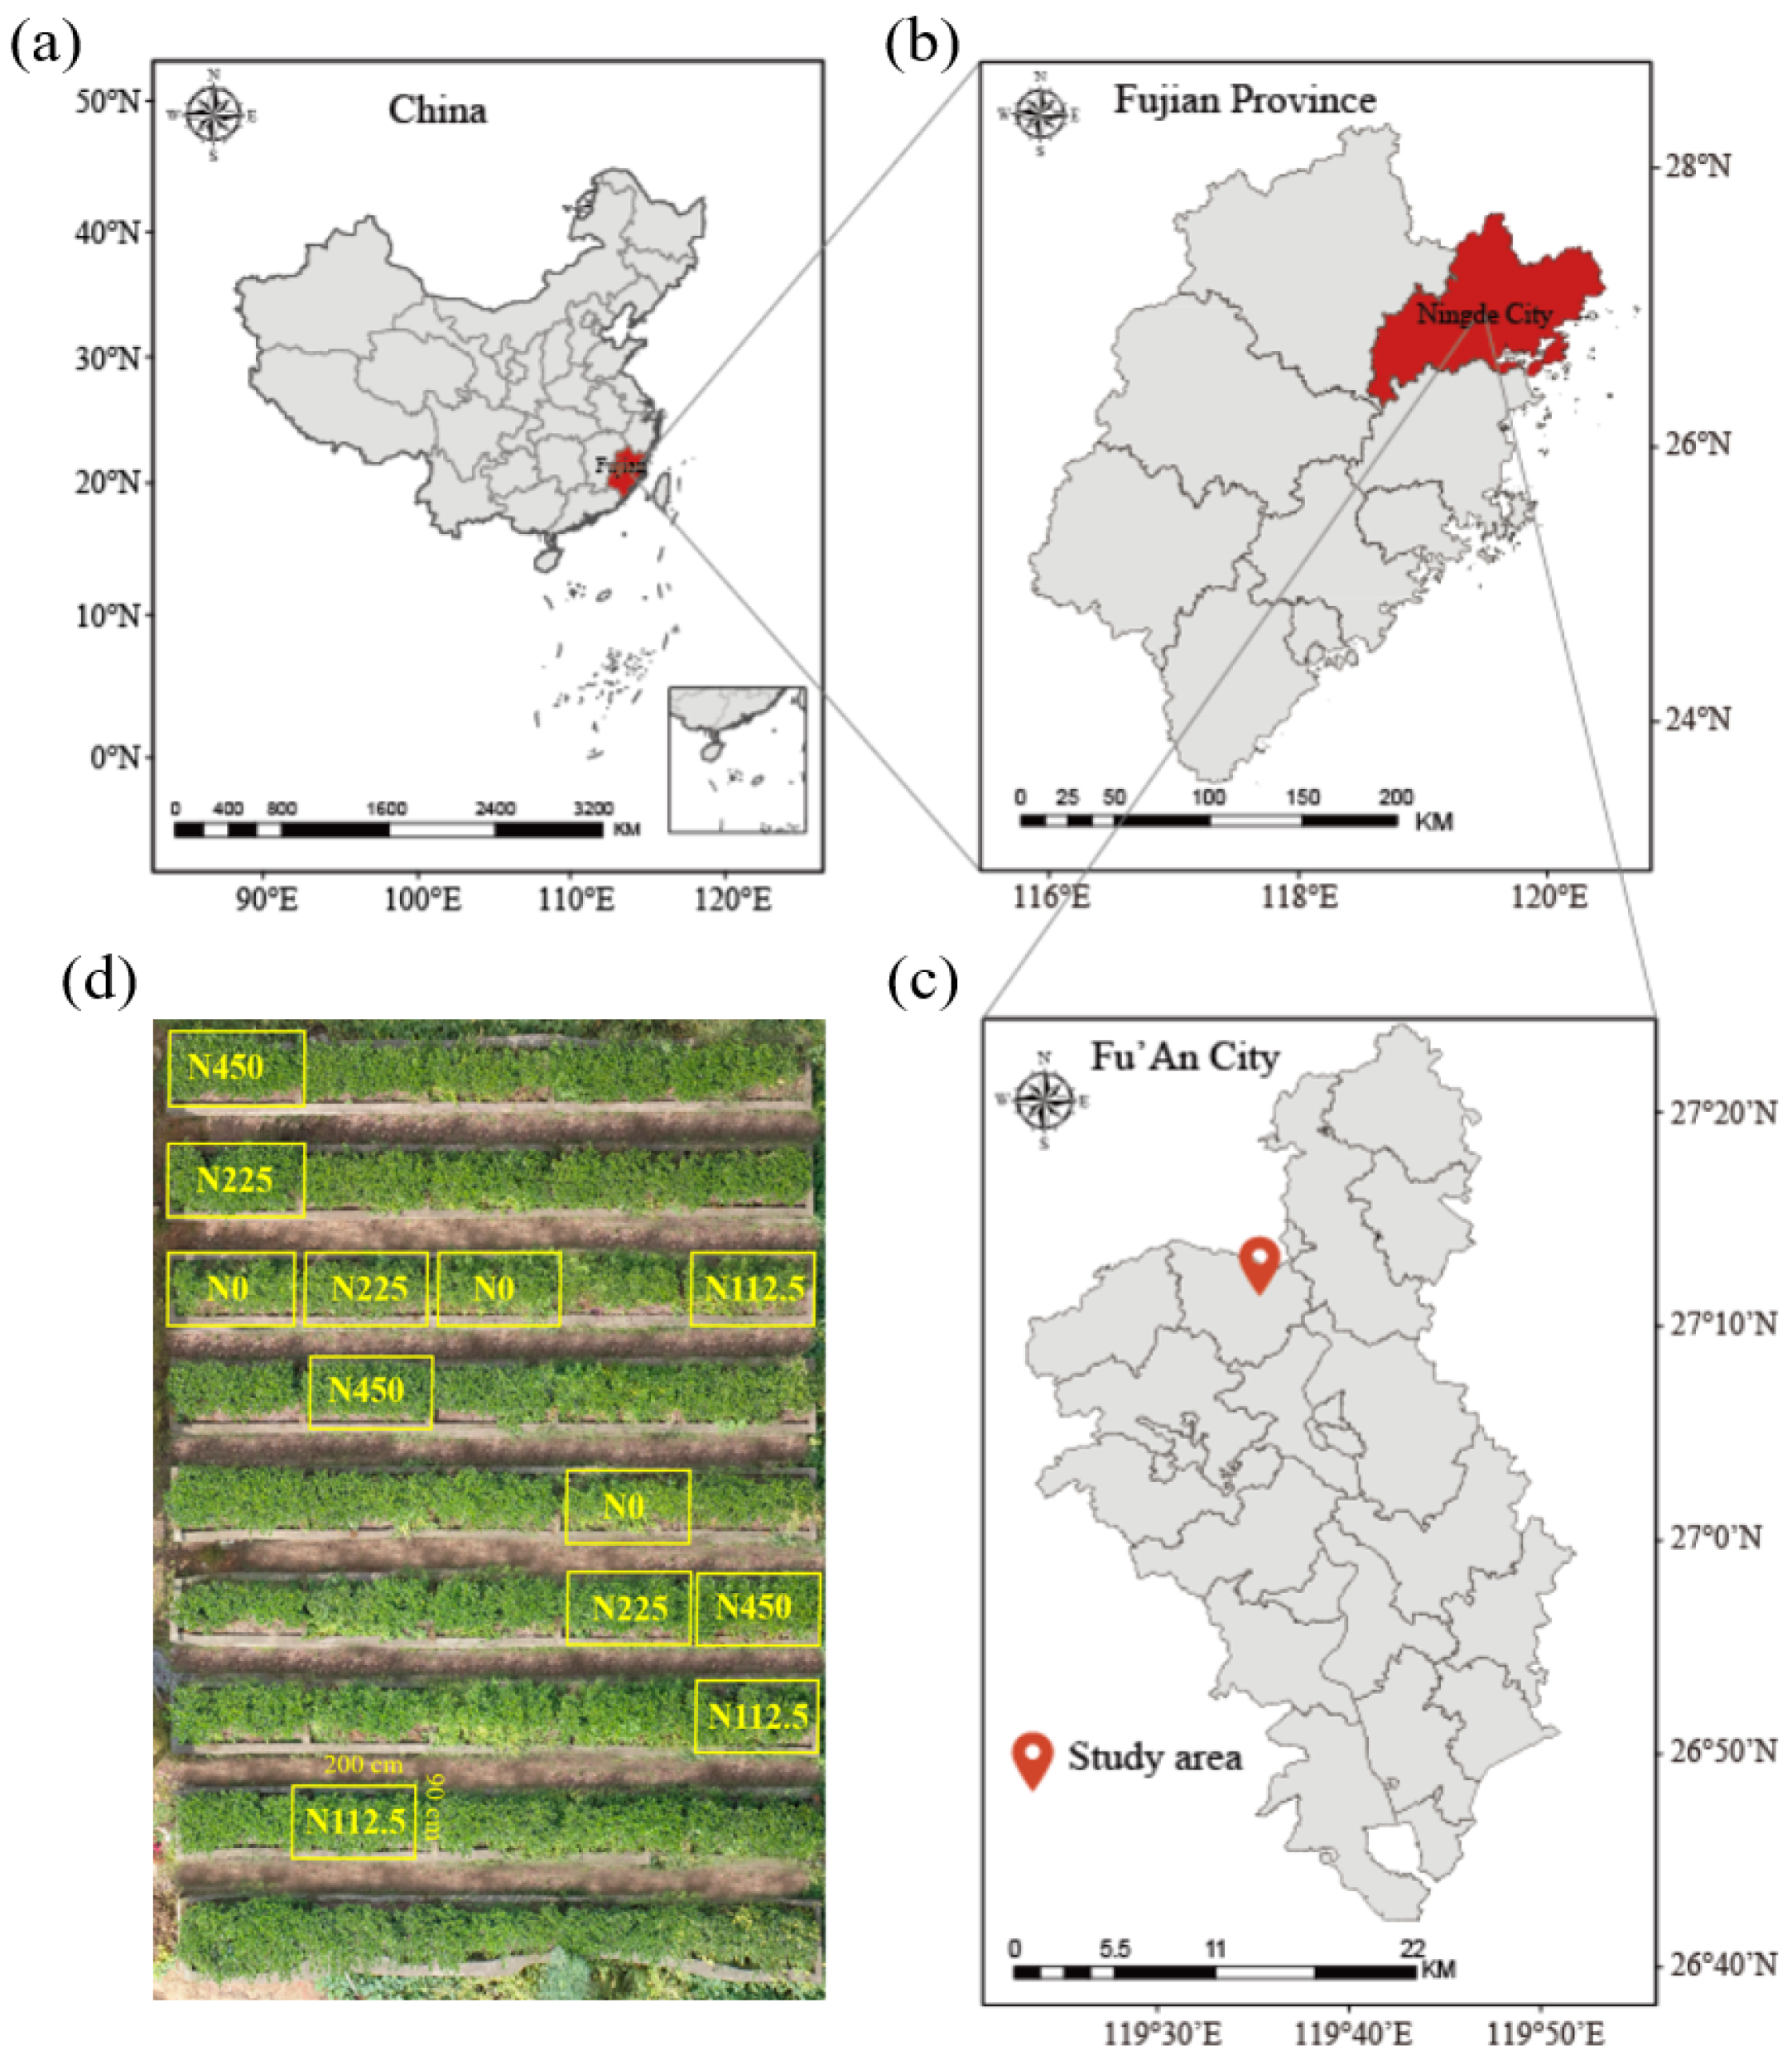
Figure 1. Geographic coordinates of the study area and the experimental design. (a) map of China, (b) map of Fujian Province, (c) map of Fu’An City and (d) experimental plot.
Agronomy 15 00007 g001
Figure 2. Daily variations in average air temperature (°C) and precipitation (mm) for a tea plantation under different levels of N application during the whole experimental period (1 January 2023–31 December 2023). The meteorological data were obtained using a WS-MC01 compact automatic weather station installed on-site.
Agronomy 15 00007 g002
Figure 3. Seasonal variations in Tsoil (a) and WFPS (b) for a tea plantation under different N rates during the experimental period. The left panels indicate the dynamic variations of Tsoil and WFPS with seasons, while the right panels indicate Tsoil and WFPS changes under different N rates. Error bars represent the standard errors (n = 3). The vertical arrows indicate the timing of fertilization. Lowercase letters above the bars indicate significant differences in Tsoil and WFPS among N rates, based on Tukey’s post hoc.
Agronomy 15 00007 g003
Figure 4. Variations in soil pH (a), NH4+-N (b), and NO3-N (c) in the soil with fertilization during the experimental period. The left panels indicate the dynamic variations of soil pH, NH4+-N, and NO3-N content with seasons, while the right panels indicate soil pH, NH4+-N, and NO3-N contents under different N rates. Error bars represent the standard errors (n = 3). The vertical arrows indicate the timing of fertilization. Lowercase letters above the bars indicate significant differences in soil pH, NH4+-N, and NO3-N among N rates, based on Tukey’s post hoc test (p < 0.05).
Agronomy 15 00007 g004
Figure 5. Variations in N2O flux and cumulative N2O emission during the experimental period. The insert panel displays the cumulative N2O emissions under different levels of N application. Error bars represent the standard errors (n = 3). The vertical arrows indicate the timing of fertilization. Lowercase letters above the bars indicate significant differences across different N rates, based on Tukey’s post hoc test (p < 0.05).
Agronomy 15 00007 g005
Figure 6. The response of tea yield to four different N rates. (a) Bar plots show ANOVA results of the effect of N rates on tea yield. Tea data shown are mean ± standard error (SE; n = 3); lowercase letters above the bars indicate significant differences (p < 0.05). (b) Trend lines show the linear regressions of tea yield against N rates, and the gray shading represents 95% confidence intervals.
Agronomy 15 00007 g006
Figure 7. The relationship between N2O flux, N rates, Tsoil, WFPS, soil pH, NH4+-N, and NO3-N. (a) Heatmap shows relationship between N2O flux, N rates, Tsoil, WFPS, soil pH, NH4+-N, and NO3-N. * p < 0.05, ** p < 0.01. (b) Random forest modeling reveals the key factors influencing N2O flux. The %IncMSE stands for “the increase in the mean square error”, and R2 refers to the model’s goodness of fit. The star above the bars indicates that the factor significantly influenced N2O flux, ** p < 0.01.
Agronomy 15 00007 g007
Table 1. The yield-scaled N2O emissions (YSNE) and direct N2O emission factors (EF; %) for a tea plantation under different levels of N application during the experimental period.
N Application Rates
(kg N ha−1 yr−1)
YSNE
(gN2O-N kg−1 tea)
N2O-EF
(%)
01.03 ± 0.06 ab
112.50.54 ± 0.04 c0.35 ± 0.07 b
2250.88 ± 0.1 b0.71 ± 0.09 a
4501.11 ± 0.02 a0.73 ± 0.01 a
ANOVA
F-value16.6910.53
p-value<0.01<0.05
Values are shown as means ± standard errors (n = 3). Different lowercase letters indicate significant differences among treatments according to Tukey’s post hoc test (p < 0.05).
Disclaimer/Publisher’s Note: The statements, opinions and data contained in all publications are solely those of the individual author(s) and contributor(s) and not of MDPI and/or the editor(s). MDPI and/or the editor(s) disclaim responsibility for any injury to people or property resulting from any ideas, methods, instructions or products referred to in the content.