Article

Estimation of Soil Evaporation in Apple Orchards Based on Hydrogen and Oxygen Isotopes

1
Sichuan Academy of Eco-Environmental Sciences, Chengdu 610041, China
2
Sichuan Province Engineering Technology Research Center of Emerging Contaminants Treatment and Environmental Health, Chengdu 610041, China
3
Sichuan Academy of Water Conservancy, Chengdu 610041, China
4
Institute of Water-Saving Agriculture in Arid Areas of China, Northwest A&F University, Xianyang 712100, China
*
Author to whom correspondence should be addressed.
Agronomy 2025, 15(1), 6; https://doi.org/10.3390/agronomy15010006
Submission received: 31 October 2024 / Revised: 28 November 2024 / Accepted: 23 December 2024 / Published: 24 December 2024

Abstract

:
Accurate estimation of soil evaporation and plant transpiration is crucial for the scientific and effective management of water resources in apple orchards. Using apple orchards of varying ages as research subjects, the Craig–Gordon model was employed to quantitatively estimate the soil evaporation loss rate, and water balance analysis was utilized to differentiate between soil evaporation and plant transpiration. This study analyzed the effects of extreme precipitation on soil evaporation in apple orchards of varying ages. The results indicated the following: All stable isotopic compositions of soil water fell within the lower right region of the Local Meteoric Water Line, and extreme precipitation reduced the intercept of the Evaporation Trend Line in apple orchards of varying ages. Soil evaporation loss rates in 2021 and 2022 ranged from 13% to 24% and from 14% to 18%, respectively. In 2022, the soil evaporation of apple orchards of 12 y, 15 y, 19 y and 22 y was measured at 123, 77, 129 and 143 mm, respectively, indicating negative correlation (R = −0.75) between soil evaporation and the leaf area index. The corresponding plant transpiration levels were 617 mm, 552 mm, 522 mm and 330 mm, indicating a linear negative correlation between plant transpiration and age (R = −0.92). These results are helpful to guide the scientific development of irrigation systems for apple orchards and provide a reference for enhancing apple yield and promoting the sustainable development of the apple industry.

1. Introduction

Evapotranspiration (ET) is the process by which water is transferred to the atmosphere in the form of water vapor by plant transpiration (Tr) and soil evaporation (SE) through open surfaces (including oceans, lakes, rivers, plant and soil surfaces, etc.) [1].
Plant transpiration is the biological process of water transport within plants, primarily influenced by atmospheric water demand. When soil moisture is insufficient, it can significantly hinder transpiration, adversely affecting vegetation productivity and threatening plant survival during periods of hydrologic stress [2,3]. Soil evaporation is the physical process of water moving from the soil to the atmosphere. As an integral component of the soil hydrological cycle, soil evaporation not only impacts soil water levels but also serves as an essential indicator of plant drought stress [4,5]. Both plant transpiration and soil evaporation represent varying aspects of water loss—transpiration reflects the biological loss, while evaporation signifies the physical loss [6].
At present, there are many methods to evaluate soil evaporation, such as the vorticity correlation method, the infrared remote sensing method and the lysimeter method [7,8,9]. The vorticity correlation method is used to obtain water flux through the measurement of wind speed, gas concentration and water pulsation, a method widely used in the observation of ecosystem carbon flux [10]. The infrared remote sensing method can be used to calculate the terrestrial evocation through parameters such as soil reflectance and surface spectrum observed by satellite or UAV remote sensing; this approach has the advantages of a large measurement area, economy and efficiency [11]. The lysimeter method is a direct measurement technique for quantifying changes in soil water flux, encompassing the utilization of drainage and water table lysimeters as well as weighing procedures [12]. The measuring instrument has high sensitivity and a simple principle and is often used for real-time monitoring of soil evapotranspiration or evaporation at the field scale. The wide use of the above methods has greatly promoted the progress of research into soil evaporation and other related research.
However, while the soil evaporation process itself has been extensively studied, it is still a challenge to accurately quantify the amount and dynamics of soil evaporation in specific ecosystems, such as apple forests in the Weibei arid tableland of the Loess Plateau. Soil evaporation and plant transpiration are often intertwined and difficult to distinguish directly, which makes it particularly difficult to accurately estimate understory soil evaporation, and that is especially the case in complex understory environments. Therefore, determining how to accurately calculate the soil evaporation and study the evolution law of soil evaporation has important practical significance for the evaluation and management of orchard water use in arid areas.
Stable hydrogen and oxygen isotopes as the basic components of water molecules [13] are ideal tracers to describe the source and destination of water [14]. In the continuous interface between soil and the atmosphere, evaporation will not only lead to the loss of soil moisture but also cause the fractionation of soil moisture isotopes [15] and change the composition ratio of stable hydrogen and oxygen isotopes of soil moisture [16]. Therefore, soil evaporation can be quantitatively estimated based on the principle of hydrogen and oxygen isotope fractionation. Unlike other methods, the hydrogen and oxygen stable isotope method is not affected by plant transpiration and can accurately describe the variation in soil evaporation flux. It also has the advantages of stability and reliability and can estimate soil evaporation on a long time scale with few sampling times [17].
Stable isotopes are powerful tools to quantify surface evapotranspiration components in arid areas, but the above studies are mostly based on bare soil or shallow roots such as grassland and agricultural land [18,19,20,21]. There are few studies on deep-rooted economic forests such as apple.
Therefore, in this study, the Craig–Gordon model was used to quantitatively estimate the soil evaporation loss rate of apple orchards before and after extreme precipitation, and the soil evaporation and plant transpiration amounts were obtained from the water balance equation. We sought to compare the effects of extreme precipitation on soil evaporation in apple orchards of varying ages, and analyze the soil evapotranspiration and plant transpiration, in order to further explore the water consumption law of apple orchards.

2. Materials and Methods

2.1. Study Area

The study area is situated in Changwu County, Shaanxi Province (Based on WGS84, 107°41′ E, 35°14′ N), in the central and southern regions of the Loess Plateau (Figure 1). It experiences an average annual temperature of 8.4 °C and an annual average precipitation of 533 mm. This region is characterized by a typical warm temperate, sub-humid continental monsoon climate [22,23]. The average altitude of the area is approximately 1230 m, with a deep soil layer primarily composed of Malan loess. The groundwater depth generally ranges between 30 m and 100 m [24]. The parent material predominantly consists of Malan loess, with the soil exhibiting a dry bulk density of 1.44 g/cm3, pH value of 8.34, organic matter content of 8.81 g/kg and total nitrogen content of 0.68 g/kg [22].
Over the course of 40 years of reform and opening up, China’s apple production soared from 2.27 million tons in 1978 to 44.5 million tons in 2017, an increase of 42.23 million tons according to the 2017 Global and Chinese Apple industry status survey and development prospects research report. During the same period, global apple production also rose from 33 million tons to 76.2 million tons, an increase of 43.2 million tons. The figures show that China has contributed almost entirely to the growth in world apple production. The Loess Plateau is an important apple ecological region in China. According to the China Statistical Yearbook, the area of apple cultivation in the region reached 1.22 million hectares, accounting for 58% of the total area of apple cultivation in China and 25% of the total area of apple cultivation worldwide [25]. In this context, since the 1990s, the Changwu Yuan region has actively promoted the development of the apple industry and committed to improving the planting scale and yield of apple. By 2020, the county’s apple planting area had expanded to 16,700 hectares, with an annual output of 338,000 tons [26]. However, about 85% of apple orchards on the Loess Plateau are more than 20 years old, and the yield and quality of apple trees gradually decrease with the increase in tree age.

2.2. Experimental Design

In this experiment, apple orchards of varying ages (12 y, 15 y, 19 y, 22 y) in Changwu Yuan were selected as the primary research subjects using the method of spatial–temporal exchange (Table 1). All apple varieties and field management practices were consistent across orchards.

2.3. Data Acquisition

2.3.1. Soil Sample Collection

In order to investigate the effects of extreme precipitation on soil water transport in apple orchards of varying ages in Changwu Yuan, soil samples were collected before (May 2021) and after (May 2022) an instance of extreme precipitation. Notably, the preceding rainy season concluded in October 2020, while the current rainy season had not commenced by May 2021. Consequently, the recharge of soil water from May 2021 to May 2022 primarily derived from rainfall during the rainy season of 2021, which was specifically analyzed as the extreme precipitation event in this study. The characteristics of soil water and isotopes at these two intervals were compared and analyzed to elucidate the impact of extreme precipitation on soil water transport within apple orchards of various ages in Changwu Yuan.
Soil samples were collected from the midpoints between four well-established trees, representing the average growth level for the entire orchard. A soil drill was employed to extract fresh samples at depths predetermined every 20 cm. A portion of each fresh sample was placed in an aluminum box for subsequent determination of soil moisture; another portion was sealed within a plastic bottle and transported back for refrigeration (−20 °C) prior to extraction for moisture analysis and isotope determination. The specific depths at which soil sampling occurred, along with the leaf area index and soil properties, are detailed in Table 2 and Table 3, respectively.

2.3.2. Precipitation Sample Collection

Precipitation serves as a crucial source for soil water recharge and plant water consumption in the study area [27]. In this research, precipitation isotope observation and collection points were established in Changwu Yuan (35°14′ N, 107°4′ E, 1200 m) to continuously gather local precipitation events from 2015 to 2021 and analyze the stable isotopic composition of hydrogen and oxygen. To mitigate the effects of evaporation fractionation on the isotopic composition of precipitation, an evaporation-proof precipitation collection device (Patent No: CN201620301350.6) was employed. This device ensured reliable accuracy in the precipitation isotope data obtained during this study [27]. The collected water samples were then promptly returned to the laboratory for determination of their stable isotopic composition of hydrogen and oxygen.

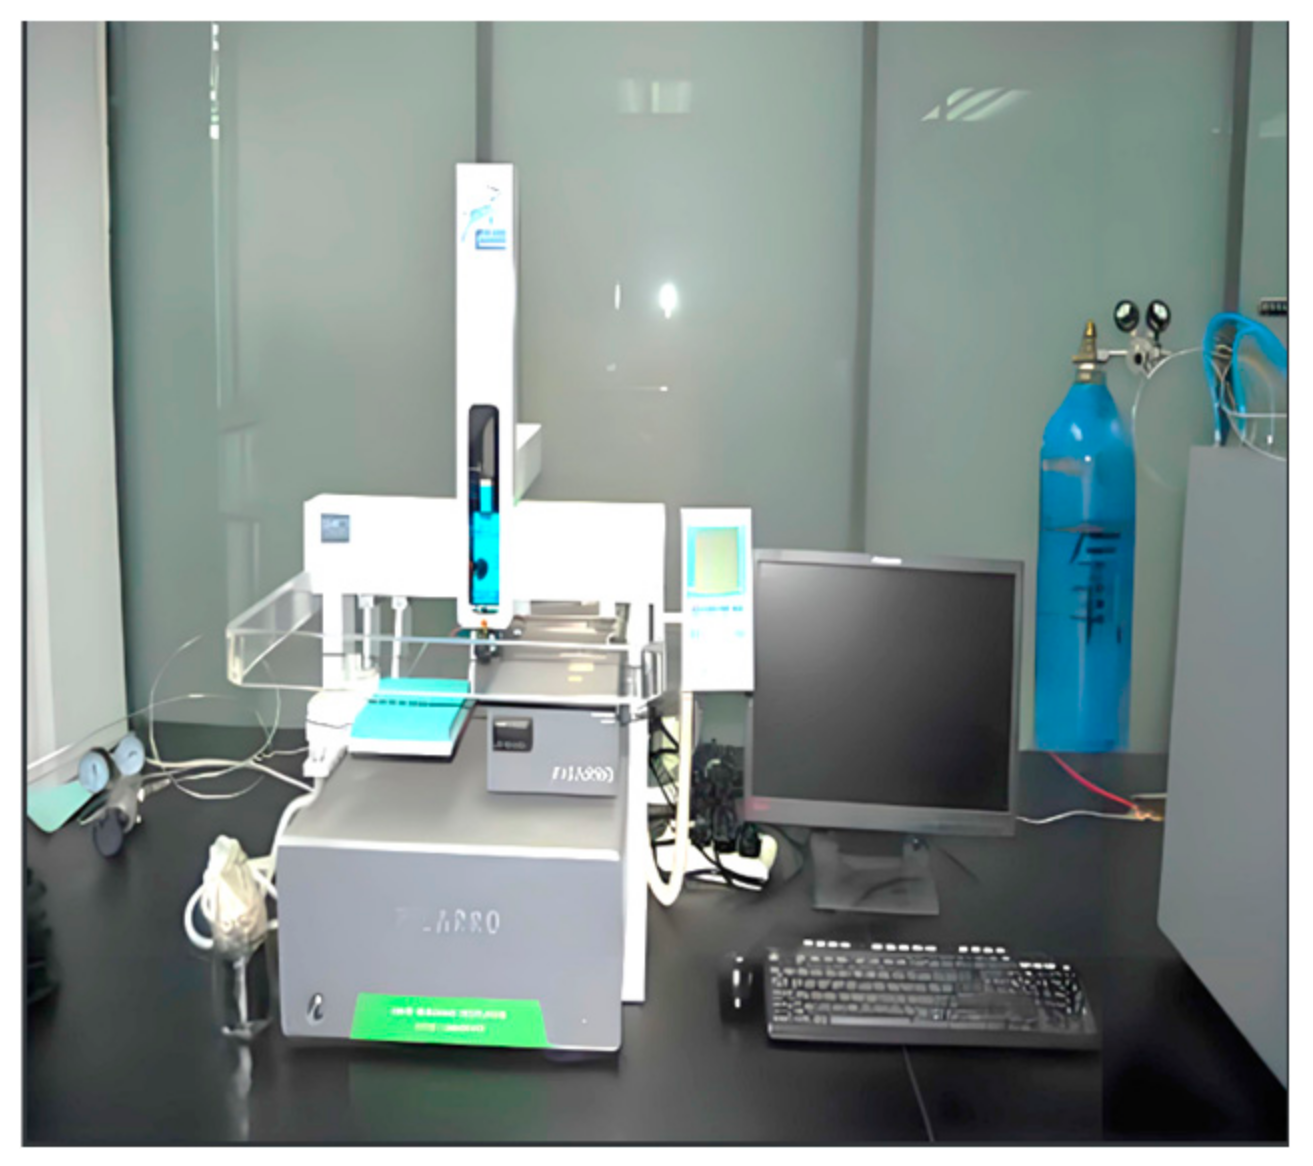
2.4. Determination of Stable Isotopes

The determination of stable isotopes is divided into two parts: moisture extraction and isotope analysis. Moisture was extracted from the samples by a cryogenic vacuum extraction system in the Tracer Hydrology Laboratory of the China Arid Regions Water-Saving Agricultural Research Institute, Northwest A&F University. When utilizing the extraction device, the sample is initially cryogenically frozen using liquid nitrogen and subsequently subjected to vacuum heating to ensure the complete removal of moisture from the sample. To guarantee a sufficient extraction of moisture, both the extraction and collection efficiencies are calculated. If both efficiencies are ≥99%, the extraction is deemed satisfactory; otherwise, repeated extractions of the sample will be conducted [28]. Following completion of the experiment, the extracted moisture was sealed in 25 mL glass bottles and refrigerated at 4 °C in order to prevent evaporation and isotopic fractionation.
The analysis of stable isotopes was also conducted in the Tracer Hydrology Laboratory of the China Arid Regions Water-Saving Agricultural Research Institute, Northwest A&F University. A laser water isotope analyzer (Figure 2) was employed as the testing instrument (LGR IWA-45EP, Los Gatos Research, Santa Clara County, CA, USA). The stable isotopes were measured with accuracies of ± 1% and ± 0.2%, respectively. The stable isotope expression is as follows [29]:
δ = R S a m p l e R S t a n d R S t a n d × 1000
where R S a m p l e and R S t a n d are the ratio of 2H/1H (or 18O/16O) between the sample to be tested and the reference standard water, respectively. The reference standard water is VSMOW2 seawater.

2.5. Linear Conditions’ Excess

The composition of isotopes of soil moisture is influenced by the combined effects of evaporation enrichment and precipitation infiltration, while water absorption by plant roots does not contribute to the enrichment of isotopes of soil moisture [30]. Evaporative fractionation results in increased isotopes, whereas non-fractionating inputs from precipitation lead to decreased isotopes. Therefore, the variation in isotopes of soil moisture can reflect the intensity and extent of interaction between evaporation and precipitation infiltration. The linear condition excess (Lc-excess) is quantified by measuring the distance between the 2H and 18O components of soil moisture and the Local Atmospheric Precipitation Line [31]. The expression can be formulated as follows:
l c e x c e s s = δ 2 H a δ 18 O b
where a and b represent the slope and intercept of the Local Meteoric Water Line (LMWL), respectively. According to this expression, the lc-excess of the precipitation isotope is 0, indicating that evaporation has not occurred. The lc-excess value of water samples after evaporation is usually negative, and the lower the negative value, the more intense the evaporation degree [32,33]. Therefore, a vertical variation in lc-excess value in the soil profile indicates an alternating variation in precipitation infiltration and soil evaporation, and the deep and shallow soil layers can be divided accordingly.

2.6. Soil Evaporation Loss Rate

In actual evaporation under natural conditions, the dynamic effect caused by molecular diffusion and the interaction and exchange factors between evaporation and isotopes of air water will affect isotope fractionation [34]. Based on the principle of isotopic mass balance, the Craig–Gordon model is applied to calculate the soil evaporation loss rate (f) in the open liquid–vapor isotope system. The formula is as follows:
f = 1 δ s δ * δ 0 δ * m
where δs represents the stable isotopes of soil moisture (‰) obtained through Equation (1). δ* and m represent the isotope enrichment limiting factor (‰) and enrichment slope, respectively, which are calculated according to the following formula [35]:
δ * = h * δ A + ε k + ε + / α + h 1 0 3 ε k + ε + / α +
m = h ( ε k + ε + α + ) × 10 3 1 h + ε k
where h represents atmospheric relative humidity (%), and δA represents the isotope of atmospheric water vapor (‰), which can be obtained according to the following recommended calculation formula [36]:
δ A = δ p k × ε + 1 + k × ε +
where εk represents the dynamic fractionation coefficient, and the calculation formulas for hydrogen and oxygen isotopes are as follows:
ε k ( 2 H ) = n × ( 1 h ) × 1 0.9755
ε k ( 18 O ) = n × ( 1 h ) × 1 0.9723
where n is the aerodynamic parameter of the liquid–gas interface during evaporation, which is usually 0.5 for saturated soil and 1.0 for very dry soil. Due to the influence of precipitation infiltration and soil evaporation, the surface soil often alternates between dry and wet. Therefore, the average value of parameter n in this paper is 0.75.
ε+ represents the average dry and wet conditions of the soil. T is the temperature (K), and the data of the national Basic Meteorological Observation station near the soil sampling point are selected. α+ is the equilibrium fractionation coefficient, and the formula is as follows [37,38]:
10 3 l n α + 2 H = 1158.8 T 3 10 9 1620.1   ( T 2 10 6 ) + 794.84 T 10 3 161.04 + 2.9992   ( 10 9 / T 3 )
10 3 l n α + ( 18 O ) = 7.685 + 6.7123 10 3 T 1.6664   ( 10 6 T 2 ) + 0.3504 10 9 T 3
ε + = α + 1
δ0 represents the stable isotopes of soil moisture origin (‰). This study selected the intersection method to determine the stable isotopes of soil moisture origin, that is, we considered that those corresponded to the intersection point of the Local Evaporation Line (LEL) and Local Meteoric Water Line. The calculation formula is as follows [39]:
δ 18 O 0 = I L E L b a S L E L
δ 2 H 0 = a × δ 18 0 0 + b
where a and b are the slope and intercept of the Local Meteoric Water Line, respectively, while SLEL and ILEL are the slope and intercept of the Local Evaporation Line. The theoretical method considering equilibrium fractionation and Rayleigh fractionation was used to calculate SLEL [36]:
S L E L = h δ A δ p + 1 + δ p ε k + ε + α + h ε k ε + α + 2 h δ A δ p + 1 + δ P ε k + ε + α + h ε k ε + / α + 18
where δP represents the stable isotopes in precipitation (‰), with ILEL obtained by fitting the stable isotope of soil moisture with SLEL.

2.7. Water Balance Analysis

Water balance analysis is a tool used in water resource management and to study the hydrological cycle [40]. The model is based on the principle of water conservation, which states that within a given space and time range, there must be a balance between the amount of water entering and the amount of water leaving. The basic water balance equation can be expressed as follows:
P E R = S
where P represents precipitation (mm), including rain and snow; E represents evapotranspiration (mm), that is, the amount of water returned to the atmosphere by soil evaporation and plant transpiration; R represents runoff (mm); and S represents changes in soil water storage (mm).
Evapotranspiration is a key concept in the study of water cycling and water resource management, involving water evaporation from the soil surface and evapotranspiration from plants [41]. To quantify this process, the following formula can be used:
S E + T r = E
where SE represents soil evaporation (mm), while Tr represents plant transpiration (mm).

3. Results and Analysis

3.1. Effect of Extreme Precipitation on Soil Evaporation in Apple Orchards

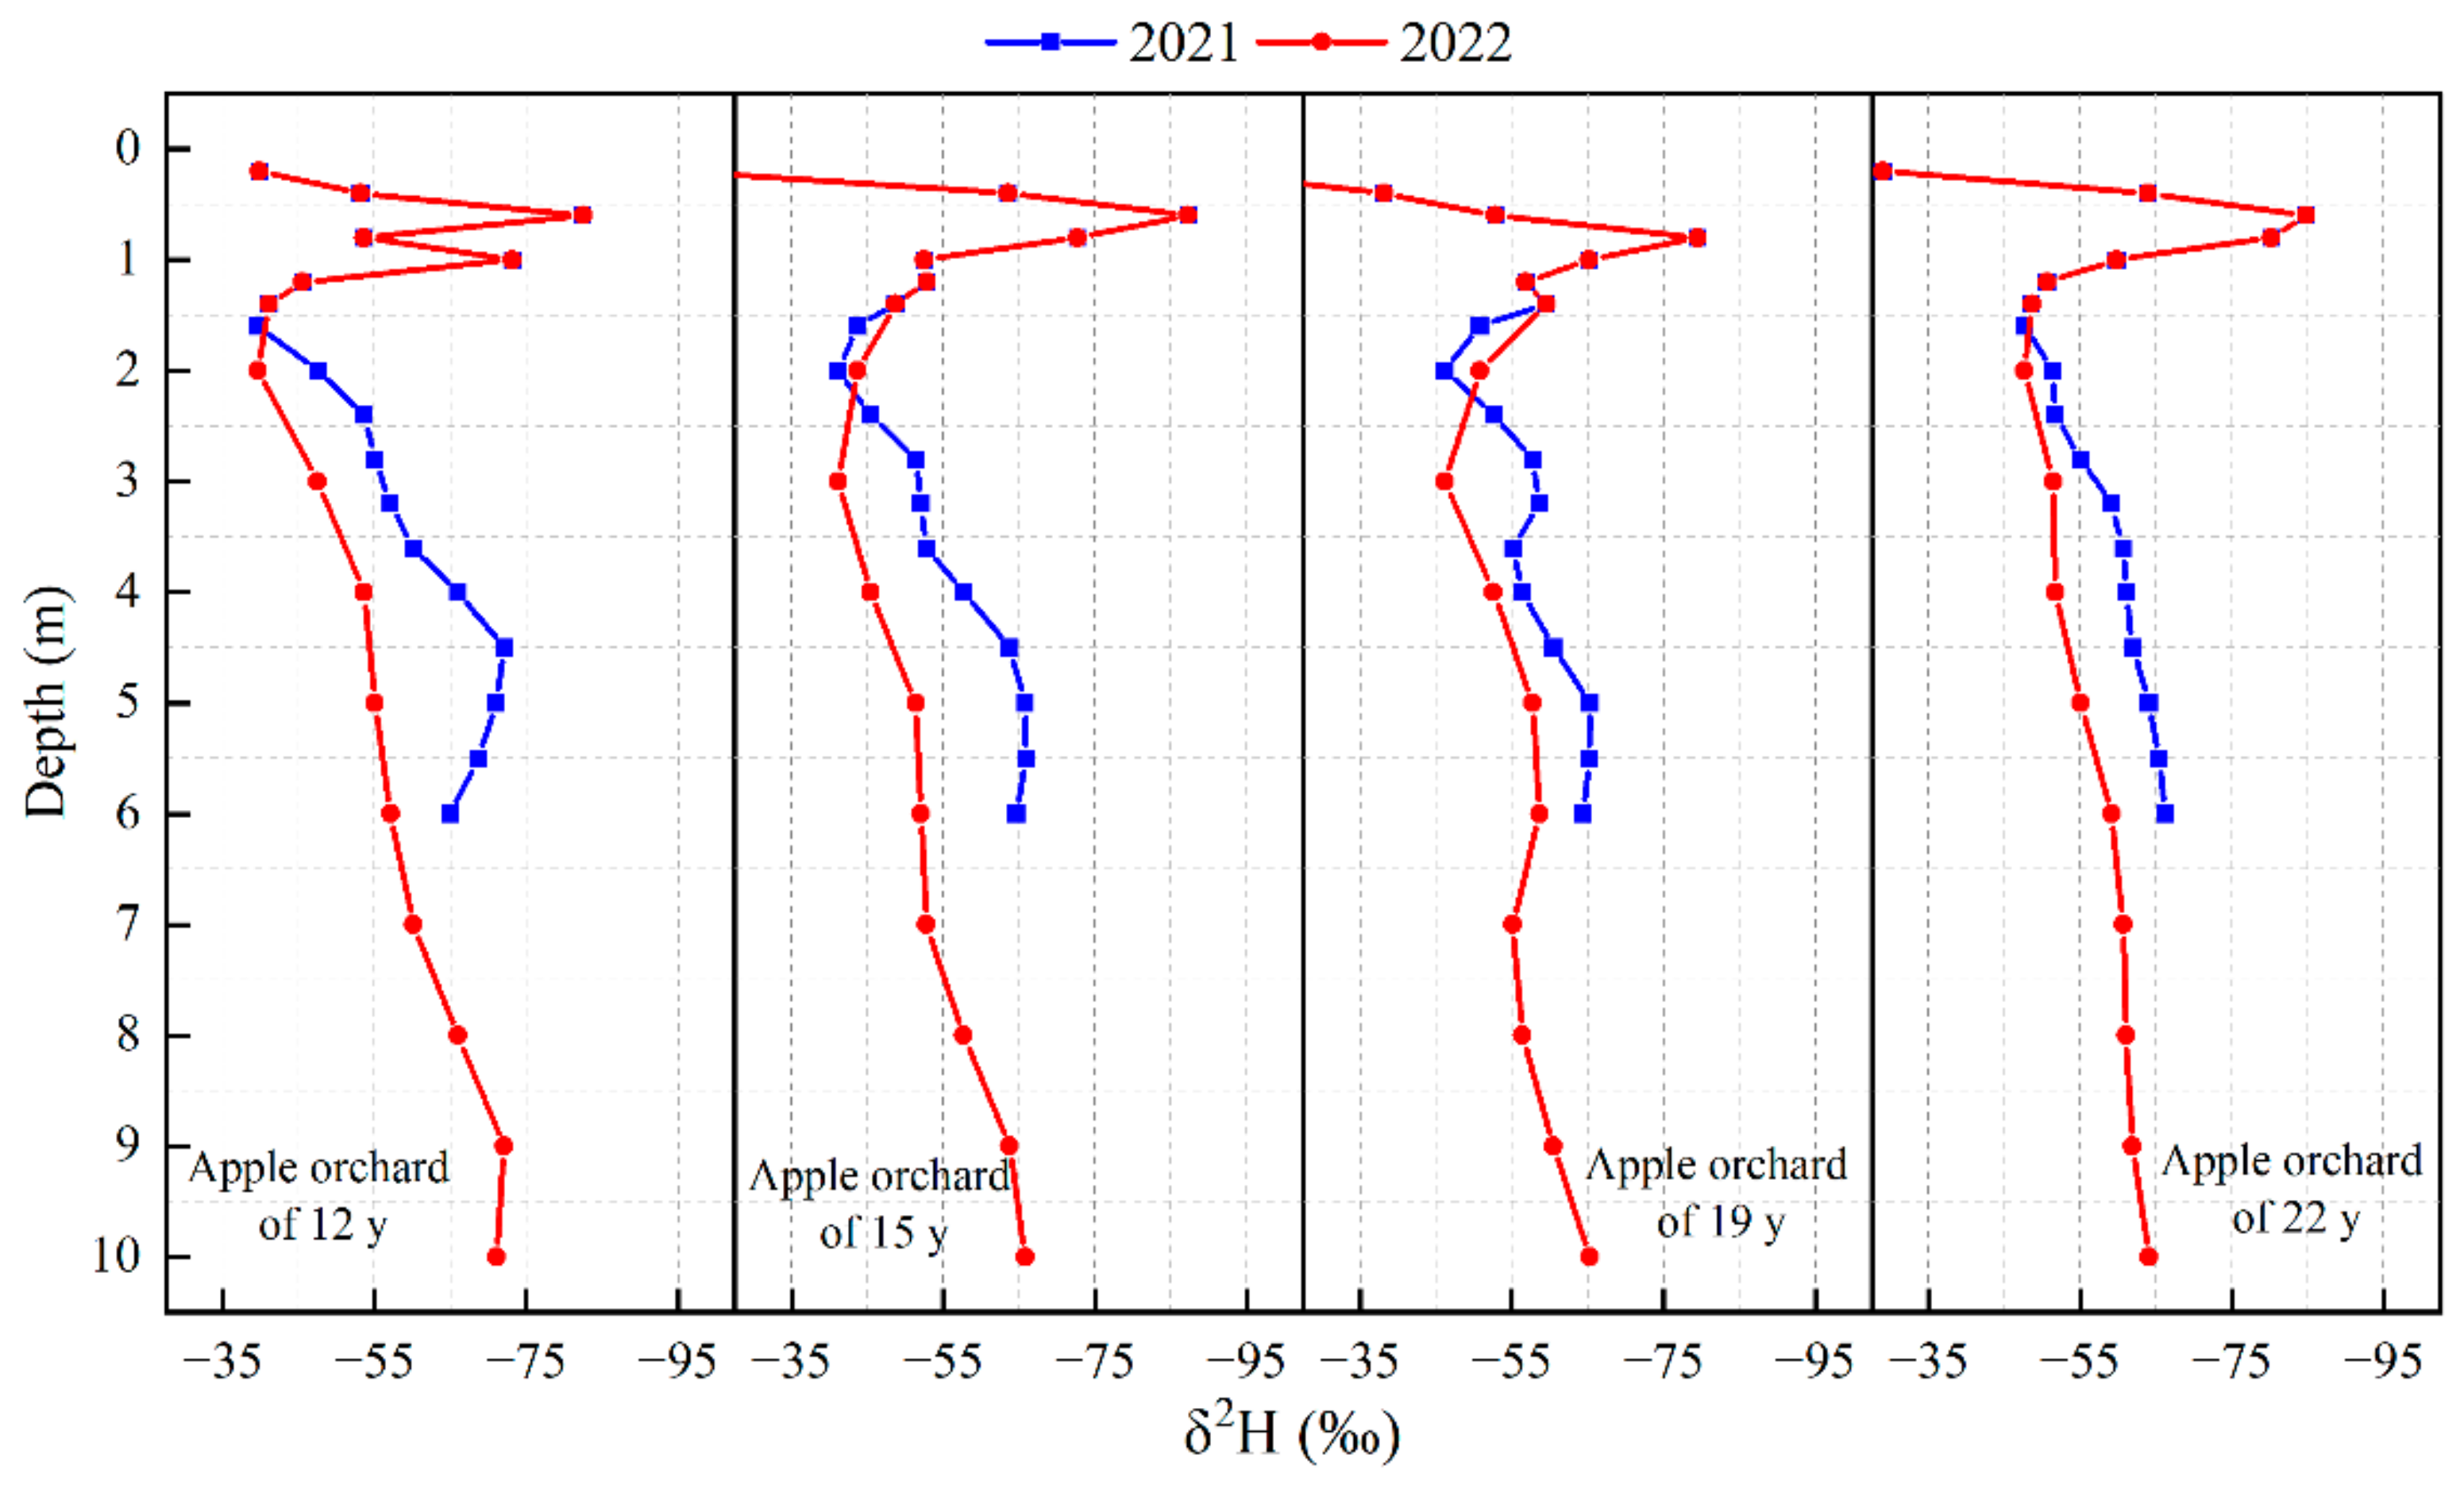
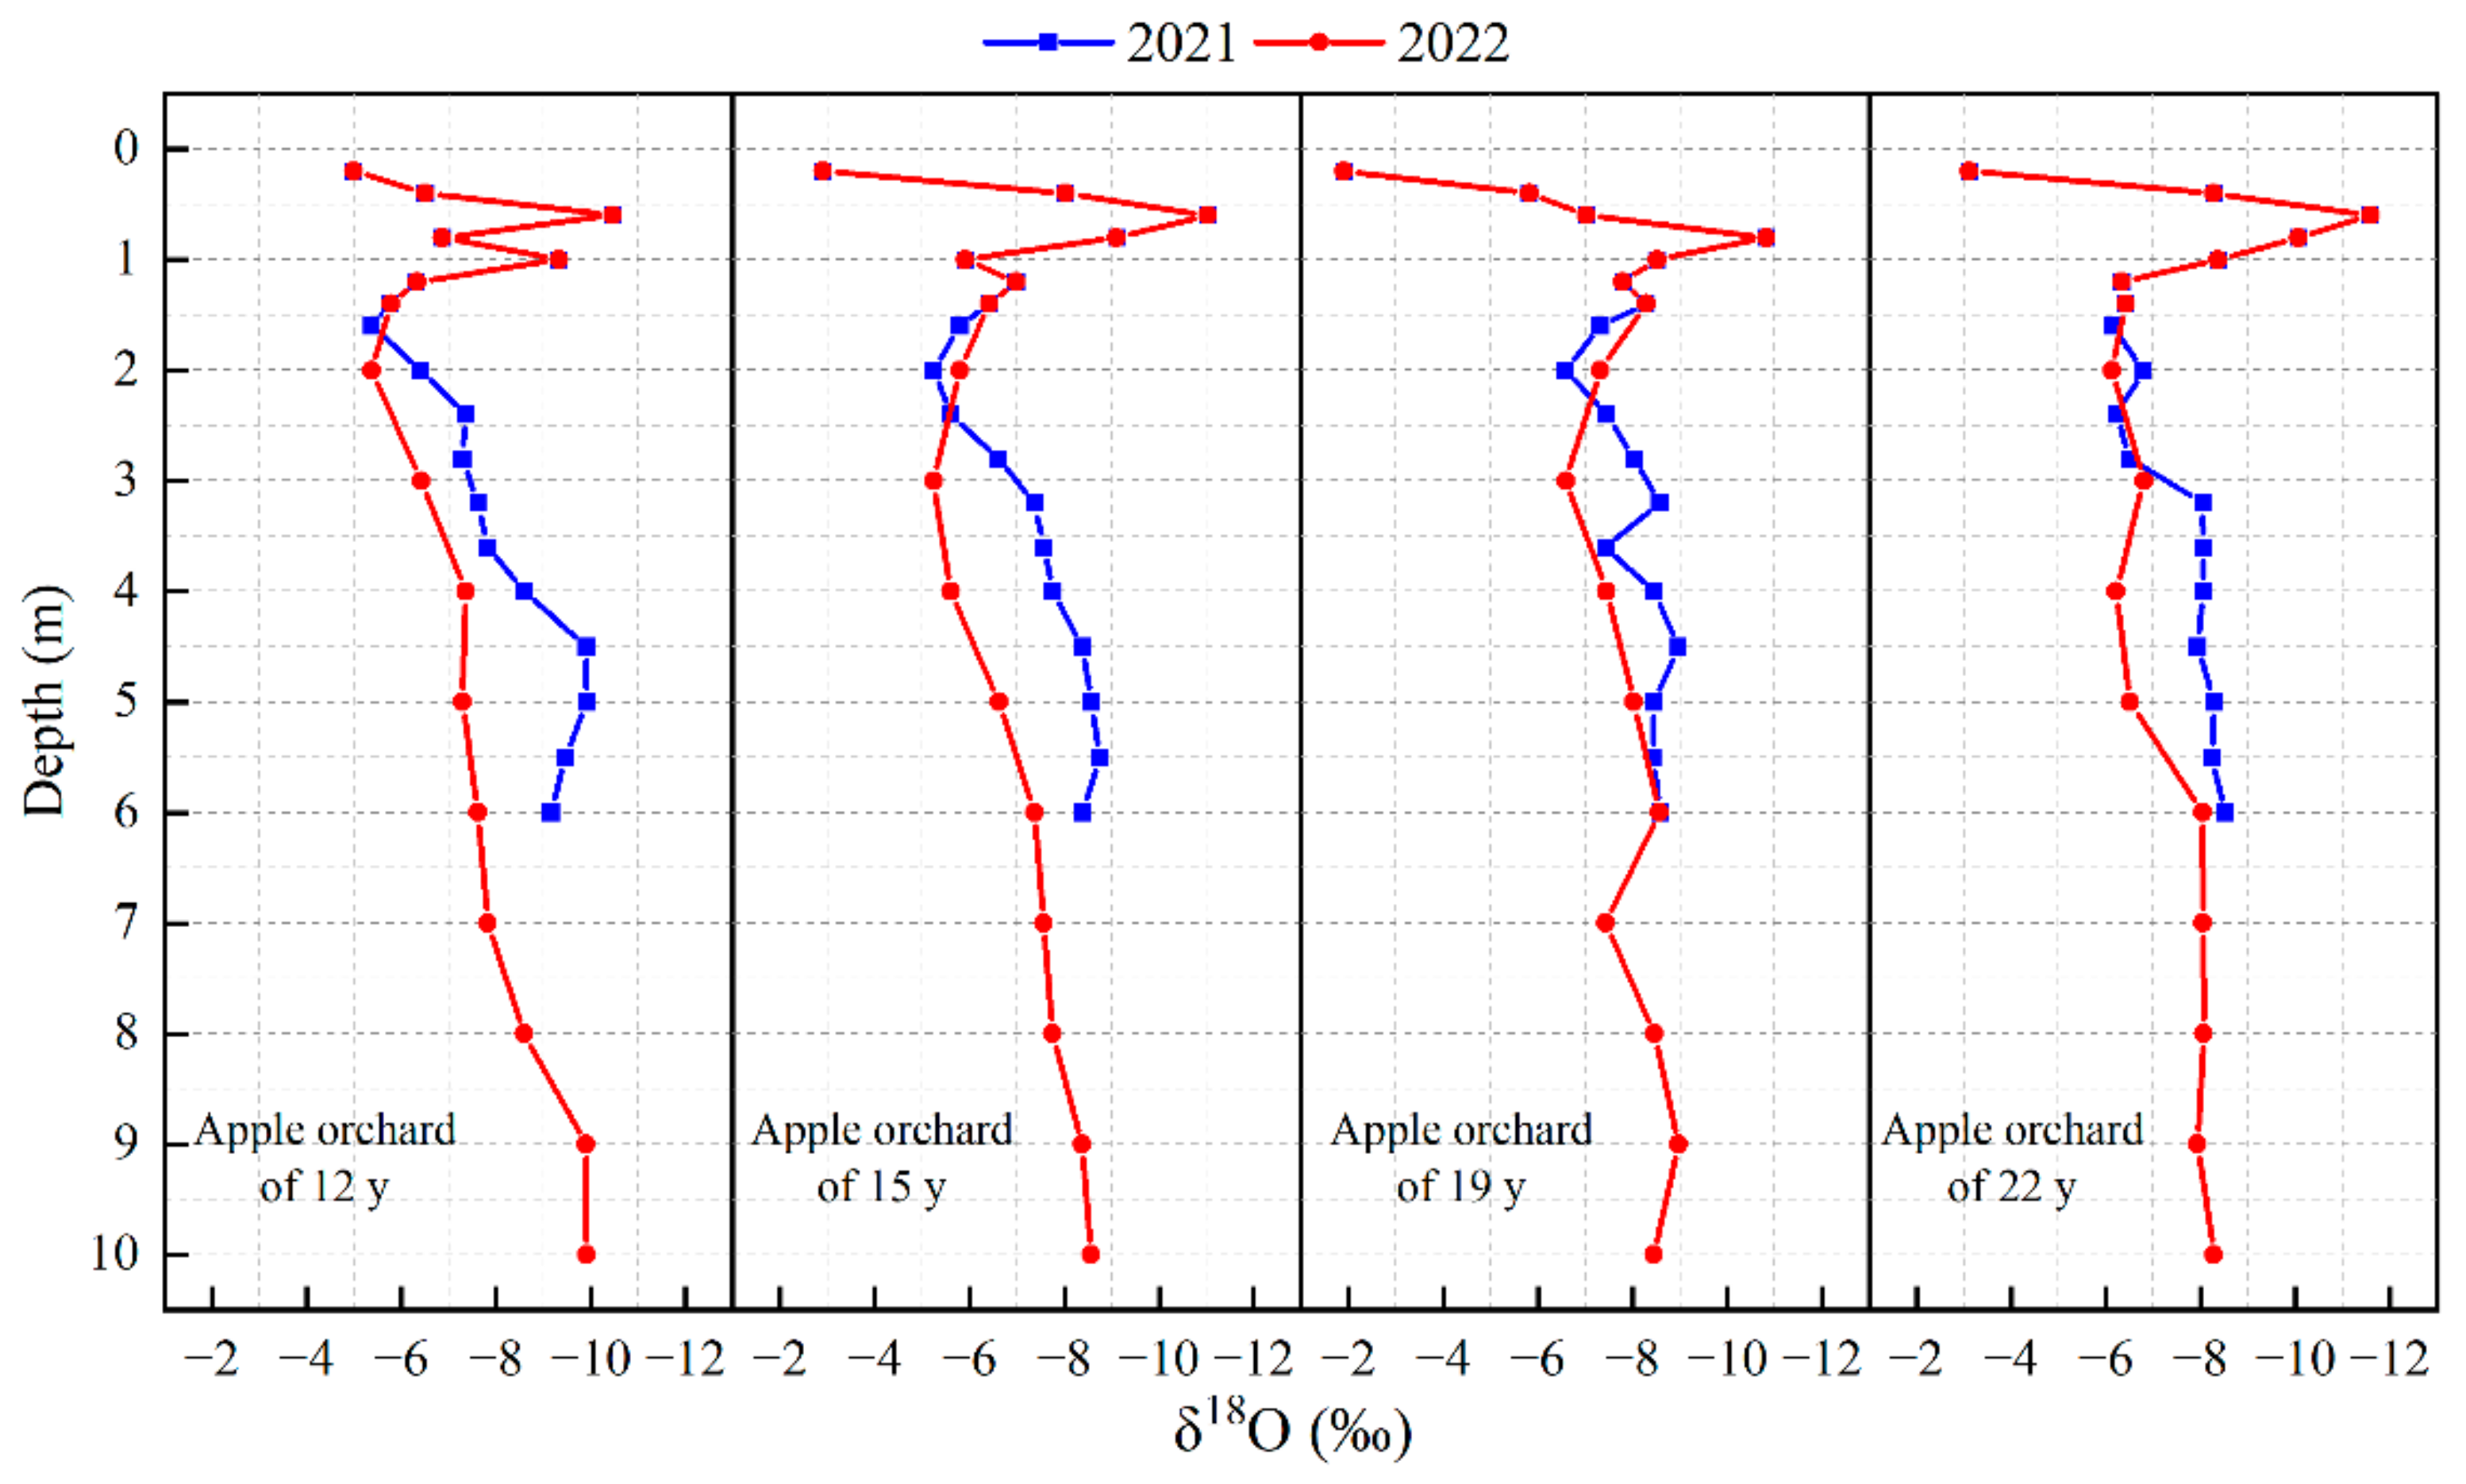
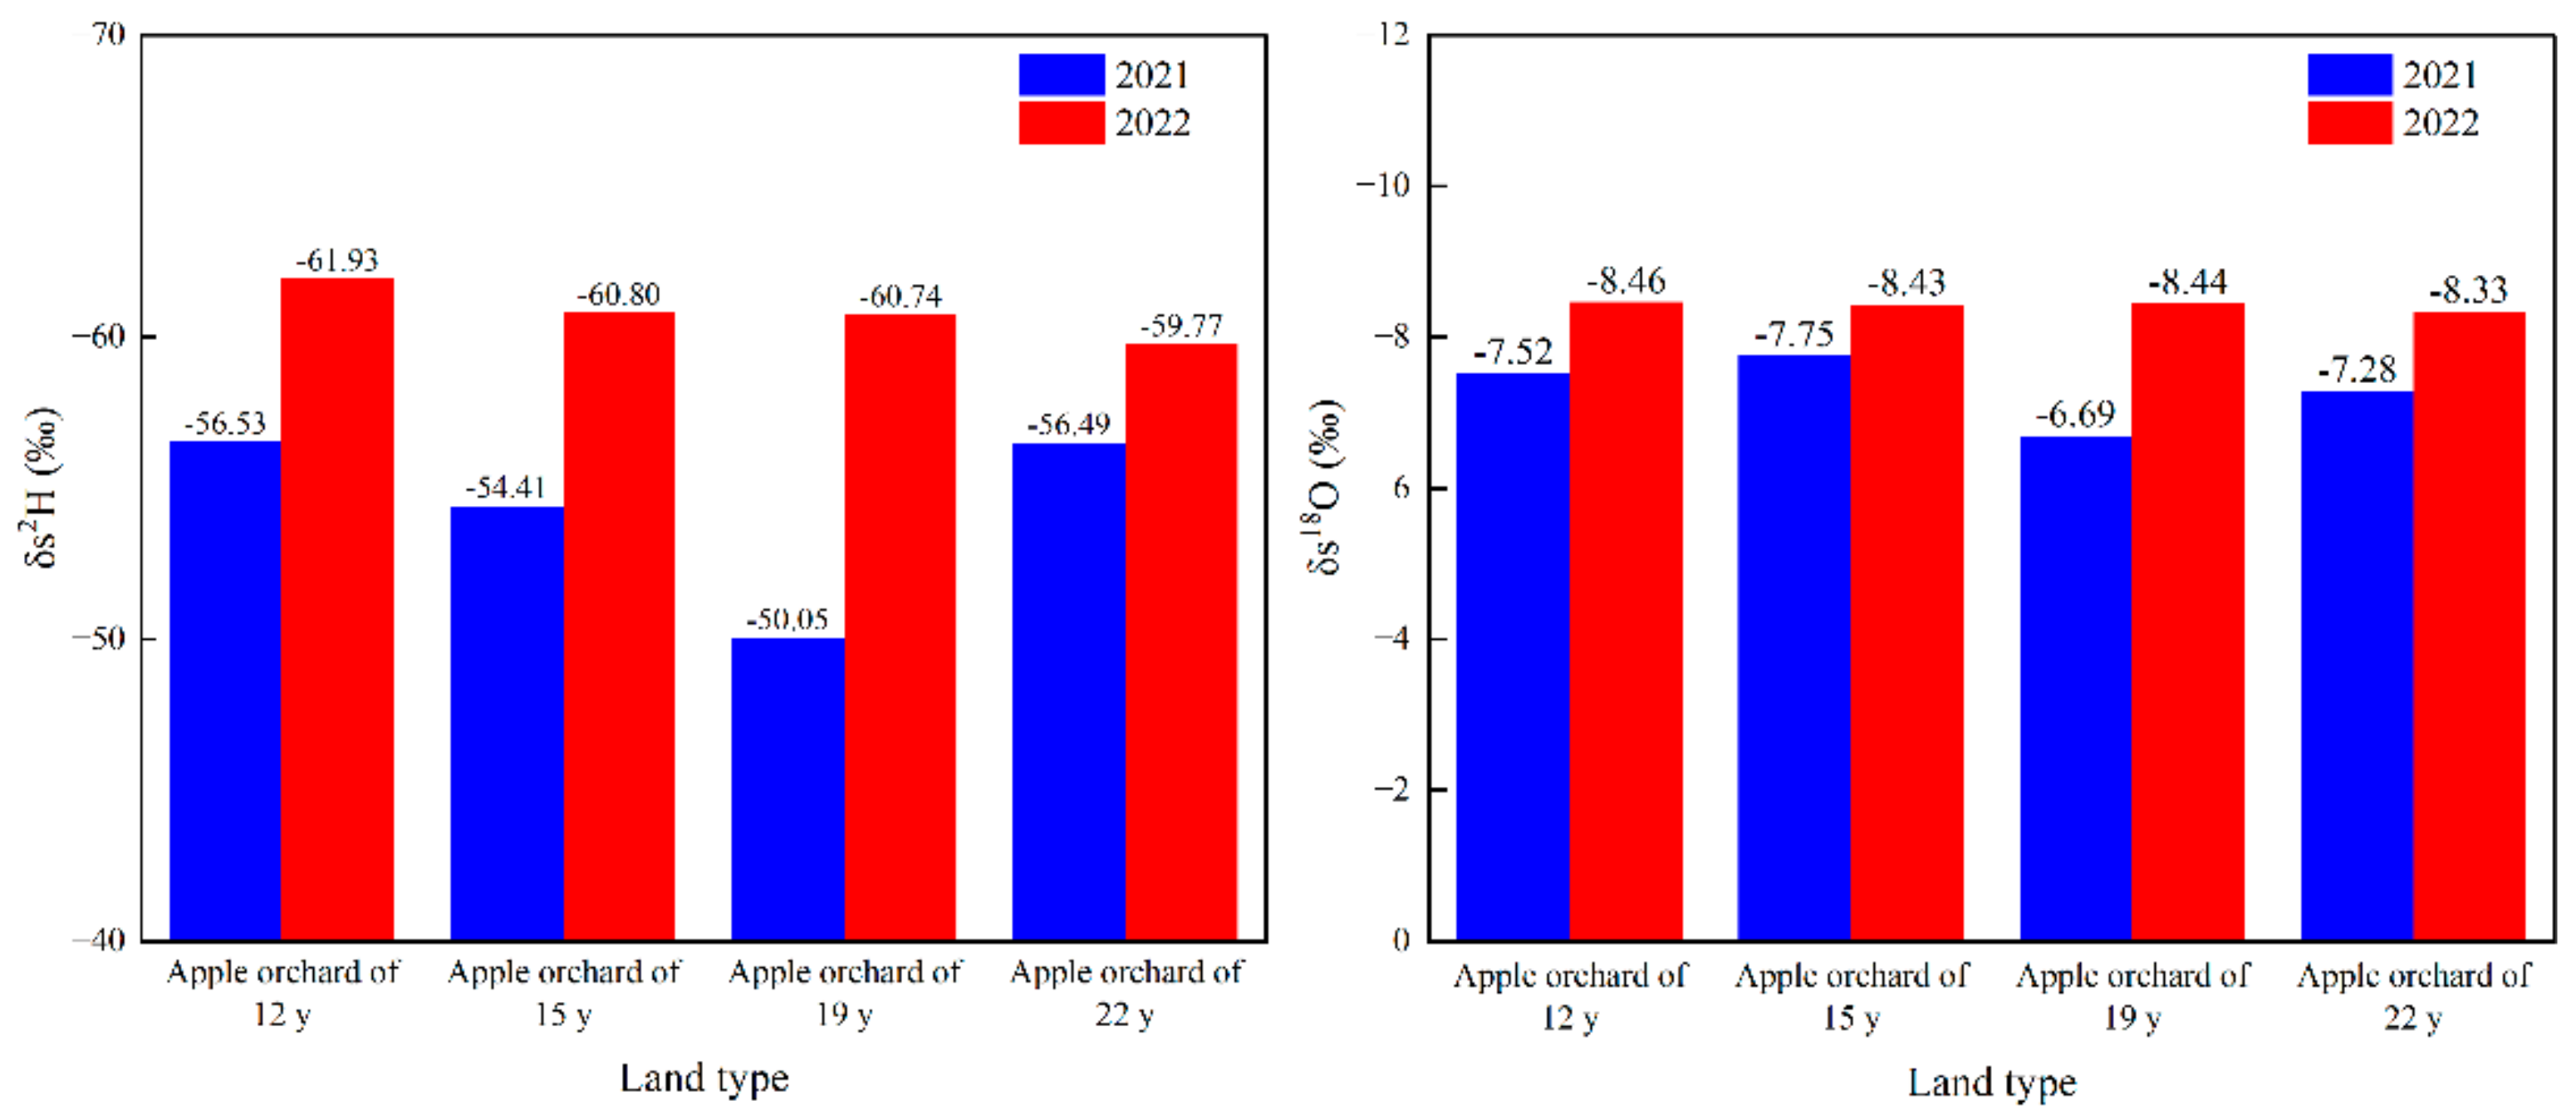
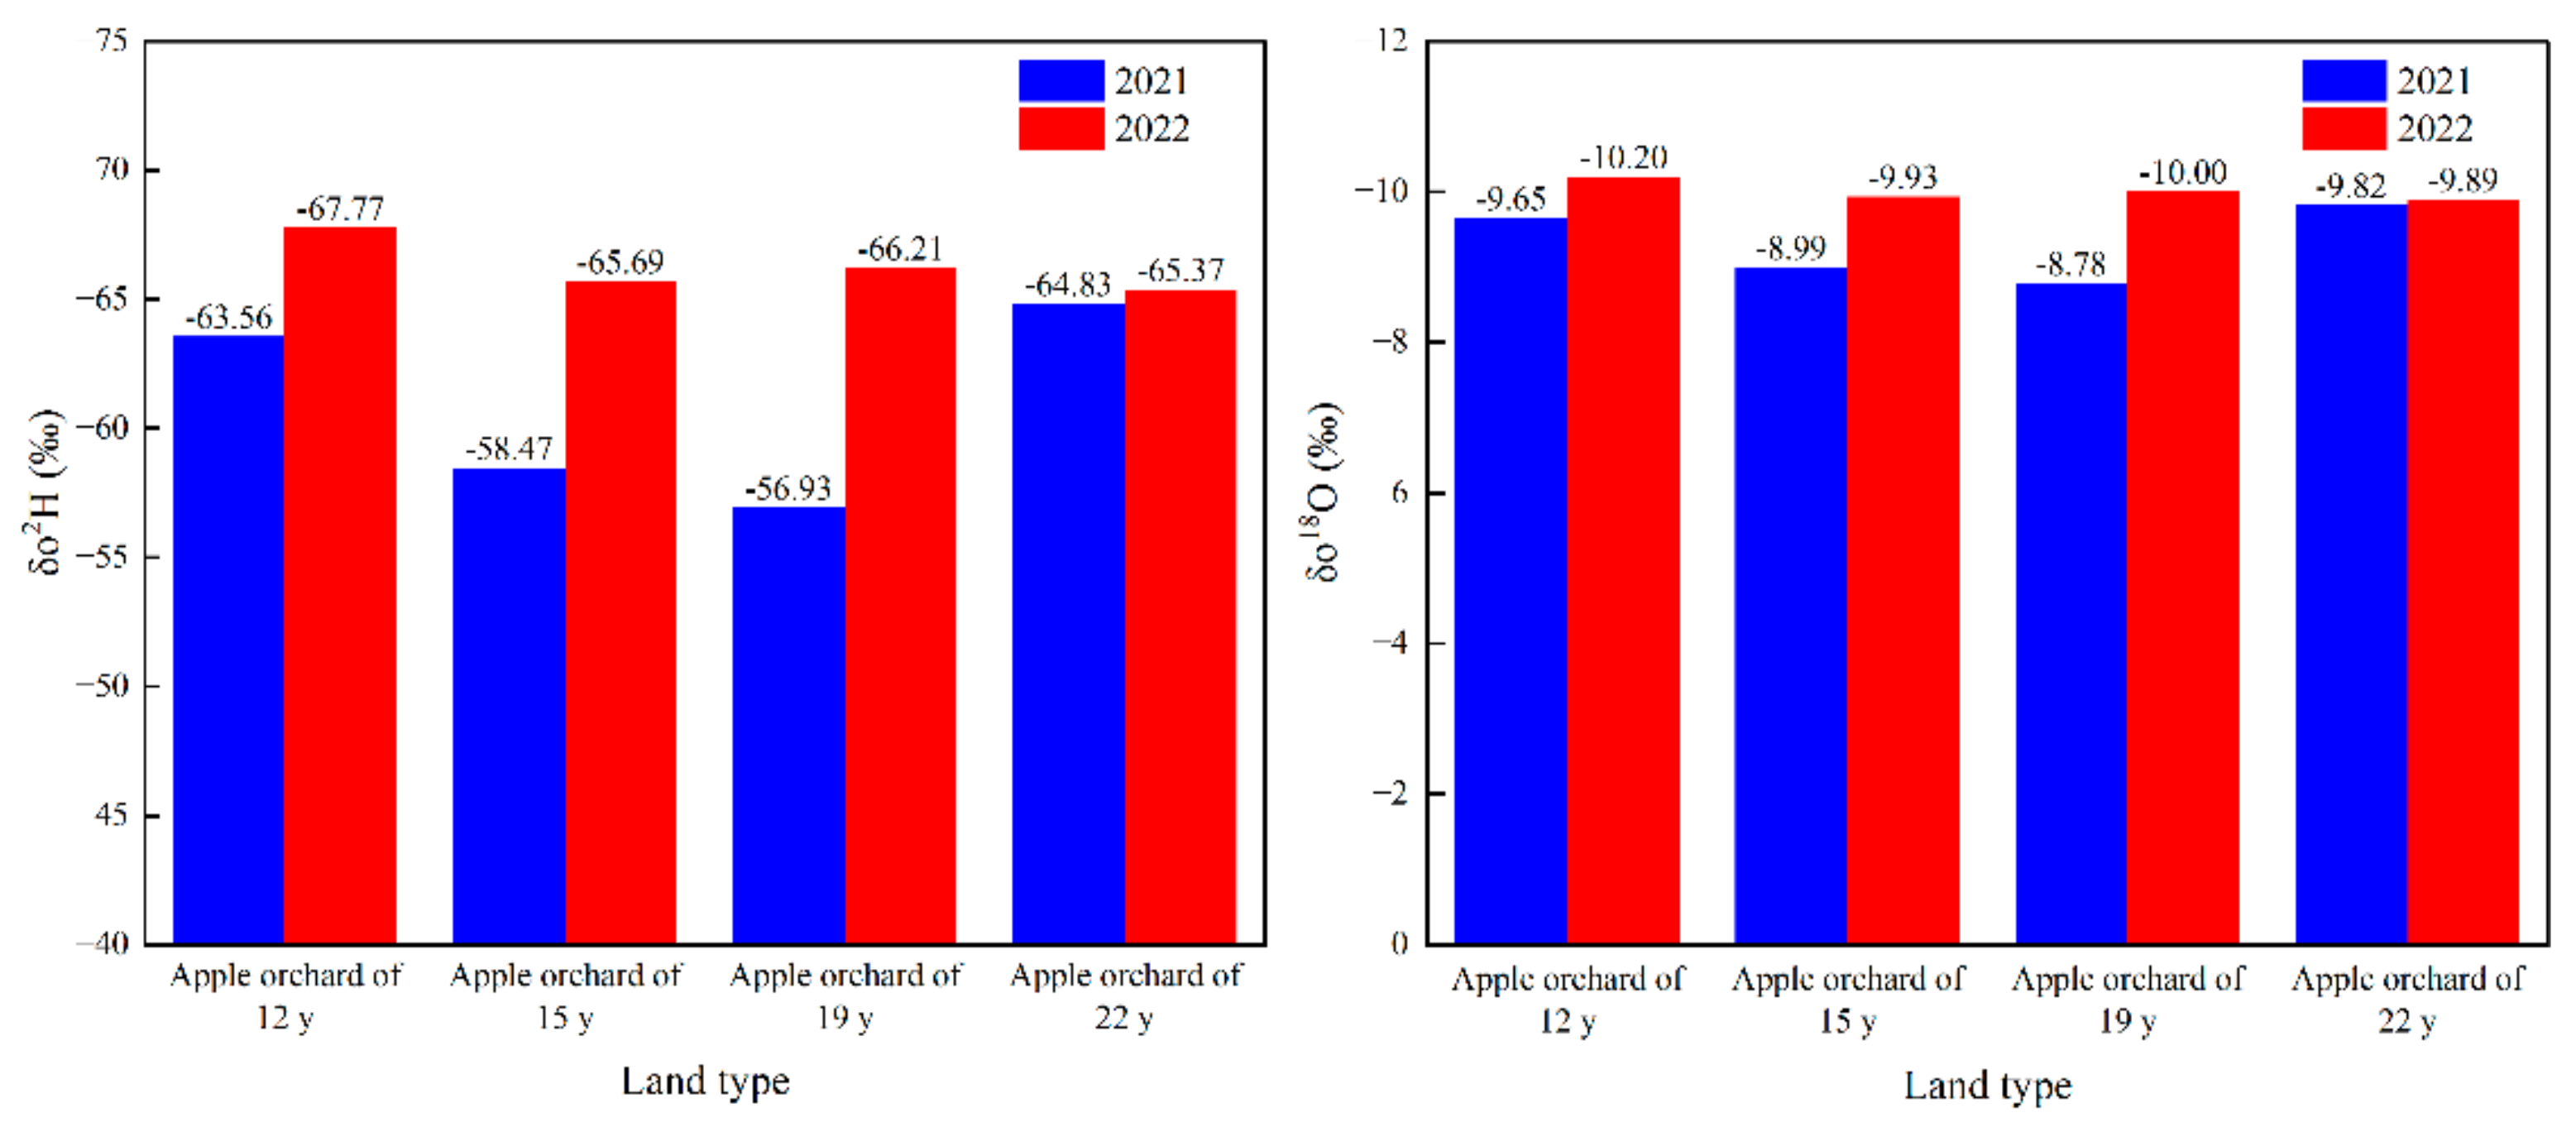
3.1.1. Trend of Stable Isotopes’ Characteristics with Age in Apple Orchards

The variations in δ2H with depth in 2021 and 2022 are depicted in Figure 3. As the soil depth increased, δ2H (represented by negative values) exhibited a general trend of initial decrease followed by a subsequent increase. Notably, the change in δ2H was particularly significant within the shallow soil range of 0.2 m to 2.0 m, characterized by a sharp decline phase followed by a rapid rise phase. Specifically, there was a rapid decrease in δ2H as the soil depth increased from 0.2 m to 0.6 m, which was then succeeded by a swift recovery as the soil depth further increased. Upon entering the area of 2 m to 4 m soil depth, the stable hydrogen isotopes transitioned into a relatively stable and fluctuating state. Although some fluctuation persisted within this range, it was less pronounced than that observed in shallow soils, forming a relatively steady fluctuation trend. However, at depths of 4 m or more, hydrogen isotopes again began a slow decline.
The characteristics of stable oxygen isotopes with soil depth were similar to those of stable hydrogen isotopes, as shown in Figure 4. Notably, the variation in stable hydrogen and oxygen isotopes was particularly pronounced in shallow soils ranging from 0 to 2 m depth, primarily attributed to fluctuations in surface climate conditions and frequent human activities. Conversely, stable isotopes in soils below a depth of 4 m remained unaffected by soil evaporation subsequent to apple planting, indicating a discernible decline in stable hydrogen and oxygen isotopes with increasing depth. To accurately capture changes in soil evaporation following fruit tree cultivation, we selected the isotopic composition of soil water at a depth of 2 m to 4 m as our research focus since it offered a representative sample reflecting the stable isotopes of soil moisture.
The distribution of δs2H and δs18O in apple orchards of varying ages were as follows (Figure 5): In 2021, the δs2H results in apple orchards of 12 y, 15 y, 19 y and 22 y were −56.53‰, −54.41‰, −50.05‰ and −56.49‰, respectively, exhibiting an initial increase followed by a decrease with age. By 2022, the corresponding δ2H results for these stands had increased to −61.93‰, −60.80‰, −60.74‰ and −59.77‰, respectively, which indicated an increasing trend with stand age.
In addition, the δs18O results for these stands in 2021 were found to be −7.52‰, −7.75‰, −6.69‰ and −7.28‰. These values increased further in 2022, to −8.43‰, −8.44‰, −8.33‰ and −8.19‰, respectively, also showing an increasing trend with age.

3.1.2. Characteristics of Evaporative Fractionation of Stable Hydrogen and Oxygen Isotopes and Its Relationship with Age in Apple Orchards

The distribution of δ2H and δ18O in apple orchards of varying ages are illustrated in Figure 6. Here, all stable isotopic points fall within the lower right region of the Local Meteoric Water Line, indicating varying degrees of evaporation fractionation occurring after precipitation infiltrates the soil.
The slope of the Local Evaporation Line (SLEL = 3.29) was calculated using Rayleigh fractionation theory, while the intercept of the Local Evaporation Line (ILEL) was obtained by fitting stable isotopes. In 2021, the intercepts for apple orchards of varying ages were −31.81, −28.91, −28.03 and −32.53, respectively, exhibiting a pattern where they initially increased and then decreased with age. In 2022, the intercepts were −34.21, −33.02, −33.32 and−32.84, respectively. The differences among stands with varying ages were minimal, demonstrating a general increasing trend with stand age.
The intersection of the Local Meteoric Water Line and the Local Evaporation Line represents stable hydrogen and oxygen isotopes of soil moisture origin (δo). Despite all soil moisture in the study area originating from local atmospheric precipitation, Figure 7 reveals variations in δo in apple orchards of varying ages. In 2021, the δo (2H) results were −63.56, −58.47, −56.93 and −64.83, respectively, while the δo (18O) results were −9.65, −8.99, −8.78 and −9.82, respectively. The average stable isotope compositions of hydrogen and oxygen in soil moisture from apple orchards at depths ranging from 2 m to 4 m initially increased with stand age but then decreased.

3.2. Estimation of Soil Evaporation Based on Craig–Gordon Model

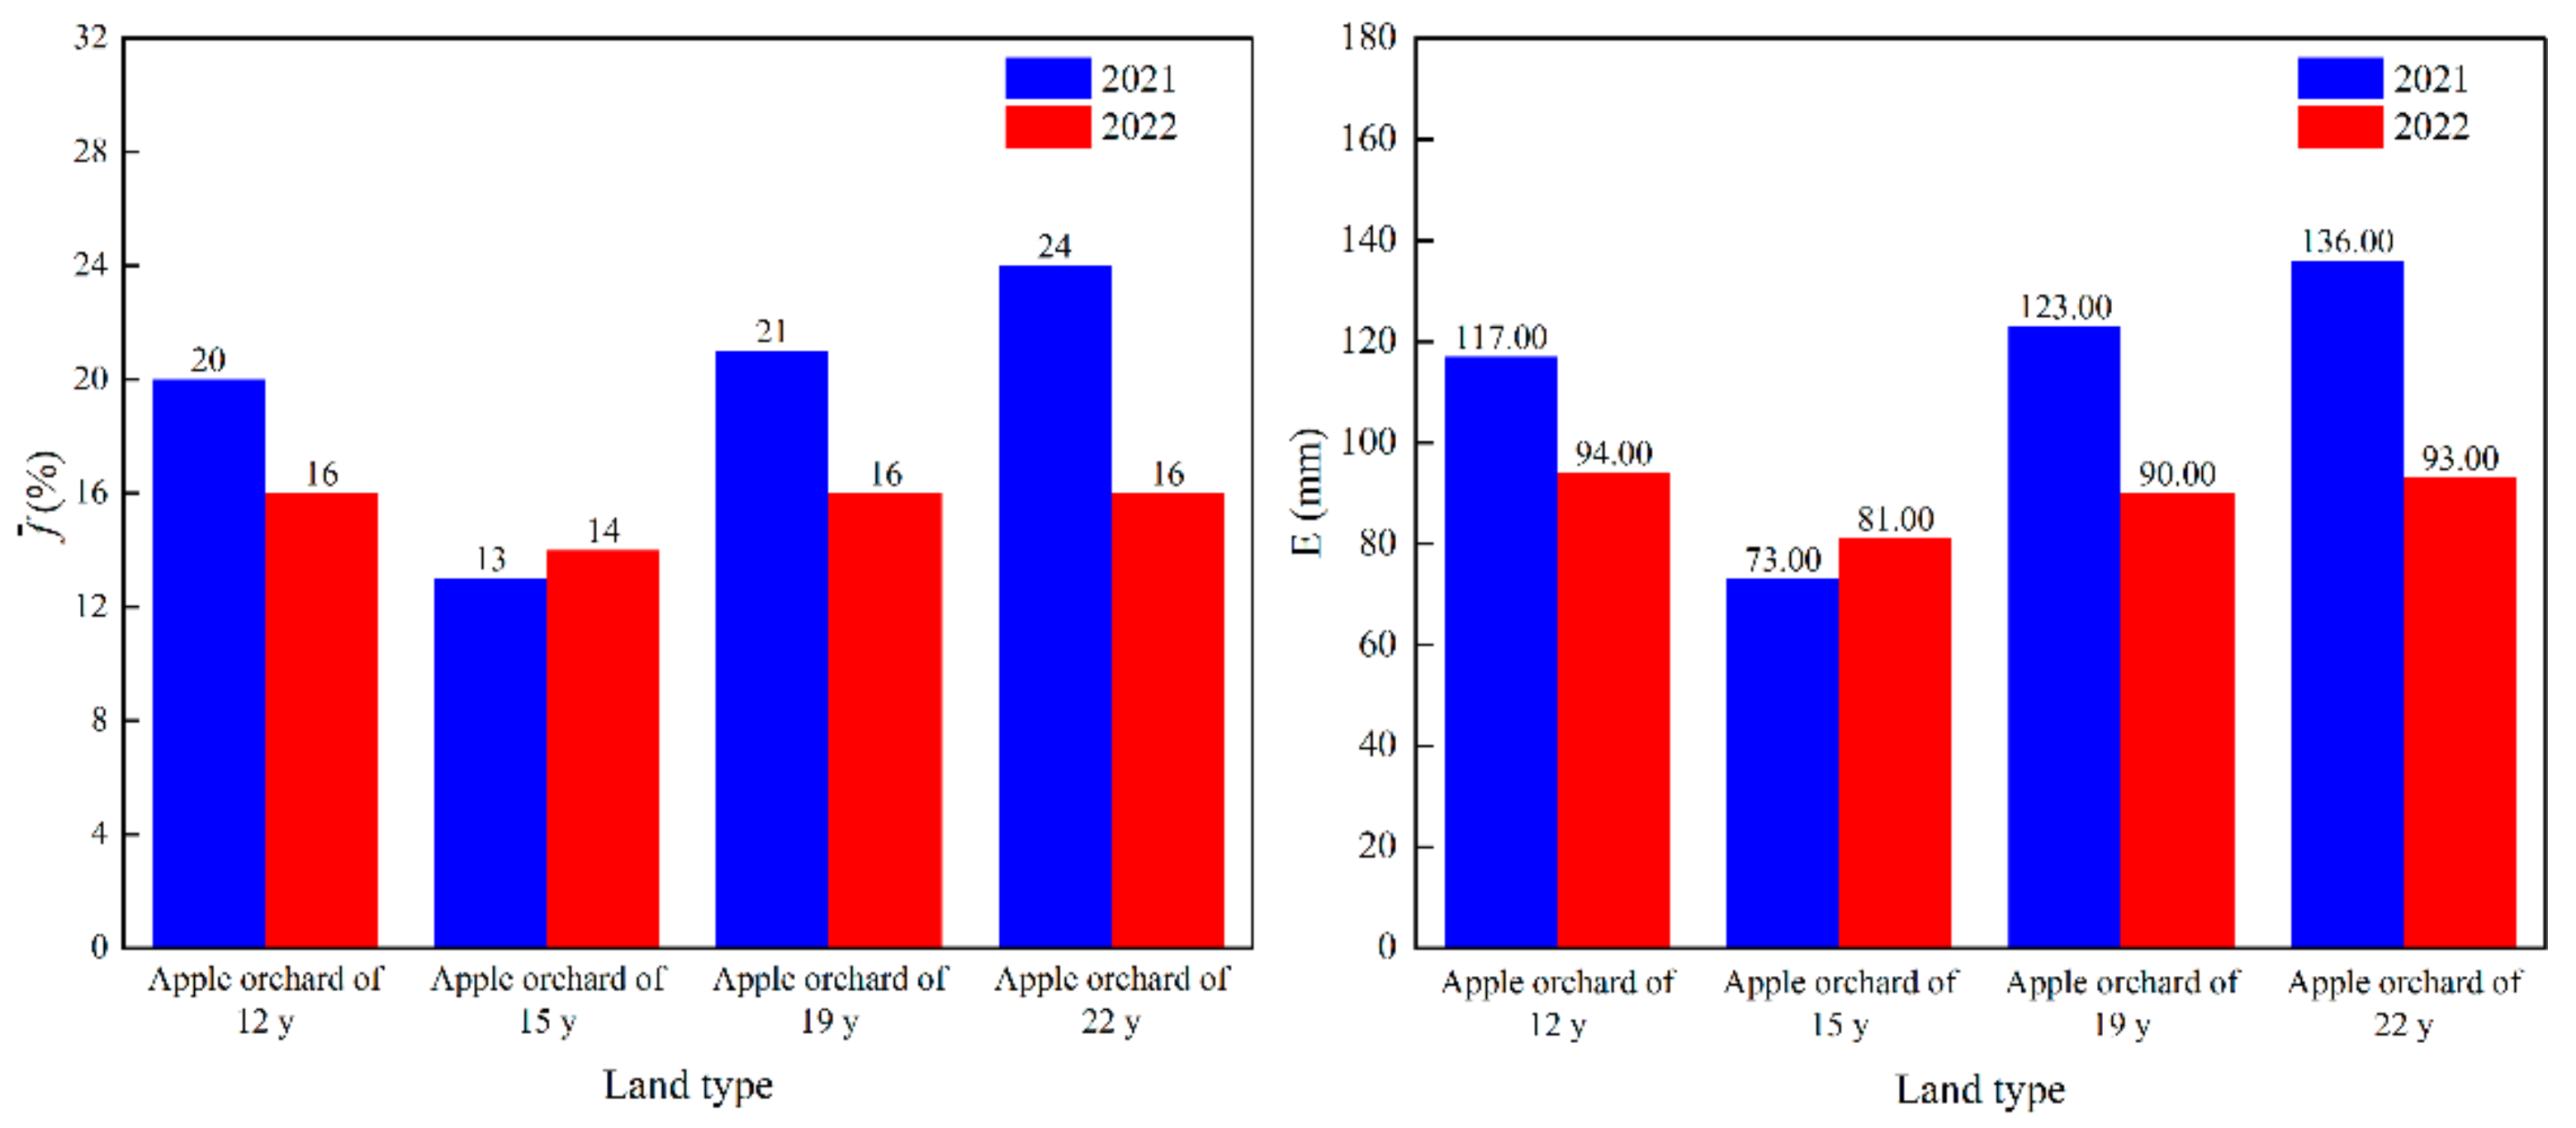
3.2.1. Soil Evaporation Loss Rate Based on Craig–Gordon Model

According to the δS and δo of apple orchards of varying ages, the corresponding soil evaporation loss rates were calculated using the Craig–Gordon model, as depicted in Figure 8.
Based on δ2H data, the soil evaporation loss rate ranged from 11% to 20% in 2021 and decreased to a range of 12% to 14% in 2022. With this change, the variation in soil evaporation loss rate in 2022 was significantly smaller than that observed in 2021. Furthermore, the standard deviation decreased from 4% in 2021 to just 1% in 2022, indicating a substantial reduction in overall volatility. Simultaneously, the coefficient of variation declined from 26.45% (in 2021) to only 10.38% (in 2022), suggesting that while there was moderate variation observed during 2021, the level of variation weakened considerably by 2022. This implied that after the extreme precipitation event during 2021, the subsequent decrease in soil evaporation reduced the differences between forests of various ages.
Similarly, based on δ18O data, the soil evaporation loss rate exhibited a comparable pattern. In 2021, the soil evaporation loss rate ranged from 14% to 27%, which decreased to 16% to 19% in 2022, with a reduction in the disparity between the upper and lower limits. The standard deviation declined from 5% in 2021 to 2% in 2022, indicating an overall decrease in volatility. Furthermore, the coefficient of variation also diminished from 26.3% in 2021 to 10.61% in 2022, further supporting the previous conclusion that extreme precipitation events led to reduced soil evaporation loss and minimized differences among varying age groups.

3.2.2. Calculation of Soil Evaporation Based on the Soil Evaporation Loss Rate

The average soil evaporation loss rate of 2H and 18O was taken as the soil evaporation loss rate in the study area, which was then multiplied by the average precipitation P (573 mm) to calculate the corresponding average soil evaporation amounts for agricultural land and apple orchards of varying ages, as presented in Figure 9.
In 2021, soil evaporation levels for apple orchards with varying ages were recorded as 117 mm, 73 mm, 123 mm and 136 mm, respectively, with an overall average of 112.3 mm. Then, in 2022, soil evaporation levels for apple orchards with varying ages were measured at 94 mm, 81 mm, 90 mm and 93 mm, respectively, resulting in average of 89.5 mm. The variation observed in soil evaporation among apple orchards with varying ages can be attributed to leaf area dynamics during peak fruiting periods (12 y and 15 y), leading to a decrease in soil evaporation rates. However, during the mid-late stages of fruit tree growth (19 y and 22 y), a water deficit occurs within root zones, prompting an active reduction in leaf areas of fruit trees to ensure basic survival, resulting in increased soil evaporation.

3.3. Estimation and Analysis of Plant Transpiration and Soil Transpiration

3.3.1. Division of Plant Transpiration According to Water Balance Analysis

Based on the soil water storage data in 2021 and 2022, the variation in soil water storage following extreme precipitation was determined. With the exception of the apple orchard aged 22 y, the other three has negative variations in soil water storage. According to the water balance analysis, evapotranspiration was calculated from the precipitation, runoff and changes in soil water storage. The study area is a semi-arid area with negligible runoff, so evapotranspiration was obtained by subtracting the variation in soil water storage from the precipitation. The evapotranspiration levels of apple orchards of 12 y, 15 y, 17 y and 22 y were 740 mm, 629 mm, 651 mm and 473 mm, respectively. By multiplying the precipitation in 2022 (p = 602.6 mm) by the soil evaporation loss rate for apple orchards of varying ages, we calculated the amount of soil evaporation for each age. Except for apple orchards aged 15 y, the results remained consistently between 120 mm and 140 mm.
Since evapotranspiration comprises both plant transpiration and soil evaporation, plant transpiration can be obtained by separating soil evaporation from evapotranspiration (Figure 10). The findings revealed that plant transpiration levels for apple orchards of 12 y, 15 y, 19 y and 22 y were 617 mm, 552 mm, 522 mm and 330 mm, respectively. As the age of the trees increased, the difference between soil moisture and evaporation gradually decreased: 493 mm, 476 mm, 393 mm and 187 mm, respectively. Therefore, the proportion of soil evaporation was also increasing, from 17% (apple orchard of 12 y) to 30% (apple orchard of 22 y).

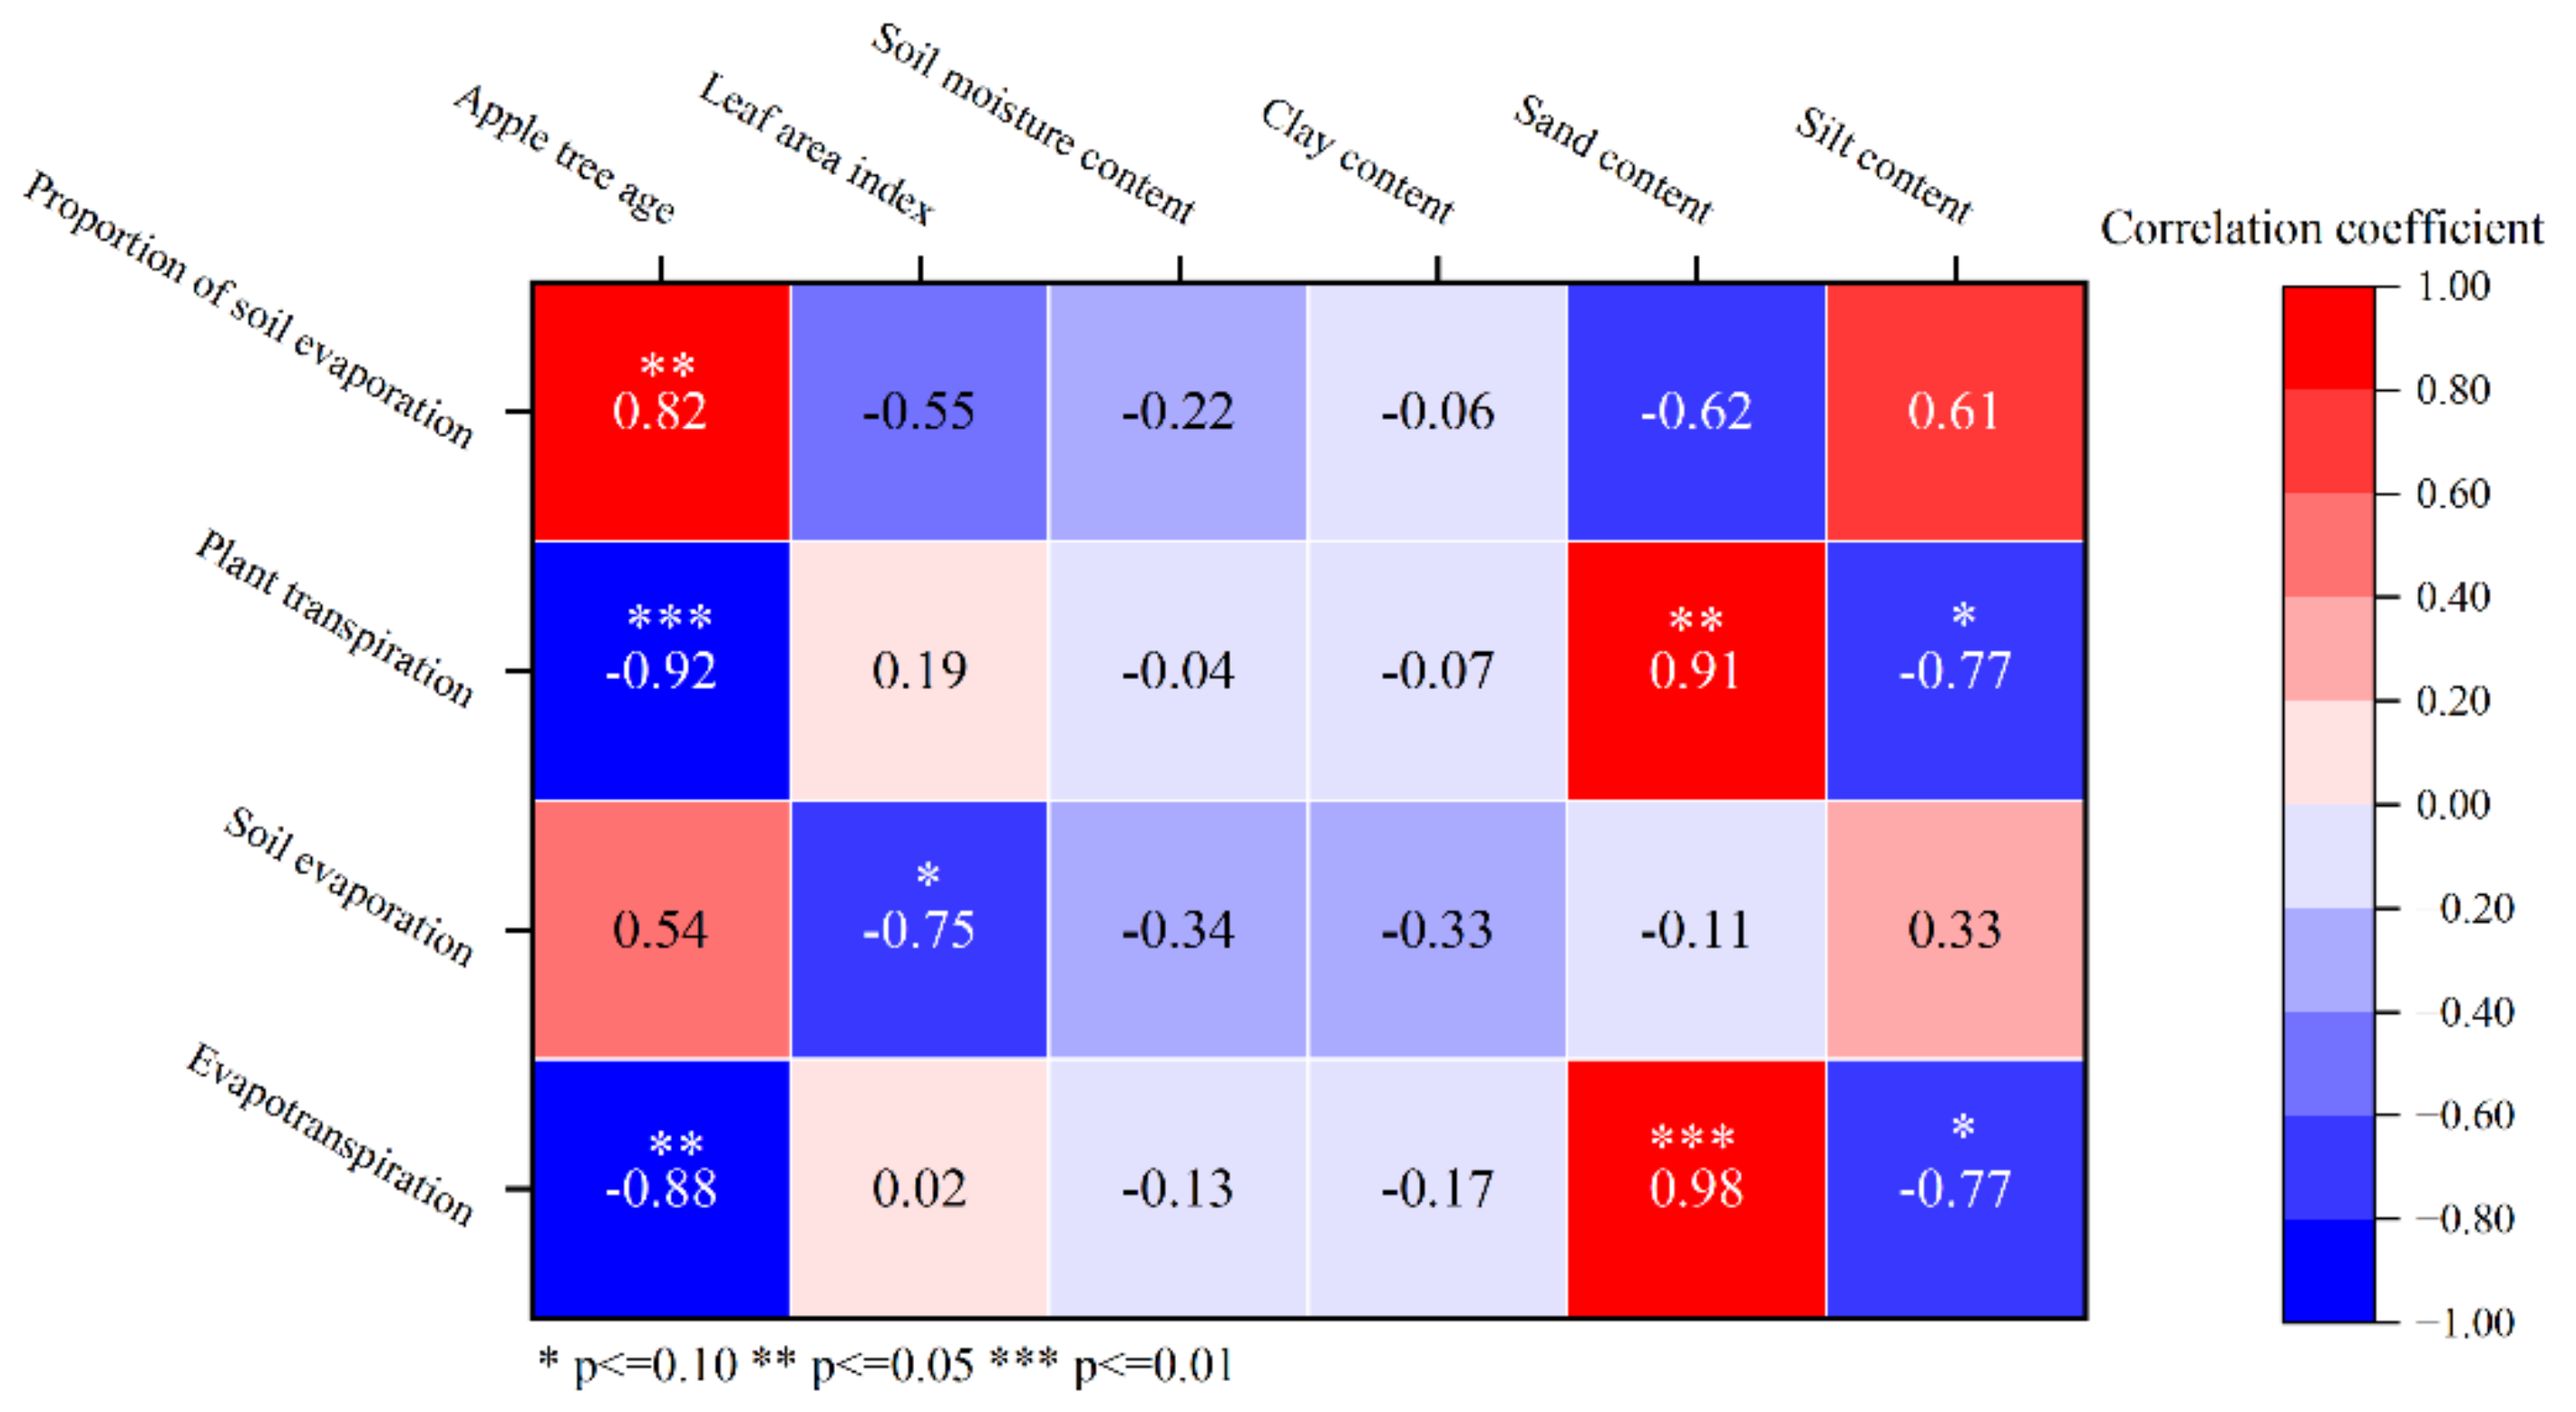
3.3.2. Correlation Analysis

In order to further analyze the influencing factors of evapotranspiration, a correlation analysis was conducted between evapotranspiration, soil evaporation and plant transpiration with plant physiological indicators and soil properties. The results are presented in Figure 11. The negative correlation between plant transpiration and tree age (R = −0.92, p < 0.01) suggested that as trees age, plant transpiration decreases. Additionally, there was a positive correlation between sand content and plant transpiration (R = 0.91, p < 0.01), indicating that a higher sand content enhanced water absorption by plants from the soil, thereby increasing plant transpiration. Furthermore, there was a negative correlation between soil evaporation and the leaf area index (R = −0.75, p < 0.10). This could be attributed to the fact that larger leaf areas result in smaller areas of direct sunlight exposure on the soil surface, leading to weaker soil evaporation effects.

4. Discussion

4.1. Observation Trend Analysis of Soil Evaporation Loss Rate

The trends observed in soil evaporation loss rates in apple orchards are intricately linked to the growth stages of trees and their physiological responses to water availability. In the early and middle stages of apple tree planting (12~15 y), if there is a sufficient soil water supply, the canopy cover will continue to increase with the normal growth of apple trees, so the leaf area per unit area of land will continue to increase, and the proportion of soil surface shaded will increase, which will lower soil evaporation. During these stages, the increasing canopy cover plays a crucial role in shading the soil surface, effectively reducing direct solar radiation and consequently lowering soil temperatures [42]. Previous research demonstrated that an enhanced canopy cover can lead to significant reductions in soil evaporation rates by maintaining higher soil moisture levels and reducing the vapor pressure deficit above the soil surface [43,44]. However, as apple trees mature and begin to experience water stress due to increased water consumption and reduced soil moisture availability, the dynamics shift. Papers report that plants undergo physiological adaptations to cope with drought stress, including a reduction in leaf area to decrease transpiration demands [45,46]. Therefore, the initial decrease in evaporation loss rates can be largely attributed to an increased canopy cover and sufficient soil moisture, while the subsequent increase in evaporation during the later stages is a direct result of drought-induced stress responses in trees.

4.2. Selection of Input Parameters for the Craig–Gordon Model

The existing research indicates that soil evaporation calculated using the Craig–Gordon model shows a good agreement with measured results [47], suggesting that using the stable isotope method to study hydrogen and oxygen offers a certain accuracy in quantifying soil evaporation. However, this does not guarantee that the computed soil evaporation values from stable isotopes are always accurate [48]. The reliability of this method is not only contingent on the specific conditions under which the Craig–Gordon model is applied [49] but also closely relates to the selection of input parameters—specifically, the isotopic composition of water vapor signals from soil evaporation.
In practical situations, if soil infiltration exhibits a preferential flow, a portion of the precipitation may rapidly penetrate deep into the soil without undergoing a complete evaporation process. Conversely, another portion of precipitation might completely evaporate in the shallow soil layer before it has had the chance to infiltrate deeper layers. These scenarios result in the loss of certain soil evaporation signals [50], leading to an underestimation of soil water isotopic composition input into the Craig–Gordon model and consequently an undervaluation of calculated soil evaporation rates. To address this issue, we excluded shallow soil water (0–2 m), which is highly influenced by surface climatic dynamics, and deep soil water (>4 m), which remains unaffected by post-apple-cultivation evaporation processes. Instead, we selected the isotopic composition of soil water from depths between 2 m and 4 m, as this best represents changes in soil evaporation following fruit tree cultivation, thereby allowing for accurate calculations of soil evaporation loss rates.

4.3. Differences in Soil Evaporation Loss Rate Based on δ2H and δ18O

Soil evaporation loss rates calculated using δ2H and δ18O isotopes exhibited notable discrepancies, with δ2H consistently yielding lower estimates than δ18O by a margin ranging from −7% to −3%. This inconsistency in soil evaporation estimates arose due to the specific hydrogen compounds formed under the particular soil conditions studied [51]. Specifically, under continuous inundation in wet fields, the anaerobic environment promotes the formation of hydrogen compounds such as methane (CH4), hydrogen sulfide (H2S), hydrogen gas (H2) and others via microbial anaerobic respiration. These hydrogen compounds undergo isotopic exchange, leading to a relative depletion of δ2H in soil water [52]. Consequently, soil evaporation estimates derived from δ2H are generally lower than those derived from δ18O. The difference is more pronounced in deeper soil layers, suggesting the formation of these hydrogen compounds at greater depths. This phenomenon complicates the accurate calculation of soil evaporation using stable isotopes and highlights the need for further research and refinement of methodologies to better understand and account for the effects of hydrogen and oxygen stable isotopes on soil evaporation estimates.

5. Conclusions

Taking the Changwu tableland, a typical area of apple orchards on the Loess Plateau, as an example, the Craig–Gordon model was used to calculate the soil evaporation loss rate and estimate soil evaporation based on stable hydrogen and oxygen isotope data. The main results are as follows:
(1) All stable hydrogen and oxygen isotope compositions fell within the lower right region of the Local Meteoric Water Line, and extreme precipitation reduced the intercept of the Evaporation Trend Line in apple orchards of varying ages.
(2) Soil evaporation loss rates in 2021 and 2022 were 13%–24% and 14%–18%, respectively, indicating that extreme precipitation narrowed the gap between the soil evaporation loss rates of apple orchards of different ages.
(3) The soil evaporation levels of apple orchards of 12 y, 15 y, 19 y and 22 y were measured at 123 mm, 77 mm, 129 mm and 143 mm, respectively, indicating a negative correlation (R = −0.75) between soil evaporation and the leaf area index. The corresponding plant transpiration levels were 617 mm, 552 mm, 522 mm and 330 mm, indicating that plant transpiration was negatively correlated (R = −0.92) with age and positively correlated (R = 0.91) with the sand content.
(4) This study extends our understanding of the processes of soil evaporation and plant transpiration in apple orchards on the Loess Plateau and provides a scientific basis for optimizing irrigation strategies and improving the water utilization efficiency. In the future, the effects of different meteorological conditions and soil types on soil evaporation and plant transpiration in apple orchards should be further studied, as well as the opportunities for regulating these processes through management measures to achieve more sustainable agricultural production.

Author Contributions

Conceptualization: J.H. and Y.H.; methodology: J.H. and Y.H.; writing—original draft preparation: J.H., Y.H. and H.W.; resource: L.Z.; software: L.Z.; formal analysis: L.Z.; data curation: C.Y., K.C. and H.W.; investigation: C.Y. and K.C.; visualization: C.Y. and K.C.; writing—review and editing: L.G., Y.W. and M.L.; project administration: Y.W. and M.L.; funding acquisition: Y.W. and M.L. All authors have read and agreed to the published version of the manuscript.

Funding

This study was financially supported by the National Key R&D Program of China (2022YEE0100300), the National Natural Science Foundation of China (52479051) and the Sichuan Program of Science and Technology (2023JDZH0010, 2024NSFSC0126).

Data Availability Statement

The raw data supporting the conclusions of this article will be made available by the authors upon request.

Acknowledgments

We thank Long Quan for his assistance with the experiment and comments on the first draft.

Conflicts of Interest

The authors declare no conflicts of interest.

References

  1. Coenders-Gerrits, A.M.J.; van der Ent, R.J.; Bogaard, T.A.; Wang-Erlandsson, L.; Hrachowitz, M.; Savenije, H.H.G. Uncertainties in transpiration estimates. Nature 2014, 506, E1–E2. [Google Scholar] [CrossRef] [PubMed]
  2. Song, X.; Lyu, S.; Wen, X. Limitation of soil moisture on the response of transpiration to vapor pressure deficit in a subtropical coniferous plantation subjected to seasonal drought. J. Hydrol. 2020, 591, 125301. [Google Scholar] [CrossRef]
  3. Xu, S.; Yu, Z.; Ji, X.; Sudicky, E.A. Comparing three models to estimate transpiration of desert shrubs. J. Hydrol. 2017, 550, 603–615. [Google Scholar] [CrossRef]
  4. Ge, G.; Chaoying, H. Climate Change and Its Impact on Water Resources in North China. Adv. Atmos. Sci. 2001, 18, 718–732. [Google Scholar] [CrossRef]
  5. Zhao, M.; A, G.; Liu, Y.; Konings, A.G. Evapotranspiration frequently increases during droughts. Nat. Clim. Change 2022, 12, 1024–1030. [Google Scholar] [CrossRef]
  6. Chang, X.; Zhao, W.; He, Z. Radial pattern of sap flow and response to microclimate and soil moisture in Qinghai spruce (Picea crassifolia) in the upper Heihe River Basin of arid northwestern China. Agric. For. Meteorol. 2014, 187, 14–21. [Google Scholar] [CrossRef]
  7. Klapp, I.; Yafin, P.; Oz, N.; Brand, O.; Bahat, I.; Goldshtein, E.; Cohen, Y.; Alchanatis, V.; Sochen, N. Computational end-to-end and super-resolution methods to improve thermal infrared remote sensing for agriculture. Precis. Agric. 2021, 22, 452–474. [Google Scholar] [CrossRef]
  8. Rafi, Z.; Merlin, O.; Le Dantec, V.; Khabba, S.; Mordelet, P.; Er-Raki, S.; Amazirh, A.; Olivera-Guerra, L.; Hssaine, B.A.; Simonneaux, V.; et al. Partitioning evapotranspiration of a drip-irrigated wheat crop: Inter-comparing eddy covariance-, sap flow-, lysimeter- and FAO-based methods. Agric. For. Meteorol. 2019, 265, 310–326. [Google Scholar] [CrossRef]
  9. López-López, M.; Espadafor, M.; Testi, L.; Lorite, I.J.; Orgaz, F.; Fereres, E. Water requirements of mature almond trees in response to atmospheric demand. Irrig. Sci. 2018, 36, 271–280. [Google Scholar] [CrossRef]
  10. Fernández-Martínez, M.; Sardans, J.; Musavi, T.; Migliavacca, M.; Iturrate-Garcia, M.; Scholes, R.J.; Peñuelas, J.; Janssens, I.A. The role of climate, foliar stoichiometry and plant diversity on ecosystem carbon balance. Glob. Change Biol. 2020, 26, 7067–7078. [Google Scholar] [CrossRef]
  11. Zhang, D.; Zhou, G. Estimation of Soil Moisture from Optical and Thermal Remote Sensing: A Review. Sensors 2016, 16, 1308. [Google Scholar] [CrossRef] [PubMed]
  12. Seymour, V.; Hsiao, T. A soil surface psychrometer for measuring humidity and studying evaporation. Agric. For. Meteorol. 1984, 32, 61–70. [Google Scholar] [CrossRef]
  13. Wu, X.; Chen, F.; Liu, X.; Wang, S.; Zhang, M.; Zhu, G.; Zhou, X.; Chen, J. The Significance of Hydrogen and Oxygen Stable Isotopes in the Water Vapor Source in Dingxi Area. Water 2021, 13, 2374. [Google Scholar] [CrossRef]
  14. Tritschler, F.; Binder, M.; Händel, F.; Burghardt, D.; Dietrich, P.; Liedl, R. Collected Rain Water as Cost-Efficient Source for Aquifer Tracer Testing. Groundwater 2020, 58, 125–131. [Google Scholar] [CrossRef] [PubMed]
  15. Yong, L.; Zhu, G.; Wan, Q.; Xu, Y.; Zhang, Z.; Sun, Z.; Ma, H.; Sang, L.; Liu, Y.; Guo, H.; et al. The Soil Water Evaporation Process from Mountains Based on the Stable Isotope Composition in a Headwater Basin and Northwest China. Water 2020, 12, 2711. [Google Scholar] [CrossRef]
  16. Oerter, E.J.; Bowen, G.J. Spatio-temporal heterogeneity in soil water stable isotopic composition and its ecohydrologic implications in semiarid ecosystems. Hydrol. Process. 2019, 33, 1724–1738. [Google Scholar] [CrossRef]
  17. Li, Y.; Huo, S.; Guo, J.; Sun, J.; Pan, J.; Wang, D.; Tan, Q.; Pei, B. Using hydrogen and oxygen stable isotopes to estimate soil water evaporation loss under continuous evaporation conditions. Hydrol. Process. 2023, 37, e14885. [Google Scholar] [CrossRef]
  18. Wang, P.; Yamanaka, T.; Li, X.-Y.; Wei, Z. Partitioning evapotranspiration in a temperate grassland ecosystem: Numerical modeling with isotopic tracers. Agric. For. Meteorol. 2015, 208, 16–31. [Google Scholar] [CrossRef]
  19. Good, S.P.; Soderberg, K.; Guan, K.; King, E.G.; Scanlon, T.M.; Caylor, K.K. δ2H isotopic flux partitioning of evapotranspiration over a grass field following a water pulse and subsequent dry down. Water Resour. Res. 2014, 50, 1410–1432. [Google Scholar] [CrossRef]
  20. Wei, Z.; Lee, X.; Wen, X.; Xiao, W. Evapotranspiration partitioning for three agro-ecosystems with contrasting moisture conditions: A comparison of an isotope method and a two-source model calculation. Agric. For. Meteorol. 2018, 252, 296–310. [Google Scholar] [CrossRef]
  21. Ma, Y.; Song, X. Applying stable isotopes to determine seasonal variability in evapotranspiration partitioning of winter wheat for optimizing agricultural management practices. Sci. Total. Environ. 2019, 654, 633–642. [Google Scholar] [CrossRef] [PubMed]
  22. Ye, S.; Li, J.; Kong, H.; Shen, J.; Wu, D. Effects of varying mulch materials on the photosynthetic characteristics, yield, and soil water use efficiency of wheat in Loess tableland. Sci. Rep. 2023, 13, 18106. [Google Scholar] [CrossRef] [PubMed]
  23. Zhao, C.; Jia, X.; Zhu, Y.; Shao, M. Long-term temporal variations of soil water content under varying vegetation types in the Loess Plateau, China. CATENA 2017, 158, 55–62. [Google Scholar] [CrossRef]
  24. Luan, J.; Zhang, Y.; Li, X.; Ma, N.; Naeem, S.; Xu, Z.; He, S.; Miao, P.; Tian, X.; Wang, R. Unexpected consequences of large-scale ecological restoration: Groundwater declines are reversed. Ecol. Indic. 2023, 155, 111008. [Google Scholar] [CrossRef]
  25. Yang, M.; Wang, S.; Zhao, X.; Gao, X.; Liu, S. Soil properties of apple orchards on China’s Loess Plateau. Sci. Total Environ. 2020, 723, 138041. [Google Scholar] [CrossRef]
  26. Li, W.; Gao, J.; Zhang, Y.; Ahmad, R.; Gao, Z.; Zhou, F. Effects of Planting Practices on Soil Organic Carbon during Old Apple Orchards’ Reconstruction on the Loess Plateau. Agronomy 2023, 13, 897. [Google Scholar] [CrossRef]
  27. Lu, Y.; Li, H.; Si, B.; Li, M. Chloride tracer of the loess unsaturated zone under sub-humid region: A potential proxy recording high-resolution hydroclimate. Sci. Total Environ. 2020, 700, 134465. [Google Scholar] [CrossRef]
  28. Tao, G.; Lei, D.; Liu, L.; Li, Y.; Zhu, X. Prediction of Soil Water Characteristic Curve Based on Soil Water Evaporation. Adv. Civ. Eng. 2021, 2021, 6686442. [Google Scholar] [CrossRef]
  29. Wei, H.; Lu, Y.; Bai, L.; Niu, J.; Chen, S.; Mojid, M.A.; Yang, Y.; Li, M. Water Uptake Characteristics of Stipa bungeana Trin: Affected by Subsidence in the Coal Mining Areas of Northwest China. Agronomy 2024, 14, 424. [Google Scholar] [CrossRef]
  30. Chen, K.; Liu, G.; Xia, C.; Meng, Y.; Tetzlaff, D.; Zhong, Q.; Chang, J. Water cycling and partitioning through the soil–plant–atmosphere continuum in a subtropical, urban woodland inferred by water stable isotopes. Hydrol. Process. 2022, 36, e14746. [Google Scholar] [CrossRef]
  31. Liu, Y.; Liu, J.; Wang, S.; Zhou, T. A simplified method of developing a local meteoric water line equation for Beijing, China. J. Radioanal. Nucl. Chem. 2018, 315, 523–532. [Google Scholar] [CrossRef]
  32. Sprenger, M.; Tetzlaff, D.; Soulsby, C. Soil water stable isotopes reveal evaporation dynamics at the soil–plant–atmosphere interface of the critical zone. Hydrol. Earth Syst. Sci. 2017, 21, 3839–3858. [Google Scholar] [CrossRef]
  33. Sprenger, M.; Tetzlaff, D.; Tunaley, C.; Dick, J.; Soulsby, C. Evaporation fractionation in a peatland drainage network affects stream water isotope composition. Water Resour. Res. 2017, 53, 851–866. [Google Scholar] [CrossRef]
  34. Gonfiantini, R.; Wassenaar, L.I.; Araguas-Araguas, L.J. Stable isotope fractionations in the evaporation of water: The wind effect. Hydrol. Process. 2020, 34, 3596–3607. [Google Scholar] [CrossRef]
  35. Lu, Y.; Wen, M.; Li, P.; Liang, J.; Wei, H.; Li, M. An Improved Craig–Gordon Isotopic Model: Accounting for Transpiration Effects on the Isotopic Composition of Residual Water during Evapotranspiration. Agronomy 2023, 13, 1531. [Google Scholar] [CrossRef]
  36. Gibson, J.J.; Birks, S.J.; Edwards, T.W.D. Global prediction of δA and δ2H-δ18O evaporation slopes for lakes and soil water accounting for seasonality. Glob. Biogeochem. Cycles 2008, 22, 191. [Google Scholar] [CrossRef]
  37. Gonfiantini, R.; Wassenaar, L.I.; Araguas-Araguas, L.; Aggarwal, P.K. A unified Craig-Gordon isotope model of stable hydrogen and oxygen isotope fractionation during fresh or saltwater evaporation. Geochim. Cosmochim. Acta 2018, 235, 224–236. [Google Scholar] [CrossRef]
  38. Loucos, K.E.; Simonin, K.A.; Song, X.; Barbour, M.M. Observed relationships between leaf H218O Peclet effective length and leaf hydraulic conductance reflect assumptions in Craig-Gordon model calculations. Tree Physiol. 2015, 35, 16–26. [Google Scholar] [CrossRef]
  39. Smith, D.F.; Saelens, E.; Leslie, D.L.; Carey, A.E. Local meteoric water lines describe extratropical precipitation. Hydrol. Process. 2021, 35, e14059. [Google Scholar] [CrossRef]
  40. Du, Y.; Berndtsson, R.; An, D.; Zhang, L.; Hao, Z.; Yuan, F. Hydrologic Response of Climate Change in the Source Region of the Yangtze River, Based on Water Balance Analysis. Water 2017, 9, 115. [Google Scholar] [CrossRef]
  41. Sun, S.; Meng, P.; Zhang, J.; Wan, X.; Zheng, N.; He, C. Partitioning oak woodland evapotranspiration in the rocky mountainous area of North China was disturbed by foreign vapor, as estimated based on non-steady-state 18O isotopic composition. Agric. For. Meteorol. 2014, 184, 36–47. [Google Scholar] [CrossRef]
  42. Villegas, J.C.; Breshears, D.D.; Zou, C.B.; Royer, P.D. Seasonally Pulsed Heterogeneity in Microclimate: Phenology and Cover Effects along Deciduous Grassland–Forest Continuum. Vadose Zone J. 2010, 9, 537–547. [Google Scholar] [CrossRef]
  43. Lin, B.B. The role of agroforestry in reducing water loss through soil evaporation and crop transpiration in coffee agroecosystems. Agric. For. Meteorol. 2010, 150, 510–518. [Google Scholar] [CrossRef]
  44. Tesfuhuney, W.A.; Mengistu, A.G.; Van Rensburg, L.D.; Walker, S. Estimating soil water evaporation as influenced by “dry-and green-mulch” cover beneath maize canopy. Phys. Chem. Earth Parts A/B/C 2022, 128, 103270. [Google Scholar] [CrossRef]
  45. Di, N.; Wang, Y.; Clothier, B.; Liu, Y.; Jia, L.; Xi, B.; Shi, H. Modeling soil evaporation and the response of the crop coefficient to leaf area index in mature Populus tomentosa plantations growing under varying soil water availabilities. Agric. For. Meteorol. 2019, 264, 125–137. [Google Scholar] [CrossRef]
  46. Wang, H.X.; Liu, C.M. Soil Evaporation and its Affecting Factors under Crop Canopy. Commun. Soil Sci. Plant Anal. 2007, 38, 259–271. [Google Scholar] [CrossRef]
  47. Lu, X.; Liang, L.L.; Wang, L.; Jenerette, G.D.; McCabe, M.F.; Grantz, D.A. Partitioning of evapotranspiration using a stable isotope technique in an arid and high temperature agricultural production system. Agric. Water Manag. 2017, 179, 103–109. [Google Scholar] [CrossRef]
  48. de Vries, J.J.; Simmers, I. Groundwater recharge: An overview of processes and challenges. Hydrogeol. J. 2002, 10, 5–17. [Google Scholar] [CrossRef]
  49. Dubbert, M.; Cuntz, M.; Piayda, A.; Maguás, C.; Werner, C. Partitioning evapotranspiration—Testing the Craig and Gordon model with field measurements of oxygen isotope ratios of evaporative fluxes. J. Hydrol. 2013, 496, 142–153. [Google Scholar] [CrossRef]
  50. Braud, I.; Bariac, T.; Gaudet, J.; Vauclin, M. SiSPAT-Isotope, a coupled heat, water and stable isotope (HDO and H218O) transport model for bare soil. Part I. Model description and first verifications. J. Hydrol. 2005, 309, 277–300. [Google Scholar] [CrossRef]
  51. Mahindawansha, A.; Külls, C.; Kraft, P.; Breuer, L. Investigating unproductive water losses from irrigated agricultural crops in the humid tropics through analyses of stable isotopes of water. Hydrol. Earth Syst. Sci. 2020, 24, 3627–3642. [Google Scholar] [CrossRef]
  52. Baram, S.; Kurtzman, D.; Dahan, O. Water percolation through a clayey vadose zone. J. Hydrol. 2012, 424–425, 165–171. [Google Scholar] [CrossRef]
Figure 1. Geographical location of the study area and distribution of each sampling point.
Agronomy 15 00006 g001
Figure 2. Liquid water laser isotope analyzer.
Agronomy 15 00006 g002
Figure 3. Stable hydrogen of apple orchards of varying ages with depth in 2021 and 2022.
Agronomy 15 00006 g003
Figure 4. Stable oxygen of apple orchards of varying ages with depth in 2021 and 2022.
Agronomy 15 00006 g004
Figure 5. Stable hydrogen and oxygen isotopes of soil moisture of apple orchards of varying ages in 2021 and 2022.
Agronomy 15 00006 g005
Figure 6. Local Meteoric Water Line and Local Evaporation Line in 2021 and 2022.
Agronomy 15 00006 g006
Figure 7. Stable hydrogen and oxygen isotopes of soil moisture origin in apple orchards of varying ages in 2021 and 2022.
Agronomy 15 00006 g007
Figure 8. Soil evaporation loss rates of apple orchards of varying ages in 2021 and 2022.
Agronomy 15 00006 g008
Figure 9. Calculation of soil evaporation of apple orchards of varying ages in 2021 and 2022.
Agronomy 15 00006 g009
Figure 10. Calculation results of total evapotranspiration, soil evaporation and plant transpiration in orchards of varying ages.
Agronomy 15 00006 g010
Figure 11. Correlation result of evapotranspiration, soil evaporation and plant transpiration with plant physiological indicators and soil properties.
Agronomy 15 00006 g011
Table 1. Apple orchard planting year, stand age, classification and geographical distribution.
Land TypePlanting YearStand AgePeriodLatitudeLongitude
Apple orchard200812 yFull bearing 107°41′05.88″35°14′58.72″
200515 yFull bearing107°41′09.01″35°14′52.18″
200119 ySenescence107°40′46.74″35°14′34.12″
199822 ySenescence107°41′03.00″35°14′08.82″
Table 2. Sampling depths of apple orchards of varying ages.
Land TypeSampling Depth (m)
May 2021May 2021
Apple orchard of 12 y0~60~12
Apple orchard of 15 y0~60~10
Apple orchard of 19 y0~60~10
Apple orchard of 22 y0~60~8
Table 3. Leaf area index and soil properties of apple orchards of varying ages.
Land TypeLeaf Area IndexSoil Moisture ContentClay Content Sand Content Silt Content
-%%%%
Apple orchard of 12 y2.010.2218.7411.9469.32
Apple orchard of 15 y2.880.23618.9110.1470.95
Apple orchard of 19 y2.590.2416.9110.8972.2
Apple orchard of 22 y2.140.22718.768.9472.31
Disclaimer/Publisher’s Note: The statements, opinions and data contained in all publications are solely those of the individual author(s) and contributor(s) and not of MDPI and/or the editor(s). MDPI and/or the editor(s) disclaim responsibility for any injury to people or property resulting from any ideas, methods, instructions or products referred to in the content.

