Abstract
Silicate agrominerals (SA) may be sustainable soil amendments that can minimize dependence on conventional fertilizers (CF). We evaluated the residual effects of SA application as a source of Si and as a soil remineralizer, using soils with contrasting chemical-physical features cultivated with soybean. The experiment was conducted under greenhouse conditions and treatments were arranged in a 5 × 2 + 2 factorial scheme: five rates of SA, two soils in addition to CF. The soil was incubated before cultivation, followed by the sequential sowing of corn and soybean. At the R4 phenological stage, when the pods were fully developed, soybean plants were harvested for anatomical leaf tissue analysis and P, Ca, Mg, and Si accumulation. After harvest, the soil was analyzed. Application of SA rates reduced potential acidity (H + Al) and exchangeable acidity (Al3+) and increased soil pH, sum of bases (SB), cation-exchange capacity (CEC), and base saturation (BS), in addition to promoting the nutrient’s availability and Si. Stomatal density was higher on the adaxial face of plants cultivated in the medium-textured soil. Silicate agrominerals can be used as a soil acidity corrector and remineralizer, improving the root environment and increasing the availability of nutrients and silicon.
1. Introduction
Soybean’s (Glycine max L.) nutritional value, versatility in food production, industrial applications, and environmental benefits make it a globally important crop. Soybean production and consumption is essential for food security, sustainable agriculture, and human health [1]. This is the reason why its cultivation has seen a significant uptick globally over the last decade. If we take into account the last decade (2013–2023), numbers are impressive. Global soybean hectarage increased by 10%, reaching 121 million hectares during this time. Its production surged by 25% during the same period, reaching 389 million metric tons. The average soybean yield per hectare improved by 15%, reaching 3.22 metric tons [2].
In Brazil, soybean occupies 44.1 million hectares (37% of the global soybean cultivated areas) and is the country’s main agricultural export product. In the 2022/2023 harvest, the country achieved a record production of 154.6 million tons, an increase of 23.2% compared to the 2021/2022 harvest, making Brazil the world’s leading soybean producer [3].
For grain production to reach higher productivity in the coming decades, one of the most important components is the use of fertilizers. However, due to the scarcity and increasing price of mineral fertilizers, which occurred as a result of the oil market, currency devaluation against the dollar, and the conflict between Russia and Ukraine [4], the extreme dependence of the national supply on the external fertilizer market became evident [5]. Price fluctuations cause variations in production costs, leading to changes in agricultural planning and, consequently, pose risks to food security [6]. Therefore, alternative sources are becoming increasingly essential, with the aim of maintaining soil fertility, promoting crop development, and contributing to environmental preservation.
The search for locally or regionally available mineral sources with a lower impact [7] on production costs and environmental risks is essential to make agricultural systems viable. In this sense, these sources should reduce the use of mineral fertilizers [8], contributing to the remineralization of low-fertility soils and promoting the increase in soil pH, cation-exchange capacity (CEC), sum of bases (SB), and base saturation (BS) values [9,10]. Therefore, researchers should enhance the search for products with better nutritional quality [11], increase the capture of atmospheric CO2 [12,13,14], recover degraded areas [15] and contribute to the use of silicate agrominerals (SA) in agriculture. This practice can be employed globally and make use of local geology, especially in countries with rock mining activity [16].
In tropical environments, the low solubility of agrominerals can be an advantage, as they promote residual effects in successive crops or perennial plants, increasing CEC, resulting from the formation of secondary minerals and minimizing nutrient losses due to leaching in the soil solution [17]. Conversely, soluble fertilizers, where the interaction of soil factors, due to low CEC and climate, as a result of high rainfall, make nutrients more susceptible to leaching processes [18].
Food production is directly impacted by lower soil quality, as it reduces the productive potential of crops [19]. To enable the use of these soils, the use of silicate fertilizers has been intensified, as Si ensures greater tolerance to water deficit and salinity, reduces the absorption of potentially toxic elements (PTE) and the plant’s transpiration rate, and increases mechanical resistance to the penetration of pathogens [20], guaranteeing greater stability in plant production. However, there is a scarcity of research related to the use of SA as a source of Si and/or soil remineralizer.
Although some positive effects of agrominerals have already been reported [21,22], there is no scientific information to recommend them as nutrient sources or soil conditioners for agriculture [23]. This study hypothesizes that the residual effect of SA rates in soils with different textures and mineralogy will improve fertility levels, provide Si, and lead to the accumulation of this element in the shoots, causing alterations in the soybean leaf anatomy. The objective of this study was to evaluate the residual effect of SA rates as a source of Si and as a soil remineralizer, using infertile tropical soils with contrasting physical and chemical features cultivated with soybean.
2. Materials and Methods
2.1. Greenhouse Experiment
The experiment was conducted in a Pad and Fan greenhouse (maximum temperature of 30 °C and controlled humidity) over 190 days. Sixty days were used for the incubation of SA at contrasting rates and soils, followed by fifty days for the cultivation of maize in the incubated soils (as a crop preceding soybean) and eight days for the cultivation of soybean, counted from the beginning of emergence.
2.2. Soil Features
The soil surface horizons (Ap; 0.0–0.2 m depth) of a Typic Quartzipsamment (TQ) and Rhodic Hapludox (RH), i.e., two contrasting soils in terms of physical-chemical features, were collected for the experiment. Chemical and physical soil attributes were determined according to the methods used by Raij et al. [24] and Teixeira et al. [25], respectively, and are described in Table 1.

Table 1.
Physical 1 and chemical 2 features of the soil surface horizons of the Typic Quartzipsamment (TQ) and Rhodic Hapludox (RH) used for the experiment (mean ± Standard Deviation (SD); n = 3).
2.3. Silicon-Based Agromineral
A geochemical, mineralogical, and chemical characterization of SA was performed to evaluate its potential as a soil remineralizer, according to Normative Instruction (NI) No. 5 of 10 March 2016 [27]. Its composition is: SiO2 = 49.86%; Al2O3 = 12.63%; Fe2O3 = 13.80%; CaO = 10.42%; MgO = 5.67%; Na2O = 2.29%; K2O = 0.98%; MnO = 0.22%; P2O5 = 0.30% and TiO2 = 1.89%. The sum of bases (CaO + MgO + K2O) in the material reaches a content of 17.41% and that of potassium oxide (K2O) 1.40%. Thus, SA meets the minimum criteria regarding the sum of bases being equal to or greater than 9% and potassium oxide (K2O) being equal to or greater than 1% [27]. PTE arsenic (As), cadmium (Cd), and lead (Pb) are found at levels below 1.0 mg kg−1 and mercury (Hg) levels below 0.1 mg kg−1. Consequently, all PTE content is below the maximum permissible limits (As = < 0.1 mg kg−1; Cd = < 10 mg kg−1; Pb = < 200 mg kg−1 and Hg = < 0.1 mg kg−1), allowing their use in the soil environment [27].
2.4. Experimental Design
The experimental unit consisted of a polyethylene pot filled with 5 kg of soil (TQ or RH). A randomized complete block design with four replications was used. Treatments were generated from a 5 × 2 + 2 factorial scheme, consisting of five rates of SA (0; 750; 1500; 3000, and 6000 mg kg−1 equivalent to 0; 7.5; 15; 30 and 60 Mg ha−1) and two soils (sandy texture—TQ and medium texture—RH) (Table 2), in addition to two additional treatments: (i) TQ = application of lime + conventional mineral fertilization (L + CMF), without SA application; and, (ii) RH = L + CMF, without SA application. Soil agrominerals treatments did not receive lime application. In the additional treatments, BS was increased to 60% [28]. Thus, mixtures of CaCO3 and MgCO3, in the form of agricultural lime (Relative total neutralizing power—PRNT = 90%), were used, maintaining a Ca:Mg ratio of 3:1, with 2.77 g of agricultural lime applied to pots containing TQ soils and 4.32 g to pots containing RH soils.
Table 2.
Experimental design explanation (TQ: Typic Quartzipsamment; RH: Rhodic Hapludox; values in brackets stand for Mg ha−1 of applied SA).
After the application of SA and the corrective material (application of lime), the soil samples were homogenized, packed in plastic bags, and incubated for 60 days. During this period, the soils were maintained at approximately 70% of their water-holding capacity. Following incubation, maize was cultivated for 50 days.
Soybean (cv. TMG 7063 IPRO) seeds were sown in pots filled with 5 kg of soil from the previous phase. Six seeds were sown per pot, and thinning was performed nine days after emergence (DAE), leaving three plants per pot.
A 100 mg kg−1 application of N (ammonium sulfate), 100 mg kg−1 of P (monoammonium phosphate), and 50 mg kg−1 of K (potassium chloride) was applied as a pre-sowing fertilization according to Malavolta [29]. In addition, a micronutrient solution (0.5 mg kg−1 B as boric acid, 2.0 mg kg−1 Cu as copper sulfate, 4.0 mg kg−1 Zn as zinc sulfate, and 3.0 mg kg−1 Mn as manganese sulfate) was applied [29] prior to soybean sowing.
Shortly before sowing, soybean seeds were treated with the fungicides thiophanate-methyl + pyraclostrobin (5 g + 45 g a.i. per 100 kg of seed) and the insecticide fipronil (50 g a.i. per 100 kg of seed). After drying, the seeds were inoculated with strains SEMIA 5019 (Bradyrhizobium elkanii) and SEMIA 5079 (Bradyrhizobium japonicum), guaranteed at 5 × 10⁹ colony-forming units (CFU) per g, at a rate of 100 g of peat per 50 kg of seeds, with 1% sugar added to the slurry, in a clean mixer to incorporate the seeds. This procedure was carried out one hour before soybean sowing. Additionally, a foliar application of 200 mL ha−1 of the liquid commercial fertilizer GeoCoMo was applied to the seeds, providing 2.72 and 27.2 g ha−1 of Co and Mo, respectively.
2.5. Plant
2.5.1. Plant Height, Chemical Analysis, and Dry Matter Production of Soybean Aboveground Biomass
At 50 DAE, plant height (cm) was measured.
Soybean plants were cut at ground level at 80 DAE, reproductive stage R4 [30]. Samples were washed with running water, placed in paper bags, and dried in a forced-air oven at 60 °C for 72 h. After drying, all material was weighed to obtain dry matter yield and then ground in a Wiley mill for the determination of Ca, Mg, and P content according to Malavolta et al. [31]. Calcium and Mg content were determined by atomic absorption spectrophotometry (Perkin-Elmer, AAS-700, Norwalk, CT, USA), and P content by colorimetry method. Calcium, Mg, and P accumulations (mg per plant) were calculated based on Ca content in the shoot (g kg−1) and dry matter of the shoot (g per plant) of each treatment.
2.5.2. Silicon Analysis in Plants
Silicon (Si) content in soybean plant samples was determined according to the analytical protocol described by Pereira and Korndörfer [26]. For extraction and digestion, 0.1 g of ground plant material was weighed into 100 mL polypropylene tubes, followed by the addition of 2 mL of H2O2 (300 or 500 g L−1) and subsequent agitation (magnetic stirrer) for a few seconds. Then, 3 mL of NaOH (500 g L−1) was added, and the mixture was agitated again. To reduce foaming, three drops of octanol were added.
The tubes were placed in a water bath for approximately 1 h. Once all extracts/samples had ceased releasing gases, the top of the tubes were covered with aluminum foil, and the tubes were autoclaved for 1 h at 123 °C and 1.5 atm. If the material (leaf tissue) was not completely digested, an additional 2 mL of H2O2 (300 or 500 g L−1) was added, and the tubes were autoclaved for another hour. After autoclaving, 45 mL of distilled water was added. The extract was then transferred to a labeled plastic flask and allowed to stand until the residue settled to the bottom.
Determination was performed using the molybdenum blue method (with bisulfite). For the samples, a 1 mL aliquot of the supernatant was pipetted into a 50 mL plastic cup and diluted with 19 mL of distilled water (note that the total volume of extract plus water should always be 20 mL). Then, 1 mL of 20% HCl (reagent A) was added to the plastic cups (50 mL) with gentle shaking. Subsequently, 1 mL of reagent B (ammonium molybdate) was added and gently shaken for 5 min. After this period, 2 mL of reagent C (20% tartaric acid) was added and allowed to stand for 2–3 min, and finally, 2 mL of reagent D (SASS—sulfonic acid and sodium sulfite) was added, after which the absorbance was measured at 630 or 670 nm in a spectrophotometer after 30 min. Silicon accumulation (mg per plant) was calculated based on the silicon content in the shoot (g kg−1) and dry matter of the shoot (g per plant) of each treatment.
2.5.3. Anatomical Analysis of Plant Tissue
Anatomical studies and scanning electron microscopy (SEM) were conducted on treatments that received the equivalent of 0, 30, and 60 Mg ha−1 rates of SA. Leaves from the tenth node of soybean plants were collected at 50 DAE. Samples were fixed in formaldehyde, acetic acid, and 70% alcohol for 48 h according to Johansen [32]. Subsequently, they were preserved in 70% alcohol. Leaf samples were also dehydrated in an ethanol series, embedded in hydroxyethyl methacrylate (Leica Historesin), and the obtained blocks were sectioned using a rotary microtome at 8 μm thickness. The material was stained with 0.05% toluidine blue in phosphate-citrate buffer pH 4.5 according to the methodology described by Sakai [33], and the slides were mounted in “Entellan” synthetic resin. Photomicrographs of the materials prepared on slides were taken using an optical microscope coupled to a camera for image acquisition, with the micrometer scales photographed and magnified under the same optical conditions.
Scanning electron microscopy allowed for the description of the leaf cuticle and other epidermal appendages, as well as the evaluation of stomatal density. For this purpose, fixed soybean leaf samples were dehydrated and dried at the critical point of CO2. Inside the chamber, the expansion of this gas increases the pressure, which rises above the critical pressure of CO2 (73 atm), and maintains the temperature above 31 °C, thus eliminating the risk of gas liquefaction according to Dedavid et al. [34] The samples were removed dry from the chamber, without any alteration in their shape, and were mounted on an aluminum stub using double-sided carbon tape and coated with a 30–40 nm gold layer. The analyses and image digitization were performed on a Zeiss EVO/LS15 SEM operated at 20 kV with scales printed directly on the micrographs. Stomatal density, number of stomata per unit leaf area, was evaluated at a magnification of 1000× by counting the number of stomata per mm2.
For the analysis of leaf tissues, histological slides of soybean leaves were obtained for each SA treatment. These photos were subjected to image analysis using the Digimizer program, which allows for the measurement in micrometers of the thickness of the adaxial and abaxial epidermis, lacunose parenchyma, and palisade parenchyma.
2.6. Soil
2.6.1. Chemical Analysis
After 190 days of SA application, soil samples were collected after removing soybean shoots to assess their chemical attributes and nutrient content according to analytical protocols described by Raij et al. [24]. pH was determined potentiometrically in air-dried fine earth suspensions in 0.01 mol L−1 CaCl2 solution at a soil-solution ratio of 1:2.5. Exchangeable Al3+ was extracted with 1 mol L−1 and then titrated with 0.025 mol L−1 NaOH. Exchangeable Ca2+ and Mg2+ were extracted by ion exchange resin and quantified by atomic absorption spectrophotometry (AAS). Exchangeable K+ and P were also extracted by resin, with K+ determined by flame photometry and P by colorimetry methods. Potential acidity (H + Al) was estimated using the Shoemaker–McLean–Pratt (SMP) pH method. With these results, the CEC at pH 7.0 and base saturation (BS) were calculated.
2.6.2. Soil Available Silicon Analysis
Available Si in the soil after soybean cultivation was determined according to the methodology described by Pereira and Korndörfer [26]. For this purpose, in the pre-treatment, soil samples were dried in a forced-air oven at 45 °C until reaching a constant mass and then manually ground. Silicon extraction was performed with a 0.01 mol L−1 calcium chloride solution. Ten grams of soil were weighed and added to 100 mL of the extracting solution in a plastic flask (150 mL). Then, it was shaken in a horizontal shaker at 50 rpm for 1 h. After this period, it was necessary to wait for 15 min for the material to settle, and then the suspension was filtered and left to stand overnight (>12 h). For sample determination, a 10 mL aliquot of the extract (filtrate/decantate) of each sample was pipetted and placed in a 50 mL beaker or plastic cup.
For the standard determination (0; 0.4; 1.0; 2.0 mg L−1 of Si), 0, 2, 5, and 10 mL of a 20 mg L−1 Si standard solution were pipetted into 100 mL volumetric flasks, and the volume was adjusted to the mark with distilled water. A 10 mL aliquot of each standard was transferred to a 50 mL beaker or plastic cup. To the plastic cups containing the standards and samples, 1 mL of sulfomolybdic solution (H4SiO4—orthosilicic acid, the simplest and most soluble form of Si, which reacts with molybdate to develop a yellow color) was added. After 10 min, 2 mL of a 200 mg L−1 tartaric acid solution (used to complex the P in the solution) was added. After 5 min, 10 mL of ascorbic acid solution (the reduction of Si transforms the yellow complex to blue) was added, and after 1 h, the absorbance was measured using a UV-Vis spectrophotometer at a wavelength of 660 nm.
2.7. Statistical Analysis
Statistical analyses were performed using the R statistical software, version 4.4.1 [35], with the asbio, multcomp, and ExpDes.pt packages. Data were subjected to analysis of variance (ANOVA), and means were compared by Tukey’s test (p ≤ 0.05) when the F-test was significant (p ≤ 0.05) among soil types. Polynomial regression was also performed for significant interactions and/or the effect of SA rates on the evaluated soil and plant attributes. Furthermore, Dunnett’s test (p ≤ 0.05) was used to verify differences between SA rates and additional treatments.
3. Results
3.1. Soil
There was an interaction between soils and SA rates for H + Al and Al (Table 3), and for the other soil attributes, there was an influence of SA rates in all soils. Additionally, there was variation among soils (Table 3). It was observed that pH, SB, and BS showed higher values when plants were grown in sandy textured soil (TQ), while H + Al, Al, and CEC were higher in medium textured soil (RH) (Table 3).
Table 3.
Effects of treatments on some selected soil features 1 after soybean cultivation in Typic Quartzipsamment (TQ) and Rhodic Hapludox (RH) soils.
For both soils, similar increases in pH, BS, and SB were observed, along with reductions in H + Al and Al content after the soybean cultivation period (Table 3), when compared to the initial soil chemical characterization before the experiment was established (Table 1).
Concerning pH in TQ soil, the 0.0 and 7.5 Mg ha−1 SA treatments exhibited significant differences compared to the additional treatment (Table 3). In contrast, for RH soil, only the 0.0 and 30 Mg ha−1 SA treatments had means comparable to the additional treatment. Potential acidity (H + Al) in TQ soil was notably different for the 0.0 and 7.5 Mg ha−1 SA treatments, while in RH soil, only the 60 Mg ha−1 SA treatment differed from the additional treatment. Concerning Al content, the 30 and 60 Mg ha−1 SA treatments in TQ soil demonstrated similarities to the additional treatment, whereas in RH soil, only the 30 Mg ha−1 SA treatment showed a comparable trend. Finally, the 60 and 30 Mg ha−1 SA rates for SB were similar to the additional treatment for TQ and RH soils, respectively (Table 3).
In terms of CEC, for TQ soil, the 0.0 and 7.5 mg ha−1 SA treatments showed significant differences compared to the additional treatment. In RH soil, only the control treatment differed from the remaining treatments (Table 3). Regarding BS, in TQ soil, solely the 30 and 60 mg ha−1 SA rates were similar to the additional treatment. However, in RH soil, this effect was observed only at the 30 mg ha−1 SA rate (Table 3).
There was a linear increase in pH, BS, and SB due to the application of the rates, with values ranging from 4.39 to 5.08 (Figure 1a), 10.00 to 27.81 mmolc kg−1 (Figure 1b), and from 28.38% to 61.63%, respectively (Figure 1d).
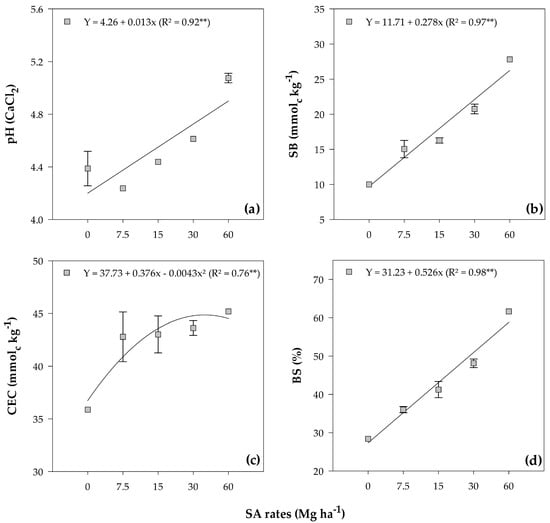
Figure 1.
pH (a), SB (b), CEC (c), and BS (d) mean values in both investigated soils after soybean cultivation in response to the residual effect of applied rates of SM. **—Significant at the 1% probability level. Error bars stand for the St. Err. of the mean.
The application of SA significantly influenced the CEC (CEC = SB + H + Al), as indicated by a quadratic fit with a maximum point at a rate of 43.72 Mg ha−1 of SA (45.95 mmolc kg−1) (Figure 1c).
Increasing rates of SA led to a linear decrease in potential acidity (H + Al) in both soils (Table 3). Values ranged from 21.75 to 14.25 mmolc kg−1 for TQ, while for RH, the range was 30.00 to 20.50 mmolc kg−1 (Figure 2a).
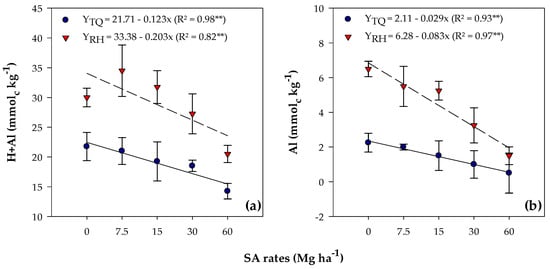
Figure 2.
Potential acidity (H + Al) (a) and exchangeable Al (b) mean values, observed in Typic Quartzipsamment (TQ) and Rhodic Hapludox (RH) soils after soybean cultivation in response to the residual effect of SA application. **—Significant at the 1% probability level. Bars stand for St. Err. of the mean.
Aluminum content was influenced by SA rates in both soils (Table 4), with negative linear adjustments, ranging from 2.25 to 0.50 mmolc kg−1 for TQ and from 6.50 to 1.50 mmolc kg−1 for RH (Figure 2b).
Table 4.
Effect of treatments on the levels of P, Ca, Mg, and Si in the soil 1 after soybean cultivation in Typic Quartzipsamment (TQ) and Rhodic Hapludox (RH) soils.
There was no interaction between SA rates and soils for P, Ca, Mg, and Si content (Table 4). Regarding SA rates, there was a difference in P, Ca, Mg, and Si content (Table 4). For the soil attributes, a difference was observed for Ca and Mg, with TQ having higher content compared to RH (Table 3).
Dunnett’s test revealed that the additional treatment significantly influenced P content in RH soil at rates of 0.0, 7.5, and 15 Mg ha−1 of SA (Table 4). For Ca content, significant differences were observed between the additional treatment and the control at 30 Mg ha−1 of SA in TQ soil, and at 15 and 30 Mg ha−1 in RH soil (Table 4). In contrast, Mg content was consistently lower in all SA treatments compared to the additional treatment in both soil types (Table 4). For Si, significant differences were found at 60 Mg ha−1 of SA in TQ soil, and at 0.0 and 7.5 Mg ha−1 in RH soil (Table 4).
The available content of P, Ca, Mg, and Si linearly increased with increasing application rates (Figure 3), ranging from 15.88 to 27.13 mg kg−1 (Figure 3a), 6.88 to 23.38 mmolc kg−1 (Figure 3b), 2.50 to 3.75 mmolc kg−1 (Figure 3c), and 5.71 to 7.37 mg kg−1 (Figure 3d), respectively.
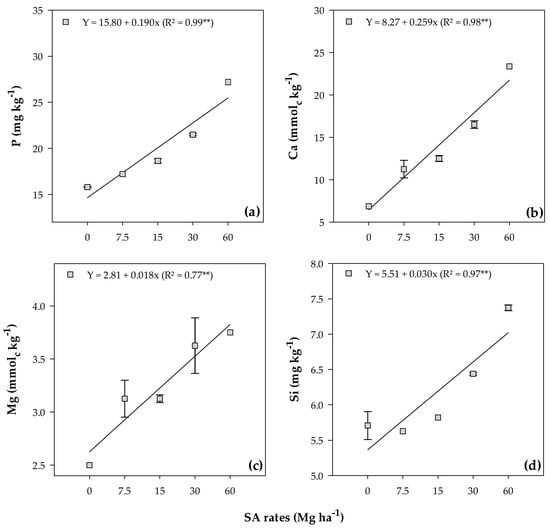
Figure 3.
Phosphorus (a), Ca (b), Mg (c), and Si (d) mean values in both soils after soybean cultivation in response to the residual effect of SA rates. **—Significant at the 1% probability level. Bars stand for the St. Err. of the mean.
3.2. Plant
There was an interaction between SA rates and soil types for Si and Ca accumulation (Table 5). Furthermore, there was a variation among soil types for Ca, Mg, and Si accumulation (Table 5). It was observed that Ca and Mg showed higher accumulations when plants were grown in sandy soil (TQ), while Si showed higher values when plants were grown in medium-textured soil (RH) (Table 5).
Table 5.
Effect of treatments on the accumulation of P, Ca, Mg, and Si in the aboveground parts of soybean plants grown in Typic Quartzipsamment (TQ) and Rhodic Hapludox (RH) soils.
Using Dunnett’s test, the additional treatment, for P and Ca accumulation, differed only from the 0.0 and 7.5 Mg ha−1 SA rates in the TQ soil, respectively (Table 5). There was no difference in Mg accumulation between conventionally fertilized plants and plants grown in both soils with SA rates (Table 5). However, for Si accumulation, all SA rates in the TQ soil differed from the additional treatment, and in the RH soil, only the control and the 15 Mg ha−1 SA rate differed from the additional treatment (Table 5).
There was an increase in Ca accumulation in response to the applied rates, ranging from 119.95 to 152.87 mg of Ca per plant (Figure 4).
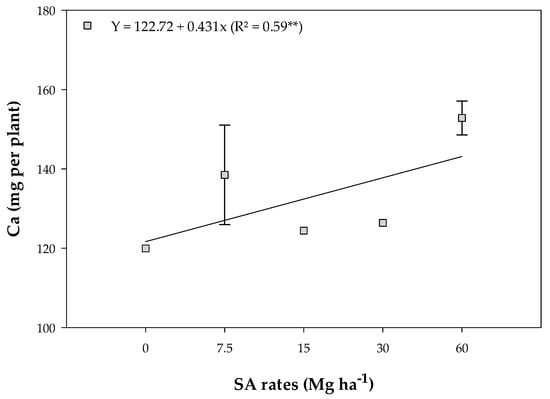
Figure 4.
Calcium (Ca) mean values in the shoot of soybean plants in response to the residual effect of the application of SA rates. **—Significant at 1% probability. Bars stand for the St. Err. of the mean.
Silicon accumulation was influenced by SA rates in TQ soil (Figure 5), with a quadratic fit and a maximum point at a rate of 50 Mg ha−1 (16.01 mg of Si per plant) (Figure 5). However, there was no difference between SA rates for silicon accumulation in RH soil, and the average value was 15.62 mg of Si per plant (Figure 5).
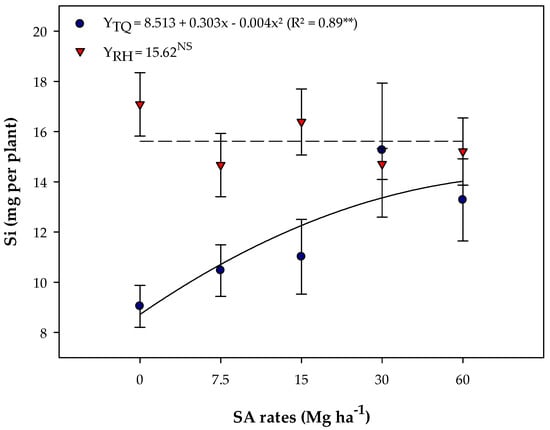
Figure 5.
Silicon accumulation in the shoot of soybean plants grown in Typic Quartzipsamment (TQ) and Rhodic Hapludox (RH) soils in response to the residual effect of applied SA rates. **, and NS—Significant at 1% probability level and not significant, respectively. Bars stand for the St. Err. of the mean.
There was an interaction between SA rates and soil types for plant height (PH) (Table 6). There was variation in aboveground dry matter (ADM) among soil types, with the highest ADM observed in plants grown in RH soil (Table 6).
Table 6.
Effect of treatments on plant height (PH) at 50 days after emergence (DAE) and aboveground dry matter (ADM) at 80 DAE of soybean plants cultivated in Typic Quartzipsamment (TQ) and Rhodic Hapludox (RH) soils.
Based on Dunnett’s test, there was no significant difference in soil pH or aboveground dry mass (ADM) between conventionally fertilized plants and plants grown in the two soils with SA treatments (Table 6).
There was no adjustment to the regression models for pH in both soils (Figure 6), with an average content of 106.40 cm found for TQ and 110.10 cm for RH (Figure 6).
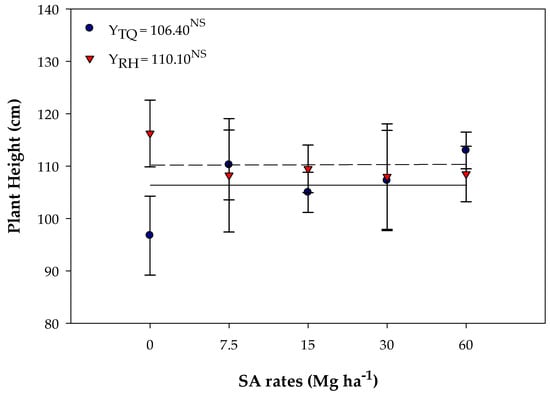
Figure 6.
Soybean plant height (PH) in Typic Quartzipsamment (TQ) and Rhodic Hapludox (RH) soils in response to the residual effect of SA application. NS—Not significant. Bars stand for the St. Err. of the mean.
There was no effect of treatments and the interaction between SA rates and soil types on the anatomical-foliar characteristics (Table 7).
Table 7.
Effect of treatments on leaf anatomical component thickness in soybean grown in Typic Quartzipsamment (TQ) and Rhodic Hapludox (RH) soils.
There were no variations in thickness (µm) observed among the analyzed soybean leaf tissues: adaxial epidermis, palisade parenchyma, spongy parenchyma, abaxial epidermis, and total leaf thickness (Figure 7).
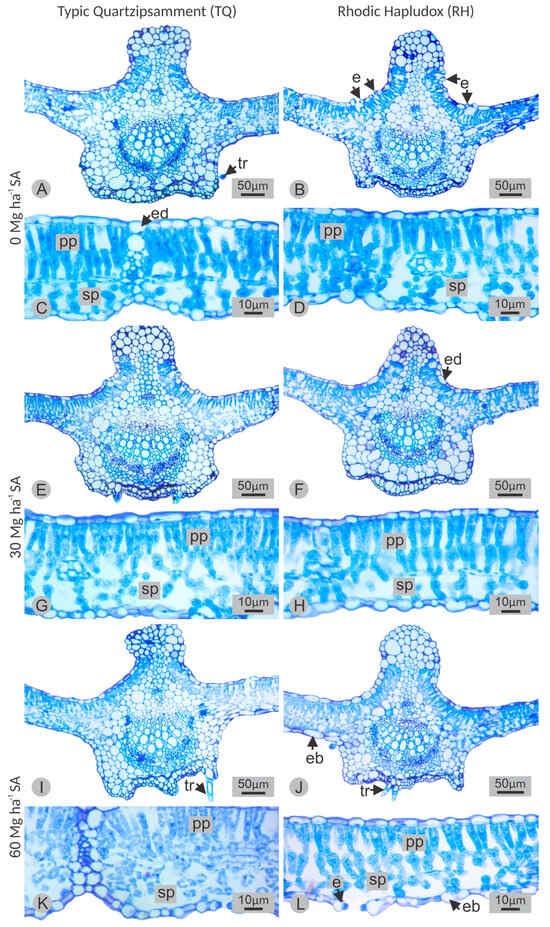
Figure 7.
Cross-sections of soybean leaves cultivated in a Typic Quartzipsamment (TQ) and a Rhodic Hapludox (RH) soil as a function of SA rates (0, 30, and 60 Mg ha−1). (A,B,E,F,I,J) showing the central vein. (C,D,G,H,K,L) showing the leaf lamina. e = stomata, eb = abaxial epidermis, ed = adaxial epidermis, pp = palisade parenchyma, sp = spongy parenchyma, tr = trichome.
The mean thickness of the adaxial epidermis was 5.37 µm and 5.08 µm for TQ and RH, respectively (Table 7). For the abaxial epidermis, the mean thickness was 5.46 µm in TQ and 5.80 µm in RH (Table 7). The mean thickness of the palisade parenchyma was 17.30 µm in TQ and 17.07 µm in RH (Table 7). The spongy parenchyma had a mean thickness of 39.23 µm in TQ and 36.75 µm in RH (Table 7). The total mean thickness was 67.50 µm in TQ and 65.05 µm in RH (Table 7).
There was no interaction between SA rates and soil types on stomatal density on both leaf surfaces of soybean (Table 8). However, there was an influence of SA rates and soil type on stomatal density on the adaxial leaf surface (Table 8), with higher stomatal density observed when plants were grown in medium-textured (RH) soil (Table 8; Figure 8). Furthermore, rates of 30 and 60 Mg ha−1 provided higher stomatal density on the adaxial leaf surface (Table 8; Figure 8).
Table 8.
Effect of treatments on stomatal density of adaxial and abaxial leaf epidermis of soybean cultivated in Typic Quartzipsamment (TQ) and Rhodic Hapludox (RH) soils.
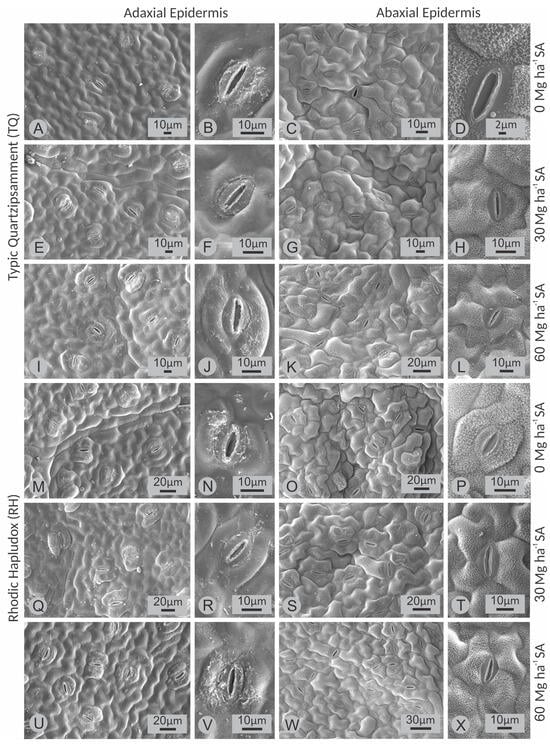
Figure 8.
Scanning electron microscopy of the leaf surface of soybean cultivated in a Typic Quartzipsamment (TQ) and a Rhodic Hapludox (RH) soil as a function of the application of rates (0; 30 and 60 Mg ha−1) of silicate mineral fertilizer (SMF), as indicated laterally to the images. (A,E,I,M,Q,U), wide view of the adaxial epidermis; (B,F,J,N,R,V) showing detail of stomata of the adaxial epidermis. (C,G,K,O,S,W) wide view of the abaxial epidermis; (D,H,L,P,T,X) showing detail of stomata of the abaxial epidermis.
4. Discussion
4.1. Main Outcomes
In the TQ soil, there was a change in the active acidity classification (pH), shifting from high (4.4–5.0) to medium acidity (5.1–5.5) [28]. Thus, the neutralizing power of SA is evident, acting as an acidity corrector for both soils, although with greater effectiveness for TQ, which has a lower buffering capacity compared to RH. The results agree with those of Ramos et al. [9], where the application of the agromineral acted as an acidity corrector in the short term (140 days). Similarly, in the study conducted by Silva et al. [36], there was an increase in soil pH, attributed to the amounts of CaO (8.56%) and MgO (4.82%) present in the basalt powder, whereas in the SA used here, the amounts of CaO and MgO are 10.42 and 5.67%, respectively.
The (SiO4)−4 present in SA reacts with H₂O in soils, resulting in (HSiO₄)3− and OH−. The latter combines with Al3⁺, forming the coprecipitated form of Al(OH)₃ [37], which explains the reduction in soil acidity and Al content. Since Al is toxic to plants and can cause nutritional deficiencies, reducing its toxic levels in soils is crucial, as most agricultural crops do not reach their maximum production potential when grown in highly acidic soils [38].
The decrease in potential and exchangeable acidity may have contributed to the increase in CEC in TQ (lower buffering capacity). It is known that Al3+ is insolubilized as hydroxide, resulting in an increase in charges, which consequently leads to an increase in CEC [39]. The increase in the sum of bases (SB) values is mainly due to the increase in Ca content in the soils. Ramos et al. [8], Medeiros et al. [40], and Dalmora et al. [41] demonstrated that the application of rock dust resulted in SB values that comply with the standards for a remineralizing product.
Phosphorous content increased with the application of SA rates, as Si restricts P sorption onto Fe and Al hydroxides [42]. The silicate anion, provided by the silicate mineral, competes with the phosphate anion for the same adsorption site, increasing P availability [43]. In addition, soil acidity correction leads to an increase in OH− ions that can cause desorption of phosphate ions, increasing their availability in the soil [44]. A change in the P class was observed for annual crops in the TQ soil, moving from low levels (7–15 mg kg−1) to medium levels (16–40 mg kg−1) at the highest rate [28]. We found that adding basalt powder to both RH and TQ soils increased their phosphorus content. The highest dose we tested (96 Mg ha−1) led to the highest phosphorus levels [45].
To achieve maximum crop productivity, agriculture depends on higher-cost inputs, mainly inorganic phosphate fertilizers [46]. However, in the long term, this system is not considered economically or environmentally sustainable, since phosphate fertilizers are a non-renewable resource and promote eutrophication of the environment [47], therefore, management with silicate minerals can mitigate future P scarcity.
Even after increasing available Mg levels in the soil, concentrations are still considered low (0–4 mmolc kg−1) [48], suggesting that this element is likely bound in low-solubility minerals with slow weathering rates. While another study observed an increase in soil magnesium content following basalt powder application, the levels remained quite low [45]. However, these values become significant considering the overall low soil Mg content. The slow solubility of SA does not preclude a significant impact on crop nutrition, favoring its residual effect and acting as a complementary fertilizer, thereby reducing the demand for mineral fertilizers over cropping cycles [43].
The dissociation, polymerization, and precipitation of Si in soil are associated with its concentration in the soil solution, the presence of Fe and Al oxides, and soil pH [49]. The increase in pH, up to a certain point, increases the availability of Si in soils and its uptake by plants [50], indicating an increase in Si content. Swoboda et al. [17] observed that silicate rocks and minerals with low solubility, such as granites, basalts, and feldspars, have the potential to release Si.
Calcium accumulation in soybean plants is directly related to the amounts of this nutrient in the SA (10.42% CaO). These results demonstrate that even with low solubility and slow alteration of the minerals present in the SA, there is a residual effect with the release of available Ca in the soils, thus enabling increased absorption. Rodrigues et al. [45] found that after a 170-day incubation period with basalt dust, followed by 70 days of Urochloa brizantha (A.Rich.) R.D.Webster growth, calcium accumulation increased by 139% in Typic Quartzipsamment soil and by a significant 208% in Oxisol at the maximum application rate of 96 Mg ha−1.
There is a marked difference among plant species in their ability to accumulate Si [51]. The low capacity to accumulate Si can be explained by the amount of Lsi1 (from soil to root) and Lsi2 (from root to xylem) transporters in root cells, as these are related to the absorption and transport of this element in the plant [52]. Moreover, there is a relationship between Si accumulation and plant stress, whereby when plants are subjected to biotic and/or abiotic stresses, Si accumulation in the shoot is more pronounced [53,54]. This may explain the less pronounced accumulation in the shoot of soybean, since the conditions were favorable for plant development (greenhouse) and these plants are not classified as Si accumulators.
The soybean epidermis is uniseriate in cross-section, characterized by elliptical to circular cells on both leaf surfaces and covered by a thin cuticle [55], as observed in our study (Figure 7C,D,G,H,K,L). Uniseriate tector trichomes, typical of the Fabaceae family, are present (Figure 7I,J), comprising a basal cell, an intermediate cell, and an elongated apical cell [56]. The high density of these trichomes disrupts the continuous film of water on the leaf surface, thereby inhibiting spore germination and bacterial proliferation [57]. Furthermore, trichomes serve as a physical barrier, providing a crucial defense mechanism against pathogen invasion [58].
The mesophyll is dorsiventral, consisting of two layers of palisade cells (Figure 7H) and spongy parenchyma (Figure 7K). The spongy parenchyma is composed of cells of various shapes and sizes with prominent intercellular spaces [59].
Soybean leaves are amphistomatic, meaning stomata are present on both the adaxial and abaxial surfaces, and are of the paracytic type (Figure 8). This type of stomata is common to many genera in the Fabaceae family and does not present a characteristic stomata type [60]. Stomata number is an environmentally influenced trait and varies among soybean cultivars [61]. Furthermore, plant nutritional status [62] and available water [63] also contribute to variations in stomatal density. The higher water retention in RH soil, compared to TQ soil, explains the higher stomatal density on the adaxial surface in this soil.
Stomatal density directly interferes with plant photosynthesis and transpiration [64]. In addition to stomatal density, the size and arrangement of stomata on the abaxial and adaxial leaf surfaces define restrictions on gas exchange rates [65]. An increase in stomatal density is generally associated with an increase in stomatal conductance, resulting in a more intense flow of water vapor and carbon dioxide. This dynamic can favor photosynthesis by increasing CO2 capture, which is essential for plant metabolism, and promote transpiration, which aids in leaf cooling. However, in environments with limited water availability, this high conductance can lead to excessive water loss, compromising water use efficiency [66,67].
This study reinforces the potential of using silicate agrominerals, particularly in regions with active rock mining, contributing to addressing global issues related to mineral and agricultural exploitation. However, it is necessary to consider the availability of rocky materials in regions close to the cultivated areas to avoid long-distance transportation, since economic viability is a determining factor for the practical application of this technology. Furthermore, the agronomic use of silicon-rich silicate agrominerals, due to their chemical characteristics, can be employed as a silicon source in weathered soils, with the aim of maintaining excess silicon in the soil-plant system [68]. Based on the obtained results, SA can be used as an acidity corrector and soil remineralizer, as it positively altered chemical attributes, improved the root environment, and increased the availability of nutrients and silicon.
4.2. Agronomic and Practical Implications
The research presented here is significant for several reasons. From an agronomic perspective, the following points can be stressed: (i) sustainable agriculture: the study focuses on reducing reliance on synthetic fertilizers, a crucial step toward sustainable agriculture. By exploring the potential of SA as a natural alternative, it contributes to minimizing environmental impact and promoting long-term soil health, thus (ii) soil health improvement: the research highlights the positive effects of SA on soil properties, including increased pH, reduced aluminum toxicity, and enhanced CEC. These improvements create a more favorable environment for plant growth and nutrient uptake and indeed (iii) nutrient management: by increasing the availability of essential nutrients like P and Ca, SA can optimize nutrient management strategies. This can lead to more efficient fertilizer use, reducing costs and environmental risks. The previous three points bring together an enhanced climate change resilience. Indeed, silicon-rich agrominerals can enhance plant tolerance to various stresses, including drought, salinity, and pest and disease attacks. This is particularly important in the context of climate change, where crops face increasing challenges.
From the practical application perspective, our research also regards: (i) precision agriculture: the findings can inform precision agriculture practices, allowing farmers to tailor fertilizer applications based on specific soil and crop needs. This can optimize resource use and reduce environmental pollution; (ii) organic farming: SA can be a valuable tool for organic farmers, providing a natural way to improve soil health and crop productivity without relying on synthetic inputs; (iii) sustainable land management: the research contributes to sustainable land management practices by promoting the use of locally available, environmentally friendly soil amendments, (iv) food security: by enhancing crop yields and quality, SA can contribute to food security, especially in regions with limited access to synthetic fertilizers or where soil degradation is a significant issue.
While the positive effects of agrominerals are well-known, their widespread use has yet to be adopted. This is because it requires not just a change in inputs, from mineral fertilizers to rock powders, but a fundamental shift in the conception of agroecosystem fertility management. Overall, this research provides valuable insights into the potential of SA to improve soil health, enhance crop performance, and promote sustainable agriculture. By understanding the mechanisms of action and optimizing their application, farmers and agricultural practitioners can make informed decisions to achieve higher yields, better quality crops, and a more sustainable agricultural system.
5. Conclusions
The application of silicate agrominerals (SA) demonstrated significant potential as an acidity corrector and soil remineralizer. In particular, the TQ soil, with its lower buffering capacity, exhibited a more pronounced response to SA treatment. The increase in pH, reduction in Al toxicity, and enhancement of CEC were evident, leading to improved soil fertility. The addition of SA also positively influenced nutrient availability, especially P. The silicate anion’s ability to compete with phosphate for adsorption sites and the increased OH− ions contributed to higher P availability, as observed by the shift in P class for annual crops in TQ soil. While Mg levels remained low, it is an essential element for plants, playing a fundamental role in their growth and productivity. The slow release of this nutrient from SA can provide a long-term benefit, complementing mineral fertilizer inputs and reducing the need for intensive fertilization. The increase in Si availability, facilitated by the pH rise, enhanced Si uptake by soybean plants. However, the low Si accumulation capacity of soybean limited the extent of this effect. The study also revealed the morphological characteristics of soybean leaves, including the presence of uniseriate tector trichomes and amphistomatic leaves with paracytic stomata. These features contribute to the plant’s defense mechanisms and water use efficiency. The use of SA represents a promising approach to sustainable agriculture. By improving soil quality, nutrient availability, and plant health, SA can help mitigate the negative impacts of intensive farming practices and contribute to a more environmentally friendly and productive agricultural system.
Author Contributions
Conceptualization, T.A.R.N., M.d.C.R., M.C.M.T.F., A.G., G.F.C., A.D.J. and L.G.F.L.; methodology, M.d.C.R., I.S.C., A.R.M., M.C.M.T.F. and L.G.F.L.; validation, A.G., A.R.M., C.H.A.-J., G.F.C. and T.A.R.N.; formal analysis, M.d.C.R., I.S.C., H.S.P., L.G.F.L. and M.C.M.T.F.; investigation, M.d.C.R., R.S.A., F.S.G. and I.S.C.; data curation, M.d.C.R. and I.S.C.; writing—original draft preparation, M.d.C.R., I.S.C., C.H.A.-J., A.G., G.F.C., L.G.F.L., M.C.M.T.F. and T.A.R.N.; writing—review and editing, A.G., A.R.M., F.S.G., H.S.P., L.G.F.L., R.S.A., I.S.C., A.D.J., G.F.C. and T.A.R.N.; visualization, M.d.C.R., A.G., A.R.M., L.G.F.L. and T.A.R.N.; supervision, M.d.C.R., A.G., G.F.C., M.C.M.T.F. and T.A.R.N.; project administration, T.A.R.N.; funding acquisition, T.A.R.N. All authors have read and agreed to the published version of the manuscript.
Funding
This study was financed in part by the Ilha Solteira Education, Research and Extension Foundation (FEPISA), project No. 2001/2020.
Data Availability Statement
Data will be available on request (last author).
Acknowledgments
We thank The São Paulo Research Foundation (FAPESP) for the scholarship granted to the first author (Grant Number 21/04123-6). We thank the Study Group on Nutrition, Fertilization, and Soil Fertility (GENAFERT) for technical support. Our sincere gratitude also goes to Neri Marcante from MINERAGRO Pesquisa Agronômica for supplying the silicate agromineral used in the study. Thiago Nogueira also thanks The National Council for Scientific and Technological Development (CNPq) for the fellowship (grant number 308374/2021-5).
Conflicts of Interest
The authors declare no conflicts of interest. The funders had no role in the design of the study; in the collection, analyses, or interpretation of data; in the writing of the manuscript; or in the decision to publish the results.
List of Acronyms and Abbreviations
| Abbreviation Acronym | Meaning |
| SA | Silicate agrominerals |
| CF | Conventional fertilizers |
| SB | Sum of bases |
| CEC | Cation-exchange capacity |
| BS | Base saturation |
| PTE | Potentially toxic elements |
| TQ | Typic Quartzipsamment |
| RH | Rhodic Hapludox |
| L + CMF | Application of lime + conventional mineral fertilization |
| PRNT | Relative total neutralizing power |
| SEM | Scanning electron microscopy |
| DAE | Days after emergence |
| ADM | Aboveground dry matter |
| PH | Plant height |
| CV | Coefficient of variation |
| °C | Celsius degrees |
| nm | Nanometer |
| mm | Millimeter |
| cm | Centimeter |
| mL | Milliliter |
| g | Gram |
| mg kg−1 | Milligrams per kilogram |
| mg L−1 | Milligrams per liter |
| g L−1 | Grams per liter |
| g kg−1 | Grams per kilogram |
| g per plant | Grams per plant |
| Mg ha−1 | Megagrams per hectare |
| mol L−1 | Moles per liter |
| mmolc kg−1 | Millimoles of charge per kilogram |
References
- Mishra, R.; Tripathi, M.K.; Sikarwar, R.S.; Singh, Y.; Tripathi, N. Soybean (Glycine Max L. Merrill): A Multipurpose Legume Shaping Our World. Plant Cell Biotechnol. Mol. Biol. 2024, 25, 17–37. [Google Scholar] [CrossRef]
- Makwana, K.; Soybeans for Global Nutrition: A Numbers Story. Sustainable Nutrition Initiative 2024. Available online: https://sustainablenutritioninitiative.com/soybeans-for-global-nutrition-a-numbers-story/ (accessed on 19 October 2024).
- Companhia Nacional de Abastecimento Acompanhamento da Safra Brasileira de Grãos. Available online: https://www.conab.gov.br/info-agro/safras/graos/boletim-da-safra-de-graos (accessed on 19 October 2023).
- Confederação da Agricultura e Pecuária Jazidas e Bioinsumos Minimizam Falta de Fertilizante Estrangeiro. Available online: https://www.cnabrasil.org.br/ (accessed on 19 October 2023).
- Plano Nacional de Fertilizantes 2050. Available online: https://static.poder360.com.br/2022/03/plano-nacional-de-fertilizantes-brasil-2050.pdf (accessed on 19 October 2023).
- Ogino, C.M.; Vieira Filho, J.E.R. Preços de fertilizantes impactando a produção agrícola brasileira. BRUA 2022, 27, 151–154. [Google Scholar] [CrossRef]
- Mbissik, A.; Elghali, A.; Ouabid, M.; Raji, O.; Bodinier, J.-L.; El Messbahi, H. Alkali-Hydrothermal Treatment of K-Rich Igneous Rocks for Their Direct Use as Potassic Fertilizers. Minerals 2021, 11, 140. [Google Scholar] [CrossRef]
- Ramos, C.G.; Querol, X.; Oliveira, M.L.S.; Pires, K.; Kautzmann, R.M.; Oliveira, L.F.S. A Preliminary Evaluation of Volcanic Rock Powder for Application in Agriculture as Soil a Remineralizer. Sci. Total Environ. 2015, 512–513, 371–380. [Google Scholar] [CrossRef]
- Ramos, C.G.; dos Santos de Medeiros, D.; Gomez, L.; Oliveira, L.F.S.; Schneider, I.A.H.; Kautzmann, R.M. Evaluation of Soil Re-Mineralizer from By-Product of Volcanic Rock Mining: Experimental Proof Using Black Oats and Maize Crops. Nat. Resour. Res. 2020, 29, 1583–1600. [Google Scholar] [CrossRef]
- Dalmora, A.C.; Ramos, C.G.; Silva Oliveira, M.L.; Silva Oliveira, L.F.; Homrich Schneider, I.A.; Kautzmann, R.M. Application of Andesite Rock as a Clean Source of Fertilizer for Eucalyptus Crop: Evidence of Sustainability. J. Clean. Prod. 2020, 256, 120432. [Google Scholar] [CrossRef]
- Ramos, C.G.; Hower, J.C.; Blanco, E.; Oliveira, M.L.S.; Theodoro, S.H. Possibilities of Using Silicate Rock Powder: An Overview. Geosci. Front. 2022, 13, 101185. [Google Scholar] [CrossRef]
- Kelemen, P.B.; McQueen, N.; Wilcox, J.; Renforth, P.; Dipple, G.; Vankeuren, A.P. Engineered Carbon Mineralization in Ultramafic Rocks for CO2 Removal from Air: Review and New Insights. Chem. Geol. 2020, 550, 119628. [Google Scholar] [CrossRef]
- Kelland, M.E.; Wade, P.W.; Lewis, A.L.; Taylor, L.L.; Sarkar, B.; Andrews, M.G.; Lomas, M.R.; Cotton, T.E.A.; Kemp, S.J.; James, R.H.; et al. Increased Yield and CO2 Sequestration Potential with the C4 Cereal Sorghum Bicolor Cultivated in Basaltic Rock Dust-Amended Agricultural Soil. Glob. Change Biol. 2020, 26, 3658–3676. [Google Scholar] [CrossRef] [PubMed]
- Beerling, D.J.; Kantzas, E.P.; Lomas, M.R.; Wade, P.; Eufrasio, R.M.; Renforth, P.; Sarkar, B.; Andrews, M.G.; James, R.H.; Pearce, C.R.; et al. Potential for Large-Scale CO2 Removal via Enhanced Rock Weathering with Croplands. Nature 2020, 583, 242–248. [Google Scholar] [CrossRef] [PubMed]
- Theodoro, S.H.; de Paula Medeiros, F.; Ianniruberto, M.; Jacobson, T.K.B. Soil Remineralization and Recovery of Degraded Areas: An Experience in the Tropical Region. J. S. Am. Earth Sci. 2021, 107, 103014. [Google Scholar] [CrossRef]
- Manning, D.A.C.; Theodoro, S.H. Enabling Food Security through Use of Local Rocks and Minerals. Extr. Ind. Soc. 2020, 7, 480–487. [Google Scholar] [CrossRef]
- Swoboda, P.; Döring, T.F.; Hamer, M. Remineralizing Soils? The Agricultural Usage of Silicate Rock Powders: A Review. Sci. Total Environ. 2022, 807, 150976. [Google Scholar] [CrossRef]
- Tamfuh, P.A.; Wotchoko, P.; Nono, D.G.K.; Ndofor, C.N.Y.; Nkouathio, D.G.; Bitom, D. Comparative Effects of Basalt Dust, NPK 20-10-10 and Poultry Manure on Soil Fertility and Cucumber (Cucumis sativus) Productivity in Bafut (Cameroon Volcanic Line). Earth Sci. 2019, 8, 323–334. [Google Scholar] [CrossRef]
- Greger, M.; Landberg, T.; Vaculík, M. Silicon Influences Soil Availability and Accumulation of Mineral Nutrients in Various Plant Species. Plants 2018, 7, 41. [Google Scholar] [CrossRef] [PubMed]
- Yan, G.; Nikolic, M.; Ye, M.; Xiao, Z.; Liang, Y. Silicon Acquisition and Accumulation in Plant and Its Significance for Agriculture. J. Integr. Agric. 2018, 17, 2138–2150. [Google Scholar] [CrossRef]
- dos Santos, L.F.; Sodré, F.F.; Martins, É.d.S.; de Figueiredo, C.C.; Busato, J.G. Effects of Biotite Syenite on the Nutrient Levels and Electrical Charges in a Brazilian Savanna Ferralsol. Pesqui. Agropecu. Trop. 2021, 51, e66691. [Google Scholar] [CrossRef]
- Nogueira, T.A.R.; Miranda, B.G.; Jalal, A.; Lessa, L.G.F.; Filho, M.C.M.T.; Marcante, N.C.; Abreu-Junior, C.H.; Jani, A.D.; Capra, G.F.; Moreira, A.; et al. Nepheline Syenite and Phonolite as Alternative Potassium Sources for Maize. Agronomy 2021, 11, 1385. [Google Scholar] [CrossRef]
- Esclarecimentos Sobre Uso de Agrominerais Silicáticos (Remineralizadores) Na Agricultura—Esclarecimentos Oficiais—Portal Embrapa. Available online: https://www.embrapa.br/esclarecimentos-oficiais/-/asset_publisher/TMQZKu1jxu5K/content/esclarecimentos-sobre-uso-de-agrominerais-silicaticos-remineralizadores-na-agricultura?inheritRedirect=false (accessed on 25 October 2023).
- van Raij, B.; Andrade, J.C.; Cantarella, H.; Quaggio, J.A. Análise Química Para Avaliar Fertilidade Em Solos Tropicais, 1st ed.; Instituto Agronômico de Campinas: Campinas, Brazil, 2001; 285p. [Google Scholar]
- Teixeira, P.C.; Donagemma, G.K.; Fontana, A.; Teixeira, W.G. Manual de Métodos de Análise de Solo, 3rd ed.; Embrapa: Brasília, Brazil, 2017. [Google Scholar]
- Pereira, H.S.; Korndörfer, G.H. Análise de Silício No Solo, Planta e Fertilizante, 2nd ed.; Boletim Técnico, 02; GPSi-ICIAG-UFU: Uberlândia, Brazil, 2016. [Google Scholar]
- MAPA Instrução Normativa No 5, de 10 de Março de 2016. Available online: https://www.gov.br/agricultura/pt-br/assuntos/insumos-agropecuarios/insumos-agricolas/fertilizantes/legislacao/in-5-de-10-3-16-remineralizadores-e-substratos-para-plantas.pdf (accessed on 10 May 2024).
- Cantarella, H.; Zambrosi, F.C.B.; Quaggio, J.A.; Duarte, A.P. Cereais. In Recomendações de Adubação e Calagem para o Estado de São Paulo; Instituto Agronômico de Campinas: Campinas, Brazil, 2022; pp. 213–236. [Google Scholar]
- Malavolta, E. Elementos de Nutrição Mineral Das Plantas; Agronômica Ceres: São Paulo, Brazil, 1980. [Google Scholar]
- Fehr, W.; Caviness, C. Stages of Soybean Development; Iowa Agricultural Experiment Station, Iowa Cooperative External Series; Iowa State University: Ames, IA, USA, 1977. [Google Scholar]
- Malavolta, E.; Vitti, G.C.; de Oliveira, S.A. Avaliação do Estado Nutricional das Plantas: Princípios e Aplicações, 2nd ed.; Potafos: Piracicaba, Brazil, 1997. [Google Scholar]
- Johansen, D.A. Plant Microtechnique; McGraw-Hill: New York, NY, USA, 1940. [Google Scholar]
- Sakai, W.S. Simple Method for Differential Staining of Paraffin Embedded Plant Material Using Toluidine Blue o. Stain Technol. 1973, 48, 247–249. [Google Scholar] [CrossRef] [PubMed]
- Dedavid, B.A.; Gomes, C.I.; Machado, G. Microscopia Eletrônica de Varredura: Aplicações e Preparação de Amostras: Materiais Poliméricos, Metálicos e Semicondutores; EDIPUCRS: Porto Alegre, Brazil, 2007; ISBN 978-85-7430-702-2. [Google Scholar]
- R Core Team, R. The R Project for Statistical Computing. Available online: https://www.r-project.org/index.html (accessed on 4 April 2024).
- Silva, A.D.; Almeida, J.A.D.; Schmitt, C.; Coelho, C.M.M. Avaliação Dos Efeitos Da Aplicação de Basalto Moído Na Fertilidade Do Solo e Nutrição de Eucalyptus Benthamii. FLORESTA 2012, 42, 69. [Google Scholar] [CrossRef]
- Cornelis, J.-T.; Delvaux, B.; Georg, R.B.; Lucas, Y.; Ranger, J.; Opfergelt, S. Tracing the Origin of Dissolved Silicon Transferred from Various Soil-Plant Systems towards Rivers: A Review. Biogeosciences 2011, 8, 89–112. [Google Scholar] [CrossRef]
- Sade, H.; Meriga, B.; Surapu, V.; Gadi, J.; Sunita, M.S.L.; Suravajhala, P.; Kishor, P.B.K. Toxicity and Tolerance of Aluminum in Plants: Tailoring Plants to Suit to Acid Soils. Biometals 2016, 29, 187–210. [Google Scholar] [CrossRef]
- Blum, W.E.H.; Herbinger, B.; Mentler, A.; Ottner, F.; Pollak, M.; Unger, E.; Wenzel, W.W. Zur Verwendung von Gesteinsmehlen in der Landwirtschaft. I. Chemisch-mineralogische Zusammensetzung und Eignung von Gesteinsmehlen als Düngemittel. Z. Pflanzenernährung Bodenkd. 1989, 152, 421–425. [Google Scholar] [CrossRef]
- Medeiros, D.S.; Sanchotene, D.M.; Ramos, C.G.; Oliveira, L.F.S.; Sampaio, C.H.; Kautzmann, R.M. Soybean Crops Cultivated with Dacite Rock By-Product: A Proof of a Cleaner Technology to Soil Remineralization. J. Environ. Chem. Eng. 2021, 9, 106742. [Google Scholar] [CrossRef]
- Dalmora, A.C.; Ramos, C.G.; Plata, L.G.; da Costa, M.L.; Kautzmann, R.M.; Oliveira, L.F.S. Understanding the Mobility of Potential Nutrients in Rock Mining By-Products: An Opportunity for More Sustainable Agriculture and Mining. Sci. Total Environ. 2020, 710, 136240. [Google Scholar] [CrossRef] [PubMed]
- Meharg, C.; Meharg, A.A. Silicon, the Silver Bullet for Mitigating Biotic and Abiotic Stress, and Improving Grain Quality, in Rice? Environ. Exp. Bot. 2015, 120, 8–17. [Google Scholar] [CrossRef]
- Luchese, A.V.; Pivetta, L.A.; Batista, M.A.; Steiner, F.; Giaretta, A.P.d.S.; Curtis, J.C.D. Agronomic Feasibility of Using Basalt Powder as Soil Nutrient Remineralizer. Afr. J. Agric. Res. 2021, 17, 487–497. [Google Scholar] [CrossRef]
- Sato, S.; Comerford, N.B. Influence of Soil pH on Inorganic Phosphorus Sorption and Desorption in a Humid Brazilian Ultisol. Rev. Bras. Ciênc. Solo 2005, 29, 685–694. [Google Scholar] [CrossRef]
- Rodrigues, M.; Bortolini, P.C.; Neto, C.K.; Andrade, E.A.; Passos, A.I.; Pacheco, F.P.; Nanni, M.R.; de Melo Teixeira, L. Unlocking Higher Yields in Urochloa Brizantha: The Role of Basalt Powder in Enhancing Soil Nutrient Availability. Discov. Soil 2024, 1, 4. [Google Scholar] [CrossRef]
- Withers, P.J.A.; Rodrigues, M.; Soltangheisi, A.; de Carvalho, T.S.; Guilherme, L.R.G.; Benites, V.d.M.; Gatiboni, L.C.; de Sousa, D.M.G.; Nunes, R.d.S.; Rosolem, C.A.; et al. Transitions to Sustainable Management of Phosphorus in Brazilian Agriculture. Sci. Rep. 2018, 8, 2537. [Google Scholar] [CrossRef] [PubMed]
- Santos, E.F.; Pongrac, P.; Reis, A.R.; White, P.J.; Lavres, J. Phosphorus–Zinc Interactions in Cotton: Consequences for Biomass Production and Nutrient-Use Efficiency in Photosynthesis. Physiol. Plant. 2019, 166, 996–1007. [Google Scholar] [CrossRef] [PubMed]
- van Raij, B.; Cantarella, H.; Quaggio, J.A.; Furlani, Â.M.C. Recomendações de Adubação e Calagem Para o Estado de São Paulo, 2nd ed. rev. atual.; Instituto Agronômico de Campinas: Campinas, Brazil, 1997. [Google Scholar]
- Korndörfer, G.H.; Souza, S.R. de Elementos Benéficos. In Nutrição Mineral de Plantas; Sociedade Brasileira de Ciência do Solo: Viçosa, Brazil, 2018; pp. 563–599. [Google Scholar]
- Castro, G.S.A.; Crusciol, C.A.C. Effects of Superficial Liming and Silicate Application on Soil Fertility and Crop Yield under Rotation. Geoderma 2013, 195–196, 234–242. [Google Scholar] [CrossRef]
- Mitani, N.; Chiba, Y.; Yamaji, N.; Ma, J.F. Identification and Characterization of Maize and Barley Lsi2-like Silicon Efflux Transporters Reveals a Distinct Silicon Uptake System from That in Rice. Plant Cell 2009, 21, 2133–2142. [Google Scholar] [CrossRef] [PubMed]
- Ma, J.F.; Yamaji, N. Functions and Transport of Silicon in Plants. Cell. Mol. Life Sci. 2008, 65, 3049–3057. [Google Scholar] [CrossRef] [PubMed]
- Gunes, A.; Inal, A.; Bagci, E.G.; Coban, S. Silicon-Mediated Changes on Some Physiological and Enzymatic Parameters Symptomatic of Oxidative Stress in Barley Grown in Sodic-B Toxic Soil. J. Plant Physiol. 2007, 164, 807–811. [Google Scholar] [CrossRef]
- Zhu, Y.; Gong, H. Beneficial Effects of Silicon on Salt and Drought Tolerance in Plants. Agron. Sustain. Dev. 2014, 34, 455–472. [Google Scholar] [CrossRef]
- Leal-Costa, M.V.; Aragão, F.J.L.; Tavares, E.S. Anatomia foliar de plantas transgênicas e não transgênicas de Glycine max (L.) Merrill (Fabaceae). Rev. Biociências 2008, 14, 23–31. [Google Scholar]
- Lackey, J.A. Leaflet Anatomy of Phaseoleae (Leguminosae: Papilionoideae) and Its Relation to Taxonomy. Bot. Gaz. 1978, 139, 436–446. [Google Scholar] [CrossRef]
- Silva, L.M.; Alquini, Y.; Cavallet, V.J. Inter-relações entre a anatomia vegetal e a produção vegetal. Acta Bot. Bras. 2005, 19, 183–194. [Google Scholar] [CrossRef]
- Kunwar, I.K.; Singh, T.; Sinclair, J.B. Histopathology of Mixed Infections by Colletotrichum truncatum and Phomopsis spp. or Cercospora sojina in Soybean Seeds. Phytopathology 1985, 75, 489–492. [Google Scholar] [CrossRef]
- Fisher, D.B. An Unusual Layer of Cells in the Mesophyll of the Soybean Leaf. Bot. Gaz. 1967, 128, 215–218. [Google Scholar] [CrossRef]
- Metcalfe, C.R.; Chalk, L.; Metcalfe, C.R.; Chalk, L. Anatomy of the Dicotyledons: Volume I: Systematic Anatomy of Leaf and Stem, with a Brief History of the Subject, 2nd ed.; Oxford University Press: Oxford, NY, USA, 1980; ISBN 978-0-19-854383-1. [Google Scholar]
- Buttery, B.R.; Tan, C.S.; Buzzell, R.I.; Gaynor, J.D.; MacTAVISH, D.C. Stomatal Numbers of Soybean and Response to Water Stress. Plant Soil 1993, 149, 283–288. [Google Scholar] [CrossRef]
- de Santana, J.R.F.; Paiva, R.; Resende, R.K.S.; de Castro, E.M.; Pereira, F.D.; Oliveira, L.M. Estímulo do comportamento fotoautotrófico durante o enraizamento in vitro de Annona glabra L., II. Aspectos da anatomia da folha antes da aclimatização. Ciênc. Agrotec. 2008, 32, 640–644. [Google Scholar] [CrossRef]
- Justo, C.F.; Soares, Â.M.; Gavilanes, M.L.; de Castro, E.M. Plasticidade anatômica das folhas de Xylopia brasiliensis Sprengel (Annonaceae). Acta Bot. Bras. 2005, 19, 112–123. [Google Scholar] [CrossRef]
- Zhu, J.; Yu, Q.; Xu, C.; Li, J.; Qin, G. Rapid Estimation of Stomatal Density and Stomatal Area of Plant Leaves Based on Object-Oriented Classification and Its Ecological Trade-Off Strategy Analysis. Forests 2018, 9, 616. [Google Scholar] [CrossRef]
- Kardiman, R.; Ræbild, A. Relationship between Stomatal Density, Size and Speed of Opening in Sumatran Rainforest Species. Tree Physiol. 2018, 38, 696–705. [Google Scholar] [CrossRef] [PubMed]
- Flexas, J. Drought-Inhibition of Photosynthesis in C3 Plants: Stomatal and Non-Stomatal Limitations Revisited. Ann. Bot. 2002, 89, 183–189. [Google Scholar] [CrossRef] [PubMed]
- Lawson, T.; Blatt, M.R. Stomatal Size, Speed, and Responsiveness Impact on Photosynthesis and Water Use Efficiency. Plant Physiol. 2014, 164, 1556–1570. [Google Scholar] [CrossRef]
- Tonello, M.S.; Korchagin, J.; Bortoluzzi, E.C. Environmental Agate Mining Impacts and Potential Use of Agate Residue in Rangeland. J. Clean. Prod. 2021, 280, 124263. [Google Scholar] [CrossRef]
Disclaimer/Publisher’s Note: The statements, opinions and data contained in all publications are solely those of the individual author(s) and contributor(s) and not of MDPI and/or the editor(s). MDPI and/or the editor(s) disclaim responsibility for any injury to people or property resulting from any ideas, methods, instructions or products referred to in the content. |
© 2024 by the authors. Licensee MDPI, Basel, Switzerland. This article is an open access article distributed under the terms and conditions of the Creative Commons Attribution (CC BY) license (https://creativecommons.org/licenses/by/4.0/).