Article

Optimum Nitrogen and Density Allocation for Trade−Off Between Yield and Lodging Resistance of Winter Wheat

1
College of Agronomy, Shandong Agricultural University, Tai’an 271018, China
2
State Key Laboratory of Wheat Improvement, Shandong Agricultural University, Tai’an 271018, China
*
Authors to whom correspondence should be addressed.
These authors contributed equally to this work.
Agronomy 2025, 15(1), 168; https://doi.org/10.3390/agronomy15010168
Submission received: 11 December 2024 / Revised: 3 January 2025 / Accepted: 10 January 2025 / Published: 11 January 2025
(This article belongs to the Section Soil and Plant Nutrition)

Abstract

:
Increasing nitrogen and planting density can enhance crop yield, but it can reduce lodging resistance due to decreased lignin content. There is an urgent need to find feasible measures to balance these conflicting factors. We conducted a two-year field experiment in Tai’an, Shandong Province, China, evaluated SN23 (lodging resistant) and SN16 (lodging sensitive), under three nitrogen applications (120 kg/ha, N1; 240 kg/ha, N2; 360 kg/ha, N3) and four planting densities (75 plants/m2, D1; 225 plants/m2, D2; 375 plants/m2, D3; 525 plants/m2, D4), with N2D2 as the control, and measured lodging resistance related indexes and yield. N2D3 (SN23) increased internode length by 0.40 cm, reduced fresh weight by 0.09 g, resulting in a bending moment reduction of 0.39 g/cm. Lignin, cellulose, and hemicellulose decreased by 18.27, 16.48, and 16.22 mg/g DW, while S and G lignin subunits decreased by 118.09 and 127.34 μg/g DW, and H subunit increased by 23.59 μg/g DW. Eventually, the breaking strength was reduced by 1.74 g/cm resulting in a reduction of 0.09 in the lodging resistance index. The yield reached 10.17 t/ha due to an increase in spike number by 100.33 plants/m2, achieving an optimal balance between yield and lodging resistance in this experiment. This study provides a viable solution for balancing lodging resistance and yield in winter wheat.

1. Introduction

Wheat (Triticum aestivum L.) contributes a fifth of the calories consumed in the global human diet and also supplies substantial amounts of protein, minerals, vitamins, and dietary fiber, and serves as a cornerstone for human and animal survival [1,2]. However, lodging causes yield losses of 7–80%, limiting yield potential [3,4,5]. Current strategies to boost yield rely on higher nitrogen inputs and increased planting density [6,7]. Unfortunately, these strategies can exacerbate lodging, ultimately reducing yields [3]. A discrepancy occurs between the resistance to lodging and the steady increase in yield [8]. There is an urgent need to investigate new strategies for nitrogen application combined with planting density to balance lodging resistance and yield.
Nitrogen application is crucial for boosting yield [9]. Nitrogen deficiency hampers growth and development, leading to reduced productivity [10,11,12]. Conversely, excessive nitrogen application results in elongated and enlarged cells, weakening structural integrity. This can lead to increased hollowness in thick- and thin-walled tissues, longer stems, a higher center of gravity, smaller stem diameters, and thinner stem walls [13,14,15,16,17]. During early stem development, high nitrogen downregulates genes (PAL, CoMT) related to lignin (reduced S and G subunits and increased H subunits), cellulose, and hemicellulose biosynthesis, leading to a decrease in mechanical strength [18,19,20,21,22]. Optimizing nitrogen application is essential for maximizing yield and lodging resistance.
Optimizing plant density serves as the primary approach to boosting crop yields [23]. Low planting density causes an inefficient use of resources, ultimately reducing productivity [24]. High planting density limits light penetration through the canopy, disrupts carbon distribution, and decreases cellulose production [25,26]. It also inhibits the activity of crucial genes, such as PAL and COMT, which are essential for lignin synthesis, resulting in fewer S and G lignin subunits [20,27,28,29,30]. This raises the likelihood of plants lodging and results in an additional decrease in yield.
Nitrogen fertilization and planting density are pivotal for boosting crop yield, as they modify the population structure, which in turn alters the light interception rate and radiation use efficiency, ultimately influencing lodging resistance and yield [31,32]. Elevating the nitrogen application and plant density can enhance plant growth, leading to an increase in green leaf surface area and the interception of photosynthetically active radiation (IPAR), which is a crucial prerequisite for the production of dry matter [33,34,35]. When nitrogen application is fixed, increasing planting density is often adopted as a strategy to augment the plant density per unit area, thereby compensating for deficiencies in productivity [15].
Nitrogen application exhibited a positive correlation with the number of spikes and thousand-kernel weight, while no significant association was observed with the number of grains [36]. Conversely, planting density positively correlated with the spike number and yield, but negatively correlated with the number of grains number per spike and 1000-grain weight [37]. Yield composition must be regulated by selecting the optimum planting density in conjunction with appropriate nitrogen fertilizer application to achieve maximum yield [38,39].
This necessitates a trade−off between lodging resistance and yield formation. The present study aims to identify optimal strategies for stable yield and lodging resistance by quantifying relevant lodging resistance and yield.

2. Materials and Methods

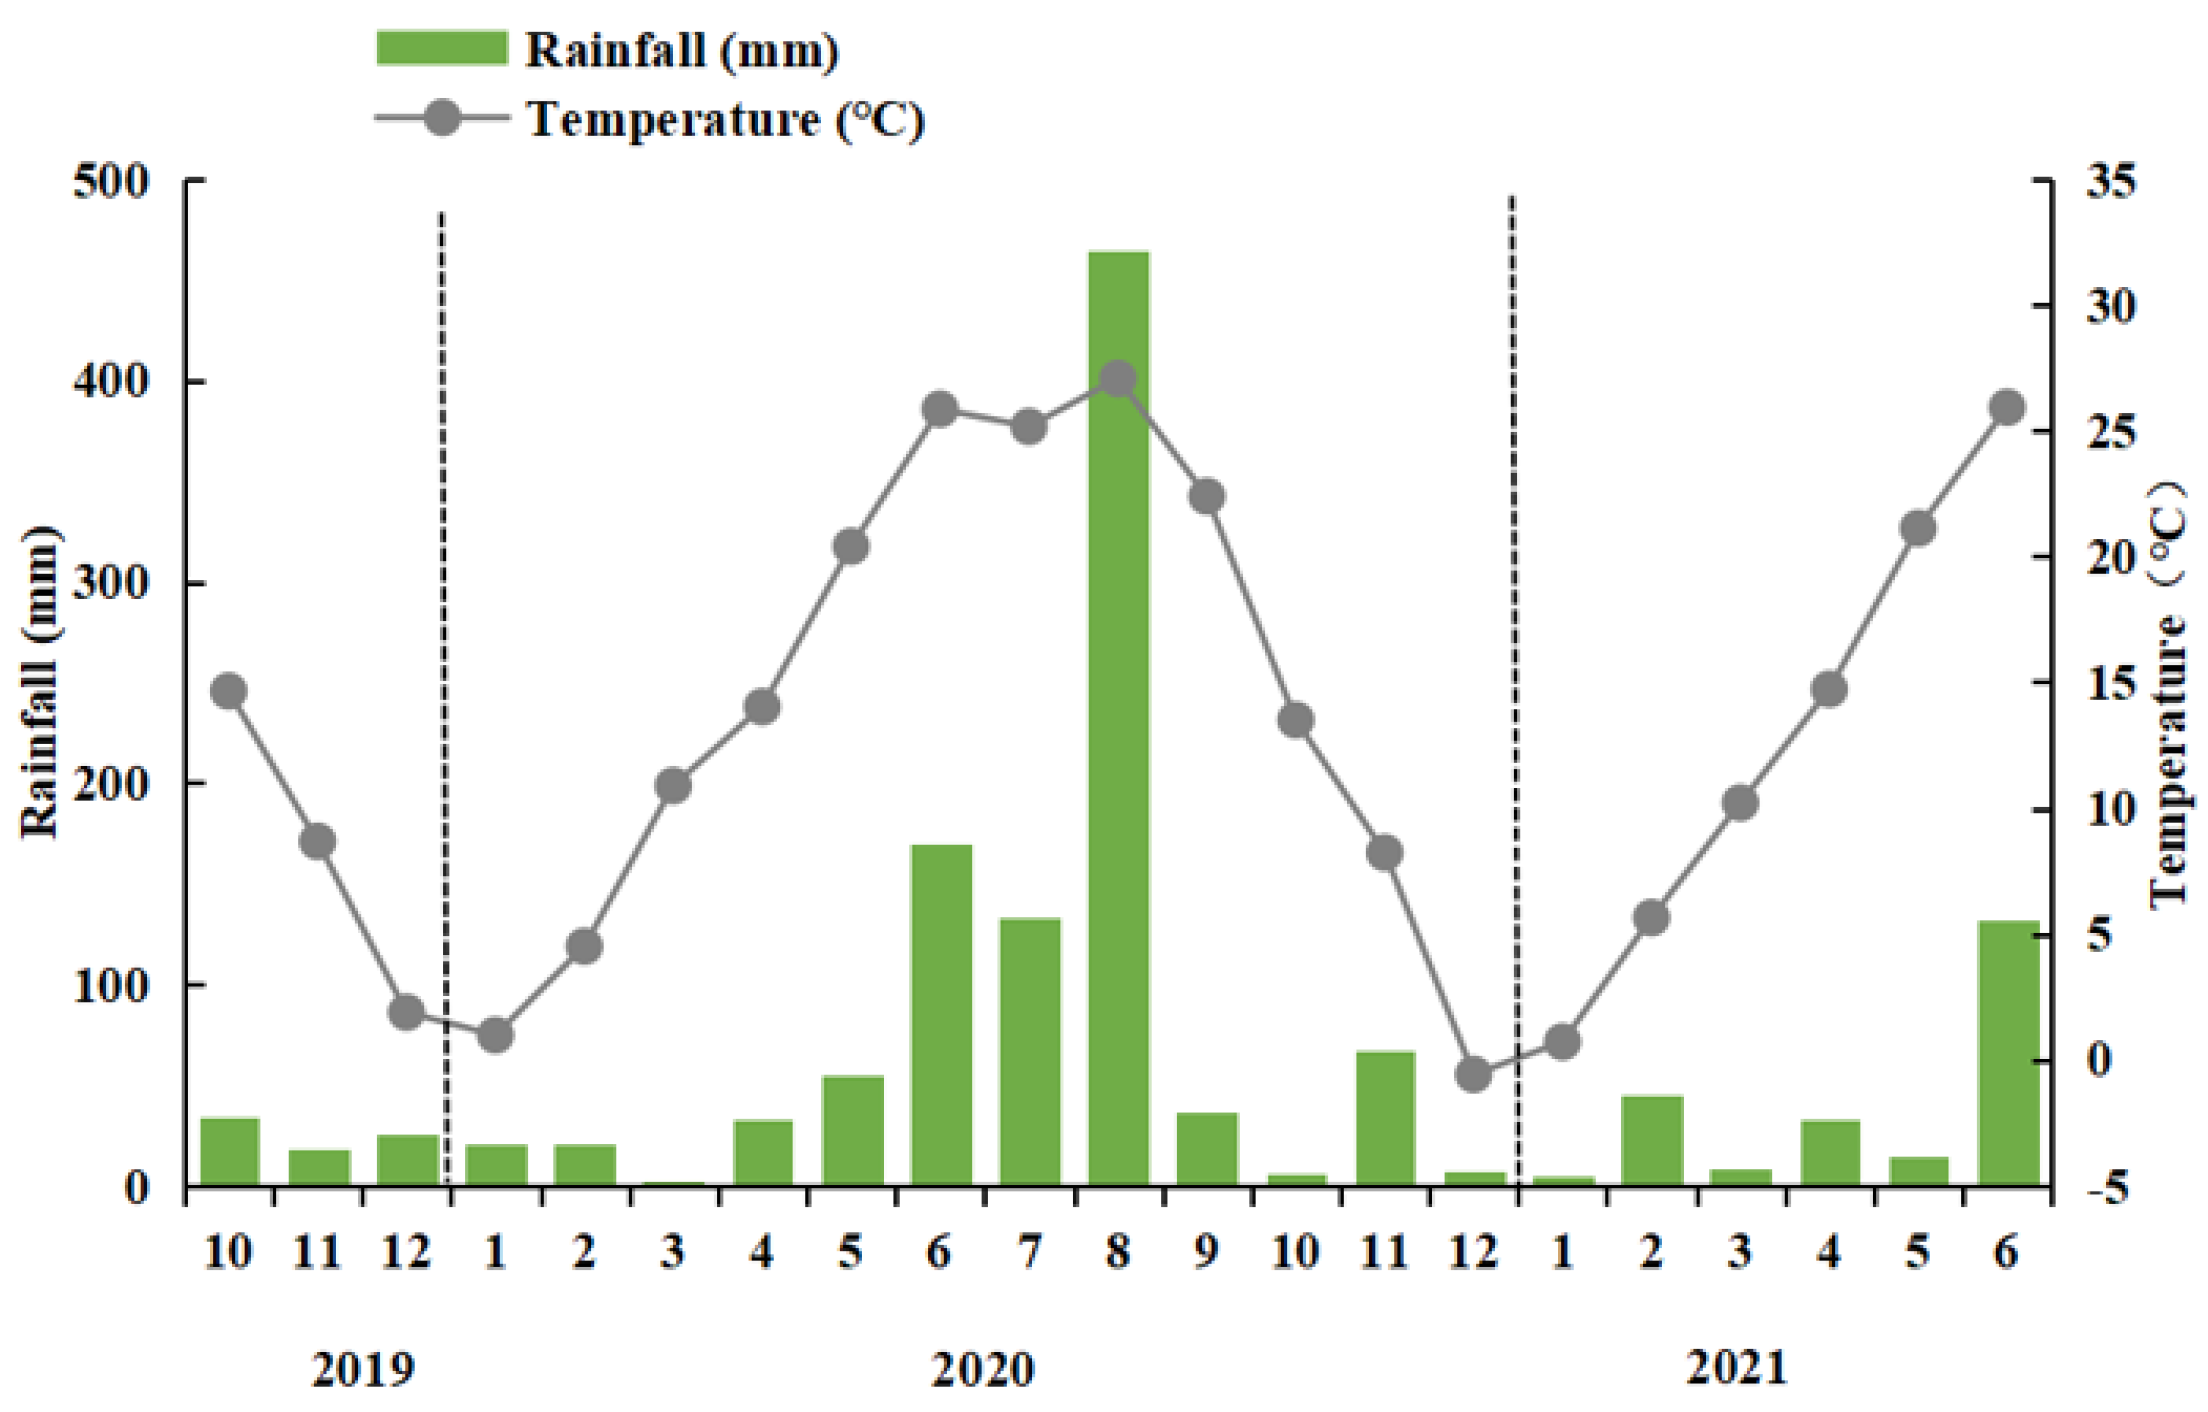
2.1. Site Description

The experiment was conducted at the Shandong agricultural university experimental station, Tai’an City, Shandong Province, China (36°09′ N, 117°09′ E), on brown loam soil. The initial soil properties (0–20 cm) were as follows: total nitrogen = 0.89 g/kg, organic matter = 13.6 g/kg, available potassium = 84.3 mg/kg, available phosphorus = 25.0 mg/kg, and available nitrogen = 80.3 mg/kg. The climate is warm temperate, semi-humid monsoon. The mean monthly temperature and precipitation during the 2019–2021 winter wheat growing season are illustrated in Figure 1.

2.2. Experimental Design

The field experiment followed a split–split plot design, with two winter wheat varieties−Shannong 23 (SN23, lodging resistant variety) and Shannong 16 (SN16, lodging sensitive variety)−as the main plots. The subplots included three nitrogen levels (120 kg/ha, N1; 240 kg/ha, N2; 360 kg/ha, N3) and four planting densities (75 plants/m2, D1; 225 plants/m2, D2; 375 plants/m2, D3; 525 plants/m2, D4). The conventional fertilization and planting density treatment was N2D2. Each treatment was replicated three times, with subplots measuring 3 × 3 m2 and row spacing of 25 cm. The wheat were sowed on 12 October 2019 and 2020, and harvested on 11 June 2020 and 2021.

2.3. Sampling and Measurement Methods

Samples were collected at the anthesis stage (GS, 65), milk stage (GS, 75), and dough stage (GS, 85). For each plot, 25 plants with consistent growth were selected. Stems were divided into five internodes in order from the basal internode upwards: the first internode (I1), the second internode (I2), the third internode (I3), the fourth internode (I4), and the fifth internode (I5).

2.4. Determination Parameters and Methods

2.4.1. Internode Length, Fresh Weight of Internode, and Stem Breaking Strength

The length of the internodes (cm, SL) was determined with a 1 m steel ruler. The fresh weight of the internodes (g, FW) was measured with an electronic balance (Sartorius, Beijing, China).
The stem breaking strength (g cm, R) was measured with Plant Stalk Strength tester (YYD-1, Zhejiang Top Instrument Co., Ltd., Hangzhou, China) [27].

2.4.2. Calculation of Mechanics Parameters

The mechanical parameters are calculated as follows [40]:
Bending moments on each internode (g cm, WP) = Length of each internode (cm, SL) × Fresh weight of each internode (g, FW)
The internodes were placed in the groove below the pressure probe of the Stem Strength Tester (YYD-1, Hangzhou Tepe Instrument Co., Ltd., Hangzhou, China), and the handle was slowly pressed down until the stems broke, at which time the instrument displayed the value of stem breaking strength (g cm, R) [41].
Lodging resistance index (LRI) = N/WP

2.4.3. Cellulose Content

The cellulose content was determined on the basis of Hussain et al. [42]. The weighed 0.15 g samples were homogenized. To a clean sample, 80% ethanol and acetone were added in proper sequence. After adding 1.5 mL dimethyl sulfoxide, the samples were incubated in a water bath at 25 °C for 1.5 h. They were then centrifuged at 4000× g, the supernatant was discarded, and the sediments were dried. Then, 0.005 g of dried sample was weighed and added to 0.5 mL of distilled water, mixing thoroughly. Slowly, 750 μL of concentrated sulfuric acid was added and in kept an ice bath for 30 min. This was then centrifuged at 8000× g and 4 °C for 10 min. Then, the supernatant liquid was diluted 20 times with distilled water. The solution with 300 μL was transferred to a new microtube and 70 μL of ethyl anthrone acetate and 630 μL of concentrated sulfuric acid were added to a 95 °C water bath for 10 min. The absorbance value was read at 620 nm (TU-1950 UV−VIS spectrophotometer, PERSEE Co., Ltd., Beijing, China) and the computing formula was as follows:
Cellulose (mg/g DW) = 4.76 × (ΔA + 0.00043)/W
ΔA; light absorption value, W; sample weight.

2.4.4. Hemicellulose Content

A 0.1 g sample was weighed and 2 mL Ca(NO3)2 4H2O was added then extracted with a 90 °C water bath for 10 min. Next the supernatant was centrifuged and discarded. Then 1 mL of distilled water was added, centrifuged for 10 min, and the supernatant was removed; this step was repeated three times. The precipitate was placed in an oven at 105 °C. Then, 1 mL of 2 M HCl was added and fully mixed in a 90 °C water bath for 1 h, naturally cooling to room temperature. Then, 100 μL of phenolphthalein and 1 mL 1 M NaOH were added successively until the solution turned red. Next, the solution was centrifuged for 10 min. After, 250 μL of the supernatant was added to 150 μL of 3,5-dinitrosalicylic acid and 650 μL of distilled water. The mixture was kept at 90 °C in a water bath for 1 h. The absorbance value was read at 520 nm (TU-1950 UV−VIS spectrophotometer, PERSEE Co., Ltd., Beijing, China). The computing formula was as follows [42]:
Hemicellulose (mg/g DW) = 10.08 × (ΔA − 0.00306)/W
ΔA; light absorption value, W; sample weight.

2.4.5. Lignin Content

Samples of 0.1 g were stirred with 2.5 mL of 25% bromoacetic acid (acetic acid: acetyl bromide 4:1) and 1 mL of perchloric acid at 80 °C for 40 min. The solution was oscillated every 10 min, and no sample added was used as a blank control. After cooling naturally to room temperature, 0.5 mL of the solution was transferred to a centrifuge tube with a 50 mL volume. Then, 2 M NaOH and hydroxylamine hydrochloride were added, and 10 mL of the solution was taken and 10 μL of glacial acetic acid was added, mixing sufficiently. The absorbance value was read at 280 nm (TU-1950 UV−VIS spectrophotometer, PERSEE Co., Ltd., Beijing, China), and the computing formula was as follows [36]:
Lignin (mg/g DW) = 0.0735 × (ΔA − 0.0068)/W × T
ΔA; light absorption value, W; sample weight.

2.4.6. Lignin Subunit Content

Approximately 0.1 g of the sample was weighed, with 50 mM NaCl, absolute ethyl alcohol, 95% ethanol, acetone, chromatographic chloroform/chromatographic methanol = 1:1 (v/v) were added, respectively. After the precipitate was centrifuged, and the supernatant was abandoned, the precipitate was dried. Approximately 0.02 g of the dried sample was weighed, 0.3 mL of 2 M NaOH and 0.5 mL of nitrobenzene were added, and they were microwave digested for 1 h at 150 °C. After centrifuging the mixture, 4 mL of ethyl acetate was added to the supernatant. Then 3 mL of the supernatant solution was taken and 4 mL of ethyl acetate again was added. The supernatant liquid obtained from the mixture, after vacuum concentration, was redissolved with 6 mL of 50% acetonitrile water. The sample, filtered with 0.22 μm of organic filter membrane, was injected into an ultra high-performance liquid chromatography triple quadrupole mass spectrometer (Xevo TQ−S, Waters, Milford, MA, USA) [43].

2.5. Determination of Yield and Its Components

At the mature stage, a 1 m2 area of wheat displaying uniform growth was designated within each plot to enumerate spike numbers (plants/m2). Subsequently, 15 spikes were harvested and threshed to determine the grain number per spike and to assess the 1000−grain weight (g). The grain yield (t/ha) was measured at a moisture content of 14% in winter wheat.

2.6. Statistical Analysis

Analysis of variance (ANOVA) was performed using the SPSS 17.0 statistical package (SPSS Inc., Chicago, IL, USA). Multiple comparisons were performed by the Least Significant Difference (LSD) test at p < 0.05. Tables were prepared using Microsoft Word 2019 (Microsoft Corp., Redmond, WA, USA). Figures were produced using Origin 2024b (Origin Lab, Northampton, MA, USA) and PowerPoint 2019 (Microsoft Corp., Redmond, WA, USA). The data in the figures and tables are averages of three replicates for each treatment. Furthermore, HY indicates the highest yield treatment for a measurement item, MaC indicates the highest content treatment for a measurement item, and MiC indicates the lowest content treatment for a measurement item. When comparing between internodes, data are averages for each of the internodes in the three stages; when not comparing between internodes, data are averages of the sum of the treatments in each of the five internodes in the three stages; when compared with HY, MaC, MiC, data are averages of five internodes summed over three stages.

3. Results

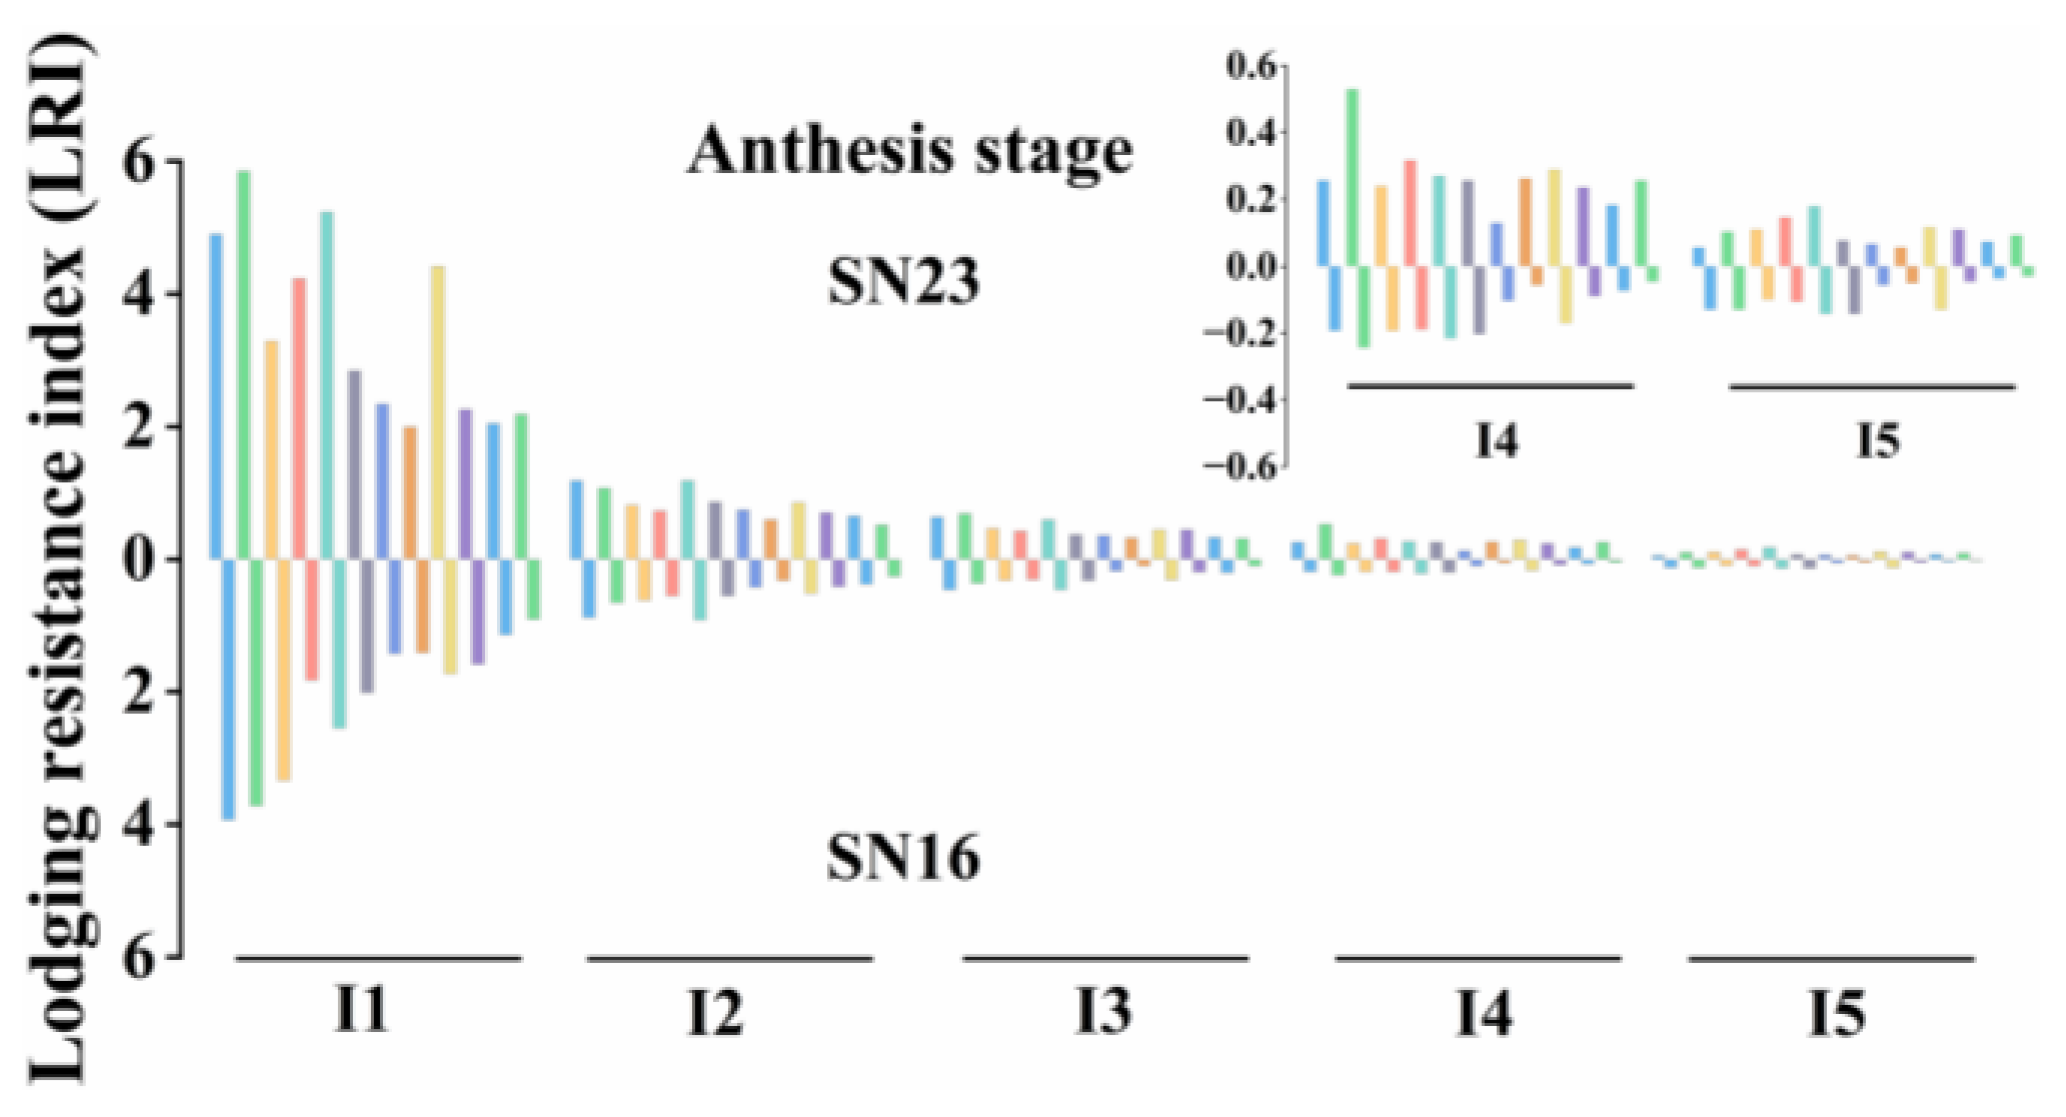
3.1. Lodging Resistance Index (LRI)

Increased nitrogen application and planting density negatively affected LRI (SN23: −0.19, −0.21; SN16: −0.18, −0.11; p < 0.05) (Figure 2 and Figure S1, Table S1). Relative to N2D2, the mean LRI variations for SN23 and SN16 were as follows: I1 (−0.63−+2.74, −0.72−+1.60), I2 (−0.32−+0.41, −0.25−+0.29), I3 (−0.12−+0.20, −0.16–+0.16), I4 (−0.09−+0.08, −0.10−+0.03), I5 (−0.02−+0.07, −0.08−+0.03). Furthermore, the LRI decreased with increasing internode height (I1 (2.16) → I2 (0.58) → I3 (0.28) → I4 (0.16) → I5 (0.08)).

3.2. Yield and Yield Components

Significant yield differences were observed between the wheat varieties. SN23 produced yields between 6.64 and 10.17 t/ha, while SN16 ranged from 5.33 to 8.31 t/ha. Yields increased further in the second year. SN23 and SN16 achieved their highest yields at N2D3 and N3D2, with average increases of 4.60% and 3.35% over N2D2, respectively. For nitrogen application, SN23 yields followed the order N2 > N3 > N1 under D1 and D2, and N2 > N1 > N3 under D3 and D4. In contrast, SN16 yields ranked as N3 > N2 > N1 under D1 and D2, and N2 > N1 > N3 under D3 and D4. For planting density, SN23 and SN16 were D3 > D4 > D2 > D1 in N1; D3 > D2 > D4 > D1 (SN23) and D2 > D3 > D4 > D1 (SN16) in N2; D2 > D3 > D4 > D1 (SN23) and D2 > D1 > D4 > D3 (SN23) in N3, respectively. Yield SN23 > SN16; the grain number per spike SN23 was higher than SN16 by 35.58−49.08%, except for N3D4; 1000−grain weight was 0.26−3.56 g more in SN23 than in SN16; and the spike number in SN16 increased by 11.91−40.85% (Table 1).

3.3. Bending Moment (WP) and Its Components

I1 → I5, SL (5.94−27.15 cm) and WP (6.08−48.88 g cm) increased linearly. FW increased in I1 → I4 (1.06, 1.64, 2.04, 2.21 g) and decreased in I5 (1.80 g). N3D3 yielded the highest SL across internodes; FW peaked at N2D1; WP peaked at N2D1 except for I1 (N3D2) in SN23. N2D2 decreased SL by 1.11 cm, FW by 0.26 g, and WP by 3.33 g cm from peak values, while increasing SL by 1.39 cm, FW by 0.26 g, and WP by 4.05 g cm from minimum values (Figure 3 and Figure S2, Table S2; p < 0.05).

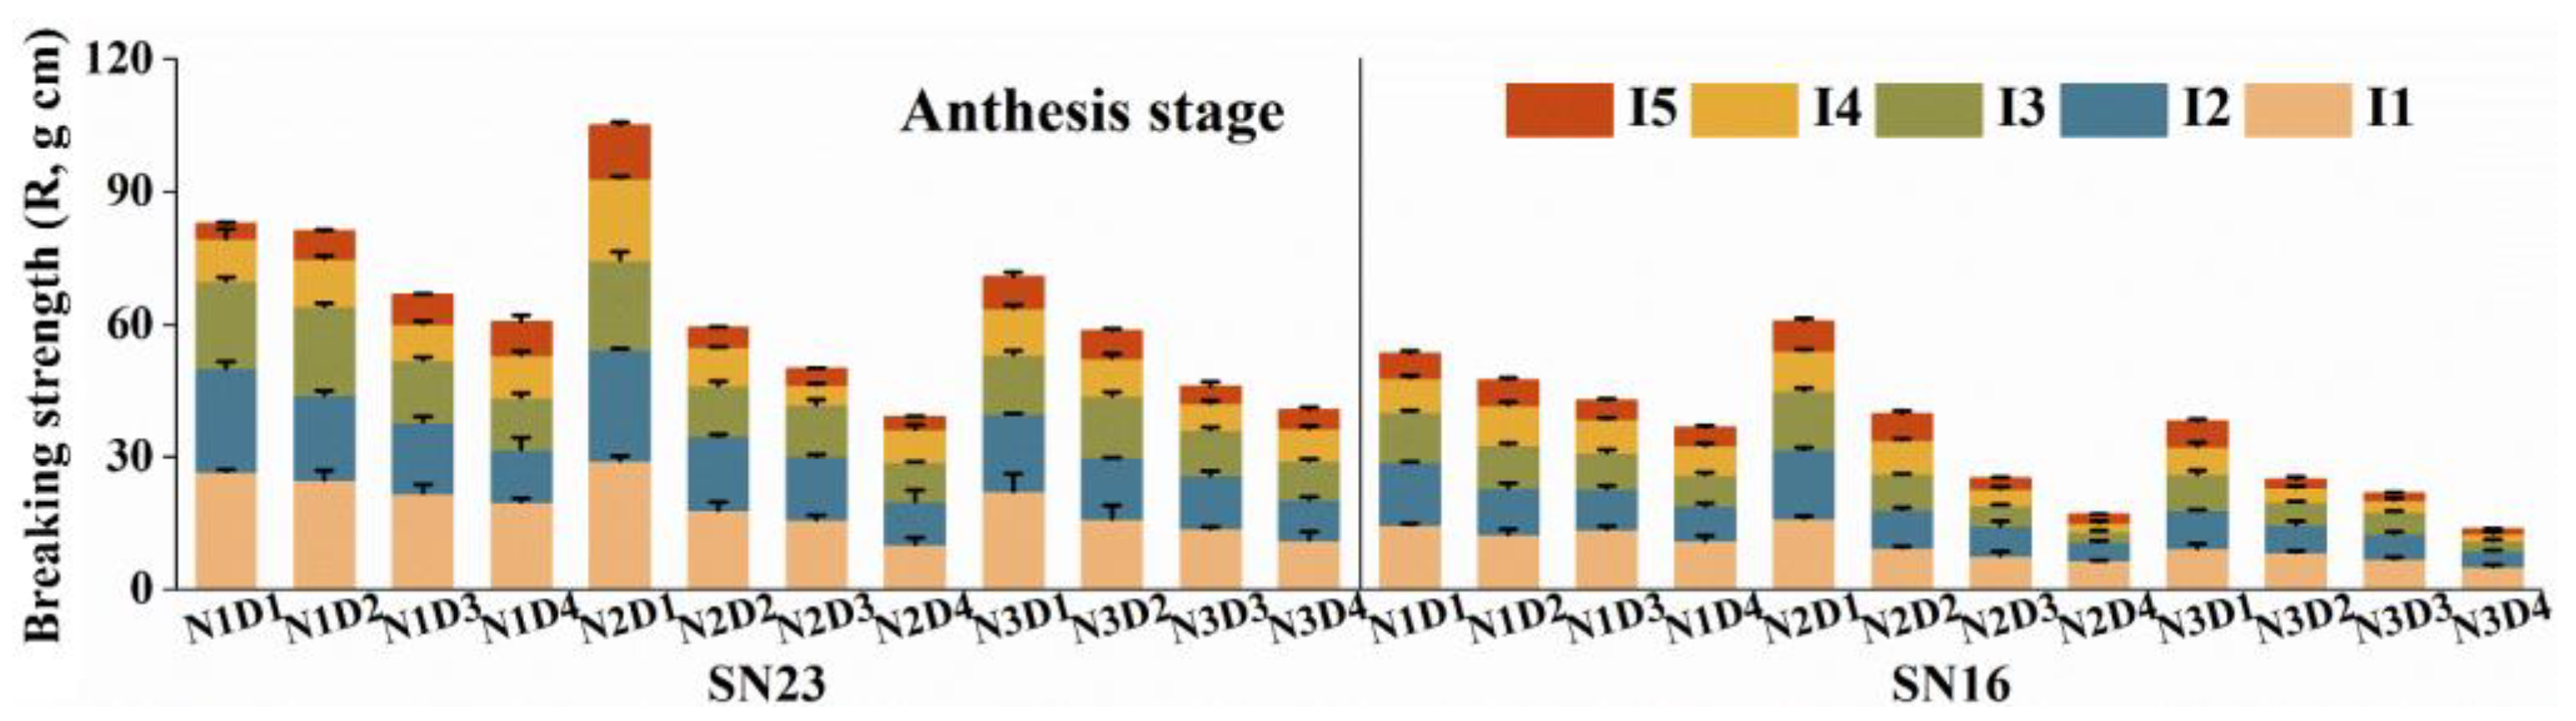
3.4. Breaking Strength (R)

R declined with increasing planting density (11.81 → 8.47 → 6.67 → 5.09 g cm) and nitrogen application (9.33 → 8.33 → 6.36 g cm), and increased with internode length, averaging 71.32−81.11% of the preceding internode. At N2D2, SN23 averaged 10.03 g cm, compared to N2D1 (MaC) + 7.42 g cm, N2D3 (HY) − 1.74 g cm, and N3D4 (MiC) − 4.49 g cm; SN16 was 6.52 g cm, with significant differences (+4.31 g cm at N2D1 (MaC), −2.10 g cm at N3D2 (HY), −4.07 g cm at N3D4 (MiC); p < 0.05) (Figure 4 and Figure S3; Table S3).

3.5. Carbohydrates Contents

3.5.1. Cellulose

At N2D2, SN23, and SN16, cellulose averaged 319.09 and 277.00 mg/g DW. In comparison, SN23 at N2D1 (MaC) + 142.25 mg/g DW, N2D3 (HY) − 16.48 mg/g DW, N3D4 (MiC) − 68.41 mg/g DW, SN16 was found in N2D1 (MaC) + 100.20 mg/g DW, N3D2 (HY) − 38.68 mg/g DW, N3D4 (MiC) − 70.23 mg/g DW (Figure 5 and Figure S4; p < 0.05). Increasing planting density reduced cellulose while nitrogen application was N2 > N1 > N3 (D1) and N1 > N2 > N3 (D2, D3, D4) (Table S4; p < 0.05). Internode accumulation varied, with average reductions of 18.60, 15.28, 17.60, 16.90 mg/g DW compared to the preceding internode.

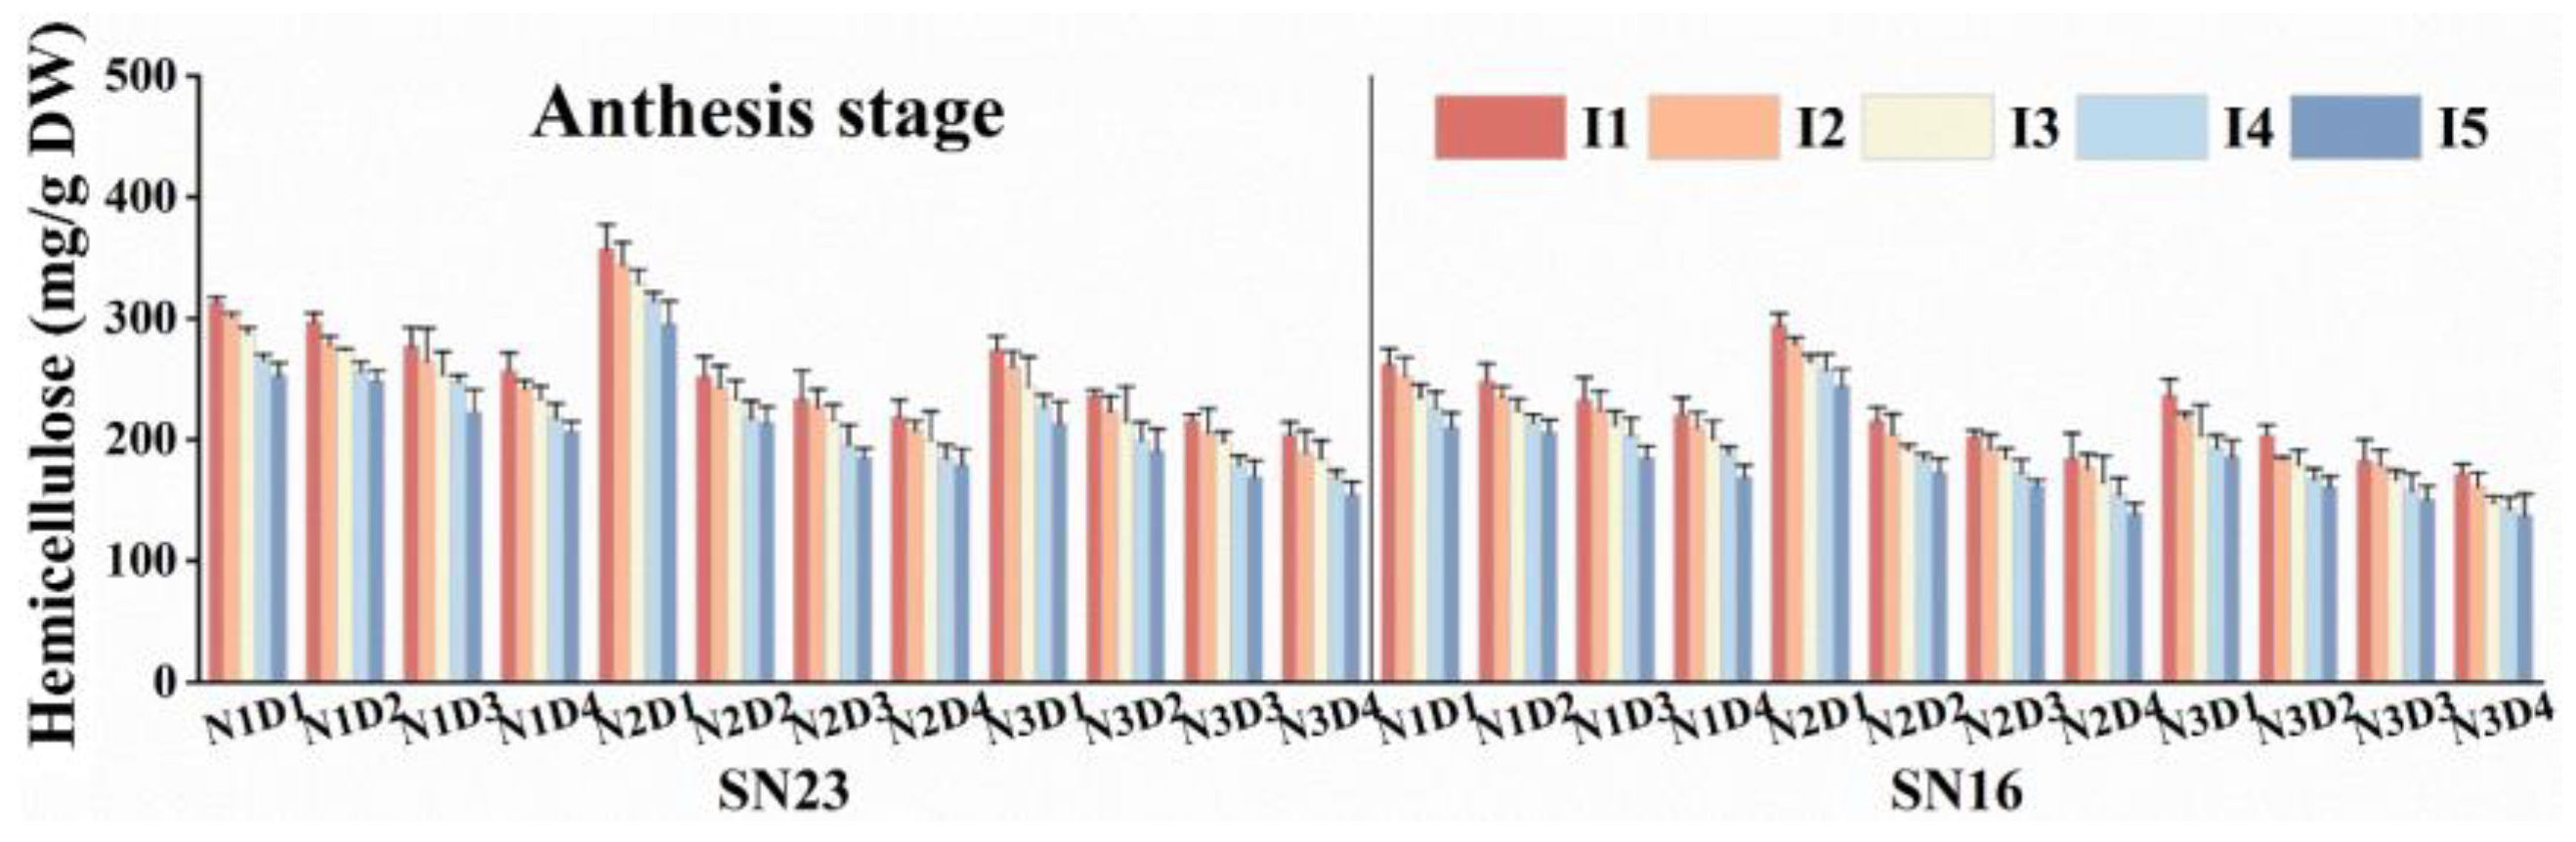
3.5.2. Hemicellulose
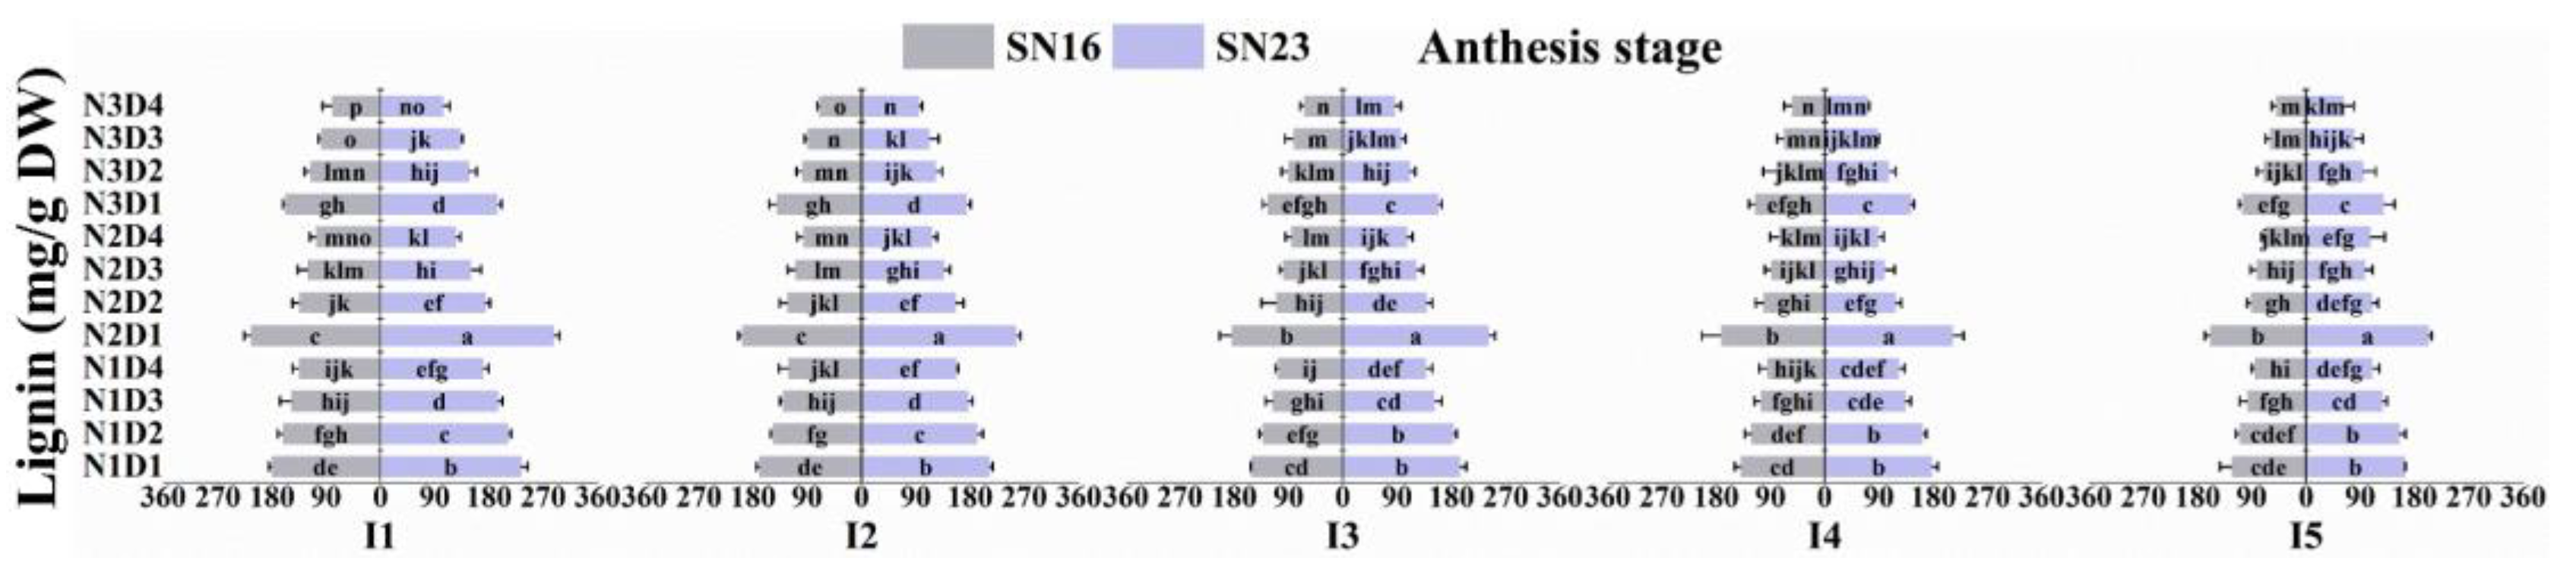
Hemicellulose content peaked at N2D1 and was lowest at N3D4. It decreased with planting density, while nitrogen application showed N2 > N1 > N3 (D1) and N1 > N2 > N3 (D2–D4) (Table S4; p < 0.05). At N2D2, the mean hemicellulose was 227.53–283.88 mg/g DW for SN23 and 188.19–234.79 mg/g DW for SN16. SN23 exhibited changes of +107.34, −16.22, −43.73 mg/g DW in N2D1 (MaC), N2D3 (HY), and N3D4 (MiC), respectively, while SN16 showed changes of +90.52, −15.53, −47.28 mg/g DW in N2D1 (MaC), N3D2 (HY), and N3D4 (MiC), respectively. Additionally, compared to the previous internode, reductions of 12.57–13.13 mg/g DW (I2 → I5) were observed (Figure 6 and Figure S5; p < 0.05).

3.5.3. Lignin

SN23 ranged from 225.34 to 320.80 mg g−1 DW at N2D2 lignin, and from 218.80 to 251.10 mg/g DW at SN16. In comparison, N2D2 of SN23 accounted for 60.68% of N2D1 (MaC), 112.45% of N2D3 (HY), and 151.95% of N3D4 (MiC), while N2D2 of SN16 accounted for 62.29% of N2D1 (MaC), 120.54% of N3D2 (HY), and 162.45% of N3D4 (MiC), respectively. Increasing planting density reduced lignin, and nitrogen application was N2 > N1 > N3 (D1) and N1 > N2 > N3 (D2, D3, D4). Also, the increase in internode height led to a decrease in lignin by 17.35, 15.49, 14.29, 13.35 mg/g DW (I1 → I5) (Figure 7 and Figure S6; Table S4; p < 0.05).

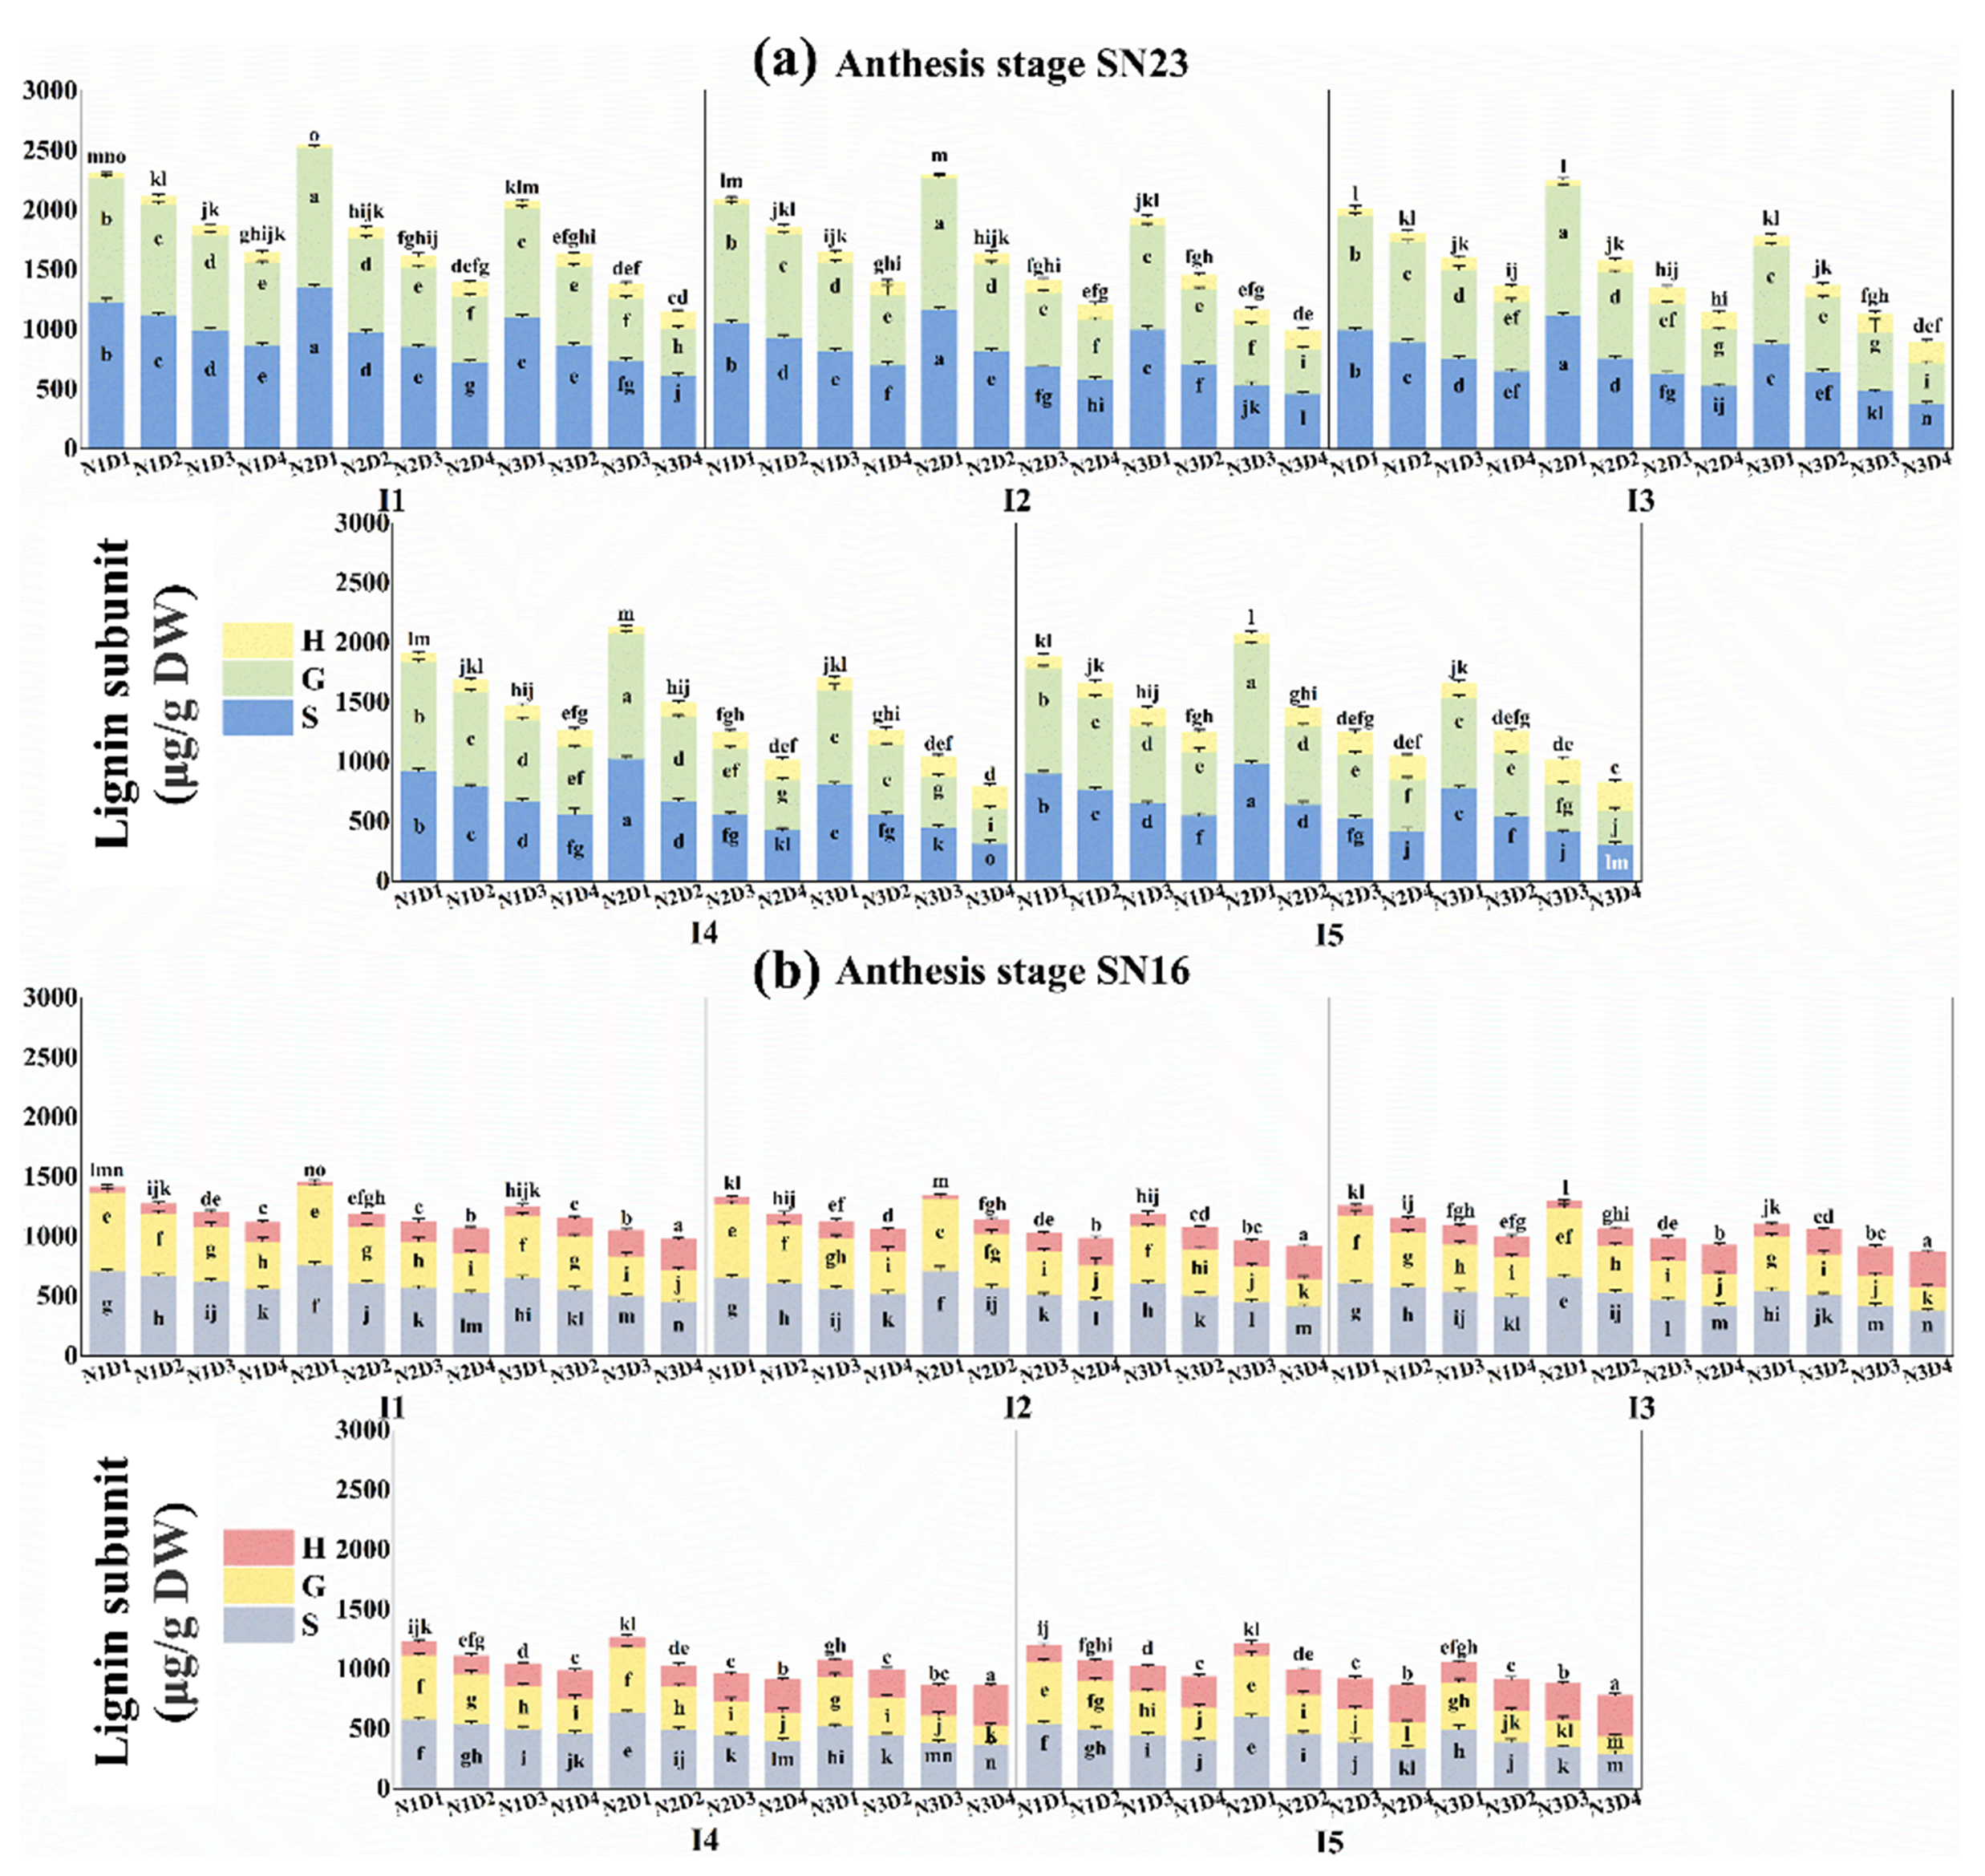
3.5.4. Lignin Subunit Content

SN23 averaged 886.71, 846.18, 129.66 μg/g DW for the S, G, and H subunits of N2D2 and 571.81, 454.59, 199.48 μg/g DW for SN16. In comparison, S, G of SN23 in N2D1 (MaC) +352.80, +346.57 μg/g DW, N2D3 (HY) − 118.09, −127.34 μg/g DW, N3D4 (MiC) − 351.79, −386.16 μg/g DW, SN16 in N2D1 (MaC) + 147.22, +176.43 μg/g DW, N3D2 (HY) − 51.89, −55.77 μg/g DW, N3D4 (MiC) − 151.72, 202.06 μg/g DW. H subunits exhibited distinct behavior: SN23 showed −65.08, +23.59, +68.91 μg/g DW in N2D1 (MiC), N2D3 (HY), and N3D4 (MaC), while SN16 had −120.47, +51.59, +145.97 μg/g DW in N2D1 (MiC), N3D2 (HY), and N3D4 (MaC). The increased internode height led to decreases in S (−30.89−−106.72 μg/g DW) and G (−25.49−−48.96 μg/g DW) subunits, and an increase in H (+15.53−+35.35 μg/g DW) subunit (Figure 8 and Figure S7; Table S5).

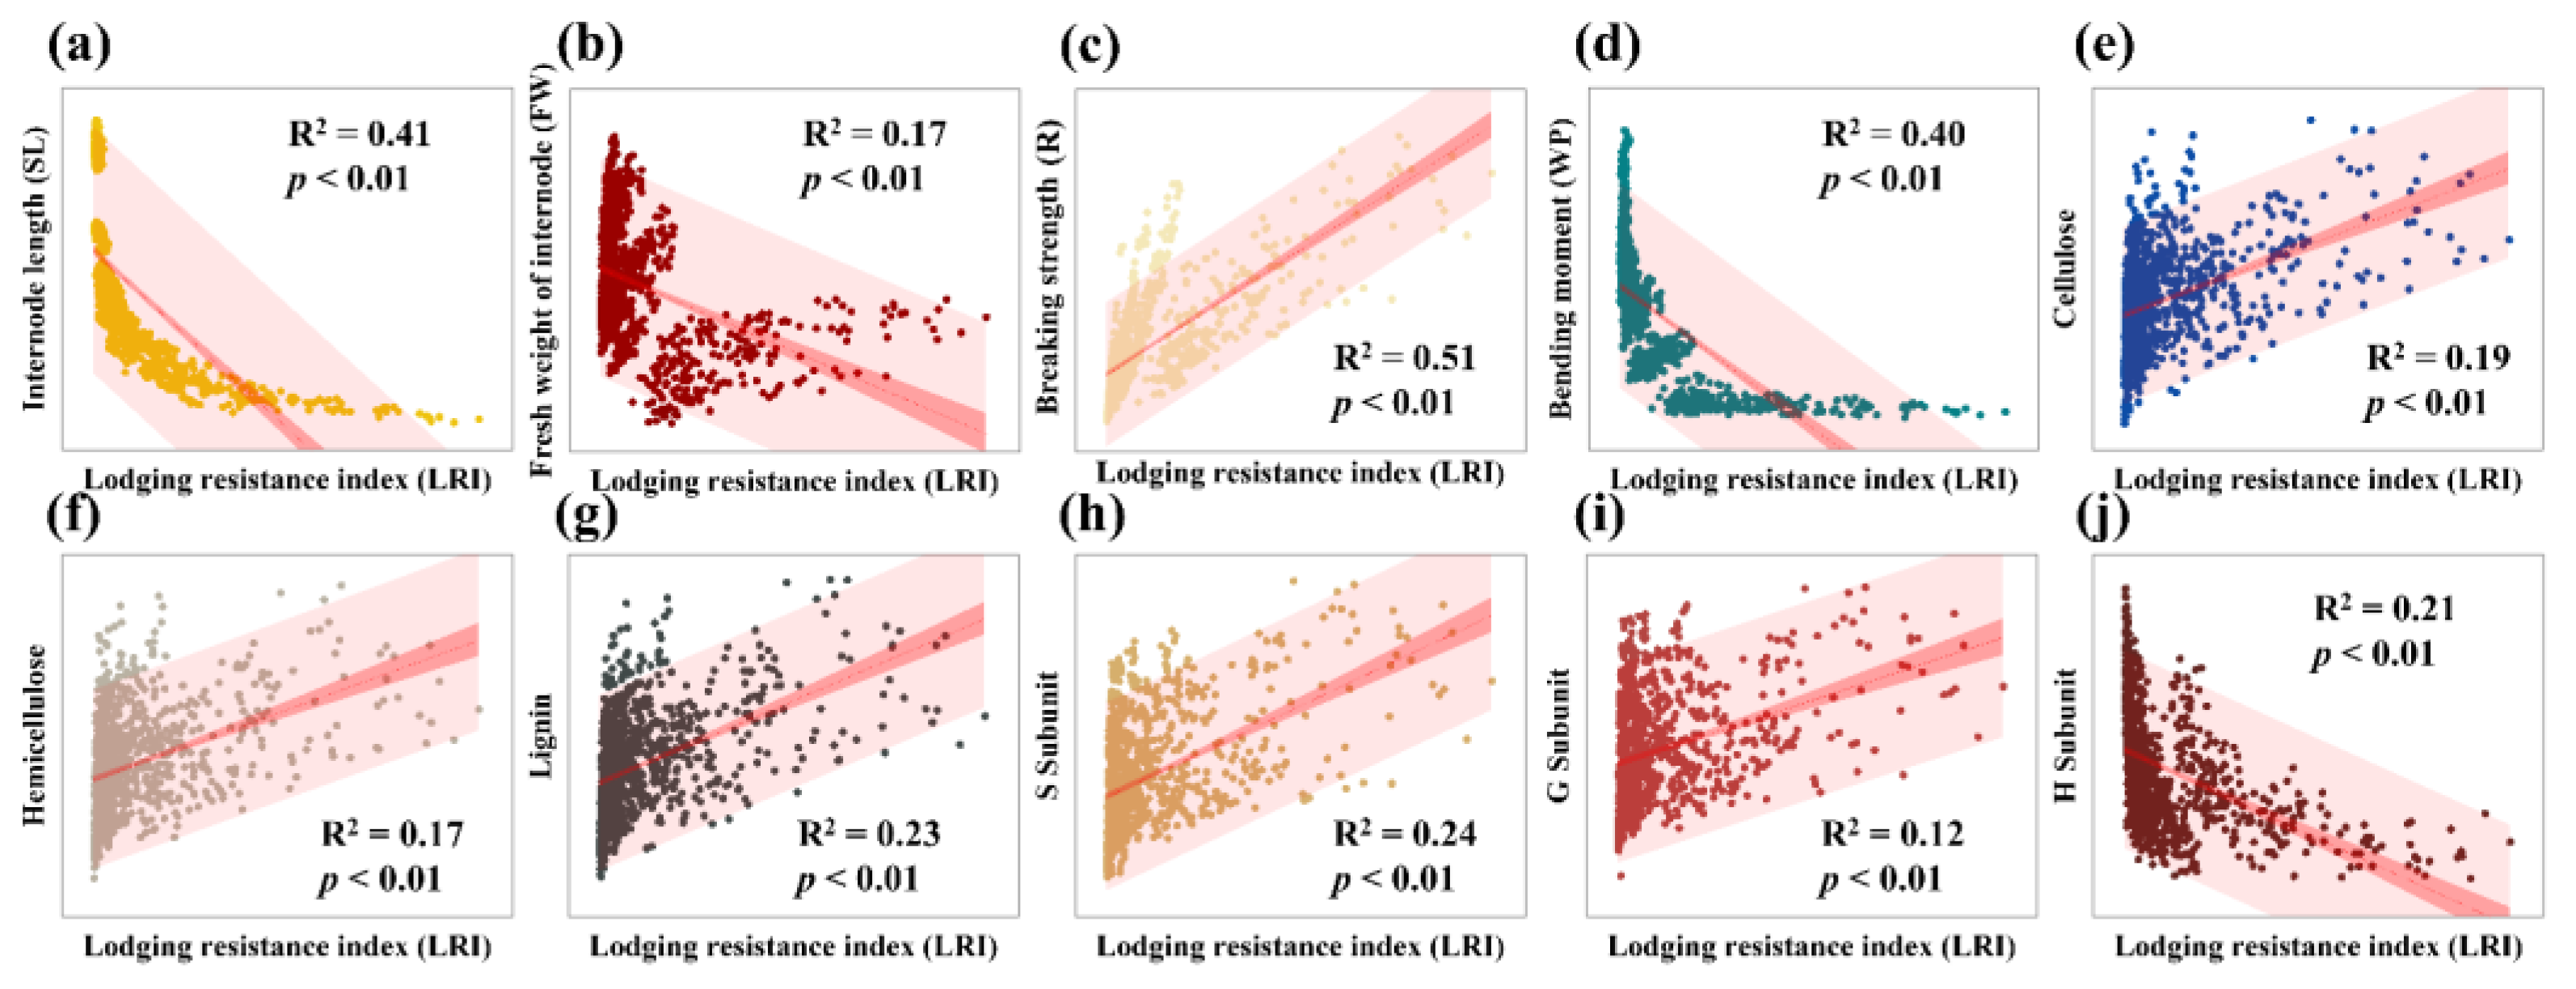
3.6. Correlation of Lodging Resistance Index (LRI) with Other Indicators

Pearson correlation results showed that the LRI was negatively correlated with SL, FW (R2 = 0.17−0.41; Figure 9a,b) and positively correlated with N (R2 = 0.51; Figure 9c), while WP showed the opposite behavior (R2 = 0.40; Figure 9d). Cellulose (Figure 9e), hemicellulose (Figure 9f), lignin (Figure 9g), and S (Figure 9h), G (Figure 9i) subunits enhance LRI establishment (R2 = 0.12−0.24), whereas H subunits hinder it (R2 = 0.21; Figure 9j).

4. Discussion

4.1. Causes of Internode Lodging Resistance Variability

An increase in internode height results in an augmentation of SL (4.52−21.21 cm) and FW (0.57−1.14 g). Consequently, WP increases by 10.68−42.80 g cm (Figure 3 and Figure S2) and shifts the center of gravity upwards [44]. Cellulose (15.28–18.60 mg/g DW; Figure 5 and Figure S4), hemicellulose (12.57−13.13 mg/g DW; Figure 6 and Figure S5), and lignin (13.35−17.35 mg/g DW; Figure 7 and Figure S6) content declined with increasing internode height, resulting in reduced mechanical strength in the upper internodes [45]. Moreover, a reduction in the S and G subunits (30.89−106.72, 25.49−48.96 μg/g DW) and an increase in the H subunits (15.53−35.35 μg/g DW) (Figure 8 and Figure S7) also contributed to a decline in R (0.48−15.25 g cm) (Figure 4 and Figure S3) [20]. The resistance to lodging exhibits a sequence of I1 > I2 > I3 > I4 > I5 (Figure 2 and Figure S1).

4.2. Causes of Differential Lodging Resistance at Different Stages

At the dough stage, concentrations of cellulose (Figure 5 and Figure S4), hemicellulose (Figure 6 and Figure S5), and lignin (Figure 7 and Figure S6) reached their peak values (213.71−546.18, 154.36−432.99, 80.19−347.98 mg/g DW). R exhibited an inverse pattern, with the lowest levels recorded at the dough stage (1.07−29.20 g cm) and the highest levels at the anthesis stage (1.42−36.46 g cm). This paradox suggests that mechanical strength is not solely determined by structural carbohydrates but also by other factors. As observed by Handakumbura and Hazen (2012) [46], during the initial stages of growth, water and pectin in the cell wall contribute to stiffness and mechanical strength, resulting in higher R (Figure 4 and Figure S3). However, as soluble sugars and other carbohydrates are redirected for grain development, the stalk’s filling degree and quality decline [47,48]. Simultaneously, increased FW raises WP, thus amplifying the gravitational load on the stalks (Figure 3 and Figure S2; Table S2) [2,49]. Additionally, wind is a major environmental factor contributing to crop stalk lodging. When the wind force acting on the plants exceeds the maximum tolerance of the stalks prior to their breaking, stalk lodging occurs [50]. Therefore, the increased wind force and rainfall during the later stages of growth (Figure 1) may exacerbate the risk of lodging [51,52]. Consequently, despite a higher structural carbohydrate content at later stages, R declined by an average of 3.89 g cm (Figure 4 and Figure S3).

4.3. Lodging Resistance Variability Induced by Nitrogen Application

Moderate nitrogen application decreased the lodging index [53]. Each 120 kg N/ha increase led to a 0.69−0.54 cm rise in SL (Table S2), elevating the center of gravity and reducing LRI by 0.23−0.14 (Figure 2 and Figure S1) [54,55]. High nitrogen reduced lignin synthases (PAL, TAL, POD) activity and gene expression, leading to decreased lignin content and rigidity [56,57]. Consistent with this study, the lignin content decreased by 12.81 and 32.99 mg/g DW (Figure 7 and Figure S6), while R decreased by 1.00 and 1.97 g cm (Figure 4 and Figure S3) with increasing nitrogen application. Furthermore, high nitrogen weakened the β-O-4 bond connections between subunits, resulting in decreased S (42.68, 109.36 μg/g DW) and G (54.02, 116.32 μg/g DW) subunits and an increase in H subunits (16.26, 43.49 μg/g DW) (Figure 8 and Figure S7) [20,58]. This simultaneously downregulated the expression of cellulose synthase genes (CESA4, CesA7, etc.) [59], as well as homologous genes associated with secondary cell wall cellulose synthesis and assembly (e.g., COBL4, CTL2) [60], leading to a reduction in cellulose content by 17.62 and 46.96 μg/g DW (Figure 5 and Figure S4). Conversely, hemicellulose was reduced by 17.23 and 30.53 mg/g DW (Figure 6 and Figure S5) due to a high N limitation of expression of xylan synthesis genes (FRA8, F8H, etc.) [61,62,63,64]. Elevated nitrogen also reduces epidermal thickness, vascular bundle area, and quantity, lowering N (Figure 4 and Figure S3) [8,65,66,67]. Thus, high N causes an increase in WP, H subunits, a decrease in structural carbohydrates, S, G subunits, and a consequent decrease in R.

4.4. Lodging Resistance Variability Induced by Planting Density

Increasing planting density can improve yield per unit area but also triggers shade avoidance responses, causing plants to overgrow and compromise lodging resistance [68]. The underlying reason is that a high planting density diminishes the photosynthetically active radiation in the lower strata of the canopy [17,69], resulting in an increase in SL of 0.33–1.09 cm per 1.50 × 10⁶ plants/ha (Table S2), plant height [70] and center of gravity height also increased [8], leading to an increase in WP (Figure 3 and Figure S2), while the LRI declines (Figure 2 and Figure S1). Weak light limits the expression of genes (TaPAL, TaCOMT) [20,28,71], decreasing the lignin content by 17.00−50.12 mg/g DW (Figure 7 and Figure S6). Simultaneously reducing the activities of sucrose synthase and sucrose phosphate synthase led to a decrease in sucrose, which in turn resulted in a reduction in cellulose by 17.08−65.69 mg/g DW (Figure 5 and Figure S4) [67]. Moreover, the reduction in xylose, possibly resulting from the downregulation of genes associated with carbohydrate biosynthesis, may elucidate the observed decrease in hemicellulose (14.46−50.42 mg/g DW) (Figure 6 and Figure S5) [42]. Shade alters the R/FR light ratio, affecting phyA and phyB expression and reducing COMT activity, which collectively lowers GA content. This results in decreased S (80.13−165.31 μg/g DW) and G (95.94−180.98 μg/g DW) subunits, whereas the H subunit (38.97−62.07 μg/g DW) showed an increase (Figure 8 and Figure S7) [43,71,72]. Consequently, an increase in planting density led to a reduction in R and LRI (Figure 2, Figure 4, Figures S1 and S3).

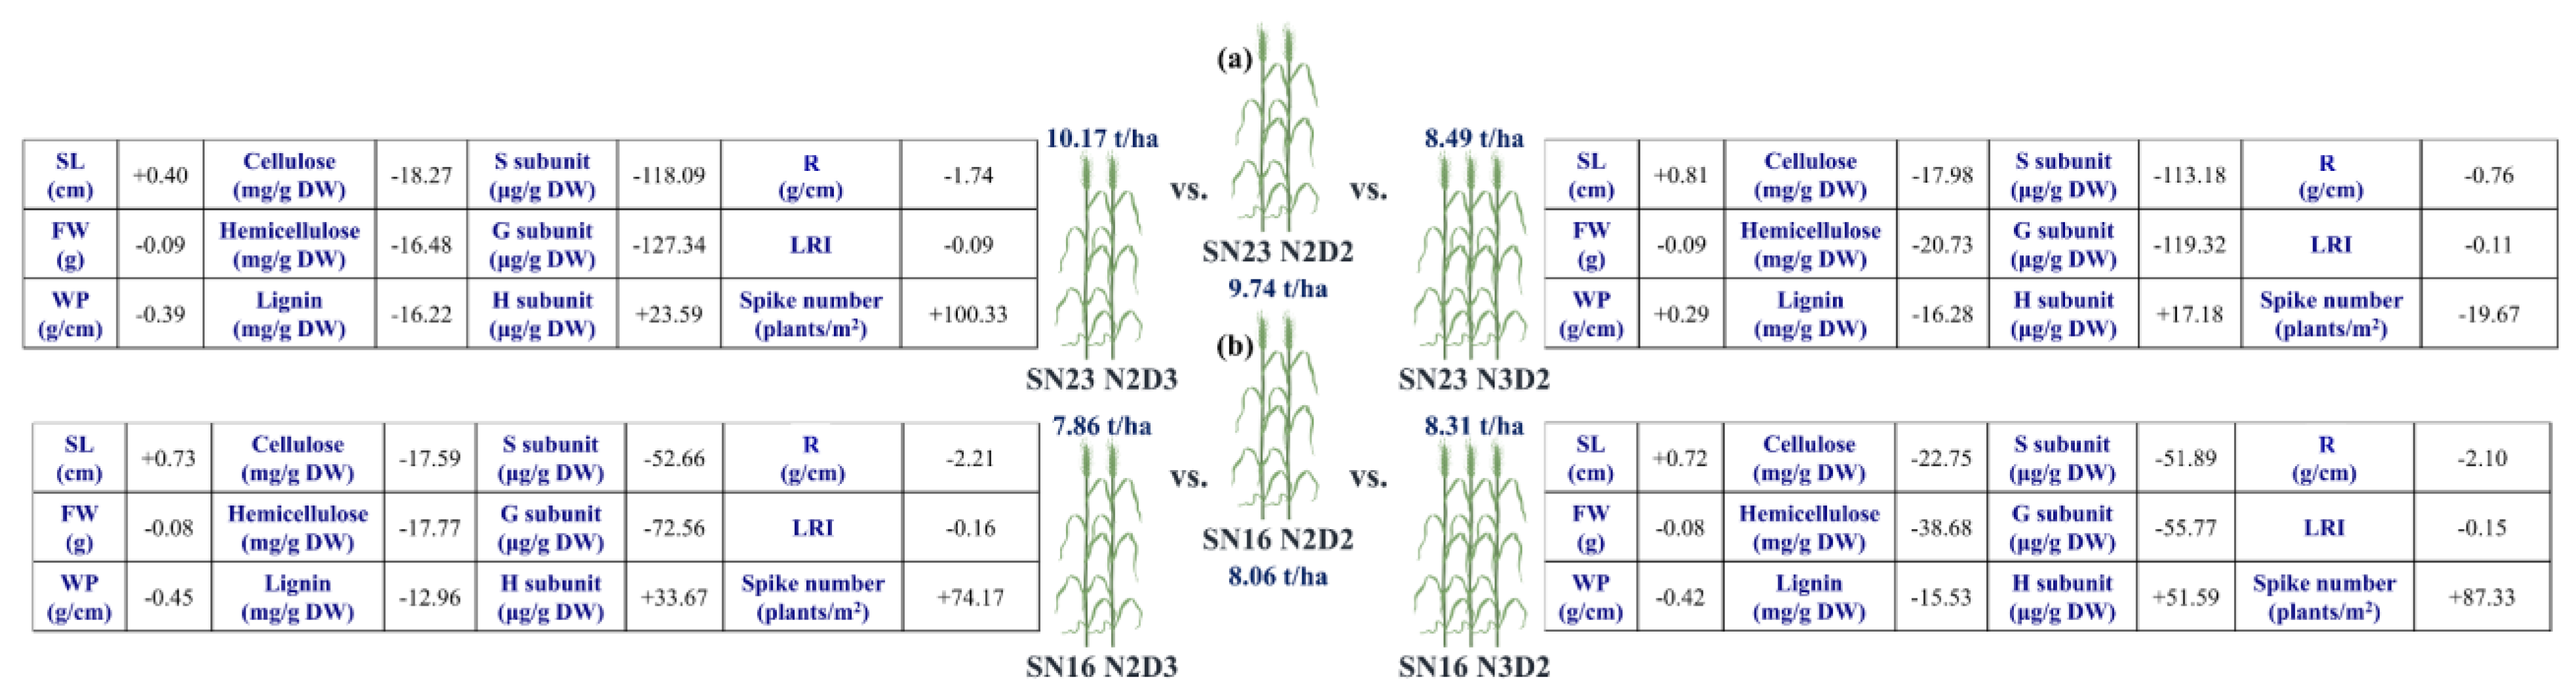
4.5. Trade−Off Between Yield and Lodging Resistance

Enhancing assimilate allocation to improve lodging resistance can reduce lodging risk, but often diverts resources away from yield formation [37]. Lodging sensitive varieties generally achieve higher yields prior to lodging compared to varieties that allocate more assimilates to lodging resistance [3,73,74]. In our study, SN23 (6.94−10.51 t/ha) outperformed SN16 (5.14−8.78 t/ha) in yield while also achieving a higher lodging resistance index (LRI) (SN23: 0.05−4.71, SN16: 0.03−3.23), demonstrating the potential for simultaneous improvement in both traits. The results showed that yield initially increased and then decreased with higher planting density and nitrogen application for both varieties. However, LRI declined consistently with increases in these factors, highlighting a trade−off: maximizing yield necessitates sacrificing the LRI (Figure 2 and Figure S1; Table 1).
To determine the optimal nitrogen application and planting density, a further analysis was conducted on the yield and LRI differences between the two varieties under the N2D3, N3D2, and N2D2 conditions. SN23 (N2D3 vs. N2D2, +0.43 t/ha, −0.09; N3D2 vs. N2D2, −1.25 t/ha, −0.11), SN16 (N2D3 vs. N2D2, −0.20 t/ha, −0.16; N3D2 vs. N2D2, +0.26 t/ha, −0.15) (Figure 10). Based on these findings, nitrogen application and planting density should be tailored to each variety’s characteristics to maximize yield while minimizing LRI reduction. However, considering global efforts to reduce nitrogen usage while maintaining high yields [75,76,77], the combination of 240 kg/ha of nitrogen and 375 plants/m2 (N2D3) is preferred.

4.6. Potential Trade−Off Mechanism Between Yield and Lodging Resistance

D3 helps compensate for yield reduction caused by resource inefficiencies under D1 and D2 [24], while also improving canopy structure, which enhances light penetration and counters lignin reduction and lodging risks associated with the excessive competition of D4 [78]. Furthermore, D3 reduces resource competition under D4, alleviating shading-induced photosynthetic damage and contributing to better plant size at maturity [24,26]. N2 addresses potential deficiencies under N1, which could limit leaf expansion and photosynthetic capacity and lower productivity [11,12,79,80]. Meanwhile, it avoids the negative effects of excessive nitrogen application under N3, such as reduced lodging resistance and increased non-productive tillers [81]. This balance improves lodging resistance and supports yield formation. While the N2D3 combination may threaten yields due to the reduced levels of lignin, cellulose, and hemicellulose, the higher planting density associated with D3 can compensate for potential yield losses by increasing the number of ears [82]. Ultimately, N2D3 resulted in yields of 10.17 t/ha for SN23 and 7.86 t/ha for SN16 (Table 1). Figure 10 and Figure 11 illustrate the trade−offs between lodging resistance and yield, reinforcing the rationale for selecting N2D3 as the optimal combination for balancing these competing demands.

5. Conclusions

The N2D3 combination emerged as the optimal strategy, delivering the highest yields with minimal reduction in the lodging resistance index (LRI); it achieved yields of 10.17 t/ha for SN23 and 7.86 t/ha for SN16. The application of 240 kg/ha of nitrogen and increasing planting density to 375 plants/m2 addressed resource underutilization from low planting density and nitrogen deficiency while reducing the decline in lodging resistance caused by high planting density and excessive nitrogen. Ultimately, yield was improved by sacrificing lodging resistance. This study highlights the trade−off between yield and lodging resistance across winter wheat internodes, offering practical strategies grounded in theoretical insight.

Supplementary Materials

The following supporting information can be downloaded at: https://www.mdpi.com/article/10.3390/agronomy15010168/s1, Figure S1: Effect of nitrogen application and planting density on lodging resistance index (LRI) in five internodes of SN23 and SN16 on milk stage, and dough stage; Figure S2: Effect of nitrogen application and planting density on bending moment (WP) in five internodes of SN23 and SN16 on milk stage, and dough stage; Figure S3: Effect of nitrogen application and planting density on breaking strength (R) in five internodes of SN23 and SN16 on milk stage, and dough stage; Figure S4: Effect of nitrogen application and planting density on cellulose in five internodes of SN23 and SN16 on milk stage, and dough stage; Figure S5: Effect of nitrogen application and planting density on hemicellulose in five internodes of SN23 and SN16 on milk stage and dough stage; Figure S6: Effect of nitrogen application and planting density on lignin in five internodes of SN23 and SN16 on milk stage, and dough stage; Figure S7: Effect of nitrogen application and planting density on lignin subunit in five internodes of SN23 and SN16 on milk stage, and dough stage; Table S1: Analysis of variance of lodging resistance index (LRI) at different stages and internodes; Table S2: Analysis of variance of bending moment (WP), internode length (SL), and fresh weight of internode (FW) at different stage and internodes; Table S3: Analysis of variance of breaking strength (R) at different stages and internodes; Table S4: Analysis of variance of cellulose, hemicellulose, and lignin at different stages and internodes; Table S5: Analysis of variance of lignin subunit (S, G, H) at different stage and internodes; Table S6: References to Figure 11.

Author Contributions

Investigation, Data curation, Formal analysis, and Writing—original draft preparation, H.L. and S.S.; Supervision, Investigation and writing—review and editing, M.J.; Supervision and Investigation, C.L.; Investigation, J.W.; Project administration and Funding acquisition, H.C. and Y.L.; Funding acquisition and Resources, Z.W. All authors have read and agreed to the published version of the manuscript.

Funding

The authors gratefully acknowledge the National Natural Science Foundation of China (NO. 32172117, 32101834, 32401959), the Shandong Province Taishan Scholars Young Experts Project (NO. tsqn202306141), the Shandong Province Modern Agricultural Industry Technology System Deputy Chief Project (SDAIT-31-02), the Postdoctoral Science Foundation of China (2022M711968), and the Natural Science Foundation of Shandong Province (NO. ZR2020QC106, ZR2024QC120).

Data Availability Statement

All data generated or analyzed during this study are presented in this article.

Conflicts of Interest

The authors declare no conflicts of interest.

References

  1. Gooding, M.J.; Shewry, P.R. Wheat and Humans. In Wheat; Gooding, M.J., Shewry, P.R., Eds.; John Wiley & Sons: Hoboken, NJ, USA, 2022. [Google Scholar] [CrossRef]
  2. Zuber, U.; Winzeler, H.; Messmer, M.M.; Keller, M.; Keller, B.; Schmid, J.E.; Stamp, P. Morphological traits associated with lodging resistance of spring wheat (Triticum aestivum L.). J. Agron. Crop Sci. 1999, 182, 17–24. [Google Scholar] [CrossRef]
  3. Piñera-Chavez, F.J.; Berry, P.M.; Foulkes, M.J.; Jesson, M.A.; Reynolds, M.P. Avoiding lodging in irrigated spring wheat. I. Stem and root structural requirements. Field Crops Res. 2016, 196, 325–336. [Google Scholar] [CrossRef]
  4. Mirabella, N.E.; Abbate, P.E.; Alonso, M.P.; Panelo, J.S.; Pontaroli, A.C. Identifying traits at crop maturity and models for estimation of lodging susceptibility in bread wheat. Crop Pasture Sci. 2019, 70, 95–106. [Google Scholar] [CrossRef]
  5. Berry, P.M.; Spink, J. Predicting yield losses caused by lodging in wheat. Field Crops Res. 2012, 137, 19–26. [Google Scholar] [CrossRef]
  6. Wang, Y.; Jin, M.; Luo, Y.; Chang, Y.; Zhu, J.; Li, Y.; Wang, Z. Effects of irrigation on stem lignin and breaking strength of winter wheat with different planting densities. Field Crops Res. 2022, 282, 108518. [Google Scholar] [CrossRef]
  7. Martre, P.; Dueri, S.; Guarin, J.R.; Ewert, F.; Webber, H.; Calderini, D.; Molero, G.; Reynolds, M.; Miralles, D.; Garcia, G.; et al. Global needs for nitrogen fertilizer to improve wheat yield under climate change. Nat. Plants 2024, 10, 1081–1090. [Google Scholar] [CrossRef] [PubMed]
  8. Kong, X.; Zhao, G.; Sun, X.; Fu, Y. Coordinating lodging incidence and grain yield through wheat genetic diversity. Field Crops Res. 2024, 315, 109468. [Google Scholar] [CrossRef]
  9. McLellan, E.L.; Cassman, K.G.; Eagle, A.J.; Woodbury, P.B.; Sela, S.; Tonitto, C.; Marjerison, R.D.; van Es, H.M. The nitrogen balancing act: Tracking the environmental performance of food production. BioScience 2018, 68, 194–203. [Google Scholar] [CrossRef] [PubMed]
  10. Chen, K.; Kumudini, S.V.; Tollenaar, M.; Vyn, T.J. Plant biomass and nitrogen partitioning changes between silking and maturity in newer versus older maize hybrids. Field Crops Res. 2015, 183, 315–328. [Google Scholar] [CrossRef]
  11. Chen, Y.; Xiao, C.; Wu, D.; Xia, T.; Chen, Q.; Chen, F.; Yuan, L.; Mi, G. Effects of nitrogen application rate on grain yield and grain nitrogen concentration in two maize hybrids with contrasting nitrogen remobilization efficiency. Eur. J. Agron. 2015, 62, 79–89. [Google Scholar] [CrossRef]
  12. Mu, X.; Chen, Q.; Chen, F.; Yuan, L.; Mi, G. Within-leaf nitrogen allocation in adaptation to low nitrogen supply in maize during grain-filling stage. Front. Plant Sci. 2016, 7, 699. [Google Scholar] [CrossRef]
  13. Xu, Q.; Li, J.; Gao, H.; Yang, X.; Dou, Z.; Yuan, X.; Gao, W.; Zhang, H. Optimizing nitrogen management can improve stem lodging resistance and stabilize grain yield of japonica rice in rice-crayfish coculture systems. J. Integr. Agric. 2024, 23, 3983–3997. [Google Scholar] [CrossRef]
  14. Zhang, W.; Wu, L.; Wu, X.; Ding, Y.; Li, G.; Li, J.; Weng, F.; Liu, Z.; Tang, S.; Ding, C.; et al. Lodging resistance of japonica rice (Oryza Sativa L.): Morphological and anatomical traits due to top-dressing nitrogen application rates. Rice 2016, 9, 31. [Google Scholar] [CrossRef] [PubMed]
  15. Kuai, J.; Sun, Y.; Zhou, M.; Zhang, P.; Zuo, Q.; Wu, J.; Zhou, G. The effect of nitrogen application and planting density on the radiation use efficiency and the stem lignin metabolism in rapeseed (Brassica napus L.). Field Crops Res. 2016, 199, 89–98. [Google Scholar] [CrossRef]
  16. Khan, S.; Anwar, S.; Kuai, J.; Noman, A.; Shahid, M.; Din, M.; Ali, A.; Zhou, G. Alteration in yield and oil quality traits of winter rapeseed by lodging at different planting density and nitrogen rates. Sci. Rep. 2018, 8, 634. [Google Scholar] [CrossRef]
  17. Pan, J.; Zhao, J.; Liu, Y.; Huang, N.; Tian, K.; Shah, F.; Liang, K.; Zhong, X.; Liu, B. Optimized nitrogen management enhances lodging resistance of rice and its morpho-anatomical, mechanical, and molecular mechanisms. Sci. Rep. 2019, 9, 20274. [Google Scholar] [CrossRef] [PubMed]
  18. Zhang, W.; Wu, L.; Ding, Y.; Yao, X.; Wu, X.; Weng, F.; Li, G.; Liu, Z.; Tang, S.; Ding, C.; et al. Nitrogen fertilizer application affects lodging resistance by altering secondary cell wall synthesis in japonica rice (Oryza sativa). J. Plant Res. 2017, 130, 859–871. [Google Scholar] [CrossRef] [PubMed]
  19. Wu, W.; Ma, B.L.; Whalen, J.K. Enhancing rapeseed tolerance to heat and drought stresses in a changing climate: Perspectives for stress adaptation from root system architecture. Adv. Agron. 2018, 151, 87–157. [Google Scholar] [CrossRef]
  20. Luo, Y.; Ni, J.; Pang, D.; Jin, M.; Chen, J.; Kong, X.; Li, W.; Chang, Y.; Li, Y.; Wang, Z. Regulation of lignin composition by nitrogen rate and density and its relationship with stem mechanical strength of wheat. Field Crops Res. 2019, 241, 107572. [Google Scholar] [CrossRef]
  21. Niu, Y.; Chen, T.; Zhao, C.; Zhou, M. Lodging prevention in cereals: Morphological, biochemical, anatomical traits and their molecular mechanisms, management and breeding strategies. Field Crops Res. 2022, 289, 108733. [Google Scholar] [CrossRef]
  22. Wu, W.; Shah, F.; Ma, B.L. Understanding of crop lodging and agronomic strategies to improve the resilience of rapeseed production to climate change. Crop Environ. 2022, 1, 133–144. [Google Scholar] [CrossRef]
  23. Djaman, K.; Allen, S.; Djaman, D.S.; Koudahe, K.; Irmak, S.; Puppala, N.; Darapuneni, M.K.; Angadi, S.V. Planting date and plant density effects on maize growth, yield and water use efficiency. Environ. Chall. 2022, 6, 100417. [Google Scholar] [CrossRef]
  24. Deng, J.; Ran, J.; Wang, Z.; Fan, Z.; Wang, G.; Ji, M.; Liu, J.; Wang, Y.; Liu, J.; Brown, J.H. Models and tests of optimal density and maximal yield for crop plants. Proc. Natl. Acad. Sci. USA 2012, 109, 15823–15828. [Google Scholar] [CrossRef] [PubMed]
  25. Cai, T.; Peng, D.; Wang, R.; Jia, X.; Qiao, D.; Liu, T.; Jia, Z.; Wang, Z.; Ren, X. Can intercropping or mixed cropping of two genotypes enhance wheat lodging resistance? Field Crops Res. 2019, 239, 10–18. [Google Scholar] [CrossRef]
  26. Yang, Y.; Guo, X.; Hou, P.; Xue, J.; Liu, G.; Liu, W.; Wang, Y.; Zhao, R.; Ming, B.; Xie, R.; et al. Quantitative effects of solar radiation on maize lodging resistance mechanical properties. Field Crops Res. 2020, 255, 107906. [Google Scholar] [CrossRef]
  27. Peng, D.; Chen, X.; Yin, Y.; Lu, K.; Yang, W.; Tang, Y.; Wang, Z. Lodging resistance of winter wheat (Triticum aestivum L.): Lignin accumulation and its related enzymes activities due to the application of paclobutrazol or gibberellin acid. Field Crops Res. 2014, 157, 1–7. [Google Scholar] [CrossRef]
  28. Mottiar, Y.; Vanholme, R.; Boerjan, W.; Ralph, J.; Mansfield, S.D. Designer lignins: Harnessing the plasticity of lignification. Curr. Opin. Biotechnol. 2016, 37, 190–200. [Google Scholar] [CrossRef]
  29. Wu, L.; Zhang, W.; Ding, Y.; Zhang, J.; Cambula, E.D.; Weng, F.; Liu, Z.; Ding, C.; Tang, S.; Chen, L.; et al. Shading contributes to the reduction of stem mechanical strength by decreasing cell wall synthesis in japonica rice (Oryza sativa L.). Front. Plant Sci. 2017, 8, 881. [Google Scholar] [CrossRef]
  30. Li, Q.; Fu, C.; Liang, C.; Ni, X.; Zhao, X.; Chen, M.; Ou, L. Crop lodging and the roles of lignin, cellulose, and hemicellulose in lodging resistance. Agronomy 2022, 12, 1795. [Google Scholar] [CrossRef]
  31. Rathke, G.W.; Christen, O.; Diepenbrock, W. Effects of nitrogen source and rate on productivity and quality of winter oilseed rape (Brassica napus L.) grown in different crop rotations. Field Crops Res. 2005, 94, 103–113. [Google Scholar] [CrossRef]
  32. Sinclair, T.R.; Muchow, R.C. Radiation use efficiency. Adv. Agron. 1999, 65, 215–265. [Google Scholar] [CrossRef]
  33. Wullschleger, S.D.; Oosterhuis, D.M. Canopy development and photosynthesis of cotton as influenced by nitrogen nutrition. J. Plant Nutr. 1990, 13, 1141–1154. [Google Scholar] [CrossRef]
  34. O’connell, M.G.; O’leary, G.J.; Whitfield, D.M.; Connor, D.J. Interception of photosynthetically active radiation and radiation-use efficiency of wheat, field pea and mustard in a semi-arid environment. Field Crops Res. 2004, 85, 111–124. [Google Scholar] [CrossRef]
  35. Rinehardt, J.M.; Edmisten, K.L.; Wells, R.; Faircloth, J.C. Response of ultra–narrow and conventional spaced cotton to variable nitrogen rates. J. Plant Nutr. 2004, 27, 743–755. [Google Scholar] [CrossRef]
  36. Cheng, B.; Raza, A.; Wang, L.; Xu, M.; Lu, J.; Gao, Y.; Qin, S.; Zhang, Y.; Ahmad, I.; Zhou, T.; et al. Effects of multiple planting densities on lignin metabolism and lodging resistance of the strip intercropped soybean stem. Agronomy 2020, 10, 1177. [Google Scholar] [CrossRef]
  37. Tao, Y.; Li, Z.; Shah, F.; Wu, W. Optimizing biomass allocation for optimum balance of seed yield and lodging resistance in rapeseed. Field Crops Res. 2024, 316, 109493. [Google Scholar] [CrossRef]
  38. Wei, S.; Wang, X.; Li, G.; Jiang, D.; Dong, S. Maize canopy apparent photosynthesis and 13C-photosynthate reallocation in response to different density and N rate combinations. Front. Plant Sci. 2019, 10, 1113. [Google Scholar] [CrossRef]
  39. Wei, S.; Wang, X.; Zhu, Q.; Jiang, D.; Dong, S. Optimising yield and resource utilisation of summer maize under the conditions of increasing density and reducing nitrogen fertilization. Sci. Nat. 2017, 104, 86. [Google Scholar] [CrossRef] [PubMed]
  40. Ookawa, T.; Ishihara, K. Varietal difference of physical characteristics of the culm related to lodging resistance in paddy rice [Oryza sativa]. Jpn. J. Crop Sci. 1992, 61, 419–425. [Google Scholar] [CrossRef]
  41. Li, C.; Li, W.; Luo, Y.; Jin, M.; Chang, Y.; Cui, H.; Sun, S.; Li, Y.; Wang, Z. Mixed cropping increases grain yield and lodging resistance by improving the canopy light environment of wheat populations. Eur. J. Agron. 2023, 147, 126849. [Google Scholar] [CrossRef]
  42. Hussain, S.; Iqbal, N.; Rahman, T.; Liu, T.; Brestic, M.; Safdar, M.E.; Asgharr, M.A.; Farooq, M.U.; Shafiq, I.; Ali, A.; et al. Shade effect on carbohydrates dynamics and stem strength of soybean genotypes. Environ. Exp. Bot. 2019, 162, 374–382. [Google Scholar] [CrossRef]
  43. Zheng, M.; Chen, J.; Shi, Y.; Li, Y.; Yin, Y.; Yang, D.; Luo, Y.; Pang, D.; Xu, X.; Li, W.; et al. Manipulation of lignin metabolism by plant densities and its relationship with lodging resistance in wheat. Sci. Rep. 2017, 7, 41805. [Google Scholar] [CrossRef] [PubMed]
  44. Shao, Q.; Zhou, Q.; Wang, X.; Cai, J.; Huang, M.; Dai, T.; Jiang, D. Effects of planting density on stem morphological characteristics, chemical composition and lodging resistance of different wheat varieties. J. Nanjing Agric. Univ. 2018, 41, 808–816. [Google Scholar] [CrossRef]
  45. Dong, X.C.; Qian, T.F.; Chu, J.P.; Zhang, X.; Liu, Y.J.; Dai, X.L.; He, M.R. Late sowing enhances lodging resistance of wheat plants by improving the biosynthesis and accumulation of lignin and cellulose. J. Integr. Agric. 2023, 22, 1351–1365. [Google Scholar] [CrossRef]
  46. Handakumbura, P.P.; Hazen, S.P. Transcriptional regulation of grass secondary cell wall biosynthesis: Playing catch-up with Arabidopsis thaliana. Front. Plant Sci. 2012, 3, 74. [Google Scholar] [CrossRef] [PubMed]
  47. Xue, J.; Gou, L.; Zhao, Y.; Yao, M.; Yao, H.; Tian, J.; Zhang, W. Effects of light intensity within the canopy on maize lodging. Field Crops Res. 2016, 188, 133–141. [Google Scholar] [CrossRef]
  48. Li, W.Q.; Han, M.M.; Pang, D.W.; Chen, J.; Wang, Y.Y.; Dong, H.H.; Chang, Y.; Jin, M.; Luo, Y.; Li, Y.; et al. Characteristics of lodging resistance of high-yield winter wheat as affected by nitrogen rate and irrigation managements. J. Integr. Agric. 2022, 21, 1290–1309. [Google Scholar] [CrossRef]
  49. Tripathi, S.C.; Sayre, K.D.; Kaul, J.N.; Narang, R.S. Growth and morphology of spring wheat (Triticum aestivum L.) culms and their association with lodging: Effects of genotypes, N levels and ethephon. Field Crops Res. 2003, 84, 271–290. [Google Scholar] [CrossRef]
  50. Niu, L.; Feng, S.; Ding, W.; Li, G. Influence of speed and rainfall on large-scale wheat lodging from 2007 to 2014 in China. PLoS ONE 2016, 11, e0157677. [Google Scholar] [CrossRef] [PubMed]
  51. Mulsanti, I.W.; Yamamoto, T.; Ueda, T.; Samadi, A.F.; Kamahora, E.; Rumanti, I.A.; Thanh, V.C.; Adachi, S.; Suzuki, S.; Kanekatsu, M.; et al. Finding the superior allele of japonica-type for increasing stem lodging resistance in indica rice varieties using chromosome segment substitution lines. Rice 2018, 11, 25. [Google Scholar] [CrossRef] [PubMed]
  52. Feng, S.W.; Ru, Z.G.; Ding, W.H.; Hu, T.Z.; Li, G. Study of the relationship between field lodging and stem quality traits of winter wheat in the north China plain. Crop Pasture Sci. 2019, 70, 772–780. [Google Scholar] [CrossRef]
  53. Li, X.; Gao, Y.; Cui, Z.; Zhang, T.; Chen, S.; Xiang, S.; Jia, L.; Yan, B.; Wang, Y.; Guo, L.; et al. Optimized nitrogen and potassium fertilizers application increases stem lodging resistance and grain yield of oil flax by enhancing lignin biosynthesis. J. Integr. Agric. 2024, in press. [Google Scholar] [CrossRef]
  54. Wu, W.; Ma, B.L.; Fan, J.J.; Sun, M.; Yi, Y.; Guo, W.S.; Voldeng, H.D. Management of nitrogen fertilization to balance reducing lodging risk and increasing yield and protein content in spring wheat. Field Crops Res. 2019, 241, 107584. [Google Scholar] [CrossRef]
  55. Wang, Y.; Peng, Y.; Lin, J.; Wang, L.; Jia, Z.; Zhang, R. Optimal nitrogen management to achieve high wheat grain yield, grain protein content, and water productivity: A meta-analysis. Agric. Water Manag. 2023, 290, 108587. [Google Scholar] [CrossRef]
  56. Chen, X.; Wang, J.; Wang, Z.; Li, W.; Wang, C.; Yan, S.; Li, H.; Zhang, A.; Tang, Z.; Wei, M. Optimized nitrogen fertilizer application mode increased culms lignin accumulation and lodging resistance in culms of winter wheat. Field Crops Res. 2018, 228, 31–38. [Google Scholar] [CrossRef]
  57. Raza, A.; Asghar, M.A.; Javed, H.H.; Ullah, A.; Cheng, B.; Xu, M.; Wang, W.; Liu, C.; Rahman, A.; Iqbal, T.; et al. Optimum nitrogen improved stem breaking resistance of intercropped soybean by modifying the stem anatomical structure and lignin metabolism. Plant Physiol. Biochem. 2024, 199, 107720. [Google Scholar] [CrossRef] [PubMed]
  58. Pitre, F.E.; Cooke, J.E.; Mackay, J.J. Short-term effects of nitrogen availability on wood formation and fibre properties in hybrid poplar. Trees 2007, 21, 249–259. [Google Scholar] [CrossRef]
  59. Zhang, J.; Li, G.; Huang, Q.; Liu, Z.; Ding, C.; Tang, S.; Chen, L.; Wang, S.; Ding, Y.; Zhang, W. Effects of culm carbohydrate partitioning on basal stem strength in a high-yielding rice population. Crop J. 2017, 5, 478–487. [Google Scholar] [CrossRef]
  60. Li, Z.; Gao, G.; Xu, L.; Wang, Z.; Wang, C.; Yang, T.; Kuai, J.; Wang, B.; Xu, Z.; Zhao, J.; et al. Reducing nitrogen application at high planting density enhances secondary cell wall formation and decreases stem lodging in rapeseed. Eur. J. Agron. 2024, 156, 127162. [Google Scholar] [CrossRef]
  61. Zhong, R.; Peña, M.J.; Zhou, G.K.; Nairn, C.J.; Wood-Jones, A.; Richardson, E.A.; Morrison, W.H.; Darvill, A.G.; York, W.S.; Ye, Z.H. Arabidopsis fragile fiber8, which encodes a putative glucuronyltransferase, is essential for normal secondary wall synthesis. Plant Cell 2005, 17, 3390–3408. [Google Scholar] [CrossRef]
  62. Peña, M.J.; Zhong, R.; Zhou, G.K.; Richardson, E.A.; O’Neill, M.A.; Darvill, A.G.; York, W.S.; Ye, Z.H. Arabidopsis irregular xylem8 and irregular xylem9: Implications for the complexity of glucuronoxylan biosynthesis. Plant Cell 2007, 19, 549–563. [Google Scholar] [CrossRef] [PubMed]
  63. Lee, C.; Zhong, R.; Richardson, E.A.; Himmelsbach, D.S.; McPhail, B.T.; Ye, Z.H. The PARVUS gene is expressed in cells undergoing secondary wall thickening and is essential for glucuronoxylan biosynthesis. Plant Cell Physiol. 2007, 48, 1659–1672. [Google Scholar] [CrossRef] [PubMed]
  64. Lee, C.; Teng, Q.; Huang, W.; Zhong, R.; Ye, Z.H. The F8H glycosyltransferase is a functional paralog of FRA8 involved in glucuronoxylan biosynthesis in Arabidopsis. Plant Cell Physiol. 2009, 50, 812–827. [Google Scholar] [CrossRef] [PubMed]
  65. Li, B.; Gao, F.; Ren, B.; Dong, S.; Liu, P.; Zhao, B.; Zhang, J. Lignin metabolism regulates lodging resistance of maize hybrids under varying planting density. J. Integr. Agric. 2021, 20, 2077–2089. [Google Scholar] [CrossRef]
  66. Liu, F.; Zhou, F.; Wang, X.L.; Zhan, X.X.; Guo, Z.X.; Liu, Q.L.; Wei, G.; Lan, T.Q.; Feng, D.J.; Kong, F.L.; et al. Optimizing nitrogen management enhances stalk lodging resistance and grain yield in dense planting maize by improving canopy light distribution. Eur. J. Agron. 2023, 148, 126871. [Google Scholar] [CrossRef]
  67. Qi, B.; Hu, J.; Zhu, L.; Duan, Y.; Zhang, W.; Gou, L. Response of maize stalk to plant density on cellulose accumulation by modulating enzymes activities. Field Crops Res. 2023, 304, 109152. [Google Scholar] [CrossRef]
  68. Cao, Y.; Zhong, Z.; Wang, H.; Shen, R. Leaf angle: A target of genetic improvement in cereal crops tailored for high-density planting. Plant Biotechnol. J. 2022, 20, 426–436. [Google Scholar] [CrossRef]
  69. Jin, R.; Li, Z.; Wang, X.L.; Liu, F.; Kong, F.L.; Liu, Q.L.; Lan, T.Q.; Feng, D.J.; Yuan, J.C. Optimizing row spacing increases stalk lodging resistance by improving light distribution in dense maize populations. Agronomy 2023, 13, 462. [Google Scholar] [CrossRef]
  70. Shi, D.Y.; Li, Y.H.; Zhang, J.W.; Liu, P.; Zhao, B.; Dong, S.T. Effects of plant density and nitrogen rate on lodging-related stalk traits of summer maize. Plant Soil Environ. 2016, 62, 299–306. [Google Scholar] [CrossRef]
  71. Li, C.Z.; Li, C.J. Ridge-furrow with plastic film mulching system decreases the lodging risk for summer maize plants under different nitrogen fertilization rates and varieties in dry semi-humid areas. Field Crops Res. 2021, 263, 108056. [Google Scholar] [CrossRef]
  72. Li, C.; Luo, Y.; Jin, M.; Sun, S.; Wang, Z.; Li, Y. Response of lignin metabolism to light quality in wheat population. Front. Plant Sci. 2021, 12, 729647. [Google Scholar] [CrossRef] [PubMed]
  73. Foulkes, M.J.; Slafer, G.A.; Davies, W.J.; Berry, P.M.; Sylvester-Bradley, R.; Martre, P.; Calderini, D.F.; Griffiths, S.; Reynolds, M.P. Raising yield potential of wheat. III. Optimizing partitioning to grain while maintaining lodging resistance. J. Exp. Bot. 2011, 62, 469–486. [Google Scholar] [CrossRef] [PubMed]
  74. Zhang, P.; Gu, S.C.; Wang, Y.Y.; Xu, C.C.; Zhao, Y.T.; Liu, X.L.; Wang, P.; Huang, S.B. The relationships between maize (Zea mays L.) lodging resistance and yield formation depend on dry matter allocation to ear and stem. Crop J. 2022, 11, 258–268. [Google Scholar] [CrossRef]
  75. Springmann, M.; Clark, M.; Mason-D’Croz, D.; Wiebe, K.; Bodirsky, B.L.; Lassaletta, L.; Vries, W.D.; Vermeulen, S.J.; Herrero, M.; Carlson, K.M.; et al. Options for keeping the food system within environmental limits. Nature 2018, 562, 519–525. [Google Scholar] [CrossRef] [PubMed]
  76. Gu, B.; Zhang, L.; Van Dingenen, R.; Vieno, M.; Van Grinsven, H.J.; Zhang, X.; Zhang, S.; Chen, Y.; Wang, S.; Ren, C.; et al. Abating ammonia is more cost-effective than nitrogen oxides for mitigating PM2. 5 air pollution. Science 2021, 374, 758–762. [Google Scholar] [CrossRef] [PubMed]
  77. Schulte-Uebbing, L.F.; Beusen, A.H.; Bouwman, A.F.; De Vries, W. From planetary to regional boundaries for agricultural nitrogen pollution. Nature 2022, 610, 507–512. [Google Scholar] [CrossRef]
  78. Hu, Y.; Qin, F.; Wu, Z.; Wang, X.; Ren, X.; Jia, Z.; Wang, Z.; Chen, X.; Cai, T. Heterogeneous population distribution enhances resistance to wheat lodging by optimizing the light environment. J. Integr. Agric. 2024, 23, 2211–2226. [Google Scholar] [CrossRef]
  79. Jovanovic, Z.; Djakovic, T.; Stikic, R.; Prokic, L.; Sukalovic, V.H. Effect of N deficiency on leaf growth and cell wall peroxidase activity in contrasting maize genotypes. Plant Soil 2004, 265, 211–223. [Google Scholar] [CrossRef]
  80. Kavanov, A.M.; Lattanzi, F.A.; Schnyder, H. Nitrogen deficiency inhibits leaf blade growth in Lolium perenne by increasing cell cycle duration and decreasing mitotic and post-mitotic growth rates. Plant Cell Environ. 2008, 31, 727–737. [Google Scholar] [CrossRef] [PubMed]
  81. Kebrom, T.H.; Chandler, P.M.; Swain, S.M.; King, R.W.; Richards, R.A.; Spielmeyer, W. Inhibition of tiller bud outgrowth in the tin mutant of wheat is associated with precocious internode development. Plant Physiol. 2012, 160, 308–318. [Google Scholar] [CrossRef] [PubMed]
  82. Huang, L.; Wang, F.; Liu, Y.; Tian, X.; Zhang, Y. Can optimizing seeding rate and planting density alleviate the yield loss of double-season rice caused by prolonged seedling age? Crop Sci. 2021, 61, 2759–2774. [Google Scholar] [CrossRef]
Figure 1. Monthly average rainfall and temperature during the winter wheat growing seasons of 2019−2021. The rainfall and temperature patterns observed during the period encompassing the initial planting of winter wheat in October 2019 through to its harvest in June 2021, across the second cropping season, exhibited a consistent trend of initial decline, followed by an increase, a subsequent decrease, and ultimately a sustained rise. No standard deviation has been added to this figure.
Agronomy 15 00168 g001
Figure 2. Effect of nitrogen application and planting density on lodging resistance index (LRI) in five internodes of SN23 and SN16 on anthesis stage. The meaning of the 12 bars for each internode in left to right is N1D1, N1D2, N1D3, N1D4, N2D1, N2D2, N2D3, N2D4, N3D1, N3D2, N3D3, and N3D4. SN23, Shannong 23; SN16, Shannong 16. N1, N2, and N3, represent 120 kg/ha, 240 kg/ha, and 360 kg/ha of nitrogen, respectively. D1, D2, D3, and D4, represent 75 plants/m2, 225 plants/m2, 375 plants/m2, and 525 plants/m2, respectively. I1, I2, I3, I4, and I5, represent the five internodes from the base upwards.
Agronomy 15 00168 g002
Figure 3. Effect of nitrogen application and planting density on bending moment (WP) in five internodes of SN23 and SN16 on anthesis stage. SN23, Shannong 23; SN16, Shannong 16. N1, N2, and N3, represent 120 kg/ha, 240 kg/ha, and 360 kg/ha of nitrogen, respectively. D1, D2, D3, and D4, represent 75 plants/m2, 225 plants/m2, 375 plants/m2, and 525 plants/m2, respectively. I1, I2, I3, I4, and I5, represent the five internodes from the base upwards. The error bars in the figure indicate the standard deviation.
Agronomy 15 00168 g003
Figure 4. Effect of nitrogen application and planting density on breaking strength (R) in five internodes of SN23 and SN16 on anthesis stage. SN23, Shannong 23; SN16, Shannong 16. N1, N2, and N3, represent 120 kg/ha, 240 kg/ha, and 360 kg/ha of nitrogen, respectively. D1, D2, D3, and D4, represent 75 plants/m2, 225 plants/m2, 375 plants/m2, and 525 plants/m2, respectively. I1, I2, I3, I4, and I5, represent the five internodes from the base upwards. The error bars in the figure indicate the standard deviation.
Agronomy 15 00168 g004
Figure 5. Effect of nitrogen application and planting density on cellulose in five internodes of SN23 and SN16 on anthesis stage. SN23, Shannong 23; SN16, Shannong 16. N1, N2, and N3, represent 120 kg/ha, 240 kg/ha, and 360 kg/ha of nitrogen, respectively. D1, D2, D3, and D4, represent 75 plants/m2, 225 plants/m2, 375 plants/m2, and 525 plants/m2, respectively. I1, I2, I3, I4, and I5, represent the five internodes from the base upwards. The error bars in the figure indicate the standard deviation.
Agronomy 15 00168 g005
Figure 6. Effect of nitrogen application and planting density on hemicellulose in five internodes of SN23 and SN16 on anthesis stage. SN23, Shannong 23; SN16, Shannong 16. N1, N2, and N3, represent 120 kg/ha, 240 kg/ha, and 360 kg/ha of nitrogen, respectively. D1, D2, D3, and D4, represent 75 plants/m2, 225 plants/m2, 375 plants/m2, and 525 plants/m2, respectively. I1, I2, I3, I4, and I5, represent the five internodes from the base upwards. The error bars in the figure indicate the standard deviation.
Agronomy 15 00168 g006
Figure 7. Effect of nitrogen application and planting density on lignin in five internodes of SN23 and SN16 on anthesis stage. SN23, Shannong 23; SN16, Shannong 16. N1, N2, and N3, represent 120 kg/ha, 240 kg/ha, and 360 kg/ha of nitrogen, respectively. D1, D2, D3, and D4, represent 75 plants/m2, 225 plants/m2, 375 plants/m2, and 525 plants/m2, respectively. I1, I2, I3, I4, and I5, represent the five internodes from the base upwards. The error bars in the figure indicate the standard deviation. Different lowercase letters indicate significant differences between treatments (p < 0.05).
Agronomy 15 00168 g007
Figure 8. Effect of nitrogen application and planting density on lignin subunit in five internodes of SN23 and SN16 on anthesis stage. (a) Effect of nitrogen application and planting density on lignin subunit in five internodes of SN23 on anthesis stage. (b) Effect of nitrogen application and planting density on lignin subunit in five internodes of SN16 on anthesis stage. Lowercase letters indicate significant differences between treatments for both varieties (p < 0.05). SN23, Shannong 23; SN16, Shannong 16. N1, N2, and N3, represent 120 kg/ha, 240 kg/ha, and 360 kg/ha of nitrogen, respectively. D1, D2, D3, and D4, represent 75 plants/m2, 225 plants/m2, 375 plants/m2, and 525 plants/m2, respectively. I1, I2, I3, I4, and I5, represent the five internodes from the base upwards. The error bars in the figure indicate the standard deviation. Different lowercase letters indicate significant differences between treatments (p < 0.05).
Agronomy 15 00168 g008
Figure 9. Correlation of lodging resistance index (LRI) with other indicators. Data are calculated using three replications of each indicator. Figures (aj) represent the correlation of each indicator with the lodging resistance index (LRI), dots in each figure are data points, shaded areas are 95 confidence spaces, and horizontal lines of varying widths represent the fitting trend. R2 is the coefficient of fit, with p < 0.01 representing highly significant.
Agronomy 15 00168 g009
Figure 10. Trade−off process between SN23 and SN16 in the context of N2D3, and N3D2 vs. N2D2. (a) The comparison results of SN23 at N2D3 and N3D2 with N2D2. (b) The comparison results of SN16 at N2D3 and N3D2 with N2D2. WP represents bending moment, R represents breaking strength, and LRI represents lodging resistance index. Data are averages of the sum of the internodes of the two varieties for each period.
Agronomy 15 00168 g010
Figure 11. Trade−off mechanism between yield and lodging resistance (references are listed in Table S6). Orange represents enzymes, blue denotes genes, light blue signifies transcription factors, gray indicates chemical bonds, and purple represents phytochromes, red represent measurement indicators and related substances. N1, N2, and N3, represent 120 kg/ha, 240 kg/ha, and 360 kg/ha of nitrogen, respectively. D1, D2, D3, and D4, represent 75 plants/m2, 225 plants/m2, 375 plants/m2, and 525 plants/m2, respectively. SL denotes internode length (cm), FW represents fresh weight of internode (g), WP denotes bending moment (g cm), and R indicates breaking strength (g cm). The data represents the average values of the total sums for each treatment of two varieties under the same nitrogen application or planting density on five internodes at different stages.
Agronomy 15 00168 g011
Table 1. Effect of nitrogen application and planting density on yield and yield components of SN23 and SN16.
TreatmentSpike Number (Plants/m2)Grain Number per Spike1000−Grain Weight (g)Yield (t/ha)
2019–20202020–20212019–20202020–20212019–20202020–20212019–20202020–2021
SN23
N1D1292.67±16.17 m242.67 ± 19.73 o62.33 ± 3.79 a73.33 ± 0.58 a45.34 ± 0.30 cd48.51 ± 0.23 bcd6.33 ± 0.42 l6.94 ± 0.44 j
N1D2328.00 ± 11.14 l298.67 ± 16.29 mn56.33 ± 1.15 c66.67 ± 1.53 c46.63 ± 0.73 ab50.17 ± 0.69 a6.98 ± 0.33 jk7.91 ± 0.13 efgh
N1D3422.67 ± 8.08 j381.33 ± 10.07 l52.00 ± 1.00 de62.33 ± 1.53 de45.79 ± 0.70 bcd48.97 ± 1.21 bc7.78 ± 0.25 f9.24 ± 0.42 b
N1D4466.00 ± 11.14 i429.33 ± 13.61 hij44.33 ± 1.15 f53.33 ± 0.58 g43.45 ± 0.28 fgh47.37 ± 0.25 ef7.30 ± 0.34 ghij8.83 ± 0.29 bc
N2D1387.33 ± 14.05 k323.33 ± 32.33 m61.33 ± 1.53 ab69.33 ± 1.53 b46.84 ± 0.35 a50.83 ± 0.49 a8.61 ± 0.19 cd8.83 ± 0.31 bc
N2D2480.00 ± 5.29 hi442.00 ± 20.88 ghi54.33 ± 0.58 cd61.33 ± 2.52 e45.48 ± 0.48 cd48.13 ± 0.77 bcde9.13 ± 0.44 b10.36 ± 0.76 a
N2D3594.67 ± 22.03 f528.00 ± 14.42 de50.00 ± 2.65 e57.00 ± 3.00 f42.16 ± 1.09 ij46.14 ± 0.60 gh9.83 ± 0.28 a10.51 ± 1.44 a
N2D4628.67 ± 10.07 de560.00 ± 25.06 cd41.67 ± 1.15 fg51.00 ± 1.73 gh41.64 ± 0.21 jk45.22 ± 0.31 hij8.96 ± 0.15 bc10.14 ± 0.79 a
N3D1334.67 ± 26.03 l285.33 ± 12.06 n59.33 ± 1.15 b64.33 ± 2.08 cd45.77 ± 0.87 bcd49.07 ± 0.72 b7.54 ± 0.30 fgh7.56 ± 0.89 ghij
N3D2464.00 ± 33.29 i418.67 ± 13.01 ijk50.67 ± 2.52 e57.33 ± 1.53 f44.25 ± 0.48 ef47.48 ± 0.05 def8.28 ± 0.21 de8.69 ± 0.23 bcde
N3D3511.33 ± 11.37 g434.67 ± 10.26 ghi43.00 ± 1.00 f51.00 ± 1.00 gh44.99 ± 0.23 de47.92 ± 0.33 cde7.69 ± 0.16 fg8.24 ± 0.34 cdefg
N3D4598.67 ± 21.39 ef512.00 ± 18.33 e39.00 ± 1.73 gh49.67 ± 2.52 h38.97 ± 0.58 l44.27 ± 0.46 jkl7.32 ± 0.49 ghij8.07 ± 0.37 cdefgh
SN16
N1D1354.00 ± 13.86 l284.67 ± 19.43 n44.00 ± 0.00 f47.00 ± 1.00 ij44.80 ± 0.17 de47.55 ± 0.34 def5.52 ± 0.19 m5.14 ± 0.37 k
N1D2493.33 ± 9.87 ghi389.33 ± 38.80 kl39.67 ± 1.15 gh49.33 ± 1.15 hi46.00 ± 0.51 abc50.28 ± 0.82 a6.88 ± 0.14 jk7.70 ± 0.15 fghij
N1D3587.33 ± 18.90 f462.00 ± 9.17 gh37.00 ± 1.00 hi46.33 ± 2.08 jk45.19 ± 0.34 cde48.79 ± 1.14 bc7.46 ± 0.13 fghi8.22 ± 0.24 cdefg
N1D4655.33 ± 9.45 cd558.67 ± 26.10 cd30.33 ± 3.21 k39.67 ± 1.53 l42.53 ± 0.31 hij45.53 ± 1.15 hi7.08 ± 0.25 ijk7.86 ± 0.13 fghi
N2D1498.00 ± 24.58 gh397.33 ± 28.38 jkl43.00 ± 1.00 f46.33 ± 0.58 jk43.72 ± 0.28 fg46.82 ± 0.25 fg7.00 ± 0.29 jk7.09 ± 0.26 ij
N2D2606.67 ± 31.64 ef501.33 ± 28.59 ef38.33 ± 0.58 hi46.00 ± 1.00 jk42.97 ± 1.45 ghi46.17 ± 1.11 gh7.61 ± 0.34 fgh8.50 ± 0.33 bcdef
N2D3678.00 ± 16.37 bc578.33 ± 42.50 bc33.67 ± 0.58 j40.33 ± 0.58 l40.87 ± 0.59 k44.09 ± 0.82 kl7.55 ± 0.19 fgh8.16 ± 0.25 cdefg
N2D4750.00 ± 32.92 a631.00 ± 10.54 a29.67 ± 1.53 k36.67 ± 2.08 m40.67 ± 0.71 k43.79 ± 0.27 l7.24 ± 0.16 hij8.00 ± 0.31 defgh
N3D1598.67 ± 14.05 ef469.33 ± 22.75 fg39.33 ± 1.15 gh44.33 ± 1.53 k42.69 ± 0.39 hi45.88 ± 0.76 ghi7.46 ± 0.17 fghi7.89 ± 0.26 efghi
N3D2691.33 ± 9.45 b591.33 ± 18.15 bc35.67 ± 2.08 ij41.33 ± 0.58 l41.63 ± 0.64 jk44.91 ± 0.47 ijk7.84 ± 0.26 ef8.78 ± 0.28 bcd
N3D3648.00 ± 17.78 cd533.00 ± 17.52 de30.00 ± 1.00 k39.33 ± 1.15 l42.06 ± 0.54 ij45.43 ± 0.20 hi7.00 ± 0.26 jk7.77 ± 0.19 fghi
N3D4702.67 ± 9.45 b608.33 ± 23.46 ab28.00 ± 1.00 k34.33 ± 1.53 m40.88 ± 0.61 k44.22 ± 0.09 jkl6.69 ± 0.18 kl7.29 ± 0.35 hij
Analysis of varianceF values
Y (Year)546.59 ***809.80 ***1045.18 ***109.01 ***
C (Variety)1261.21 ***3636.61 ***222.38 ***215.03 ***
N (Nitrogen)514.35 ***169.25 ***181.24 ***126.79 ***
D (Density)746.33 ***540.56 ***194.07 ***60.84 ***
Y × C54.95 ***9.50 **1.73 ns2.51 ns
Y × N2.54 ns5.84 **0.14 ns1.25 ns
Y × D1.22 ns5.34 **0.87 ns7.21 ***
C × N39.29 ***4.32 *18.07 ***51.35 ***
C × D5.25 **37.55 ***14.04 ***2.78 *
N × D20.40 ***4.73 ***34.34 ***21.47 ***
Y × C × N0.44 ns0.51 ns0.31 ns3.84 *
Y × C × D0.68 ns3.22 *2.50 ns0.52 ns
Y × N × D0.41 ns0.88 ns1.62 ns0.64 ns
C × N × D18.73 ***1.22 ns11.02 ***2.92 *
Y × C × N × D598.57 ns5.52 ns0.30 ns53,810.17 ns
Note: Lowercase letters indicate significant differences (p < 0.05) between different treatments in the same year. *, **, and ***, denote significant effects at p < 0.05, p < 0.01, and p < 0.001, and ns denotes not significant. SN23, Shannong 23; SN16, Shannong 16. N1, N2, and N3, represent 120 kg/ha, 240 kg/ha, and 360 kg/ha of nitrogen, respectively. D1, D2, D3, and D4, represent 75 plants/m2, 225 plants/m2, 375 plants/m2, and 525 plants/m2, respectively. I1, I2, I3, I4, and I5, represent the five internodes from the base upwards. Y indicates year, C indicates variety, N indicates nitrogen application, and D indicates planting density. Y × C indicate interaction between year and variety; Y × N indicate the interaction between year and nitrogen application; Y × D indicate the interaction between year and planting density; C × N indicate the interaction between variety and nitrogen application; C × D indicate the interaction between variety and planting density; N × D indicate the interaction between nitrogen application and planting density; Y × C × N indicate the interaction between year, and variety, and nitrogen application; Y × C × D indicate the interaction between year, and variety, and planting density; Y × N × D indicate the interaction between year, and nitrogen application, and planting density; C × N × D indicate the interaction between variety, and nitrogen application, and planting density; Y × C × N × D indicate the interaction between year, variety, and nitrogen application, and planting density. Data are expressed as the mean and standard deviation of three replications.
Disclaimer/Publisher’s Note: The statements, opinions and data contained in all publications are solely those of the individual author(s) and contributor(s) and not of MDPI and/or the editor(s). MDPI and/or the editor(s) disclaim responsibility for any injury to people or property resulting from any ideas, methods, instructions or products referred to in the content.

