Article

Effects of Irrigation with Treated Slaughterhouse Effluent and Bradyrhizobium spp. Inoculation on Soybean Development and Productivity: Strategies for Sustainable Management

by
Ana Carolina Murad Lima
1,
Lisiane Brichi
1,
Lucas Renato Trevisan
1,
André Leão de Souza Dominguez
1,
Gustavo Nocera Santiago
2,
Tamara Maria Gomes
1,3 and
Fabrício Rossi
1,3,*
1
College of Agriculture “Luiz de Queiroz”, University of São Paulo, Piracicaba 13418-900, SP, Brazil
2
Agronomy Department, Kansas State University, 1712 Claflin Rd, Manhattan, KS 66502, USA
3
Department of Biosystems Engineering, School of Animal Science and Food Engineering, University of São Paulo, Pirassununga 13635-900, SP, Brazil
*
Author to whom correspondence should be addressed.
Agronomy 2025, 15(1), 167; https://doi.org/10.3390/agronomy15010167
Submission received: 28 November 2024 / Revised: 24 December 2024 / Accepted: 25 December 2024 / Published: 11 January 2025

Abstract

:
Water scarcity challenges in agriculture are prompting the exploration of alternative irrigation sources, including treated effluents. This study investigates the effects of irrigation with treated slaughterhouse effluent on soybean productivity and development, with and without inoculation, over two cropping cycles. Plant performance was significantly influenced by environmental factors and the interaction between effluent and inoculation. Plant height and leaf area were greater in the second cycle, with effluent enhancing growth and foliar development. Fresh and dry shoot biomass showed significant interactions among cycle, inoculation, and effluent, with higher effluent concentrations combined with inoculation being most effective in the first cycle. Foliar nitrogen concentrations were higher in the first cycle, particularly at elevated effluent doses, while foliar sodium showed a positive correlation with nitrogen and a negative correlation with magnesium. Chlorophyll indices varied across developmental stages, with maximum chlorophyll b estimated at 85.35% effluent irrigation. Soybean yield did not vary significantly with effluent dilutions, suggesting environmental factors had a greater influence. In conclusion, treated effluent irrigation represents a sustainable strategy for soybean production, optimizing water and nutrient use while reducing reliance on chemical fertilizers.

1. Introduction

Water scarcity is an increasing global challenge exacerbated by population growth and climate change. Currently, about 40% of the world’s population faces some degree of water stress, and this situation is expected to worsen by 2050 [1,2]. In Brazil, agriculture accounts for over 50% of total water consumption, while industrial sectors such as meat processing and slaughterhouses also make substantial withdrawals, further intensifying pressure on water resources [3]. In this context, water reuse has become a vital strategy for promoting sustainability and water security. It aligns with the principles of a circular economy by reducing the consumption of higher-quality water, minimizing effluent discharge, and decreasing the reliance on mineral fertilizers [4]. However, the application of treated effluents in agriculture requires careful management to prevent soil salinization and adverse environmental impacts [5,6].
Soybean (Glycine max), one of the most important crops for Brazilian agribusiness, is especially relevant in this scenario. Brazil is the largest global producer of soybeans, contributing approximately 33% of the world’s production [7,8]. In addition to its economic value, soybeans possess advantageous agronomic characteristics, such as the ability to fix atmospheric nitrogen biologically through symbiosis with bacteria of the genus Bradyrhizobium spp., which reduces the need for nitrogen fertilization and enhances the sustainability of production systems [9,10]. However, the interaction between effluent irrigation and biological nitrogen fixation (BNF) can be complex, as high concentrations of nutrients and salts in the effluent may negatively influence nodulation and the nitrogen fixation process [11].
Recent studies suggest that while irrigation with treated effluents can increase agricultural productivity, excessive nitrogen doses and soil salinity can reduce BNF efficacy and limit legume growth [12,13]. Conversely, moderate nitrogen doses may complement BNF and improve soybean development [14,15]. These findings highlight the need to explore management practices that maximize the benefits of effluent reuse while preserving soil health and symbiotic performance.
This study, therefore, investigates the effects of irrigation with treated slaughterhouse effluent on soybean productivity, with and without Bradyrhizobium spp. inoculation. The hypothesis is that treated effluent when applied at appropriate doses and combined with Bradyrhizobium spp. inoculation can meet the plant’s nitrogen demand independently of BNF, promoting a viable and sustainable alternative for soybean crop irrigation. This study aims to contribute to the advancement of sustainable agricultural management practices, particularly in water-scarce regions, by providing an in-depth analysis of the interaction between effluent irrigation and biological nitrogen fixation.

2. Materials and Methods

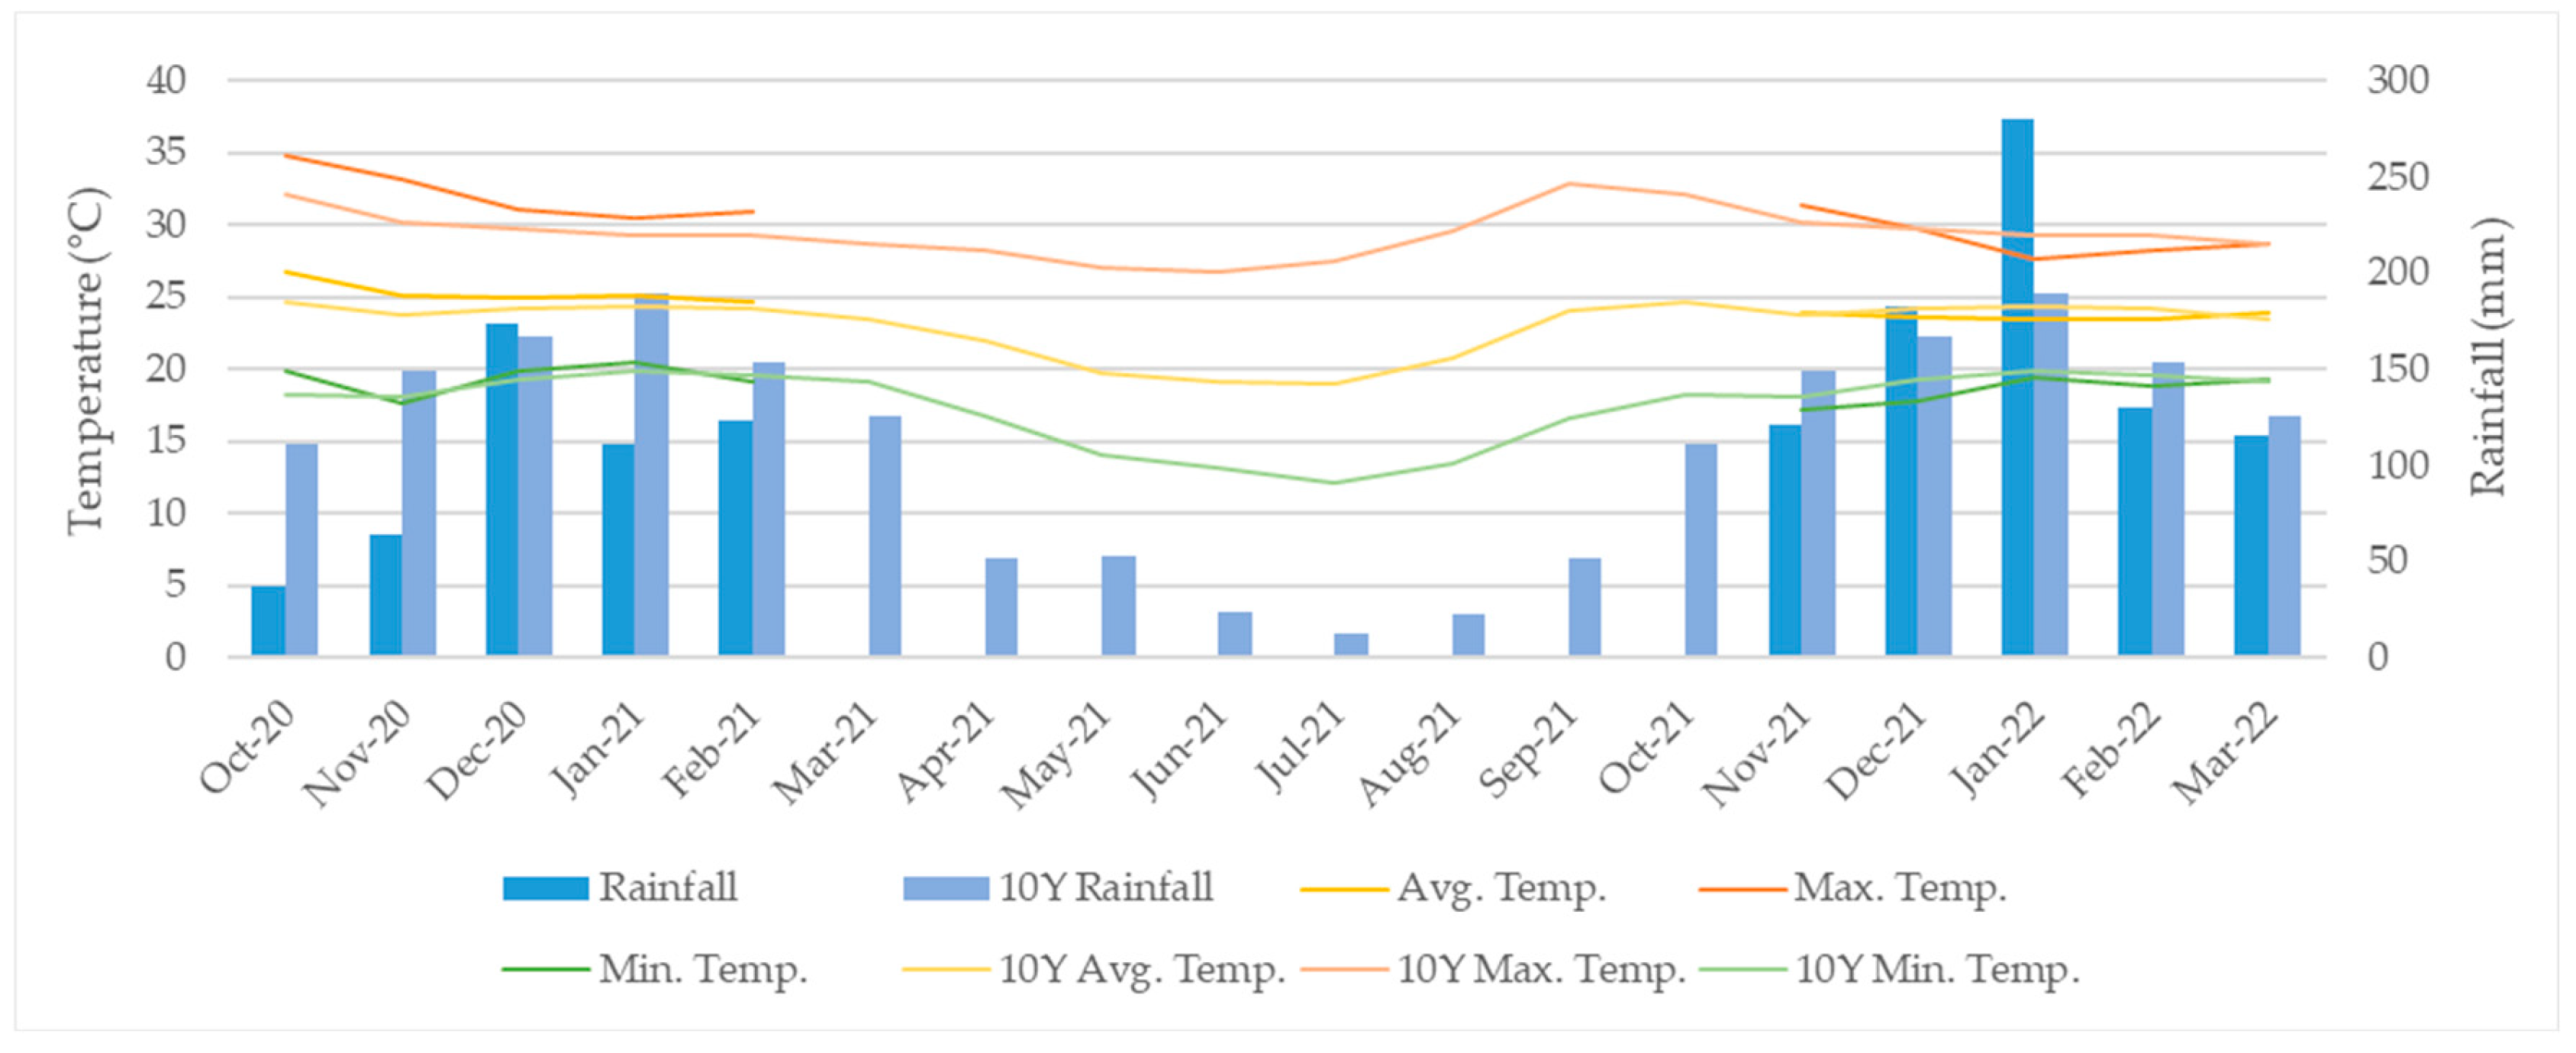
2.1. Experimental Conditions

The experiment was conducted in the experimental area of the School of Animal Science and Food Engineering, University of São Paulo (FZEA/USP), located in Pirassununga, São Paulo, Brazil (latitude: 21°59′ S, longitude: 47°23′ W). The regional climate is classified as Cwa, a humid subtropical climate with dry winters. During the two experimental cycles (2020/2021 and 2021/2022), the average recorded temperatures from October to February over the past 10 years were 30 °C maximum and 19 °C minimum, with an accumulated rainfall of 772 mm. Figure 1 shows the 10-year temperature and rainfall patterns compared to the climate conditions for the 2020–2021 and 2021–2022 seasons.
The experiment followed a split-plot design arranged in randomized complete blocks. The main plots consisted of five dilutions of treated slaughterhouse effluent (0%, 25%, 50%, 75%, and 100%), while the subplots comprised two Bradyrhizobium spp. inoculation treatments, with inoculation (WI) and without inoculation (NI). Each treatment combination was replicated across four blocks in a randomized way, totaling 40 experimental units. Each experimental subplot comprised a useful area of 21 m2, with border rows to minimize edge effects.
The effluent used was sourced from the Scholar Slaughterhouse of the University of São Paulo, School of Animal Science and Food Engineering, “Fernando Costa” (Pirassununga, SP), and was treated through a system consisting of a solid separation tank, an Upflow Anaerobic Sludge Blanket (UASB) reactor, and a polishing pond. The UASB reactor had a total volume of 13 m3 and a working volume of 8.7 m3, with an application rate varying from 2 to 4 kg of COD/m3 and a detention time ranging from 24 to 48 h. Effluent samples were collected and analyzed biweekly following the methodology proposed by APHA/AWWA/WEF [16].

2.2. Soybean Cultivation

In both cycles, soybean cultivation was preceded by black oat cultivation during winter. In the first cycle, the soybean seeds used were of the Agroeste® AS 3590 (Bayer S.A., Santo Antônio da Platina, Brazil) variety, sown at a density of 30 seeds per linear meter. The inoculated treatment (WI) received inoculation with Bradyrhizobium japonicum from Biosphera (Nitrosphera High Soja TS liquid and Nitrosphera Ultra peat—Agrocete Ind. De Fertilizantes LDTA, Ponta Grossa, Brazil). In both cycles, the inoculant was applied directly to the seeds right before sowing, following the manufacturer’s recommended concentration per kilogram of seed to ensure uniform coverage. Soybeans were sown on 14 October 2020 and harvested 127 days later.
In the second cycle, the soybean seeds used were of the Intacta RR2 PRO® (KWS Sementes LDTA, Patos de Minas, Brazil) variety, sown at a density of 35 seeds per linear meter. Inoculation was performed with Bradyrhizobium elkanii from Biomax® Premium (liquid plus peat—Vittia Fertilizantes e Biológicos S.A., São Joaquim da Barra, Brazil). Soybeans were sown on 29 October 2021 and harvested 133 days later. Both soybean seeds used were varieties widely accepted and used by local rural producers in respective years.
In both cycles, weed control was performed using glyphosate. In the 2020–2021 cycle, glyphosate was applied at a rate of 1 kg ha−1 five days after sowing, while in the 2021–2022 cycle, the application was increased to 2 kg ha−1 in the second week after sowing. No additional herbicide applications were necessary during the cultivation cycles. Brachiaria grass around the plots was managed with a backpack mower.
Phosphorus and potassium fertilization were performed consistently across both cycles, following the recommendations of the Soybean Crop Fertilization Guide [17]. Simple superphosphate and potassium chloride were used as fertilizers. A total of 40 kg ha−1 of P2O5 was applied immediately after sowing, while 80 kg ha−1 of K2O was applied in five split doses throughout the cultivation cycle, both delivered via fertigation.
Micronutrient applications were also performed via fertigation using the Agrucon Green Italia foliar micronutrient blend. This provided, per hectare, 350 g manganese, 1050 g zinc, 23 g iron, 58 g boron, 992 g sulfur, 175 g magnesium, and 1867 g nitrogen. Micronutrients were applied twice in the 2020–2021 cycle (at 23 and 37 DAS) and once in the 2021–2022 cycle (at 42 DAS).
The soybean growth stages referenced in this study were defined according to the widely recognized and accepted scale developed by Embrapa (Brazilian Agricultural Research Corporation, Brasília, Brazil), which operates under the Ministry of Agriculture, Livestock, and Food Supply [18].

2.3. Irrigation Management

Irrigation was managed based on the soil water retention curve, established from soil samples collected at depths of 0–20 cm and 20–40 cm and determined using a Richards chamber, with adjustments made according to the Van Genuchten model (1980). Soil moisture was monitored every 48 h by frequency domain reflectometry (FDR) using the Sentek Diviner 2000 probe, with readings taken in the experimental plots of three of the four blocks. The average moisture content was used to calculate the irrigation depth needed to bring soil moisture to field capacity. The irrigation system consisted of separate tanks for water and effluent, connected to centrifugal pumps for precise control of effluent dilutions (0, 25, 50, 75, and 100%) through solenoid valves programmed for each treatment. Application was carried out via adjustable sector sprinklers set to operate at 90°, with two sprinklers per plot installed at opposite ends to ensure uniform distribution.

2.4. Biometric Analyses

The biometric parameters evaluated included plant height, plant stand, fresh and dry shoot biomass, fresh root biomass, and leaf area. Plant height was measured at three points (V7 seventh node, R1 beginning bloom, and R5 beginning seed) throughout the cycle, while the other variables were analyzed at stages R5 beginning seed (2020–2021) and R2 full bloom (2021–2022). Destructive sampling was conducted in three areas of 0.0625 m2 per subplot to minimize impact on plant stand. Plants were washed, separated into shoots and roots, and weighed to obtain fresh biomass. Leaf area was measured with an area integrator (LI-3100, LI-COR®, Inc., Lincoln, NE, USA) and extrapolated per square meter. Leaves were then dried at 65 °C to obtain dry mass. Roots were photographed and analyzed using Safira© software, version 1.1, to calculate volume and surface area per square meter.

2.4.1. Foliar Diagnosis

Foliar diagnosis sampling took place about 50 days after sowing (DAS) at the R2 full bloom stage. Fifteen newly mature leaves with petioles were collected per subplot. After drying in a forced-air oven at 65 °C to a constant weight, samples were ground and sent to the Laboratory of Agricultural Sciences (FZEA/USP) for macronutrient and sodium analysis.

2.4.2. Instrumentation: Chlorophyll Index and Normalized Difference Vegetation Index

Chlorophyll content was determined indirectly using a chlorophyll meter (Clorofilog®, Falker, Porto Alegre, Brazil) to measure relative chlorophyll index (RCI) for chlorophyll a, b, and total. Readings were taken from 15 plants per subplot, always on the first fully expanded leaf of each plant, at phenological stages V3 third node, R1 beginning bloom, R2 full bloom, and R4 full pod in both cycles. Normalized Difference Vegetation Index (NDVI) was collected using the GreenSeeker® (Trimble Agriculture, Sunnyvale, CA, USA) device. NDVI measurements were taken along the five central rows of the subplot, positioning the device about 1 m above the canopy at stages V7 seventh node, R1 beginning bloom, R2 full bloom, and R4 full pod in the 2020–2021 cycle and at R2 full bloom, R4 full pod, and R5 beginning seed in the 2021–2022 cycle. Differences in collection dates were due to technical issues and challenges during rainy periods.

2.4.3. Yield and Bromatological Analysis of Grains

Sample collection to determine yield was conducted manually when the soybeans reached physiological maturity (R8 full maturity stage), occurring at 127 DAS (days after sowing) in the 2020–2021 cycle and at 133 DAS in the 2021–2022 cycle in a 3 m2 area at the center of the subplot. The plants were bagged whole and processed in a plot thresher (TP SB01, SB Máquinas Agrícolas, Cambé, Brazil). The grains were dried in an oven at 45 °C, with moisture adjusted to 13% using a moisture meter (G600, Gehaka Agri, Sao Paulo, Brazil) before weighing to calculate yield per subplot. Due to the low physiological quality of the grains in the 2020–2021 cycle, only samples from the 2021–2022 cycle were analyzed at the Nutrition Laboratory (FZEA/USP) to determine bromatological parameters: dry matter, mineral matter, crude protein, crude fiber, ether extract, nitrogen-free extract, acid detergent fiber, and ash-free neutral detergent fiber.

2.5. Statistical Analysis

The variance analyses were conducted using the Sisvar statistical software, version 5.8, [19] following a split-plot block design and considering the repetition across two growing seasons and, where applicable, in time (phenological stages). For factors with significant differences (p < 0.05), the comparisons for the effluent factor were performed using Tukey’s test and regression analysis, while comparisons for inoculation and cycle factors were carried out using the t-test. Comparisons over time or depth, with statistical significance, were also conducted using Tukey’s test and regression analysis.

2.6. Generative AI Assistance

During the preparation of this manuscript, a generative artificial intelligence tool, ChatGPT, GPT-4-turbo (from OpenAI), was utilized to assist with the refinement of academic language, the structuring of the manuscript, and ensuring adherence to the submission guidelines of the journal. The tool provided suggestions for text revisions, scientific phrasing, and formatting in line with high-impact publication standards in agronomy. The authors reviewed and edited all AI-generated content to ensure its accuracy and relevance to this study.

3. Results

3.1. Irrigation Management and Nitrogen Incoming

Soil moisture varied similarly between the experimental plots in both cropping cycles, with greater uniformity from the onset of the reproductive phase when soybean water demand reached its peak. In cycle 1, both rainfall and effluent were more evenly distributed throughout the cycle, with higher effluent volumes applied at the beginning to meet initial water demand. In cycle 2, most of the effluent was applied up to 48 DAS (days after sowing) before the increase in rainfall, which had more intense and heterogeneous volumes. Effluent characterization showed a higher nutrient concentration in cycle 2, including nitrogen, phosphorus, and calcium, possibly due to variations in the abattoir processing and climatic conditions (Table 1).
The average nitrogen concentration in the effluent was similar to values reported in the literature, and electrical conductivity remained below the limit of 3.30 dS m−1, posing no risk to soybean productivity. Due to the higher nitrogen concentration in cycle 2, nutrient input was higher, although the irrigated volume was similar in both cycles (Table 2). The total applied volume exceeded the crop’s maximum demand (800 mm), especially in cycle 2, where rainfall exceeded the crop’s requirement by 240 mm.

3.2. Biometric Analyses

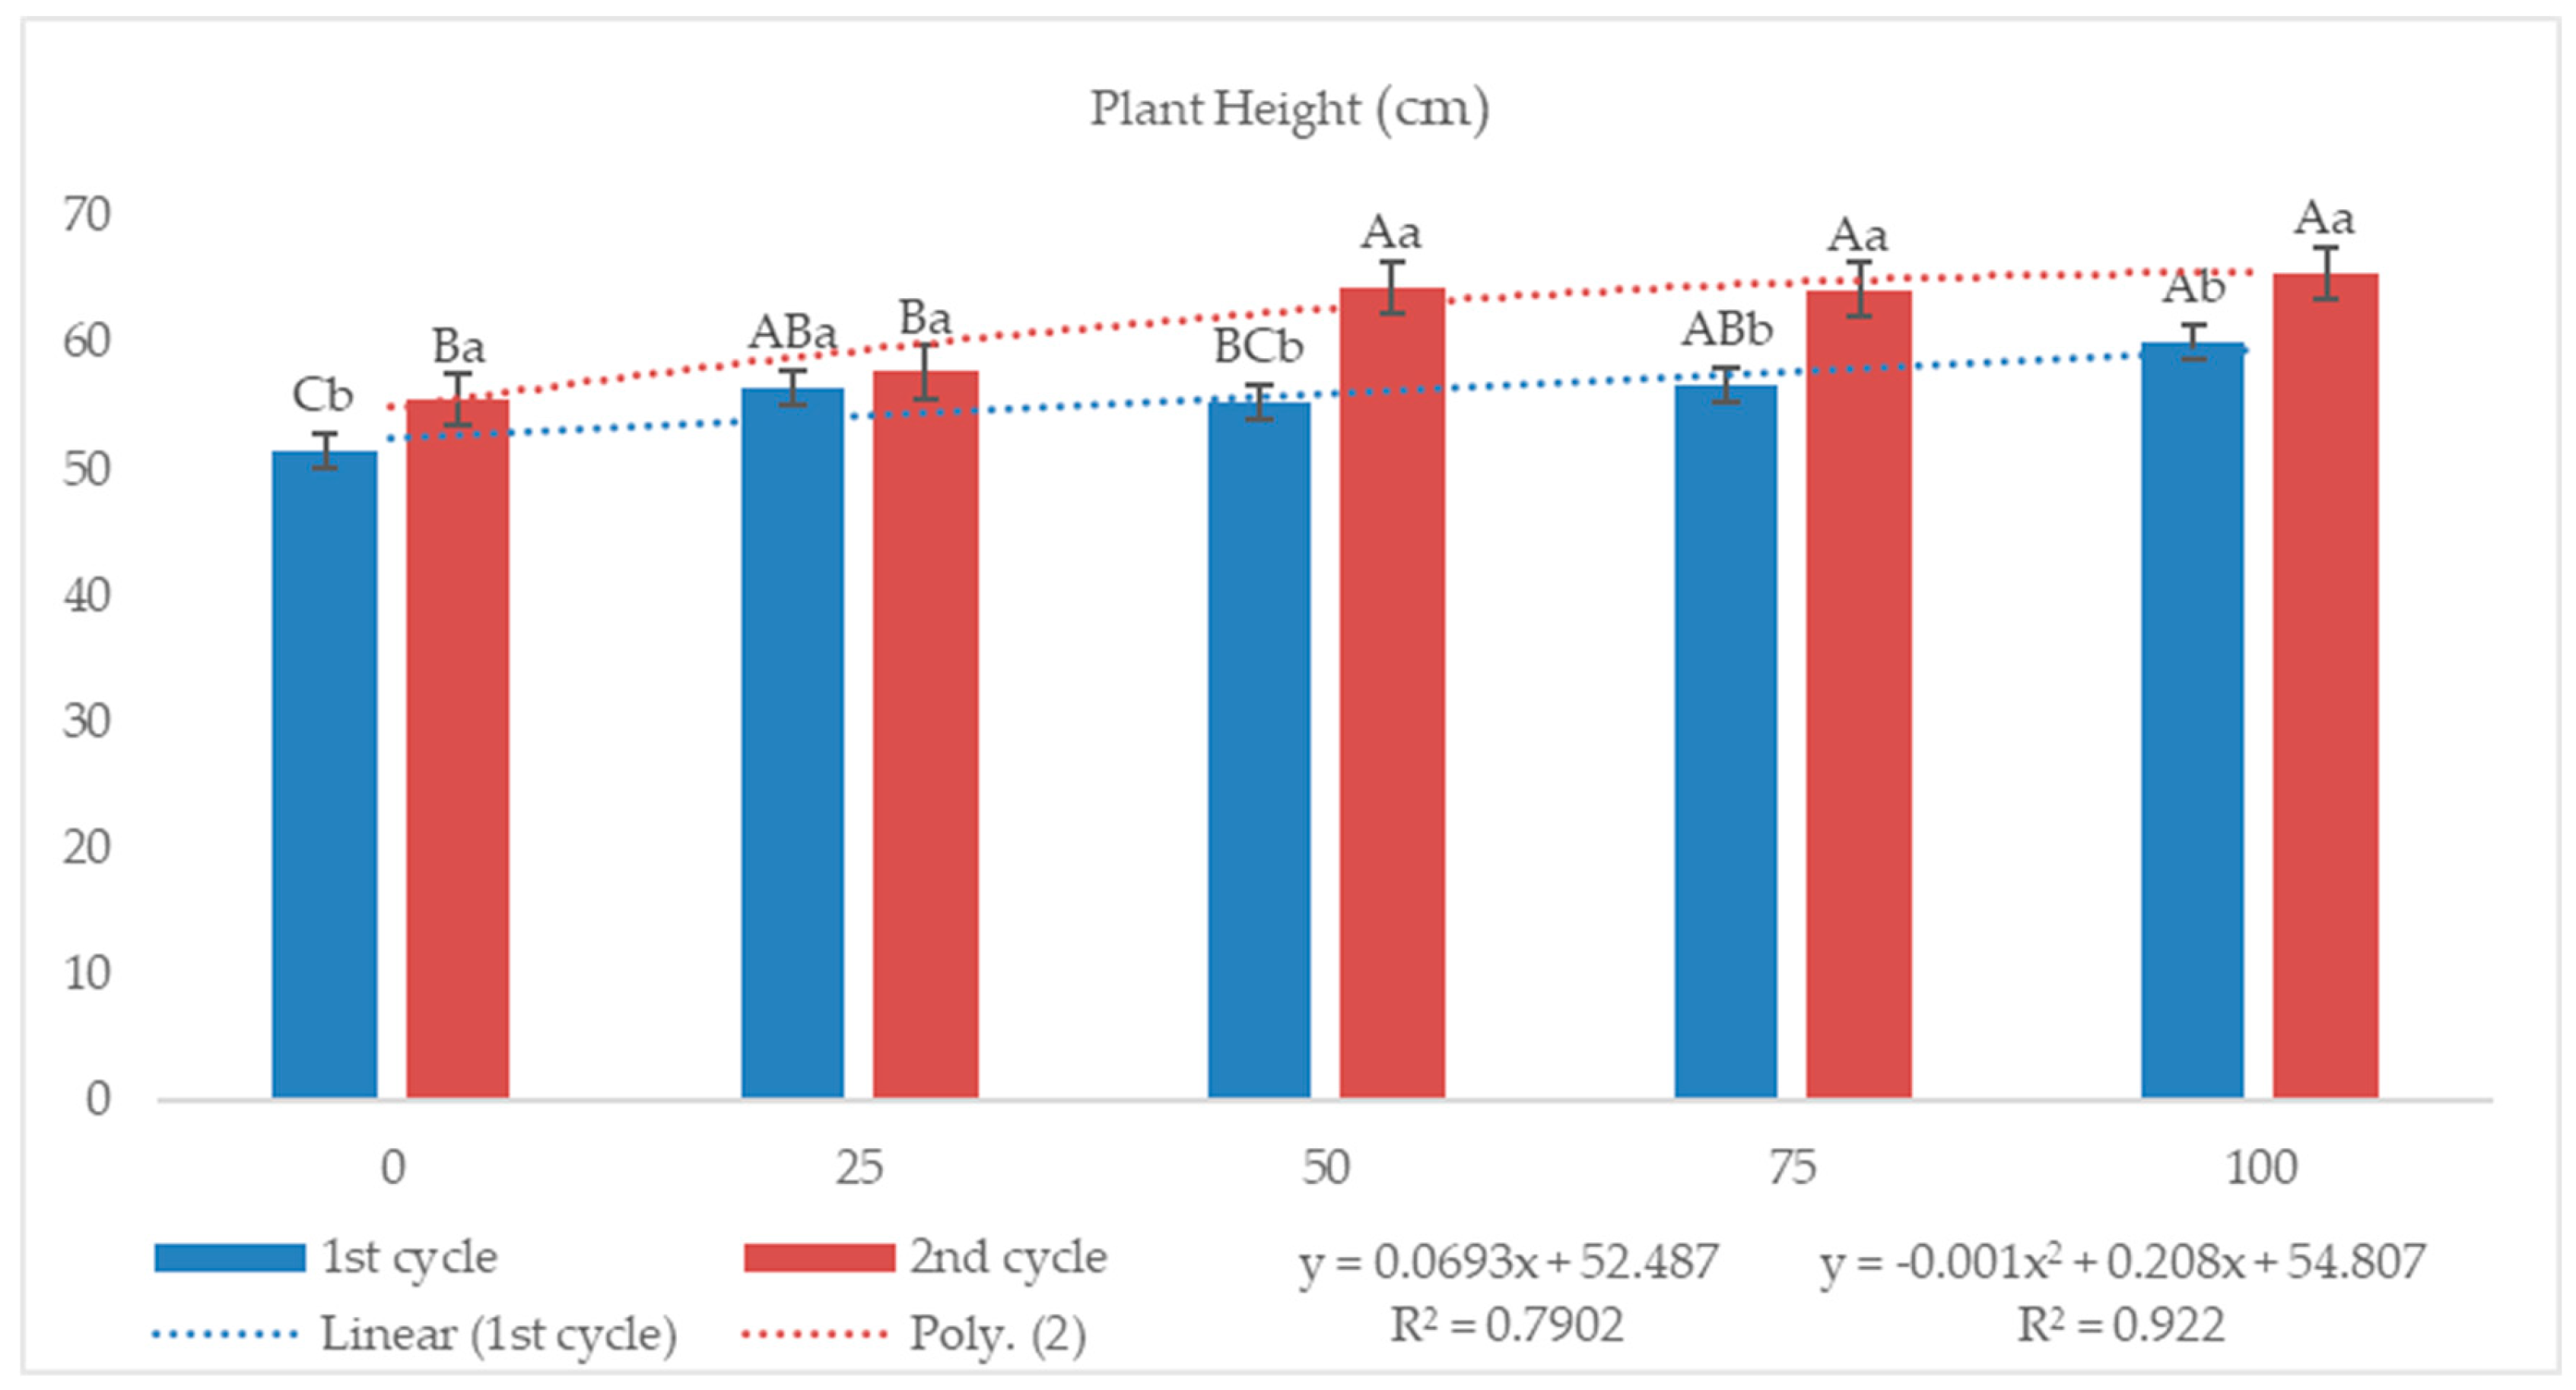
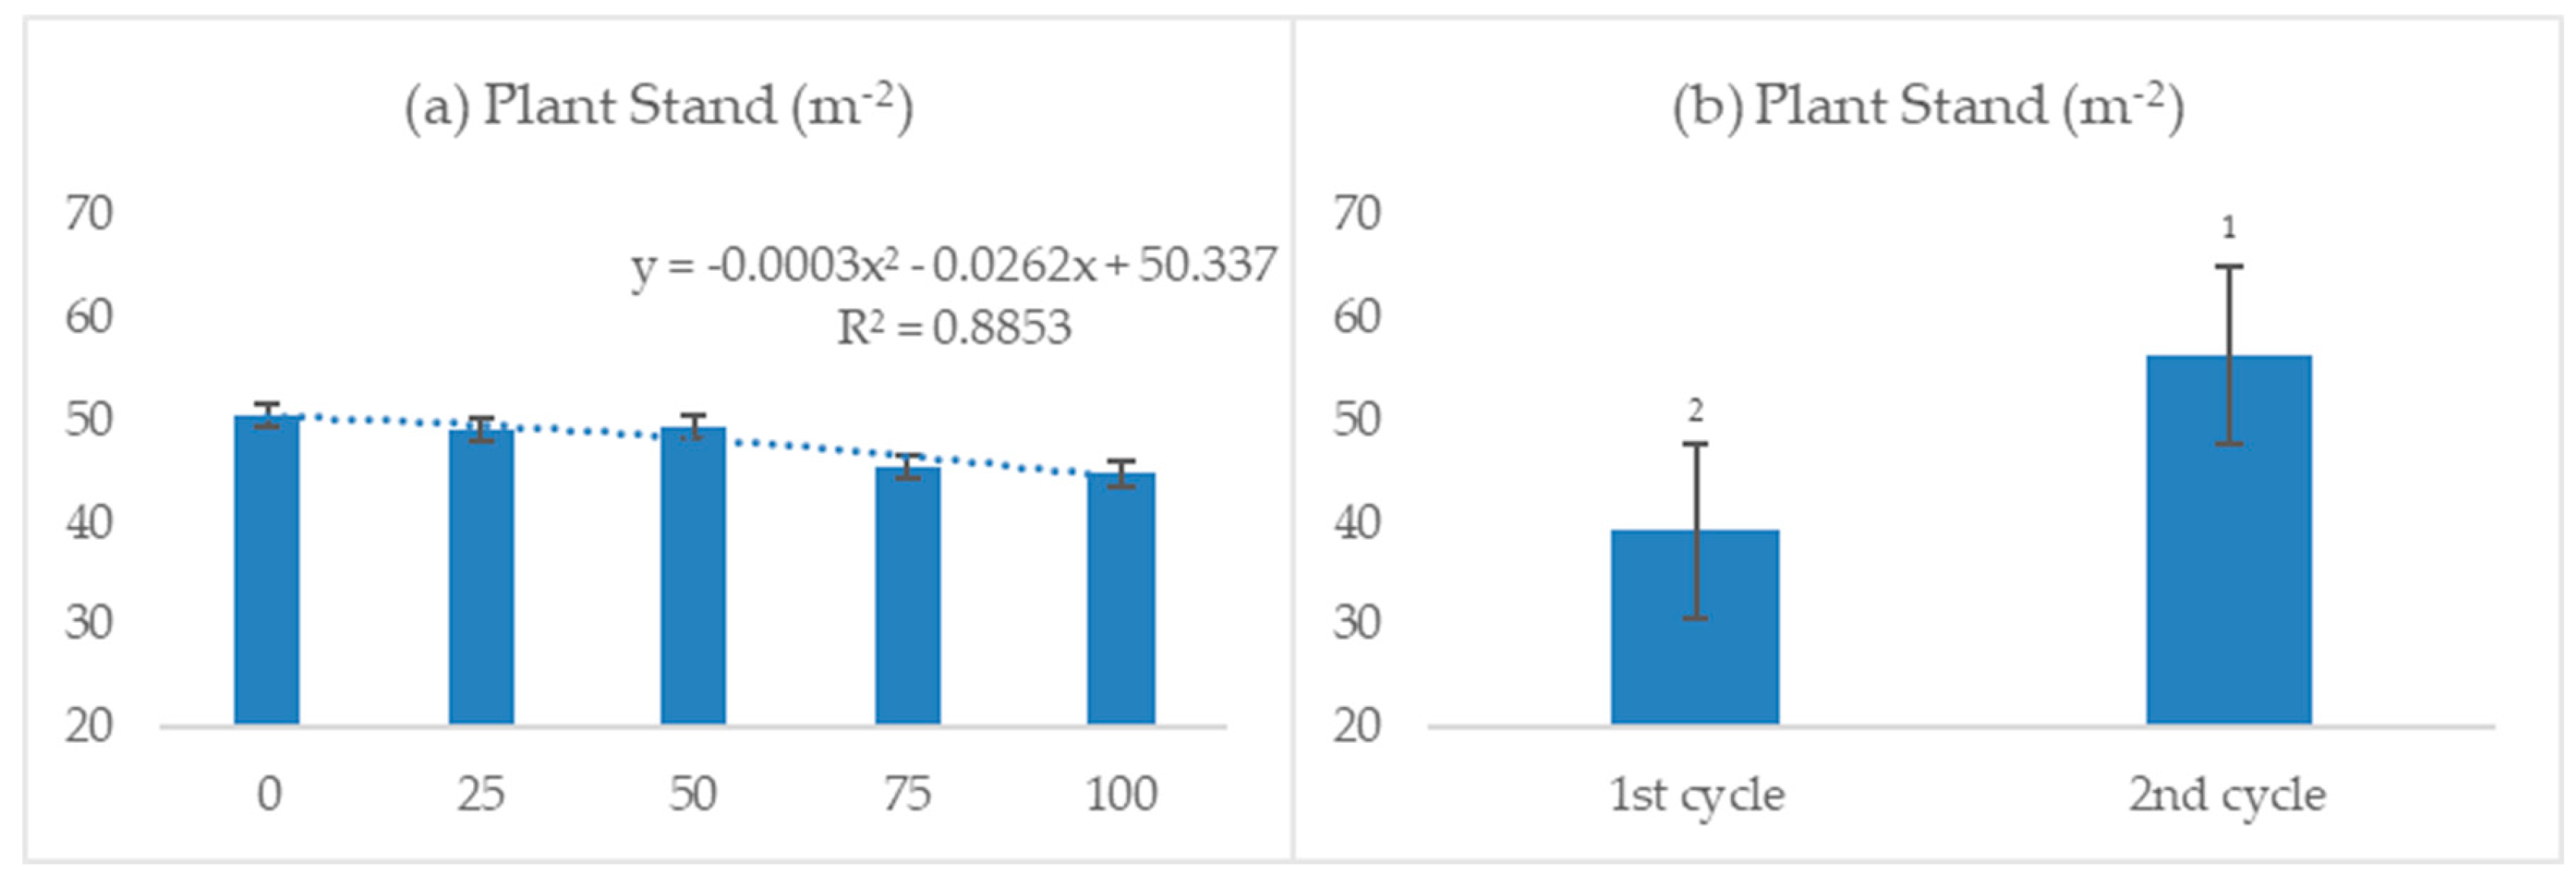
3.2.1. Plant Height and Stand

The average plant height varied according to the interaction between the growing cycle and the effluent concentrations (Figure 2). In the first cycle, the plants showed a linear response to the increase in effluent doses, suggesting that the nutrient input, especially nitrogen, was crucial for initial growth. In the second cycle, the highest plant heights were observed in plots with 50%, 75%, and 100% effluent, indicating that intermediate and high effluent doses promote an optimal height for soybean development. The difference between cycles can be attributed to better water and nutrient availability in the second cycle, as well as a higher nitrogen concentration in the applied effluent or even to higher plant stand, which was bigger for the second cycle (Figure 3b) and also presented difference for the effluent factor, fitting a second-degree polynomial equation (Figure 3a).

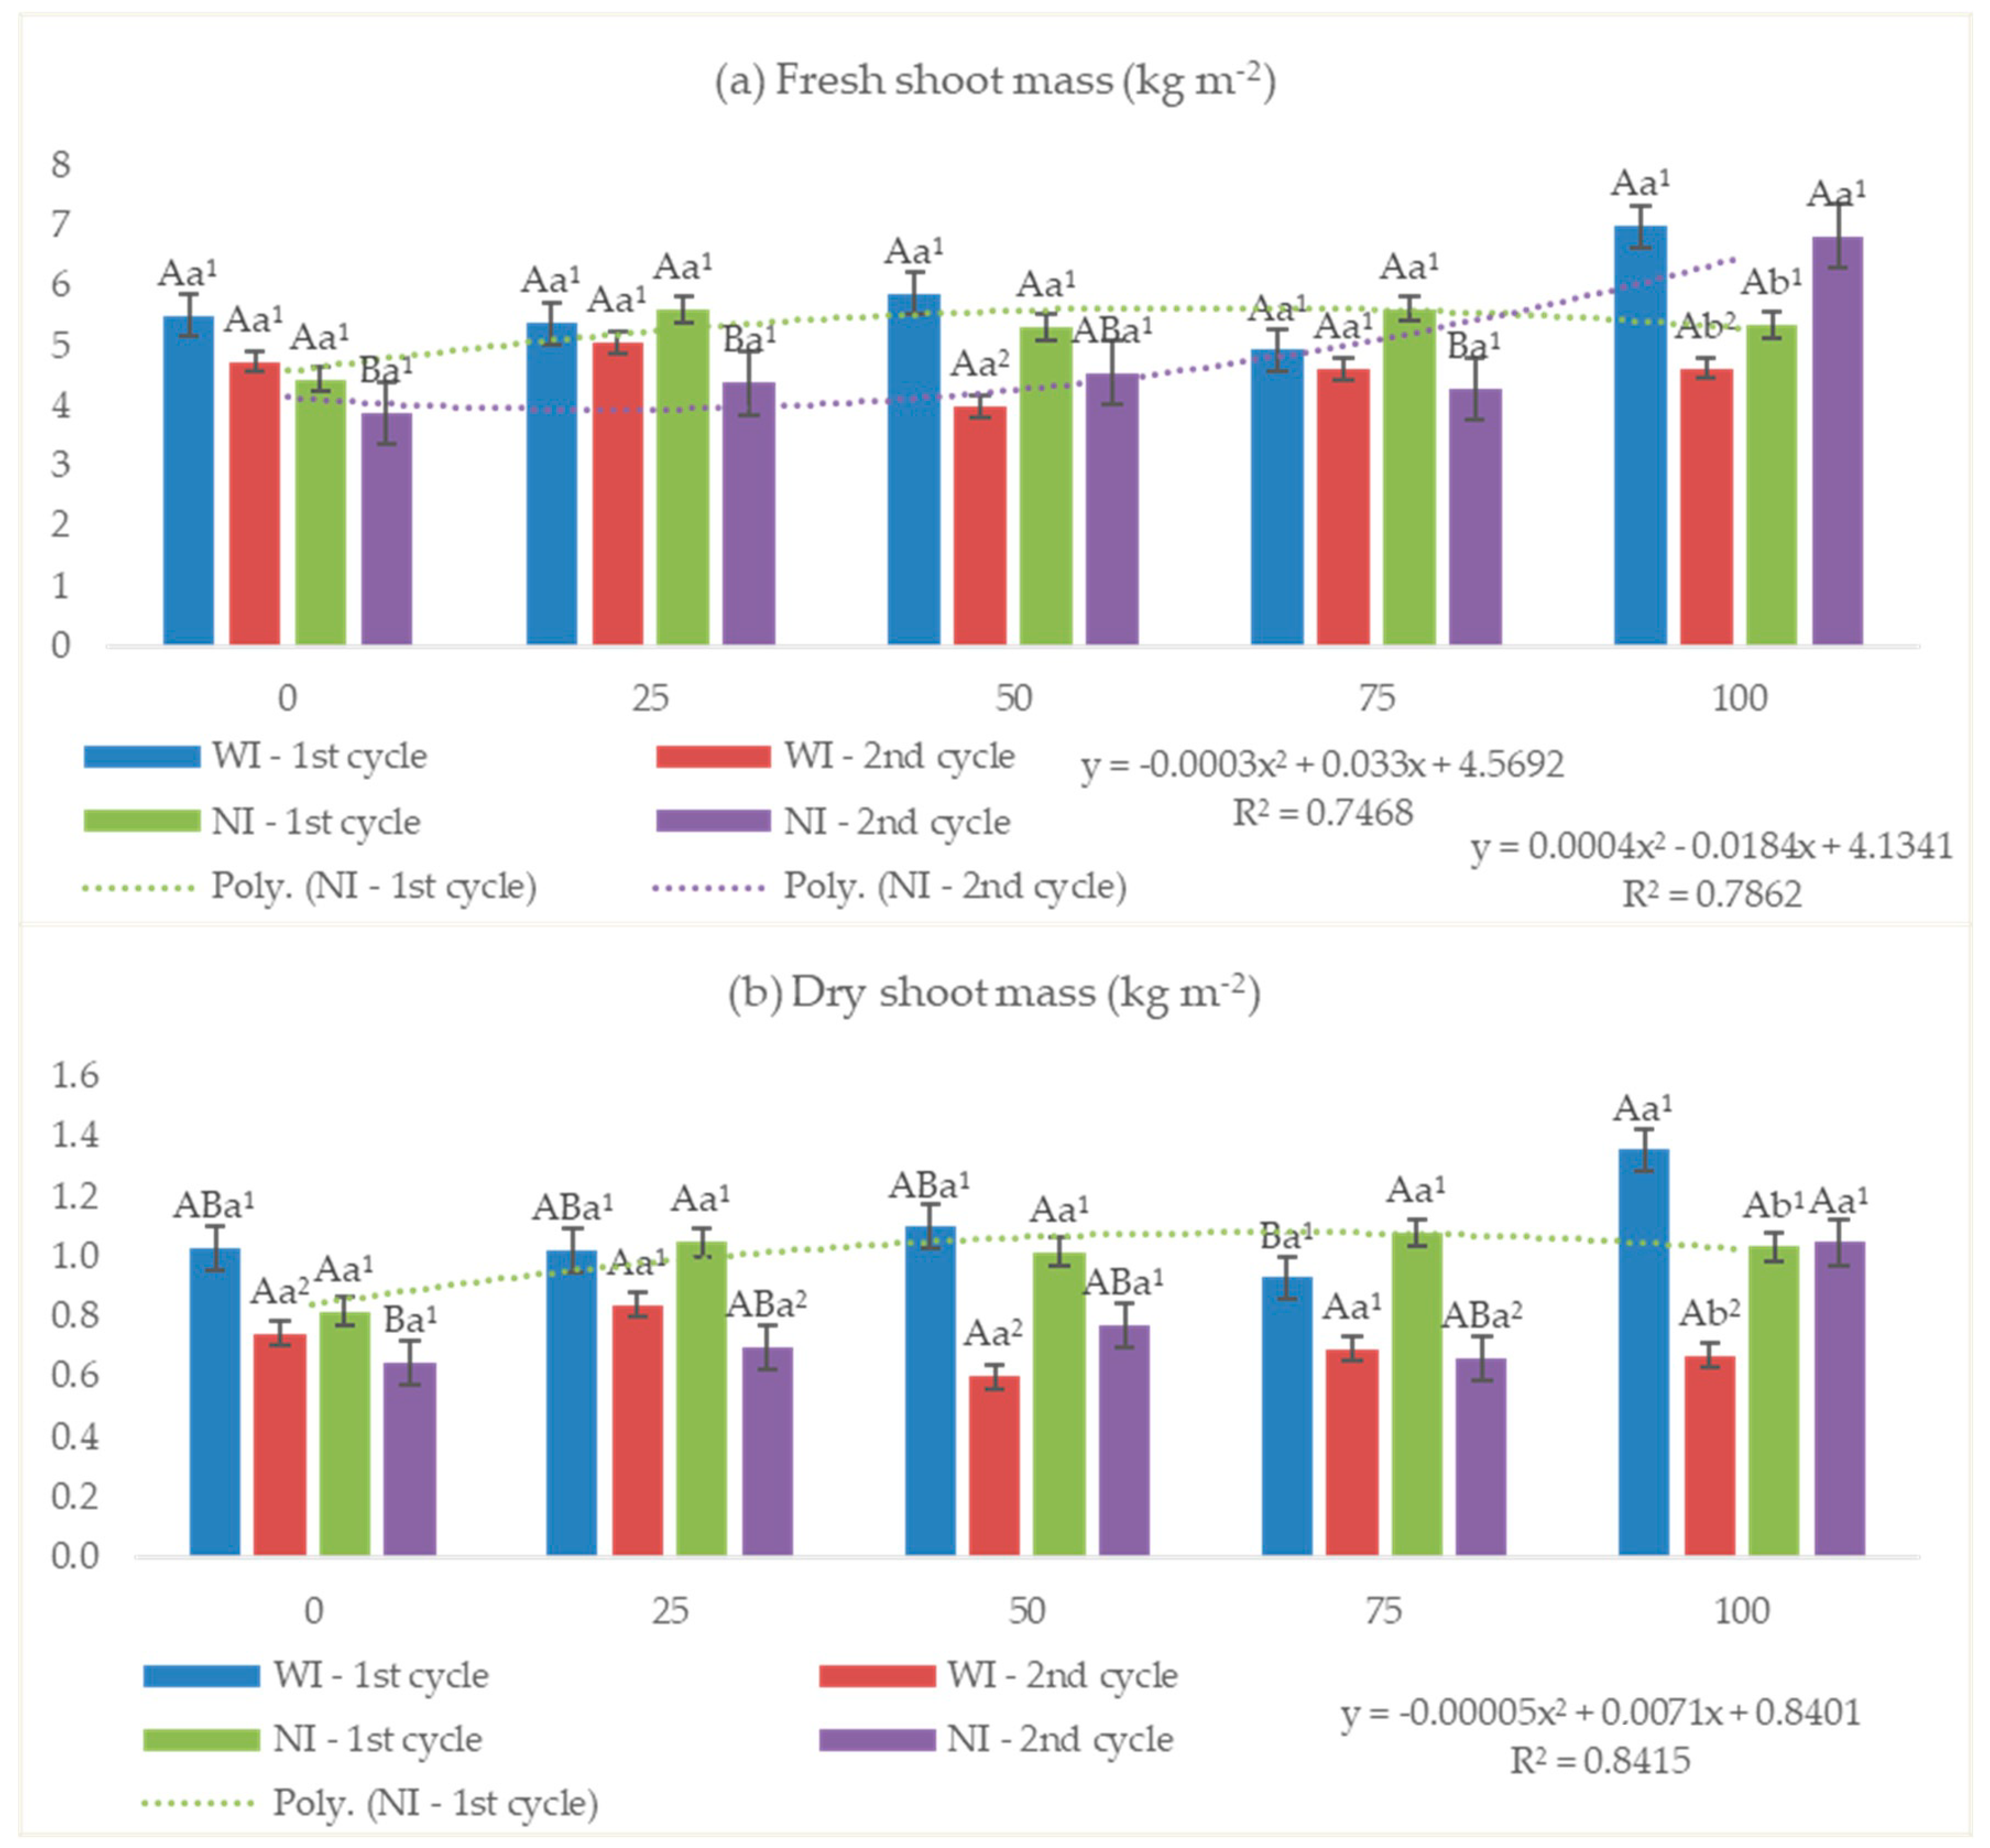
3.2.2. Fresh and Dry Shoot Mass

The results for fresh shoot biomass showed a significant interaction among effluent concentration, inoculation, and cultivation cycle (Figure 4a). A significant effect of inoculation was observed only at the 100% effluent dose. In cycle 1, the rhizobium-inoculated subplots had greater fresh biomass, whereas in cycle 2, the non-inoculated subplots performed better. No differences were observed in either cycle for the effluent levels in inoculated subplots. During cycle 1, the non-inoculated subplots did not show differences across effluent doses but fit a second-degree polynomial equation, indicating that the highest fresh biomass accumulation would occur at 64% effluent in the absence of inoculation. In cycle 2, the 50% and 100% effluent doses yielded the best results. At these same concentrations and with inoculation, plants accumulated more fresh biomass in cycle 1 than in cycle 2, suggesting that the impact of effluent on fresh biomass in inoculated soybeans depends on environmental conditions during cultivation.
Dry shoot biomass results mirrored the fresh biomass findings, as expected (Figure 4b). However, in the 25% and 75% effluent treatments, the absence of inoculant resulted in lower dry biomass accumulation in cycle 2 compared to cycle 1. This may indicate that, without inoculation, these effluent doses were less effective in optimizing conversion to structural biomass. Effluent doses did not show differences in dry biomass accumulation in non-inoculated subplots in cycle 1 or in inoculated subplots in cycle 2.

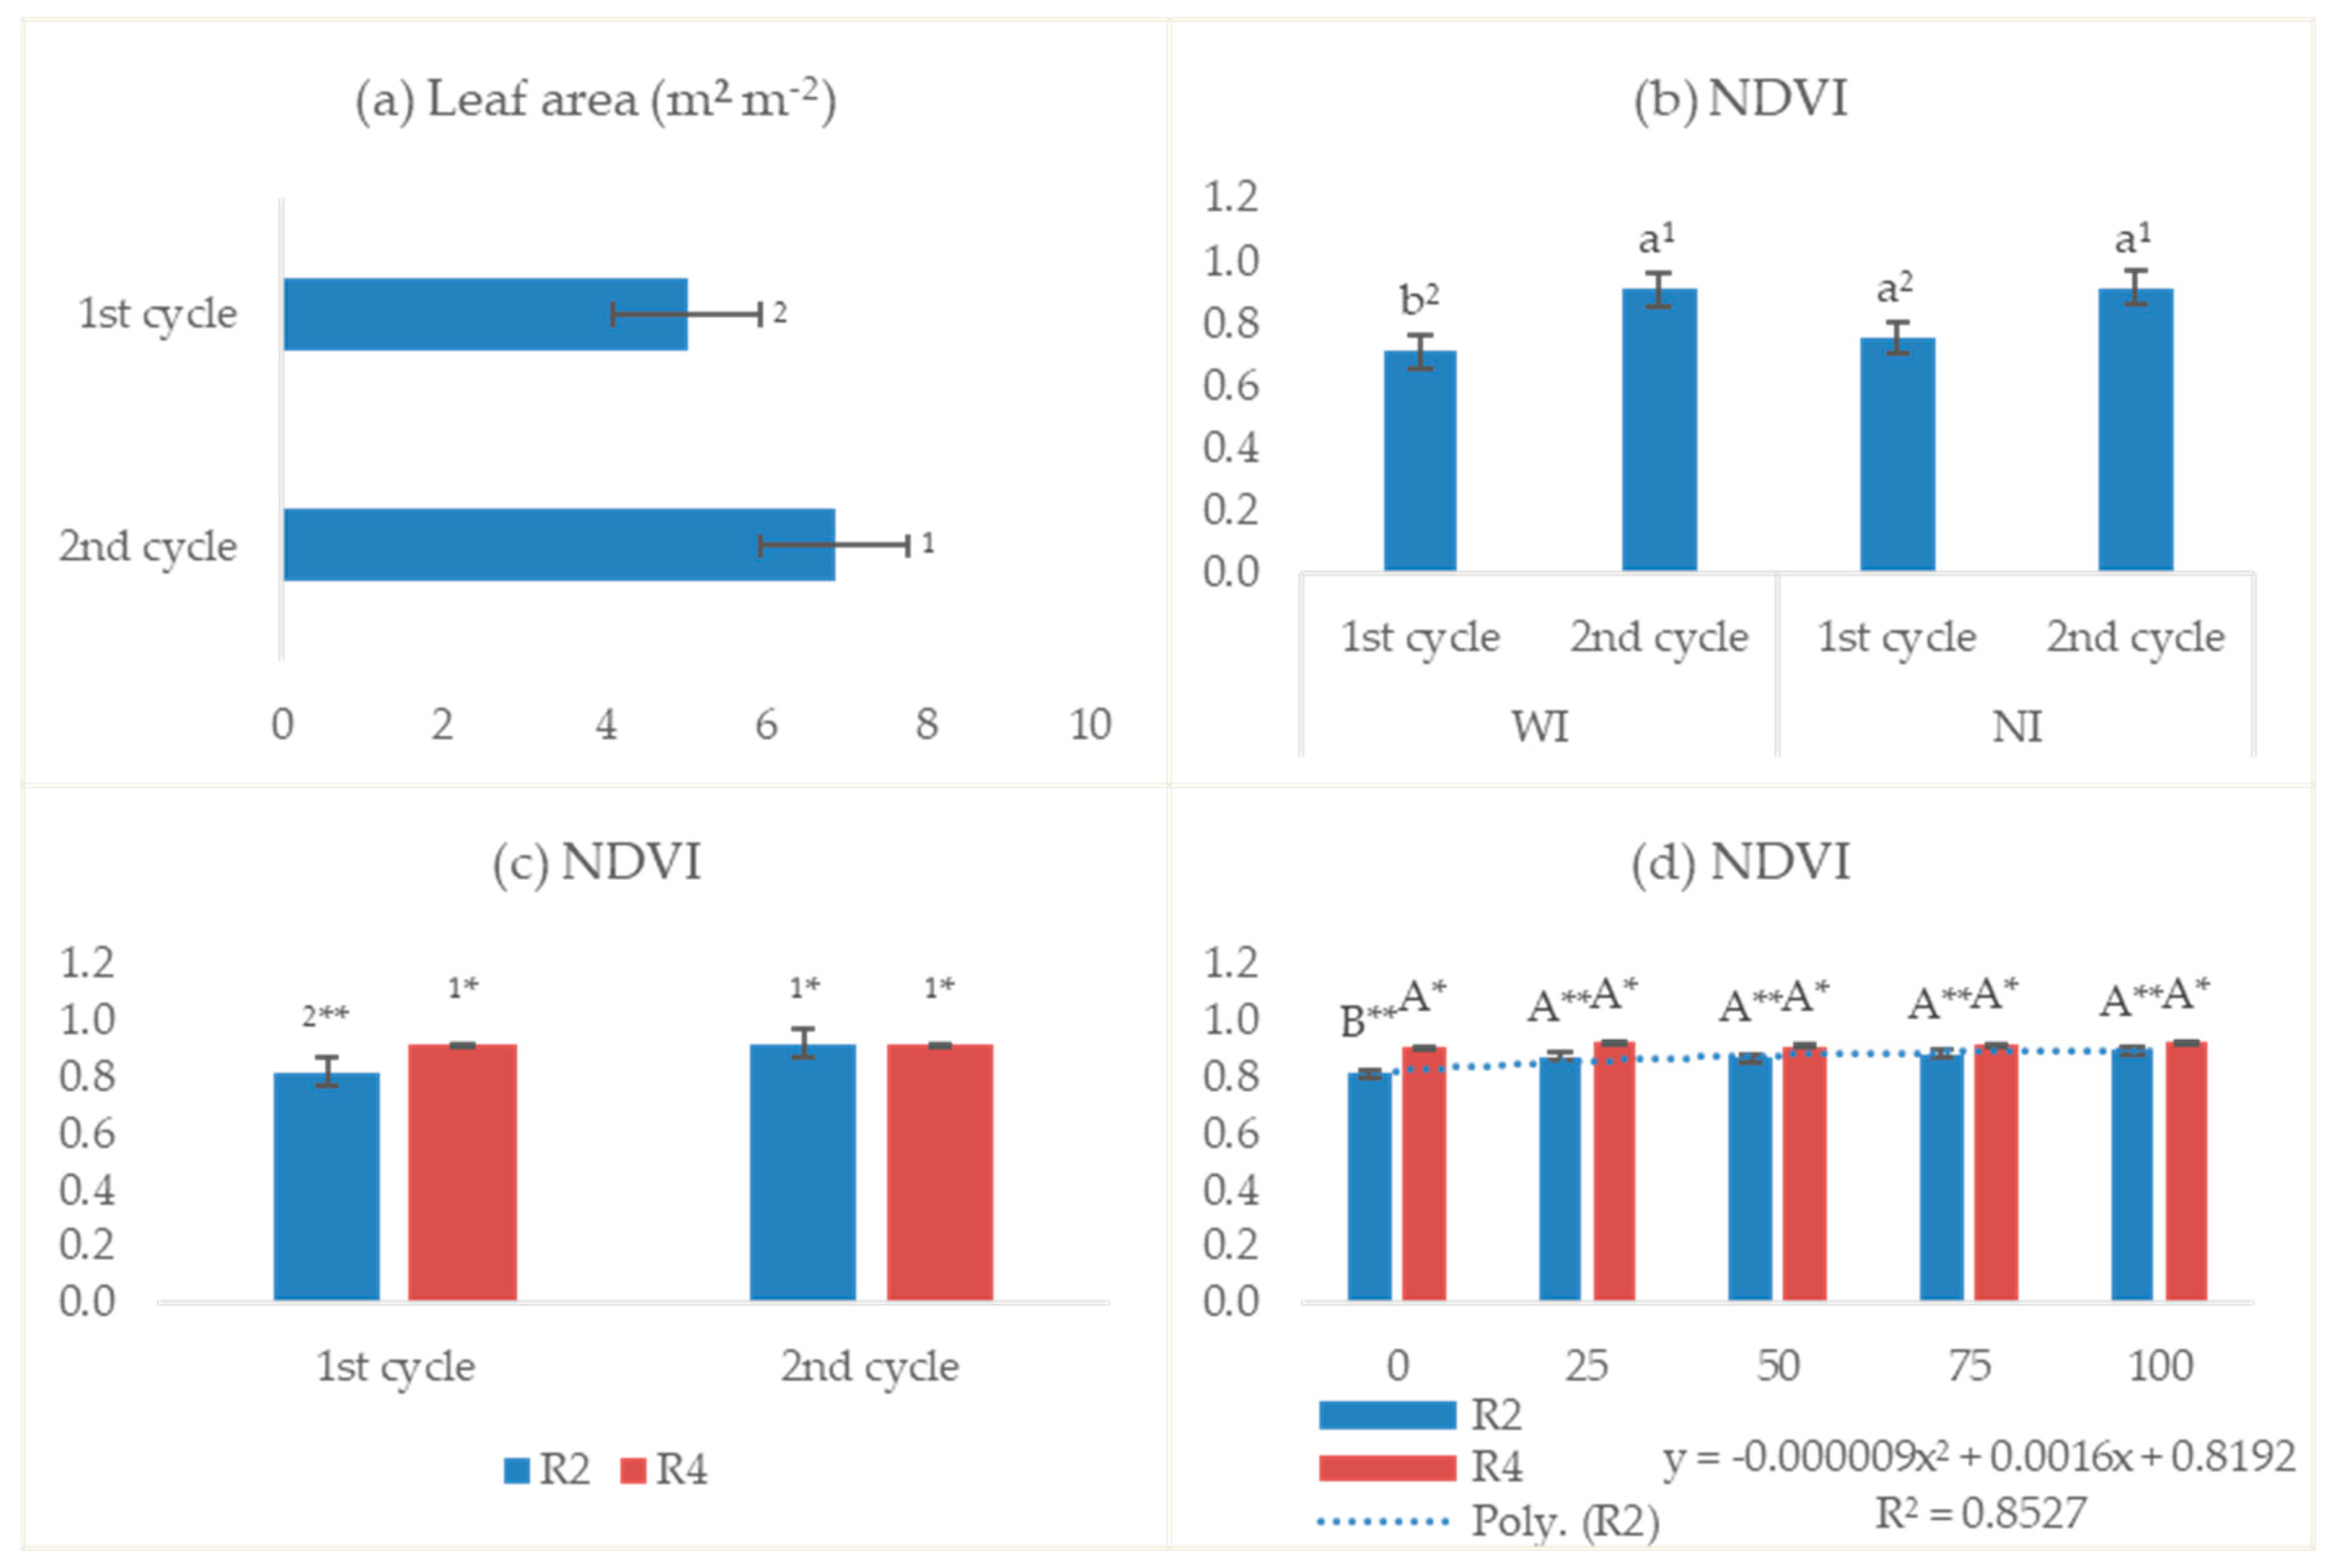
3.2.3. Leaf Area and Normalized Difference Vegetation Index

Leaf area measurements using the integrator showed differences only between cultivation cycles, with higher values observed in cycle 2 (Figure 5a). Considering that sampling for this analysis was conducted at stage R5 in cycle 1 and at stage R2 in cycle 2, the increased leaf area observed in the second cycle indicates favorable plant development during that year (2021–2022). Normalized Difference Vegetation Index (NDVI) values obtained showed statistical differences in response to interactions between cycle and inoculation (Figure 5b), cycle and phenological stage (Figure 5c), and effluent and phenological stage (Figure 5d). In the latter case, the data fit a second-degree polynomial equation, allowing us to estimate that the effluent dose maximizing NDVI at stage R2 is 86%.

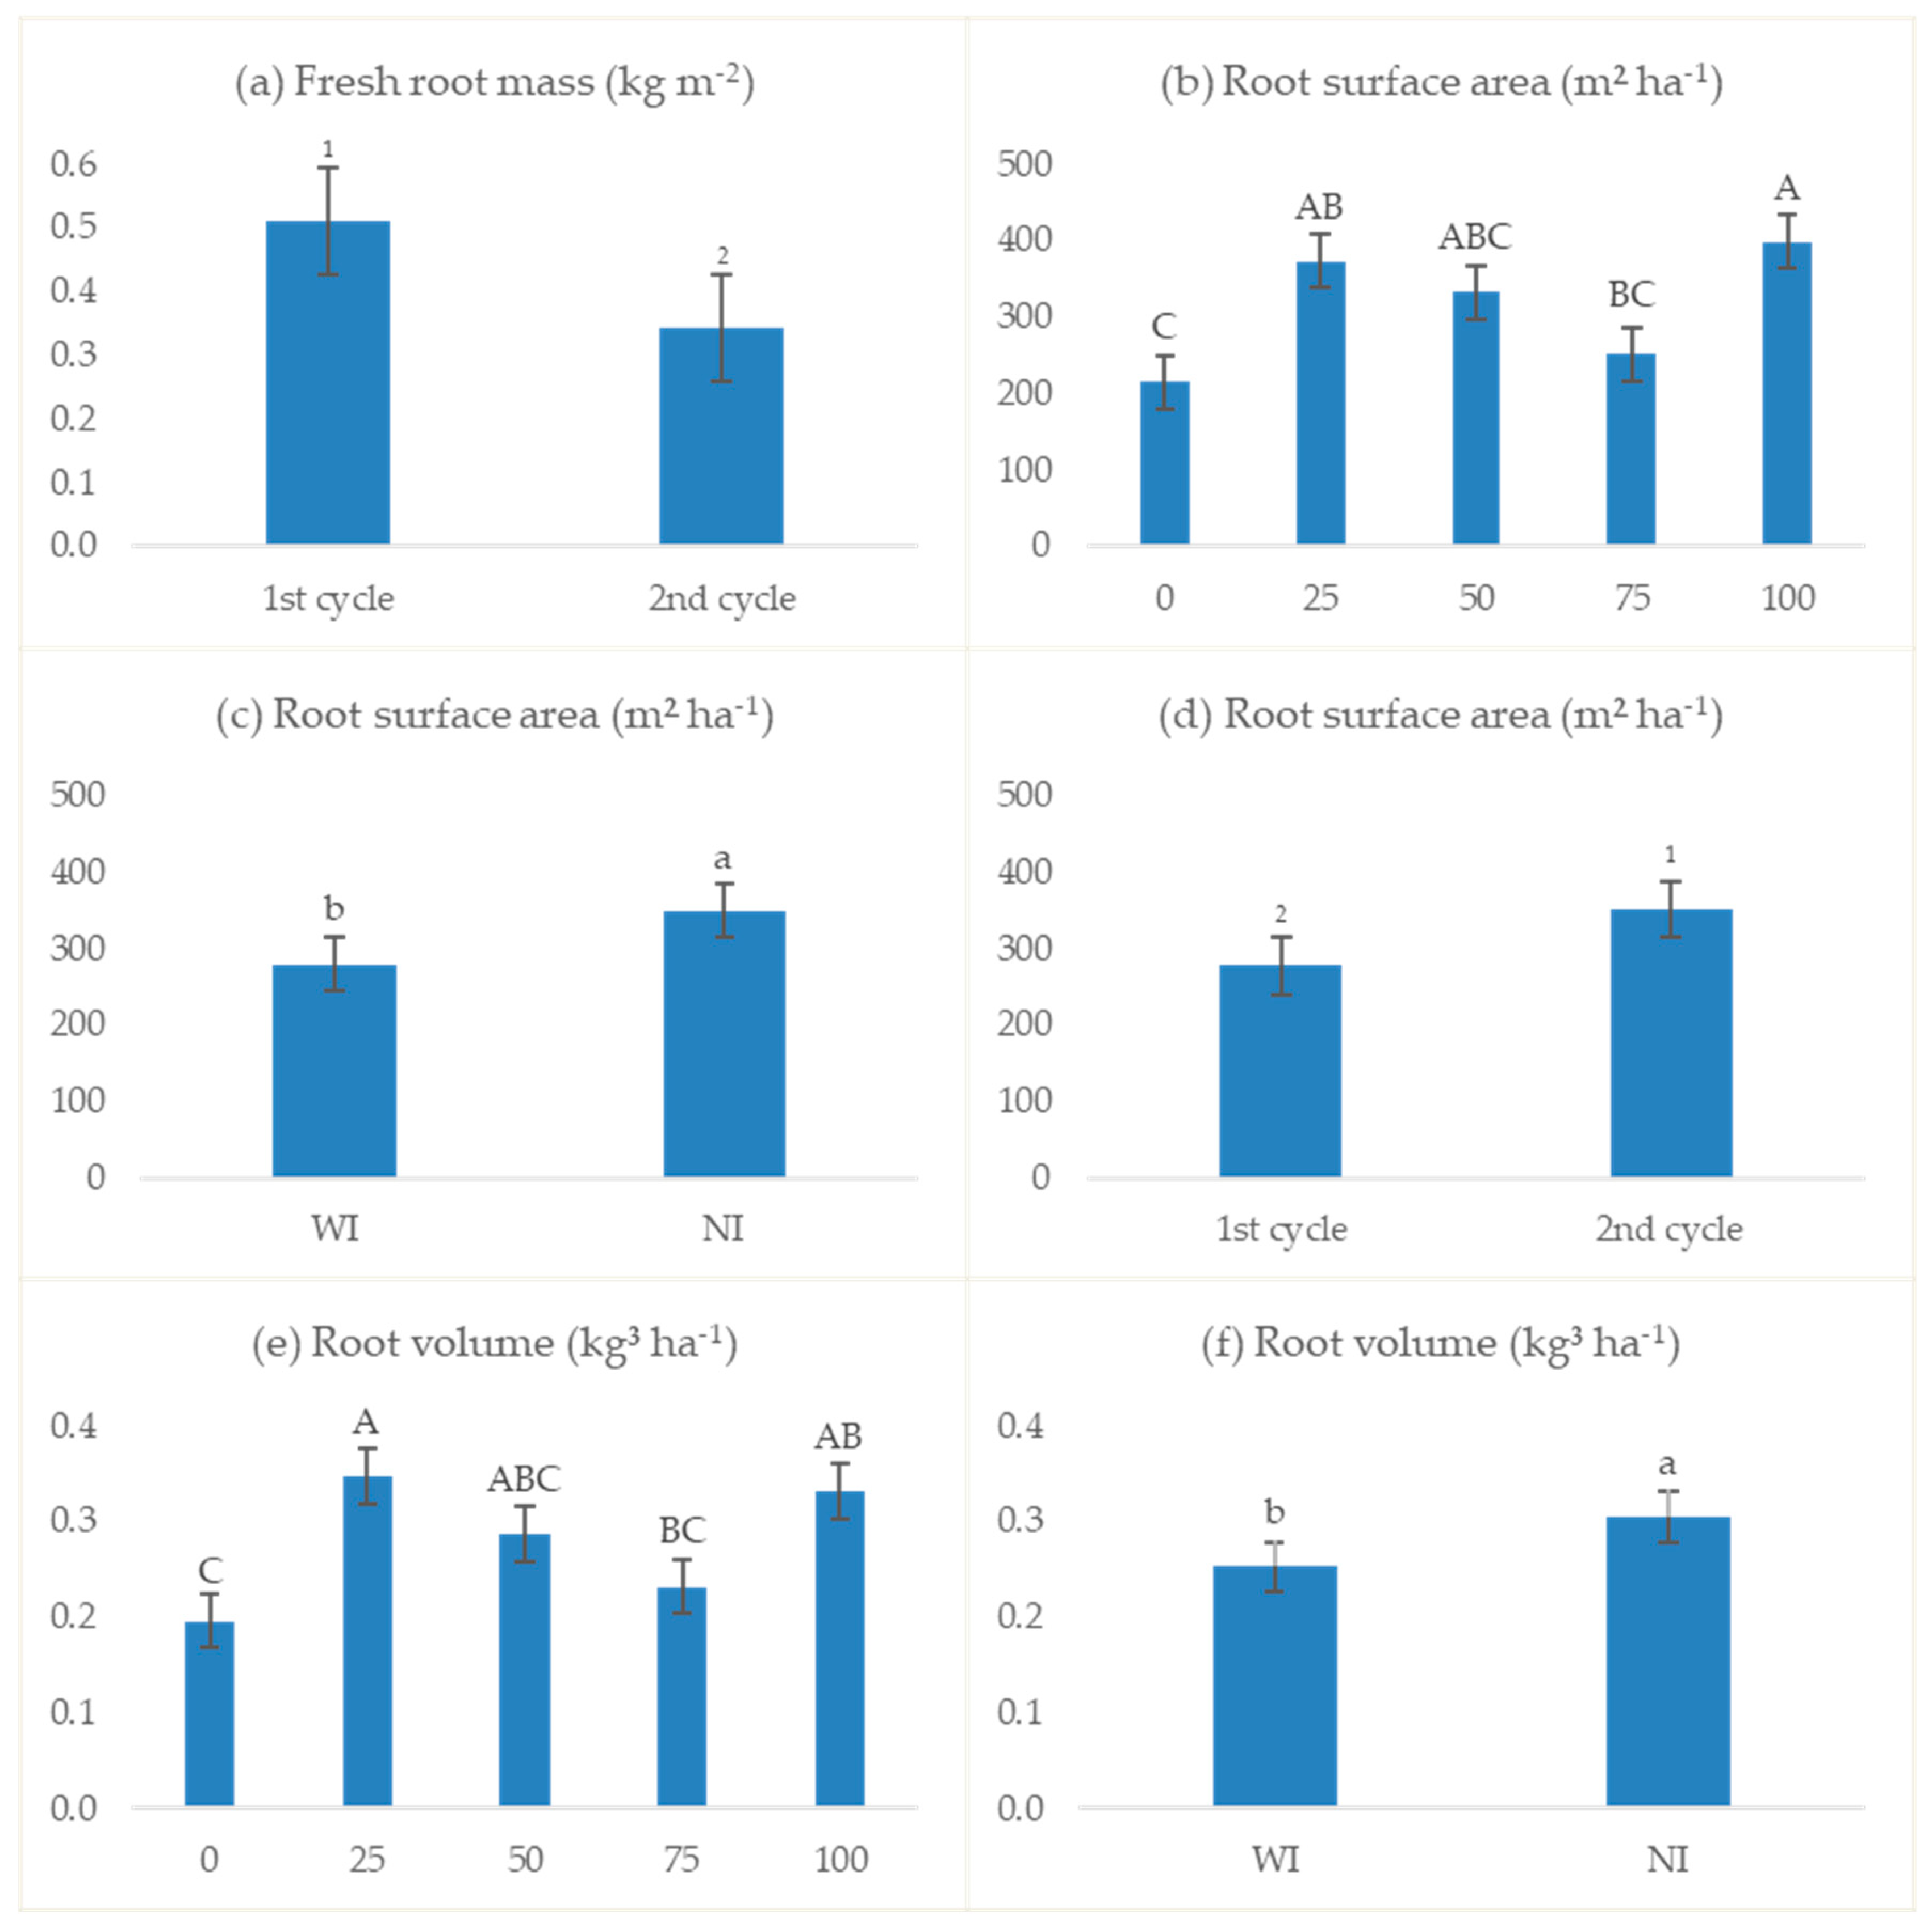
3.2.4. Root Parameters

The difference between cultivation cycles was significant for both root fresh biomass and root surface area (Figure 6a,d). However, the greater root biomass observed in cycle 1 did not correspond to an increase in root surface area or volume (Figure 6d,f). This result suggests a higher accumulation of structural biomass in cycle 1, whereas in cycle 2, the root architecture likely shifted toward a denser, more branched structure. Root surface area was highest with the 100% effluent dose, comparable with 25% and 50% dosages, while the 0% effluent treatment showed a lower response (Figure 6b). Root volume varied significantly with both effluent and inoculation treatments (Figure 6e,f); the optimal effluent doses for volume were 25% and 100%, and the absence of inoculation further increased both root volume and surface area (Figure 6c).

3.2.5. Foliar Diagnosis

The statistical analysis results for foliar concentrations of nitrogen, potassium, phosphorus, sodium, calcium, magnesium, and sulfur are presented in Table 3. All analyzed nutrients showed significant differences for the effluent factor, either alone or within interactions. The mean values obtained from the statistical analysis are shown in the table alongside reference values for legumes [25], except for sodium. The averages for magnesium and calcium fell within the recommended range, while phosphorus and potassium were slightly below, and nitrogen and sulfur varied according to the treatments.
No interaction was observed between the higher nitrogen and phosphorus concentrations in the effluent during cycle 2 and foliar levels of these nutrients in the same cycle, as their leaf concentrations were lower in cycle 2. This suggests that the cycle-related differences are associated with other factors, such as nitrogen translocation within the plant and phosphorus’s low soil mobility. In contrast, calcium, magnesium, and sulfur levels were higher in cycle 2, likely due to the increased application of these nutrients via effluent. Sodium concentrations showed significant differences between cycles under 75% and 100% effluent irrigation, with higher levels in cycle 1. Sodium content also differed for the inoculation factor at the 50% concentration, with significantly higher means in non-inoculated treatments.
Foliar nitrogen concentrations were higher in cycle 1 and at the 75% and 100% effluent doses. Despite the higher nitrogen application rate in cycle 2, increased precipitation in the second cycle and nitrogen’s high soil mobility led to lower leaf concentrations in the second year of cultivation. Nitrogen averages in cycle 1 were within reference values, except for the 100% dose, which was slightly above (54.19 g kg−1). In cycle 2, only the 100% dose fell within the recommended range, while the other doses ranged from 38.01 to 39.95 g kg−1. Despite significant differences, foliar nitrogen levels in the effluent-cycle interaction were close to recommended values.
Foliar potassium content responded significantly to the effluent doses applied. The highest potassium average was observed in the 0% dose, while the lowest was observed at the 75% dose. This response may be linked to the competitive relationship between potassium and sodium, with effluent application and subsequent sodium accumulation possibly influencing K uptake. The potassium means ranged from 14.29 to 16.15 g kg−1. Phosphorus content averaged between 1.94 and 2.25 g kg−1 and increased with effluent dose in the absence of inoculation.
Foliar calcium levels were higher in the second cycle and varied according to the effluent concentration, with averages between 8.95 and 19.81 g kg−1, remaining within recommended values. Magnesium levels also fell within the recommended range, ranging from 5.61 to 8.55 g kg−1, with the highest means at intermediate effluent doses in the second cycle. Sulfur levels in the first cycle were all below the recommended range (average of 1.26 g kg−1), while in cycle 2, some treatments met the recommended range, and others exceeded it. In cycle 2, the sulfur content in inoculated plants decreased with increasing effluent doses, while in non-inoculated plants, sulfur concentrations were lowest at 25% and 50% effluent doses.

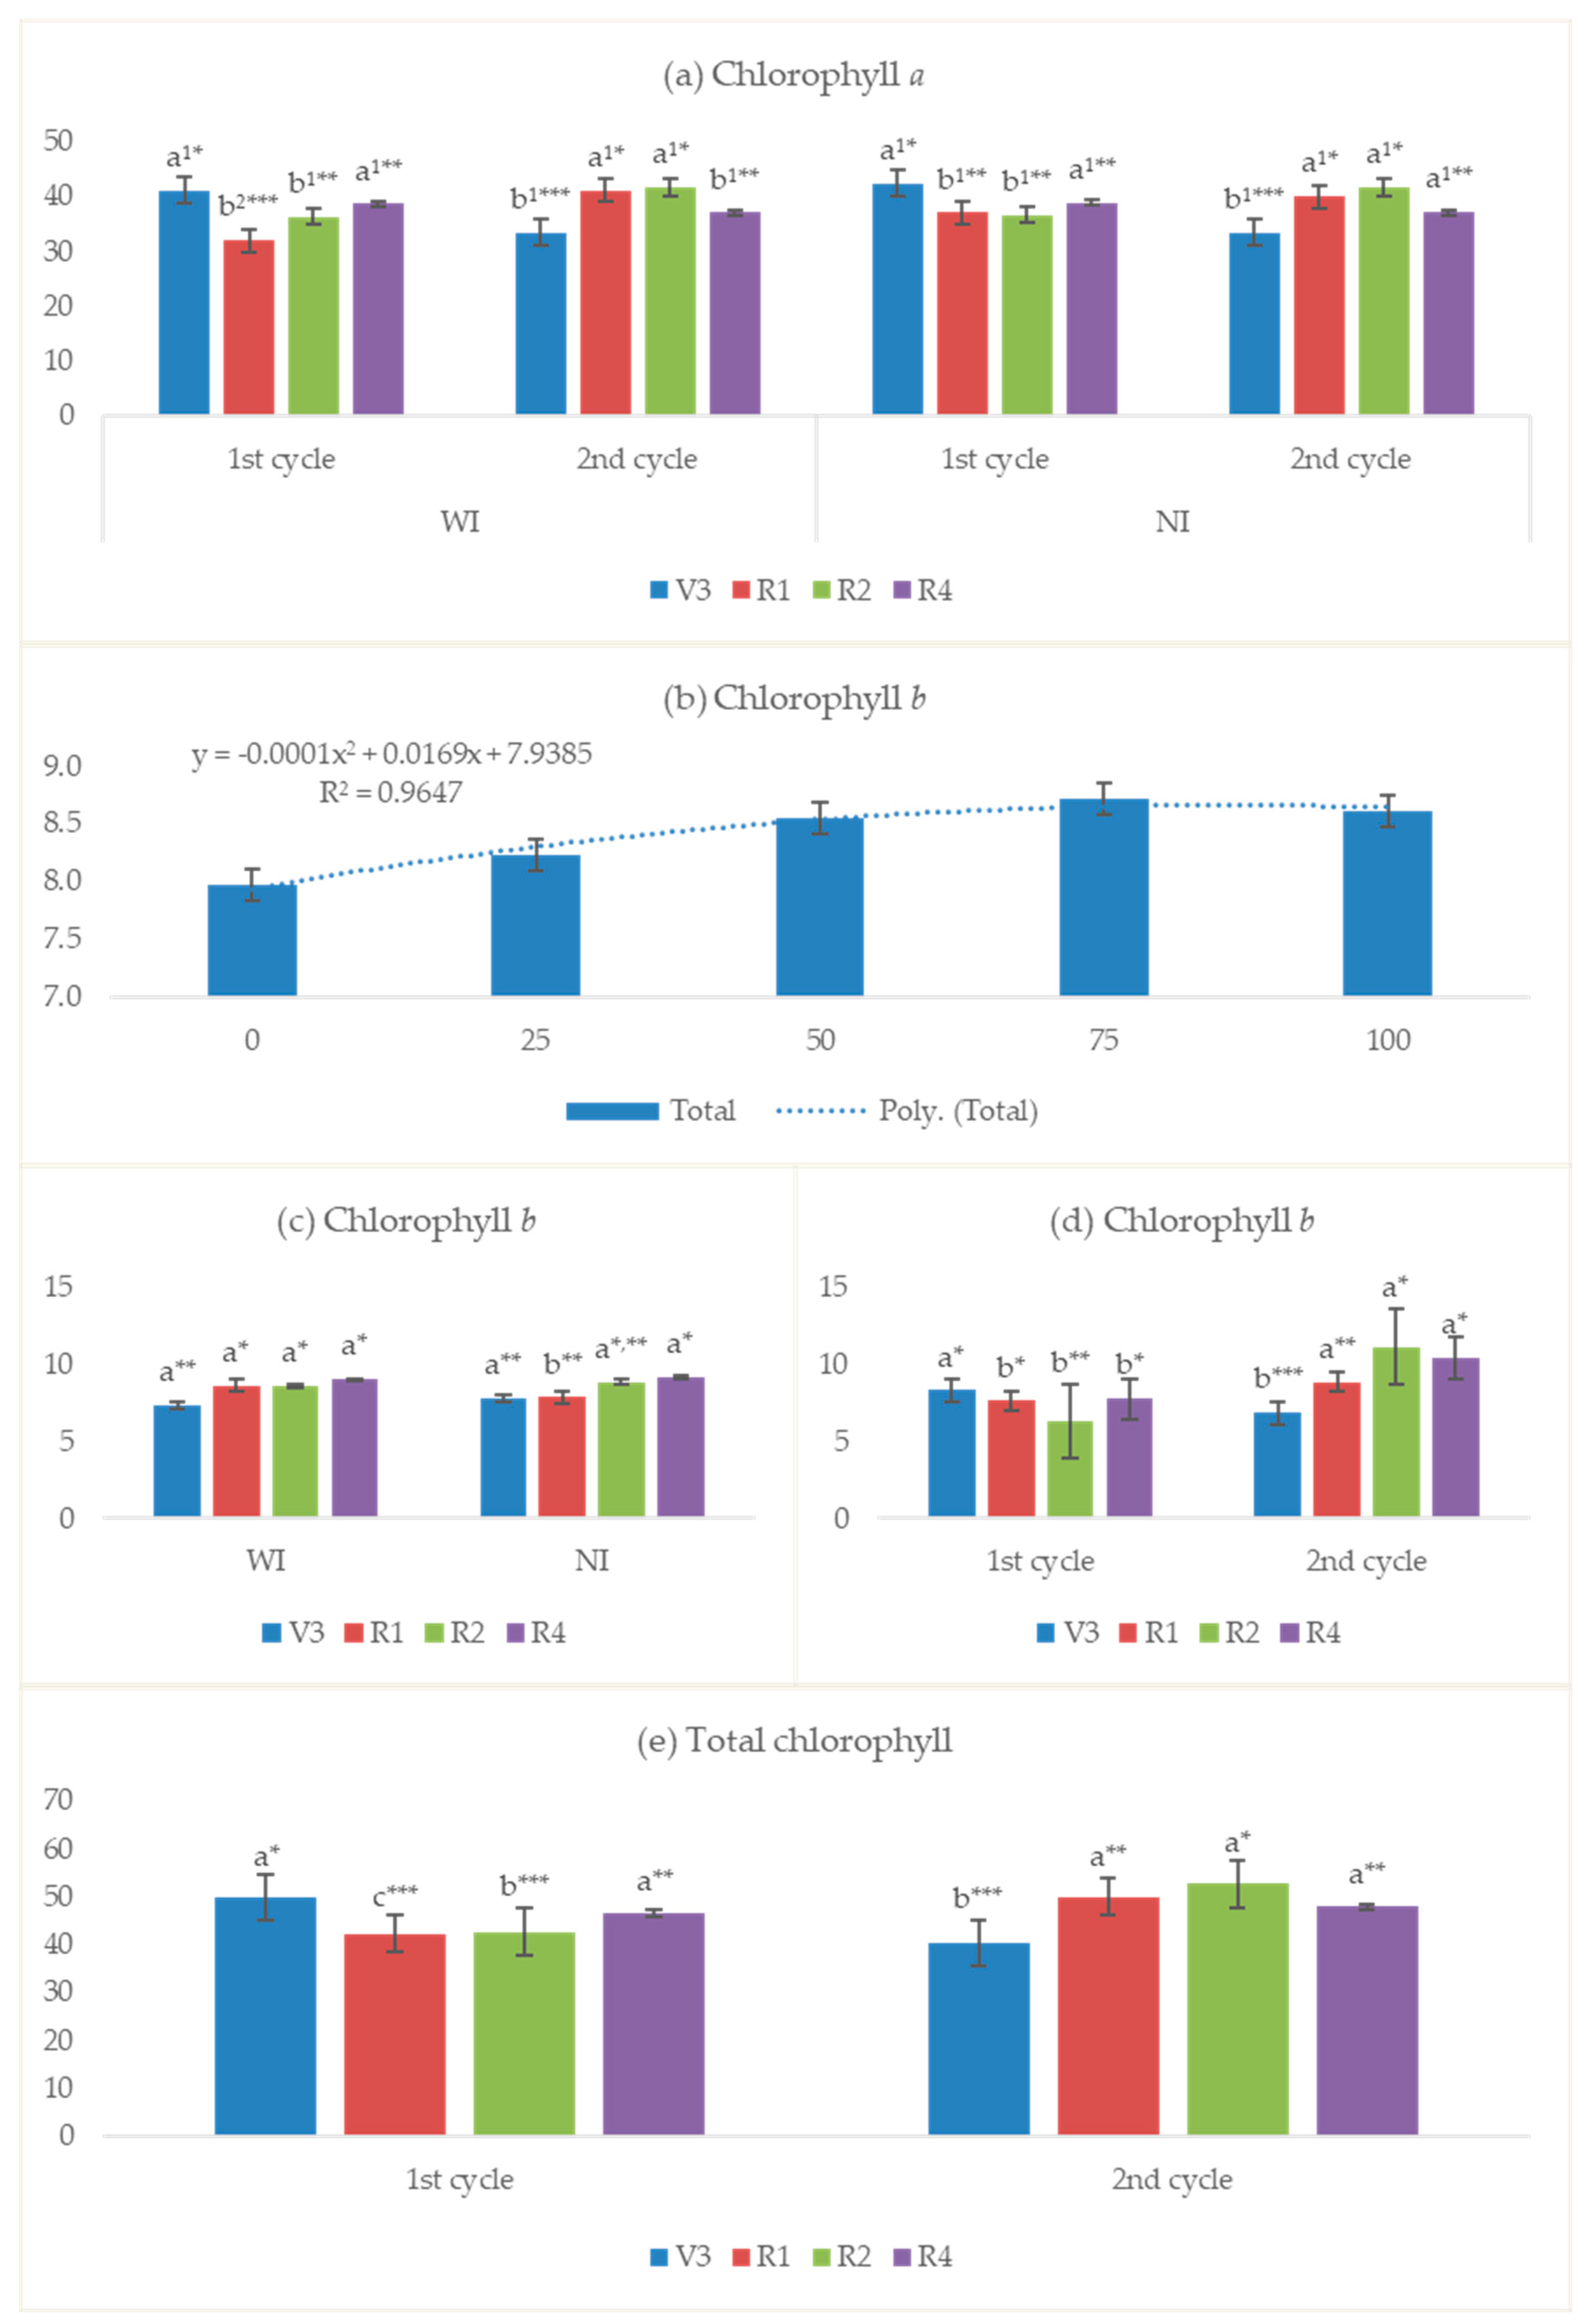
3.2.6. Chlorophyll Index

The relative chlorophyll index is directly related to chlorophyll content in the leaf and, consequently, to its photosynthetic capacity, serving as an indicator of plant health. The results obtained in this study show that the chlorophyll a index responded significantly to the interaction among inoculation, cycle, and vegetative stage (Figure 7a), while the chlorophyll b index responded to the effluent dose applied (Figure 7b) to the interaction between inoculation and phenological stage (Figure 7c), and to the interaction between cycle and phenological stage (Figure 7d).
For chlorophyll a, the highest means were observed at stage V3 in cycle 1 and at stages R1 and R2 in cycle 2 in both inoculated and non-inoculated plants. For chlorophyll b, the effluent dose that maximizes the response is approximately 85.35%, with the highest values observed in reproductive stages when inoculation was present and in R4 without inoculation. When comparing cycles, the best chlorophyll b results were obtained at V3 in cycle 1 and at R2 and R4 in cycle 2.

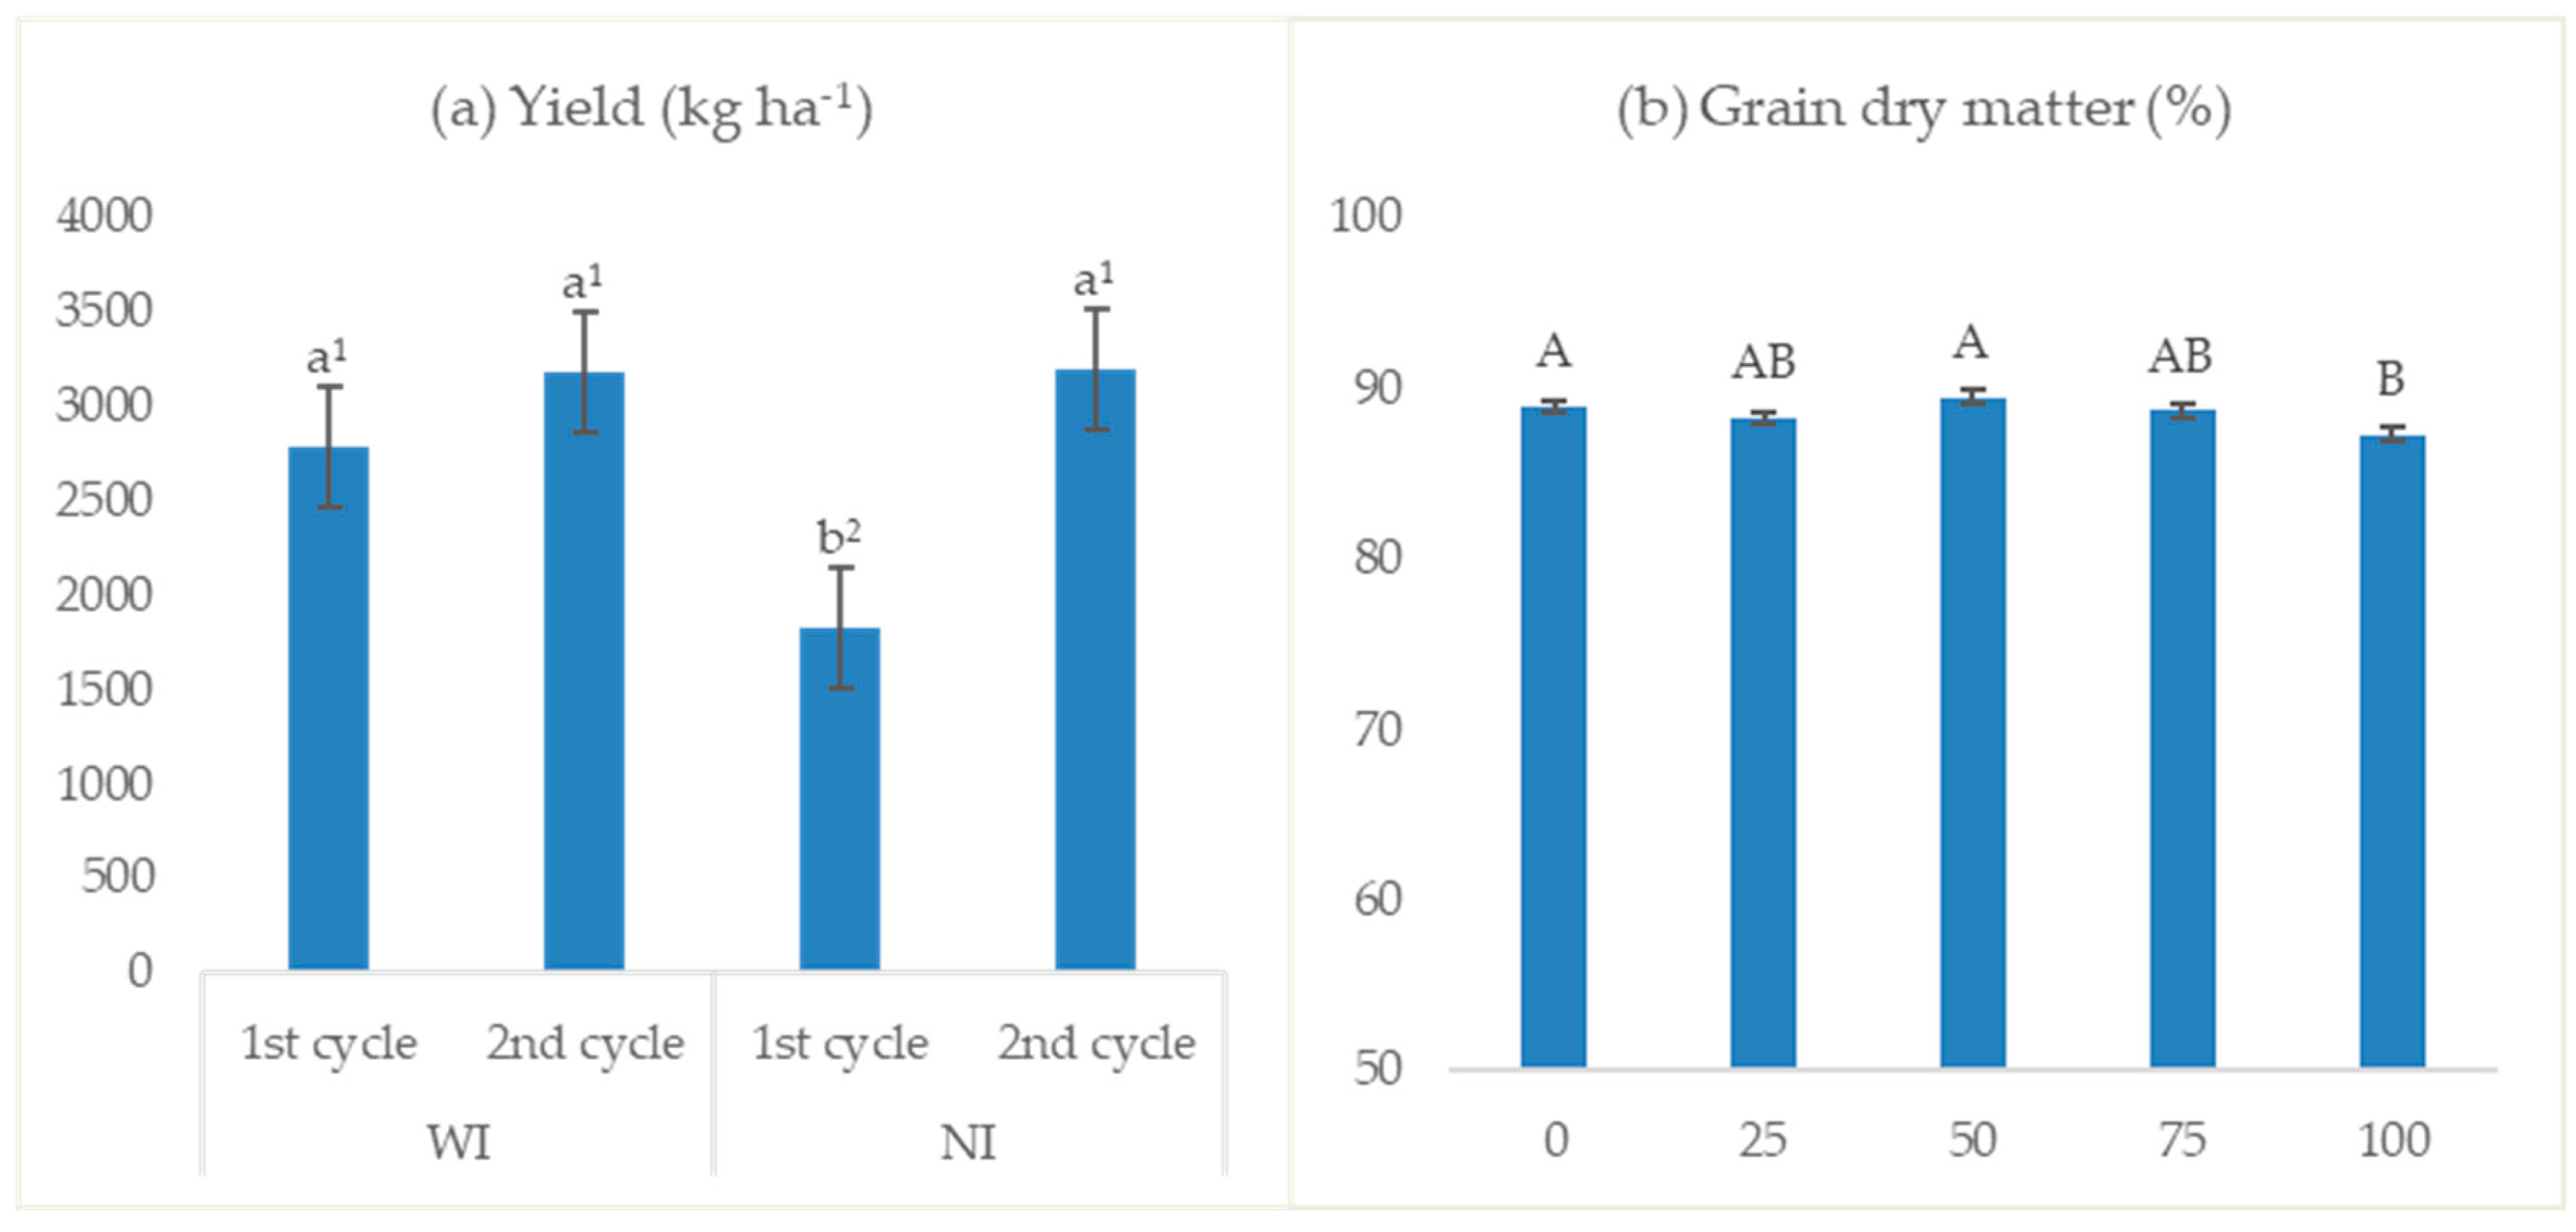
3.2.7. Yield and Grain Quality

The physiological quality of grains in the first cultivation cycle was lower than in the second, resulting in a reduced yield that fell below the national average of 3202 kg ha−1 (CONAB, 2024) [8]. Higher temperatures during the first cycle likely contributed to this outcome, as did the increased rainfall during the late developmental stages in the first cycle, beginning around 110 days after sowing (DAS), corresponding to stages R7 and R8 (beginning of maturity and full maturity). In response to the rainfall, plants started producing new shoots at the nodes, which likely redirected photoassimilates and compromised both plant maturation and grain quality.
Soybean yield did not respond significantly to different doses of treated slaughterhouse effluent used for irrigation. The primary factors influencing yield in this study were inoculation and cultivation cycle, with their interaction showing significant effects (Figure 8a). Non-inoculated soybeans in cycle 1 were the only group with a significantly lower mean yield compared to the others.
The bromatological analysis results for soybeans harvested in the second cycle are presented in Table 4 in comparison with other studies and reference values from the Organization for Economic Co-operation and Development (OECD). Most parameters evaluated did not show significant differences for the factors studied, except for the dry matter percentage, which showed a significant response to the effluent factor (Figure 8b), with the lowest value observed in the 100% effluent treatment. However, all treatments remained within the recommended range. This variation is likely associated with the sodium applied to the soil, affecting the dynamics of photoassimilate accumulation in the plants.

4. Discussion

4.1. Plant Height and Stand

The results align with findings from other studies, indicating that plant height varied significantly by soybean genotype but not by the presence or absence of rhizobium inoculation [30]. Kakabouki et al. [31] observed an increase in soybean plant height with higher nitrogen doses, with 120 kg ha−1 providing the best results compared to lower doses and unfertilized soybeans. The higher plant stand in cycle 2 is consistent with the increased plant height observed, as denser plantings tend to promote etiolation due to light competition, though this response is also influenced by each cultivar’s intrinsic characteristics [32]. Serafin-Andrzejewska et al. (2024) [14] reported that nitrogen application combined with inoculation optimized germination and survival rates, resulting in higher plant density, especially with moderate nitrogen dosages (30 kg ha−1). However, the results of this study differed from these findings, as the nitrogen dose–response curve peaked near 0%. Tukey’s test showed no significant differences in plant stand across effluent doses, indicating minimal variation, which was also reflected in the low absolute values of coefficients in the dose–response equation. The limited effect of effluent on plant stand was expected, as stand establishment occurs within the first weeks after sowing when salt and nutrient accumulation from effluent is still low.

4.2. Fresh and Dry Shoot Mass

As previously mentioned, higher temperatures and lower precipitation in cycle 1 (see Materials and Methods) created conditions that negatively affected soybean and rhizobium fitness [33]. Under these conditions, high nitrogen doses combined with inoculation allowed the plants to accumulate more fresh shoot biomass. In more favorable environmental conditions, high effluent doses may have impaired symbiosis. Kakabouki et al. [31] reported that applying 120 kg ha−1 of nitrogen increased dry shoot biomass. However, environmental factors are known to have a significant impact on soybean yield, accounting for 68% of variability, with nitrogen management practices contributing less than 1% [34]. Therefore, the more stressful environmental conditions in cycle 1 likely influenced soybean response more than nitrogen supplied via effluent. In cycle 2, under more favorable conditions for soybean development, the 100% effluent dose effectively increased dry shoot biomass in the absence of inoculation.

4.3. Leaf Area and Normalized Difference Vegetation Index

Similar to the plant height response, leaf area may have been positively influenced by denser planting in the second cycle, consistent with findings by Jańczak-Pieniążek [35]. These results also align with those of Szpunar-Krok et al. [10], who reported higher leaf area index (LAI) in inoculated treatments; however, they found maximum LAI at stage R3, whereas Montoya et al. [36] observed a peak between stages R4 and R5. Other studies report positive leaf area index responses to nitrogen application. Gai et al. [12] found that LAI was higher in soybeans fertilized with 50 kg ha−1 nitrogen compared to 0, 25, and 75 kg ha−1 doses. Basal and Szabó [37] also reported LAI increases with nitrogen application, especially under water-stress conditions.

4.4. Root Parameters

Conversely, Da Silva [38] observed higher soybean yields associated with lower root dry mass, suggesting that conditions that discourage root growth, such as higher soil moisture and water availability, may positively influence grain yield. In line with our findings, Gai et al. [12] reported negative root parameter responses to high nitrogen concentrations. While the 50 kg ha−1 dose had positive effects on root parameters, a 75 kg ha−1 nitrogen dose inhibited root activity and reduced root dry mass. McCoy et al. [39] corroborated this, reporting a 19% reduction in belowground biomass, with shorter root length and smaller root area in plants receiving 135 kg ha−1 nitrogen. Samudin and Kuswantoro [30] observed that inoculants increased root dry matter while reducing root length in soybeans. In the presence of Bradyrhizobium spp. inoculation, no difference was found in foliar phosphorus levels, possibly due to phosphorus retention in the roots to support nitrogen fixation [33].

4.5. Foliar Diagnosis

The foliar nutrient diagnosis revealed significant variations in macronutrient and sodium concentrations in response to treated effluent application, inoculation, and cultivation cycle. The observed nitrogen concentrations were higher in the first cycle compared to the second, aligning with nitrogen translocation within plants and the high mobility of this nutrient in soil. Although nitrogen application rates were increased in the second cycle, precipitation may have diluted its soil availability, resulting in lower leaf concentrations. Despite these variations, nitrogen levels in most treatments fell within or near the reference range for legumes, demonstrating the feasibility of effluent irrigation as an alternative nitrogen source.
Potassium concentrations were highest in the absence of effluent application and decreased with increased sodium accumulation from effluent treatments, supporting evidence of competitive absorption between these cations. This interaction has been widely documented as a limiting factor in potassium uptake under saline conditions. Similarly, phosphorus concentrations showed treatment-specific variations, with the absence of Bradyrhizobium spp. inoculation enhancing phosphorus uptake at higher effluent doses. This pattern is likely due to reduced phosphorus retention in roots under non-symbiotic conditions, as previously reported in soybean studies [33].
Conversely, calcium, magnesium, and sulfur concentrations were elevated in the second cycle, potentially due to the increased application of these nutrients via effluent. Calcium and magnesium levels consistently met the recommended ranges, highlighting the effluent’s role in supplementing essential secondary macronutrients. In contrast, sulfur concentrations varied by treatment, with inoculated plants demonstrating lower sulfur content under higher effluent doses, potentially due to the metabolic demands of nitrogen fixation on sulfur assimilation pathways.
Sodium accumulation showed a notable interaction with the effluent and inoculation factors. Higher sodium levels were detected in non-inoculated treatments, suggesting that Bradyrhizobium spp. may mitigate sodium uptake, potentially by enhancing plant resilience to osmotic stress through improved nitrogen assimilation. Additionally, sodium concentrations were higher in the first cycle under 75% and 100% effluent treatments, correlating with lower rainfall and reduced leaching.

4.6. Chlorophyll Index

The highest total chlorophyll levels were observed at V3 in cycle 1 and at R2 in cycle 2, followed by treatments at R1 in cycle 2, R4 in both cycles, and, lastly, the lowest values were seen in R1 and R2 in cycle 1 and V3 in cycle 2. The chlorophyll index is positively influenced by nitrogen and sulfur application, rhizobium inoculation, and higher plant water content [12,37,38,40]. Accordingly, chlorophyll index results from this study indicate that, generally, plants were healthier at V3 than at reproductive stages during cycle 1, while in cycle 2, plant health peaked near stage R2. In interaction with the inoculation factor, inoculation improved chlorophyll b levels during reproductive stages but did not positively affect chlorophyll a when interacting with the cycle, instead showing a reduction at R4 in the second cycle.

4.7. Yield and Grain Quality

Higher maximum temperatures in the first cycle likely contributed to the difference in grain quality, as reported by other authors; elevated temperatures negatively affect soybean fitness and yield [33,41]. This result suggests that under more limiting environmental conditions, rhizobium inoculation supports soybean response, whereas inoculation has no significant effect in favorable conditions. The positive effect of inoculation on soybean yield has been documented in several studies [10,14], as well as its beneficial effects on physiological responses [30]. This positive effect can occur due to various factors reported in the literature, including improved nutrient availability and uptake, enhanced plant growth, increased pathogen resistance, greater biomass accumulation [42], and increased salt stress tolerance [43]. The latter effect is particularly relevant to this study, as sodium concentrations in leaves correlated positively with effluent application in cycle 1.
The average yields in this study are compared with those from other scientific studies in Table 5. Other authors also found no significant yield difference in response to nitrogen application [10,11,44]. Kakabouki et al. [31], however, noted a significant yield increase with higher nitrogen doses. La Menza et al. [45] compared soybean production under limited versus abundant nitrogen supply across 13 environments, concluding that nitrogen limitation affects yield in high-productivity environments, with the extent of this limitation modulated by pre-existing soil nitrogen.
Mourtzinis et al. [34] assessed nitrogen application in soybeans under different management practices, noting that split applications, surface applications, and applications distributed across vegetative and reproductive stages (rather than solely reproductive) yielded better results. However, only 1% of environmental variation was attributed to nitrogen fertilization. Hoffaman et al. [46] supported this, showing that soybeans are more sensitive to water deficiency than nitrogen deficiency, a finding mirrored by Montoya et al. [36] in their yield responses to irrigation. Recent studies in Brazil found significant soybean yield differences when grown after sorghum fertilized with increasing nitrogen doses (0, 50, and 100 kg ha−1), with higher yields when nitrogen application was combined with no-till soybean planting after sorghum [15]. Yield averages in this study also varied by production year, with estimated yields ranging from 2250 to 3250 kg ha−1 in the 2019–2020 season and 2500 to 3500 kg ha−1 in the 2021–2022 season.
While numerous studies report that biological nitrogen fixation (BNF) is inhibited by nitrogen fertilization [11,47,48], this process is also strongly modulated by other factors. According to Santachiara, Salvagiotti, and Rotundo [33], phosphorus and potassium are major BNF promoters, while sulfur and other micronutrients also have positive impacts. It is also important to note that reduced BNF due to nitrogen application is not directly related to decreased yield, as soils with adequate mineral nitrogen supply can balance nitrogen sources [49].
The lack of significant yield response to effluent suggests that nitrogen sources compensated sufficiently to meet soybean needs, even if some biometric parameters were affected, as seen earlier. However, the importance of Bradyrhizobium spp. inoculation in mitigating adverse effects on soybean performance is evident.
The quality of grains from the second cycle was satisfactory, not only meeting established nutrient levels but also exhibiting high crude protein content compared to other studies. Since nitrogen application can increase seed protein content [37,50], the high crude protein values and lack of significant differences in this variable support the earlier discussion that nitrogen deficiency was not a concern in the second cycle due to the balance between nitrogen sources.

5. Conclusions

This study evaluated the impact of irrigation with treated slaughterhouse effluent on soybean growth, development, and yield under different effluent concentrations, with and without Bradyrhizobium spp. inoculation. Effluent application enhanced plant height, leaf area, and biomass, with the most significant effects observed at higher effluent concentrations combined with inoculation in the first cycle. Foliar nitrogen increased with elevated effluent doses in the first cycle, while chlorophyll b index peaked at 85.35% effluent irrigation. Yield was not significantly affected by effluent dilutions, highlighting the dominant influence of environmental factors.
Cycle-dependent variations in environmental factors, particularly rainfall and nitrogen concentrations in the effluent, influenced crop responses, underlining the importance of adjusting effluent application to the specific climatic conditions of each growing season. Inoculation with Bradyrhizobium spp. proved beneficial in promoting plant health and yield, particularly under suboptimal conditions, reinforcing the importance of microbial symbiosis for sustainable crop management.
Overall, this study supports the viability of using treated effluent as an alternative irrigation source in soybean production, with potential benefits for reducing reliance on chemical fertilizers and conserving freshwater resources. Careful management of effluent dosage is essential to maximize yield and ensure the compatibility of effluent irrigation with sustainable agricultural practices. Further research is recommended to explore the long-term agronomic impacts and the economic feasibility of large-scale effluent reuse in soybean and other legume crops, contributing to more sustainable agriculture in water-scarce regions.

Author Contributions

A.C.M.L.: conceptualization, methodology, formal analysis, investigation, data curation, and writing—original draft preparation; L.B. and L.R.T.: conceptualization, methodology, formal analysis, investigation, and data curation; A.L.d.S.D. and G.N.S.: investigation and data curation; T.M.G.: writing—review and editing, supervision, and funding acquisition; F.R.: writing—review and editing, supervision, project administration, and funding acquisition. All authors have read and agreed to the published version of the manuscript.

Funding

This research received no external funding.

Data Availability Statement

Data will be made available on request.

Acknowledgments

The authors would like to thank CAPES (Brazil) for the scholarship (Financing Code 001, process 88887.484379/2020-00), the University of Sao Paulo—Campus “Fernando Costa” for supplying the space, and all of the Grupo de Estudos em Engenharia de Biossistemas (GEBio) team for their hard work collecting data. During the preparation of this manuscript, the authors used ChatGPT and GPT-4-turbo (from OpenAI) for the purposes of academic language refinement, manuscript structuring, and adherence to journal formatting standards. The authors have reviewed and edited the output and take full responsibility for the content of this publication.

Conflicts of Interest

The authors declare no conflicts of interest.

References

  1. Ribeiro, W.C.; Conferência da Água da ONU: A Contribuição da USP. Jornal da USP, São Paulo, 12 April 2023. Available online: https://jornal.usp.br/?p=626794 (accessed on 20 October 2024).
  2. Bruyninckx, H.; Hatfield-Dodds, S.; Hellweg, S.; Schandl, H.; Vidal, B.; Razian, H.; Nohl, R.; Marcos-Martinez, R.; West, J.; Lu, Y.; et al. Global Resources Outlook 2024: Bend the Trend—Pathways to a Liveable Planet as Resource Use Spikes; International Resource Panel: Nairobi, Kenya, 2024; Available online: https://wedocs.unep.org/20.500.11822/44901 (accessed on 20 October 2024).
  3. Agência Nacional de Águas e Saneamento Básico (ANA). Conjuntura dos Recursos Hídricos no Brasil 2023: Informe Anual; ANA: Brasília, Brazil, 2024; 118p. [Google Scholar]
  4. Chojnacka, K.; Moustakas, K.; Witek-Krowiak, A.; Skrzypczak, D.; Mikula, K.; Loizidou, M. A transition from conventional irrigation to fertigation with reclaimed wastewater: Prospects and challenges. Renew. Sustain. Energy Rev. 2020, 130, 109959. [Google Scholar] [CrossRef]
  5. Almeida, I.C.C.; Fernandes, R.B.A.; Neves, J.C.L.; Ruiz, H.A.; De Lima, T.L.B.; Hoogmoed, W. Soil quality after six years of paper mill industrial wastewater application. Rev. Bras. Ciênc. Solo 2017, 41, e0160400. [Google Scholar] [CrossRef]
  6. Wang, H.; Wang, J.; Yu, X. Wastewater irrigation and crop yield: A meta-analysis. J. Integr. Agric. 2022, 21, 1215–1224. [Google Scholar] [CrossRef]
  7. Food and Agriculture Organization of the United Nations (FAO). FAOSTAT: Crops. Available online: https://www.fao.org/faostat/en/#data/QCL (accessed on 29 September 2024).
  8. Companhia Nacional de Abastecimento (CONAB). Boletim da Safra de Grãos. 12° Levantamento—Safra 2023/24. Available online: https://www.conab.gov.br/info-agro/safras/graos/boletim-da-safra-de-graos (accessed on 14 October 2024).
  9. Ramlal, A.; Nautiyal, A.; Lal, S.K.; Chigeza, G. A wonder legume, soybean: Prospects for improvement. Front. Plant Sci. 2023, 14, 1294185. [Google Scholar] [CrossRef]
  10. Szpunar-Krok, E.; Bobrecka-Jamro, D.; Pikuła, W.; Jańczak-Pieniążek, M. Effect of nitrogen fertilization and inoculation with Bradyrhizobium japonicum on nodulation and yielding of soybean. Agronomy 2023, 13, 1341. [Google Scholar] [CrossRef]
  11. Santachiara, G.; Salvagiotti, F.; Rotundo, J.L. Does biological nitrogen fixation modify soybean nitrogen dilution curves? Field Crops Res. 2018, 223, 171–178. [Google Scholar] [CrossRef]
  12. Gai, Z.; Zhang, J.; Li, C. Effects of starter nitrogen fertilizer on soybean root activity, leaf photosynthesis and grain yield. PLoS ONE 2017, 12, e0174841. [Google Scholar] [CrossRef]
  13. Liu, Y.; Yin, X.; Xiao, J.; Tang, L.; Zheng, Y. Interactive influences of intercropping by nitrogen on flavonoid exudation and nodulation in faba bean. Sci. Rep. 2019, 9, 4818. [Google Scholar] [CrossRef]
  14. Serafin-Andrzejewska, M.; Jama-Rodzeńska, A.; Helios, W.; Kozak, M.; Lewandowska, S.; Zalewski, D.; Kotecki, A. Influence of nitrogen fertilization, seed inoculation and the synergistic effect of these treatments on soybean yields under conditions in south-western Poland. Sci. Rep. 2024, 14, 6672. [Google Scholar] [CrossRef]
  15. Da Silva, G.F.; Calonego, J.C.; Luperini, B.C.O.; Chamma, L.; Zanetti, W.A.L.; Borghi, E.; Parrella, R.A.C.; Putti, F.F. Nitrogen fertilization in biomass sorghum improves the yield and quality of soybeans grains grown in succession in long-term management systems. Eur. J. Agron. 2024, 158, 127206. [Google Scholar] [CrossRef]
  16. American Public Health Association (APHA); American Water Works Association (AWWA); Water Environment Federation (WEF). Standard Methods for the Examination of Water and Wastewater, 22nd ed.; APHA: Washington, DC, USA, 2012; 1496p. [Google Scholar]
  17. Farias, J.R.B.; Nepomuceno, A.L.; Neumaier, N. Ecofisiologia da Soja; Circular Técnica No. 48; Embrapa Soja: Londrina, Brazil, 2007; Available online: http://www.infoteca.cnptia.embrapa.br/infoteca/handle/doc/470308 (accessed on 20 August 2024).
  18. Braga, N.R.; Reco, P.C.; Galo, P.B.; de Miranda, M.A.C.; Mascarenhas, H.A.A. Soybean: Glycine max (L.) Merrill. In Boletim 200: Instruções agrícolas para as principais culturas econômicas, 7th ed.; da Eira Aguiar, A.T., Gonçalves, C., Zagatto Paterniani, M.E.A.G., Tucci, M.L.S.A., de Castro, C.E.F., Eds.; Instituto Agronômico: Campinas, Brazil, 2014; p. 452. [Google Scholar]
  19. Ferreira, D.F. Sisvar: A computer statistical analysis system. Ciênc. Agrotec. 2011, 35, 1039–1042. [Google Scholar] [CrossRef]
  20. Oliveira, J.F.D.; Rodrigues, F.N.; Fia, R.; Vilela, H.S.; Landim, D.V. Chemical properties of soil fertirrigated with dairy and slaughterhouse wastewater. Eng. Agríc. 2017, 37, 1244–1253. [Google Scholar] [CrossRef]
  21. Araujo, I.R.; Sampaio, S.C.; Paz-Gonzalez, A.; Vilas-Boas, M.A.; Gonçalves, A.C.; Szekut, F.D. Reforested soil under drip irrigation with treated wastewater from poultry slaughterhouse. Rev. Bras. Eng. Agríc. Ambient. 2019, 23, 439–445. [Google Scholar] [CrossRef]
  22. Emerick, T.; Vieira, J.L.; Silveira, M.H.L.; João, J.J. Ultrasound-assisted electrocoagulation process applied to the treatment and reuse of swine slaughterhouse wastewater. J. Environ. Chem. Eng. 2020, 8, 104308. [Google Scholar] [CrossRef]
  23. Kanafin, Y.N.; Makhatova, A.; Meiramkulova, K.; Poulopoulos, S.G. Treatment of a poultry slaughterhouse wastewater using advanced oxidation processes. J. Water Process Eng. 2022, 47, 102694. [Google Scholar] [CrossRef]
  24. Madeira, L.; Carvalho, F.; Almeida, A.; Teixeira, M.R. Optimization of atmospheric carbonation in the integrated treatment immediate one-step lime precipitation and atmospheric carbonation: The case study of slaughterhouse effluents. Results Eng. 2023, 17, 100807. [Google Scholar] [CrossRef]
  25. Van Raij, B.; Cantarella, H.; Quaggio, J.A.; Furlani, A.M.C. Recomendações de Adubação e Calagem para o Estado de São Paulo, 2nd ed.; Boletim Técnico 100; Instituto Agronômico de Campinas: Campinas, Brasil, 1997; 285p. [Google Scholar]
  26. Etiosa, O.R.; Chika, N.B.; Benedicta, A. Mineral and proximate composition of soya bean. Asian J. Phys. Chem. Sci. 2017, 4, 1–6. [Google Scholar] [CrossRef]
  27. Qin, Y.; Park, S.Y.; Oh, S.W.; Lim, M.H.; Shin, K.S.; Cho, H.S.; Lee, S.K.; Woo, H.J. Nutritional composition analysis for beta-carotene-enhanced transgenic soybeans (Glycine max L.). Appl. Biol. Chem. 2017, 60, 299–309. [Google Scholar] [CrossRef]
  28. Alghamdi, S.S.; Khan, M.A.; El-Harty, E.H.; Ammar, M.H.; Farooq, M.; Migdadi, H.M. Comparative phytochemical profiling of different soybean (Glycine max (L.) Merr) genotypes using GC–MS. Saudi J. Biol. Sci. 2018, 25, 15–21. [Google Scholar] [CrossRef]
  29. Organisation for Economic Co-operation and Development (OECD). Revised Consensus Document on Compositional Considerations for New Varieties of Soybean [Glycine max (L.) Merr.]: Key Food and Feed Nutrients, Anti-Nutrients, Toxicants and Allergens; Series on the Safety of Novel Foods and Feeds; No. 25; OECD: Paris, France, 2012; Available online: https://www.oecd.org (accessed on 26 October 2024).
  30. Samudin, S.; Kuswantoro, H. Effect of rhizobium inoculation to nodulation and growth of soybean [Glycine max (L.) Merrill] germplasm. Legume Res. 2018, 41, 303–310. [Google Scholar] [CrossRef]
  31. Kakabouki, I.; Zisi, C.; Mavroeidis, A.; Kouneli, V.; Karydogianni, S.; Folina, A.; Triantafyllidis, V.; Efthimiadou, A.; Roussis, I.; Zotos, A.; et al. Effects of nitrogen fertilization on weed flora and productivity of soybean [Glycine max (L.) Merr.] crop. Nitrogen 2022, 3, 284–297. [Google Scholar] [CrossRef]
  32. Do Carmo, E.L.; Rocha, A.G.C.; Simon, G.A.; Da Silva, A.G.; Braz, G.B.P. Adensamento de plantas e épocas de cultivo de soja no cerrado. Colloq. Agrar. 2018, 14, 1–12. [Google Scholar] [CrossRef]
  33. Santachiara, G.; Salvagiotti, F.; Rotundo, J.L. Nutritional and environmental effects on biological nitrogen fixation in soybean: A meta-analysis. Field Crops Res. 2019, 240, 106–115. [Google Scholar] [CrossRef]
  34. Mourtzinis, S.; Gurpreet Kaur, G.; Orlowski, J.M.; Shapiro, C.A.; Lee, C.D.; Wortmann, C.; Holshouser, D.; Nafziger, E.D.; Kandel, H.; Niekamp, J.; et al. Soybean response to nitrogen application across the United States: A synthesis-analysis. Field Crops Res. 2018, 215, 74–82. [Google Scholar] [CrossRef]
  35. Jańczak-Pieniążek, M.; Buczek, J.; Bobrecka-Jamro, D.; Szpunar-Krok, E.; Tobiasz-Salach, R.; Jarecki, W. Morphophysiology, productivity and quality of soybean (Glycine max (L.) Merr.) cv. Merlin in response to row spacing and seeding systems. Agronomy 2021, 11, 403. [Google Scholar] [CrossRef]
  36. Montoya, F.; García, C.; Pintos, F.; Otero, A. Effects of irrigation regime on the growth and yield of irrigated soybean in temperate humid climatic conditions. Agric. Water Manag. 2017, 193, 30–45. [Google Scholar] [CrossRef]
  37. Basal, O.; Szabó, A. The combined effect of drought stress and nitrogen fertilization on soybean. Agronomy 2020, 10, 384. [Google Scholar] [CrossRef]
  38. Da Silva, G.F.; Calonego, J.C.; Luperini, B.C.O.; Chamma, L.; Alves, E.R.; Rodrigues, S.A.; Putti, F.F.; Silva, V.M.; Silva, M.A. Soil–Plant relationships in soybean cultivated under conventional tillage and long-term no-tillage. Agronomy 2022, 12, 697. [Google Scholar] [CrossRef]
  39. McCoy, J.M.; Kaur, G.; Golden, B.R.; Orlowski, J.M.; Cook, D.R.; Bond, J.A.; Cox, M.S. Nitrogen fertilization of soybean affects root growth and nodulation on two soil types in Mississippi. Commun. Soil Sci. Plant Anal. 2018, 49, 181–187. [Google Scholar] [CrossRef]
  40. Bi, Y.; Fan, C.; Liang, W.; Liao, Y.; Han, D.; Li, W.; Chen, X.; Liu, M.; Liu, J.; Di, S.; et al. Combination effects of sulfur fertilizer and rhizobium inoculant on photosynthesis dynamics and yield components of soybean. Agronomy 2024, 14, 794. [Google Scholar] [CrossRef]
  41. Allen Jr, L.H.; Zhang, L.; Boote, K.J.; Hauser, B.A. Elevated temperature intensity, timing, and duration of exposure affect soybean internode elongation, mainstem node number, and pod number per plant. Crop J. 2018, 6, 148–161. [Google Scholar] [CrossRef]
  42. Kebede, E. Competency of rhizobial inoculation in sustainable agricultural production and biocontrol of plant diseases. Front. Sustain. Food Syst. 2021, 5, 728014. [Google Scholar] [CrossRef]
  43. Fu, X.; Bian, D.; Gu, X.; Cao, J.; Liu, J. Combination of graphene oxide and rhizobium improved soybean tolerance in saline-alkali stress. Agronomy 2023, 13, 1637. [Google Scholar] [CrossRef]
  44. Flajšman, M.; Mihelič, R.; Kolmanič, A.; Ačko, D.K. Influence of soil amended with zeolite and/or mineral N on agronomic performance and soil mineral N dynamics in a soybean–winter triticale crop rotation field experiment. Cereal Res. Commun. 2020, 48, 239–246. [Google Scholar] [CrossRef]
  45. La Menza, N.C.; Monzon, J.P.; Specht, J.E.; Lindquist, J.L.; Arkebauer, T.J.; Graef, G.; Grassini, P. Nitrogen limitation in high-yield soybean: Seed yield, N accumulation, and N-use efficiency. Field Crops Res. 2019, 237, 74–81. [Google Scholar] [CrossRef]
  46. Hoffmann, B.; Varga, B.; Nagy, E.; Hoffmann, S.; Darkó, É.; Tajti, J.; Janda, T. Effects of nitrogen and water deficiency on agronomic properties, root characteristics and expression of related genes in soybean. Agronomy 2021, 11, 1329. [Google Scholar] [CrossRef]
  47. Shin, C.; Sharif, M.O.; Lee, H. Evaluating the effect of bacterial inoculation and fertilization on the soil nutrient status of coal mine soil by growing soybean (Glycine max) and shrub lespedeza (Lespedeza bicolor). Sustainability 2018, 10, 4793. [Google Scholar] [CrossRef]
  48. Ciampitti, I.A.; de Borja Reis, A.F.; Córdova, S.C.; Castellano, M.J.; Archontoulis, S.V.; Correndo, A.A.; De Almeida, L.F.A.; Rosso, L.H.M. Revisiting biological nitrogen fixation dynamics in soybeans. Front. Plant Sci. 2021, 12, 727021. [Google Scholar] [CrossRef]
  49. Santachiara, G.; Borrás, L.; Salvagiotti, F.; Gerde, J.A.; Rotundo, J.L. Relative importance of biological nitrogen fixation and mineral uptake in high yielding soybean cultivars. Plant Soil. 2017, 418, 191–203. [Google Scholar] [CrossRef]
  50. La Menza, N.C.; Monzon, J.P.; Specht, J.E.; Grassini, P. Is soybean yield limited by nitrogen supply? Field Crops Res. 2017, 213, 204–212. [Google Scholar] [CrossRef]
Figure 1. Average monthly temperatures (Avg. Temp.), maximum (Max. Temp.) and minimum temperatures (Min. Temp.), and precipitation during the experimental period (cycle 1, 20 October to 21 February; and cycle 2, 21 November to 22 March) compared to the historical averages (10Y) over the past ten years for the experimental area location. Source: Author’s work, created with data from the Power Project (NASA, 2023).
Agronomy 15 00167 g001
Figure 2. Result of the statistical analysis for plant height in the effluent-cycle interaction. Uppercase letters indicate differences for the effluent factor, and lowercase letters indicate differences for the cycle factor (p < 0.05).
Agronomy 15 00167 g002
Figure 3. Result of the statistical analysis for plant stand in response to (a) effluent and (b) growing cycle. Different numbers indicate differences in the cycle factor (p < 0.05).
Agronomy 15 00167 g003
Figure 4. Result of the statistical analysis for fresh shoot biomass (a) and dry shoot biomass (b) in the interaction between effluent, inoculum, and cycle. Uppercase letters differ for the effluent factor, lowercase letters differ for the inoculum factor, and numbers differ for the cycle factor (p < 0.05). WI: with inoculation; NI: without inoculation.
Agronomy 15 00167 g004
Figure 5. Result of the statistical analysis for (a) leaf area in response to the cycle factor and Normalized Difference Vegetation Index (NDVI) in response to (b) interaction between inoculum and cycle, as well as (c) phenological stage and cycle and (d) effluent and phenological stage. Uppercase letters differ for effluent, lowercase letters differ for inoculum, numbers differ for cycle, and asterisks differ for phenological stage (p < 0.05). WI: with inoculation; NI: without inoculation.
Agronomy 15 00167 g005
Figure 6. Result of the statistical analysis for (a) fresh root mass in response to the cycle factor; root surface area in response to (b) effluent, (c) inoculation, and (d) cycle; and root volume in response to (e) effluent and (f) inoculation. Uppercase letters differ for effluent, lowercase letters differ for inoculum, and numbers differ for cycle (p < 0.05). WI: with inoculation; NI: without inoculation.
Agronomy 15 00167 g006
Figure 7. Result of the statistical analysis for (a) chlorophyll a in response to the inoculation and cycle factor; chlorophyll b in response to (b) effluent, (c) inoculation and phenological stage, and (d) cycle and phenological state; and total chlorophyll in response to (e) cycle and phenological state. Lowercase letters differ for inoculum, numbers differ for cycle, and asterisks differ for phenological stage (p < 0.05). WI: with inoculation; NI: without inoculation.
Agronomy 15 00167 g007
Figure 8. Result of the statistical analysis for (a) yield in the interaction for the factors inoculum and cycle and (b) grain dry matter in response to the effluent factor. Uppercase letters differ for effluent, lowercase letters differ for inoculum, and numbers differ for cycle (p < 0.05). WI: with inoculation; NI: without inoculation.
Agronomy 15 00167 g008
Table 1. Characterization of the effluent from Scholar Slaughterhouse of the University of São Paulo, “Fernando Costa” campus, collected after the polishing pond stage, during the first and second experimental cycles in comparison with previous studies.
ParameterThis StudyOliveira et al. [20]Araújo et al. [21]Emerick et al. [22]Kanafin et al. [23]Madeira et al. [24]
2020–20212021–2022Average
Slaughterhouse TypeGeneralNPPoultrySwinePoultryGeneral
Treatment TypeAnaerobicPhysicalAerobicPhysical ChemistPhotochemicalPhysical Chemist
pH8.12 ± 0.757.45 ± 0.127.79 ± 0.637.70 ± 0.307.00 ± 0.108.20 ± 0.717.53 ± 0.227.50 ± 0.10
EC (dS m−1)0.4 ± 0.070.77 ± 0.090.58 ± 0.201.20 ± 0.100.01 ± 0.002.82 ± 0.53-3.00 ± 0.10
COD (mg L−1)96.04 ± 42.25178.46 ± 80.67279.62 ± 243.005.81 ± 3007.0080.90 ± 14.70405.00 ± 8.20155.00 ± 15.00226.00 ± 41.00
TKN (mg L−1)34.03 ± 9.2777.49 ± 7.7453.34 ± 23.25157.50 ± 27.0048.70 ± 11.509.20 ± 2.52-58.00 ± 0.00
N-NH4+ (mg L−1)22.19 ± 8.8859.71 ± 940.95 ± 20.79---0.8452.00 ± 0.00
Nitrate (mg L−1)0.32 ± 0.18ND0.32 ± 0.18---2.98-
Nitrite (mg L−1)NDNDND-----
Soluble Phosphoru (mg L−1)3.57 ± 0.45.46 ± 0.994.62 ± 1.22-----
Total Phosphorus (mg L−1)7.16 ± 2.97.98 ± 0.877.61 ± 2.0811.90 ± 9.6020.20 ± 5.500.26 ± 0.06--
Potassium (mg L−1)14.88 ± 3.31NA14.88 ± 3.3112.60 ± 5.00--14.86-
Calcium (mg L−1)17.97 ± 0.9523.25 ± 1.4517.97 ± 0.9565.00 ± 38.10--132.43190.50 ± 0.00
Magnesium (mg L−1)1.58 ± 0.292.44 ± 0.191.58 ± 0.2989.00 ± 52.20--67.2760.20 ± 4.20
Sulfur (mg L−1)2.12 ± 2.35NA2.12 ± 2.35-----
Iron (mg L−1)2.61 ± 2.94NA2.61 ± 2.94-----
Manganese (mg L−1)0.06 ± 0.020.12 ± 0.020.06 ± 0.02-----
Sodium (mg L−1)35.7 ± 9.59NA35.70 ± 9.5921.50 ± 3.60--141.87-
SAR (mmol L−1)−0.53.34 ± 0.89-------
EC: electrical conductivity; COD: chemical oxygen demand; TKN: total Kjeldahl nitrogen; SAR: Sodium adsorption ratio; ND: not detectable; NA: not analyzed; NP: not provided.
Table 2. Water input (via precipitation and irrigation) and nitrogen input during the two soybean growing cycles.
TreatmentPrecipitationTap Water
Irrigation
Effluent IrrigationTotal IrrigationTotal DepthNitrogen Input
2020–2021(mm)(kg ha−1)
0%468.54395.790.00395.79864.330.00
25%468.54338.9176.37415.28883.8225.96
50%468.54277.82161.82439.64908.1855.02
75%468.54181.89223.65405.54874.0876.04
100%468.54107.34298.20405.54874.08101.39
2021–2022(mm)(kg ha−1)
0%756.85287.930.00287.931044.780.00
25%756.85248.4354.40302.841059.6941.89
50%756.85205.94115.54321.471078.3288.96
75%756.85136.21159.18295.381052.23122.56
100%756.8583.15212.23295.381052.23163.42
Table 3. Leaf diagnosis analysis result for macronutrients and sodium.
NPCaMgSNa PKCaMgNa
(g kg−1)
Min.40.002.504.003.002.10- 2.5017.004.003.00-
Max.54.005.0020.0010.004.00- 5.0025.0020.0010.00-
2020–202149.042.17 18.95 26.321.260.68
046.37 B12.108.406.52 A21.030.1902.0316.15 A12.69 B6.910.29
WI46.162.097.936.381.04 Aa20.00
NI46.572.118.876.661.03 Aa20.38WI2.09 Aa15.8312.376.830.17 Ba
2546.64 B12.198.496.84 A21.320.45
WI47.262.088.676.881.33 Aa20.47NI1.97 Ba16.4613.026.990.40 BCa
NI46.012.308.316.801.30 Aa20.42
5046.90 B12.178.666.63 A21.210.58252.0614.82 AB13.67 AB7.510.40
WI45.482.158.776.681.13 Aa20.35
NI48.322.208.556.581.28 Aa20.80WI1.96 Ab14.3913.817.460.41 Ba
7551.11 AB12.108.776.00 AB21.340.53
WI52.692.049.005.871.31 Aa20.48NI2.17 ABa15.2413.537.570.39 Ca
NI49.532.178.546.141.37 Aa20.57
10054.19 A12.2610.455.61 B21.391.65502.1115.59 AB13.61 AB7.390.51
WI54.102.1710.315.441.37 Aa21.72
NI54.282.3510.595.781.41 Aa21.58WI2.11 Aa15.7313.657.430.20 Bb
2021–202239.102.01 219.81 28.183.680.31
038.71 A21.9418.427.43 B13.290.42NI2.10 ABa15.4413.587.360.81 ABa
WI37.542.0918.297.434.38 Aa10.40
NI39.881.8018.557.442.19 Bb10.43752.1014.33 B13.69 AB7.100.37
2538.01 A21.8920.578.40 A14.290.33
WI38.861.8020.668.224.55 Aa10.33WI2.00 Ab14.2913.756.890.31 Ba
NI37.161.9920.488.584.03 Aa10.33
5039.95 A22.0220.218.41 A13.310.42NI2.19 Aa14.3713.637.310.43 BCa
WI41.452.0620.148.434.10 ABa10.00
NI38.441.9820.288.392.52 Bb10.831002.2014.70 AB14.36 A6.681.04
7538.30 A22.0820.248.55 A14.040.17
WI36.861.9420.078.243.56 ABb10.10WI2.13 Aa14.7613.866.381.07 Aa
NI39.742.2320.418.864.53 Aa10.23
10040.52 A22.1119.588.09 AB13.490.23NI2.27 Aa14.6414.866.971.01 Aa
WI39.832.0818.617.633.19 Ba10.20WI2.0615.0013.497.00 a0.43
NI41.222.1520.568.563.79 Aa10.27NI2.1415.2313.727.24 b0.61
Uppercase letters differ for effluent, lowercase letters differ for inoculum, and numbers differ for cycle (p < 0.05). WI: with inoculation; NI: without inoculation.
Table 4. Average result of the bromatological analysis of soybean grains in the present study compared with other studies and references.
This StudyEtiosa et al. [26]Qin et al. [27]Alghamdi et al. [28]OECD [29]
AverageAveragecv PoongsanAverageAverageMin.Max.
Dry Matter88.5291.93-95.189.965.695.3
Mineral Matter4.624.295.015.445.33.97
Crude Protein45.0337.6935.0539.0239.533.245.5
Crude Fiber11.85.444.75-7.8--
Ether Extract22.5528.217.2721.1616.78.123.6
Nitrogen-Free Extract15.97------
Acid Detergent Fiber10.5---127.818.6
Neutral Detergent Fiber17.19---12.38.521.3
Table 5. Comparison of soybean yield values in the present study with average soybean yields found in the literature. Uppercase letters differ for effluent, lowercase letters differ for inoculum (p < 0.05) in this study, while different letters within each study denote specific treatment differences. WI: with inoculation; NI: without inoculation.
This StudySantachiara et al. [11]Flajšman et al. [44]Kakabouki et al. [31]Szpunar-Krok et al. [10]
SP-BrasilArgentinaSloveniaGreecePoland
Treatmentkg ha−1Treatmentkg ha−1Treatmentkg ha−1Treatmentkg ha−1Treatmentkg ha−1
WI Cycle 12782 Aa0 kg N ha−14968WI30930 kg N ha−14066–4095 c0 kg N ha−13740
NI Cycle 11823 Bb600 kg N ha−15081NI316280 kg N ha−14208–4225 bc30 kg N ha−13860
WI Cycle 23180 Aa Control3044100 kg N ha−14327–4343 ab60 kg N ha−13950
NI Cycle 23190 Aa Zeolite 600 kg ha−1 +3161120 kg N ha−14441–4462 aNI3610 b
30 kg N ha−1 + 72–90 kg N ha−13174 WI HiStick®4010 a
Zeolite 600 kg ha−1 + 30 kg N ha−1 + 72–90 kg N ha−13132 WI Nitragina3940 a
Disclaimer/Publisher’s Note: The statements, opinions and data contained in all publications are solely those of the individual author(s) and contributor(s) and not of MDPI and/or the editor(s). MDPI and/or the editor(s) disclaim responsibility for any injury to people or property resulting from any ideas, methods, instructions or products referred to in the content.

