Abstract
Scarce water resources, high temperatures, limited rainfall, elevated soil salinity, and poor soil quality (98% sand) challenge crop production in the desert regions of the Middle East. Proso millet’s resilience under these stresses presents a potential solution for enhancing food security in arid environments. This field study evaluated 24 proso millet genotypes under three environments (100% freshwater, 50% freshwater, and 10 dS/m salinity) in the UAE during normal and summer seasons, aiming to identify genotypes resilient to water, heat, and salinity stresses and to assess genotype-by-environment (G × E) interactions and key traits associated with grain yield. ANOVA indicated significant G × E interactions. Genotypes G9 and G24 displayed high yield and stability across environments during the normal season. In the summer, genotypes G7 and G10 exhibited resilience with high yields under high-temperature stress alone, while combined stresses led to yield reductions across all genotypes, with greater susceptibility under cumulative stress. GGE biplot analysis identified G9 as ideal in the normal season, while G15 and G23 demonstrated stability under combined stresses in the summer season. High chaffy grain yield (CGY) observed under summer stress conditions suggests a shift in resource allocation away from productive grain formation. The reproductive phase was highly vulnerable to heat stress, with 88% of this period experiencing daytime temperatures exceeding 40 °C, with a peak reaching up to 49 °C. These extreme conditions, coinciding with the crop’s critical growth stages, triggered a significant increase in chaffy grain production, substantially reducing overall grain yield. Despite these challenges, genotypes G7, G10, and G12 exhibited notable resilience, maintaining yields above 0.75 t ha−1. Correlation analysis suggested that selecting for increased plant height, forage yield, and 1000-grain weight (TGW) could enhance grain yield under the normal and summer conditions. This study highlights the potential of proso millet genotypes as climate-resilient options for arid regions, providing a basis for developing stress-tolerant varieties and promoting sustainable agriculture in desert climates.
1. Introduction
The United Arab Emirates (UAE) faces some of the most challenging agricultural conditions globally, with the summer temperatures often exceeding 50 °C and prolonged heatwaves lasting several weeks. These extreme heat conditions are compounded by scarce water resources, with available groundwater frequently exhibiting high salinity levels [1,2,3]. The combined impact of high temperatures, intense solar radiation, and saline water creates an inhospitable environment for most conventional crops globally. These factors contribute to the UAE’s heavy reliance on agricultural food imports, which account for approximately US$ 2.28 billion [4]. This heavy reliance on imports poses a significant economic burden and makes the nation highly vulnerable to fluctuations in global food markets. As the nation strives to enhance its food security and reduce vulnerability, it must explore resilient crop alternatives that can thrive under such unique environmental conditions. One such alternative is promoting millet crops, which are more efficient in photosynthesis (C4) and can thrive under adverse climatic conditions, including drought and salinity.
Proso millet (Panicum miliaceum L.), traditionally grown in arid and semi-arid regions, exhibits exceptional resilience to abiotic stresses, including drought, salinity, and low soil fertility, making it an ideal crop for sustainable agriculture in these challenging climates [5]. Proso millet has been adapted to marginal lands of rainfed agriculture systems characterized by low rainfall (100–400 mm) and high temperatures for food or feed production in arid and semi-arid regions of China, India, Africa, Russia, Nepal, and the Pacific Northwest (PNW) region of the United States [6,7,8,9]. It is cultivated globally across diverse regions, with significant production areas in China, India, the USA, and Eastern Europe [10,11]. Known for its short growing season (60–90 days), proso millet is used as a catch crop before planting the cool season crops such as wheat [12] and in rotation with sunflower and maize [13]. Country-level production data on proso millet production are limited, as the statistics for this crop are often grouped with other millets. Consequently, obtaining accurate figures for specific countries, particularly those in arid regions, can be challenging.
Proso millet is a valuable option for resource-poor farmers due to its minimal input requirements. It delivers high nutritional value, with 11–12% protein, 8–9% dietary fiber, and essential vitamins and minerals [5,14], making it suitable for both human consumption and animal feed. Its nutritional profile emphasizes its role in enhancing food security and addressing malnutrition. Furthermore, incorporating proso millet into local agricultural practices aligns with the UAE’s National Food Security Strategy, which aims to foster sustainable agricultural development and enhance domestic food production [15].
This research aimed to evaluate a diverse panel of proso millet genotypes under field conditions, applying various stress treatments across the normal and summer seasons. This study sought to enhance food security and promote self-sufficiency in these water-scarce environments by identifying resilient varieties capable of thriving in the UAE’s challenging environment. The successful cultivation of proso millet could mitigate the import burden and contribute to a diversified agricultural landscape less dependent on traditional crops, paving the way for a more sustainable and resilient food system in the UAE. To ensure optimal crop performance and yield in the UAE’s challenging climate, it is crucial to identify proso millet genotypes that exhibit superior salinity, water-stress, and heat-stress tolerance.
Each test environment in this study provided insights into the phenotypic performance of genotypes under specific stress conditions. During the normal season, ENV1 represented ideal conditions with no stress (100% irrigation), ENV2 imposed only water stress (50% irrigation), and ENV3 applied salinity stress. In the summer, ENV1 was structured to assess genotypes under heat stress alone (100% irrigation; no water stress); ENV2 combined water (50% irrigation) and heat stresses, while ENV3 evaluated the effects of heat, water, and salinity stresses. This combination of treatments will provide researchers with a comprehensive understanding of genetic variation within the tested genotypes, facilitating the identification of genotypes suited to specific or combinations of stresses.
This approach is essential to optimize proso millet’s productivity and ensure its role as a sustainable food source in regions with adverse climatic conditions, such as in the Gulf Cooperation Council countries (GCC). Multiseasonal or location testing of proso millet accessions plays a crucial role in varietal development programs, focusing on the agronomic superiority of new accessions, particularly in grain and fodder yield. However, limited emphasis is often placed on understanding the accession’s interaction with diverse target environments, which can be unpredictable. The development of biplot methodology, especially AMMI and GGE biplots, has simplified complex GEI visualization, allowing researchers to observe genotype and environment interactions in a clear, graphical format [16,17,18]. By introducing climate-resilient proso millet genotypes, our research can significantly impact the UAE’s food production, reduce import dependency, and contribute to a more sustainable and resilient food system.
2. Materials and Methods
2.1. Study Area and Soil Analysis
The experiments were conducted under field conditions at the International Center for Biosaline Agriculture (ICBA) in Dubai during the 2023–24 (November to February) and 2024 (Apr–Jun) growing seasons. ICBA is 34 m above sea level, with geographic coordinates of 25°09′ N latitude and 55°39′ E longitude. Dubai has a hot desert climate classified under the Köppen climate classification as BWh (arid, desert climate). High temperatures, minimal rainfall, and intense solar radiation characterize this climate. Summer (May to September) is extremely hot, with average daytime temperatures often exceeding 40 °C and frequently reaching above 45 °C and nighttime temperatures rarely falling below 30 °C. Winter (November to February) is milder, with temperatures ranging between 14 °C and 25 °C (57 °F to 77 °F). However, extremes can dip below 10 °C (50 °F) at night in rare cases (Figure 1). The average annual rainfall is extremely low, typically around 100 mm annually. Most rainfall occurs during the winter months, between December and March, though it is highly erratic and often in the form of brief showers or thunderstorms. The soils of Dubai are primarily arid and sandy, typical of desert regions, with low organic matter content and limited water retention capacity. They belong mainly to the Aridisols soil orders, as defined by the USDA soil taxonomy. These soils dominate the UAE’s landscape and are common in dry regions with minimal organic content. They are characterized by low fertility, high salinity, and poor moisture retention due to the sandy texture. Due to high evaporation rates, salts accumulate in the upper soil layers, leading to saline conditions that challenge crop growth without proper management.
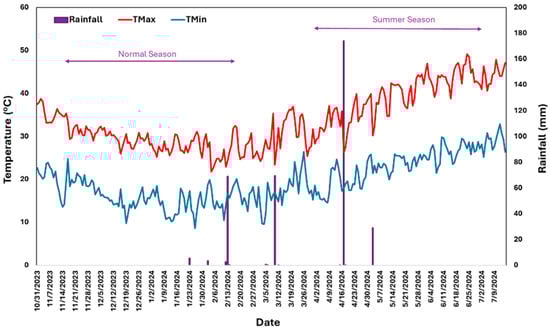
Figure 1.
Daily weather data collected during the crop growth period in normal and summer seasons.
Soil data were collected in the experimental site using an Agile Camp soil auger of 1 m length. Two representative samplings were selected for freshwater treatment and one for salinity. Soil samples by horizon layer were collected and analyzed for chemical and physical characteristics. Soil layer information regarding bulk density, pH, soil texture, soil organic carbon (SOC), and soil hydraulic properties are shown in Table 1. The bulk density was estimated by the Core method [19], pH and EC by the Saturated soil paste method [20], SOC by Walkley [21], and FAO [22] methods and soil texture by Pipette method [23]. The soil profile in the freshwater zone tends to have a lower sand proportion than in the salinity zone. The Soil Organic Carbon (SOC) in the top layer is 0.89% and 0.78% in the fresh and saline soil, respectively. During the field experiments, three fertilizer doses were applied using fertigation to ensure consistent nutrient availability. The first dose, consisting of a complex fertilizer, was applied 20 days after sowing (DAS) at a rate of 60 kg/ha. The second dose, using Urea, was applied after 30 DAS at the same rate of 60 kg/ha. The final dose, comprising a complex fertilizer, was applied on 40 DAS, also at a rate of 60 kg/ha. These fertilization practices ensured adequate nutrient supply during the experimental period, supporting plant growth and development under the applied stress conditions.

Table 1.
Status of soil biophysical properties collected at different depths of the experimental site.
2.2. Plant Materials
A set of 24 genotypes was carefully selected based on yield performance and flowering time from a genebank characterization program that screened over 80 germplasm accessions stored at the ICBA genebank. Pure seeds collected from single plants of each genotype during the 2022–23 season in the germplasm characterization nursery were used in the current experiment. Details on genotype designation, ID, and respective origins are provided in Table S1. No special permissions were required to use these genotypes, as they were sourced through ICBA’s genebank under the Standard Material Transfer Agreement (SMTA) of the International Treaty on Plant Genetic Resources for Food and Agriculture (ITPGRFA) of the FAO.
2.3. Treatments and Experimentation
The experiment was conducted over two seasons: the normal (November–January/February 2023/24) and the summer (April–June/July 2024). In each season, genotypes were evaluated under three treatments: fresh water with 100% irrigation (ENV1), fresh water with 50% irrigation (ENV2), and saline water with an electrical conductivity of 10 dS/m (ENV3). The experiments followed a randomized complete block design (RCBD) with three replications. Each plot consisted of two rows, each 3 m long, with 30 cm spacing between rows and 25 cm between plants. Irrigation was managed using a drip irrigation system connected to an automated Supervisory Control and Data Acquisition (SCADA) system to control water quantity and quality (ICBA) precisely. Drip Irrigation system of the plots was controlled by SCADA system, which consists of sensors and smart flowmeters that control the required amount of water to the exact plot in exact time. The system also works on 3.5 bars constant pressure. Inline drip tubing with 4LPH discharge was used in the experiment. Eurodrip has pressure compensating emitters which has the same discharge between 1 and 4 bar operating pressures, even though the lateral line for risers were kept at a diameter of 50 mm for an even distribution of water to the extreme end of the drip line. Compression male adapters were used instead of gromets to avoid any type of leakage in the system. Regular inspections were carried out by an irrigation team for leakage. Discharge of emitters were also measured by selecting random emitters in the start, mid, and last emitters of a polyline. Presowing irrigation was applied one day before sowing. In each plot, 2–3 seeds were sown at each dripper on a flat sand bed at a depth of 1.5 cm. A single weeding operation was performed 30 days after sowing across all treatments in both seasons. Irrigation quantities were based on crop coefficients derived from evapotranspiration measurements under local conditions. During the normal and summer seasons, 5.33 mm and 6.40 mm of water were supplied daily for ENV1 and ENV3, respectively. For ENV2, the irrigation was set at half the amount provided to ENV1 or ENV3 (Figure S1).
2.4. Crop Water Requirements
The irrigation requirement was calculated by using the FAO Penman–Monteith equation [24]
where the following are represented: ETo is the reference evapotranspiration [mm day−1]; Rn is the net radiation at the crop surface [MJ m−2 day−1]; G is the soil heat flux density [MJ m−2 day−1]; T is the air temperature at a 2 m height [°C]; u2 is the wind speed at a 2 m height [m s−1]; es is the saturation vapor pressure [kPa]; ea is the actual vapor pressure [kPa]; es − ea is the saturation vapor pressure deficit [kPa]; D is the slope vapor pressure curve [kPa °C−1]; and g is the psychrometric constant [kPa °C−1].
Daily meteorological data from the ICBA weather station were used to calculate ETo, including daily maximum (Tmax) and minimum (Tmin) air temperature, mean wind speed (u2), maximum (RHmax) and minimum (RHmin) relative humidity, and net radiation (Rn).
Daily ETo was calculated over the last 5 years, and the average of these daily values was used to determine the crop evapotranspiration (ETc):
The calculation of ETc involved identifying specific crop growth stages and the duration of each growth stage. The crop coefficient (Kc) values were obtained from the FAO 56 guidelines, with values adjusted for different crop growth stages.
2.5. Application of Saline Water for Irrigation
Two sources of water were available for irrigation. The first source was fresh water supplied by DEWA (Dubai Electricity and Water Authority), with a salinity level of 0.2 dS/m. The second source was groundwater, with a high salinity level of 23 dS/m. For the experiment, the crop was irrigated with water at a target salinity of 10 dS/m, achieved by mixing fresh and saline water using a specific mixing formula.
Phenotypic data were recorded on a plot basis for each replication, capturing the following traits: days to flowering (DF), days to maturity (DM), plant height (PH), green fodder yield (FY), grain yield (GY), chaffy grain yield (CGY), and 1000-grain weight (TGW) or grain size. Flowering was recorded when 50% of the plants in a plot showed panicle emergence, while maturity was noted when 50% of panicles in a plot had reached physiological maturity. The PH and GY were measured when the plants in each plot reached maturity. The mature panicles were hand-threshed and cleaned by winnowing.
High temperatures during the summer season led to the formation of chaffy or unfilled grains in the panicles across genotypes. Both GY and CGY were converted to kg/ha for analysis.
2.6. Statistical Analysis
Data analysis was conducted using R statistical software version 4.4.1 [25] and Python programming language version 3.12.6 [26]. The main effects of genotype, environment (treatments), and genotype-by-environment (G × E) interaction were estimated through a combined analysis of variance (ANOVA) for both the normal and summer seasons. The ANOVA model included replication (REP), genotype (GEN), environment (ENV), and their interaction as factors, using the formula Trait ~ REP + GEN × ENV. Python’s statsmodels v0.14.3 package [27] was employed for model fitting, following standard procedures described by [28]. This analysis treated genotypes as fixed variables, while environments were treated as random variables. The significance of effects was evaluated based on p-values, with significance levels indicated by stars (* for p < 0.05, ** for p < 0.01, *** for p < 0.001). The results were summarized, and their contributions to the total sum of squares (TSS%) were calculated. Significant G × E interactions were observed for the target trait in the ANOVA, prompting further analysis using additive main effects and multiplicative interaction (AMMI) and genotype × environment (GGE) biplots to identify high-performing, stable, and environment-specific genotypes under both seasonal conditions at the target location. The original datasets underwent quality checks before AMMI and GGE biplot modeling in RStudio, as developed by the R Core Team [29]. Multivariate stability analysis was performed on GGE biplots and AMMI to graphically interpret the G × E interactions, enabling the ranking of genotypes and environments based on both mean performance and stability [18].
Due to extreme variability in phenotypic data across and within treatments during the summer season, primarily driven by cumulative water stress, salinity, and repeated episodes of heat stress, grain yield data were standardized. Yields ranged from 0 to 100 kg ha−1 under salinity treatment, 0 to 200 kg ha−1 with 50% irrigation, and 0 to 810 kg ha−1 with 100% irrigation. This high variability caused genotypes to cluster closely at the origin in the GGE biplot, limiting interpretability. To address this, z-score normalization was applied to standardize the data. This method transforms data so that they have a mean of 0 and a standard deviation of 1, transforming each value Z as follows:
where the following is represented:
X is the original data point.
μ is the mean of the dataset.
σ is the standard deviation of the dataset.
Z is the standardized value, representing how many standard deviations the original value is from the mean.
Standardization was used to eliminate the effect of differing scales while preserving the original data distribution, maintaining the original shape of the data distribution, and being especially useful when the data follow a normal (Gaussian) distribution [30,31].
3. Results and Discussion
3.1. Combined Analysis of Variance
Analysis of variance (ANOVA) was used to determine the statistical significance of differences among treatments, genotypes, and their interactions. ANOVA provides a robust framework for partitioning the total variation in the data into components attributable to these factors, highlighting key sources of variability. The combined analysis of variance revealed that the genotype, environment, and genotype × environment (G × E) interactions were significant for both grain yield (GY) and chaffy grain yield (CGY) in both the normal and summer seasons (Table 2). The genotype component accounted for 77.69% of the variation in GY during the normal season, indicating substantial genetic diversity among the tested entries. This finding aligns with Yazdizadeh et al. [32], who reported significant genetic variability in proso millet, emphasizing the potential for selecting high-yielding genotypes. The significant G × E interactions, contributing 50.03% to GY and 39.48% to CGY, suggest that genotypes respond differently across environments. This is consistent with findings in other small millets; for instance, a study on finger millet by Anuradha et al. [33] highlighted the importance of evaluating G × E interactions to identify stable genotypes across diverse conditions. The non-significant replication effects and low error variance for both GY and CGY indicate effective control of random variation by the experimental design, enhancing the reliability of the results. This methodological robustness is crucial for accurate genotype performance assessment, as emphasized in their study on proso millet.
Table 2.
A combined analysis of variance was performed on grain yield (GY) and chaffy grain yield (CGY) traits during normal and summer seasons. df, degrees of freedom; GY, grain yield; CGY, chaffy grain yield.
The highly significant genotype effects (p ≤ 0.001) for GY and CGY suggest that breeders can achieve substantial genetic gains by selecting superior genotypes with favorable yield traits, such as higher grain yield and reduced chaffy grain production. This is supported by research on little millet [33], which demonstrated that selecting genotypes with desirable traits can significantly improve yield and quality.
These findings provide valuable insights for breeding strategies in proso millet and other small millets. The significant genotype effects, combined with substantial G × E interactions, underscore the importance of multi-environment testing to identify genotypes that exhibit high yield potential and maintain stability across diverse environmental conditions. This approach is essential for developing resilient cultivars that sustain productivity under varying climatic scenarios.
3.2. Genotype-by-Environment Interactions
GGE biplot analysis was employed to visualize the performance and stability of genotypes across environments. This method combines genotype (G) and genotype-by-environment interaction (GE) effects into a single biplot, making it particularly effective for identifying ideal genotypes and environments. The “mean vs. stability” view was used to evaluate genotypes based on their mean performance and stability, while the “ideal genotype” assessment identified those closest to the individual environmental mean. Understanding the relationship between environments and genotype performance under stress conditions is essential for proso millet’s successful expansion into diverse agroecological zones. As represented in Figure 2, the analysis highlights three environments (ENV1, ENV2, and ENV3) plotted as vectors, with principal component axes capturing over 98% and 84% of the total variation in the normal and summer seasons, respectively. This high percentage reflects robust data representation. Such visual analyses are widely used for interpreting genotype-by-environment (G × E) interactions and identifying genotypes with stable performance. The angles between environment vectors in the normal season reveal close associations, with ENV1 and ENV2 and ENV2 and ENV3 exhibiting angles under 45°, suggesting strong correlations and similar environmental influences on genotype performance. In comparison, in the summer season, only ENV2 and ENV3 display this close correlation, while ENV1 shows a distinct pattern from ENV2 and ENV3 due to its unique stress factors. This distinction aligns with findings by Sanku et al. [34] in small millets, who reported that environmental stresses such as heat and water deficit can create distinct response patterns, impacting genotype performance consistency across varied conditions.
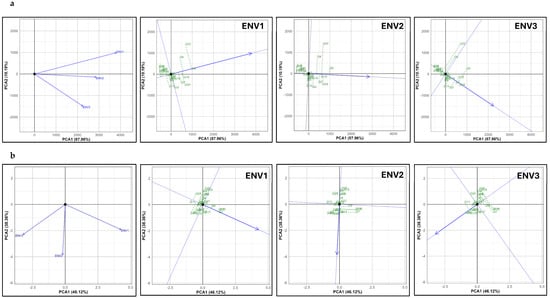
Figure 2.
Relationship among three environments and grain yield performance of genotypes in ENV1 (fresh water 100% irrigation), ENV2 (fresh water 50% irrigation), and ENV3 (salinity 10 dS/m) conditions under (a) normal and (b) summer seasons.
Genotypes were ranked according to grain yield performance in each environment across the normal (Figure 2a) and summer (Figure 2b) seasons. The line (with an arrow) that passes through the biplot origin and the environment is called the axis for the environment [35], and along this axis, genotypes are ranked. In the normal season, genotypes G9 and G24 yielded higher than the mean yield in ENV1, ENV2, and ENV3, highlighting their adaptability across different conditions. This approach to ranking genotypes along the environmental axis has been effectively used in studies to evaluate yield stability, as described by Gauch et al. [36], who emphasized that the biplot method offers a transparent and interpretable way of assessing genotype stability across multiple environments. Such methods are beneficial for identifying genotypes with broad adaptability, providing valuable insights for breeding programs targeting multi-environment resilience.
In the summer season, multiple stresses (e.g., elevated temperature, water stress, and salinity) severely impacted yields, with distinct variations across environments. In ENV1, which primarily featured heat stress, yields ranged between 32.1 and 810.2 kg ha−1. Under combined heat and water stress in ENV2, the top genotypes yielded between 80 and 100 kg ha−1, whereas in ENV3, with added salinity, yields were further reduced to 20–25 kg ha−1. This performance decline highlights the vulnerability of proso millet to combined stresses, particularly during the reproductive phase, which affects grain filling. The impact of combined stresses on the genotype performance in proso millet or other millet crops is understudied. However, the reproductive impairment observed in proso millet is likely due to the formation of non-viable pollen grains [37] and damage to ovarian tissues [38] under high temperatures (40–42 °C), which mirrors similar findings in sorghum. These factors can lead to complete sterility and significant yield losses.
In ENV3 (combined heat and salinity stress), genotypes G19 and G20 produced only chaffy, unfilled grains, indicating severe reproductive stress under these conditions. Genotype G24 failed to produce flowers, underscoring the harsh impact of combined stress factors on flowering and grain-filling processes and categorizing them as the most sensitive genotypes. However, the crop exhibited resilience under ENV1, where heat stress was the primary factor. Genotypes G7, G10, and G12 yielded over 750 kg ha−1 despite high temperatures but showed moderate performance under ENV2 and 3, suggesting inherent tolerance to heat stress alone. Studies on heat-stressed environments in millets support these findings, as they demonstrated that specific genotypes could withstand high temperatures but showed decreased resilience when water or salinity stress was introduced [39].
3.3. Mean vs. Stability Analysis and Assessment of Ideal Genotype
In this study, the GGE biplot “mean vs. stability” analysis explained 98.15% of the total variation in grain yield for the normal season (Figure 3a), 84.53% for grain yield, and 94.82% for chaffy grain under the summer season (Figure 3b). The average-environment axis (AEA) or AEC abscissa, indicated by the single-arrowed line, reflects the mean yield across the three environments. The proximity of ENV2 to the AEA suggests it had the highest alignment with the season mean yield, offering a consistent reference for evaluating genotypes. This approach aligns with Yan and Tinker’s [35] findings, emphasizing the AEA’s role in GGE biplots for accurately identifying high-yielding, stable genotypes across environments. In the normal season, genotype G9 displayed high mean yield and stability, followed by G24 and G18, with G6, G5, and G23 near the grand mean. G14 and G16 showed the lowest mean yields. The combination of high yield and stability in the G9 genotype suggests its potential as a broadly adaptable cultivar, an essential trait for multi-environment cultivation [35]. Conversely, genotypes G22 and G4, though high yielding, showed low stability due to their distance from the AEA, reflecting significant environmental interactions. These findings echo Torres-Ordoñez et al. [40], who observed that high-yielding genotypes may not consistently demonstrate stability due to environmental variability. It is essential to balance yield with stability when selecting ideal genotypes.
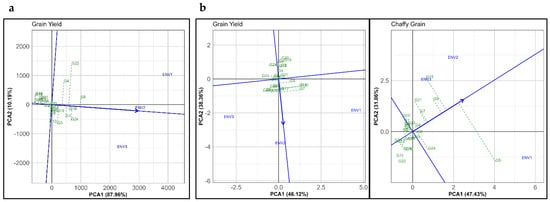
Figure 3.
“Mean vs. stability” pattern of GGE biplot illustrating interaction effect of 24 proso millet genotypes evaluated under three environments in the (a) normal and (b) summer seasons for grain yield (GY) and chaffy grain (CGY). The biplots were generated using Column Metric Preserving SVP and Tester-Centered G + GE with no scaling.
In the summer season, under combined stress conditions, genotypes G15, G23, and G5 exhibited higher mean yields. At the same time, G24 had the lowest mean yield (Figure 3b). Genotype G7 displayed high variability, performing well in ENV1 but inconsistently in other environments, indicating that stress-specific adaptability may vary significantly among genotypes. This observation aligns with Sun et al. [41], who reported similar variability in millet crops under drought and heat stress, emphasizing identifying genotypes with specific tolerance profiles for environments prone to such conditions.
The mean yield (AEA) in the summer season aligned closely with ENV2’s performance, suggesting that ENV2 serves as a representative environment under moderate stress conditions. However, the combination of water deficit, high temperature, and salinity in ENV3 significantly reduced mean yields and increased chaffy grains production. This aligns with the work of Chellapilla et al. [42] and Srividhya et al. [43], who reported that high temperatures and salinity together increase the likelihood of unfilled grains, severely impacting reproductive development in millet crops. Genotype G5 produced a high quantity of chaffy grains, reflecting its susceptibility to stress-induced grain-filling issues, while G16 and G19 exhibited both low chaffy grain production and reduced variability. These genotypes, closer to the origin on the biplot and with shorter projections from the AEA, emerge as promising candidates for enhanced tolerance to moisture stress, heat, and salinity.
Interestingly, most genotypes tested under salinity in the summer season were able to produce seeds, with exceptions like G19, G20, and G24. This suggests variable tolerance among genotypes to concurrent stress factors, providing valuable insights for breeding programs focused on developing resilient proso millet varieties for challenging environments. Chaffy grains in pearl millet often increase under combined heat and drought stresses, reducing yield quality [43]. Similarly, optimizing maturity timing in finger millet remains critical to avoiding yield penalties during the cropping season [44].
3.4. Which-Won-Where Pattern of GGE Biplot
The GGE biplot analysis (Figure 4) presents the performance of 24 genotypes under different environmental conditions across the normal and summer seasons, focusing on GY and CGY. Figure 4a represents GY in the normal season; both PCAs explained a total of 98.15% variation. The positioning of the environments (ENV1, ENV2, and ENV3) reveals differential genotype performance across them, with ENV1 located on the positive side of both PCA1 and PCA2, suggesting that genotypes aligned with this direction perform better in ENV1. In contrast, ENV2 and ENV3 are situated on the negative side of PCA1, indicating that these genotypes are less suitable in these environments. Genotypes G9 and G24, positioned along ENV2, represent their robust performance under this specific environment. Meanwhile, genotypes such as G9 and G22, closer to ENV1, exhibit high adaptation to this environment. Genotypes G9, G24, and G7, located closer to ENV3, suggest an advantage in that environment under the normal season conditions.
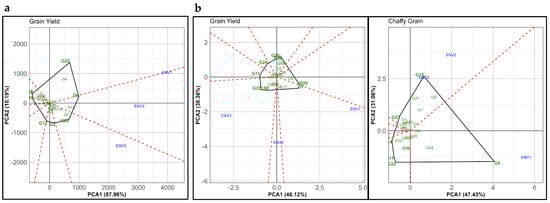
Figure 4.
Polygon view of GGE biplot displaying the ‘Which-won-where’ pattern of genotype main effect and G × E interaction effects in 24 proso millet genotypes evaluated under three different environments in the (a) normal and (b) summer seasons for grain yield (GY) and chaffy grain (CGY). The biplots were generated using Column Metric Preserving SVP and Tester-Centered G + GE with no scaling.
In Figure 4b, representing GY in the summer season, PCA1 and PCA2 explained 46.12% and 38.35% of the variation, respectively. The clustering of the environments (ENV1, ENV2, and ENV3) in this plot suggests reduced variation in genotype performance across different environments compared to the normal season, reflecting a more consistent genotype-by-environment interaction in summer. Nonetheless, specific genotypes such as G7 and G10 showed higher performance under ENV1, while G5, G17, and G23 were favorable for ENV2 and ENV3, indicating environment-specific adaptation. Similarly, PCA1 and PCA2 explained 65.49% of the variation in CGY. In this plot, ENV1 was distinctly separated from ENV2 and ENV3, revealing specific genotype responses to environmental conditions for CGY. Genotype G5, positioned close to ENV1, indicates a large amount of CGY was produced under this environment, while genotypes G14 and G23 produced less CGY. This result highlights that CGY, often influenced by environmental stress, particularly benefits from genotype-specific adaptation, underscoring the impact of environmental factors on trait expression in the summer season.
Comparing the normal and summer seasons, it becomes evident that the genotype performance across environments in the normal season is more variable, with certain genotypes showing high adaptation to specific environments, such as G9 in ENV1 and ENV2. In contrast, the summer season presents a more homogenous response across environments due to the severe negative impact of stresses, as indicated by the closer clustering of environments. This reduced environmental differentiation in the summer season might reflect stress adaptation traits across genotypes, as the summer conditions exerted drought, heat, and salinity stresses on the genotypes. This finding aligns with previous studies that reported genotype stability under stress conditions due to adaptive traits that buffer environmental variations [45]. Our findings align with previous studies on proso millet and other small millets, highlighting genotype-specific adaptations to varying environmental conditions, especially under stress [46,47]. For example, proso millet genotypes have demonstrated significant yield stability and adaptability across diverse environments, exhibiting distinct performance patterns under stressors like drought and high temperatures [48]. Similarly, genotype-specific responses in proso millet under varying water stress conditions reinforced that environmental stress could enhance adaptive traits, ensuring consistent performance across environments [47].
3.5. Discriminativeness vs. Representativeness Pattern of GGE Biplot
The GGE biplots display the “Discriminativeness vs. Representativeness” pattern genotypes under three environments in both the normal and summer seasons, specifically focusing on GY and CGY (Figure 5). Genotypes such as G22, located farther from the origin, exhibit high discrimination ability and align closely with the ideal genotype for ENV1, suggesting they perform well in that environment with favorable yield stability. ENV2 and ENV3, positioned along the negative side of PCA1, indicate differential responses in genotype performance, highlighting specific adaptability patterns among genotypes such as G24, G7, and G18. These results align with previous findings demonstrating genotype-specific adaptation and stability across different environments in small millets under the normal seasonal conditions [49].
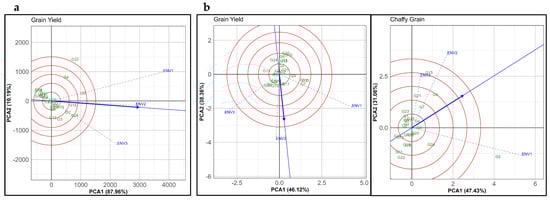
Figure 5.
The GGE biplot showing the “Discriminativeness vs. Representativeness” pattern for genotype comparison with ideal genotype in 24 proso millet genotypes evaluated under three environments in the (a) normal and (b) summer seasons for grain yield (GY) and chaffy grain (CGY). The biplots were generated using Column Metric Preserving SVP and Tester-Centered G + GE with no scaling.
In Figure 5b for GY in the summer season, the environments are positioned closer to each other compared to the regular season, suggesting a more consistent genotype performance across environments. This clustering of environments could reflect the effect of summer-season stresses, such as drought, heat, and salinity, reducing the distinctiveness of genotypic responses across environments. Genotype G7 is close to ENV1, indicating a robust performance in this environment, while G15 and G23 show favorable adaptation to ENV2 and ENV3, respectively. These findings are consistent with Guo et al. [45], who reported that stress conditions often lead to convergent performance patterns among genotypes due to adaptive traits that mitigate environmental variability.
The third plot focuses on CGY in the summer season, where ENV2 and ENV1 are distinctly separated from ENV1, emphasizing that genotype response was distinct for the formation of chaffy grains. Genotype G15, located far along the positive PCA1 axis near ENV2, exhibits high discriminativeness and produces more amount of chaffy grains when water and heat stress were applied, while G5 and G24, positioned closer to ENV1, indicating that these genotypes were sensitive to heat stress alone. This response pattern aligns with findings in Ventura et al. [47], which demonstrated that specific genotypes of proso millet and other small millets exhibit varying levels of chaffy grain production depending on the environment, particularly under stress conditions.
During the normal growing season, maximum surface temperatures exceeding 35 °C were recorded during the early vegetative phase, lasting approximately 15 days. In contrast, during the summer, extreme temperatures surpassing 35 °C, peaking at 49.2 °C, coincided with critical crop stages such as flowering and grain filling. These extreme conditions, particularly under saline treatments, were associated with significantly increasing chaffy grains. Similar impacts have been reported in finger millet, where a high-temperature stress of 38 °C during reproductive stages reduced seeds per panicle by 95% and seed yield per panicle by 97% [50]. Mean maximum temperatures during the flowering-to-maturity period averaged 43 °C in the summer compared to 28 °C in the normal season. Despite these harsh summer conditions, genotypes G7, G10, and G12 displayed remarkable resilience, achieving yields exceeding 0.75 t ha−1.
Under normal freshwater irrigation (ENV1), the mean yield of the 24 genotypes reached 1.11 t ha−1. In contrast, under summer conditions (ENV1), yields dropped sharply by 79% (0.24 t ha−1) due to high temperatures during critical crop growth phases. Such thermal stress severely restricts photosynthate allocation to reproductive organs, reducing grain yield and increasing sterility rates [51,52]. In addition, salinity stress compounds these effects by hindering water uptake and disrupting nutrient balance, contributing to additional reductions in grain formation [53]. In the normal season, mean crop yields declined by 23% under 50% irrigation (ENV2) and by 17% under salinity conditions (ENV3) compared to full irrigation with fresh water (ENV1). Similar studies in pearl millet reported a yield reduction of 72% [54] and 12–49% [55] under water stress.
While in the summer, proso millet yields decreased more drastically, by 79% under 50% irrigation (ENV2) and 96% under salinity conditions. Therefore, the combined impact of heat and salinity stress presents a significant threat to yield stability. This heat and salinity stress pattern in proso millet emphasizes the importance of developing stress-resilient cultivars. Research in small millets highlights the potential for genetic improvements to enhance heat and salinity tolerance during crucial growth stages, an essential strategy for mitigating the adverse effects of climate variability [56].
The findings further emphasize the importance of selecting genotypes that balance high yield with stability and lower production of chaffy grains under stress conditions, supporting previous studies on the adaptability and resilience of millets [46,47]. This insight is critical for breeding programs that improve stress resilience in proso millet and other small millets, particularly in regions prone to climate variability.
3.6. Key Relationships Among Environments
The correlation analysis across three environments (ENV1, ENV2, and ENV3) in the normal and summer seasons highlights key associations between GY and various plant traits. Under the normal season (Figure 6a) of ENV1, GY shows a strong positive correlation with FY (r = 0.92 **) and a moderate association with PH (r = 0.58 **), indicating that higher biomass and taller plants may enhance GY. This is consistent with findings from Anuradha et al. [33] and Yazdizadeh et al. [32], who observed a similar positive correlation between biomass yield and GY in proso millet, attributing this to increased photosynthetic resource allocation, which directly supports grain filling. Similar studies in proso millet also highlighted the role of plant height: Taller genotypes have better light interception, improving overall growth and yield potential [48,57]. These results suggest that managing plant traits such as biomass and plant height can effectively improve GY in proso millet and other small millets.
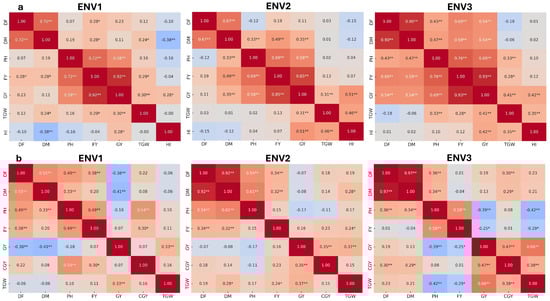
Figure 6.
Heat map showing the Pearson’s correlation coefficient (r) between selected traits under ENV1, ENV 2, and ENV 3 in (a) normal and (b) summer seasons. * p < 0.05; ** p < 0.01; DF, days to flowering; DM, days to maturity; PH, plant height; FY, fodder yield; GY, grain yield; CGY, chaffy grain yield; TGW, 1000-grain weight; and HI, harvest Index.
In ENV2, GY maintains a robust correlation with FY (r = 0.85 **) and shows moderate positive associations with PH (r = 0.58 **) and TGW (r = 0.31 **), suggesting that both biomass and grain size contribute to yield. Earlier studies indicated that a larger grain size, as reflected by higher TGW, significantly contributes to yield potential in proso millet [58] and foxtail millet [59], reinforcing the importance of grain size across small millets. In ENV3, GY correlates strongly with FY (r = 0.93) and positively with PH (r = 0.69 **) and DM (r = 0.54 **), showing that both PH and fodder yield can contribute to yield. Although the association between DM and HI in the current study was non-significant (r = 0.02), it contrasts with findings by Wolie and Tadesse [44], who observed a more notable negative association between DM and HI in finger millet. Their study suggested that extended maturity phases in certain millet types could reduce HI, as resources may be diverted to vegetative growth rather than grain filling. While the current study did not find a substantial trade-off, this insight from other millets underscores the importance of carefully managing growth duration to optimize yield.
Under the summer season (Figure 6b) of ENV1, GY has a moderate negative correlation with DM (r = −0.41 **) and a positive association with TGW (r = 0.33 **), indicating that delayed maturity may hinder yield, while a larger grain size improves it. This finding aligns with a previous study [59], which indicates that a larger TGW benefits yield, as grain size contributes more effectively to overall yield. Additionally, the negative relationship between DM and GY suggests that managing the maturity period is crucial to avoid yield penalties associated with extended vegetative growth under the summer conditions. In ENV2, GY shows a moderate positive correlation with CGY (r = 0.35) and TGW (r = 0.37 **) under drought and heat stress conditions. While TGW is a favorable trait for yield, the positive correlation with CGY suggests a complex interaction. High CGY is not beneficial, as it often represents non-productive grains that do not contribute directly to harvestable yield. The slight positive association may indicate that, under stress, plants allocate resources to CGY, potentially as a survival mechanism, but this can come at the expense of actual grain yield. Wang et al. [60] observed that, although CGY may act as a temporary nutrient buffer, its contribution to yield is limited, as non-viable grains can reduce overall grain quality and marketable yield. In ENV3, GY also shows a positive correlation with CGY (r = 0.47 **) and a stronger association with TGW (r = 0.66 **), again highlighting the beneficial role of grain size in yield, even as CGY increases. However, the negative impact of CGY on grain yield remains, as CGY typically represents a yield inefficiency where resources are allocated to unfilled grains. PH negatively associates with TGW (r = −0.42 **), suggesting that taller plants may produce smaller grains in this environment. While promising genotypes were identified, the study faced certain limitations. The salinity level was limited to 10 dS/m, which constrained the ability to quantify the genotypes’ threshold tolerance and full variability. Additionally, during the summer season, the combined effect of high-temperature stress and salinity significantly impacted most genotypes, reducing yields and limiting the expression of their genetic potential.
4. Conclusions
The study highlights the significant impact of heat, drought, and salinity stress on proso millet yields, with drastic reductions observed during the summer season, particularly under combined stresses. Genotypes such as G22 showed high stability under optimal conditions, while G15, G24, and G7 exhibited specific adaptability to stressed environments. Critical growth stages like booting, panicle emergence, and flowering were most affected, leading to increased chaffy grain production and reduced grain yields. Despite these challenges, resilient genotypes like G7, G10, and G12 maintained relatively high yields, demonstrating their potential for stress-prone environments. These findings underscore the importance of developing stress-resilient cultivars with enhanced heat and salinity tolerance to ensure yield stability in regions vulnerable to climate variability. During the normal season, temperatures were moderate (Tmax: 29.5 °C and Tmin: 16.4 °C), while the summer season experienced extreme heat (Tmax: 40.3 °C and Tmin: 24.8 °C), with peaks reaching 49.2 °C. The reproductive phase was particularly vulnerable, with 88% (62 out of 70 days) of this period experiencing surface maximum temperatures above 40 °C. These extreme conditions coincided with critical growth stages, significantly reducing 1000-seed weight, grain yield, and fodder yield while increasing chaffy grain production. The correlation analysis highlights key trait–yield relationships in proso millet across diverse environments. In the normal season, GY strongly correlated with FY and PH, emphasizing the importance of biomass and plant height for yield. TGW also contributed to GY in stressed environments, reinforcing its role in yield resilience. Under summer stress, delayed maturity negatively impacted GY, while TGW remained a key positive driver. The moderate positive correlation between GY and CGY under stress suggests resource allocation trade-offs, with non-productive grains reducing efficiency. These insights underline the need to prioritize traits like biomass, plant height, and TGW while minimizing chaffy grains for breeding stress-resilient proso millet. Developing mapping populations from the identified stress-tolerant and sensitive genotypes will enable the detection of large-effect QTLs, which are promising candidates for enhancing stress tolerance in proso millet improvement programs. Additionally, multilocation testing of these genotypes will improve our understanding of target population environments (TPEs) and optimize production areas.
Supplementary Materials
The following supporting information can be downloaded at https://www.mdpi.com/article/10.3390/agronomy15010165/s1, Table S1: List of genotypes and the respective codes used in the GGE biplot analysis, Figure S1: Evaluation of proso millet genotypes under field conditions during normal season across different environmental treatments.
Author Contributions
S.S., R.K.S. and L.A.B.L.-L. designed and implemented the experiments; S.G., S.S. and A.G. performed the data analysis and interpretation of results; S.T. identified the entries for conducting the study and multiplied the seed; D.N.K. arranged automation of the field irrigation system; S.S. and S.G. drafted the original manuscript; all authors revised the manuscript. All authors have read and agreed to the published version of the manuscript.
Funding
Funding was received from the core donors, the UAE government and the Islamic Development Bank (IsDB), to research underutilized millet and legumes (Project code IP035).
Data Availability Statement
Data and materials are available upon reasonable request.
Acknowledgments
The authors are grateful to the Field Research Technicians, Reenu Noushad, Bala G. Samy, Saif El Islam, and Iftikhar Ali, for their efforts during the summer season field operations. The authors also thank Velmurugan Arumugam, the irrigation technician at ICBA.
Conflicts of Interest
The authors declare no conflicts of interest.
References
- Foster, S.; Loucks, D.P. Non-Renewable Groundwater Resources: A Guidebook on Socially-Sustainable Management for Water-Policy Makers; IHP-VI Series on Groundwater; United Nations Educational; Scientific and Cultural Organization: Paris, France, 2006; Volume 10. [Google Scholar]
- Murad, A.A. An Overview of Conventional and Non-Conventional Water Resources in Arid Region: Assessment and Constrains of the United Arab Emirates (UAE). J. Water Resour. Prot. 2010, 2, 181–190. [Google Scholar] [CrossRef]
- Evans, J.P. 21st Century Climate Change in the Middle East. Clim. Change 2009, 92, 417–432. [Google Scholar] [CrossRef]
- FAOSTAT. Food and Agriculture Organization Statistical Database. Available online: https://www.fao.org/faostat/en/#home (accessed on 13 November 2024).
- Kalinova, J.; Moudry, J. Content and Quality of Protein in Proso Millet (Panicum miliaceum L.) Varieties. Plant Foods Hum. Nutr. 2006, 61, 43–47. [Google Scholar] [CrossRef]
- Das, S.; Khound, R.; Santra, M.; Santra, D.K. Beyond Bird Feed: Proso Millet for Human Health and Environment. Agriculture 2019, 9, 64. [Google Scholar] [CrossRef]
- Habiyaremye, C.; Matanguihan, J.B.; D’Alpoim Guedes, J.; Ganjyal, G.M.; Whiteman, M.R.; Kidwell, K.K.; Murphy, K.M. Proso Millet (Panicum miliaceum L.) and Its Potential for Cultivation in the Pacific Northwest, U.S.: A Review. Front. Plant Sci. 2017, 7, 1961. [Google Scholar] [CrossRef]
- Cavers, P.B.; Kane, M. The Biology of Canadian Weeds: 155. Panicum miliaceum L. Can. J. Plant Sci. 2016, 96, 939–988. [Google Scholar] [CrossRef]
- Agdag, M.; Nelson, L.; Baltensperger, D.; Lyon, D.; Kachman, S. Row Spacing Affects Grain Yield and Other Agronomic Characters of Proso Millet *. Commun. Soil. Sci. Plant Anal. 2001, 32, 2021–2032. [Google Scholar] [CrossRef]
- Lu, H.; Zhang, J.; Liu, K.; Wu, N.; Li, Y.; Zhou, K.; Ye, M.; Zhang, T.; Zhang, H.; Yang, X.; et al. Earliest Domestication of Common Millet (Panicum miliaceum) in East Asia Extended to 10,000 Years Ago. Proc. Natl. Acad. Sci. USA 2009, 106, 7367–7372. [Google Scholar] [CrossRef]
- Joshi, R.P.; Jain, A.K.; Malhotra, N.; Kumari, M. Chapter 4—Origin, Domestication, and Spread. In Millets and Pseudo Cereals; Singh, M., Sood, S., Eds.; Woodhead Publishing: Sawston, UK, 2021; pp. 33–38. ISBN 978-0-12-820089-6. [Google Scholar]
- Nielsen, D.C.; Vigil, M.F. Water Use and Environmental Parameters Influence Proso Millet Yield. Field Crops Res. 2017, 212, 34–44. [Google Scholar] [CrossRef]
- Lyon, D.J.; Burgener, P.A.; DeBoer, K. Producing and Marketing PROSO MILLET PROSO MILLET in the Great Plains; University of Nebraska-Lincoln Extension: Lincoln, NE, USA, 2008; Available online: https://digitalcommons.unl.edu/extensionhist/4794 (accessed on 13 November 2024).
- U.S. Department of Agriculture (USDA). Food Data Central. Available online: https://fdc.nal.usda.gov/ (accessed on 13 November 2024).
- UAE National Food Security Strategy 2051. Available online: https://u.ae/en/about-the-uae/strategies-initiatives-and-awards/strategies-plans-and-visions/environment-and-energy/national-food-security-strategy-2051 (accessed on 13 November 2024).
- Gabriel, K.R. The Biplot Graphic Display of Matrices with Application to Principal Component Analysis. Biometrika 1971, 58, 453–467. [Google Scholar] [CrossRef]
- Yan, W.; Hunt, L.A.; Sheng, Q.; Szlavnics, Z. Cultivar Evaluation and Mega-Environment Investigation Based on the GGE Biplot. Crop. Sci. 2000, 40, 597–605. [Google Scholar] [CrossRef]
- Yan, W.; Kang, M.S. GGE Biplot Analysis, 1st ed.; Yan, W., Kang, M.S., Eds.; CRC Press: Boca Raton, FL, USA, 2002; ISBN 9780429122729. [Google Scholar]
- AL-Shammary, A.A.G.; Kouzani, A.Z.; Kaynak, A.; Khoo, S.Y.; Norton, M.; Gates, W. Soil Bulk Density Estimation Methods: A Review. Pedosphere 2018, 28, 581–596. [Google Scholar] [CrossRef]
- RICHARDS, L.A. Diagnosis and Improvement of Saline and Alkali Soils. Soil. Sci. 1954, 78, 154. [Google Scholar] [CrossRef]
- Walkley, A. A Critical Examination of a Rapid Method for Determining Organic Carbon in Soils Effect of Variations in Digestion Conditions and of Inorganic Soil Constituents. Soil. Sci. 1947, 63, 251–264. [Google Scholar] [CrossRef]
- FAO. Soil Testing Methods Manual; FAO: Rome, Italy, 2020. [Google Scholar]
- Soil Science Division Staff. Soil Survey Manual; Ditzler, C., Scheffe, K., Monger, H.C., Eds.; Government Printing Office: Washington, DC, USA, 2017. [Google Scholar]
- Allen, R.G.; Pereira, L.S. Crop Evapotranspiration (Guidelines for Computing Crop Water Requirements); FAO: Rome, Italy, 1998. [Google Scholar]
- R Core Team A Language and Environment for Statistical Computing. R Foundation for Statistical Computing. Available online: https://www.R-project.org/ (accessed on 13 November 2024).
- Van Rossum, G. Python Programming Language. In Proceedings of the USENIX Annual Technical Conference, Santa Clara, CA, USA, 17–22 June 2007; pp. 1–36. [Google Scholar]
- Seabold, S.; Perktold, J. Statsmodels: Econometric and Statistical Modeling with Python. In Proceedings of the 9th Python in Science Conference, Austin, TX, USA, 28 June–3 July 2010; pp. 57–61. [Google Scholar]
- Fisher, R.A. Statistical Methods for Research Workers; Springer: New York, NY, USA, 1992; pp. 66–70. [Google Scholar]
- R Studio Integrated Development Environment for R (Computer Software v0.98.1074). Available online: https://www.rstudio.org/ (accessed on 13 November 2024).
- Kuhn, M.; Johnson, K. Data Pre-Processing. In Applied Predictive Modeling; Kuhn, M., Johnson, K., Eds.; Springer: New York, NY, USA, 2013; pp. 27–59. ISBN 978-1-4614-6849-3. [Google Scholar]
- Ioffe, S.; Szegedy, C. Batch Normalization: Accelerating Deep Network Training by Reducing Internal Covariate Shift. arXiv 2015, arXiv:1502.03167. [Google Scholar]
- Yazdizadeh, M.; Fahmideh, L.; Mohammadi-Nejad, G.; Solouki, M.; Nakhoda, B. Association Analysis between Agronomic Traits and AFLP Markers in a Wide Germplasm of Proso Millet (Panicum miliaceum L.) under Normal and Salinity Stress Conditions. BMC Plant Biol. 2020, 20, 427. [Google Scholar] [CrossRef] [PubMed]
- Anuradha, N.; Patro, T.S.S.K.; Singamsetti, A.; Sandhya Rani, Y.; Triveni, U.; Nirmala Kumari, A.; Govanakoppa, N.; Lakshmi Pathy, T.; Tonapi, V.A. Comparative Study of AMMI- and BLUP-Based Simultaneous Selection for Grain Yield and Stability of Finger Millet [Eleusine coracana (L.) Gaertn.] Genotypes. Front. Plant Sci. 2022, 12, 786839. [Google Scholar] [CrossRef]
- Sanku, G.; Rajasekaran, R.; Boopathi, N.M.; Krishnamoorthy, I.; Santhanakrishnan, V.P.; Mani, V. Transcriptomic Response of Minor Millets to Abiotic Stresses. Front. Sustain. Food Syst. 2024, 8, 1435437. [Google Scholar] [CrossRef]
- Yan, W.; Tinker, N.A. Biplot Analysis of Multi-Environment Trial Data: Principles and Applications. Can. J. Plant Sci. 2006, 86, 623–645. [Google Scholar] [CrossRef]
- Gauch, R.H.; Zobel, W. AMMI Analysis of Yield Trials. In Genotype-by-Environment Interaction; Kang, M.S., Gauch, H.G., Eds.; CRC Press: Boca Raton, FL, USA, 1996; pp. 85–122. [Google Scholar]
- Smith, A.; Gentile, B.R.; Xin, Z.; Zhao, D. The Effects of Heat Stress on Male Reproduction and Tillering in Sorghum bicolor. Food Energy Secur. 2023, 12, e510. [Google Scholar] [CrossRef]
- Chiluwal, A.; Bheemanahalli, R.; Kanaganahalli, V.; Boyle, D.; Perumal, R.; Pokharel, M.; Oumarou, H.; Jagadish, S.V.K. Deterioration of Ovary Plays a Key Role in Heat Stress-induced Spikelet Sterility in Sorghum. Plant Cell Environ. 2020, 43, 448–462. [Google Scholar] [CrossRef] [PubMed]
- Bhardwaj, A.; Devi, P.; Chaudhary, S.; Rani, A.; Jha, U.C.; Kumar, S.; Bindumadhava, H.; Prasad, P.V.V.; Sharma, K.D.; Siddique, K.H.M.; et al. ‘Omics’ Approaches in Developing Combined Drought and Heat Tolerance in Food Crops. Plant Cell Rep. 2022, 41, 699–739. [Google Scholar] [CrossRef] [PubMed]
- Torres-Ordoñez, L.H.; Valenzuela-Cobos, J.D.; Guevara-Viejó, F.; Galindo-Villardón, P.; Vicente-Galindo, P. Effect of Genotype × Environment Interactions on the Yield and Stability of Sugarcane Varieties in Ecuador: GGE Biplot Analysis by Location and Year. Appl. Sci. 2024, 14, 6665. [Google Scholar] [CrossRef]
- Sun, M.; Huang, D.; Zhang, A.; Khan, I.; Yan, H.; Wang, X.; Zhang, X.; Zhang, J.; Huang, L. Transcriptome Analysis of Heat Stress and Drought Stress in Pearl Millet Based on Pacbio Full-Length Transcriptome Sequencing. BMC Plant Biol. 2020, 20, 323. [Google Scholar] [CrossRef]
- Chellapilla, T.S.; Ambawat, S.; Gurjar, N.R. Millets: Role and Responses Under Abiotic Stresses. In Sustainable Remedies for Abiotic Stress in Cereals; Springer: Berlin/Heidelberg, Germany, 2022; pp. 171–207. [Google Scholar]
- Srividhya, S.; Swarna, R.; Jinu, J.; Dheeraj, C.; Talwar, H.S. Salinity Stress in Pearl Millet: From Physiological to Molecular Responses. In Pearl Millet in the 21st Century; Springer Nature Singapore: Singapore, 2024; pp. 361–394. [Google Scholar]
- Wolie, A.; Tadesse, D. Correlation and Path Coefficient Analyses of Some Yield Related Traits in FInger Millet (Eleusine coracana (L.) Gaertn.) Germplasms in Northwest Ethiopia. Afr. J. Agric. Res. 2011, 6, 5099–5105. [Google Scholar]
- Guo, Y.; Hao, D.; Wang, X.; Wang, H.; Wu, Z.; Yang, P.; Zhang, B. Comparative Transcriptomics Reveals Key Genes Contributing to the Differences in Drought Tolerance among Three Cultivars of Foxtail Millet (Setaria Italica). Plant Growth Regul. 2023, 99, 45–64. [Google Scholar] [CrossRef]
- Sanjana Reddy, P.; Satyavathi, C.T.; Khandelwal, V.; Patil, H.T.; Gupta, P.C.; Sharma, L.D.; Mungra, K.D.; Singh, S.P.; Narasimhulu, R.; Bhadarge, H.H.; et al. Performance and Stability of Pearl Millet Varieties for Grain Yield and Micronutrients in Arid and Semi-Arid Regions of India. Front. Plant Sci. 2021, 12, 670201. [Google Scholar] [CrossRef] [PubMed]
- Ventura, F.; Poggi, G.M.; Vignudelli, M.; Bosi, S.; Negri, L.; Fakaros, A.; Dinelli, G. An Assessment of Proso Millet as an Alternative Summer Cereal Crop in the Mediterranean Basin. Agronomy 2022, 12, 609. [Google Scholar] [CrossRef]
- Habiyaremye, C.; Barth, V.; Highet, K.; Coffey, T.; Murphy, K. Phenotypic Responses of Twenty Diverse Proso Millet (Panicum miliaceum L.) Accessions to Irrigation. Sustainability 2017, 9, 389. [Google Scholar] [CrossRef]
- Vetriventhan, M.; Azevedo, V.C.R.; Upadhyaya, H.D.; Nirmalakumari, A.; Kane-Potaka, J.; Anitha, S.; Ceasar, S.A.; Muthamilarasan, M.; Bhat, B.V.; Hariprasanna, K.; et al. Genetic and Genomic Resources, and Breeding for Accelerating Improvement of Small Millets: Current Status and Future Interventions. The Nucleus 2020, 63, 217–239. [Google Scholar] [CrossRef]
- Opole, R.A.; Prasad, P.V.V.; Djanaguiraman, M.; Vimala, K.; Kirkham, M.B.; Upadhyaya, H.D. Thresholds, Sensitive Stages and Genetic Variability of Finger Millet to High Temperature Stress. J. Agron. Crop. Sci. 2018, 204, 477–492. [Google Scholar] [CrossRef]
- Sehgal, A.; Sita, K.; Kumar, J.; Kumar, S.; Singh, S.; Siddique, K.H.M.; Nayyar, H. Effects of Drought, Heat and Their Interaction on the Growth, Yield and Photosynthetic Function of Lentil (Lens Culinaris Medikus) Genotypes Varying in Heat and Drought Sensitivity. Front. Plant Sci. 2017, 8, 1776. [Google Scholar] [CrossRef] [PubMed]
- Rai, K.N.; Govindaraj, M.; Rao, A.S. Genetic Enhancement of Grain Iron and Zinc Content in Pearl Millet. Qual. Assur. Saf. Crops Foods 2012, 4, 119–125. [Google Scholar] [CrossRef]
- Gupta, S.K.; Rai, K.N.; Singh, P.; Ameta, V.L.; Gupta, S.K.; Jayalekha, A.K.; Mahala, R.S.; Pareek, S.; Swami, M.L.; Verma, Y.S. Seed Set Variability under High Temperatures during Flowering Period in Pearl Millet (Pennisetum glaucum L. (R.) Br.). Field Crops Res. 2015, 171, 41–53. [Google Scholar] [CrossRef]
- Yadav, O.P.; Bhatnagar, S.K. Evaluation of Indices for Identification of Pearl Millet Cultivars Adapted to Stress and Non-Stress Conditions. Field Crops Res. 2001, 70, 201–208. [Google Scholar] [CrossRef]
- Mahalakshmi, V.; Bldlnger, F.R. Flowering Response of Pearl Millet to Water Stress during Panicle Development*. Ann. Appl. Biol. 1985, 106, 571–578. [Google Scholar] [CrossRef]
- Bidinger, F.R.; Hash, C.T. Pearl Millet. In Physiology and Biotechnology Integration for Plant Breeding; Nguyen, H.T., Blum, A., Eds.; Marcel Dekker: New York, NY, USA, 2004; pp. 225–270. [Google Scholar]
- Calamai, A.; Masoni, A.; Marini, L.; Dell’acqua, M.; Ganugi, P.; Boukail, S.; Benedettelli, S.; Palchetti, E. Evaluation of the Agronomic Traits of 80 Accessions of Proso Millet (Panicum miliaceum L.) under Mediterranean Pedoclimatic Conditions. Agriculture 2020, 10, 578. [Google Scholar] [CrossRef]
- Mythri, B.; Sivasankarreddy, K.; Behera, P. Recent Advancements in Proso Millet (Panicum miliaceum L.) Breeding for Quality and Yield Improvement. In Genetic Improvement of Small Millets; Mishra, S., Kumar, S., Srivastava, R.C., Eds.; Springer Nature Singapore: Singapore, 2024; pp. 423–442. [Google Scholar]
- Zhang, H.; Tang, S.; Wang, H.; Wang, Y.; Zhi, H.; Liu, B.; Zhang, R.; Ma, Q.; Jia, G.; Feng, B.; et al. Genetic Diversity of Grain Yield Traits and Identification of a Grain Weight Gene SiTGW6 in Foxtail Millet. Theor. Appl. Genet. 2024, 137, 84. [Google Scholar] [CrossRef]
- Wang, D.; Su, M.; Hao, J.-H.; Li, Z.-D.; Dong, S.; Yuan, X.; Li, X.; Gao, L.; Chu, X.; Yang, G.; et al. Dynamic Transcriptome Landscape of Foxtail Millet Grain Development. Seed Biol. 2023, 2, 19. [Google Scholar] [CrossRef]
Disclaimer/Publisher’s Note: The statements, opinions and data contained in all publications are solely those of the individual author(s) and contributor(s) and not of MDPI and/or the editor(s). MDPI and/or the editor(s) disclaim responsibility for any injury to people or property resulting from any ideas, methods, instructions or products referred to in the content. |
© 2025 by the authors. Licensee MDPI, Basel, Switzerland. This article is an open access article distributed under the terms and conditions of the Creative Commons Attribution (CC BY) license (https://creativecommons.org/licenses/by/4.0/).