Article

Evaluating Copper-Doped Biochar Composites for Improving Wheat Nutrition and Growth in Oxisols

by
Loren Chisté
1,
Carlos Alberto Silva
1,
Flávio Henrique Silveira Rabêlo
2,
Keiji Jindo
3 and
Leônidas Carrijo Azevedo Melo
1,*
1
Department of Soil Science, School of Agricultural Sciences, Federal University of Lavras, Lavras 37203-202, MG, Brazil
2
Department of Soil Science, Luiz de Queiroz College of Agriculture, University of São Paulo, Piracicaba 13418-260, SP, Brazil
3
Agrosystems Research, Wageningen University & Research, P.O. Box 16, 6700 AA Wageningen, The Netherlands
*
Author to whom correspondence should be addressed.
Agronomy 2025, 15(1), 144; https://doi.org/10.3390/agronomy15010144
Submission received: 4 November 2024 / Revised: 2 January 2025 / Accepted: 6 January 2025 / Published: 9 January 2025

Abstract

:
Copper (Cu) is a critical micronutrient for wheat (Triticum aestivum L.), essential for growth and grain baking quality, yet its availability is limited because Cu is specifically adsorbed on colloids of highly weathered tropical soils like Oxisols. This study hypothesizes that Cu-doped biochar composites can outperform traditional Cu fertilizers in improving wheat growth and Cu use efficiency. Composites were synthesized from chicken manure (FCM), shrimp shells (FSC), and sewage sludge (FSS), doped with copper sulfate (CuSO45H2O) or copper oxide (CuO), and pyrolyzed at 300 °C or 550 °C. The experimental design involved greenhouse trials in two Oxisols (RYL and DRL), assessing Cu release kinetics, plant Cu uptake, and dry matter production. Fourier Transform Infrared Spectroscopy (FTIR) confirmed successful Cu integration. Results revealed that CSS/CS-5 (FSS + CuSO45H2O at 550 °C) improved Cu uptake and shoot biomass in DRL soil, while CSC/CS-3 (FSC + CuSO45H2O at 300 °C) enhanced wheat CuSO45H2O growth in RYL soil. Peak Cu availability varied by CuSO45H2O soil and composite type, with residual Cu highest CuSO45H2O in CuSO45H2O-treated soils. These findings demonstrate that Cu–biochar composites, tailored to soil conditions, offer a sustainable alternative to mineral Cu fertilizers by enhancing the nutrient availability and wheat grain yield.

1. Introduction

Copper (Cu) is an essential element for plant growth, yet its availability is often limited in tropical soils, such as those found in the Brazilian cerrado. These soils usually have high concentrations of iron and aluminum oxides (Fe2O3, Al2O3) and kaolinite, low-activity colloids, acidic pH, low to medium organic matter content and low cation exchange capacity (CEC) (Vermaat et al., 1950) [1]. These properties enhance the adsorption of Cu within soil colloids, mainly the mineral ones, significantly reducing its availability to crops [2]. As a result, conventional Cu fertilizers, such as copper sulfate (CuSO45H2O) and copper oxide (CuO), have limited effectiveness in these soils and are rarely used and marketed in Brazil, particularly for crops such as wheat. Winter wheat, which has a high demand for Cu, often receives insufficient Cu fertilization. As an essential micronutrient that is often limited and specifically adsorbed onto Al and Fe oxides, which are abundant in highly weathered tropical soils, this deficiency frequently results in reduced yields low quality grains [3].
Copper-doped biochar composites offer a novel solution to the strong interaction between Cu and clay minerals of tropical soils [4]. These composites, enriched with Cu in the form of oxides or sulfates, show potential as high-value micronutrient sources. They may minimize copper specific adsorption (fixation) in tropical soils and enhance its availability for plant uptake [5,6]. The production conditions of biochar, including the choice of right temperature and feedstock type, play a critical role in determining its composition and properties, as well as the effectiveness of the charred matrices in delivering Cu to crops. These factors, in turn, influence the availability of copper in soil [7]. The feedstock selection influences the biochar elemental composition, pH, and potential contaminants, as well as the effectiveness of biochar to act as true nutrient source or, depending on the biochar rate, as a soil conditioner [8]. Consequently, Cu–biochar composites can address Cu deficiency in soil and support sustainable, efficient Cu fertilization strategies, thereby improving crop growth and yields in tropical soils [9], such as winter wheat [10].
This study focuses on converting abundant organic wastes found in Brazil, specifically chicken manure (FCM), shrimp shells (FSC), and sewage sludge (FSS), into biochar-Cu composites. When pyrolyzed with Cu sources, these materials exhibit increased pH, specific spectroscopic signatures, structural changes, and the presence of alkaline functional groups in the biochar matrix, which enhance Cu surface complexation through deprotonation [11]. The selection of these feedstock is based on their availability in Brazil, degree of humification, the chemical nature of the matrix organic groups, elemental composition, the richness of functional N organic groups, including aminoacids and proteins, and their demonstrated potential for nutrient complexation and for biochar production in previous studies [12,13,14]. Applying Cu–biochar composites can increase CEC, catalyze various reactions of Cu with organic radicals, and is supposed to increase Cu availability to plants in a pH-dependent way [15]. Analytical techniques, such as infrared spectroscopy, are used to identify chemical bonds and compounds within the composites. Comprehensive chemical analyses for Cu speciation, pools, and availability aim to meet plant Cu nutritional requirements and enhance the agronomic effectiveness of Cu fertilizers in tropical, highly weathered soils [15]. Higher pyrolysis temperatures typically produce biochar with enhanced Cu sorption capacity, enriched inorganic constituents, and improved ash content but may also destroy organic functional groups essential for Cu complexation or chelation [16]. The reactivity, solubility, and stability of the Cu complexes in the charred matrices are tested in this study using different techniques, such as spectroscopy, SEM-EDS, and elemental composition of composites, in addition to assessing different Cu pools in the Oxisols and wheat plants.
The hypothesis of this study is that Cu–biochar composites are more efficient than traditional Cu fertilizers in enhancing wheat growth and nutrient uptake in Oxisols due to the slow and protected release behavior of Cu. The study aims to (i) identify synthesis routes and evaluate properties of Cu composites (CuSO45H2O and CuO) based on biochars derived from FCM, FSC, and FSS pyrolyzed at 300 °C or 550 °C; (ii) assess the efficiency of Cu–biochar composites in supplying Cu to wheat plants, and examine the release kinetics of Cu release in Oxisols; (iii) determine the agronomic effectiveness of Cu–biochar composites in ensuring robust wheat growth compared to plants fertilized with CuSO45H2O.

2. Materials and Methods

2.1. Feedstock Preparation and Characterization

Three types of feedstocks were used for the synthesis of biochars and composites as follows: chicken manure (FCM), shrimp shell (FSC), and sewage sludge (FSS). FCM was acquired from a farm located in Nepomuceno, Minas Gerais, Brazil (Latitude: −21.236110° S; Longitude: −45.234970° W); municipal FSS was collected from a sewage treatment station at the Federal University of Lavras (UFLA) in Lavras, Minas Gerais, Brazil (Latitude: −21.23008° S; Longitude: −44.98981° W); and FSC was obtained from a seafood processing corporation located in Linhares, Espírito Santo, Brazil (Latitude: −19.373030° S; Longitude: −40.054680° W), (Figure A1).
The feedstocks were initially air-dried at room temperature to remove constitutional water. Subsequently, they were dried in a forced-air oven at 65 °C until reaching a constant weight. After drying, the samples were ground and sieved to ensure a uniform particle diameter of less than 0.25 mm. The processed feedstocks were stored in desiccators and airtight plastic bags to prevent re-moisturization.

2.2. Synthesis of Biochar and Copper-Doped Biochar

Six biochar samples were produced by pyrolyzing each feedstock and two Cu sources in a JUNG muffle furnace at either 300 °C or 550 °C, with a heating rate of 10 °C per minute and a holding time of 60 min followed by slow cool-down to room temperature. Twelve Cu-doped composites were synthesized by mixing feedstocks with either copper sulfate (CuSO4·5H2O) or copper oxide (CuO), sourced from ISOFAR and Exodus Scientific, to achieve a target Cu content of 20% (w/w) in the final composite. The selection of a 20% Cu content was defined based on preliminary studies demonstrating that this concentration optimizes the catalytic activity and structural stability of the composites, preventing excessive agglomeration of Cu particles and ensuring uniform metal distribution [17]. Additionally, this concentration was deemed appropriate to ensure efficient synthesis without compromising the integrity of the biochar. The pre-treated mixture, weighing 100 g, was subjected to pyrolysis under the same conditions as the untreated biochars. After pyrolysis, all samples were ground and sieved through a 60-mesh screen for consistency and homogeneity, and the ground, dried, and prepared samples were stored in desiccators until further analysis. Refer to Table 1 for the nomenclature of feedstocks and Cu sources, biochar, and the respective Cu–biochar composites synthesized.

2.3. Characterization of Biochar and Composite Properties

The contents of volatile matter (VM), moisture (M), and ash (As) were determined following ASTM D1762-84 protocols, with modifications for biochar (Equations (1)–(3)) [18,19]. Biochar yield was calculated according to Equation (4). Post-VM determination, ash content was quantified by incinerating the sample at 750 °C for six hours. Fixed carbon content was computed as outlined in Equation (5).
V M % = D W   a t   105   ° C D W   a t   950   ° C D W   a t   105   ° C × 100
  M % = R W D W   a t   105   ° C R W × 100
A s % = R W D W   a t   750   ° C D W   A T   105   ° C × 100
Y % = 100 × b i o c h a r   m a s s 105   ° C   d r i e d   f e e d s t o c k
C % = D W   a t   105   ° C D W   a t   950   ° C D W   a t   750   ° C D W   a t   105   ° C × 100
The pH and electrical conductivity (EC) of the studied samples were assessed using a 1:10 ratio of biochar to wate measured with a digital meter from (Toledo CE, Mettler-Toledo AG, Switzerland) [18]. Carbon (C) content was determined through a dry combustion technique using a Vario TOC cube analyzer from Elementar, Germany. Total nitrogen (N) content was measured following sulfuric acid digestion employing the Kjeldahl method [18]. The carbonized samples underwent a digestion process involving sulfuric acid mixed with selenium and potassium sulfate in digestion tubes. The process began with a 12 h pre-digestion phase, followed by a gradual increase in the aluminum block temperature up to 250 °C until the samples were completely solubilized. After digestion, the nutrient contents were quantified using the inductively coupled plasma optical emission spectroscopy ICP-OES machine from Agilent Technologies, USA, with the used of certified samples to control the quality of the results during the digestion phase and elemental determination (Table A1).
All digestion procedures utilized certified tomato leaf samples from the National Institute of Standards and Technology (NIST) SRM 1573a; as well as biochar samples derived from sewage sludge and wheat straw in the UK, supplied by the Biochar Research Centre, School of Geosciences-University of Edinburgh (SS550, SS700, WSP550, and WSP700) [20]. These standard samples were utilized to ensure quality control, along with blank samples whose nutrient contents were factored into the calculations to determine the final elemental composition of feedstocks, biochars, and composites.
Water-soluble (W), 2% citric acid-soluble (CA%), and neutral ammonium citrate-soluble (NAC) Cu levels were assessed in filtrate using standard methods [21]. The indices of Cu in the sources used in this study were quantified through chemical analysis and subsequently determined in the aforementioned ICP-OES machine. To compare the Cu solubility of the samples, a Cu index was calculated, taking into account the ratio of the soluble Cu indices in fertilizers (Cu in water, Cu-W, Cu in citric acid, Cu-CA% and Cu in neutral citric acid solution, Cu-NAC) and the total Cu content of each matrix, according to (Equation (6)).
C u % = S o l u b l e   C u g   k g 1 T o t a l   C u g   k g 1 × 100

2.4. Fourier Transform Infrared Spectroscopy (FTIR)

Fourier-transform infrared spectroscopy (FTIR) with attenuated total reflectance (ATR) was performed using an Agilent® Cary 630 FTIR spectrometer equipped with a ZnSe-ATR crystal. Infrared analysis covered a wavelength range of 4000–650 cm−1 at a 4 cm−1 resolution. Each FTIR spectrum was normalized as described in [22]. Spectral interpretation and identification of specific bands for Cu-treated biochars were based on existing libraries and assignments of bands to organic functional groups [18,23].

2.5. Scanning Electron Microscopy (SEM)

The scanning electron microscope (SEM) was used to analyze the elemental composition of the samples, utilizing the Schottky Field Emission Scanning Electron Microscope JEOL JSM-7610F, located at the Electron Microscopy and Ultrastructural Analysis Laboratory of the Federal University of Lavras (LME/UFLA) in Brazil-Department of Phytopathology. Non-conductive, dried samples measuring 0.5 × 0.5 × 0.5 cm were oven-dried, mounted on stubs using double-sided carbon tape, and then carbon-coated.

2.6. Copper Release Kinetics

The kinetics of Cu release from various matrices (biochar and composites and Cu mineral source) were assessed through sequential extractions of leached Cu over time. The experimental procedure involved weighing 1.0 g of the sample, which was then transferred to a 50 mL falcon tube and combined with 20 mL of 2% citric acid solution. The mixture was horizontally shaken at 90 rotations per minute (rpm), and extracts were collected at predetermined intervals as follows: 0.25, 0.5, 1, 2, 4, 12, 24, 48, 72, 120, and 250 h of sequential analysis to evaluate the Cu quantities released by the biochars and their respective composites. After each extraction time, tubes containing samples were centrifuged for 5 min at 3500 rpm. The resultant supernatant was carefully collected and transferred to another falcon tube and reserved for further analysis of the extracted analytes. Cooper concentrations in the leachate extracts were determined in an inductively coupled plasma optical emission spectrometer (ICP-OES) machine.

2.7. Agronomic Performance t of Cu Composites

This agronomic study was conducted in a greenhouse experiment involving wheat Triticum aestivum cultivation in surface samples (0–20 cm) of typical Dystrophic Red-Yellow Latosol (RYL) and Dystroferric Red Latosol (DRL), whose main attributes are shown in Table 2.
Soil samples underwent air-drying, grounding, and sieving (2 mm) to obtain air-dried fine earth. Soil acidity was corrected using calcium carbonate (CaCO3) and magnesium carbonate (MgCO3) at a 4:1 molar ratio to achieve a target pH of 5.5 ± 0.2, aiming to maximize the availability of essential macro- and micronutrients and optimize growth conditions for the plants, avoiding the aluminum toxicity that is common in these soils. This approach ensures that the soil conditions are optimized for the specific crop, providing a balanced environment for plentiful plant development [25]. The lime application aimed to optimize growth conditions for wheat and ensure the availability of calcium (Ca) and magnesium (Mg) in the soil [24]. A randomized complete block design with the use of a 5 × 3 factorial arrangement was employed, combining five biochar–Cu composites: CCM/CS-3, CSC/CS-5, and CSS/CS-5, alongside the treatment without Cu addition to soil. Regardless of the source, Cu was added to both Oxisols at a concentration of 4.0 mg kg−1 [26]. The choice of the composites CCM/CS-3, CSC/CS-5, and CSS/CS-5 over others shown in Table 1 was based on their specific properties and their potential to improve soil fertility and plant growth, besides the specific capacity to release Cu (kinetics study) over time.
These composites were selected to assure an ideal combination of physical and chemical characteristics capable of maximizing nutrient availability in the soil, in addition to showing uniform Cu distribution and thermal stability, making them more effective for the experimental conditions of this study.
After liming, each pot containing 3 kg of soil was fertilized, and wheat was sown with four seeds per pot, incorporating a nutrient fertilization scheme that includes 300; (600 DRL and 300 RYL), 300; 40; 1.80; 5, 20 and 0.15 mg kg−1, of N, P, K, S, B, Mn, Mo, Zn, and Fe, respectively, and using the following sources: NH4H2PO4, K2SO4, H3BO3, MnCl2.4H2O, and (NH4)6Mo7O2.4H2O (p.a), except for N and K, which were split into three applications at 7, 15, and 30 days after wheat seed germination [27]. Irrigation was maintained at approximately ~70% of the soil’s maximum water-holding capacity. The trial lasted 90 days, with daily soil water level adjustments.
At the beginning of the experiment, a Suolo Acqua® sampler (Lavras, Minas Gerais, Brazil) [28] was installed in the lower third of the pots, centrally, where the soil was carefully packed and slightly compressed around the soil solution sampler to avoid the entry of air into the soil–water–sampler system. After 12 h following the wheat sowing, the first aliquots of the soil solution (20 mL) were collected throughout the experimental period at 1, 7, and 15 days. The collected solution was filtered through a membrane with a pore size of 0.45 µm, and soil Cu content was determined by an ICP-OES machine. After 190 days of wheat sowing, 50 g of soil was collected from each experimental unit. The soil samples were then dried and sieved (2 mm). The Cu content in the soil was determined at the end of the experiment to evaluate the residual Cu available in the soil after wheat cultivation [24].
Upon harvest, 190 days after sowing, wheat plants were separated into shoot, root, and grain parts. The weight (dry matter, DM) r of each plant part was obtained after drying at 60 °C. Shoot (SDM), root (RDM), and grain yield (GP) were ground in a mill (Model TE-648, Tecnal, Piracicaba, São Paulo, Brazil) using (1 mm); plant materials were digested in a nitric-perchloric mixture [29], and the Cu content in the plant tissue was determined using an ICP-OES machine, while Cu accumulation in the SDM was calculated by multiplying the dry matter by the Cu concentration in shoot (Equation (7)).
S h o o t   C u   c o n t e n t   =   s h o o t   d r y   m a t t e r   g   ×   C u   c o n c e n t r a t i o n   i n   t h e   s h o o t   t i s s u e   m g   g 1                                      

2.8. Statistical Analysis

Data were processed using mean values of the plant and soil attributes assessed in this study. The data were then subjected to a two-way ANOVA to discern any statistically significant differences (p < 0.05) among treatments, followed by means comparison using Tukey’s test (p < 0.05). All assumptions for ANOVA were verified, and significance was assessed at p < 0.05 using R software (version 4.2.1, R Core Team, Vienna, Austria) [30]. Multivariate analyses were conducted using R to elucidate the relationships between the properties and Cu solubility indices and pools within the composites. The packages employed in these analyses included agricolae, factoextra, FactoMineR, pvclust, corrplot, tidyverse, and nlstools [31,32,33,34,35,36,37].
The dataset of Cu-release kinetics in 2% citric acid (CA%) was fitted to different non-linear mathematical models, as an output of the relationship between incubation time versus the amount of Cu released from each Cu source. The following mathematical models were fitted to the Cu kinetics dataset: Elovich model (Equation (8)), simple exponential model (Equation (9)), power function (Equation (10)), and hyperbolic model (Equation (11)).
N t = a + b l n t
N t = N 0 1 e k t
N t = a × b t
N t = N 0 × t   N 0 × b + t
Model selection for Cu-release kinetics was performed based on the highest determination coefficient (R2), the lowest root mean square error (RMSE), and the smallest Akaike information criterion (AIC) values [38]. Notation: Nt is the fraction of Cu released at time t; a represents the initial Cu release rate; b is the constant rate of Cu release; and N0 is the maximum amount of Cu released during the kinetics study.

3. Results

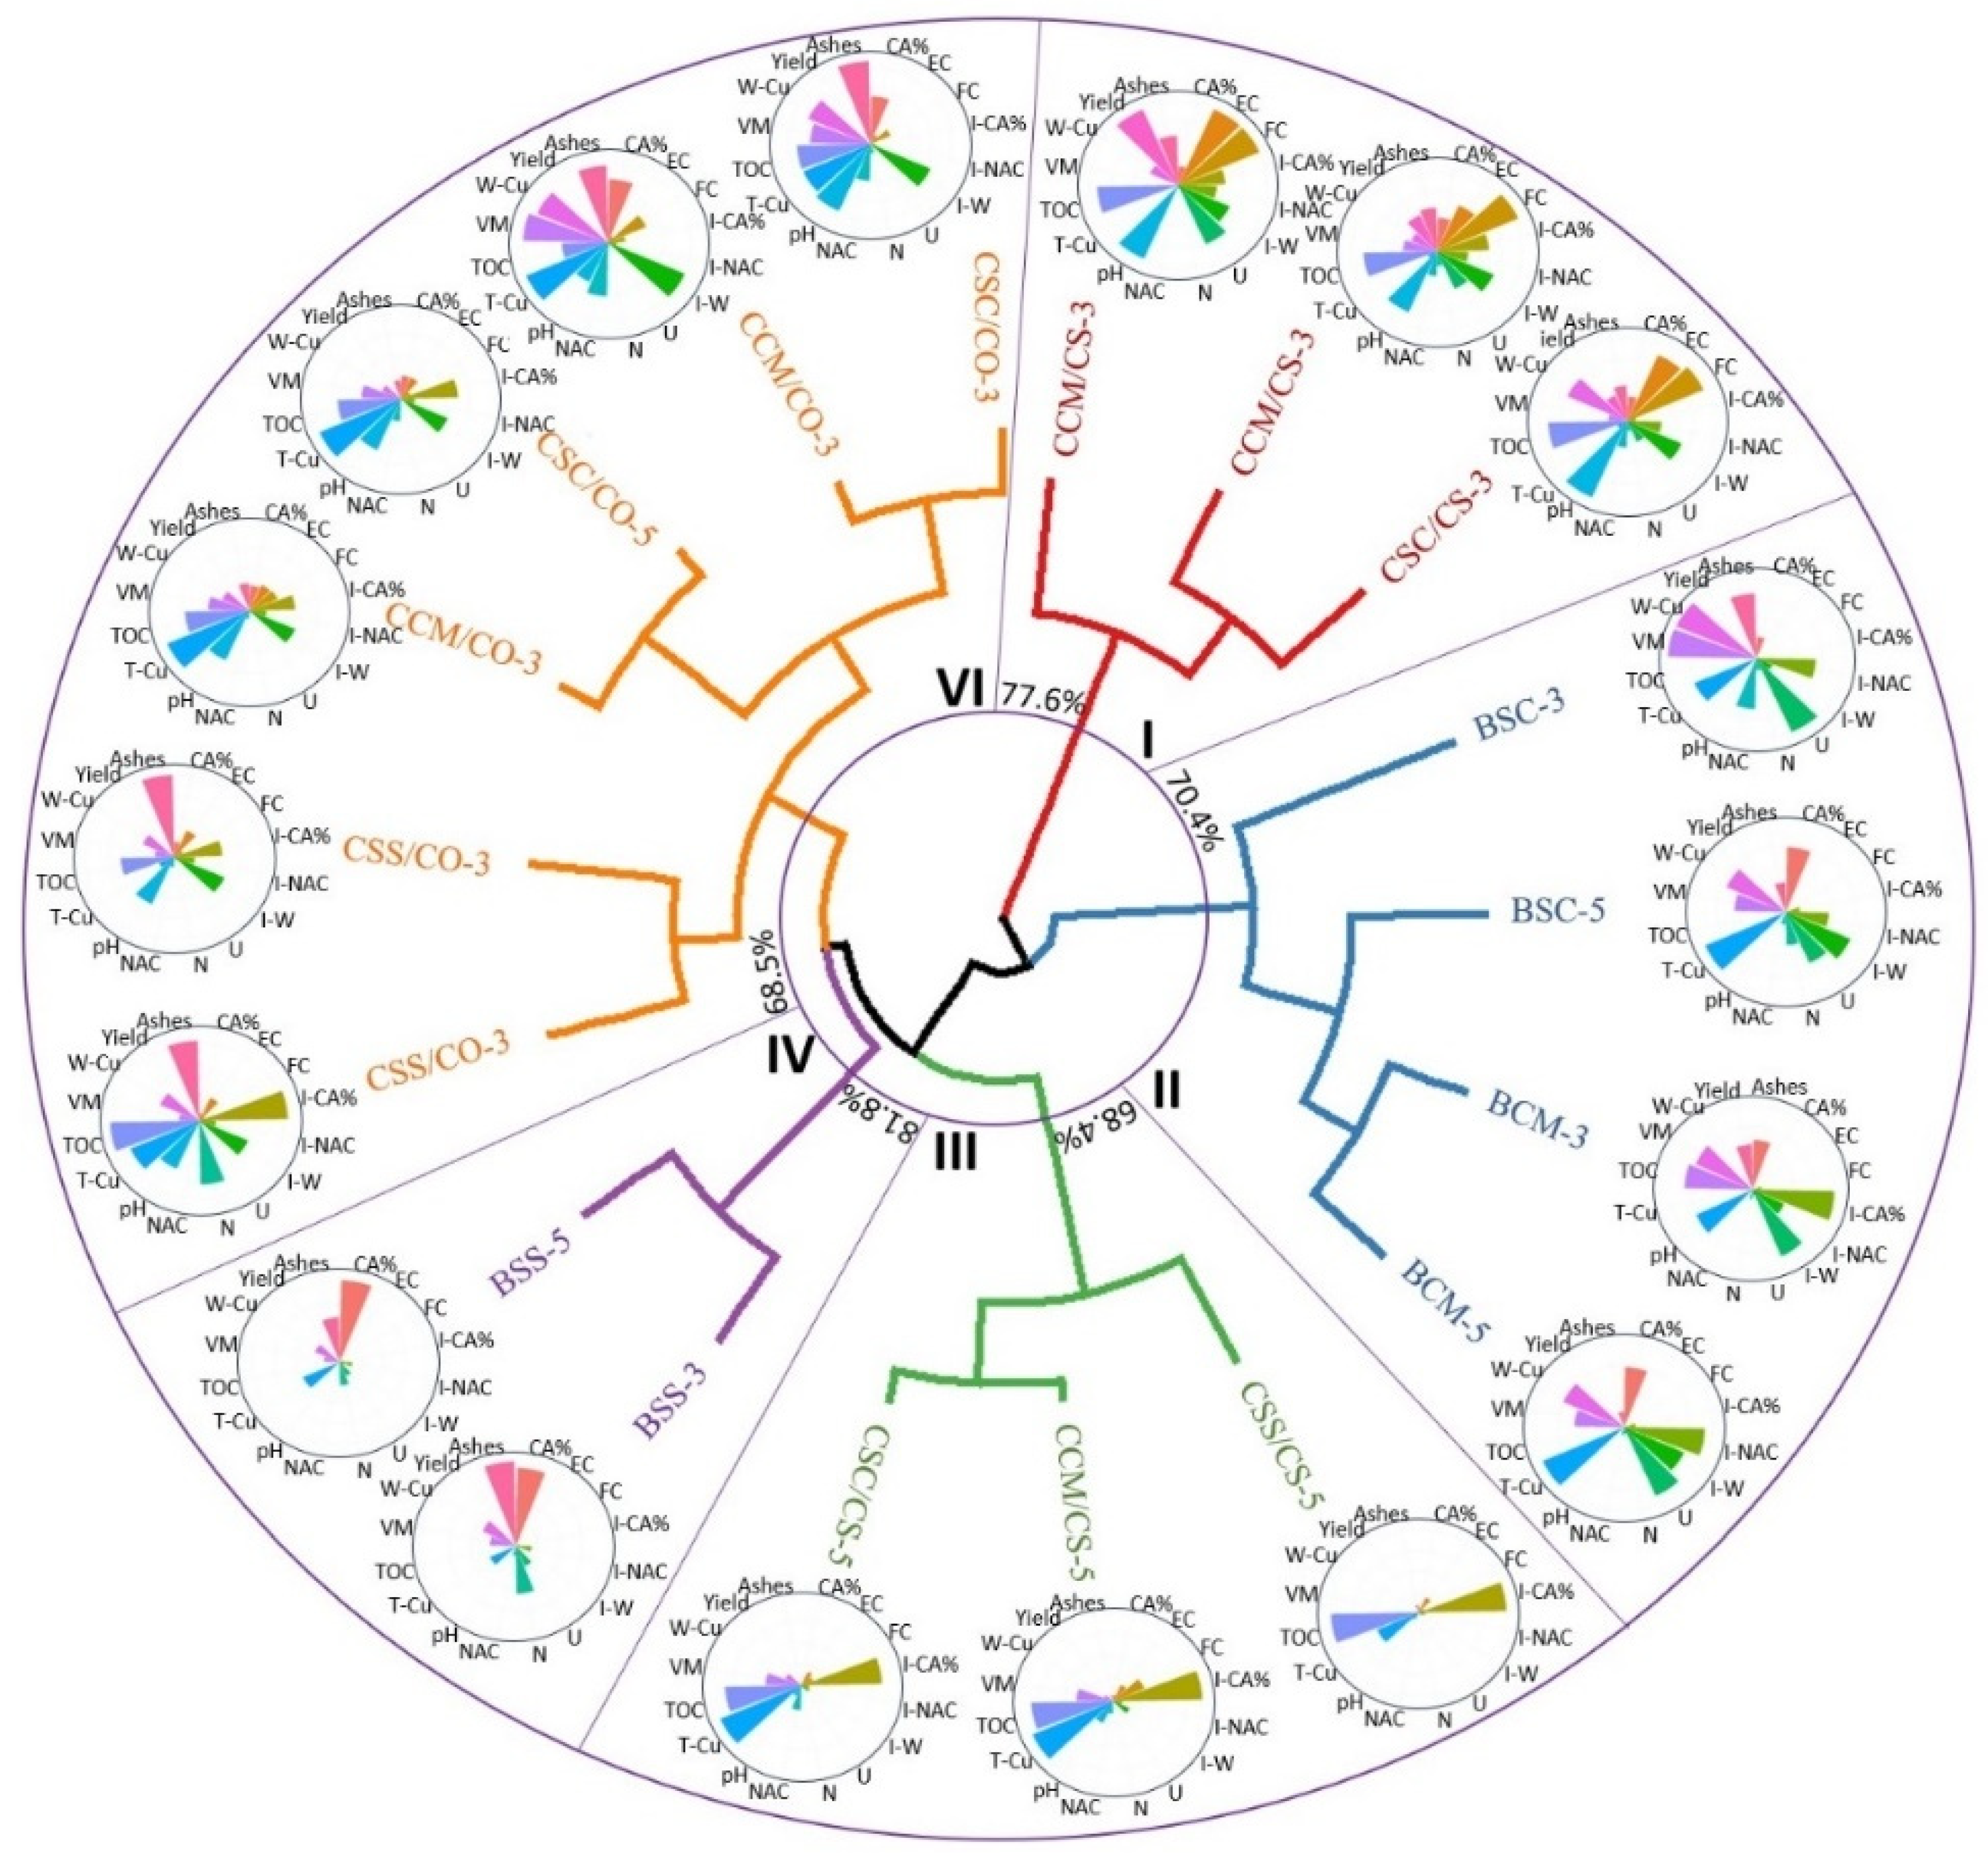
3.1. Chemical Properties of the Composites

The pH of the biochars varied within a range of 6.2 to 10.7 (Table 3). Biochars derived from FCM and FSC exhibited higher pH values, indicating a more alkaline nature. In contrast, those derived from FSS showed lower pH values, which could influence their application in acidic soils [39]. The high alkalinity of the FCM and FSC biochars may be beneficial for neutralizing acidic soils. Although the FSS biochars have a lower pH of 6.2, this does not necessarily limit their effectiveness in such conditions. Overall, the pH of the biochars increases with the pyrolysis temperature for all feedstocks due to the increased generation of ash, which contains basic cations that can be associated with alkaline species such as carbonates, oxides, and hydroxides [40], especially in nutrient-rich raw materials [41], such as FCM and FCS.
Electrical conductivity ranged from 1.3 to 8.2 dS m−1, with BCM-3, BCM-5, and BSC-3 showing the highest values. This suggests a higher concentration of soluble salts in these biochars, which could affect their applicability in soils depending on soil salinity and the crops to be grown. In general, the yield percentage of the biochars decreased with increasing pyrolysis temperature, as expected, due to greater mass loss at higher temperatures [42]. The inorganic constituents present in the ash of FSS-derived biochars act as flame retardants, thereby reducing mass loss during pyrolysis [43]. The volatile matter (VM) content was higher in biochars pyrolyzed at 300 °C, as seen in BSC-3 with 72%, compared to those pyrolyzed at 550 °C, such as BSC-5 with 42%. This pattern indicates that higher pyrolysis temperatures promote greater volatilization of organic compounds, resulting in a biochar with a lower volatile matter content and a higher proportion of fixed carbon [44].
Ash contents ranged from 32% to 78%, with biochars from FSS showing the highest ash contents, which reflects the large number of inorganic minerals present in sewage sludge, which do not volatilize during pyrolysis, remaining in the biochar matrix [45]. The fixed carbon percentage increased with pyrolysis temperature, consistent with the thermal degradation of volatile materials and the concentration of chemically stable carbon. For example, BCM-5 had 11.1% fixed carbon, while BCM-3 had 9.3%. Biochars derived from FSC had a higher carbon content (41% for BSC-5) compared to those from sewage sludge (FSS) (12% for BSS-5). However, the carbon concentration in FCM biochar decreased with increasing pyrolysis temperature, which is consistent with findings reported by other studies [41].
Nitrogen content was highest in biochars from BCS-3 (6.5%) compared to other composites, as the nitrogen content and chemical species of N in the biochars are determined by the choice of feedstock and its initial N content [46]. The C/N ratio, an important factor in biochar application in soil, varied significantly. Biochars from (BCM-3 and BCM-5) had higher C/N ratios (16.6 and 13.1, respectively), which could suggest potential benefits for carbon stability in the soil. In contrast, biochars from FSS had lower C/N ratios (10.3 for BSS-5), indicating a relatively higher potential for N mineralization [47]. While the C and N in biochar are generally stable, especially at lower pyrolysis temperatures, these ratios provide insight into the comparative dynamics of these elements among different biochars.
In summary, the type of feedstock and pyrolysis temperature significantly affect the properties of biochar. Biochars from FCM and FSC showed higher alkalinity and C content, while those from FSS had higher ash content and lower C: N ratio. These characteristics should be considered when selecting biochar for specific soil applications to optimize agronomic and environmental benefits of Cu sources.
The composites derived from CCM/CS-5 and CCM/CO-5 exhibited substantial increases in pH, illustrating the impact of high-temperature treatment on the alkalinization of carbonized matrices (Table 4). Notably, CCM/CS-5 exhibited a considerable increase in pH from 5 at 300 °C to 10, alongside a sharp decrease in EC from 21 dS m−1 to 9 dS m−1. Similarly, the pH of CCM/CO-5 increased to 10.6, while its EC decreased to 8.4 dS m−1. These changes suggest that higher pyrolysis temperatures, depending on the biochar rate added to soil, can enhance the composite’s ability to correct soil acidity. The lower solubility of CuO results in fewer free ions in the solution, thereby reducing EC. Additionally, the basic nature of CuO contributes to a higher pH level in the biochar, making it more alkaline in character than the more acidic CuSO45H2O [48].
Table 4 presents mean values (± standard deviation) for pH, electrical conductivity (EC), yield, volatile matter (VM), ash content, fixed carbon (FC), elemental composition (C and N), and the C:N ratio. Composites: CCM/CS-3: chicken manure + copper sulfate pyrolyzed at 300 °C; CCM/CO-3: chicken manure + copper oxide at 300 °C; CCM/CS-5: chicken manure + copper sulfate at 550 °C; CCM/CO-5: chicken manure + copper oxide at 550 °C; CSC/CS-3: shrimp waste + copper sulfate at 300 °C; CSC/CO-3: shrimp residue + copper oxide at 300 °C; CSC/CS-5: shrimp residue + copper sulfate at 550 °C; CSC/CO-5: shrimp residue + copper oxide at 300 °C; CSS/CS-3: sewage sludge + copper sulfate at 300 °C; CSS/CO-3: sewage sludge + copper oxide at 300 °C; CSS/CS-5: sewage sludge + copper sulfate at 550 °C; CSS/CO-5: sewage sludge + copper oxide at 550 °C.
In contrast, lower pH values in CSS/CS-3 may indicate greater metal solubility and lower Cu adsorption on soil colloids, although Cu compounds’ solubility and availability are conditioned by the degree of Cu complexation by organic compounds and the reactivity and stability of Cu-organic complexes formed during pyrolysis [48]. Depending on the composite rate added to soil, the high EC observed for CSC/CS-3 could limit its application in saline soils or those susceptible to salt stress. The addition of CuO generally resulted in lower EC and higher pH compared to CuSO45H2O across all feedstocks due to its basic nature, which neutralizes more acidic components present in the biochar [48] and accelerates the production of hydroxyl and oxygen radicals in the synthesis media [49].
Increasing the temperature typically resulted in a decrease in biochar yield, but there was an increment in FC content, indicating a higher degree of carbonization. For instance, CCM/CO-3 had a higher yield (71%) and a lower FC of 10%, in contrast to CCM/CO-5, which yielded a 59% greater amount of biochar but increased the FC to 37%. The elemental composition of Cu-enriched biochars revealed variations in C and N contents, significantly impacting the C:N ratio, crucial for nutrient release in soil applications. Remarkably, CSS/CS-3 displayed lower C:N ratios, such as CSC/CS-3 at 3.5, enhancing nutrient availability compared to those treated at 550 °C such as CSC/CS-5 and CCM/CO-5, which exhibited C:N ratios of 5.5 and 10.8, respectively.
Values shown in Table 4 refer to the treatments’ mean (n = 3), except yield (%) (n = 1); pH, electrical conductivity (EC), yield, and proximate composition (volatile matter (VM), ash content, fixed Carbon (FC), Carbon (C), Nitrogen (N), and C:N. Composites: CCM/CS-3: chicken manure + copper sulfate pyrolyzed at 300 °C; CCM/CO-3: chicken manure + copper oxide at 300 °C; CCM/CS-5: chicken manure + copper sulfate at 550 °C; CCM/CO-5: chicken manure + copper oxide at 550 °C; CSC/CS-3: shrimp waste + copper sulfate at 300 °C; CSC/CO-3: shrimp residue + copper oxide at 300 °C; CSC/CS-5: shrimp residue + copper sulfate at 550 °C; CSC/CO-5: shrimp residue + copper oxide at 300 °C; CSS/CS-3: sewage sludge + copper sulfate at 300 °C; CSS/CO-3: sewage sludge + copper oxide at 300 °C; CSS/CS-5: sewage sludge + copper sulfate at 550 °C; CSS/CO-5: sewage sludge + copper oxide at 550 °C.
These findings underscore that pyrolysis temperature is a pivotal factor in optimizing the properties of the composites. Higher temperatures increase pH and FC, which are advantageous for improving soil structure and soil acidity correction [50]. However, these conditions can also decrease N availability due to volatilization [51], which is associated with higher C:N ratios and suggests carbon stabilization and the biochar’s higher aromatic character [44].
The increase in FC content and the decrease in yield at elevated temperatures indicate the enhanced thermal stability of the composites [52]. This stability is beneficial for applications requiring long-lasting C-rich materials, such as sustained soil amendment. Furthermore, the reduction in EC with increased temperature points to a decrease in soluble salts, which is favorable for preventing soil salinity. Nonetheless, this could also imply a reduction in readily available Cu levels in soil or adsorption in soil colloids, necessitating a balanced approach for the application of these composites, especially in micronutrient-deficient soils [53].
The synthesized CSS/CS-5 composites exhibited the highest Cu retention, with a total Cu content reaching 338 g kg−1. This high retention rate suggests an effective interaction between the raw material enriched with CuSO45H2O, regardless of the pyrolysis temperature. Conversely, composites such as CCM/CS-5 and CSC/CS-5, also produced with CuSO45H2O, maintained high Cu levels regardless of the pyrolysis temperature but did not surpass the FSS matrix regarding Cu retention. In contrast, composites produced with CuO exhibited lower Cu retention, reflecting less effective Cu immobilization in the charred matrices, regardless of the pyrolysis temperature.
The FSS composites doped with CuSO45H2O exhibited higher Cu content due to the presence of oxygen-containing functional groups, such as C-OH and COOH, which have a high capacity for Cu sorption [54]. Additionally, FSS biochars produce a high nutrient content and offer considerable soil acidity neutralization capacity, highlighting their potential as fertilizers and soil conditioners [40,41]. On the other hand, composites (CSC/CS-3) achieved higher Cu levels due to their greater aromaticity, which surpasses that of FCM, as shown in the study by [51]. The enhanced aromatic structure of FSC biochars contributes to a more efficient retention and stabilization of Cu, making them more effective in agricultural applications.
Additionally, the solubility of Cu varied among the composites, assessed via Cu-source water solubility index, NAC index, and CA% index. CSS/CS-3 had the highest solubility indices for different extracting solutions (W: 63%, NAC: 69%, CA%: 50%), indicating its capacity for controlled Cu release, which is beneficial for environmental applications and wheat nutrition in the long term (Table 5).
Values are the treatment means (n = 3); copper in H2O was determined ± 0.01 in water at a ratio of 1:10 (w/v); content of soluble copper in total (T) was determined by total digestion of the composites; copper in neutral ammonium citrate water (NAC); copper in content of copper soluble in citric acid at 2% (CA%); H2O Index, NAC Index, and CA% Index represent the copper content with the extractors and the total copper content. Composites: CCM/CS-3: chicken manure + copper sulfate pyrolyzed at 300 °C; CCM/CO-3: chicken manure + copper oxide at 300 °C; CCM/CS-5: chicken manure + copper sulfate at 550 °C; CCM/CO-5: chicken manure + copper oxide at 550 °C; CSC/CS-3: shrimp waste + copper sulfate at 300 °C; CSC/CO-3: shrimp residue + copper oxide at 300 °C; CSC/CS-5: shrimp residue + copper sulfate at 550 °C; CSC/CO-5: shrimp residue + copper oxide at 300 °C; CSS/CS-3: sewage sludge + copper sulfate at 300 °C; CSS/CO-3: sewage sludge + copper oxide at 300 °C; CSS/CS-5: sewage sludge + copper sulfate at 550 °C; CSS/CO-5: sewage sludge + copper oxide at 550 °C.
Radar chart analysis emphasized the variable efficacy of different biochars in adsorbing and retaining Cu, whose magnitude relies upon the feedstock and temperature applied during pyrolysis (Figure 1). Biochars derived from BCM-3, BCM-5, BSC-3, and BSC-5 displayed enhanced Cu chemical species and composite Cu solubility indices, contrasting with those from BSS-3 and BSS-5, which showed reduced agronomic effectiveness. Cluster analysis highlighted distinct chemical behaviors among the composites, particularly concerning Cu content and solubility indices. Variations were noted in the chemical properties of the composites, such as pH, EC, VM, ash content, FC, and C and N levels, influenced by both the temperature and the feedstock used in the composite production.
The composites synthesized at higher temperatures tend to increase FC and reduce VM, which not only enhances the longevity of Cu in the soil but also minimizes nutrient leaching, making it a more sustainable option for enhancing soil fertility over the long-term. In addition to improving nutrient use efficiency, this strategy contributes to C sequestration in the soil, reducing carbon emissions associated with the decomposition of organic matter. These characteristics align with the findings of other studies, which have noted that higher pyrolysis temperatures generally improve biochar’s chemical and physical stability, thereby reducing the environmental mobility of macro- and micronutrients [55].
Incorporating CuO into the matrix provides a strategic advantage in the dynamics of Cu delivery. Unlike CuSO45H2O, CuO is much less soluble, which regulates the Cu release rate, preventing excessive initial bioavailability that could lead to plant toxicity. This slow-release mechanism ensures a steady supply of this essential micronutrient, which is crucial for plant health. It supports enzymatic processes, chlorophyll synthesis, and promotes root development by enhancing root elongation and biomass accumulation. The controlled Cu availability also improves nutrient uptake efficiency, ensuring a balanced allocation of nutrients between roots and shoots. This not only fosters robust root systems but also contributes to better overall plant growth and resistance to environmental stresses.
This controlled release also aligns with sustainable agricultural practices, minimizing the risk of Cu leaching into groundwater, thus protecting the environment and adhering to increasingly stringent regulations concerning soil and water quality [56]. The application of CCM/CO-5 has the potential to significantly improve Cu retention capacity, offering a more controlled and sustained release of Cu in the soil. This is particularly advantageous in agricultural contexts, where Cu toxicity can be a concern [57].

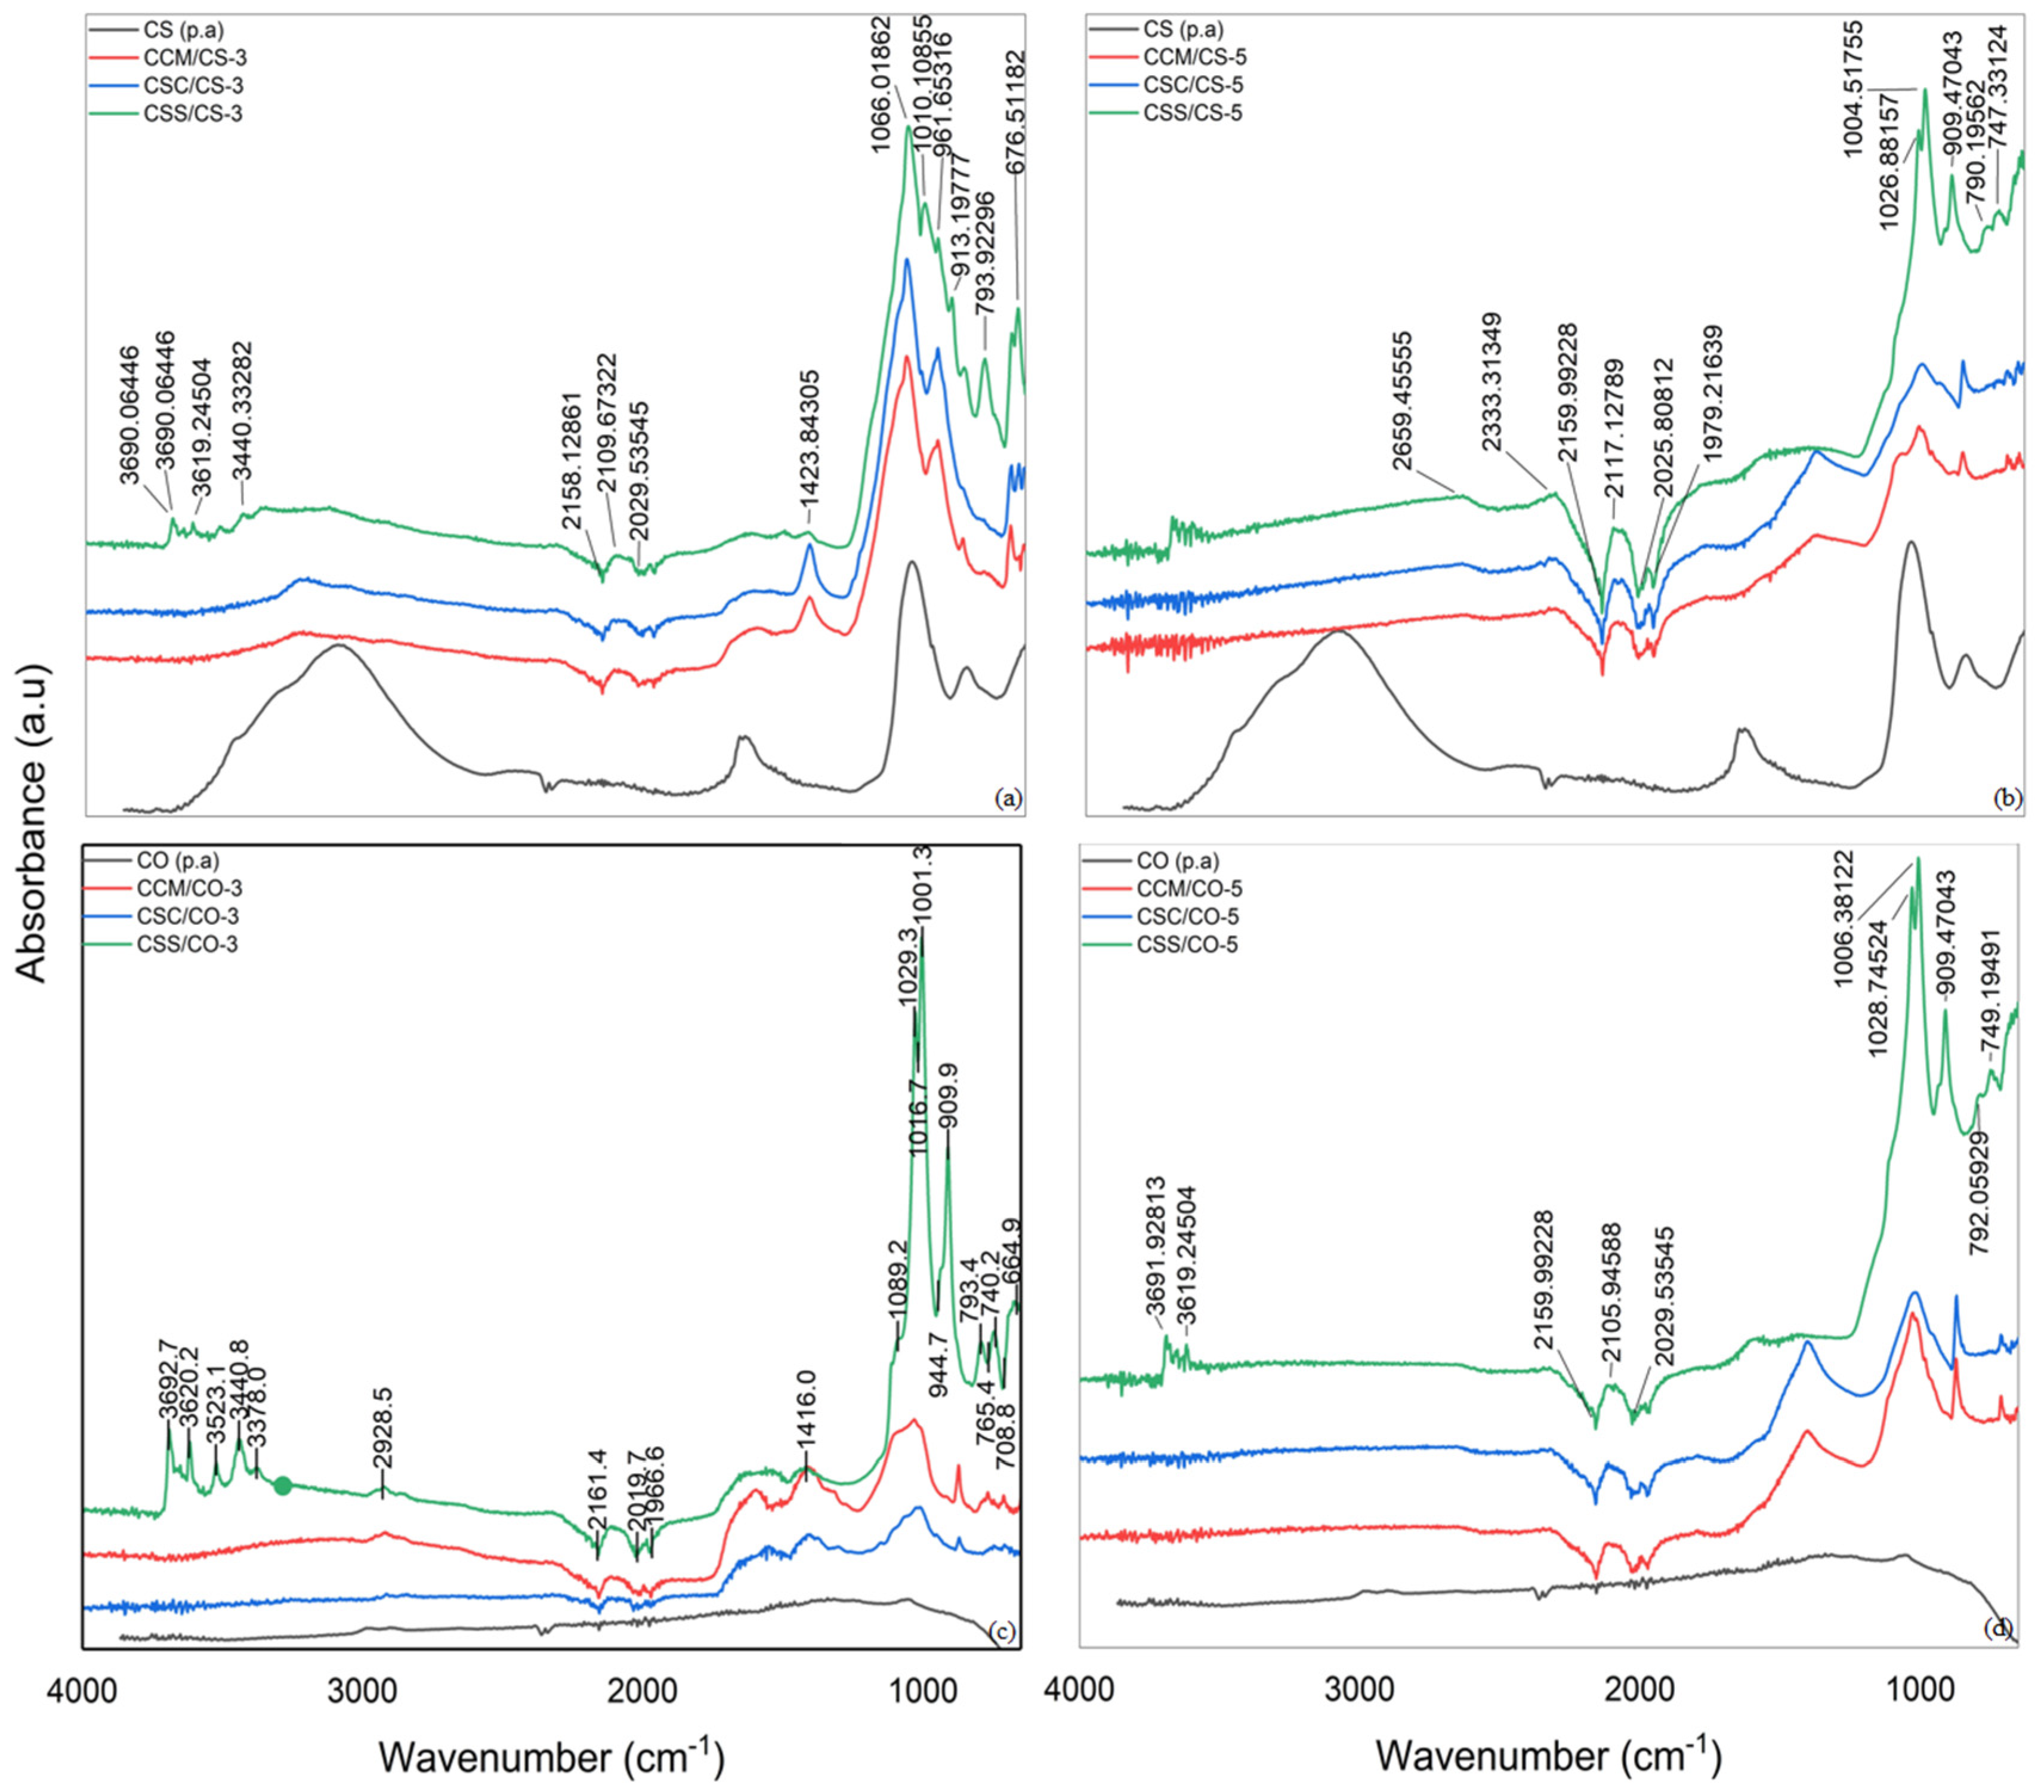
3.2. Infrared Spectroscopy

Fourier transform infrared spectroscopy with attenuated total reflection (ATR-FTIR) was employed to characterize the functional groups present in the composites produced from biochar doped with CuSO45H2O and CuO at two different temperatures, 300 °C and 550 °C (Figure 2).
The FCM e FSC, rich in nitrogenous compounds and organic matter, provides an excellent base for composite production. Upon doping, especially at higher temperatures, there is an enhancement in the functionalization of specific groups, such as amides and amines, as evidenced by the FTIR peaks. At the same time, the FSC, which is rich in chitin, showed an increase in chitin-related functional groups, such as amines and amides, evidenced by peaks at 1650 cm−1 and 1550 cm−1 [51]. The samples treated with CuSO45H2O and CuO at 300 °C and 550 °C show significant differences in their FTIR spectra.
In the composites doped with CuSO45H2O at 300 °C (Figure 2a), significant peaks are observed in the 3200–3600 cm−1 region, attributed to the stretching vibrations of hydroxyl (O-H) groups, suggesting the presence of alcohols or phenolic compounds. Peaks around 1650–1750 cm−1 indicate the presence of carbonyl-containing compounds, such as ketones, aldehydes, or carboxylic acids, while the C-O stretching vibrations (1000–1300 cm−1) suggest the presence of alcohols, esters, and ethers. In the composites treated at 550 °C (Figure 2b), there is an increase in the intensity of peaks related to oxygenated functional groups, such as C=O and C-O, indicating more pronounced oxidation of the material. This suggests that higher temperatures promote more intense thermal decomposition of volatile organic compounds, exposing more functional sites in the carbon structure [58]. Peaks at 1100 cm−1, 650 cm−1, and 1000–1200 cm−1 correspond to S=O stretching, O=S=O bending, and S-O stretching in sulfates, respectively.
For the composites doped with CuO at 300 °C (Figure 2c), the less pronounced peaks in the 3200–3600 cm−1 region indicate a reduction in OH-containing compounds. The presence of peaks around 1650–1750 cm−1 suggests the presence of carbonyl compounds. The C-O stretching between 1000 and 1300 cm−1 indicates the presence of esters, ethers, and alcohols. At 550 °C (Figure 2d), the composites doped with CuO show broadening or shifting of the C=O peaks around 1700 cm−1 and OH peaks around 3400 cm−1, indicating possible interactions with organic compounds, potentially forming hydroxides or by adsorbing water. The presence of C≡C stretching in the 2100–2260 cm−1 region suggests the formation of triple carbon bonds. Materials doped with CuO exhibited ester stretching, primarily observed in the ranges of 1050–1150 cm−1 for simple C-O stretching and 1735–1750 cm−1 for C=O stretching, differentiating from carboxylic acids [59].

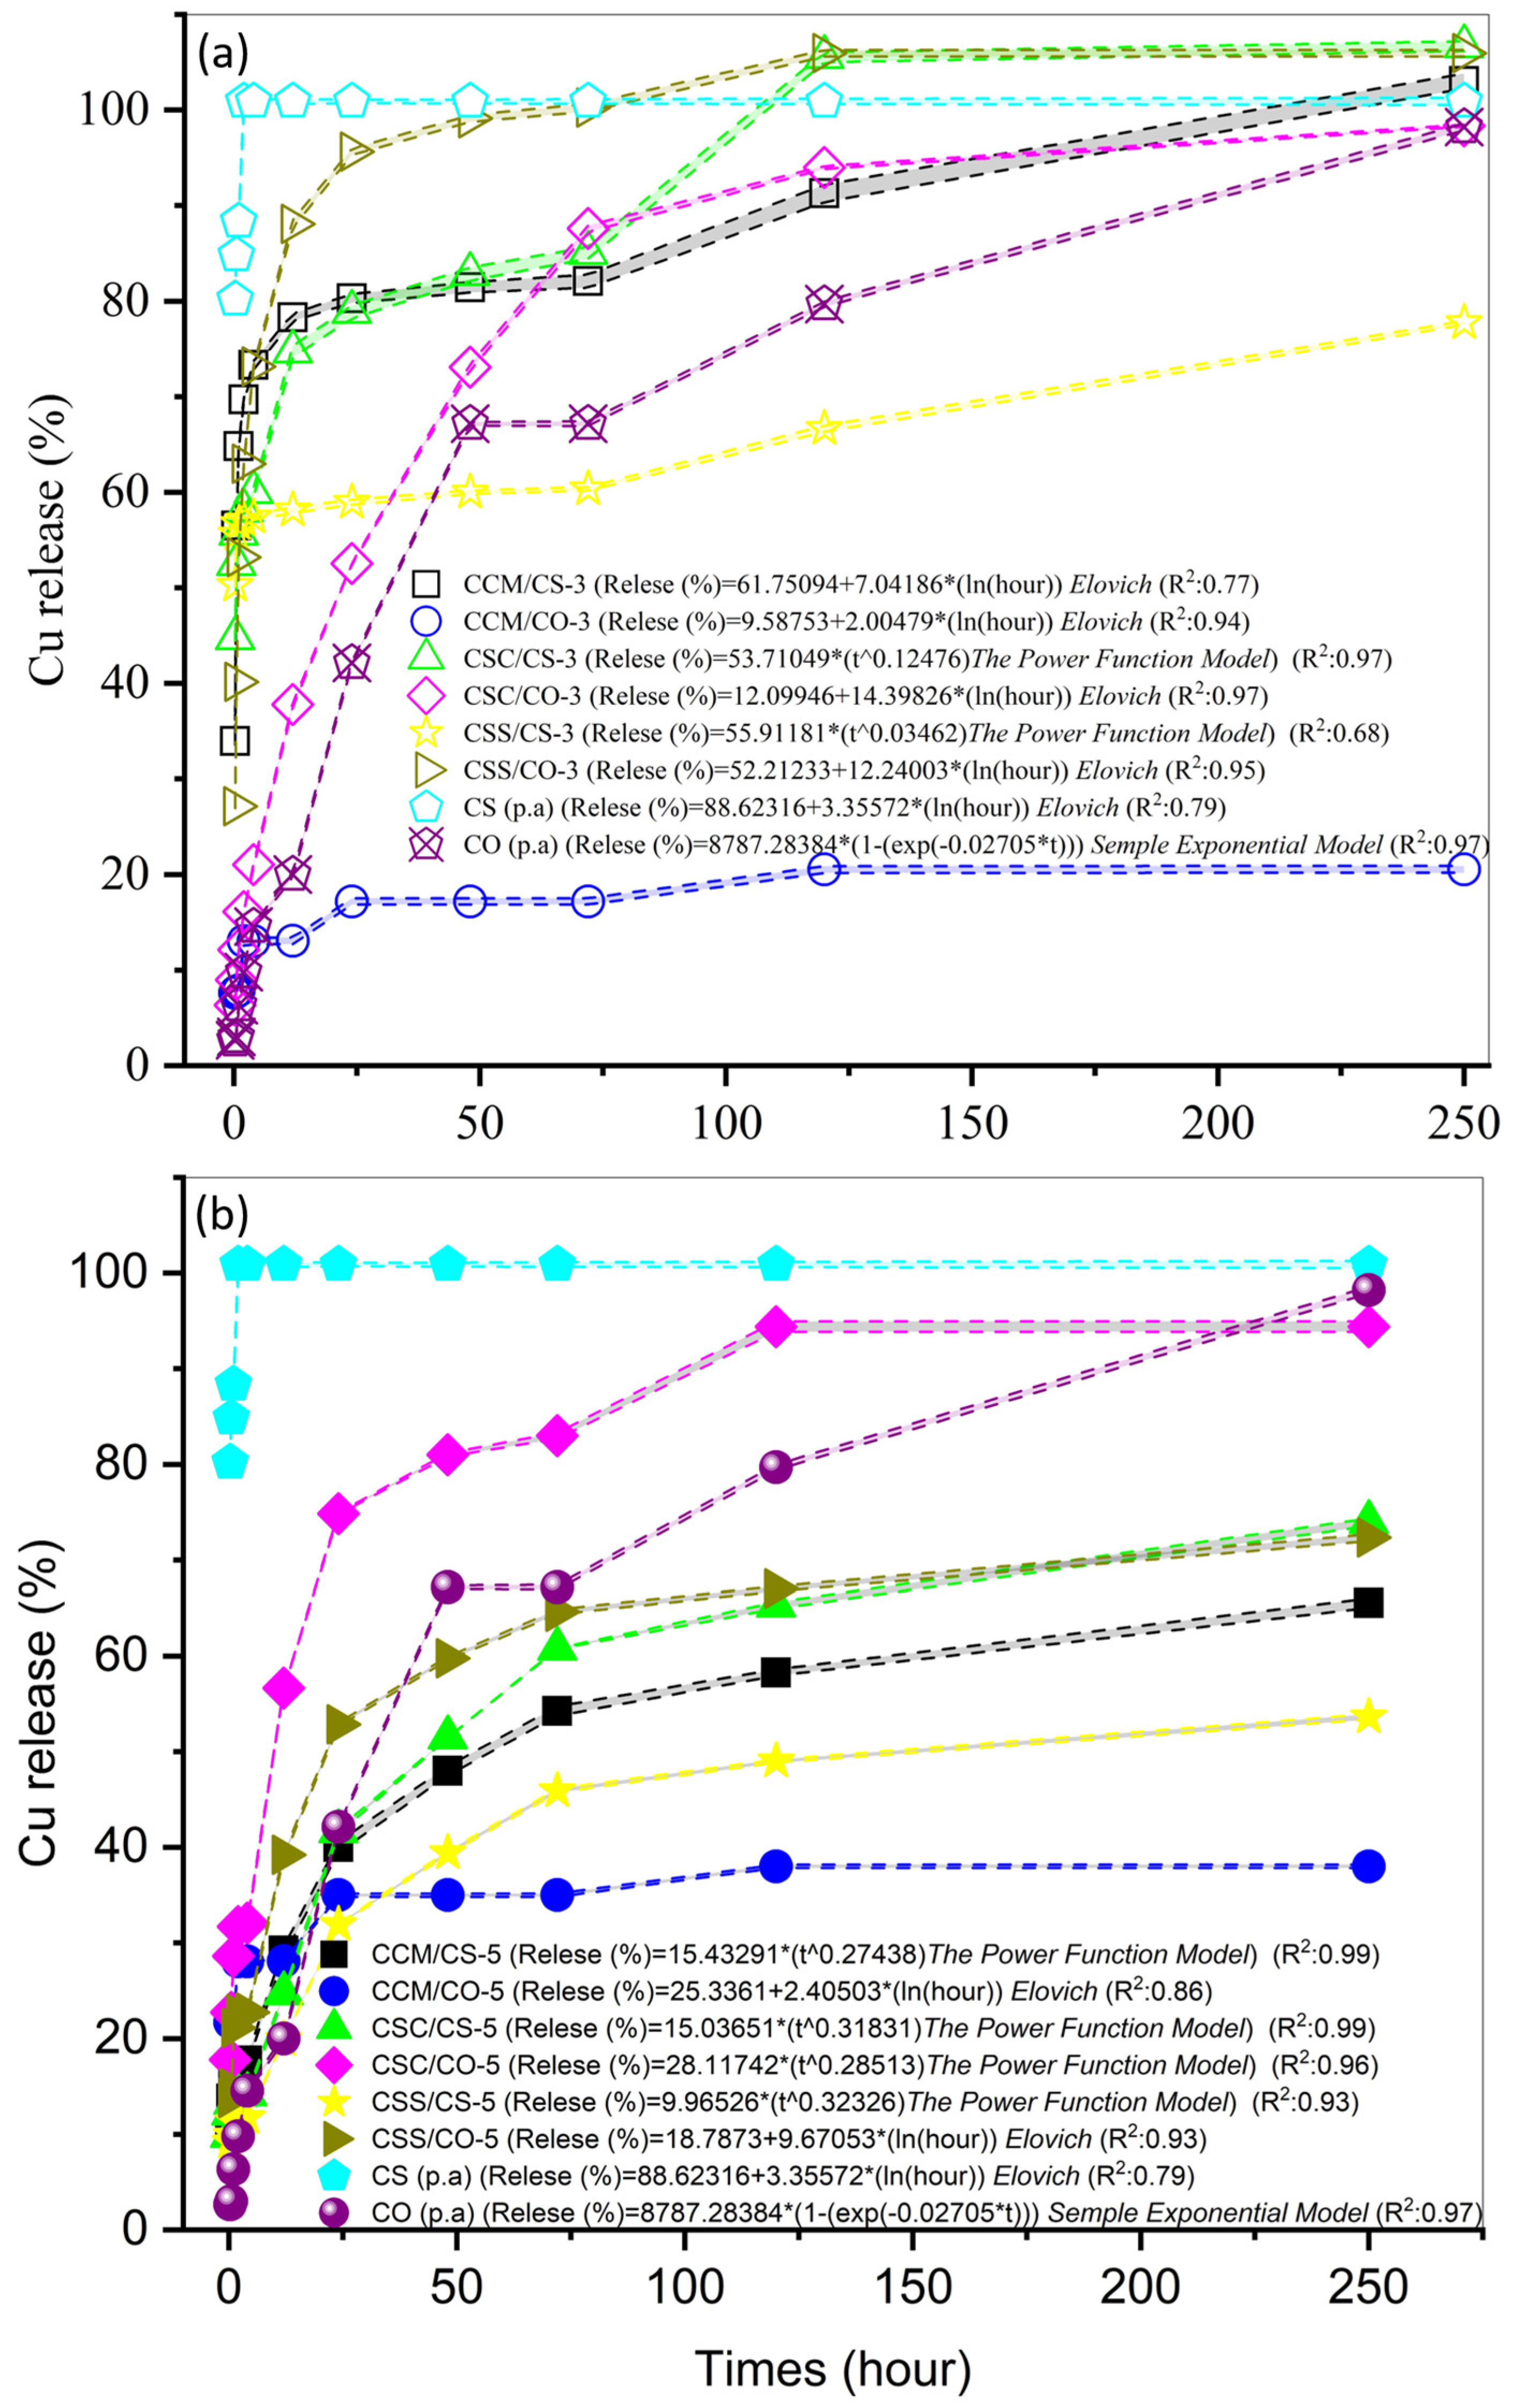
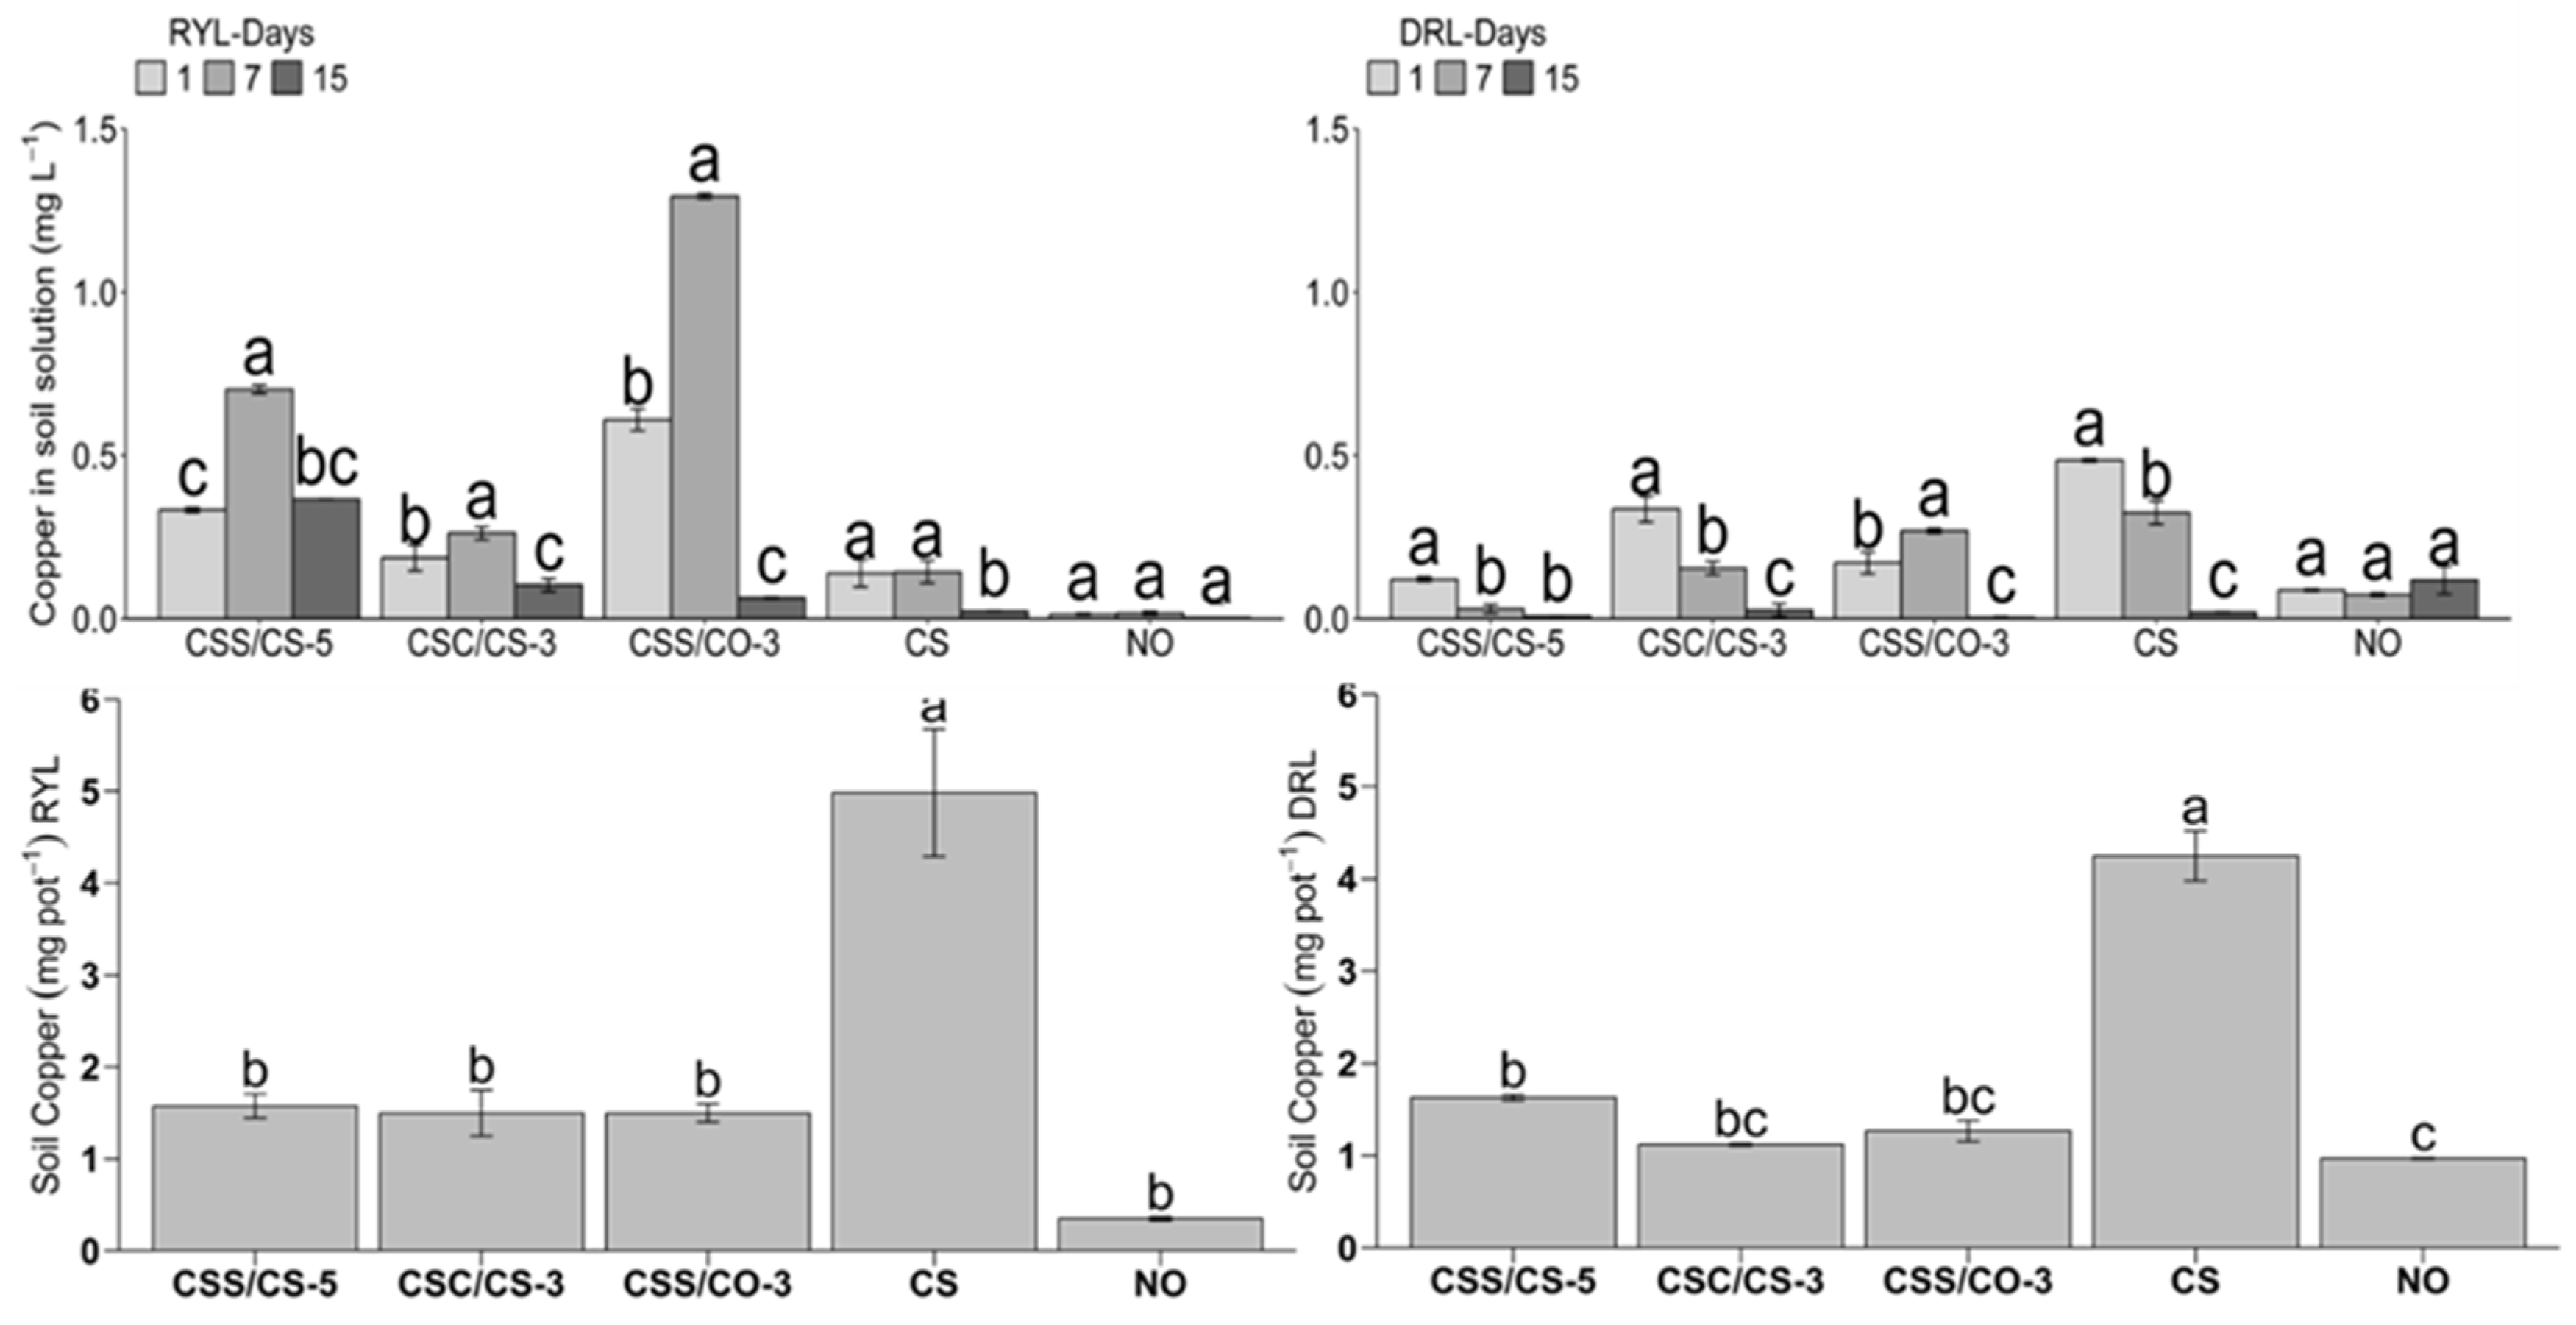
3.3. Kinetics of Cu Release

The pyrolyzed composites at 300 °C exhibited a more gradual release of Cu than those processed at 550 °C. This indicates that lower temperatures may facilitate the formation of more stable Cu complexes within the matrix, which could benefit applications requiring controlled Cu release, such as in agricultural settings or crop fertilization (Figure 3).
Composites such as CCM/CS-3 and CSC/CS-3 showed a less gradual Cu release compared to those containing CuO as the Cu source. This suggests that CuSO45H2O may form chemical bonds within the biochar matrix, resulting in a controlled and consistent release of Cu ions over time, as observed by [60]. The type of organic matrix and the Cu additive significantly impacted the release kinetics, as revealed by CSS/CS-3, which released more slowly than CuO. Composites with CuO exhibited a slower and more controlled release profile compared to those made with CuSO45H2O, indicating that CuSO45H2O interacts more effectively with organic components.
The release kinetics followed various models, including the Elovich model, the Power Function model, and the Simple Exponential model, with different degrees of fit (R2 values). For instance, composites fitting the Elovich model, such as CCM/CO-3 (R2 = 0.94), suggest a chemisorption process, whereas those following the Power Function model indicate a more complex, multi-phase release process. These differences emphasize the importance of selecting appropriate models to predict the behavior of biochar composites under different conditions.
At 550 °C, all composites demonstrated an increased rate of Cu release, with CSC/CO-5 showing the fastest release. This higher release rate can be attributed to the increased temperature destabilizing the Cu matrix interactions, leading to quicker dissolution and availability of Cu, as reported by [53]. Higher pyrolysis temperatures also raise pH levels, transforming Cu salts into CuO and causing, especially in ash-rich matrices, a reduction in the release rate of the composite in CA% solution. The type of biomass used for biochar production influences these outcomes, with high-ash content materials further increasing pH and promoting Cu precipitation. Therefore, understanding the interplay between pyrolysis temperature, biomass composition, and pH is essential for optimizing biochar for Cu fertilization in tropical soils.

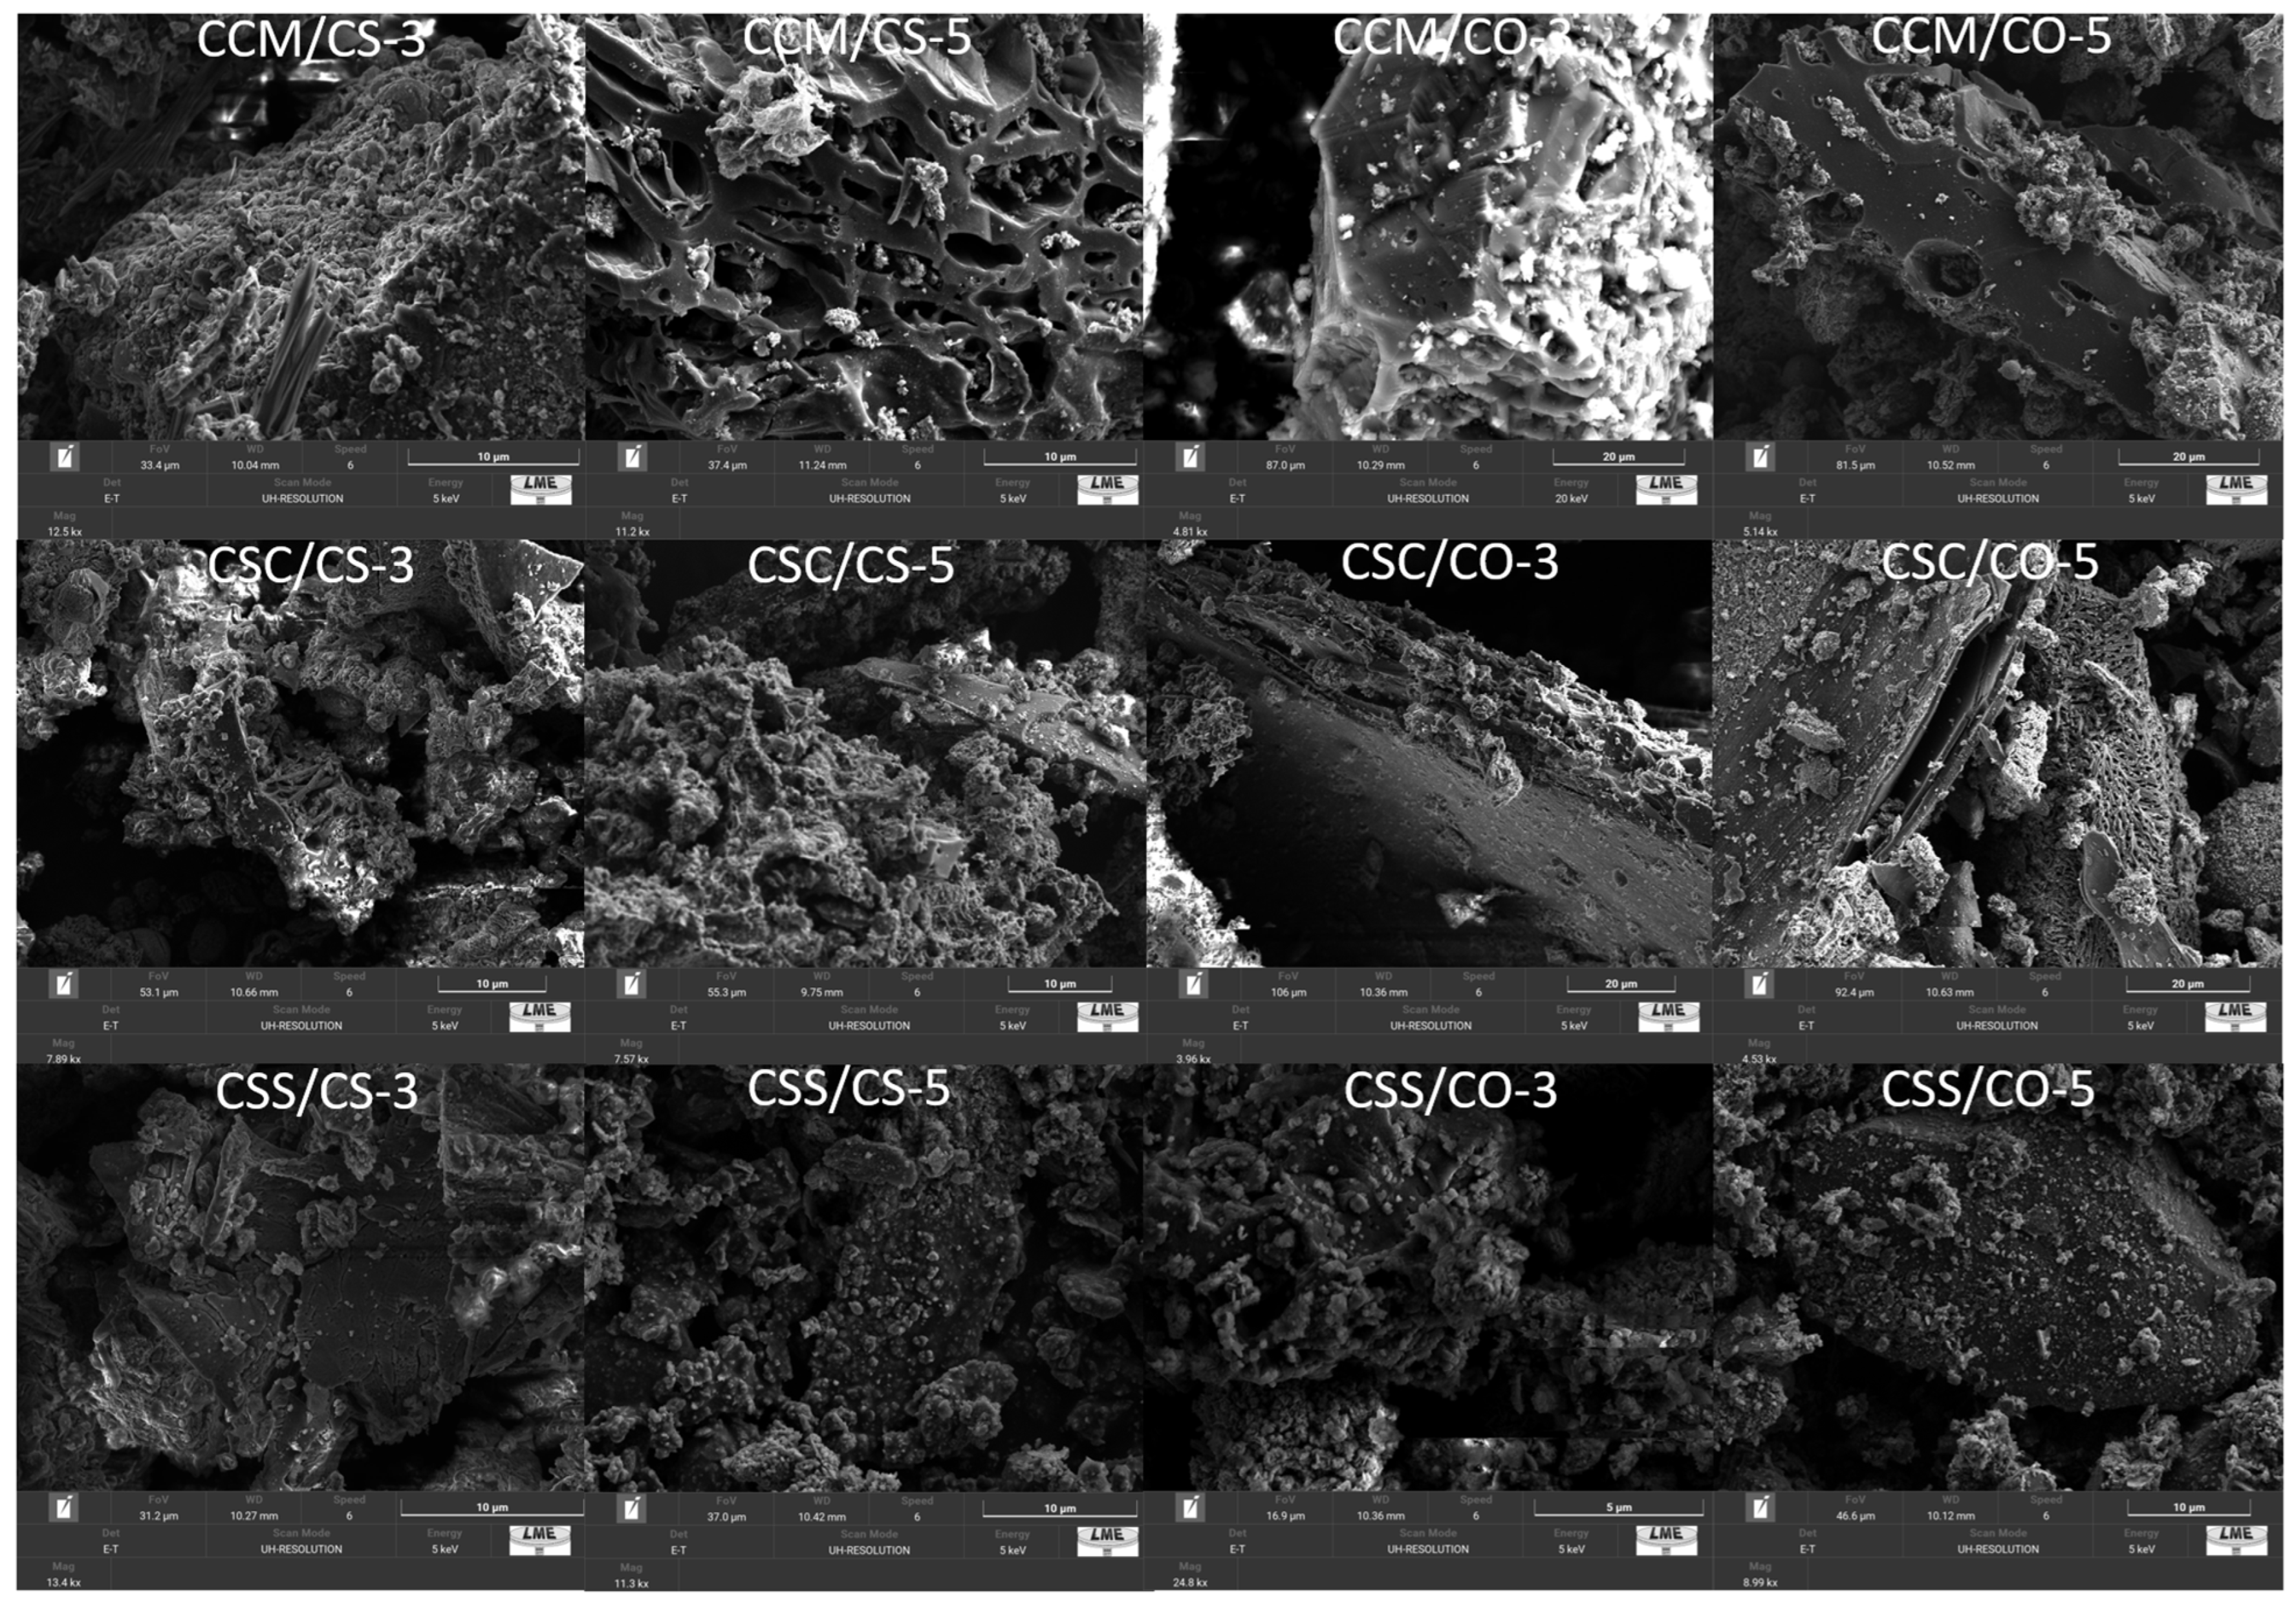
3.4. Scanning Electron Microscopy

Scanning Electron Microscopy (SEM) images revealed differences in the microstructure of composites processed at varying temperatures (Figure 4). At 300 °C, the composites retained a more defined and structured morphology, indicating that this lower temperature is sufficient to preserve the composite matrix’s integrity. In contrast, at 550 °C, the SEM images showed clear signs of deformation and structural breakdown, suggesting that higher temperatures cause more intense thermal degradation of organic components.
FCM is rich in organic and inorganic nutrients, particularly N, P, and K [61]. SEM analysis of composites containing FCM, such as CCM/CS-3 and CCM/CS-5, reveals a relatively porous and homogeneous structure. This porosity benefits applications requiring high specific surface areas, such as contaminant adsorption. However, thermal degradation of organic components at 550 °C results in a less defined and more fragmented structure, indicating the volatilization of organic materials [62].
FSC is rich in chitin, a polysaccharide that contributes to the rigidity and structural integrity of the composites [63]. Thus, composites CSC/CS-3 and CSC/CS-5 exhibit a distinct morphology with robust structures and more uniform Cu distribution when doped with CuSO45H2O. The presence of chitin provides greater thermal resistance up to 300 °C. However, at higher temperatures (550 °C), a more pronounced degradation occurs, resulting in increased porosity and potential structural collapse.
FSS is a complex feedstock comprising organic and inorganic substances [39]. Composites CSS/CS-3 and CSS/CS-5 derived from FSS show a highly porous structure and heterogeneous distribution of elements. The chemical complexity of FSS can lead to varied interactions with Cu dopants (CuSO45H2O or CuO), resulting in diverse morphologies. SEM analysis shows that, at 300 °C, the composites maintain reasonable structural integrity, while at 550 °C, the structure becomes significantly more porous, indicating intense thermal decomposition.

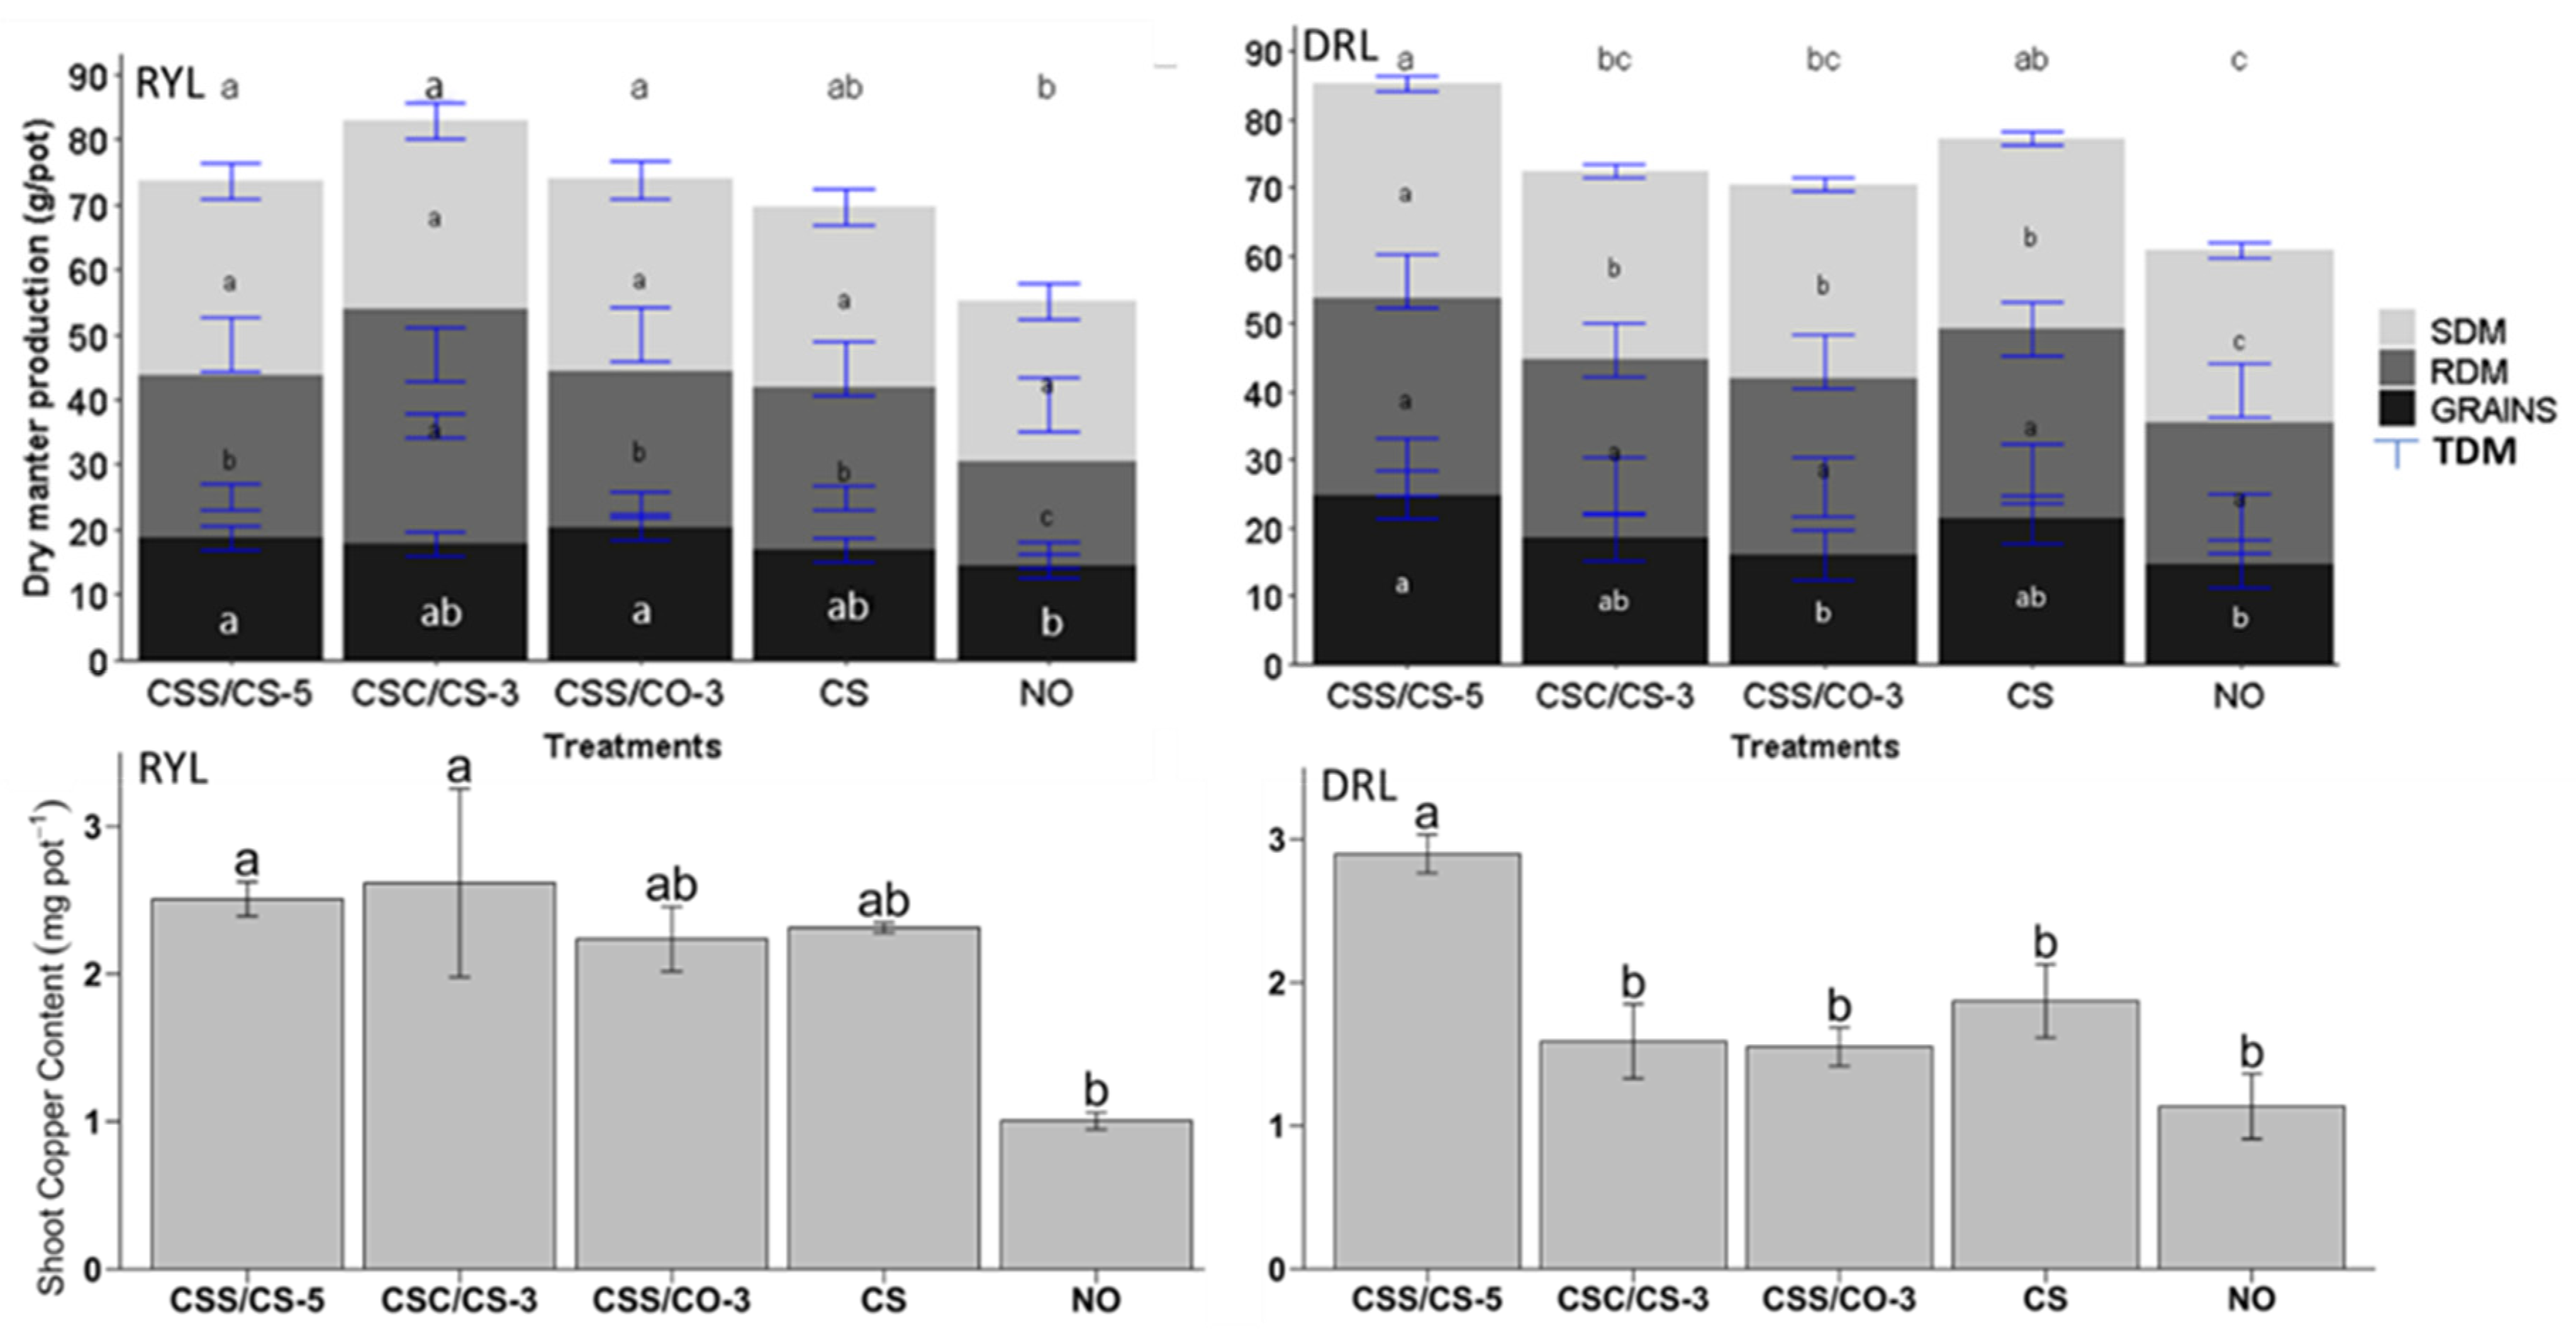
3.5. Agronomic Impact of Composites on Wheat Growth

The effect of composite fertilization on the growth characteristics of wheat and Cu nutrition in different types of Oxisols was evaluated by analyzing Shoot Dry Matter (SDM), Root Dry Matter (RDM), Grain Dry Matter, and Total Dry Matter (TDM) under various treatments (Figure 5). The study was conducted on two soil types: Yellow-Red Oxisol (RYL) and Dystrophic Red Oxisol (DRL).
In RYL, differences in TDM and SDM production were observed among the treatments. The highest production was observed in the CSS/CS-5, CSC/CS-3, and CSS/CO-3 treatments, which outperformed both the control (NO) and copper sulfate (CS) treatments. Similar results have been reported in other studies, where Cu in organic form showed superior outcomes to the given controls [64]. RDM was notably higher in the CSC/CS-3 treatment. The CSS/CS-5 and CSS/CO-3 treatments for grain production were particularly effective, indicating that combining FSS with a Cu source boosts productivity. This enhancement is attributed to the redox-active functional groups in the matrix, which play an important role in facilitating electron transfer [65]. The NO treatment consistently resulted in the lowest dry matter production, underscoring the importance of Cu supplementation in this soil type.
In contrast, the DRL soil demonstrated a unique pattern in dry matter production. The CSS/CS-5 treatment achieved the highest TDM, SDM, RDM, and grain production, followed closely by the CSC/CS-3 treatment. The differences between the top-performing treatments and the control (NO) were more pronounced in DRL, with the NO treatment showing significantly lower dry matter production across all parameters. In this context, FCS is rich in calcium, chitin, and protein, and as a carbon source, can produce biochar containing residual calcium and nitrogen [66,67], providing active functional groups that form strong complexes with metals according to the literature [68].
Interestingly, the CuSO45H2O treatment performed better in DRL than in RYL, although it still lagged behind the composite treatments. The CSS/CO-3 treatment also showed an improvement in TDM compared to the control, similar to the results seen in RYL but with a relatively larger increase. However, CuO (CSS/CO-3) was less effective in enhancing wheat productivity than the other composites. This is due to the concentration of H+ in the solution, as Cu atoms in CuO-biochar are not easily converted into free Cu2+. This conversion affects the activation of superoxide radicals (O2−) [69], which in turn modulates the intensification of the adsorption strength [70]. These findings indicate that soil type significantly affects the efficacy of different fertilization treatments. The greater effectiveness of composite treatments in both soil types underscores their potential for boosting wheat productivity in the long term.
This study evaluated the impact of Cu accumulation on the dry matter production of wheat in contrasting Oxisols. Understanding how different fertilization treatments influence nutrient uptake in nutrient-poor soils is crucial for developing sustainable agricultural practices. In RYL, the treatments CSS/CS-5 and CSC/CS-3 resulted in the highest copper accumulation in the total dry matter of wheat, with average values around 2.5 mg per pot. These treatments were not notably different. Still, they were significantly higher than the control (NO), which had the lowest Cu accumulation: less than 1.0 mg per pot (Tukey’s test, p < 0.05). The CSS/CO-3 treatment also led to relatively high copper accumulation, although not as high as that of CSS/CS-5 and CSC/CS-3. Treatment with pure CuSO45H2O (p.a) resulted in intermediate Cu accumulation, indicating that adding organic compounds to CuSO45H2O can further increase Cu uptake and accumulation by plants [71].
These results suggest that combining organic materials with Cu sulfate at high temperatures significantly improves Cu availability in RYL. The thermal treatment likely modifies the organic matrix, enhancing the mobilization and solubility of Cu, which aligns with previous studies that have shown improved nutrient uptake with organic amendments [72].
In DRL, the effects of the treatments were more pronounced. The CSS/CS-5 treatment led to the highest Cu accumulation in total dry matter, averaging over 3.0 mg per pot, significantly higher than all other treatments. The CSC/CS-3, CSS/CO-3, and CS treatments had similar Cu accumulations, all significantly higher than the control (NO), which had the lowest accumulation, around 1.0 mg per plant. This indicates that, while all Cu treatments improved Cu nutrition compared to the control (no Cu supplied to plants), CSS/CS-5 was the most effective in promoting wheat growth and grain yield.
This study also assessed the availability of Cu in the soil solution and the residual Cu extracted by EDTA (Figure 6). The graph presents the results of Cu-based fertilization on soil solution, comparing different treatments over 1, 7, and 15 days. Analyzing these treatments in RYL and DRL provides insights into the dynamics of Cu availability in various soil types.
In RYL, characterized by its sandy texture and low organic matter content, the concentration of Cu in the soil solution varied significantly over time within each treatment. All composite treatments (CSS/CS-5, CSC/CS-3, and CSS/CO-3) showed a notable increase in Cu concentration from day 1 to day 7, followed by a reduction on day 15. This initial spike and subsequent decrease can be attributed to the high initial solubility and subsequent precipitation or adsorption of Cu onto soil particles. The CSS/CS-5 and CSC/CS-3 treatments demonstrated effective initial Cu release due to their high ash content and thermal processing, likely increasing the bioavailability of Cu. The drop in Cu concentration by day 15 suggests that these treatments provide a controlled release, preventing excessive leaching and ensuring sustained availability of Cu.
Similarly, CSS/CO-3 peaked at day 7, followed by a decline at day 15, indicating its lower solubility and gradual release of Cu, which is beneficial for maintaining adequate nutrient levels over time. The pure CS treatment exhibited high solubility with no notable difference between days 1 and 7. Still, there was a drastic decrease by day 15, reflecting Cu’s quick release and rapid leaching, making it less effective for long-term nutrient supply. The control (NO) treatment maintained consistently low Cu concentrations, indicating negligible background Cu levels in the soil solution. These observations suggest that the composite treatments, especially CSS/CS-5 and CSC/CS-3, are more effective in providing a sustained release of Cu in RYL, enhancing nutrient availability and reducing the risk of leaching in sandy soils.
In DRL, which is more clayey and has higher organic matter content, the concentration of Cu in the soil solution also varied over time within each treatment, but with different patterns compared to RYL. The CSS/CS-5 and CSC/CS-3 treatments showed an increase in Cu concentration from day 1, followed by a marked decrease on subsequent days. The high initial release could be due to the enhanced interaction between the clay particles and Cu, which is then followed by adsorption onto the soil colloids, reducing the Cu concentration in the solution by day 15. CSS/CO-3, unlike RYL, exhibited an increase in Cu concentration from day 1 to day 7 and a decrease by day 15, with all means notably different from each other, suggesting a more controlled release and efficient nutrient supply suitable for the higher organic matter content of DRL. Similarly to RYL, the CS (p.a) treatment showed a quick initial release of Cu with a drop by day 15, indicating its less effective long-term nutrient availability due to rapid leaching. The control (NO) treatment maintained consistently low Cu concentrations, reflecting the minimal background levels of Cu in the soil solution. The higher organic matter and clay content in DRL facilitate stronger adsorption and complexation of Cu, leading to a more pronounced fluctuation in Cu availability. The CSS/CS-5 composite, with its high-temperature treatment enhancing porosity and nutrient retention, proved particularly effective in DRL, ensuring a more sustained and controlled release of Cu.
The graph illustrates the effect of Cu-based fertilization on EDTA-extractable Cu residues in contrasting Oxisols cultivated with wheat. In the sandy-textured RYL soil with low organic matter, the CS (p.a) treatment resulted in the highest residual Cu concentration, significantly surpassing other treatments (p < 0.05). This aligns with the high solubility of CuSO45H2O, which enhances immediate availability but also leads to greater residual accumulation, as reported by CuSO45H2O [73], potentially increasing the risk of phytotoxicity, consistent with findings in [74].
The organic composite treatments (CSS/CS-5, CSC/CS-3, and CSS/CO-3) exhibited similar residual Cu concentrations, significantly higher than the control (NO) but lower than the CS treatment. Due to their high ash content and thermal processing, these composites provide a more gradual Cu release, resulting in lower residual concentrations after initial plant uptake. Studies have found that Cu–biochar can reduce residual Cu levels in the soil, improving soil quality and plant health in the long term [74] while also reducing the risk of leaching and environmental contamination [71]. This controlled release mechanism is particularly advantageous in sandy soils with low cation exchange capacity (CEC), as it reduces the risk of Cu leaching.
In the DRL, which has a clayey texture and a higher organic matter content, the pattern was similar, with the CS treatment resulting in the highest residual Cu concentration, significantly higher than other treatments (p < 0.05). However, there was greater variability among the organic composites. The CSS/CS-5 treatment exhibited a significantly higher residual Cu concentration than CSC/CS-3 and CSS/CO-3 but was still lower than the CS treatment. This can be attributed to differences in the composition and thermal processing of the organic composites, affecting Cu release rates and mobility. The higher CEC and organic matter content in DRL enhance Cu retention, resulting in more complex interactions between organic matter and soil components, which may explain the observed variability [73].
Comparative analysis between the two soils reveals that RYL retains less residual Cu from organic composite treatments than DRL. This is likely due to the distinct physicochemical properties of the soils, such as CEC, pH, and organic matter content, which influence Cu retention and mobility. RYL’s sandy texture and lower CEC result in less effective Cu retention, leading to lower residual concentrations. DRL’s higher clay content and organic matter enhance Cu adsorption and retention, resulting in higher residual levels.
These findings highlight the significant effects of Cu-based fertilization on soil Cu availability and residuals. The CS (p.a) treatment resulted in the highest residual Cu concentrations, reflecting rapid release and a higher tendency for accumulation. Conversely, organic composites, particularly high-temperature treatments like CSS/CS-5, exhibited controlled Cu release with lower residual accumulation. These results suggest organic composites as a sustainable fertilization option, enhancing Cu availability while minimizing soil accumulation. This approach supports long-term soil fertility management and crop succession without excessive reliance on Cu fertilization [75]. This innovative approach enhances agricultural productivity while promoting environmental sustainability by mitigating the harmful effects of elevated Cu levels in contaminated soils.

4. Discussion

4.1. Chemical Properties of the Composites

The influence of pyrolysis temperature and the type of organic matrix are critical factors affecting Cu solubility. The pyrolysis temperature of 550 °C leads to decreased Cu solubility, as evidenced in CCM/CS-5, CSC/CS-5 and CSS/CS-5 where Cu was nearly insoluble in water, CA% and NAC solutions. This suggests that high pyrolysis temperatures of 550 °C reduce the mobility of Cu in the soil–plant system by reducing its solubility [44].
The CuSO45H2O–biochar composites decrease the solubility of Cu in all tests as the temperature increases, while the CuO–biochar composites increase the solubility of Cu in response to rising temperature. An exception is the CSS/CO-5 composite, which shows a reduction in solubility in CA%. This is consistent with studies showing the conversion of Cu2+ to CuO and Cu monomers [48], CuSO45H2O–biochar decomposes CuSO4 into CuO, releasing SO3 and/or SO2, resulting in a slight reduction in solubility.
The chemical stability and high solubility was notably identified in the CSS/CS-3 composite, which maintained solubility in all tested indices (water, CA, and NAC), indicating notable potential for use as a Cu source [76]. At 550 °C, CuO–biochar increases solubility in CA%, an acidic chelating agent capable of solubilizing various forms of Cu, including oxides and carbonates [77]. This enhances thermal stability and maintains Cu availability after treatment, except in CuO–biochar composites, which remain more stable with the FSS matrix charring at 550 °C. In alkaline conditions, less soluble Cu atoms of CuO–biochar are converted into Cu2+, which effectively activates superoxide radicals (O2−) [69], promoting the thermal degradation of organic functional groups and adsorption and precipitation of Cu chemical species [70].
Organic matrices rich in humic substances, such as those found in the composted FSS, tend to form more stable complexes and is supposed to be less prone to thermal degradation during pyrolysis, particularly when treated at high temperatures, as seen in CSS/CS-5, this not only enhances Cu retention but also alters its availability in the soil–plant system. Studies have shown that the total concentrations of Cu and other elements increased with the conversion of FSS into biochar and higher pyrolysis temperatures [78,79,80].
The choice of CuSO45H2O versus CuO and its interaction with the contrasting feedstocks significantly determine the composites’ physical and chemical properties. Overall, CuSO45H2O interacts effectively with the feedstock during the pyrolysis process, likely due to its higher solubility over CuO, influencing the stability, reactivity and solubility, and the release rate of Cu in the final composite. These findings highlight the importance of selecting appropriate Cu sources and the pyrolysis conditions to optimize the environmental and agricultural benefits of Cu-enriched composites [53].
Radar data indicate that the highest temperature of 550 °C enhanced Cu stabilization, as demonstrated by nutrient availability indices in different chemical extractors (I-NAC, I-CA%, I-W). These findings suggest that the interplay between pyrolysis conditions and feedstock type directly influences Cu availability in soil (Figure 1). A direct correlation was observed between the pH values of the composites and EC with soil Cu availability, suggesting that the alkalinity induced by pyrolysis, consequently by biochar, could affect Cu mobility and availability in soil [7].
Composites formulated with CuSO45H2O might contribute to increased Cu availability compared to those using CuO due to the sulfate component in CuSO45H2O, which can enhance the solubility and availability of Cu. Conversely, composites with CuO exhibit more restrained Cu release, indicating a more stable incorporation of Cu into the biochar matrix [48]. This observation is vital for the applications of these composites as sources of nutrients or as a strategy for contaminant remediation [81]. Moreover, composites made with CuO may have a lower impact on the pH and EC of the resulting biochar compared to those treated with CuSO45H2O, as sulfate can potentially increase the acidity and electrical conductivity of the composites. This aspect is crucial when considering biochar for soil amendment, as pH and EC significantly influence soil chemistry and plant nutrition and growth [44].

4.2. Infrared Spectroscopy

The different feedstocks resulted in varied FTIR profiles and spectroscopic signatures, reflecting differences in the functionalization and organic and mineral groups and interactions in the composite matrices doped with copper. Biochar derived from FCM showed a high presence of nitrogenous groups, with C≡N stretching standing out in the 2100–2260 cm−1 range, attributable to the high nitrogen content in the feedstock [59]. Conversely, FSC, rich in chitin, showed increased chitin-related functional groups, such as amines and amides, evidenced by peaks at 1650 cm−1 and 1550 cm−1 [82].
The peaks observed in the samples doped with CuSO45H2O at 550 °C, such as those in the 1000–1300 cm−1 (C-O) and 3200–3600 cm−1 (O-H) regions, suggest a greater incorporation of oxygen functional groups, which can be beneficial for pollutant adsorption applications in which such functionalities facilitate the interaction of the charred matrix with heavy metals and other organic compounds generated in the pyrolysis process [83].
As shown in the graph, the CuSO45H2O-doped composites exhibit notable peaks around 1120–1080 cm−1 (SO42−) and enhanced absorption peaks around 1000–1100 cm−1, are indicative of sulfate-related complexes, and at 1423.8 cm−1 are assigned as C-O from carboxylic acids [84]. The CuO-doped composites show peaks around 1083.2 cm−1 (Cu-O), 1029.3 cm−1 (Si-O-Cu), and 1441.6 cm−1, with peaks around 600–700 cm−1 corresponding to Cu-O stretching, indicating the formation of pure Cu [85]. The peaks related to carbonyl groups (C=O) at 1700 cm−1 may be more pronounced due to oxidation processes as the pyrolysis temperature rises [86].
In general, composites that are formulated and CuSO45H2O-doped exhibit more prominent peaks associated with hydroxyl groups, carbonyl groups, and sulfur-containing groups (sulfates). These peaks indicate a higher presence of alcohols, phenolic compounds, and sulfate groups. Conversely, composites doped with CuO display less pronounced hydroxyl group peaks, a broader or shifted carbonyl peak suggesting interactions with organic compounds or water adsorption, and distinctive peaks for triple carbon bonds and esters. These features of CuO–biochar composites suggest different chemical interactions over those composed doped with CuSO45H2O, highlighting the formation of esters and the possible generation of hydroxides.

4.3. Kinetics of Cu Release

The observed variations in kinetics are primarily due to physicochemical interactions between Cu sources and organic compounds and radicals, which are influenced by the pyrolysis temperature. Lower temperatures seem to support the formation of more chemically stable complexes, likely due to the relatively lessened degradation of organic functional groups that interact with Cu [87]. On the other hand, higher temperatures can lead to the chemical stabilization and low reactivity of the complexes formed, which decrease the release of Cu [88]. The CSS/CO-3 composite (52%) exhibited the highest Cu release when compared to CCM/CO-3 (10%) and CSC/CO-3 (12%). This may be due to the inherent properties of sewage sludge, which may increase the solubility of Cu through the presence of mineral compounds in the ash-rich composite matrix. Chicken manure matrix composites showed moderate release rates. In contrast, those derived from shrimp shells released the least amount of Cu, suggesting a potential for these compounds to stabilize Cu, correlating with Cu mobility and availability in soil, as reported by [89].
Furthermore, the difference in Cu release rates among the formulated composites doped with CuSO45H2O and CuO suggests that CuSO45H2O can form more extensively distributed complexes in the matrix, potentially due to its greater Cu release rate, solubility and reactivity than CuO. Variability in Cu release rates has notable implications for environmental safety, agricultural use, and crop fertilization programs. For environmental applications, slower release rates are preferable to minimize Cu leaching and potential toxicity to soil biota and contamination of water reservoirs. On the other hand, in agricultural cultivation systems, a more controlled release of Cu can be beneficial to provide a sustained supply of the nutrient though different crop growth stages.

4.4. Scanning Electron Microscopy

The inclusion of Cu, either as CuSO45H2O or CuO, significantly influenced the composites’ physical, physicochemical, and chemical properties, thereby affecting their suitability for environmental and agricultural applications. For example, the composites CSS/CS-3 and CSS/CO-3 exhibited and produced more porous structures, which could enhance their effectiveness in applications requiring large surface areas, such as adsorption and desorption processes.
The type of Cu additive notably impacted the composites’ microstructures. Composites such as CCM/CS-3 and CSS/CS-3 showed a more homogeneous distribution of Cu over the matrix surface, compared to formulated those with CuO. This can be attributed to the superior solubility and integration capability of CuSO45H2O within the organic matrix. Pyrolysis temperature variations also played a crucial role. Increasing the temperature from 300 °C to 550 °C generally led to greater porosity and surface roughness, indicating more extensive thermal degradation of organic groups and structural changes in the composite matrix. The choice of doping agent (CuSO45H2O versus CuO) affected the samples’ thermal stability and structural development. CuO-doped samples usually exhibited smoother surfaces at lower temperatures but developed notable porosity at higher temperatures.
Composites doped with CuSO45H2O (CCM/CS-3 and CSS/CS-3) displayed a more uniform Cu distribution. This homogeneity can be attributed to the better solubility and integration of CuSO45H2O in the organic matrix. In contrast, CuO-doped composites (CCM/CO-3 and CSS/CO-3) exhibited less uniform Cu distributions, likely due to different chemical interactions between CuO and the organic matrix [48] and stable matrices [90]. These findings underscore the importance of optimizing thermal processing conditions and selecting appropriate Cu additives to enhance the structural and functional properties of the composites, tailoring them for specific environmental and agricultural applications.

4.5. Agronomic Effectiveness of Composites on Wheat Growth

In conclusion, this study reveals substantial differences in the effectiveness of fertilization treatments depending on soil type, highlighting the need for tailored approaches related to Cu source synthesis to maximize wheat productivity. With its sandy texture and low organic matter content, the RYL showed notable improvements in dry matter production and total Cu accumulation when fertilized with CSC/CS-3 and CSS/CS-5 composites. These composites, enriched with ash due to higher-temperature (550 °C)employed in their synthesis, ensured a controlled release of Cu, improving retention and reducing leaching in the sandy soil [74,91]. Their low solubility makes them particularly suitable for acidic soils, providing Cu and basic cations in stable forms like carbonates, oxides, and hydroxides over time [92]. Additionally, the CSS/CS-5 composite demonstrated higher stability due to its lower solubility, which is advantageous for nutrient availability in soil over longer time.
By contrast, the CSC/CS-3 composite showed a more controlled initial release of Cu, followed by a complete release after 50 h, making it ideal for soils needing an immediate yet sustained nutrient supply. Its higher solubility and abundance of functional groups, including sulfate complexes, carboxylic acids, and nitrogen-linked groups [66,68], enhance its efficacy as a source of Cu in the nutrient-deficient soils.
On the other hand, the DRL, a clay-rich soil with a higher organic matter content, responded best to the CSS/CS-5 composite. The high-temperature treatment at 550 °C likely enhanced the biochar’s porosity and surface area, improving its ability to retain and gradually release nutrients, including Cu, vital for efficient nutrient uptake and overall plant growth. This enhanced nutrient retention and release, combined with better soil structure and water retention, supports robust root development and plant growth [93].

5. Conclusions

This study demonstrates the effectiveness of Cu–biochar composites in enhancing wheat growth in two contrasting Oxisols. In the RYL, characterized by a sandy texture and a low organic matter content, the CSC/CS-3 composite resulted in the highest shoot and root dry matter and wheat grain production. This composite’s high solubility and gradual Cu release improved nutrient uptake and may have addressed Cu retention challenge in tropical soils. With a clayey texture and higher organic matter in the DRL, the CSS/CS-5 composite showed superior results regarding shoot and root dry matter, grain production, and Cu uptake. High-temperature (550 °C) charring enhanced biochar stability and Cu retention.
Residual Cu levels were highest with the CS (p.a) as Cu source for the composites’ synthesis in both soils, indicating a fast release and higher accumulation of Cu in wheat plants. In DRL, the CSS/CS-5 composite also exhibited notable residual Cu levels, which was well correlated with increased wheat growth, suggesting an efficient strategy to manage Cu fertilizers in tropical cropland areas. This study underscores the importance of selecting Cu–biochar composites based on specific soil characteristics to maximize agricultural benefits to crops and minimize copper retention in highly weathered soils. Future research should explore long-term environmental impacts, varying biochar application rates, different Cu sources, and their interactions with crops grown in field trials to optimize copper fertilization strategies for the Brazilian tropical soils.

Author Contributions

Conceptualization, L.C. and L.C.A.M.; methodology, L.C.; validation, L.C., L.C.A.M., K.J., C.A.S. and F.H.S.R.; formal analysis, L.C.; investigation, L.C.; resources, C.A.S.; data curation, L.C.; writing—original draft preparation, L.C.; writing—review and editing, L.C., L.C.A.M. and K.J.; visualization, L.C.; supervision, L.C.A.M. and C.A.S.; project administration, C.A.S.; funding acquisition, C.A.S. All authors have read and agreed to the published version of the manuscript.

Funding

This research and scholarship were funded by the Coordination for the Improvement of Higher Education Personnel (CAPES), CAPES-PROEX/AUXPE 593/2018, the National Council for Scientific and Technological Development (CNPq, grants # 307447/2019-7 and 311212/2023-9), and the Minas Gerais State Research Support Foundation (FAPEMIG) for financial support.

Data Availability Statement

The datasets generated and/or analyzed during the current study are available from the corresponding author upon reasonable request.

Acknowledgments

We express our sincere gratitude to Everton Morais for his invaluable assistance with the data analysis and continued support throughout the study. We also wish to thank Lívia Botelho and Mariene Duarte for their expert help with the laboratory analyses. Lastly, we deeply appreciate José Roberto Fernandes for his contribution to conducting the experiments.

Conflicts of Interest

The authors declare no conflicts of interest.

Appendix A

Table A1. Chemical characterization of the raw materials, biochars, and composites produced. The table presents the concentrations of essential nutrients and elements (B, Ca, Cu, Fe, Mg, Mn, Na, P, Zn) in the raw materials, biochars, and their respective composites. The results are expressed in milligrams per kilogram (mg kg−1). Elemental analyses were performed using an inductively coupled plasma optical emission spectrometry (ICP-OES, PerkinElmer Optima 8000, USA) after acid digestion with a 4:1 mixture of nitric and perchloric acids. Each value represents the mean of three replicates ± standard deviation.
IDAlBCaCuFeMgMnNaPZn
--------------------------------------------- (mg kg−1) ----------------------------------------------------
FCM2669299102,60617825336466462292921,060551
FSC184422296,764981137843392177418,473109
FSS686747947134811,10624892009223843623
BCM-32780243108,73216621709516597IN30,035787
BSC-3226816286,60314734378513114IN23,0741683
BSS-373999410,29342355652347230IN4745812
BCM-54719196105,307169365713,158882IN46,275968
BSC-53648164125,101188474917,627156IN44,3592238
BSS-510,5379512,64748111,4392738301IN6129922
CCM/CS-36334129.5101,517232,9793271<LQ1857752727,145567
CCM/CO-3487910.0108,679111,4122712<LQ184384,24029,341233
CCM/CS-57342459.0157,750282,4124312<LQ214311,46132,208412
CCM/CO-5716918.4142,800237,3584366<LQ218577,56533,387338
CSC/CS-32275189.3112,591302,437160112,4825220,55244,2504105
CSC/CO-32567434.883,212241,5621547945562145,50236,8831238
CSC/CS-53356958.9237,362281,037183919,35012724,29868,0373865
CSC/CO-53446491.4292,200233,291162922,464154129,04066,5081640
CSS/CS-377,711134.32465309,25041,466362212610,52711,1821366
CSS/CO-3260,387475.62411203,825135,316498321096,63612,7861151
CSS/CS-535,60878.2<LQ337,85828,450<LQ1240677<LQ111
CSS/CS-535,104147.8<LQ214,85010,251<LQ113777,757<LQ163
B: Boron; Ca: Calcium; Cu: Copper; Fe: Iron; Mg: Magnesium; Mn: Manganese; Na: Sodium; P: Phosphorus; Zn: Zinc. LQ: Limit of Quantification; IN: Not Informed. Raw materials include chicken manure (CM), shrimp shell (SS), and sewage sludge (SL). Biochars are denoted as BCM, BSS, and BSC, representing biochars from CM, SS, and SL, respectively. Composites are labeled as CCM/CS, CSC/CS, and CSS/CS, denoting biochar with copper sulfate doped at different pyrolysis temperatures.

Appendix B

Figure A1. Location of the study’s raw material collection area. Map of Brazil highlighting the states of Minas Gerais and Espírito Santo, with emphasis on the cities of Lavras, Nepomuceno, and Linhares.
Agronomy 15 00144 g0a1

References

  1. Vermaat, J.G.; Van Der Bie, G.J. On the Occurrence of Copper in Tropical Soils. Plant Soil 1950, 2, 257–282. [Google Scholar] [CrossRef]
  2. Hortin, J.M.; Anderson, A.J.; Britt, D.W.; Jacobson, A.R.; McLean, J.E. Copper Oxide Nanoparticle Dissolution at Alkaline PH Is Controlled by Dissolved Organic Matter: Influence of Soil-Derived Organic Matter, Wheat, Bacteria, and Nanoparticle Coating. Environ. Sci. Nano 2020, 7, 2618–2631. [Google Scholar] [CrossRef]
  3. Jez, E.; Pellegrini, E.; Contin, M. Copper Bioavailability and Leaching in Conventional and Organic Viticulture under Environmental Stress. Appl. Sci. 2023, 13, 2595. [Google Scholar] [CrossRef]
  4. Zhang, D.; Sun, J.; Li, Q.; Song, H.; Xia, D. Cu-Doped Magnetic Loofah Biochar for Tetracycline Degradation via Peroxymonosulfate Activation. New J. Chem. 2022, 46, 17223–17234. [Google Scholar] [CrossRef]
  5. Carneiro, J.S.d.S.; Leite, D.A. da C.; Castro, G.M. de; Franca, J.R.; Botelho, L.; Soares, J.R.; Oliveira, J.E. de; Melo, L.C.A. Biochar-Graphene Oxide Composite Is Efficient to Adsorb and Deliver Copper and Zinc in Tropical Soil. J. Clean. Prod. 2022, 360, 132170. [Google Scholar] [CrossRef]
  6. Cho, D.-W.; Kim, S.; Tsang, Y.F.; Song, H. Preparation of Nitrogen-Doped Cu-Biochar and Its Application into Catalytic Reduction of p-Nitrophenol. Environ. Geochem. Health 2019, 41, 1729–1737. [Google Scholar] [CrossRef] [PubMed]
  7. Altıkat, A.; Alma, M.H.; Altıkat, A.; Bilgili, M.E.; Altıkat, S. A Comprehensive Study of Biochar Yield and Quality Concerning Pyrolysis Conditions: A Multifaceted Approach. Sustainability 2024, 16, 937. [Google Scholar] [CrossRef]
  8. Otoni, J.P.; Matoso, S.C.G.; Pérez, X.L.O.; da Silva, V.B. Potential for Agronomic and Environmental Use of Biochars Derived from Different Organic Waste. J. Clean. Prod. 2024, 449, 141826. [Google Scholar] [CrossRef]
  9. Hu, Z.; Wei, L. Review on Characterization of Biochar Derived from Biomass Pyrolysis via Reactive Molecular Dynamics Simulations. J. Compos. Sci. 2023, 7, 354. [Google Scholar] [CrossRef]
  10. Wijitkosum, S.; Jiwnok, P. Elemental Composition of Biochar Obtained from Agricultural Waste for Soil Amendment and Carbon Sequestration. Appl. Sci. 2019, 9, 3980. [Google Scholar] [CrossRef]
  11. Liu, Q.; Zang, G.-L.; Zhao, Q. Removal of Copper Ions by Functionalized Biochar Based on a Multicomponent Ugi Reaction. RSC Adv. 2021, 11, 25880–25891. [Google Scholar] [CrossRef] [PubMed]
  12. Jin, H.; Zhang, D.; Yan, Y.; Yang, C.; Fang, B.; Li, X.; Shao, Y.; Wang, H.; Yue, J.; Wang, Y.; et al. Short-Term Application of Chicken Manure under Different Nitrogen Rates Alters Structure and Co-Occurrence Pattern but Not Diversity of Soil Microbial Community in Wheat Field. Front. Microbiol. 2022, 13, 975571. [Google Scholar] [CrossRef] [PubMed]
  13. Heckler, G.S.; da Costa, R.C.; Fransozo, A.; Rosso, S.; Munehisa Shimizu, R. Long-Term Patterns of Spatial and Temporal Distribution in the Seabob Shrimp Xiphopenaeus Kroyeri (Decapoda: Penaeidae) Population in Southeastern Brazil. J. Crustac. Biol. 2014, 34, 326–333. [Google Scholar] [CrossRef]
  14. Wydro, U.; Jankowska, M.; Wołejko, E.; Kondzior, P.; Łozowicka, B.; Kaczyński, P.; Rodziewicz, J.; Janczukowicz, W.; Pietryczuk, A.; Cudowski, A.; et al. Changes in Soil Biological Properties after Sewage Sludge and Pesticide Application in Wheat Cultivation. Appl. Sci. 2022, 12, 11452. [Google Scholar] [CrossRef]
  15. Xu, L.; Xing, X.; Peng, J.; Ji, M. Effects of In Situ Remediation on Copper Distribution and Soil Aggregate Adsorption–Desorption Characteristics in Smelter-Impacted Soil. Front. Environ. Sci. 2022, 10, 816361. [Google Scholar] [CrossRef]
  16. Zhu, X.; Chen, B.; Zhu, L.; Xing, B. Effects and Mechanisms of Biochar-Microbe Interactions in Soil Improvement and Pollution Remediation: A Review. Environ. Pollut. 2017, 227, 98–115. [Google Scholar] [CrossRef] [PubMed]
  17. Aleosfoor, A.; Rahimpour, M.R. Highly Dispersed Copper on Biochar Carbon as a Promising Catalyst for Reverse Water Gas Shift Reaction. J. Energy Inst. 2024, 115, 101680. [Google Scholar] [CrossRef]
  18. Singh, B.; Dolk, M.M.; Shen, Q.; Camps-Arbestain, M. Biochar: A Guide to Analytical Methods; Singh, B., Camps-Arbestain, M., Lehmann, J., Eds.; CRC Press: Boca Raton, FL, USA; Taylor and Francis Group, LLC: Boca Raton, FL, USA, 2017; pp. 23–38. ISBN 9781486305094. [Google Scholar]
  19. ASTM D1762-84; Standard Test Method for Chemical Analysis of Wood Charcoal. ASTM: West Conshohocken, PA, USA, 2013.
  20. Masek, O.; Buss, W.; Sohi, S. Standard Biochar Materials. Environ. Sci. Technol. 2018, 52, 9543–9544. [Google Scholar] [CrossRef]
  21. Granulométrica, B.A. Manual de Métodos Analíticos Oficiais para Fertilizantes Minerais, Orgânicos, Organominerais e Corretivos. 2014. Available online: http://sistemasweb.agricultura.gov.br/arquivosislegis/anexos/tm/INM28_2007_MAPA.pdf (accessed on 14 August 2023).
  22. Liberda, D.; Pięta, E.; Pogoda, K.; Piergies, N.; Roman, M.; Koziol, P.; Wrobel, T.P.; Paluszkiewicz, C.; Kwiatek, W.M. The Impact of Preprocessing Methods for a Successful Prostate Cell Lines Discrimination Using Partial Least Squares Regression and Discriminant Analysis Based on Fourier Transform Infrared Imaging. Cells 2021, 10, 953. [Google Scholar] [CrossRef] [PubMed]
  23. Khan, A.; Harfield, D.; Hillen, B.; Stenzel, F.; Homung, A. Long-Termaging of Biochar. In Proceedings of the Biochar: Production, Characterization and Applications, Alba, Italy, 20–25 August 2017. [Google Scholar] [CrossRef]
  24. Teixeira, P.C.; Donagemma, G.K.; Fontana, A.; Teixeira, W.G. Manual de Métodos de Análise de Solo 3a Edição Revista e Ampliada. In Man. Métodos Análise Solo—Capítulo 8—Densidade Partículas; Embrapa: Brasília, Brazil, 2017; Volume 574. [Google Scholar]
  25. Barrow, N.J.; Hartemink, A.E. The Effects of PH on Nutrient Availability Depend on Both Soils and Plants. Plant Soil 2023, 487, 21–37. [Google Scholar] [CrossRef]
  26. Shabbir, Z.; Sardar, A.; Shabbir, A.; Abbas, G.; Shamshad, S.; Khalid, S.; Natasha; Murtaza, G.; Dumat, C.; Shahid, M. Copper Uptake, Essentiality, Toxicity, Detoxification and Risk Assessment in Soil-Plant Environment. Chemosphere 2020, 259, 127436. [Google Scholar] [CrossRef] [PubMed]
  27. de Novais, R.F.; Neves, J.C.L.; de Barros, N.F. Ensaio Em Ambiente Controlado. In Métodos de Pesquisa em Fertilidade de Solo; Embrapa-SEA: Brasília, Brazil, 1991; p. 392. [Google Scholar]
  28. do Carmo, D.L.; Silva, C.A.; de Lima, J.M.; Pinheiro, G.L. Electrical Conductivity and Chemical Composition of Soil Solution: Comparison of Solution Samplers in Tropical Soils. Rev. Bras. Ciência Do Solo 2016, 40, e0140795. [Google Scholar] [CrossRef]
  29. da Silva, F.C. Manual de Análises Químicas de Solos, Plantas e Fertilizantes; Literasi Media Publishing: Kota Malang, Indonesia, 2009; Volume 2, ISBN 9786021018187. [Google Scholar]
  30. Factoextra R: The R Project for Statistical Computing. Available online: https://www.r-project.org/ (accessed on 14 August 2023).
  31. Agricolae Pacote Agricolae—CRAN—Embalagem Agrícola. Available online: https://cran.r-project.org/web/packages/agricolae/index.html (accessed on 14 August 2023).
  32. Extract Extract and Visualize the Results of Multivariate Data Analyses, R Package Factoextra Version 1.0.7. 2020. Available online: https://cran.r-project.org/web/packages/factoextra/index.html (accessed on 5 January 2025).
  33. Lê, S.; Josse, J.; Husson, F. FactoMineR: An R Package for Multivariate Analysis. J. Stat. Softw. 2008, 25, 1–18. [Google Scholar] [CrossRef]
  34. Suzuki, R.; Hidetoshi, S. Hierarchical Clustering with P-Values via Multiscale Bootstrap Resampling; R Package; R Foundation for Statistical Computing: Vienna, Austria, 2013. [Google Scholar]
  35. Wei, T.; Wei, A.; Simko, V.; Levy, M.; Xie, Y.; Jin, Y.; Zemla, J.; Freidank, M.; Cai, J.; Protivinsky, T. Package “corrplot”: Visualization of a Correlation Matrix; (R package); R Foundation for Statistical Computing: Vienna, Austria, 2022; Available online: https://cran.r-project.org/web/packages/corrplot/index.html (accessed on 5 January 2025).
  36. Wickham, H.; Averick, M.; Bryan, J.; Chang, W.; Mcgowan, D.L.A.; François, R.; Grolemund, G.; Hayes, A.; Henry, L.; Hester, J.; et al. Welcome to the Tidyverse. J. Open Source Softw. 2019, 4, 1686. [Google Scholar] [CrossRef]
  37. Baty, F.; Ritz, C.; Charles, S.; Brutsche, M.; Flandrois, J.P.; Delignette-Muller, M.L. A Toolbox for Nonlinear Regression in R: The Package Nlstools. J. Stat. Softw. 2015, 66, 1–21. [Google Scholar] [CrossRef]
  38. Akaike, H. A Bayesian Extension of the Minimum AIC Procedure of Autoregressive Model Fitting. Biometrika 1979, 66, 237–242. [Google Scholar] [CrossRef]
  39. Penido, E.S.; Martins, G.C.; Mendes, T.B.M.; Melo, L.C.A.; do Rosário Guimarães, I.; Guilherme, L.R.G. Combining Biochar and Sewage Sludge for Immobilization of Heavy Metals in Mining Soils. Ecotoxicol. Environ. Saf. 2019, 172, 326–333. [Google Scholar] [CrossRef]
  40. Das, S.K.; Ghosh, G.K.; Avasthe, R.K.; Sinha, K. Compositional Heterogeneity of Different Biochar: Effect of Pyrolysis Temperature and Feedstocks. J. Environ. Manag. 2021, 278, 111501. [Google Scholar] [CrossRef] [PubMed]
  41. Domingues, R.R.; Trugilho, P.F.; Silva, C.A.; De Melo, I.C.N.A.; Melo, L.C.A.; Magriotis, Z.M.; Sánchez-Monedero, M.A. Properties of Biochar Derived from Wood and High-Nutrient Biomasses with the Aim of Agronomic and Environmental Benefits. PLoS ONE 2017, 12, e0176884. [Google Scholar] [CrossRef] [PubMed]
  42. Muzyka, R.; Misztal, E.; Hrabak, J.; Banks, S.W.; Sajdak, M. Various Biomass Pyrolysis Conditions Influence the Porosity and Pore Size Distribution of Biochar. Energy 2023, 263, 126128. [Google Scholar] [CrossRef]
  43. Fan, J.; Li, Y.; Yu, H.; Li, Y.; Yuan, Q.; Xiao, H.; Li, F.; Pan, B. Using Sewage Sludge with High Ash Content for Biochar Production and Cu(II) Sorption. Sci. Total Environ. 2020, 713, 136663. [Google Scholar] [CrossRef] [PubMed]
  44. Ghorbani, M.; Amirahmadi, E.; Neugschwandtner, R.W.; Konvalina, P.; Kopecký, M.; Moudrý, J.; Perná, K.; Murindangabo, Y.T. The Impact of Pyrolysis Temperature on Biochar Properties and Its Effects on Soil Hydrological Properties. Sustainability 2022, 14, 14722. [Google Scholar] [CrossRef]
  45. Ghorbani, M.; Konvalina, P.; Walkiewicz, A.; Neugschwandtner, R.W.; Kopecký, M.; Zamanian, K.; Chen, W.-H.; Bucur, D. Feasibility of Biochar Derived from Sewage Sludge to Promote Sustainable Agriculture and Mitigate GHG Emissions—A Review. Int. J. Environ. Res. Public Health 2022, 19, 12983. [Google Scholar] [CrossRef]
  46. Schellekens, J.; Silva, C.A.; Buurman, P.; Rittl, T.F.; Domingues, R.R.; Justi, M.; Vidal-Torrado, P.; Trugilho, P.F. Molecular Characterization of Biochar from Five Brazilian Agricultural Residues Obtained at Different Charring Temperatures. J. Anal. Appl. Pyrolysis 2018, 130, 106–117. [Google Scholar] [CrossRef]
  47. Clough, T.J.; Condron, L.M.; Kammann, C.; Müller, C. A Review of Biochar and Soil Nitrogen Dynamics. Agronomy 2013, 3, 275–293. [Google Scholar] [CrossRef]
  48. Zhao, J.; Li, H.; Wang, Y.; Yu, J.; Li, N.; Wang, S. Cu/CuO-Decorated Peanut-Shell-Derived Biochar for the Efficient Degradation of Tetracycline via Peroxymonosulfate Activation. Catalysts 2023, 13, 1246. [Google Scholar] [CrossRef]
  49. Wang, C.; Dai, H.; Liang, L.; Li, N.; Cui, X.; Yan, B.; Chen, G. Enhanced Mechanism of Copper Doping in Magnetic Biochar for Peroxymonosulfate Activation and Sulfamethoxazole Degradation. J. Hazard. Mater. 2023, 458, 132002. [Google Scholar] [CrossRef] [PubMed]
  50. Chaves Fernandes, B.C.; Ferreira Mendes, K.; Dias Júnior, A.F.; da Silva Caldeira, V.P.; da Silva Teófilo, T.M.; Severo Silva, T.; Mendonça, V.; de Freitas Souza, M.; Valadão Silva, D. Impact of Pyrolysis Temperature on the Properties of Eucalyptus Wood-Derived Biochar. Materials 2020, 13, 5841. [Google Scholar] [CrossRef] [PubMed]
  51. de Oliveira Paiva, I.; de Morais, E.G.; Jindo, K.; Silva, C.A. Biochar N Content, Pools and Aromaticity as Affected by Feedstock and Pyrolysis Temperature. Waste Biomass Valorization 2024, 15, 3599–3619. [Google Scholar] [CrossRef]
  52. Tu, P.; Zhang, G.; Wei, G.; Li, J.; Li, Y.; Deng, L.; Yuan, H. Influence of Pyrolysis Temperature on the Physicochemical Properties of Biochars Obtained from Herbaceous and Woody Plants. Bioresour. Bioprocess. 2022, 9, 131. [Google Scholar] [CrossRef]
  53. Nepal, J.; Ahmad, W.; Munsif, F.; Khan, A.; Zou, Z. Advances and Prospects of Biochar in Improving Soil Fertility, Biochemical Quality, and Environmental Applications. Front. Environ. Sci. 2023, 11, 1114752. [Google Scholar] [CrossRef]
  54. Dong, X.; Wang, C.; Li, H.; Wu, M.; Liao, S.; Zhang, D.; Pan, B. The Sorption of Heavy Metals on Thermally Treated Sediments with High Organic Matter Content. Bioresour. Technol. 2014, 160, 123–128. [Google Scholar] [CrossRef]
  55. Nan, H.; Yin, J.; Yang, F.; Luo, Y.; Zhao, L.; Cao, X. Pyrolysis Temperature-Dependent Carbon Retention and Stability of Biochar with Participation of Calcium: Implications to Carbon Sequestration. Environ. Pollut. 2021, 287, 117566. [Google Scholar] [CrossRef] [PubMed]
  56. Hailegnaw, N.S.; Mercl, F.; Pračke, K.; Praus, L.; Száková, J.; Tlustoš, P. The Role of Biochar and Soil Properties in Determining the Available Content of Al, Cu, Zn, Mn, and Cd in Soil. Agronomy 2020, 10, 885. [Google Scholar] [CrossRef]
  57. Joseph, S.; Graber, E.R.; Chia, C.; Munroe, P.; Donne, S.; Thomas, T.; Nielsen, S.; Marjo, C.; Rutlidge, H.; Pan, G.X.; et al. Shifting Paradigms: Development of High-Efficiency Biochar Fertilizers Based on Nano-Structures and Soluble Components. Carbon Manag. 2013, 4, 323–343. [Google Scholar] [CrossRef]
  58. Zhang, X.; Zhao, B.; Liu, H.; Zhao, Y.; Li, L. Effects of Pyrolysis Temperature on Biochar’s Characteristics and Speciation and Environmental Risks of Heavy Metals in Sewage Sludge Biochars. Environ. Technol. Innov. 2022, 26, 102288. [Google Scholar] [CrossRef]
  59. Sadeek, S.A.; Mohammed, E.A.; Shaban, M.; Abou Kana, M.T.H.; Negm, N.A. Synthesis, Characterization and Catalytic Performances of Activated Carbon-Doped Transition Metals during Biofuel Production from Waste Cooking Oils. J. Mol. Liq. 2020, 306, 112749. [Google Scholar] [CrossRef]
  60. Li, L.; Niu, W.; Cong, H.; Meng, H.; Niu, Z.; Shen, X.; Cao, L.; Kong, X. Effects of Pyrolysis Temperature on the Release Characteristics of Polycyclic Aromatic Hydrocarbons during Pyrolysis of Corn Stover Pellet. BioResources 2023, 18, 2112–2136. [Google Scholar] [CrossRef]
  61. Manogaran, M.D.; Shamsuddin, R.; Mohd Yusoff, M.H.; Lay, M.; Siyal, A.A. A Review on Treatment Processes of Chicken Manure. Clean. Circ. Bioeconomy 2022, 2, 100013. [Google Scholar] [CrossRef]
  62. Akhil, D.; Lakshmi, D.; Kartik, A.; Vo, D.-V.N.; Arun, J.; Gopinath, K.P. Production, Characterization, Activation and Environmental Applications of Engineered Biochar: A Review. Environ. Chem. Lett. 2021, 19, 2261–2297. [Google Scholar] [CrossRef]
  63. Sieber, V.; Hofer, M.; Brück, W.M.; Garbe, D.; Brück, T.; Lynch, C.A. ChiBio: An Integrated Bio-Refinery for Processing Chitin-Rich Bio-Waste to Specialty Chemicals. In Grand Challenges in Marine Biotechnology. Grand Challenges in Biology and Biotechnology; Rampelotto, P.H., Trincone, A., Eds.; Springer International Publishing: Cham, Switzerland, 2018; pp. 555–578. ISBN 978-3-319-69075-9. [Google Scholar]
  64. Elsherpiny, M.A. Effect of Organic Amendments and Synthetic Substances on Copper Availability, Absorption, and Wheat Productivity. Egypt. J. Soil Sci. 2023, 63, 429–442. [Google Scholar] [CrossRef]
  65. Lou, T.; Yin, Y.; Wang, J. Mechanisms of Biochar Promoting Medium Chain Fatty Acids Production from Sewage Sludge: Effect of Biochar Type. J. Clean. Prod. 2024, 451, 141995. [Google Scholar] [CrossRef]
  66. Xiao, Y.; Xue, Y.; Gao, F.; Mosa, A. Sorption of Heavy Metal Ions onto Crayfish Shell Biochar: Effect of Pyrolysis Temperature, PH and Ionic Strength. J. Taiwan Inst. Chem. Eng. 2017, 80, 114–121. [Google Scholar] [CrossRef]
  67. Bhatnagar, A.; Sillanpää, M. Applications of Chitin-and Chitosan-Derivatives for the Detoxification of Water and Wastewater—A Short Review. Adv. Colloid Interface Sci. 2009, 152, 26–38. [Google Scholar] [CrossRef] [PubMed]
  68. Dai, L.; Zhu, W.; He, L.; Tan, F.; Zhu, N.; Zhou, Q.; He, M.; Hu, G. Calcium-Rich Biochar from Crab Shell: An Unexpected Super Adsorbent for Dye Removal. Bioresour. Technol. 2018, 267, 510–516. [Google Scholar] [CrossRef] [PubMed]
  69. Ling, C.; Wu, S.; Han, J.; Dong, T.; Zhu, C.; Li, X.; Xu, L.; Zhang, Y.; Zhou, M.; Pan, Y. Sulfide-Modified Zero-Valent Iron Activated Periodate for Sulfadiazine Removal: Performance and Dominant Routine of Reactive Species Production. Water Res. 2022, 220, 118676. [Google Scholar] [CrossRef]
  70. Shuailong, C.; Qintie, L.I.N.; Rongbo, X.; Haoyu, L.U.O.; Hengyi, F.U. Removal of EDTA-Cu in Wastewater by Copper-Based Biochar Activated Sodium Persulfate. Chin. J. Environ. Eng. 2020, 14, 3298–3307. [Google Scholar]
  71. Karimi, B.; Masson, V.; Guilland, C.; Leroy, E.; Pellegrinelli, S.; Giboulot, E.; Maron, P.-A.; Ranjard, L. Ecotoxicity of Copper Input and Accumulation for Soil Biodiversity in Vineyards. Environ. Chem. Lett. 2021, 19, 2013–2030. [Google Scholar] [CrossRef]
  72. Meenu; Rani, M.; Shanker, U. Efficient Photodegradation of Hexabromocyclododecane Leached from Polystyrene by Biochar and Sulfur Doped CuO Nanocomposite: Optimization Factors, Kinetics, and Photoactivity. Environ. Pollut. 2024, 340, 122818. [Google Scholar] [CrossRef]
  73. Alva, A.K.; Graham, J.H.; Anderson, C.A. Soil PH and Copper Effects on Young ‘Hamlin’Orange Trees. Soil Sci. Soc. Am. J. 1995, 59, 481–487. [Google Scholar] [CrossRef]
  74. Lamichhane, J.R.; Osdaghi, E.; Behlau, F.; Köhl, J.; Jones, J.B.; Aubertot, J.-N. Thirteen Decades of Antimicrobial Copper Compounds Applied in Agriculture. A Review. Agron. Sustain. Dev. 2018, 38, 28. [Google Scholar] [CrossRef]
  75. Xu, P.; Gao, Y.; Cui, Z.; Wu, B.; Yan, B.; Wang, Y.; Zaitongguli, K.; Wen, M.; Wang, H.; Jing, N.; et al. Research Progress on Effects of Biochar on Soil Environment and Crop Nutrient Absorption and Utilization. Sustainability 2023, 15, 4861. [Google Scholar] [CrossRef]
  76. Brasil Instrução Normativa MAPA No 46 DE 22/11/2016—Federal—LegisWeb. Available online: https://www.legisweb.com.br/legislacao/?id=332894 (accessed on 27 June 2024).
  77. Di Palma, L.; Mecozzi, R. Heavy Metals Mobilization from Harbour Sediments Using EDTA and Citric Acid as Chelating Agents. J. Hazard. Mater. 2007, 147, 768–775. [Google Scholar] [CrossRef]
  78. Chen, H.; Zhou, Y.; Zhao, H.; Li, Q. A Comparative Study on Behavior of Heavy Metals in Pyrochar and Hydrochar from Sewage Sludge. Energy Sources Part A Recover. Util. Environ. Eff. 2018, 40, 565–571. [Google Scholar] [CrossRef]
  79. Zhao, L.; Sun, Z.-F.; Pan, X.-W.; Tan, J.-Y.; Yang, S.-S.; Wu, J.-T.; Chen, C.; Yuan, Y.; Ren, N.-Q. Sewage Sludge Derived Biochar for Environmental Improvement: Advances, Challenges, and Solutions. Water Res. X 2023, 18, 100167. [Google Scholar] [CrossRef] [PubMed]
  80. Jin, J.; Li, Y.; Zhang, J.; Wu, S.; Cao, Y.; Liang, P.; Zhang, J.; Wong, M.H.; Wang, M.; Shan, S. Influence of Pyrolysis Temperature on Properties and Environmental Safety of Heavy Metals in Biochars Derived from Municipal Sewage Sludge. J. Hazard. Mater. 2016, 320, 417–426. [Google Scholar] [CrossRef] [PubMed]
  81. Rúa-Díaz, S.; Forjan, R.; Lago-Vila, M.; Cerqueira, B.; Arco-Lázaro, E.; Marcet, P.; Baragaño, D.; Gallego, J.L.R.; Covelo, E.F. Pyrolysis Temperature Influences the Capacity of Biochar to Immobilize Copper and Arsenic in Mining Soil Remediation. Environ. Sci. Pollut. Res. 2023, 30, 32882–32893. [Google Scholar] [CrossRef]
  82. Losacco, D.; Campanale, C.; Tumolo, M.; Ancona, V.; Massarelli, C.; Uricchio, V.F. Evaluating the Influence of Nitrogen Fertilizers and Biochar on Brassica oleracea L. var. botrytis by the Use of Fourier Transform Infrared (FTIR) Spectroscopy. Sustainability 2022, 14, 11985. [Google Scholar] [CrossRef]
  83. Liu, C.; Lin, J.; Chen, H.; Wang, W.; Yang, Y. Comparative Study of Biochar Modified with Different Functional Groups for Efficient Removal of Pb(II) and Ni(II). Int. J. Environ. Res. Public Health 2021, 19, 11163. [Google Scholar] [CrossRef] [PubMed]
  84. Atchaya, S.; Meena Devi, J. Experimental Investigation on Structural, Optical, Electrical and Magnetic Properties of Copper Oxide Nanoparticles. Proc. Natl. Acad. Sci. India Sect. A Phys. Sci. 2024, 94, 153–160. [Google Scholar] [CrossRef]
  85. Sukumar, S.; Rudrasenan, A.; Padmanabhan Nambiar, D. Green-Synthesized Rice-Shaped Copper Oxide Nanoparticles Using Caesalpinia Bonducella Seed Extract and Their Applications. ACS Omega 2020, 5, 1040–1051. [Google Scholar] [CrossRef]
  86. Kayani, Z.N.; Umer, M.; Riaz, S.; Naseem, S. Characterization of Copper Oxide Nanoparticles Fabricated by the Sol–Gel Method. J. Electron. Mater. 2015, 44, 3704–3709. [Google Scholar] [CrossRef]
  87. Abdullah, R.; Ishak, C.F.; Osman, N.; Halim, N.S.A.; Panhwar, Q.A. Determining the Characteristics and Potential of Plantbased Biochars to Reduce Copper Uptake in Maize. Bragantia 2021, 80, e2221. [Google Scholar] [CrossRef]
  88. Thapa, S.; Bhandari, A.; Ghimire, R.; Xue, Q.; Kidwaro, F.; Ghatrehsamani, S.; Maharjan, B.; Goodwin, M. Managing Micronutrients for Improving Soil Fertility, Health, and Soybean Yield. Sustainability 2021, 13, 11766. [Google Scholar] [CrossRef]
  89. Lin, C.-W.; Chen, F.-Y.; Liu, S.-H.; Ma, C.-Y. Optimized Combination of Zero-Valent Iron and Oxygen-Releasing Biochar as Cathodes of Microbial Fuel Cells to Enhance Copper Migration in Sediment. Bioelectrochemistry 2024, 158, 108699. [Google Scholar] [CrossRef]
  90. Abbasi, M.; Rizvi, O.S.; Hussain, S.Z.; Jilani, A.; Osra, F.A.; Kajjumba, G.W.; Bhatnagar, A.; Khan, E.; Abbas, T. Nano-Zerovalent Copper Biochar Composite for Treating Selenium Oxyanions in Water: Synthesis, Evaluation, Removal Mechanism, Density Functional Theory, and Molecular Dynamics Simulations. Chem. Eng. J. 2024, 485, 149954. [Google Scholar] [CrossRef]
  91. Jalali, M.; Imanifard, A.; Jalali, M. Heavy Metals Accumulation in Wheat (Triticum aestivum L.) Roots and Shoots Grown in Calcareous Soils Treated with Non-Spiked and Spiked Sewage Sludge. Environ. Sci. Pollut. Res. 2023, 30, 20862–20873. [Google Scholar] [CrossRef]
  92. Wu, P.; Guo, Z.; Hua, K.; Wang, D. Long-Term Application of Organic Amendments Changes Heavy Metals Accumulation in Wheat Grains by Affecting Soil Chemical Properties and Wheat Yields. J. Soils Sediments 2023, 23, 2136–2147. [Google Scholar] [CrossRef]
  93. Wang, H.; Chen, D.; Wen, Y.; Cui, T.; Liu, Y.; Zhang, Y.; Xu, R. Insights into Influence of Aging Processes on Zero-Valent Iron Modified Biochar in Copper(II) Immobilization: From Batch Solution to Pilot-Scale Investigation. Front. Chem. Sci. Eng. 2023, 17, 880–892. [Google Scholar] [CrossRef]
Figure 1. Normalized cluster analysis of biochar attributes (300 °C and 550 °C) shows the similarity percentage within each formed group (I, II, III, IV, and VI). Total copper content (T-Cu); copper content in neutral ammonium citrate (NAC); 2% citric acid copper content (CA%); water-available copper content (W-Cu); index representing the copper NAC content in relation to the extractors and the total (I-NAC); index representing the copper AC% content (I-CA%); index representing the water copper content (I-W); pH; electrical conductivity (EC); yield content; volatile material content (VM); ash content; fixed carbon content (FC); carbon content (TOC); nitrogen content (N). Radar charts at the ends of the terminal branches display the variable value ratio for each biochar or composite normalized by the maximum value of the analyzed variable. The range of normalized attributes varies from 0 to 1 (maximum in all samples).
Agronomy 15 00144 g001
Figure 2. Fourier transform infrared spectroscopy with attenuated total reflection (ATR-FTIR) and the main peaks and characteristics of the chemical groups found in composites produced from biochar, doped or not with copper sulfate or copper oxide. (a) Composites doped with copper sulfate at 300 °C; (b) composites doped with copper sulfate at 550 °C; (c) composites doped with copper oxide at 300 °C and (d) composites doped with copper oxide at 550 °C.
Agronomy 15 00144 g002
Figure 3. Kinetics of copper release (Cu) as related to composites produced at 300 °C (a) and 550 °C (b) with the mixture of chicken manure, shrimp carcass, and sewage sludge plus copper sulfate and copper oxide previously to pyrolysis.
Agronomy 15 00144 g003
Figure 4. Scanning microscopy was obtained by FCM, FSC, and FSS, both under the influence of temperatures 300 and 550 °C and doped with CuSO45H2O or CuO. Images magnified at 10 μm.
Agronomy 15 00144 g004
Figure 5. Impact of fertilization with composites on wheat growth characteristics and Cu accumulation evaluated in contrasting Oxisols: Shoot Dry Matter (SDM), Root Dry Matter (RDM), and Grain Dry Matter (Grains) and Total Dry Matter (TDM). Soils: RYL: yellow-red latosol and DRL: dystrophic red Oxisol. Lowercase letters were used to compare the means of each parameter evaluated between treatments using the Tukey test (p < 0.05). Composites: CSS/CS-5: sewage sludge + copper sulfate at 550 °C; CSC/CS-3: shrimp waste + copper sulfate at 300 °C; CSS/CO-3: sewage sludge + copper oxide at 300 °C; CS: copper sulfate (p.a); NO: without copper application.
Agronomy 15 00144 g005
Figure 6. Impact of Cu-based composite fertilization on soil solution Cu availability and residual Cu extracted by EDTA in contrasting Oxisols cultivated with wheat. Lowercase letters were utilized for comparing means of each evaluated parameter between treatments using the Tukey test (p < 0.05). Composites: CSS/CS-5—sewage sludge biochar doped with copper sulfate at 550 °C; CSC/CS-3—shrimp waste biochar doped with copper sulfate at 300 °C; CSS/CO-3—sewage sludge biochar doped with copper oxide at 300 °C; CS—pure copper sulfate (p.a.); NO—no copper application.
Agronomy 15 00144 g006
Table 1. Identification of feedstocks, biochar sources, and synthesis temperatures for the biochar composites.
AcronymFeedstockTemperature (°C)Cu Source
FCMChicken Manure60no
FSCShrimp Shell
FSSSewage Sludge
BCM-3Chicken Manure300No
BSC-3Shrimp Shell
BSS-3Sewage Sludge
CCM/CS-3Chicken Manure300Copper Sulfate
CCM/CO-3Chicken ManureCopper Oxide
CSC/CS-3Shrimp ShellCopper Sulfate
CSC/CO-3Shrimp ShellCopper Oxide
CSS/CS-3Sewage SludgeCopper Sulfate
CSS/CO-3Sewage SludgeCopper Oxide
BCM-5Chicken Manure550No
BSC-5Shrimp Shell
BSS-5Sewage Sludge
CCM/CS-5Chicken Manure550Copper Sulfate
CCM/CO-5Chicken ManureCopper Oxide
CSC/CS-5Shrimp ShellCopper Sulfate
CSC/CO-5Shrimp ShellCopper Oxide
CSS/CS-5Sewage SludgeCopper Sulfate
CSS/CO-5Sewage SludgeCopper Oxide
Table 2. Physicochemical properties of Oxisols (RYL and DRL) utilized in wheat cultivation experiments, previously to liming and fertilization practices.
OxisolpHCClaySiltSandNPKCaMgFeMnBCuZn
---------- g kg−1 ------------- mg dm−3 ---cmolc dm−3------------ mg dm−3 -------------
RYL4.74.5460854553296.1217.50.80.435.73.00.10.00.2
DRL4.519.877010013025808.330.10.30.250.63.40.061.10.3
RYL—Red-Yellow Latosol (medium texture); DRL—Dystroferric Red Latosol (clay texture). pH measured in a soil-water ratio of 1:2.5; C—carbon content determined by dry combustion using an automatic Vario Cube TOC analyzer, Elementar, Germany; clay, silt, and sand fractions analyzed using the Bouyoucos method. N—total nitrogen determined by the Kjeldahl method; P—available phosphorus determined by the resin soil test; K, Fe2+, Mn2+, Cu2+, and Zn2+—availability determined by the Mehlich-1 soil test; B—determined using an EDTA extractor; Ca2+ (exchangeable calcium) and Mg2+ (exchangeable magnesium) extracted using a 1 mol L−1 KCl solution soil test. All analytical methods are described in detail in [24].
Table 3. Properties, elemental composition (C and N) and value of pH and EC of the biochar produced.
BiocharpHECYieldVMAshFCElemental CompositionC:N Ratio
(dS m−1)--------------------------------(%)-------------------------------------
CNC:N
BCM-39.1 6.4 69 57 529.3 35 2.1 16.6
BCM-510.7 8.2 53 56 60 11.1 26 1.9 13.1
BSC-39.2 7.3 8172 32 3.9 41 6.5 6.4
BSC-510.4 2.9 60 53 60 12.5 25 2.4 10.7
BSS-36.2 1.3 88 34 71 4.8 16 2.1 7.6
BSS-57.1 1.5 69 28 78 5.4 12 1.2 10.3
Values are mean (n = 3), except yield (%) (n = 1); EC: electrical conductivity; VM: volatile matter; Ashes; FC: fixed carbon; C: Carbon; N: nitrogen; C:N: carbon/nitrogen ratio. BCM-3: chicken manure biochar at 300 °C; BCM-5: chicken manure biochar at 550 °C; BSC-3: shrimp shell biochar at 300 °C; BSC-5: shrimp shell biochar at 550 °C; BSS-3: sewage sludge biochar at 300 °C; BSS-5: sewage sludge biochar at 550 °C.
Table 4. Comparative analysis of composite properties: impact of feedstock type, doping agents, and pyrolysis temperatures on chemical parameters.
CompositepHECYieldVMAshesFCElemental CompositionC:N Ratio
(dS m−1)--------------------------------------------(%)--------------------------------
CNC:N
CCM/CS-34.8 ± 0.121 ± 0.165 25 ± 0.536 ± 0.136 ± 0.517 ± 0.13 ± 0.15 ± 0.1
CCM/CS-510 ± 0.19 ± 0.14714 ± 0.119 ± 0.966 ± 0.919 ± 0.12.3 ± 0.18 ± 0.1
CCM/CO-38 ± 0.17 ± 0.17144 ± 0.145 ± 1.410 ± 1.427 ± 0.14.6 ± 0.16 ± 0.1
CCM/CO-511 ± 0.18 ± 0.15929 ± 0.533 ± 1.337 ± 1.822 ± 0.12 ± 0.111 ± 0.5
CSC/CS-35 ± 0. 123 ± 0.16456 ± 0.133 ± 1.39 ± 1.113 ± 0.14 ± 0.13.5 ± 0.1
CSC/CS-510 ± 0.13.5 ± 0.14420 ± 0.815 ± 0.964 ± 1.519.5 ± 0.14 ± 0.15.5 ± 0.1
CSC/CO-39 ± 0.15 ± 0.18450 ± 0.446 ± 0.11.6 ± 0.526.5 ± 0.14.4 ± 0.46 ± 0.5
CSC/CO-510 ± 0.13 ± 0.15422 ± 0.232 ± 1.246 ± 1.321 ± 0.13.3 ± 0.16.3 ± 0.2
CSS/CS-34 ± 0.125 ± 0.17230 ± 0.229 ± 0.439 ± 0.66 ± 0.11.4 ± 0.24 ± 0.6
CSS/CS-57 ± 0.12 ± 0.1488 ± 0.0419 ± 0.173 ± 0.16 ± 0.11.2 ± 0.15.4 ± 0.1
CSS/CO-35 ± 0.13 ± 0.19033 ± 0.127 ± 1.740 ± 1.613.5 ± 0.12.2 ± 0.16 ± 0.1
CSS/CO-58 ± 0.11 ± 0.17228 ± 0.519 ± 1.446 ± 2.011 ± 0.11.4 ± 0.17.5 ± 0.1
Table 5. Solubility and availability index of Cu–biochar composites.
Copper (Cu)
AcronymWT NACCA% W IndexNAC IndexCA% Index
------------------------(g kg−1)----------------------------------------(%)----------------
CCM/CS-378 ± 8.2233 ± 3.3147 ± 6.779 ± 6.233± 3.563 ± 2.634 ± 2.6
CCM/CS-50.1 ± 0. 1282 ± 1.257 ± 0.730 ± 0.10.1 ± 0.120 ± 0.211 ± 0.1
CCM/CO-30.3 ± 0.1111 ± 0.473 ± 3.98 ± 2.00.3 ± 0.165± 3.37 ± 1.8
CCM/CO-50.1 ± 0. 1237 ± 1.0141 ± 0.652 ± 1.30. 1 ± 0.160 ± 0.522 ± 0.6
CSC/CS-366 ± 0.1302 ± 2.8221 ± 0.7135 ± 0.122 ± 0.272 ± 0.445 ± 0.4
CSC/CS-50.1 ± 0. 1281 ± 0.829 ± 5.228 ± 2.30. 1 ± 0.110± 1.910 ± 0.8
CSC/CO-31.2 ± 0.2241± 0.1168 ± 2.116 ± 2.00.5 ± 0.170 ± 0.96.5 ± 0.8
CSC/CO-50.1 ± 0.1233 ± 3.3142 ± 0.142 ± 10.70.1 ± 0.161 ± 0.918 ± 4.5
CSS/CS-3194 ± 7.2309 ± 1.7213 ± 1.5155 ± 4.563 ± 2.169 ± 0.450 ± 1.6
CSS/CS-50.2 ± 0.1338 ± 5.619 ± 1.131 ± 2.40.1 ± 0.16 ± 0.49 ± 0.6
CSS/CO-36 ± 0.1204 ± 1.7138 ± 4.255 ± 5.53 ± 0.368 ± 1.527 ± 2.9
CSS/CO-50.2 ± 0.1215 ± 0.889 ± 2.430 ± 0.20.1 ± 0.142 ± 1.014 ± 0.1
Disclaimer/Publisher’s Note: The statements, opinions and data contained in all publications are solely those of the individual author(s) and contributor(s) and not of MDPI and/or the editor(s). MDPI and/or the editor(s) disclaim responsibility for any injury to people or property resulting from any ideas, methods, instructions or products referred to in the content.

