Article

Effects of Grazing Intensity on Microbial Diversity at Different Soil Depths in Desert Steppe Soils

College of Grassland, Inner Mongolia Agricultural University, Hohhot 010019, China
*
Author to whom correspondence should be addressed.
Agronomy 2025, 15(1), 124; https://doi.org/10.3390/agronomy15010124
Submission received: 4 December 2024 / Revised: 25 December 2024 / Accepted: 30 December 2024 / Published: 6 January 2025
(This article belongs to the Special Issue Utilization and Management of Grassland Ecosystems)

Abstract

:
This study examines the influence of grazing intensity on soil microbial communities in a desert steppe ecosystem. Soil samples were collected from three depths (0–10 cm, 10–20 cm, and 20–30 cm) under varying grazing intensities: control (CK), light (LG), moderate (MG), and heavy grazing (HG). Key soil physicochemical properties and plant characteristics were analyzed alongside microbial diversity and community composition, which were assessed by identifying amplicon sequence variants and by conducting linear discriminant analysis effect size. The results showed that grazing intensity significantly impacted soil moisture, organic carbon, total nitrogen, and phosphorus levels, with a notable decrease in plant cover and microbial diversity under heavy grazing. CK and LG treatments supported higher microbial diversity, especially in surface layers, while heavy grazing was associated with a shift in community composition toward stress-tolerant taxa like Acidobacteriota and Blastocatella. Non-metric multidimensional scaling analysis revealed differences in microbial community structure between soil depths, with the effects of grazing diminishing with depth. These findings highlight the critical role of sustainable grazing practices in maintaining soil health and microbial diversity, with implications for the long-term resilience of desert steppe ecosystems.

1. Introduction

Soil microorganisms are of fundamental importance to terrestrial ecosystems, playing critical roles in nutrient cycling, soil fertility, and plant health [1]. Communities of soil microbes, composed of bacteria, fungi, and archaea, are highly sensitive to changes in environmental conditions, including those caused by anthropogenic land management practices, such as grazing [2]. Grazing is widespread in grassland ecosystems [3], and it has the potential to profoundly alter soil’s physical and chemical properties, thereby influencing the structure, diversity, and functionality of microbial communities [4]. While the impacts of grazing on aboveground biodiversity and ecosystem productivity are well documented, grazing’s effects on soil microbial diversity remain less understood, particularly under varying grazing intensities [5].
Recent research highlights the complex interplay between grazing intensity and soil microbial dynamics, particularly in fragile ecosystems, such as desert steppes. Studies have shown that moderate grazing not only maintains but can even increase microbial diversity, significantly altering microbial community structure and improving soil health. In contrast, heavy grazing often reduces microbial biomass, degrades soil structure, and diminishes fertility [6]. Moderate grazing creates optimal conditions for microbial growth and efficient nutrient cycling via its association with increased microbial biomass and enzymatic activity. Changes in microbial community composition under moderate grazing have also been linked to increased soil organic carbon turnover, underscoring the critical role of microbial processes in ecosystem carbon dynamics [7]. The distribution of microbial functional traits, particularly in relation to nitrogen cycling, varies spatially and fluctuates with grazing intensity, highlighting the need for grazing management strategies that align with ecological sustainability and productivity [8]. These findings illustrate the nuanced responses of soil microbial communities to different grazing pressures, reflecting broader ecological trends influenced by geographic and environmental factors [9].
In arid and semi-arid ecosystems such as deserts, the impacts of grazing are particularly significant due to limited biomass production and slow rates of vegetation recovery [10]. Historically, research in semi-arid areas has tended to focus primarily on plant responses and soil erosion, with relatively little attention given to the underlying soil microbiota [11]. Moreover, while some studies have explored the effects of grazing on microbial communities on the soil surface, few have examined how these impacts vary with soil depth, despite the extensively documented stratification of microbial communities and processes with depth [12].
Understanding interactions between grazing intensity and soil microbial diversity is important for several reasons. First, microbial diversity is a key indicator of soil health and resilience, influencing nutrient availability, decomposition rates, and overall ecosystem productivity [13,14]. Second, insights into how grazing affects soil microbes can inform the development of sustainable grazing and land management policies, which are vital for maintaining the ecological integrity and economic viability of grasslands [15]. Therefore, this study aimed to address these gaps in knowledge by exploring the effects of grazing intensity on soil microbial diversity across multiple soil layers in a desert steppe ecosystem. Specifically, we sought to answer the question: How do low, moderate, and high grazing intensities influence the composition and diversity of soil microbial communities, and how do these effects vary with depth (i.e., 0–10 cm, 10–20 cm, and 20–30 cm)?
To achieve these objectives, we integrated field experiments with advanced laboratory analyses. We collected soil samples from experimental plots subjected to varying grazing intensities within a controlled study design. Microbial diversity was assessed using high-throughput DNA sequencing of 16S rRNA genes, and the resulting data were analyzed using a combination of traditional statistical methods and cutting-edge bioinformatics tools. By providing detailed insights into the belowground ecological effects of grazing, this work advances the field of soil ecology and supports the development of evidence-based guidelines for sustainable grazing management that promotes soil health and biodiversity.

2. Materials and Methods

2.1. Experimental Design

The study area is located at the Siziwang Base (111°53′41.7″ N, 41°46′43.6″ E; elevation 1456 m above mean sea level) of the Comprehensive Experimental Demonstration Center, Inner Mongolia Academy of Agriculture and Animal Husbandry Sciences. This region is characterized by a typical mid-temperate continental climate and belongs to the Stipa breviflora desert steppe zone. The soil is primarily light chestnut calcic soil. The climate features dry and windy springs, hot summers, and cold winters. The average annual precipitation is 248 mm, mainly concentrated from June to September. The average annual temperature is 3.4 °C, with the highest monthly averages in June, July, and August. The annual temperature sum ranges from 2200 to 2500 °C, with a daily average temperature ≥ 10 °C and a frost-free period of 90–120 days.
A complete randomized block design was employed, enclosing approximately 50 ha of natural grassland since 2004 (maintained for 19 years until 2023). The present study’s data collection was conducted in 2023 (see Figure 1). The experimental area was divided into three blocks, each containing four treatment plots: control (NG), light grazing (LG), moderate grazing (MG), and heavy grazing (HG). Each treatment was replicated three times. Each experimental plot covered an area of 4.4 ha and was randomly arranged. The grazing animals were castrated Mongolian sheep of approximately two years old (mean age: 2.0 ± 0.1 years). Prior to 2004, this study site was grazed year-round by sheep at a relatively high stocking rate (~1.0 sheep equivalent ha−1) [16], leading to a relatively degraded grassland with 17~20% vegetative cover [17]. A grazing manipulation experiment was established in June 2004 in a ~50 ha site with relatively flat terrain and homogeneous vegetation and soil types. Twelve experimental plots of 4.4 ha were constructed with iron wire fencing and distributed among three replicate experimental blocks, and each received one of four grazing treatments: control (no grazing), light grazing (0.91 sheep unit · [hm2 A−1] −1), moderate grazing (1.82 sheep unit · [hm2 A−1] −1), and heavy grazing (2.71 sheep unit · [hm2 A−1] −1). These grazing intensities were determined based on the theoretical stock capacity of the Stipa breviflora desert steppe and the design proposed by Wei [18]. The grazing period each year lasted five months, starting in June and ending in early October. Animals were herded into the grazing area for free grazing during the day and returned to the pens at night.
All samples were collected on a single day in August 2023. In each plot, ten 1 m × 1 m quadrats were randomly selected to measure plant height, coverage, and density by species. Details of plant density and relative abundance by species and functional groups under different grazing treatments are provided in Table 1. Vegetation within quadrats was divided into aboveground green parts and litter. Plants were cut at ground level, placed into envelopes, and transported to the laboratory. Fresh weight was measured, followed by drying at 85 °C for 12 h to determine dry weight and calculate aboveground biomass. Underground biomass was determined using a 30 cm × 30 cm excavation method, repeated three times for soil layers at depths of 0–10 cm, 10–20 cm, and 20–30 cm. Samples were transported to the laboratory, washed through a 1 mm sieve, dried at 105 °C for 24 h, and weighed to calculate underground biomass.

2.2. Measurement of Soil Physicochemical Properties

In August, soil samples were collected under sunny, cloudless, and calm weather conditions whenever possible; if rainfall occurred, sampling was postponed until three days after the rain. Soil samples were collected from depths of 0–10 cm, 10–20 cm, and 20–30 cm using a 3 cm diameter soil auger in the grazing area. Four replicates were taken from each site, and three cores per replicate were combined into one composite sample. Mixed samples were divided into two parts: one part was air-dried for chemical property analysis; the other was stored at −20 °C for microbial sequencing.
  • Soil pH measurement: Soil pH was measured using a pHS-3G digital pH meter (Starter3100, OHAUS, Parsippany, NJ, USA). Five grams of air-dried soil were placed in a 50 mL conical flask, mixed with 25 mL of ultrapure water (soil-to-water ratio of 1:5), shaken thoroughly, and left to stand for 30 min before measurement.
  • Soil moisture (SM) and bulk density (SBD): Soil moisture content was determined by the drying method, and soil bulk density was measured using the ring knife method, each with three replicates.
  • Total soil phosphorus (TP) measurement: Total phosphorus was measured using the HClO4-H2SO4 digestion method. Five grams of air-dried soil were weighed with an analytical balance (CP224C, Sartorius, Germany) accurate to 0.0001 g and placed in a digestion tube. Five milliliters of concentrated sulfuric acid and ten drops of perchloric acid were added. The mixture was digested at 150 °C for 1 h in a temperature-controlled far-infrared digestion furnace (LWY84B) and then at 360 °C for an additional hour. The digest was transferred to a 100 mL volumetric flask, diluted to volume with distilled water, and filtered through phosphorus-free filter paper into a 10 mL centrifuge tube. Total phosphorus content was determined using a flow analyzer (AUTO ANALYZER3-AA3, SEAL Analytical, Germany).
  • Soil organic carbon (SOC) measurement: Soil organic carbon was determined using the external heating potassium dichromate oxidation method. A 0.2500 g sample of air-dried soil was weighed into a digestion tube. Five milliliters each of concentrated sulfuric acid and 0.8 mol·L⁻¹ potassium dichromate solution (prepared after drying the reagents at 130 °C for 1 h) were added. The mixture was heated at 180 °C for 10 min in a digital constant-temperature oil bath (HH-S8). The digest was transferred to a conical flask, diluted with distilled water to 60–70 mL, and 1,10-phenanthroline indicator was added. The solution was titrated with 0.2 mol·L⁻1 ferrous sulfate standard solution until it turned brick-red, and the reading was recorded.
  • Soil total nitrogen (TN) and available phosphorus (AP) measurement: Soil total nitrogen (TN) was determined using an elemental analyzer (Vario TOC, Elemental Inc., Germany). Specifically, air-dried soil samples were ground, passed through a 100-mesh sieve, and precisely weighed (105 mg) on a high-precision balance. Each subsample was then wrapped in a tin capsule and analyzed for total nitrogen content. Available phosphorus (AP) was measured using a spectrophotometer following standard colorimetric procedures.

2.3. Soil DNA Extraction, PCR Amplification, and Bacterial 16S rRNA Gene Sequencing

Genomic DNA was extracted from soil samples of each plot using the QIAGEN DNA extraction kit (Qiagen Gel Extraction Kit, Qiagen, Hilden, Germany). Extracted DNA samples were stored at −80 °C. DNA purity and concentration were assessed by agarose gel electrophoresis. Suitable DNA samples were diluted to 1 ng·µL⁻¹ with sterile water. The diluted genomic DNA served as the template for PCR amplification. Specific primers with barcodes were used based on the selected sequencing region, along with New England Biolabs’ Phusion® High-Fidelity PCR Master Mix with GC Buffer to ensure amplification efficiency and accuracy. PCR amplification targeted the V4 region of the 16S rRNA gene using primers 515F (5′-GTGCCAGCMGCCGCGGTAA-3′) and 806R (5′-GGACTACHVGGGTWTCTAAT-3′).
The DNA samples were sent to Beijing Novogene Bioinformatics Technology Co., Ltd. (Beijing, China). Library construction was performed using a kit (TruSeq® DNA PCR-Free Sample Preparation Kit). Constructed libraries were quantified using Qubit and qPCR. Qualified libraries were sequenced on the NovaSeq 6000 platform.

2.4. Statistical Analysis

Data were organized and analyzed using Excel 2013 (Microsoft Corporation, USA), SPSS 19.0 (IBM., Chicago, IL, USA), and R 3.5.1 software. Figures were generated using Origin 2017 (Origin-Lab Corporation, Northampton, MA, USA) and R 3.5.1. Prior to statistical analysis, we assessed the normality of each variable (vegetation traits, soil factors, and microbial communities) using the Shapiro–Wilk test. For those variables that satisfied normal distribution and homogeneity of variance assumptions, one-way ANOVA was performed to compare the effects of grazing intensity, followed by the LSD test for multiple comparisons of mean values at a significance level of 0.05. However, if a variable did not meet these assumptions, we applied an appropriate data transformation (e.g., log or square root) or used nonparametric methods (e.g., Kruskal–Wallis test) to ensure the reliability of the statistical inferences. Linear discriminant analysis (LDA) combined with effect size measurements (LEfSe) was used to identify microbial biomarkers with significant differences between groups.

3. Results

3.1. Soil Properties and Vegetation Traits

The physical and chemical properties of soil and plant characteristics under different grazing intensities are shown in Table 2. Soil moisture content in the (HG) treatment was significantly lower (p < 0.05) than that in the (LG) and (MG) treatments. The soil organic carbon of CK and LG was significantly higher than that of MG and HG (p < 0.05), the total soil nitrogen of LG was significantly higher than that of HG (p < 0.05), the total soil phosphorus of CK and LG was significantly higher than that of HG (p < 0.05), the available phosphorus of LG was significantly higher than that of CK, MG, and HG (p < 0.05), and the plant coverage decreased significantly with the increase in grazing intensity (p < 0.05). Belowground biomass decreased significantly with increasing grazing intensity (p < 0.05). There were no significant differences in the remaining variables under different grazing intensities.

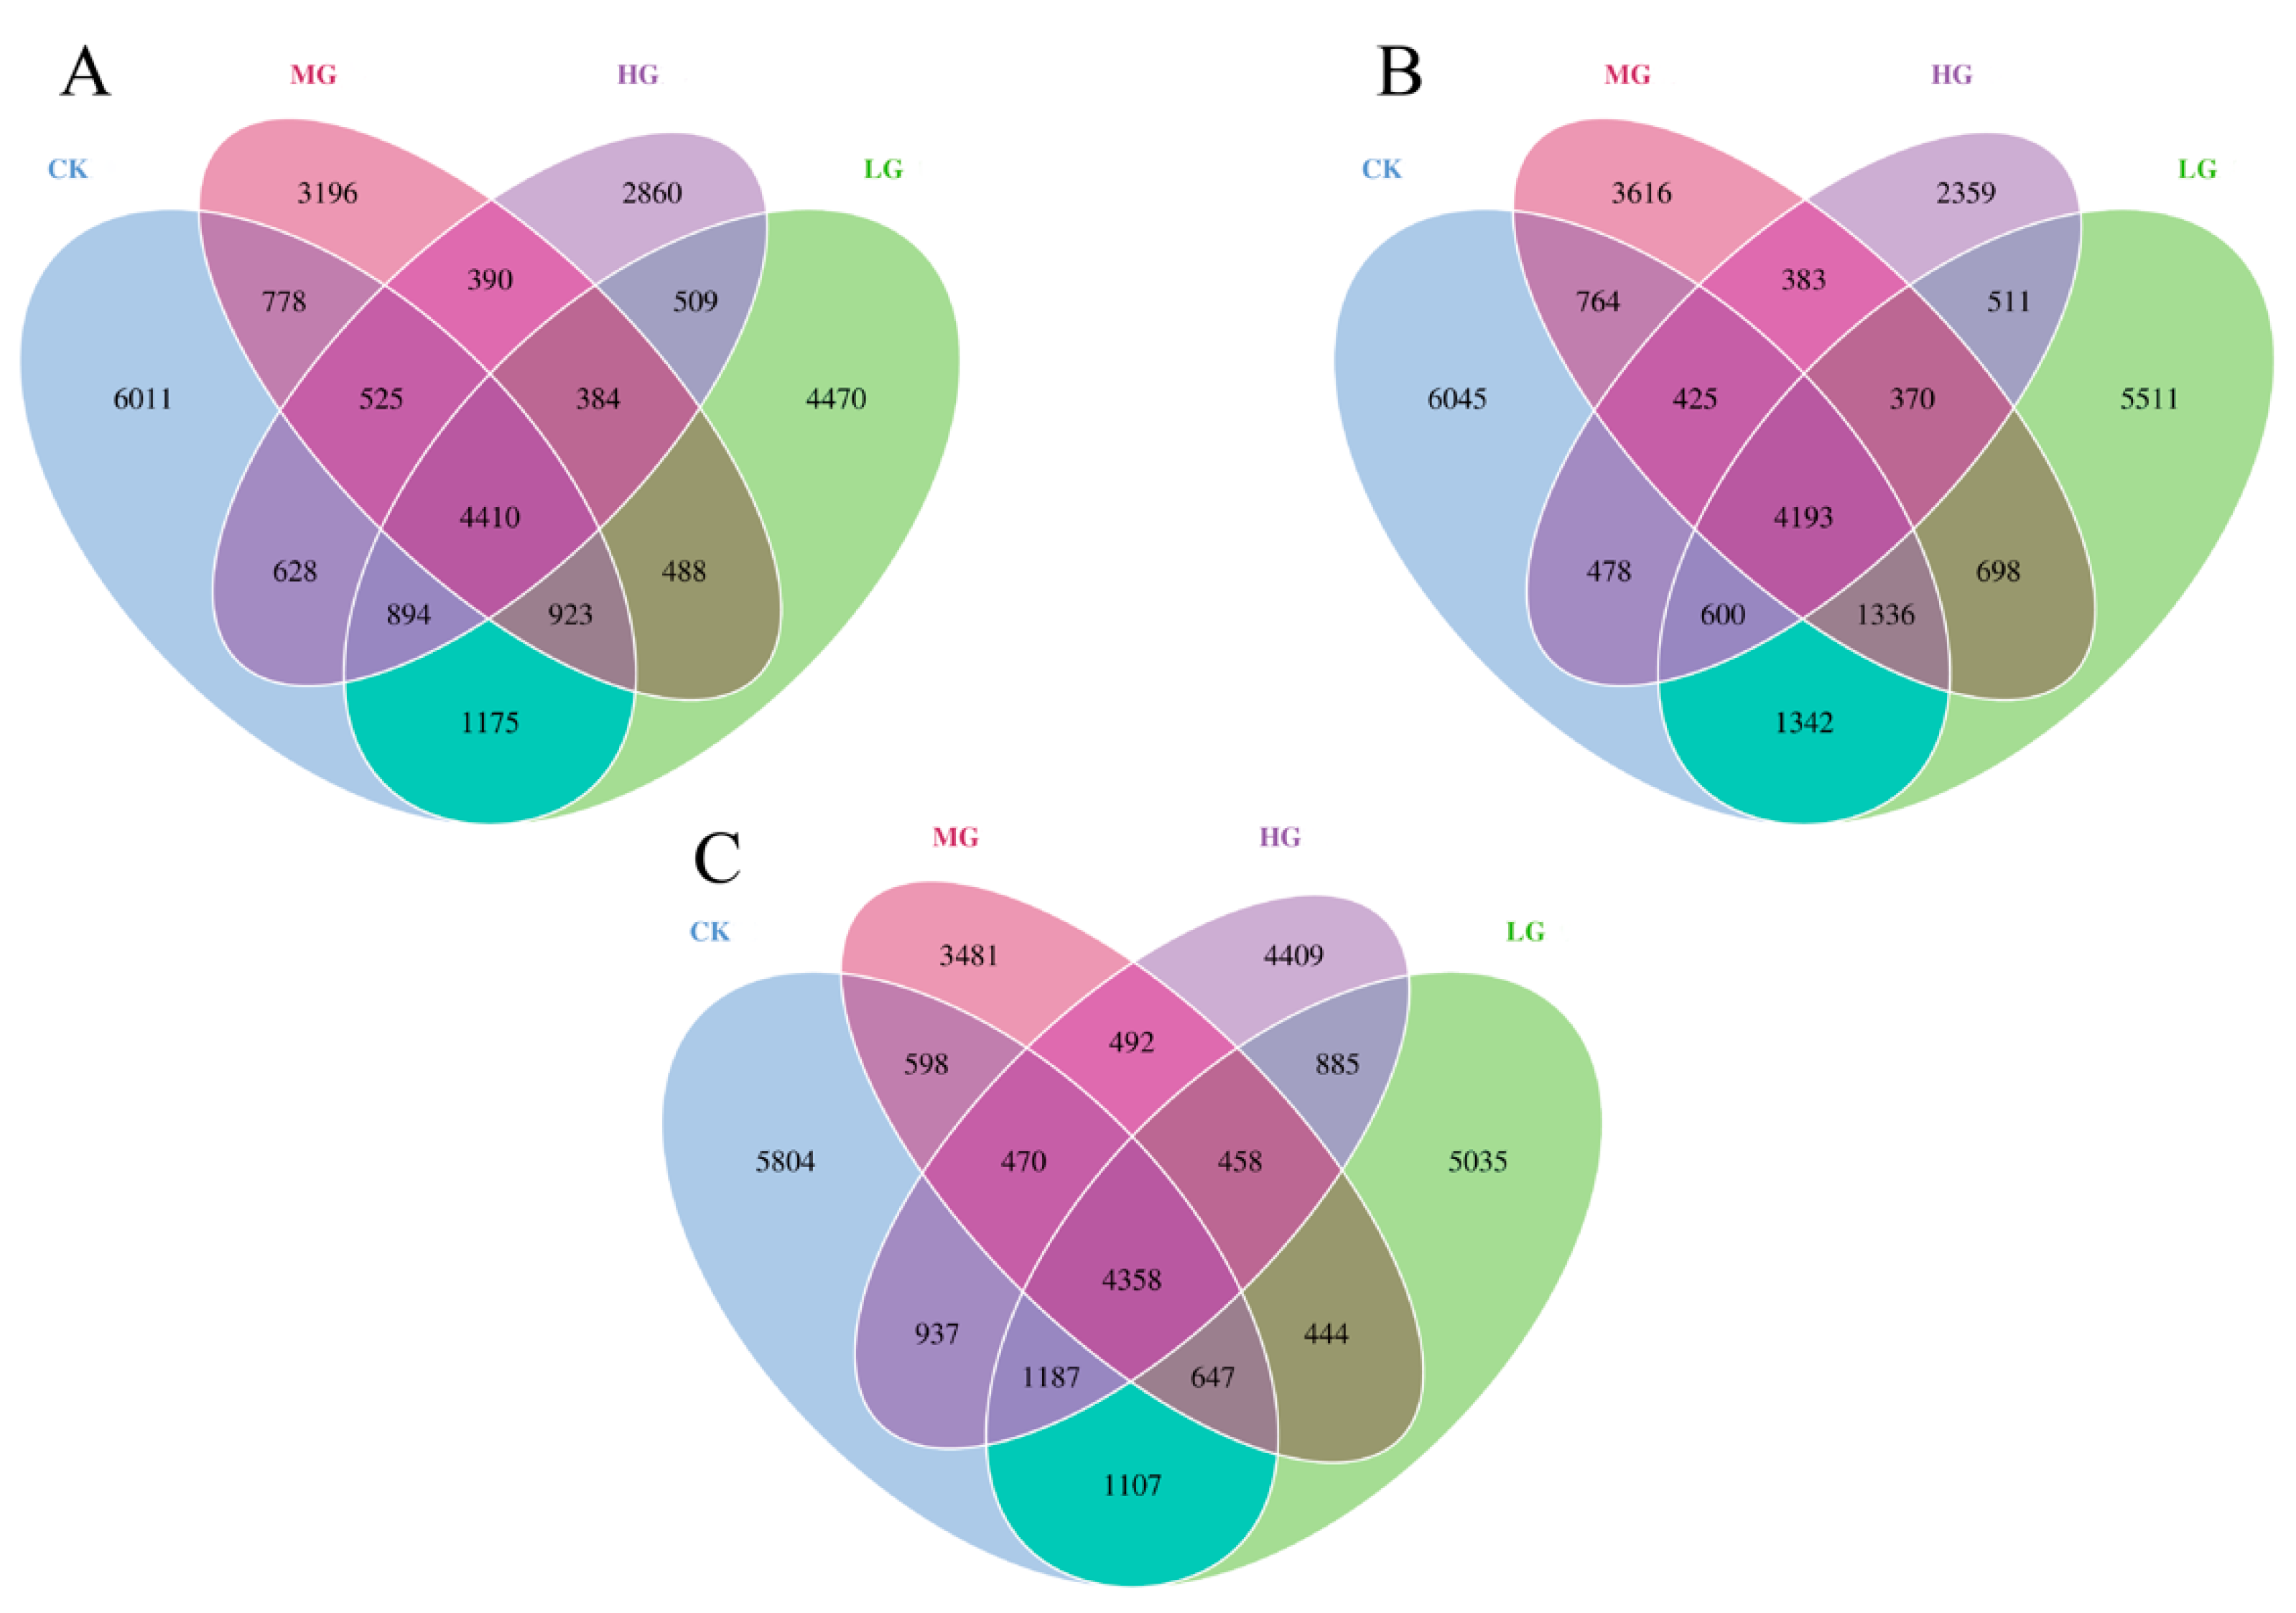
3.2. Microbial Community Richness and Biodiversity

Our analysis of amplicon sequence variants (ASVs) revealed significant variation in the distribution of microbial communities across soil depths and grazing intensities (Figure 2).
A total of 27,641 ASVs were identified in the top 10 cm of soil. In CK, we identified 15,344 ASVs (55.5% of the total for this depth), 13,253 in LG (47.9%), 11,094 in MG (40.1%), and 10,600 in HG (38.3%). The ASV count declined noticeably with increasing grazing intensity, with 6011 unique ASVs in CK, 4479 in LG, 3196 in MG, and 2860 in HG.
In the 10–20 cm soil layer, we identified 28,631 ASVs. CK contained 15,183 ASVs (53.0%), LG had 13,961 (48.8%), MG contained 11,785 (41.2%), and HG had 9319 (32.5%). The ASV counts declined consistently with increasing stocking rate, with CK having 6045 unique ASVs, LG having 5511, MG having 3616, and HG having 2359.
We identified 30,312 ASVs in the 20–30 cm soil layer, with 15,108 in CK (49.8%), 14,121 in LG (46.6%), 10,948 in MG (36.1%), and 13,196 in HG (43.5%). With the exception of MG, total ASVs decreased with increasing grazing intensity. CK had 5804 unique ASVs, LG had 5035, MG had 3481, and HG had 4409. These data indicate a complex interaction between soil depth, grazing intensity, and microbial community dynamics.
We examined prokaryotic α-diversity under different grazing intensities. As depicted in Figure 3, Shannon–Wiener index values generally declined with increasing grazing intensity. Notably, α-diversity was significantly higher in CK and LG in the 0–30 cm soil layers compared to HG (p < 0.05). Specifically, in the 0–10 cm and 20–30 cm soil layers, α-diversity was significantly higher in CK than in HG (p < 0.05). Similarly, Chao1 diversity mirrored this trend with increasing grazing intensity. In the 0–30 cm, 10–20 cm, and 20–30 cm soil layers, richness was significantly higher in CK and LG than in HG (p < 0.05). Furthermore, richness was significantly greater in CK than in MG or HG (p < 0.05) in the shallowest depth (0–10 cm), underscoring the impact of grazing on microbial diversity within these ecosystems.

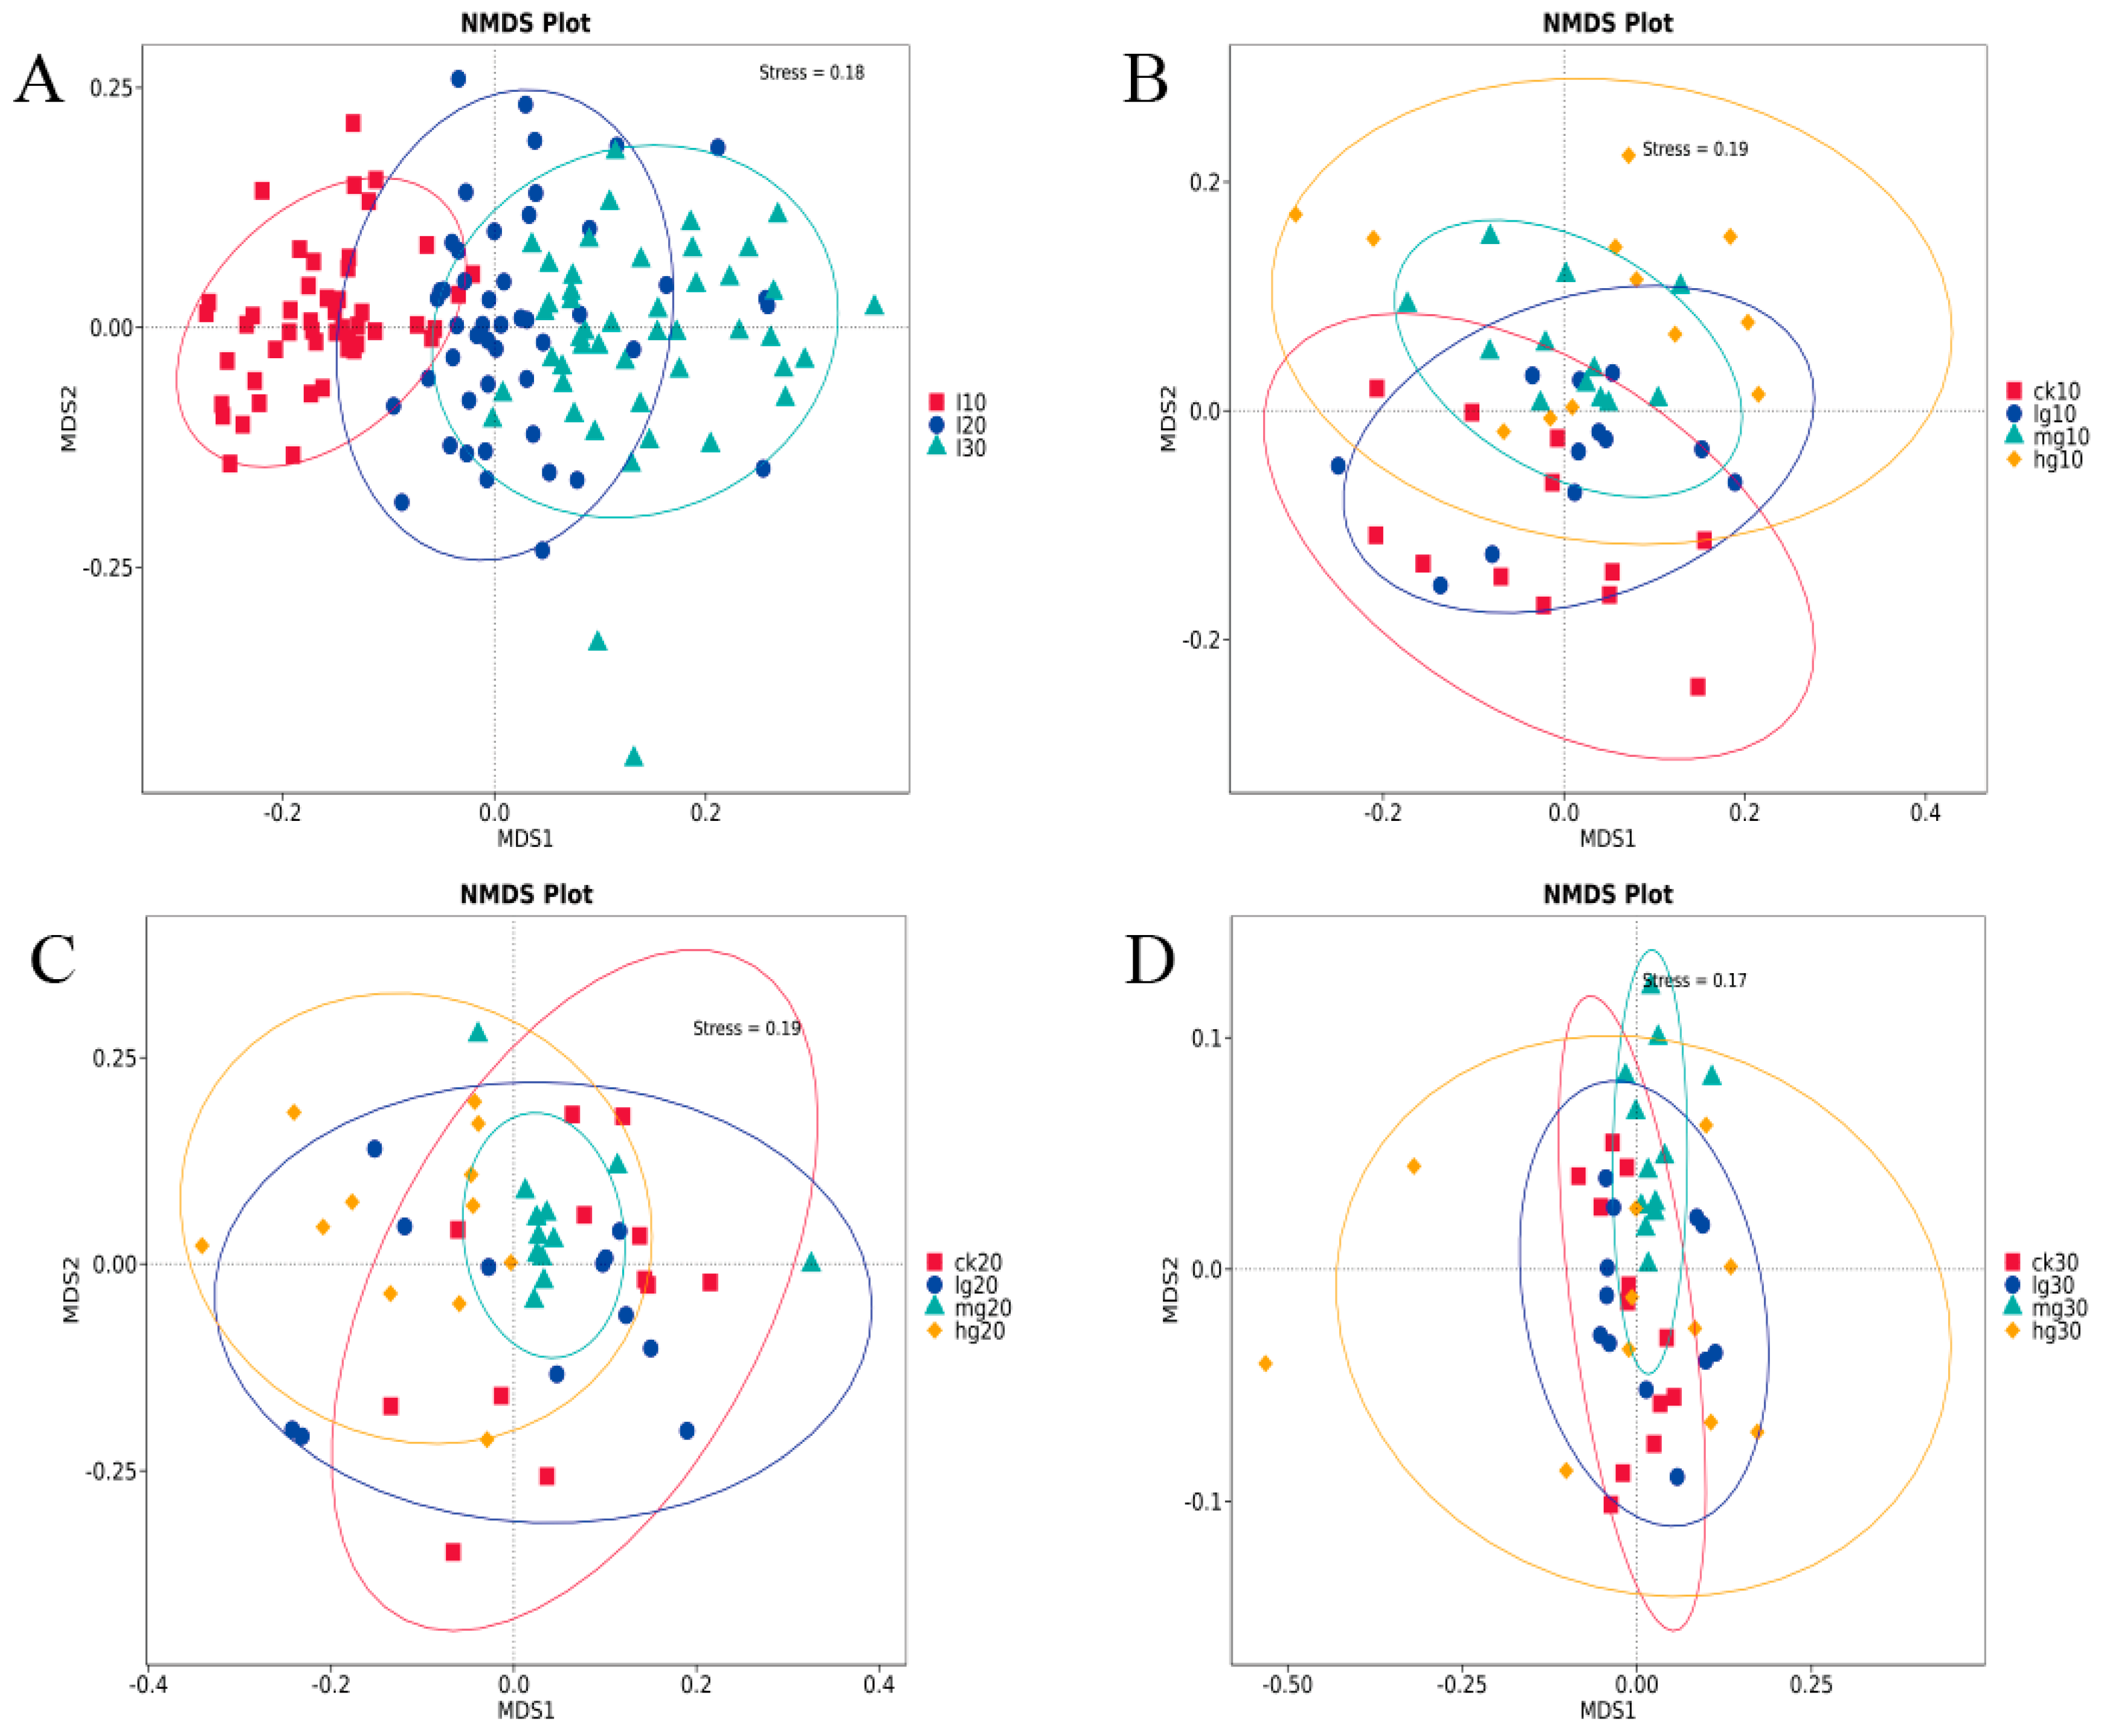
3.3. Bacterial Beta Diversity

Figure 4 presents the results of a ranking analysis based on non-metric multidimensional scaling (NMDS) similarity distance values. All had stress values < 0.2, indicating that the figure reflects the true distribution of prokaryotic microbial community similarity rankings under different grazing intensities. As shown in Figure 4A, NMDS analysis highlighted a substantial distance between the 0–10 cm and 20–30 cm soil layers, suggesting that microbial community structure differed at these depths. Further, the NMDS results for the 0–10 cm (Figure 4B) and 10–20 cm (Figure 4C) soil layers reveal significant separation between CK and HG, indicating pronounced differences in prokaryotic community structure between these treatments. Conversely, NMDS results for the 20–30 cm soil layer (Figure 4D) depict a more compact distribution of prokaryotes across treatments, suggesting that grazing intensity influences microbial community structure less at this depth.

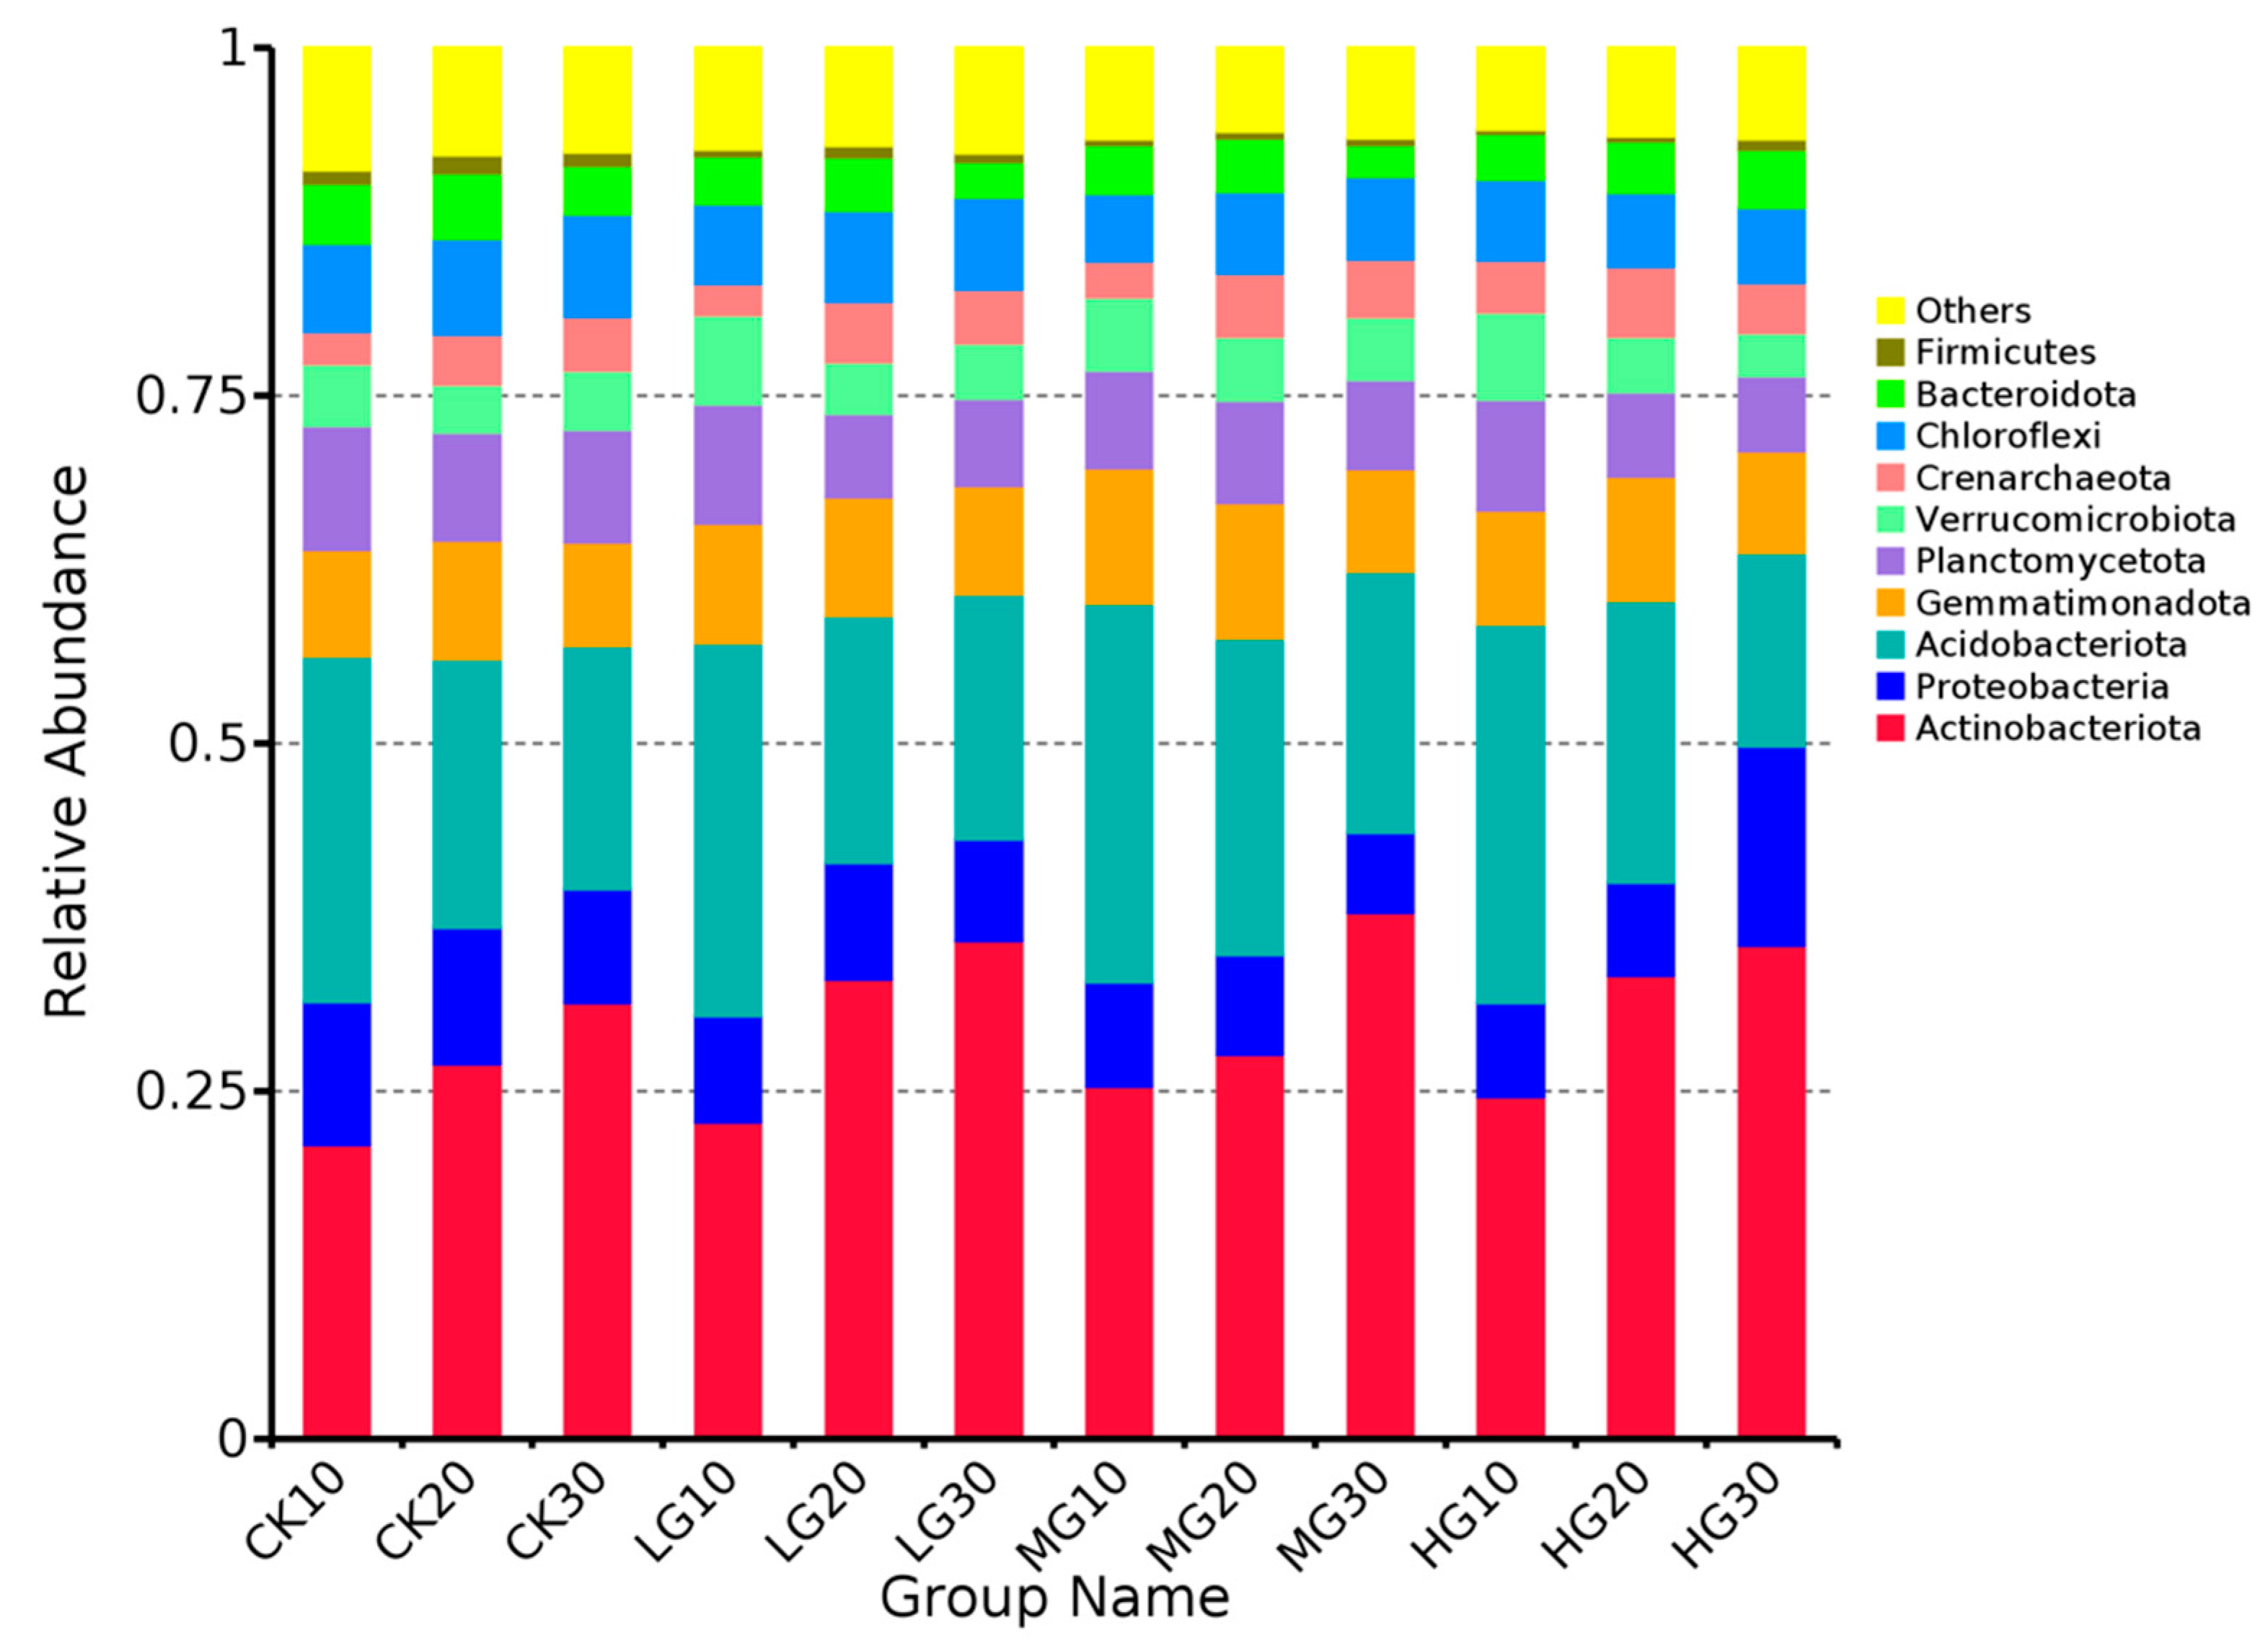
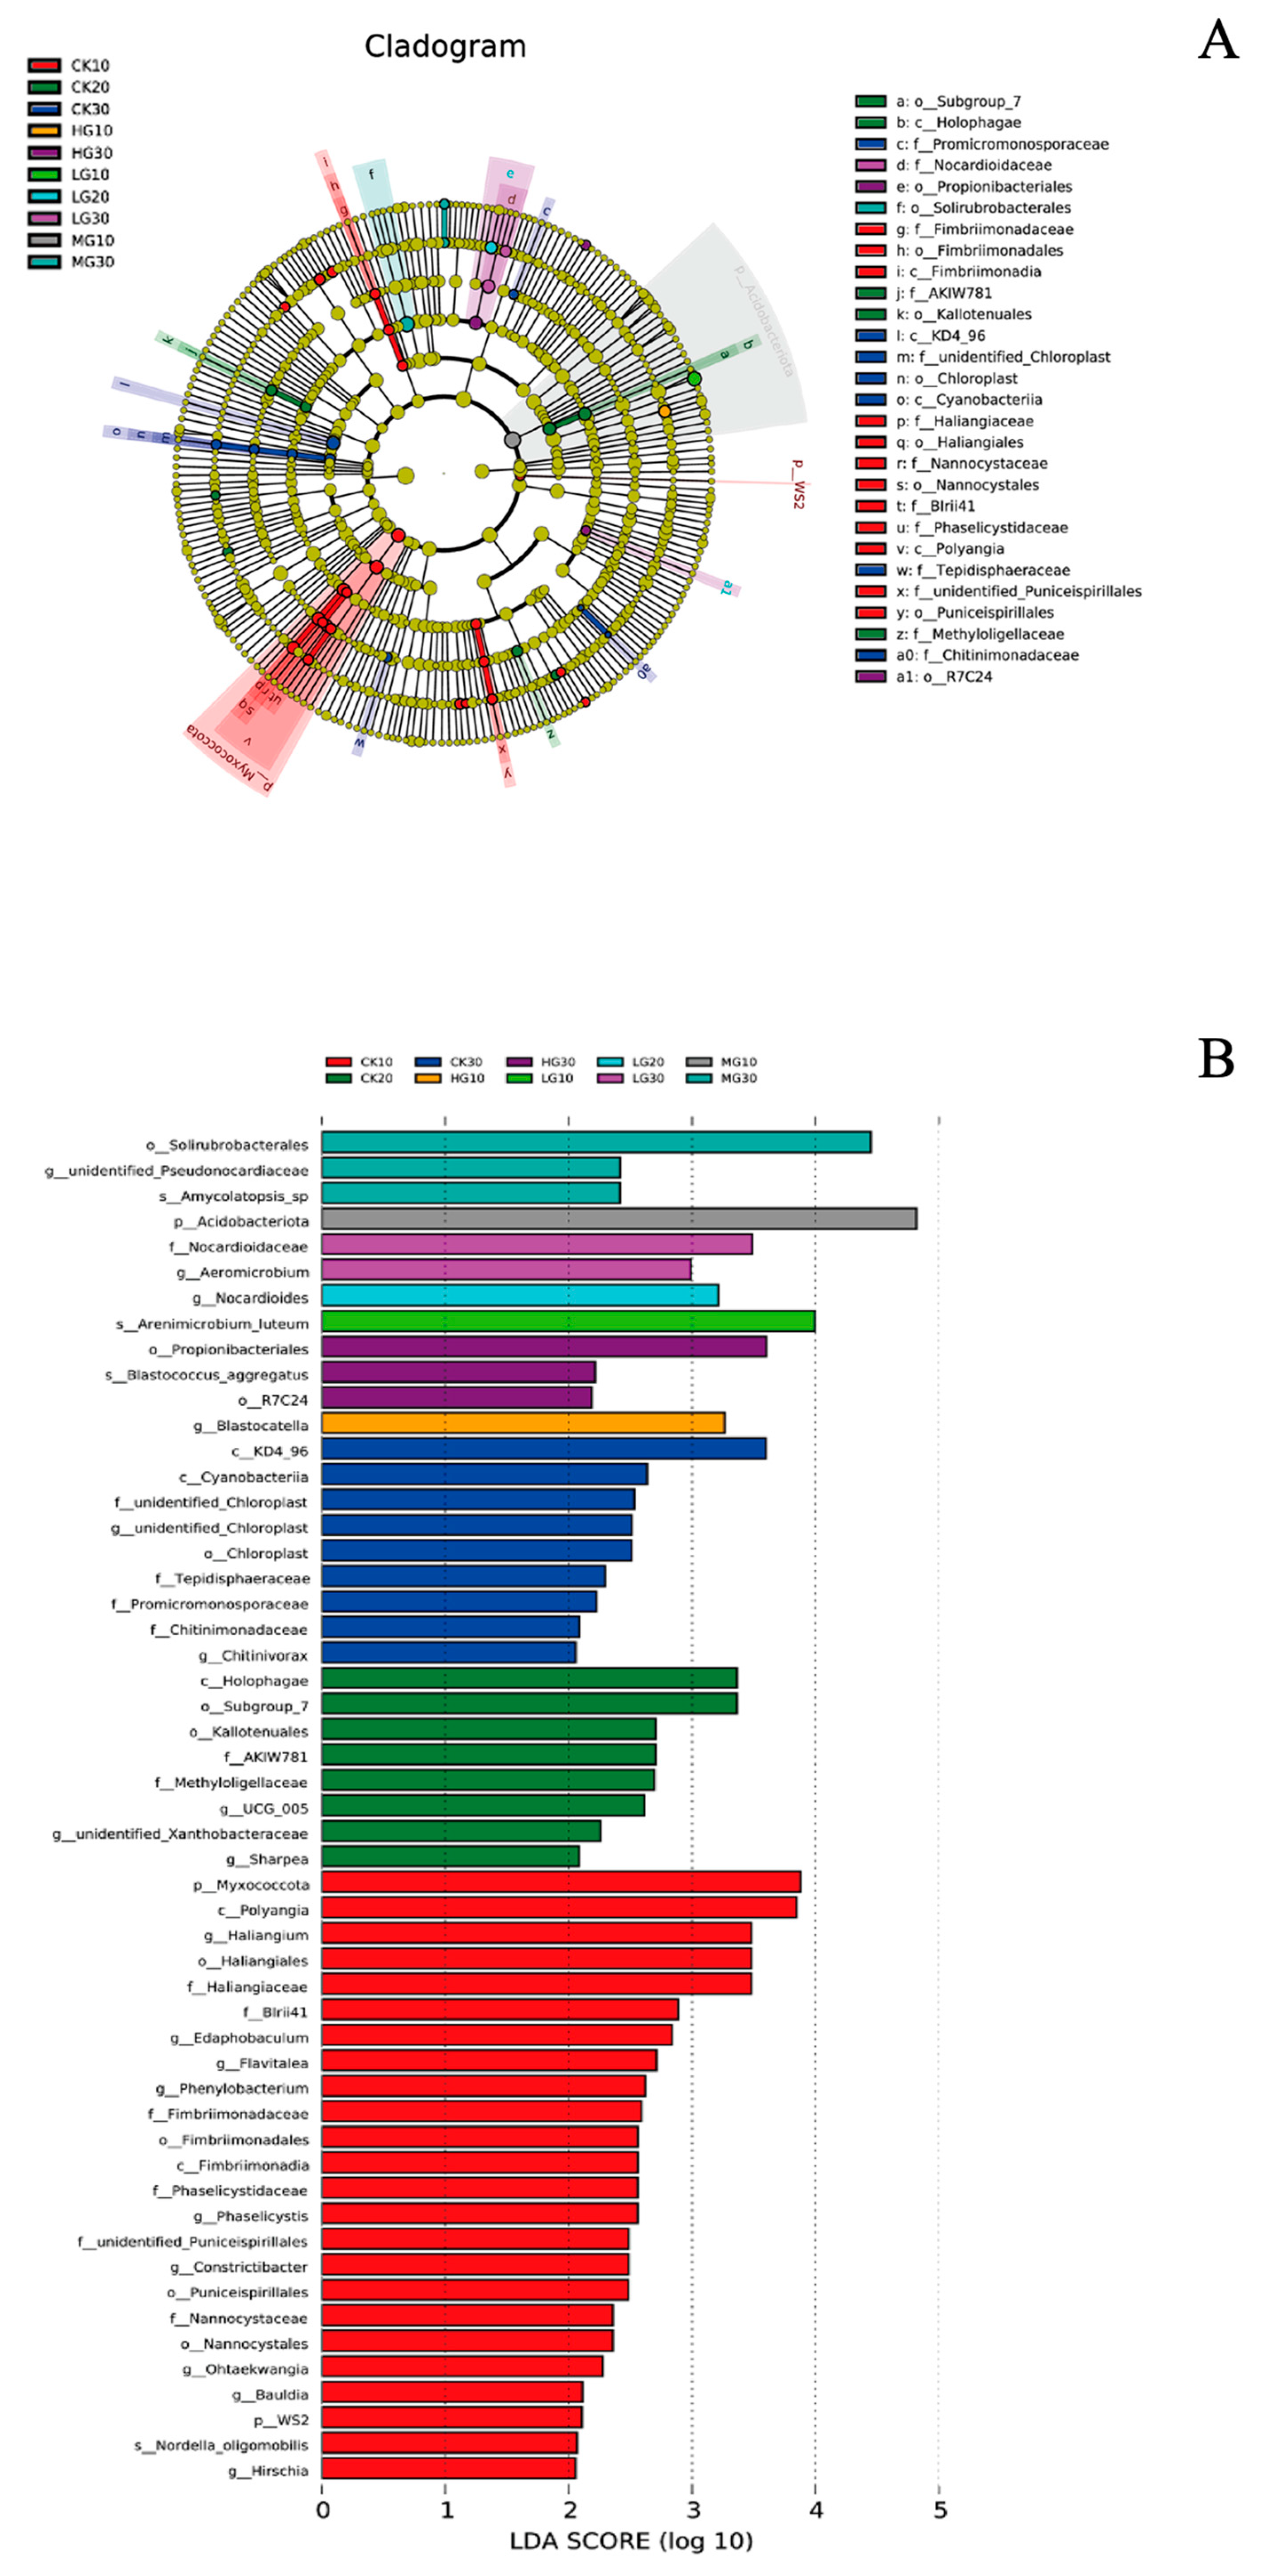
3.4. Community Composition

Our analysis of community composition across soil depths and grazing intensities revealed significant variation in the prevalence of dominant bacterial phyla. We analyzed the ten most abundant phyla, which all had relative abundance > 1%: Actinobacteriota, Proteobacteria, Acidobacteriota, Gemmatimonadota, Planctomycetota, Verrucomicrobiota, Crenarchaeota, Chloroflexi, Bacteroidota, and Firmicutes. Microbial diversity was influenced by both soil depth and grazing intensity, as depicted in Figure 5. Notably, Actinobacteriota and Proteobacteria were the predominant phyla across all groups, reflecting their crucial roles in soil ecological processes.

3.5. Soil Properties and Relative Abundance

Our analysis of soil samples revealed that microbial community composition differed across depths and grazing intensities (Figure 6). The 0–10 cm layer of CK was significantly enriched in 24 bacterial taxa, with Myxococcota (P_), Polyangia (c_), Haliangium (g_), Haliangiales (o_), and Haliangiaceae (f_) exhibiting the highest differential abundance (LDA > 3.0); the 10–20 cm layer in CK was enriched in eight bacterial taxa, notably Holophagae (c_) and Subgroup_7 (o_), both of which had LDA > 3.0; and the 20–30 cm layer was enriched in nine taxa, with KD4_96 (c_) having the highest significance (LDA > 3.5).
By contrast, LG had fewer bacterial taxa: the 0–10 cm layer was only enriched in Arenimicrobium luteum (s_), while the 10–20 cm layer was enriched in Nocardioides (g_), both of which had LDA scores above 3.0. The deepest soil layer was enriched in two taxa, with Nocardioidaceae (f_) being predominant (LDA > 3.0).
Patterns of relative abundance were unique in MG, particularly in the 0–10 cm layer, where only Acidobacteriota (p_) was significantly enriched, with an LDA score of 4.5, indicating a robust response to grazing pressure. The 20–30 cm soil layer was significantly enriched in three taxa, including Solirubrobacterales (o_), which emerged as the most influential (LDA > 4.0).
HG influenced microbial communities differently, with the 0–10 cm soil layer enriched only in Blastocatella (g_) (LDA > 3.0) and the 20–30 cm layer enriched in three taxa, with Propionibacteriales (o_) as the most critical (LDA > 3.5).

4. Discussion

Interactions between vegetation, soil, and microorganisms form a complex feedback system in which each component affects and responds to changes in the other components [19,20,21]. Grazing is an important environmental factor that alters this balance by affecting plant growth, soil properties, and microbial community structure [15,22,23]. Exploring the effects of grazing intensity on interrelationships between soil physicochemical properties, plant characteristics, and microbial communities can reveal the potential mechanisms by which grazing affects grassland ecosystem function and health and provide a scientific basis for the formulation of sustainable grassland management strategies [24,25,26].
We found that grazing intensity significantly affected soil moisture content, soil organic carbon (SOC), total nitrogen (TN), and total phosphorus (TP). The initial increase in soil moisture under LG suggests that the reduced plant cover caused by moderate disturbance may decrease transpiration but not be sufficient to drive a large decrease in evaporation. However, as grazing intensity increased to moderate and heavy levels, soil moisture content decreased, probably due to soil compaction caused by trampling, which reduced infiltration and increased surface runoff.
SOC and TN initially increased at LG compared to CK but subsequently decreased at MG and HG, indicating that heavier grazing intensities can negatively impact soil nutrient pools. This is consistent with the results of other studies [27,28,29], showing that heavy grazing reduces plant litter inputs and increases soil erosion, leading to lower soil organic matter content and nitrogen availability.
Soil TP and available phosphorus (AP) also showed significant changes with grazing intensity. The higher AP levels in LG compared to other treatments may be attributed to the positive effects of light grazing on soil aeration and nutrient cycling. Under light grazing, manure deposition and slight disturbance of soil structure can enhance phosphorus mineralization, increasing its availability to plants and microorganisms [30,31].
This study found that the number of soil microbial ASVs increased with soil depth, while ASV counts in the 0–10 cm and 10–20 cm soil layers decreased with increasing grazing intensity. In the top two soil layers, ASV counts were highest in CK and lowest in HG. In the 20–30 cm soil layer, the number of ASVs first decreased before increasing and was highest in CK and lowest in MG. This is consistent with Fang’s findings that overgrazing significantly reduces microbial ASV counts in typical grasslands [32,33]. Our study found that Shannon–Wiener and Chao1 diversity generally decreased with increasing grazing intensity. This trend was most obvious in the surface soil (i.e., 0–10 cm and 10–20 cm), where grazing had the greatest direct impact due to trampling, defecation, and selective plant consumption. The decrease in microbial diversity under HG is consistent with previous studies [34], which found that high-intensity grazing causes soil compaction and lower organic matter inputs, both of which are detrimental to microbial habitat quality [23,35,36].
Our finding that Actinobacteria and Proteobacteria were the dominant phyla in all treatments suggests that they play a key role in maintaining soil function in arid environments. Actinobacteria are known for their ability to degrade complex organic compounds and thrive in the nutrient-poor and dry soils typical of desert steppe ecosystems [37,38,39]. On the other hand, Proteobacteria are versatile and include many taxa involved in nitrogen cycling, which is essential for maintaining soil fertility [40]. However, the observed decrease in microbial diversity and enrichment of specific taxa (such as Acidobacteria) under heavy grazing may indicate a shift toward lower functional diversity. Members of Acidobacteria are typically associated with low-nutrient environments but were significantly enriched in the 0–10 cm soil layer under moderate grazing. This suggests that grazing may have caused community composition to shift in favor of taxa more adapted to stress and resource scarcity. Such a shift could have long-term consequences for soil nutrient cycling and overall ecosystem resilience, especially if heavy grazing pressure persists [41,42,43].
LEfSe analysis revealed that the 0–10 cm soil layer of the desert steppe was highly responsive to grazing intensity, with taxa such as Myxococcota, Polyangia, Haliangium, and Haliangiaceae particularly abundant in non-grazed or lightly grazed areas. These taxa are typically associated with organic-rich environments and are involved in the degradation of complex organic compounds that are more readily available in undisturbed soils. Under moderate grazing, the high abundance of Acidobacteriota suggests that microbial communities shifted in favor of taxa better adapted to low-nutrient conditions. Members of Acidobacteriota often dominate in nutrient-limited soils, particularly under neutral to slightly alkaline conditions, where they thrive with reduced organic matter inputs and limited carbon sources, thereby helping to maintain the stability and functionality of microbial communities.
The 10–20 cm and 20–30 cm soil layers showed distinct enrichment patterns. Taxa such as Holophagae and Subgroup_7 were enriched in CK within the 10–20 cm soil layer, while KD4_96 was particularly abundant in the 20–30 cm layer. These taxa are less affected by disturbances near the soil surface and may play specialized roles in nutrient cycling and organic matter degradation in more stable, less disturbed environments. The lower impact of grazing at these depths suggests that microbial communities in the 10–20 cm and 20–30 cm soil layers are more resilient to surface disturbances or that the effects of grazing do not significantly penetrate deeper than the uppermost soil layers.

5. Conclusions

This study demonstrates the significant effects of grazing intensity on soil microbial diversity and community composition across different soil depths in a desert steppe ecosystem. Moderate grazing promotes microbial diversity and enhances soil health through improved nutrient cycling, particularly in the 0–10 cm and 10–20 cm soil layers. In contrast, heavy grazing reduces microbial biomass, degrades soil structure, and negatively impacts nitrogen cycling and organic carbon turnover. Our results show clear stratification of microbial communities with soil depth, indicating that grazing intensity has a more profound effect on surface soils compared to deeper layers. These findings underscore the importance of implementing targeted grazing management strategies to enhance soil resilience and ecosystem sustainability. Future research should further investigate the long-term effects of grazing on microbial community dynamics, particularly in arid and semi-arid steppe regions vulnerable to environmental change.

Author Contributions

Investigation, X.J. and Y.W.; resources, Q.W.; writing—original draft, Y.W.; writing—review and editing, Q.W., X.J. and G.H.; project administration, G.H.; funding acquisition, G.H. All authors have read and agreed to the published version of the manuscript.

Funding

This research was funded by the Inner Mongolia Autonomous Region Forestry and Grassland Bureau’s project Research and Application of Carbon Sequestration Methodology for Grassland Protection and Sustainable Management (2024LKY-TH02).

Data Availability Statement

The original contributions presented in this study are included in the article. Further inquiries can be directed to the corresponding author(s).

Acknowledgments

The authors thank the reviewers and editor for their insightful comments and constructive suggestions.

Conflicts of Interest

The authors declare no conflicts of interest.

References

  1. Zhao, P.P.; Huang, Y.T.; Liu, B.Y.; Chen, J.Y.; Lei, Z.Y.; Zhang, Y.H.; Cheng, B.H.; Zhou, T.; Peng, S.L. Effects of daytime and nighttime warming on soil microbial diversity. Geoderma 2024, 447, 116909. [Google Scholar] [CrossRef]
  2. Islam, W.; Noman, A.; Naveed, H.; Huang, Z.; Chen, H.Y.H. Role of environmental factors in shaping the soil microbiome. Environ. Sci. Pollut. Res. 2020, 27, 41225–41247. [Google Scholar] [CrossRef] [PubMed]
  3. Li, Y.M.; Lin, Q.Y.; Wang, S.P.; Li, X.Z.; Liu, W.T.; Luo, C.Y.; Zhang, Z.H.; Zhu, X.X.; Jiang, L.L.; Li, X.N. Soil bacterial community responses to warming and grazing in a Tibetan alpine meadow. FEMS Microbiol. Ecol. 2016, 92, fiv152. [Google Scholar] [CrossRef] [PubMed]
  4. Chen, Q.; Song, Y.; An, Y.; Lu, Y.; Zhong, G. Soil microorganisms: Their role in enhancing crop nutrition and health. Diversity 2024, 16, 734. [Google Scholar] [CrossRef]
  5. Miller, C. Handbook of Biodiversity Methods. Survey, Evaluation and Monitoring. Austral Ecol. 2007, 32, 956. [Google Scholar] [CrossRef]
  6. Wang, X.; Zhou, C.; Zuo, S.; Ji, Y.; Liu, W.; Huang, D. Heavy grazing reduces soil bacterial diversity by increasing soil pH in a semi-arid steppe. PeerJ 2024, 12, e17031. [Google Scholar] [CrossRef] [PubMed]
  7. Xun, W.; Yan, R.; Ren, Y.; Jin, D.; Xiong, W.; Zhang, G.; Cui, Z.; Xin, X.; Zhang, R. Grazing-induced microbiome alterations drive soil organic carbon turnover and productivity in meadow steppe. Microbiome 2018, 6, 170. [Google Scholar] [CrossRef] [PubMed]
  8. Le Roux, X.; Bardy, M.; Loiseau, P.; Louault, F. Stimulation of soil nitrification and denitrification by grazing in grasslands: Do changes in plant species composition matter? Oecologia 2003, 137, 417–425. [Google Scholar] [CrossRef] [PubMed]
  9. Wang, Z.; Jiang, S.; Struik, P.C.; Wang, H.; Jin, K.; Wu, R.; Na, R.; Mu, H.; Ta, N. Plant and soil responses to grazing intensity drive changes in the soil microbiome in a desert steppe. Plant Soil 2023, 491, 219–237. [Google Scholar] [CrossRef]
  10. Eldridge, D.; Greene, R. Microbiotic soil crusts: A review of their roles in soil and ecological processes in the rangelands of Australia. Aust. J. Soil. Res. 1994, 32, 389–415. [Google Scholar] [CrossRef]
  11. Hernández-Álvarez, C.; García-Oliva, F.; Cruz-Ortega, R.; Romero, M.F.; Barajas, H.R.; Piñero, D.; Alcaraz, L.D. Squash root microbiome transplants and metagenomic inspection for in situ arid adaptations. Sci. Total Environ. 2021, 801, 150136. [Google Scholar] [CrossRef]
  12. Shu, X.; Ye, Q.; Huang, H.; Xia, L.; Tang, H.; Liu, X.; Wu, J.; Li, Y.; Zhang, Y.; Deng, L.; et al. Effects of grazing exclusion on soil microbial diversity and its functionality in grasslands: A meta-analysis. Front. Plant Sci. 2024, 15, 1366821. [Google Scholar] [CrossRef]
  13. Chen, Y.; Zhang, Z.; Zhang, H.; Luo, H.; Li, Z. Characteristics of soil bacterial and fungal communities on interval seawater covering Linchang Island, China. Arch. Microbiol. 2021, 203, 2453–2461. [Google Scholar] [CrossRef] [PubMed]
  14. Duhamel, M.; Peay, K.G. Does Microbial Diversity Confound General Predictions? Trends Plant Sci. 2015, 20, 695–697. [Google Scholar] [CrossRef]
  15. Louisson, Z.; Gutiérrez-Ginés, M.J.; Taylor, M.; Buckley, H.L.; Hermans, S.M.; Lear, G. Soil conditions are a more important determinant of microbial community composition and functional potential than neighboring plant diversity. iScience 2024, 27, 110056. [Google Scholar] [CrossRef]
  16. Kemp, D.R.; Han, G.; Hou, X.; Michalk, D.L.; Hou, F.; Wu, J.; Zhang, Y. Innovative grassland management systems for environmental and livelihood benefits. Proc. Natl. Acad. Sci. USA 2013, 110, 8369–8374. [Google Scholar] [CrossRef]
  17. Wang, Z.W.; Jiao, S.Y.; Han, G.D.; Zhao, M.L.; Havstad, K.M. Effects of stocking rate on the variability of peak standing crop in a desert steppe of Eurasia grassland. Environ. Manag. 2014, 53, 266–273. [Google Scholar] [CrossRef]
  18. Wei, Z.J.; Han, G.D.; Yang, J.; Li, W.J.; Wang, G.L.; Zhou, X.F. The response of Stipa breviflora community to stocking rate. Grassl. China 2000, 6, 1–5. [Google Scholar]
  19. de Vries, F.T.; Brown, C.; Stevens, C.J. Grassland species root response to drought: Consequences for soil carbon and nitrogen availability. Plant Soil 2016, 409, 297–312. [Google Scholar] [CrossRef]
  20. Ehrenfeld, J.G.; Ravit, B.; Elgersma, K. Feedback in the plant-soil system. Annu. Rev. Environ. Resour. 2005, 30, 75–115. [Google Scholar] [CrossRef]
  21. De Deyn, G.B.; Cornelissen, J.H.C.; Bardgett, R.D. Plant functional traits and soil carbon sequestration in contrasting biomes. Ecol. Lett. 2008, 11, 516–531. [Google Scholar] [CrossRef] [PubMed]
  22. Jacoby, R.; Peukert, M.; Succurro, A.; Koprivova, A.; Kopriva, S. The Role of Soil Microorganisms in Plant Mineral Nutrition—Current Knowledge and Future Directions. Front. Plant Sci. 2017, 8, 1617. [Google Scholar] [CrossRef]
  23. Wang, Z.; Zhang, Q.; Staley, C.; Gao, H.; Ishii, S.; Wei, X.; Liu, J.; Cheng, J.; Hao, M.; Sadowsky, M.J. Impact of long-term grazing exclusion on soil microbial community composition and nutrient availability. Biol. Fertil. Soils 2019, 55, 121–134. [Google Scholar] [CrossRef]
  24. Chauhan, P.; Sharma, N.; Tapwal, A.; Kumar, A.; Verma, G.S.; Meena, M.; Seth, C.S.; Swapnil, P. Soil Microbiome: Diversity, Benefits and Interactions with Plants. Sustainability 2023, 15, 14643. [Google Scholar] [CrossRef]
  25. Hartmann, M.; Frey, B.; Mayer, J.; Mäder, P.; Widmer, F. Distinct soil microbial diversity under long-term organic and conventional farming. ISME J. 2015, 9, 1177–1194. [Google Scholar] [CrossRef]
  26. Jiang, M.; Tian, Y.; Guo, R.; Li, S.; Guo, J.; Zhang, T. Effects of warming and nitrogen addition on soil fungal and bacterial community structures in a temperate meadow. Front. Microbiol. 2023, 14, 1231442. [Google Scholar] [CrossRef] [PubMed]
  27. Bulgarelli, D.; Garrido-Oter, R.; Münch, P.C.; Weiman, A.; Dröge, J.; Pan, Y.; McHardy, A.C.; Schulze-Lefert, P. Structure and function of the bacterial root microbiota in wild and domesticated barley. Cell Host Microbe 2015, 17, 3. [Google Scholar] [CrossRef]
  28. Xu, T.; Chen, X.; Hou, Y.; Zhu, B. Changes in microbial biomass, community composition and diversity, and functioning with soil depth in two alpine ecosystems on the Tibetan plateau. Plant Soil 2021, 459, 137–153. [Google Scholar] [CrossRef]
  29. Deng, L.; Shangguan, Z.; Bell, S.M.; Soromotin, A.V.; Peng, C.; An, S.; Wu, X.; Xu, X.; Wang, K.; Li, J.; et al. Carbon in Chinese grasslands: Meta-analysis and theory of grazing effects. Carbon Res. 2023, 2, 19. [Google Scholar] [CrossRef]
  30. Kim, H.M.; Lee, M.J.; Jung, J.Y.; Hwang, C.Y.; Kim, M.; Ro, H.M.; Chun, J.; Lee, Y.K. Vertical distribution of bacterial community is associated with the degree of soil organic matter decomposition in the active layer of moist acidic tundra. J. Microbiol. 2016, 54, 713–723. [Google Scholar] [CrossRef] [PubMed]
  31. Pan, J.; Yang, F.; Yang, W.; Zhang, M.; He, S.; Li, Z. Fertilizers and Manures Enhance the Bioavailability of Soil Phosphorus Fractions in Karst Grassland. Agronomy 2024, 14, 1429. [Google Scholar] [CrossRef]
  32. Sun, Q.; Jia, R.; Qin, J.; Wang, Y.; Lu, X.; Yang, P.; Bai, Y. Grassland management regimes regulate soil phosphorus fractions and conversion between phosphorus pools in semiarid steppe ecosystems. Biogeochemistry 2023, 163, 33–48. [Google Scholar] [CrossRef]
  33. Fang, M.; Lu, G.; Zhang, S.; Liang, W. Overgrazing on Unmanaged Grassland Interfered with the Restoration of Adjacent Grazing-Banned Grassland by Affecting Soil Properties and Microbial Community. Front. Microbiol. 2024, 14, 1327056. [Google Scholar] [CrossRef] [PubMed]
  34. Zhang, Y.; Yang, Y.; Li, X.; Wang, Y.; Zhang, Y.; Zhang, Z. Grazing Regulates Changes in Soil Microbial Communities in Plant-Soil Systems. Agronomy 2023, 13, 708. [Google Scholar] [CrossRef]
  35. Yang, Y.; Zhang, Y.; Li, X.; Wang, Y.; Zhang, Z.; Yang, W. Effects of Grazing Intensity on Diversity and Composition of Rhizosphere and Non-Rhizosphere Microbial Communities in a Desert Grassland. Ecol. Evol. 2023, 13, e10300. [Google Scholar] [CrossRef]
  36. He, N.P.; Zhao, L.; Liu, L.; Cheng, J.; Song, J.; Li, J.; Hu, S.; Zhou, H. Grazing Intensity Impacts Soil Carbon and Nitrogen Storage of Continental Steppe. Ecosphere 2011, 2, art8. [Google Scholar] [CrossRef]
  37. Jiao, F.; Shi, X.R.; Han, F.P.; Yuan, Z.Y. Increasing Aridity, Temperature, and Soil pH Induce Soil C-N-P Imbalance in Grasslands. Sci. Rep. 2016, 6, 19601. [Google Scholar] [CrossRef] [PubMed]
  38. Li, Y.; Jiang, L.; Yuan, H.; Li, E.; Yang, X. The Impact of Artificial Afforestation on the Soil Microbial Community and Function in Desertified Areas of NW China. Forests 2024, 15, 1140. [Google Scholar] [CrossRef]
  39. Li, J.; Benti, G.; Wang, D.; Yang, Z.; Xiao, R. Effect of Alteration in Precipitation Amount on Soil Microbial Community in a Semi-Arid Grassland. Front. Microbiol. 2022, 13, 842446. [Google Scholar] [CrossRef]
  40. Tardy, V.; Spor, A.; Mathieu, O.; Lévèque, J.; Terrat, S.; Plassart, P.; Regnier, T.; Bardgett, R.D.; van Der Putten, W.H.; Roggero, P.P.; et al. Shifts in Microbial Diversity through Land Use Intensity as Drivers of Carbon Mineralization in Soil. Soil Biol. Biochem. 2015, 90, 204–213. [Google Scholar] [CrossRef]
  41. Fan, J.; Jin, H.; Zhang, C.; Zheng, J.; Zhang, J.; Han, G. Grazing Intensity Induced Alternations of Soil Microbial Community Composition in Aggregates Drive Soil Organic Carbon Turnover in a Desert Steppe. Agric. Ecosyst. Environ. 2021, 313, 107387. [Google Scholar] [CrossRef]
  42. Olivera, N.L.; Prieto, L.; Bertiller, M.B.; Ferrero, M.A. Sheep Grazing and Soil Bacterial Diversity in Shrublands of the Patagonian Monte, Argentina. J. Arid Environ. 2016, 125, 16–20. [Google Scholar] [CrossRef]
  43. Tapia-Torres, Y.; López-Lozano, N.E.; Souza, V.; García-Oliva, F. Vegetation-Soil System Controls Soil Mechanisms for Nitrogen Transformations in an Oligotrophic Mexican Desert. J. Arid Environ. 2015, 114, 62–69. [Google Scholar] [CrossRef]
Figure 1. Vegetation conditions under four grazing intensity treatments in the experimental grassland site. The treatments include no grazing (CK), light grazing (LG), moderate grazing (MG), and heavy grazing (HG), established in 2004 and sampled in August 2023. The photographs illustrate the typical vegetation structure for each grazing intensity. The lower panel shows the schematic arrangement of treatments within three replicated blocks (Block 1, Block 2, and Block 3), demonstrating the complete randomized block design. Each block contains all four treatments (e.g., CK1, LG1, MG1, HG1), ensuring a balanced and systematic comparison across grazing intensities.
Agronomy 15 00124 g001
Figure 2. Venn diagrams showing the distribution of prokaryotic microorganisms under different grazing intensities in three soil depth layers. Soil samples were collected in August 2023 from the experimental grassland site in Inner Mongolia Academy of Agricultural Sciences long-term grazing platform. The four treatments include CK (no grazing), LG (low grazing), MG (moderate grazing), and HG (high grazing). Each circle corresponds to one treatment, with colors indicating different grazing intensities. Overlapping areas represent microbial taxa shared among multiple treatments. Panels show the following: (A) the 0–10 cm soil layer, (B) the 10–20 cm soil layer, and (C) the 20–30 cm soil layer.
Agronomy 15 00124 g002
Figure 3. Alpha diversity (mean ± SD) of soil microbial communities under different grazing intensities at multiple soil depths. Soil samples were collected in August 2023 from the experimental grassland site in Inner Mongolia Academy of Agricultural Sciences long-term grazing platform. CK (no grazing), LG (low grazing), MG (moderate grazing), and HG (high grazing) treatments are shown at four soil depth ranges: 0–30 cm (aggregated), 0–10 cm, 10–20 cm, and 20–30 cm. (A) shows the Shannon index; (B) shows the Chao1 richness estimator. Different letters above bars indicate significant differences among treatments within the same depth range based on post hoc tests (p < 0.05). Error bars represent standard deviations.
Agronomy 15 00124 g003
Figure 4. Non-metric multidimensional scaling (NMDS) ordination plots illustrating the composition of soil prokaryotic communities at different soil depths and grazing intensities in a desert steppe ecosystem. Soil samples were collected in August 2023 from the experimental site in Inner Mongolia Academy of Agricultural Sciences long-term grazing platform. (A) shows the combined microbial communities from all treatments at three soil depths: I10 (integrated community at 0–10 cm), I20 (integrated community at 10–20 cm), and I30 (integrated community at 20–30 cm). (BD) show communities at 0–10 cm, 10–20 cm, and 20–30 cm depths, respectively, separated by grazing intensity treatments: CK (no grazing), LG (low grazing), MG (moderate grazing), and HG (high grazing). Different symbols and colors correspond to different treatments.
Agronomy 15 00124 g004
Figure 5. Relative abundance of dominant bacterial phyla across different grazing intensities and soil depths in the experimental grassland site (Inner Mongolia Academy of Agricultural Sciences long-term grazing platform, August 2023). Grazing treatments include CK (no grazing), LG (low grazing), MG (moderate grazing), and HG (high grazing). Soil depths are indicated by numbers following the treatment codes (CK10 = CK at 0–10 cm depth, LG20 = LG at 10–20 cm depth, etc.). Each color in the stacked bars represents a different bacterial phylum, and the height of each colored segment within a bar indicates that phylum’s relative abundance.
Agronomy 15 00124 g005
Figure 6. Phylogenetic and indicator taxa analysis of soil bacterial communities under different grazing intensities and soil depths in an Inner Mongolia Academy of Agricultural Sciences long-term grazing platform (samples collected in August 2023). (A) LEfSe-derived cladogram illustrating bacterial lineages from the domain level (center) to the genus level (outermost rings). Each node (circle) represents a taxon, and node size is proportional to its relative abundance. Colors highlight taxa significantly enriched under different grazing intensities: CK (no grazing), LG (low grazing), MG (moderate grazing), and HG (heavy grazing). Soil depth treatments are indicated by appended numbers (e.g., CK10 = CK at 0–10 cm soil depth). (B) LDA (linear discriminant analysis) score (log10) bar plot showing bacterial taxa with LDA scores ≥ 2, indicating their importance as indicators under specific grazing intensity–depth combinations. The length of each bar reflects the magnitude of enrichment of that taxon in the corresponding treatment and depth.
Agronomy 15 00124 g006
Table 1. Density and relative abundance within five functional groups under different grazing treatments. The table summarizes the density (individuals/m²) and relative abundance (%) of five functional groups: perennial bunch grasses, perennial rhizome grasses, perennial forbs, shrubs and semi-shrubs, and annual and biennial plants. Data were collected under four grazing treatments (CK: no grazing; LG: light grazing; MG: moderate grazing; HG: heavy grazing) at the Inner Mongolia Academy of Agricultural Sciences long-term grazing platform. Values represent the mean ± standard error for the density and relative abundance of each functional group, based on three replicates per treatment, with 10 quadrats per replicate. Note: values followed by different lowercase letters in a row indicate significant differences (p < 0.05) between treatments.
Functional GroupsCKLGMGHG
Density (Individuals/m²)Relative Abundance (%)Density (Individuals/m²)Relative Abundance (%)Density (Individuals/m²)Relative Abundance (%)Density (Individuals/m²)Relative Abundance (%)
Perennial bunch grasses106.4 ± 8.59 a17%146.4 ± 11.01 ab22%169.6 ± 11.95 b24%238.0 ± 20.8 c37%
Perennial forbs44.8 ± 19.848%15.9 ± 5.4719%13.7 ± 3.8918%25.3 ± 3.8715%
Perennial rhizome grasses15.9 ± 9.06 a33%2.00 ± 1.87 a17%16.5 ± 13.7 a46%1.07 ± 0.77 a4%
Shrubs and semi-shrubs18.7 ± 4.07 a45%3.60 ± 1.12 b25%2.13 ± 0.71 b13%1.87 ± 0.68 b18%
Annual and biennials12.6 ± 3.28 a49%2.80 ± 1.22 b18%1.33 ± 0.62 b15%0.66 ± 0.33 b17%
Table 2. Soil properties and vegetation characteristics under different grazing intensities (mean ± SD), collected in August 2023 from the experimental site in Inner Mongolia Academy of Agricultural Sciences long-term grazing platform. Soil samples represent mean values from three depths (0–10 cm, 10–20 cm, and 20–30 cm), and vegetation data were collected from the corresponding plots under each grazing intensity treatment.
Soil PropertiesVegetation Characteristics
FactorsSM
(%)
SBD
(g/cm3)
pHSOC
(g/kg)
TN
(g/kg)
TP
(g/kg)
AP
(mg/kg)
BGB
(g/m2)
Coverage
(%)
CK2.68 ± 0.10 ab91.5 ± 3.20 a7.73 ± 0.20 a15.9 ± 0.20 a1.43 ± 0.10 ab0.27 ± 0.01 a0.49 ± 0.010 b665.7 ± 41.1 a17.3 ± 0.30 a
LG2.94 ± 0.10 a94.3 ± 0.60 a8.23 ± 0.20 a17.0 ± 0.20 a1.55 ± 0.10 a0.27 ± 0.01 a0.51 ± 0.003 a511.2 ± 30.1 b14.6 ± 0.40 b
MG2.77 ± 0.20 a96.0 ± 1.00 a8.20 ± 0.20 a14.4 ± 0.50 b1.31 ± 0.10 ab0.26 ± 0.01 ab0.48 ± 0.003 b403.8 ± 19.6 c9.57 ± 0.60 c
HG2.25 ± 0.40 b96.4 ± 2.10 a8.06 ± 0.10 a14.3 ± 0.50 b1.18 ± 0.10 b0.23 ± 0.01 b0.46 ± 0.003 c279.6 ± 24.2 d8.73 ± 0.60 c
Note: values followed by different lowercase letters in a row indicate significant differences (p < 0.05) between treatments; SM, soil moisture; SBD, soil bulk density; SOC, soil organic carbon; TN, total nitrogen; TP, total phosphorus; AP, soil available phosphorus; and BGB, belowground biomass.
Disclaimer/Publisher’s Note: The statements, opinions and data contained in all publications are solely those of the individual author(s) and contributor(s) and not of MDPI and/or the editor(s). MDPI and/or the editor(s) disclaim responsibility for any injury to people or property resulting from any ideas, methods, instructions or products referred to in the content.

