Article

Light Intensity Affects Growth and Nutrient Value of Hydroponic Barley Fodder

1
College of Grassland Science, Xinjiang Agricultural University, Urumqi 830052, China
2
Institute of Soil, Fertilizer and Agricultural Water Saving, Xinjiang Academy of Agricultural Sciences, Urumqi 830091, China
*
Author to whom correspondence should be addressed.
Agronomy 2024, 14(6), 1099; https://doi.org/10.3390/agronomy14061099
Submission received: 23 April 2024 / Revised: 16 May 2024 / Accepted: 17 May 2024 / Published: 22 May 2024

Abstract

:
Light intensity significantly influences plant growth in hydroponic green fodder systems, yet research exploring the growth dynamics and nutrient accumulation in hydroponically grown barley under various light conditions has been limited. This study investigated the impact of different light intensities—0, 100, 200, and 300 μmol/m2/s—on the nutritional composition and quality of hydroponic barley fodder. Assessments were made on biomass production, physiological responses including photosynthetic parameters, and nutritional components such as essential amino acids five days post-treatment. The findings indicated that increasing light intensity boosted photosynthetic activity, expanded leaf area, enhanced root length, and promoted biomass accumulation. However, the highest intensity tested, 300 μmol/m2/s, led to significant chlorophyll degradation, increased water loss, and induced oxidative stress, adversely affecting fodder quality and reducing essential amino acids. In contrast, an intensity of 200 μmol/m2/s was identified as optimal for promoting robust barley growth through principal component analysis. This optimal setting supported vigorous growth and ensured the production of nutrient-rich, high-quality fodder, providing a basis for scaling up production efficiently. This research offers crucial insights into optimizing light conditions to maximize both the yield and nutritional quality of hydroponically grown barley fodder, presenting a significant step forward in enhancing hydroponic farming practices.

1. Introduction

The productivity of animal husbandry may face challenges due to the progressive decline in grassland areas and the degradation of pastures [1,2]. Additionally, during the cold season, securing a supply of high-quality forage presents significant challenges, underscoring the critical need to address the scarcity of forage [3]. Hydroponic green fodder production plays a crucial role in animal nutrition, particularly during seasonal periods when natural feed resources are scarce [4]. Hydroponic green fodder production also offers the advantage of producing high-quality green feed within an average of 5–8 days, ensuring rapid access to nutritious fodder [5].
Barley (Hordeum vulgare L.), a vital fodder crop, is characterized by its rapid growth with high protein levels, a rich amino acid profile, and an abundance of minerals, vitamins, and metabolic enzymes, while its tender stems and leaves provide a fragrant aroma, exceptional palatability, and easy digestion [6]. During the cold season, when traditional animal feed sources are scarce, hydroponically grown fodder barley provides a reliable, rapid, and nutrient-dense feeding alternative that sustains livestock nutrition without the limitations of conventional agriculture [4]. Hence, advances and enhancements in hydroponically sprouted barley technology are critical for maintaining the continuous production of green fodder and high-quality forage [7].
The nutritional composition of plant feed varies with environmental conditions, where light functions as the energy source for photosynthesis in plants and significantly influences both plant morphogenesis and nutrient accumulation [8]. Therefore, the effective management or controlled application of light presents a viable method to increase the accumulation of health-promoting compounds in sprouts [8]. The advent and utilization of LED lighting have revolutionized artificial cultivation conditions, allowing for the customization of light spectral quality, intensity, and photoperiodism [9,10]. However, the influence of LED lighting on plant growth and quality characteristics differs according to the plant species and the conditions under which they are cultivated [11]. Consequently, determining optimal lighting formulas is essential for achieving efficient hydroponic fodder production [11]. Light intensity is a critical factor for optimal plant growth, with the level of light intensity playing a crucial role in determining photosynthetic efficiency, cellular development, and metabolic processes essential for plant health and productivity [12,13,14]. For instance, it has been shown that reduced light intensity adversely affects agronomic traits such as stem and leaf development, as well as the dry and fresh weight of plants [14,15,16]. Insufficient levels of light intensity result in a significant decrease in vitamin C, a reduction in soluble sugars like sucrose and fructose in leaves, and an impaired production of major biomolecules such as amino acids and phytohormones essential for plant growth [13,17,18]. Furthermore, inappropriate levels of light intensity can elevate the levels of reactive oxygen species, including hydrogen peroxide, thereby disrupting the photosynthetic metabolism of plants [19]. Optimal levels of light intensity, on the other hand, enhance the development of plant growth and positively influence the regulation of plant photosynthesis, the dynamics of nutrient absorption and distribution, and the overall quality of the plant [20].
The cultivation of hydroponic barley differs from traditional hydroponic systems, such as the deep flow technique, where plant roots are obscured from light exposure [21]. Contrary to traditional methods, hydroponic barley cultivation leverages a shallow liquid film technique that facilitates the spreading of roots across the tray, intertwining to form a dense grass mat, with roots, stems, and leaves concurrently exposed to light throughout the process. When harvesting hydroponic barley, the grass blanket created by the intertwined root system is directly rolled up, with the roots themselves serving as a crucial component of the forage. Nonetheless, there has been no research on the dynamics of root growth and nutrient accumulation under varied lighting conditions, underscoring the importance of studying how different light intensities affect the nutritional composition of barley fodder. Hence, the aim of this research was to investigate the effects of light intensity on the growth and nutritional quality of hydroponic barley fodder, providing technical references for its development and utilization. The findings of this research will assist in identifying and implementing optimal light conditions to establish a high-quality fodder production system and facilitate the mass production of nutrient-rich hydroponic barley.

2. Materials and Methods

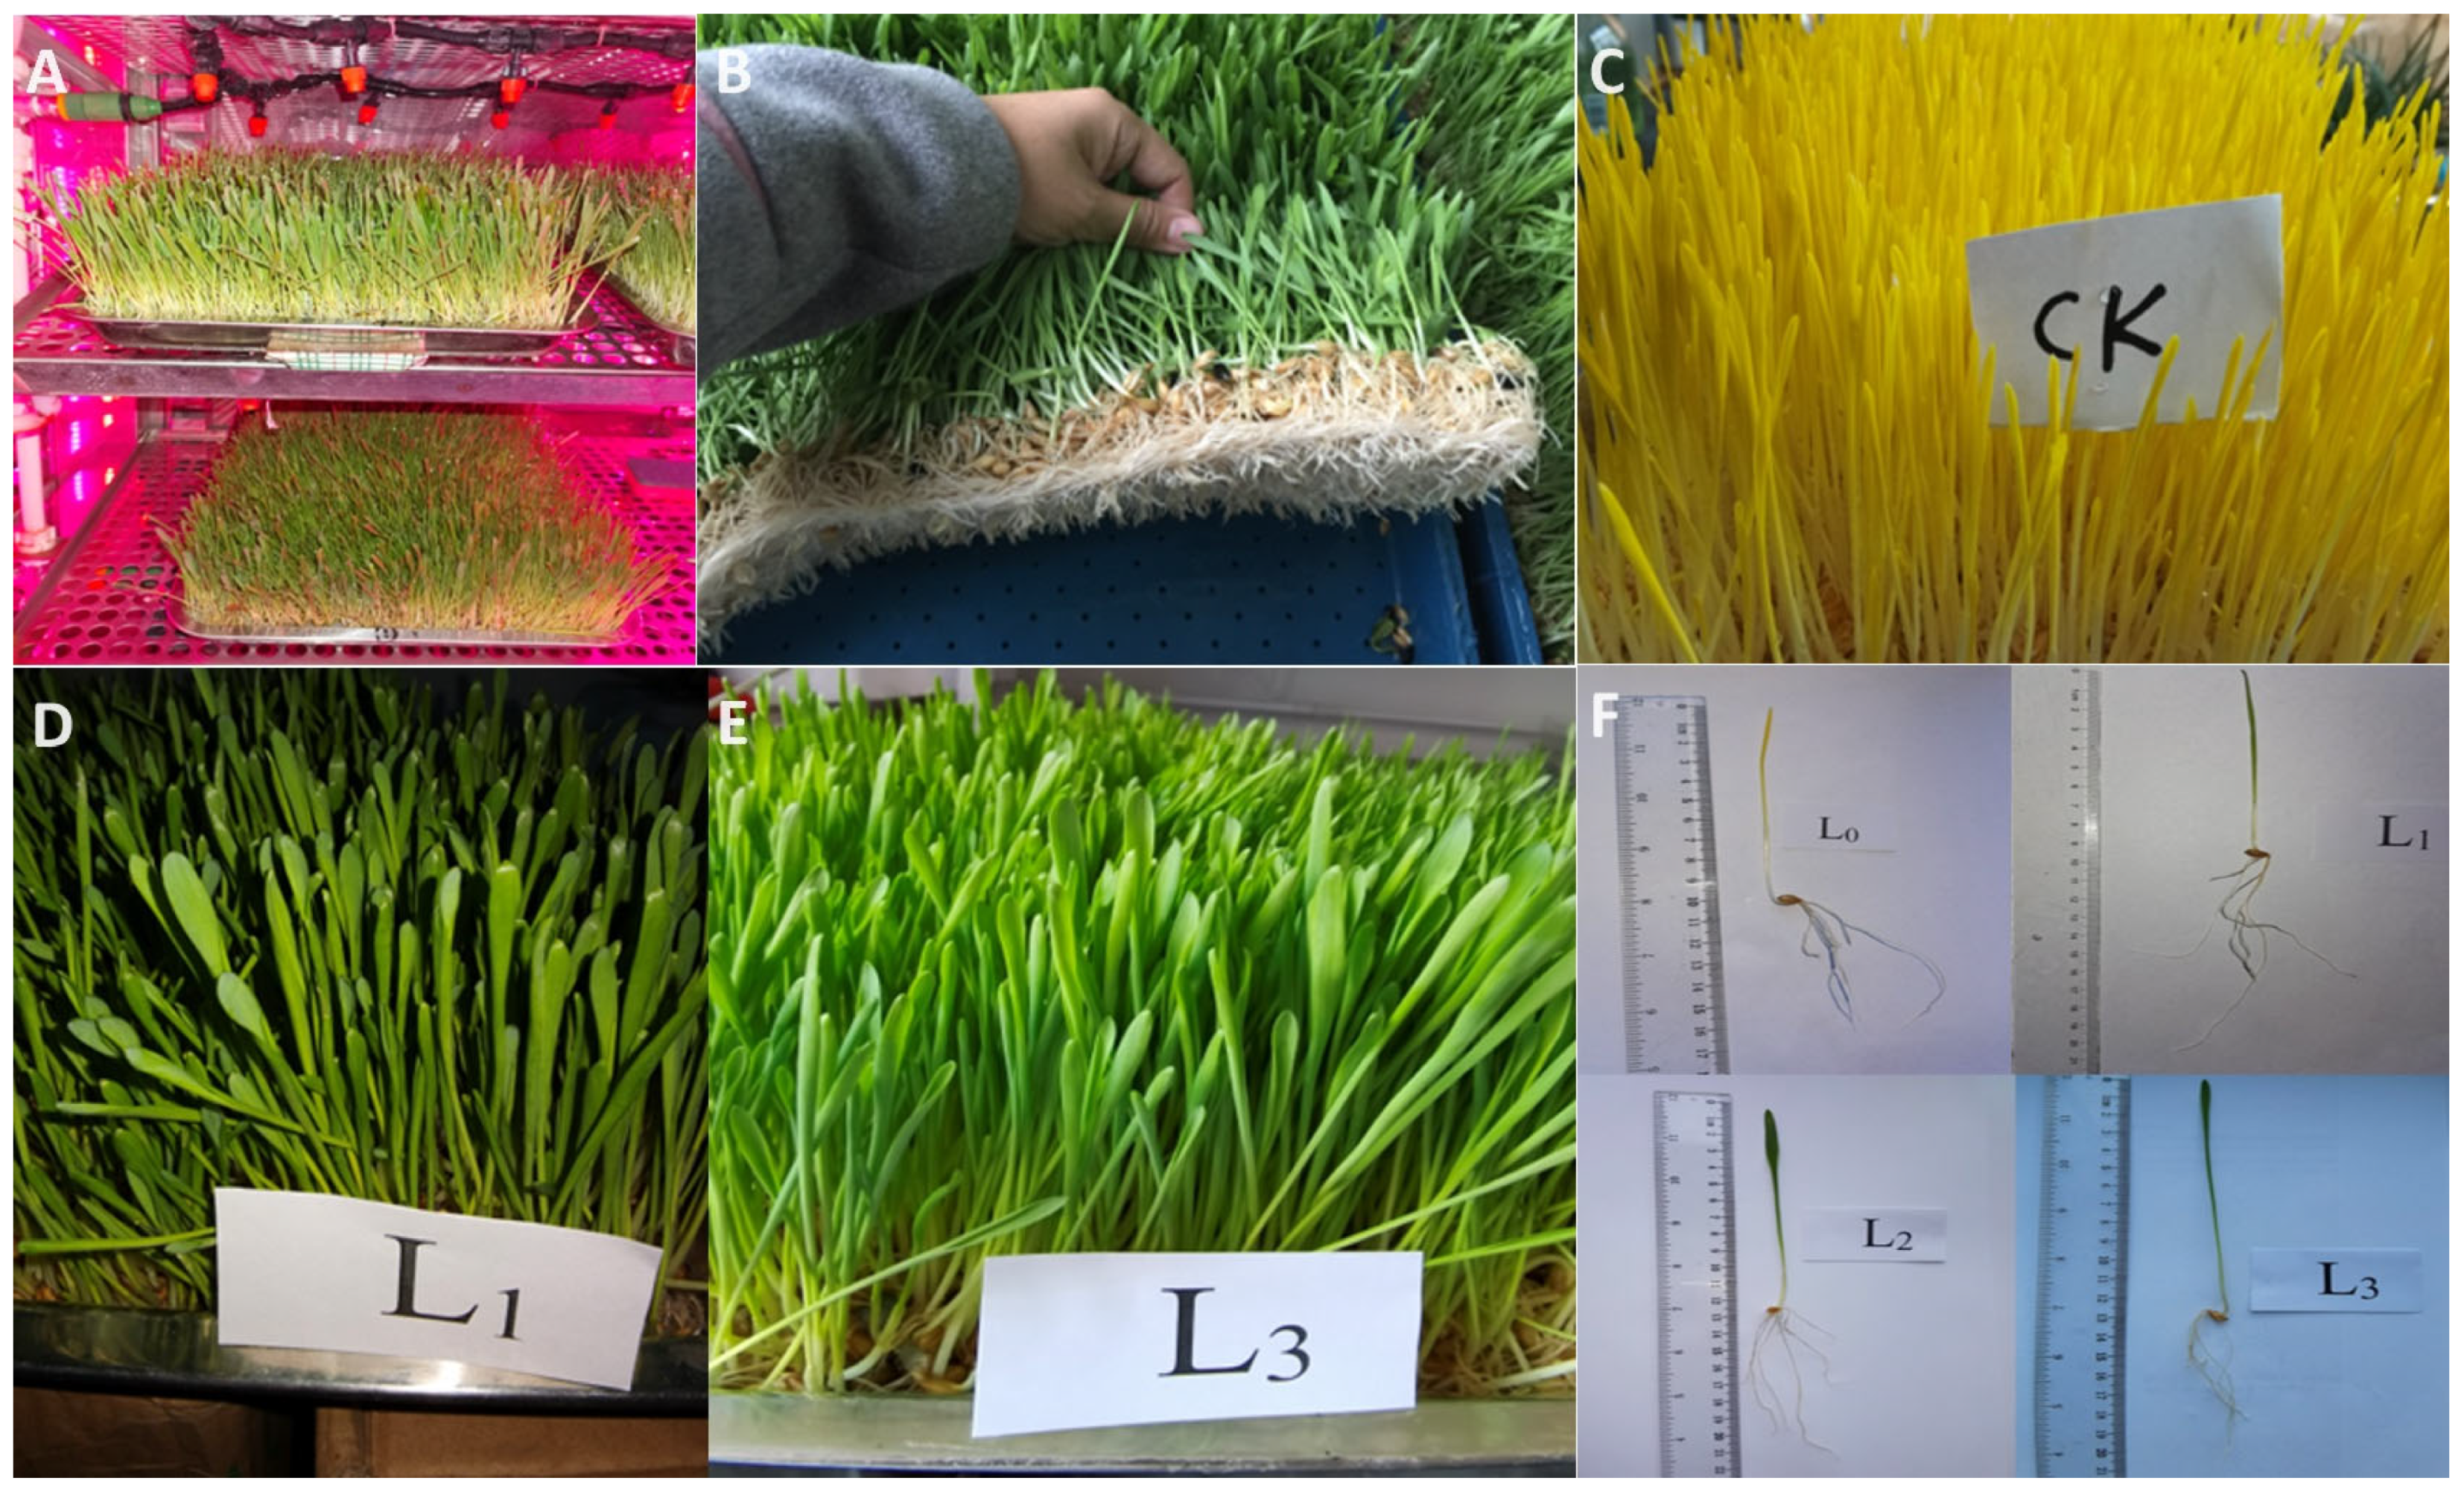
2.1. The Design of the Controllable Environmental Cultivation System with Different Light Conditions

The experiment utilized a fully controllable environmental cultivation system (Figure 1), which was designed according to previous research on hydroponic fodder barley production [22]. Briefly, during the cultivation period, the LED lighting maintained a light quality ratio of red to blue light (R/B) at 4:1. Temperature settings were consistently held at 25 °C during light periods and 22 °C during dark periods, accompanied by a relative humidity of 75 ± 10% and a CO2 concentration of 450 ± 50 μmol/mol. Irrigation through sprinklers was scheduled for 15 s every four hours, with the photoperiod consisting of 10 h/6 h light/dark cycles. Previous research has shown that water without added nutrients can support the hydroponic growth of fodder for a period of seven days [23]. The experimental design included four treatments with varied light intensities at 0 μmol/m2/s (L0, control treatment), 100 μmol/m2/s (L1), 200 μmol/m2/s (L2), and 300 μmol/m2/s (L3). Light intensity levels were recorded using an LI-1500 irradiance meter (LI-COR, Lincoln, NE, USA), positioned 5 cm above the hydroponic trays. The experiment was conducted in three replicates and concluded on the fifth day.

2.2. The Seed Germination

Barley seeds (cv. Ganpi No. 8), weighing 2.5 kg/m2, were thoroughly cleaned and placed in basins, where they were soaked for 6–8 h in warm water (40–45 °C). Post-soaking, the seeds were transferred to plastic buckets and covered with a damp cloth, with water sprayed every 8 h to maintain moisture. The seeds were kept at a room temperature of 20–28 °C and shielded from light to promote germination until white sprouts appeared after 24 h. At 48 h after germination, germinated seeds were evenly distributed in individual trays, each measuring 1420 cm2 (43 cm × 33 cm) and containing approximately 0.35 kg of germinated seeds. The trays were maintained within a fully controllable environmental incubator described above.

2.3. Measurement of Biomass and Nutritional Quality

On the fifth day of light cultivation (seven days after seed germination), hydroponic barley fodder was harvested to evaluate its biomass and nutritional quality. The assessment was made on the fifth day because previous research has suggested that the levels of antioxidant enzymes are at the highest up to seven days after germination [24]. Growth morphology was assessed by randomly selecting 45 barley plants from each treatment to measure seedling height and root length with a ruler. The selected barley plants were then precisely cut at the root/stem junction, and the leaf area was quantified using a leaf area meter (CID, CI-202, Camas, WA, USA). Subsequently, the fresh weight of the stems, leaves, and roots of each sample was measured using an electronic scale. The samples were then oven-dried at 80 °C until a constant weight was achieved, and the dry weights of the stem, leaf, and root components were individually assessed to calculate the biomass of plants over a period of five days.
A 10 cm × 10 cm sample in each tray was used to evaluate the nutritional quality of plant tissues. The analyses of ether extract (EE), crude ash (CA), crude fiber (CF), crude protein (CP), neutral detergent fiber (NDF), and acidic detergent fiber (ADF) were performed in accordance with standardized methodologies outlined in GB/T 6433-2006 [25], GB/T 6434-2006 [26], and GB/T 20806-2006 [27], respectively. Additionally, the quantification of 17 amino acids was carried out following the method outlined in the national standard method GB/T 18246-2019 [28]. However, the acid hydrolysis process used in the experiment led to the degradation of tryptophan, rendering it undetectable. The amino acids assessed included seven essential amino acids (EAAs)—threonine, valine, lysine, isoleucine, leucine, phenylalanine, and methionine—and ten non-essential amino acids (NEAAs)—aspartic acid, serine, glutamic acid, glycine, alanine, cysteine, tyrosine, histidine, arginine, and proline. All assays were conducted in triplicate to measure the nutritional compositions in the stems, leaves, and roots of the fodder barley.
The contents of delicate amino acids (DAAs), sweet amino acids (SAAs), aromatic amino acids (AAAs), and pharmacodynamic amino acids (PAAs) were determined using the classification method described previously [29]. Delicate amino acids comprise glutamic acid, aspartic acid, glycine, arginine, and alanine. Sweet amino acids consist of threonine, serine, glycine, alanine, histidine, and proline. Aromatic amino acids are represented by tyrosine and phenylalanine. Pharmacodynamic amino acids include cystine, isoleucine, leucine, tyrosine, phenylalanine, lysine, and arginine. The content of each category was calculated as the sum of its constituent amino acids.
The activity of antioxidant enzymes, superoxide dismutase (SOD) and peroxidase (POD), and the contents of vitamins C and E were measured using commercial kits (Suzhou Grace Bio Technology Ltd., Co., Suzhou, China) and following the instructions outlined by the manufacturer.

2.4. Photosynthetic Characteristics

The photosynthetic characteristics of barley leaves were assessed using a portable photosynthesizer (CIRAS-3, PP System, Amesbury, MA, USA). For each treatment, three samples were analyzed. The measurements recorded included the net photosynthetic rate (A), intercellular CO2 concentration (Ci), stomatal conductance (Gs), transpiration rate (E), and water use efficiency (WUE). For the chlorophyll SPAD analysis, ten leaves per treatment were selected. The chlorophyll SPAD readings were consistently taken at the same part of the leaves (i.e., 1 cm from the leaf tip), using a chlorophyll meter (SPAD-502 Plus, Konica Minolta, Tokyo, Japan).

2.5. Statistical Analysis

All experiments were performed in a completely randomized design with three replicates. The assumptions of analysis of variance (ANOVA), homogeneity of variance, and normality were assessed using Levene’s and Shapiro–Wilk tests, respectively. IBM SPSS Statistics 20 (IBM Corporation, Armonk, NY, USA) was used to perform one-way ANOVA, and the means were compared using Duncan’s new multiple range test at 5% probability. OriginPro 2022 (OriginLab, Northampton, MA, USA) was used to generate figures and perform principal component analyses (PCA).

3. Results

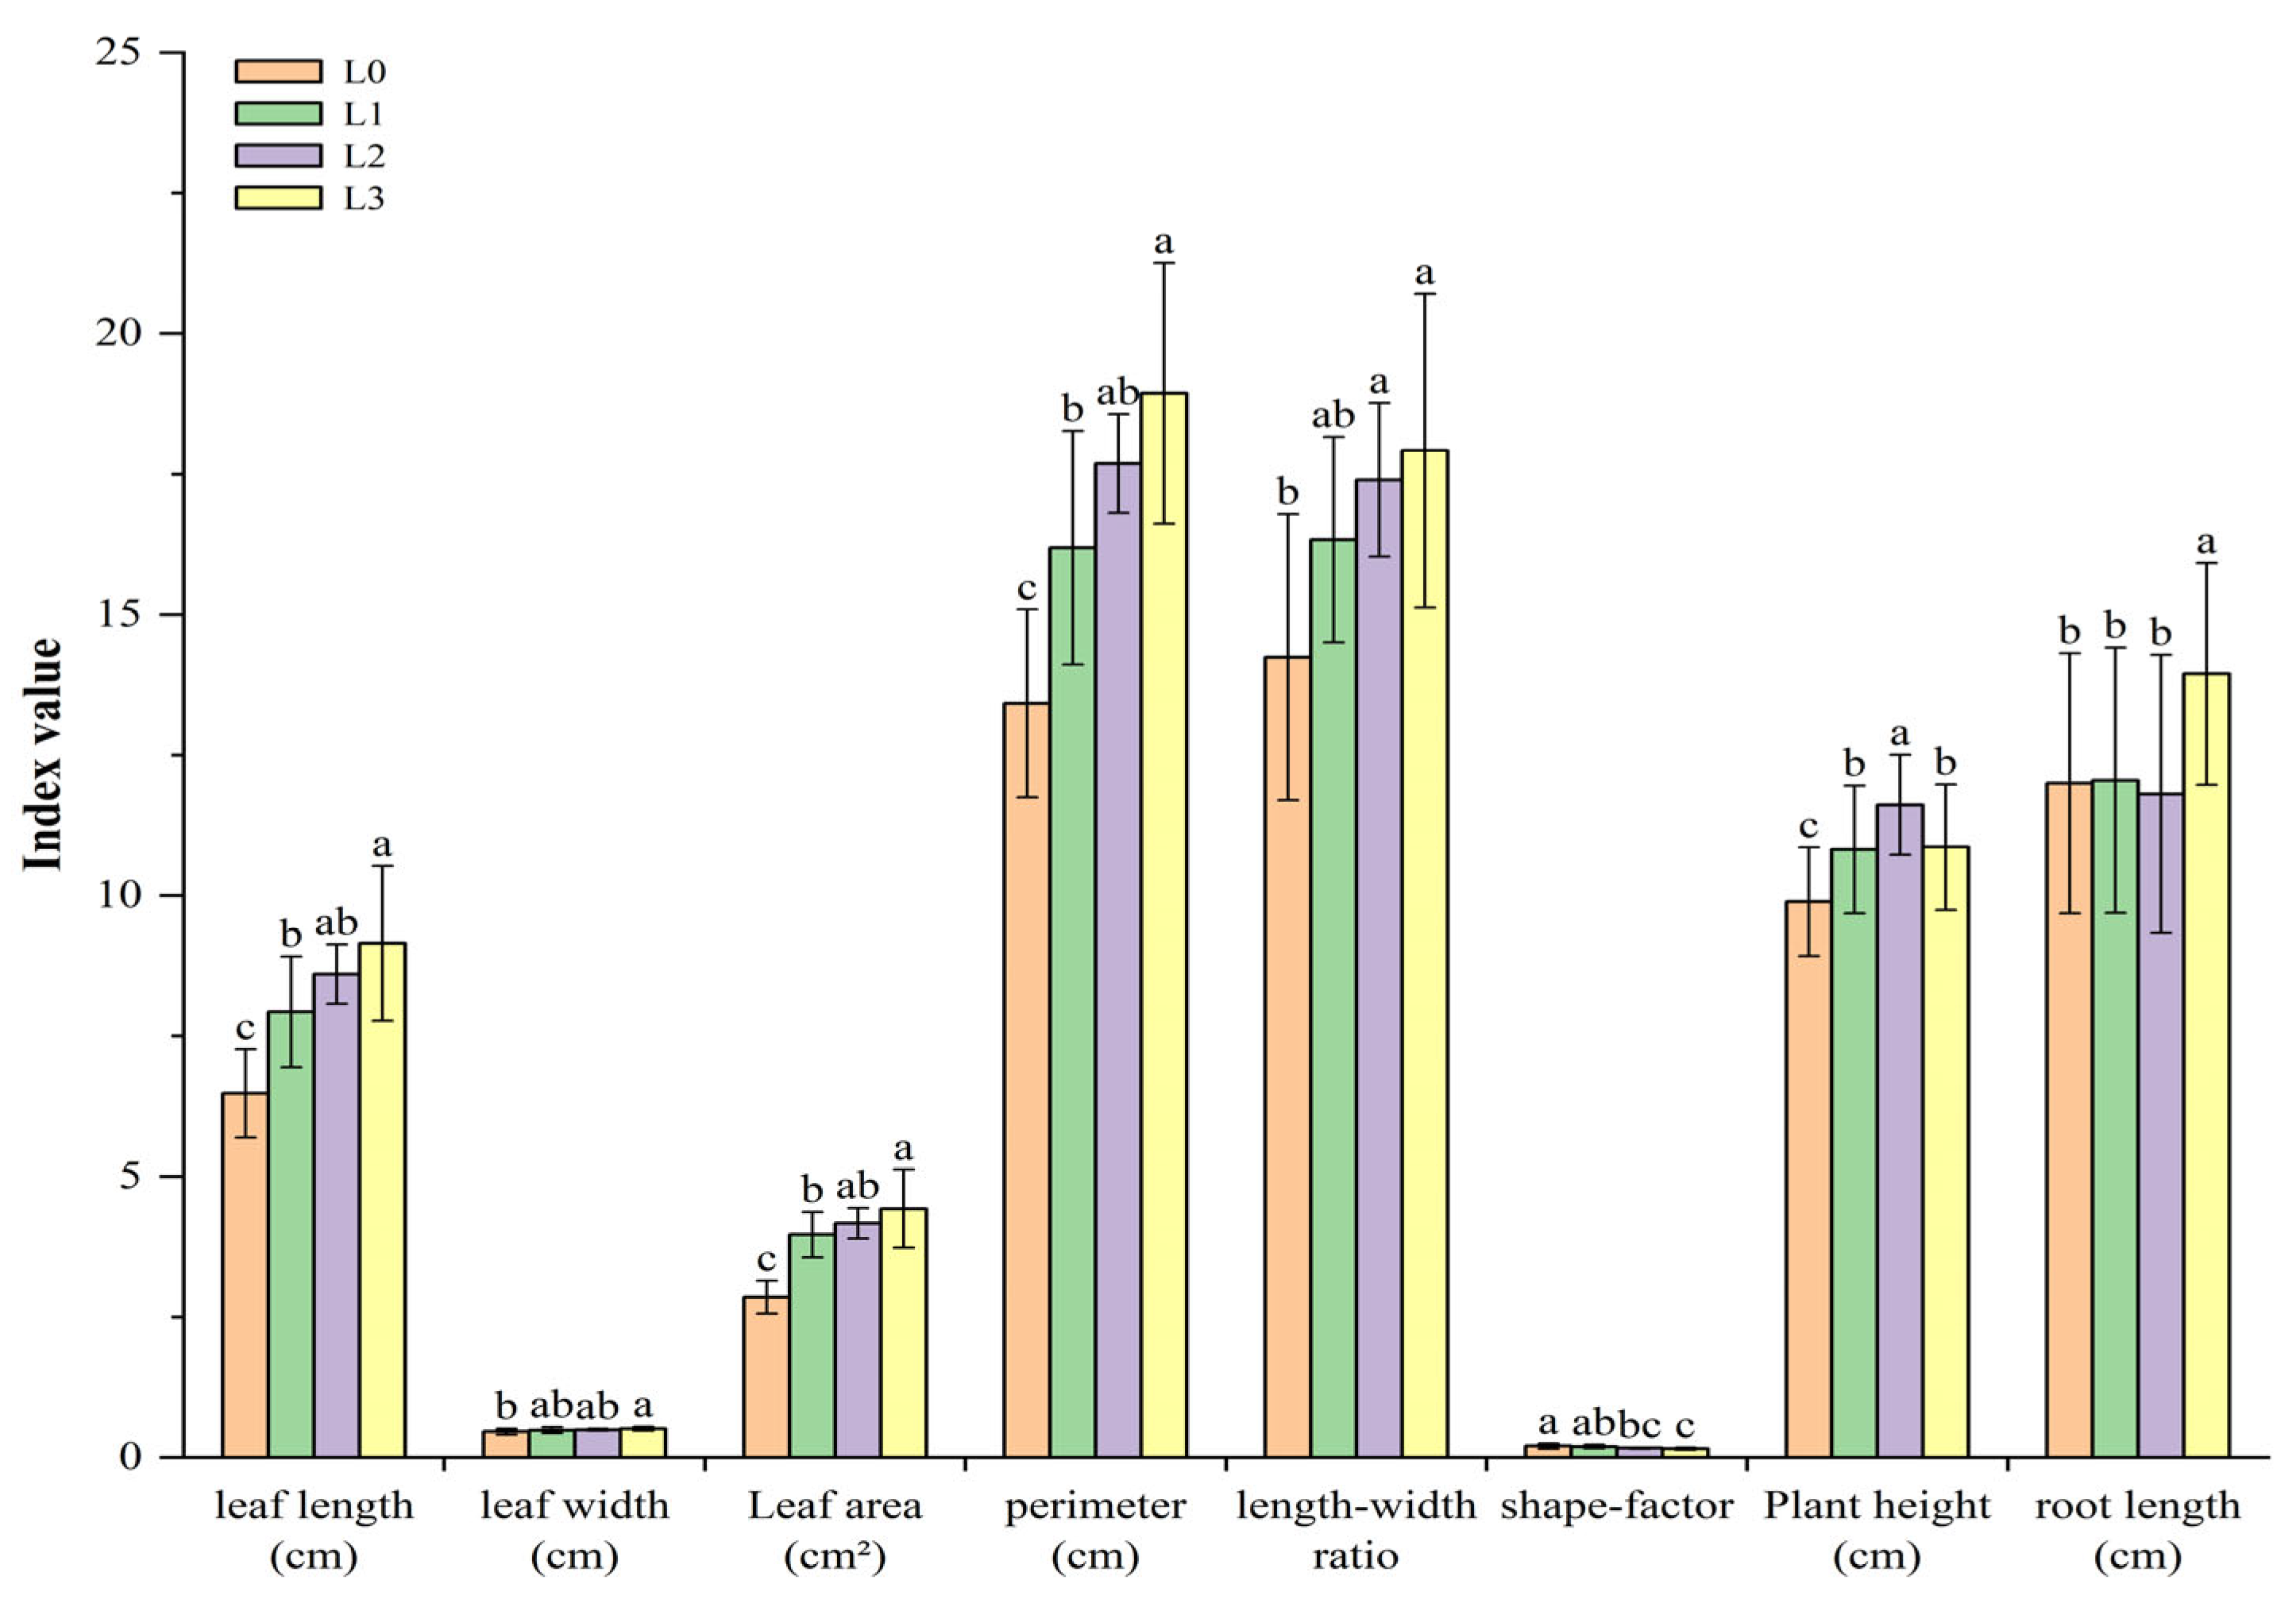
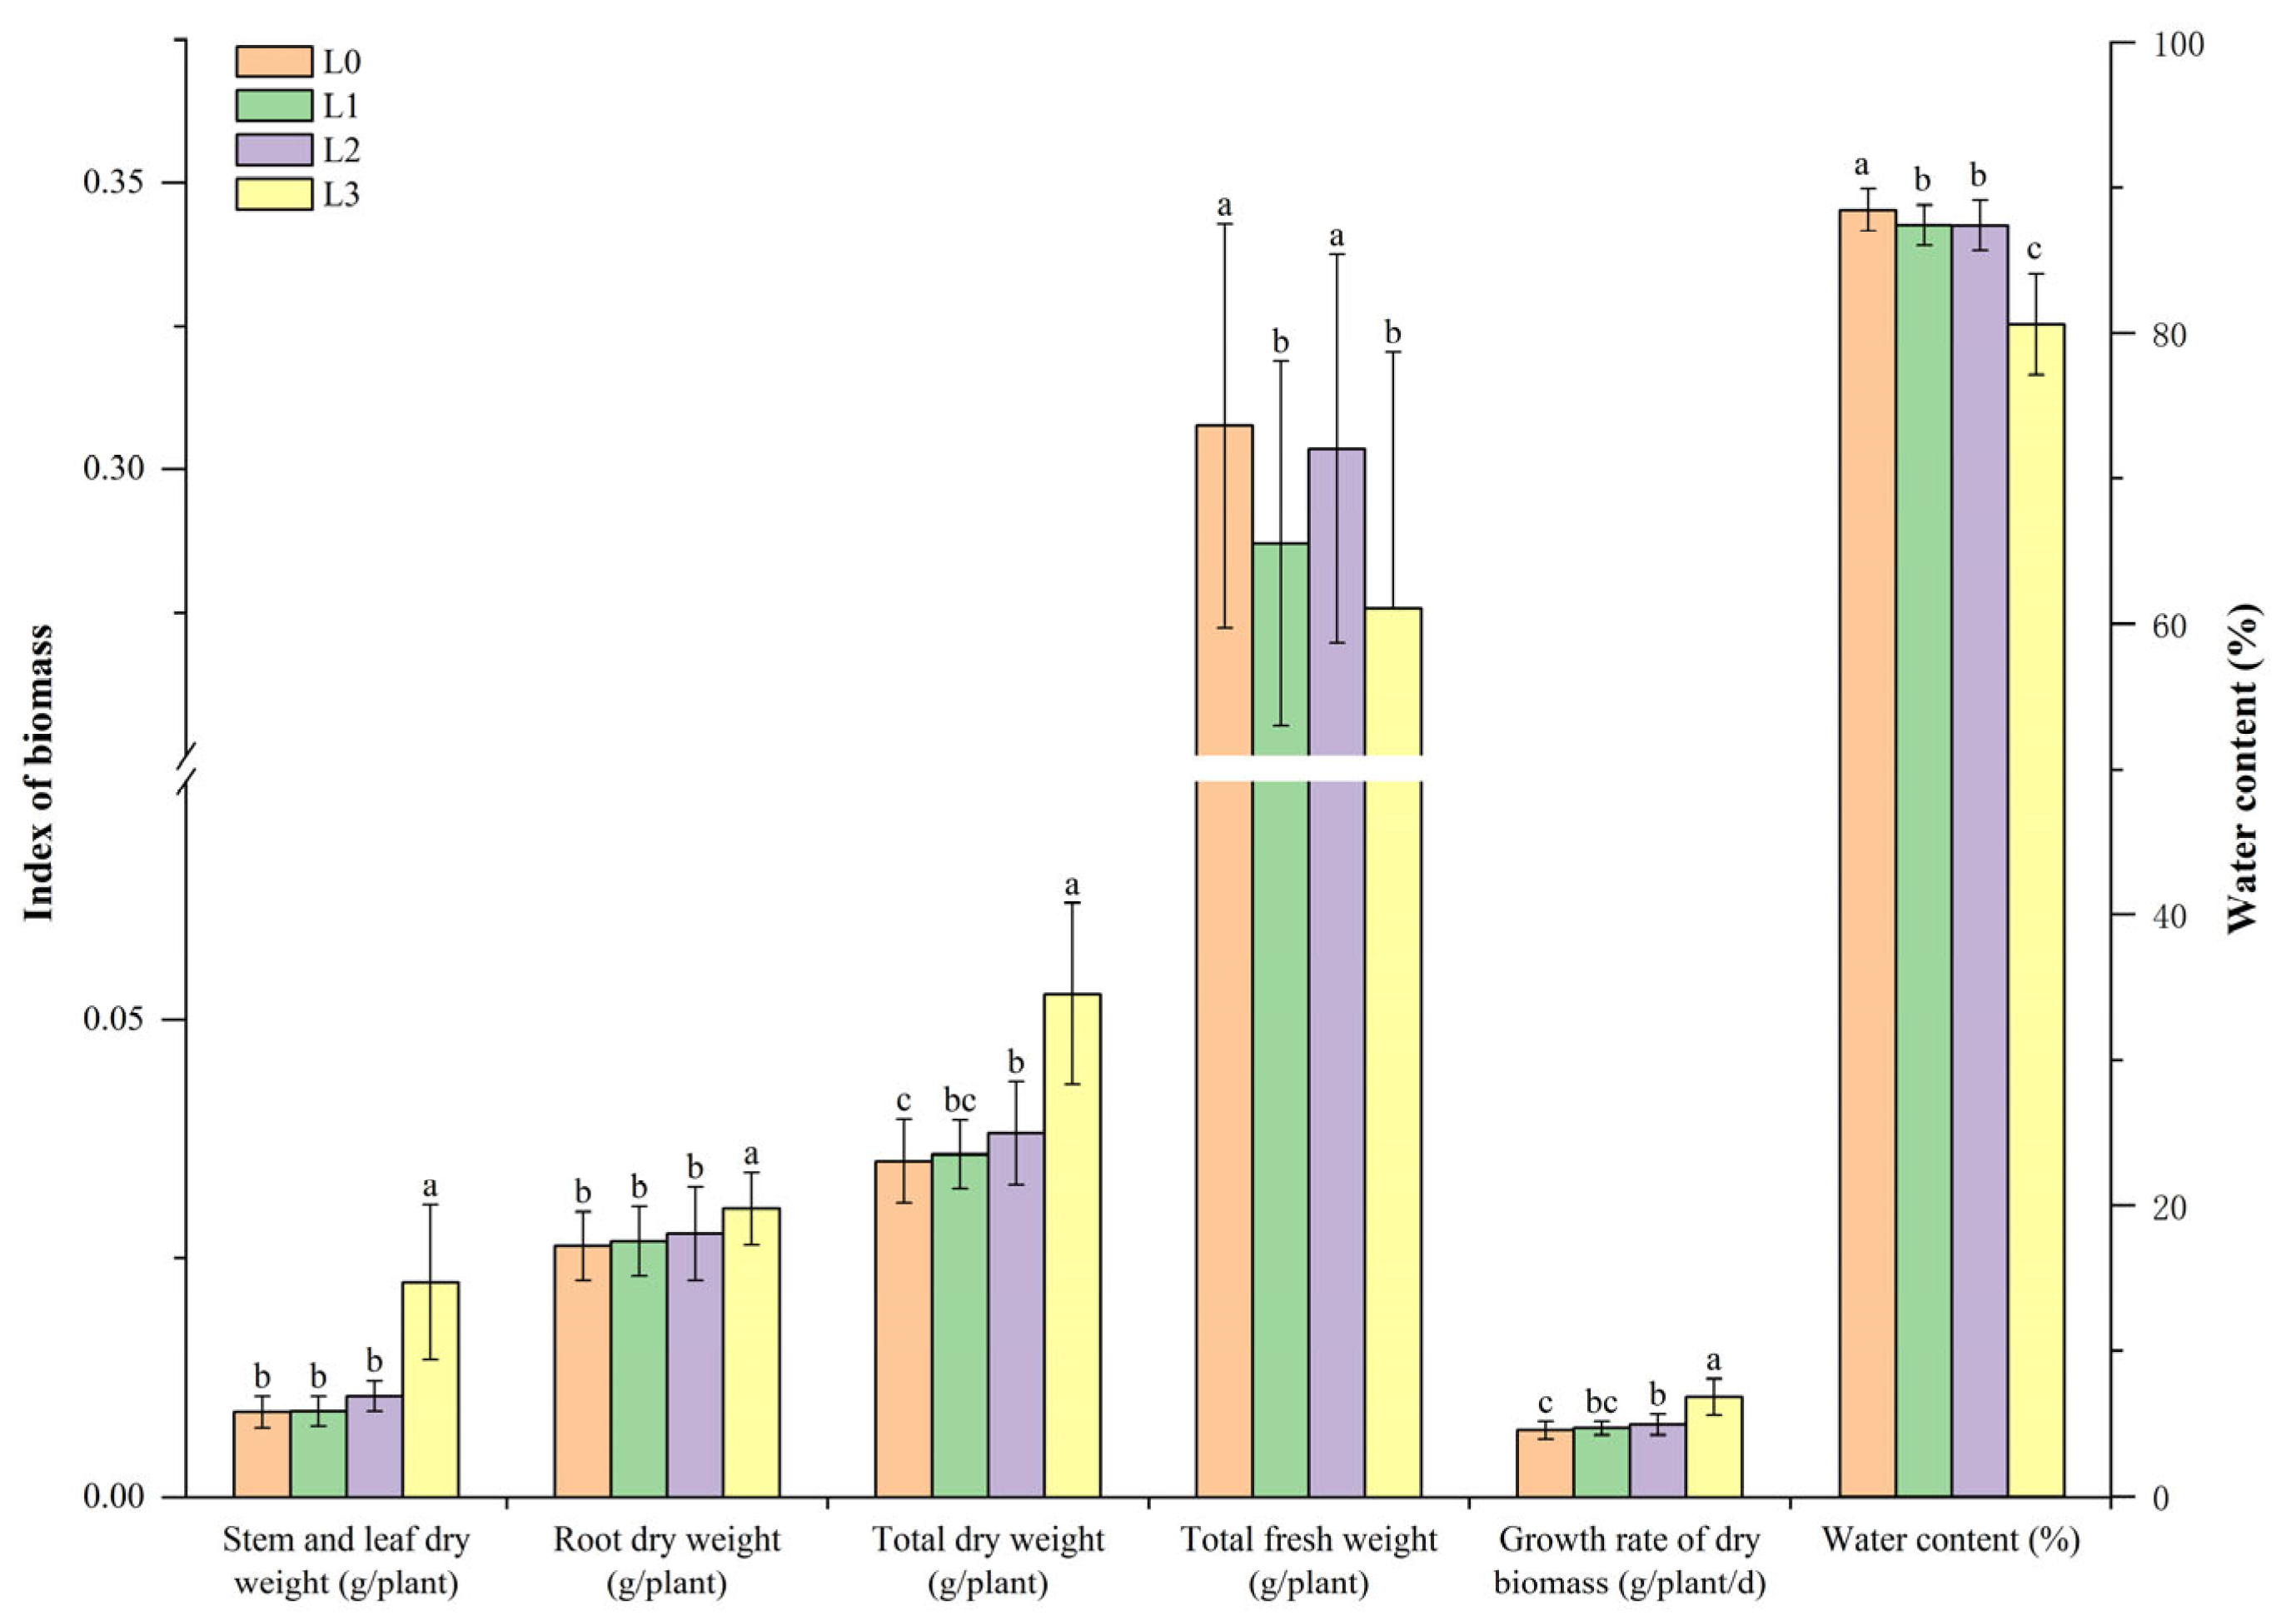
3.1. The Effects of Different Light Intensities on the Growth of Hydroponic Barley Fodder

The impact of varying light intensities on the growth of hydroponic barley fodder was observed (Figure 2). The results showed that as light intensity increased, leaf length, width, leaf area, and perimeter gradually increased, with L2 and L3 treatments showing a significantly larger leaf area compared to the L1 and L0 treatments. These results imply that light intensities of 200 and 300 μmol/m2/s effectively promoted leaf growth in the treated plants. In the L3 treatment, the length/width ratio was the highest, significantly differing from the L0 treatment but not from L1 and L2, while the shape factor was the lowest in all light treatments, indicating that the leaves were comparatively narrow and elongated in seedlings grown under the light. The L2 treatment resulted in the tallest plants, significantly exceeding the growth of other treatments and achieving a height 17.5% greater than the control. The root length in the L3 treatment was the longest, measuring 16.3% greater than the control. There was no significant difference in root length between the L1 and L2 treatments and the control. These findings demonstrate that increasing light intensity corresponds to an increase in leaf area, with root growth further promoted when light intensity reaches 300 μmol/m2/s.
According to the results, under high-light intensity conditions of 300 μmol/m2/s (L3), different parts of hydroponic barley plants exhibited rapid increases in their dry biomasses (Figure 3), suggesting that the highest light intensity tested here enhanced the accumulation of biomass in plants more effectively compared to other treatments. Nevertheless, the plants in the L3 treatment exhibited the lowest fresh weight compared to the other treatments, presumably as a result of the promotion of water loss by high light intensity as indicated by the water content parameter. According to the results, with increasing light intensity, the water content in the L3 treatment notably decreased, dropping by 8.9% compared to the control. Significant differences were observed in the dry weight of stems and leaves between treatment L3 and the other treatments. In addition, the dry weight of roots exhibited a notable increase in treatment L3. The total dry weight and biomass growth rate peaked in the L3 treatment, surpassing those of the control by 49.7% and 50.0%, respectively. These results indicate that the L3 treatment outperformed other treatments in the growth rate of dry biomass, emphasizing its effectiveness in enhancing rapid biomass accumulation as indicated by the growth rate of the dry biomass parameter.

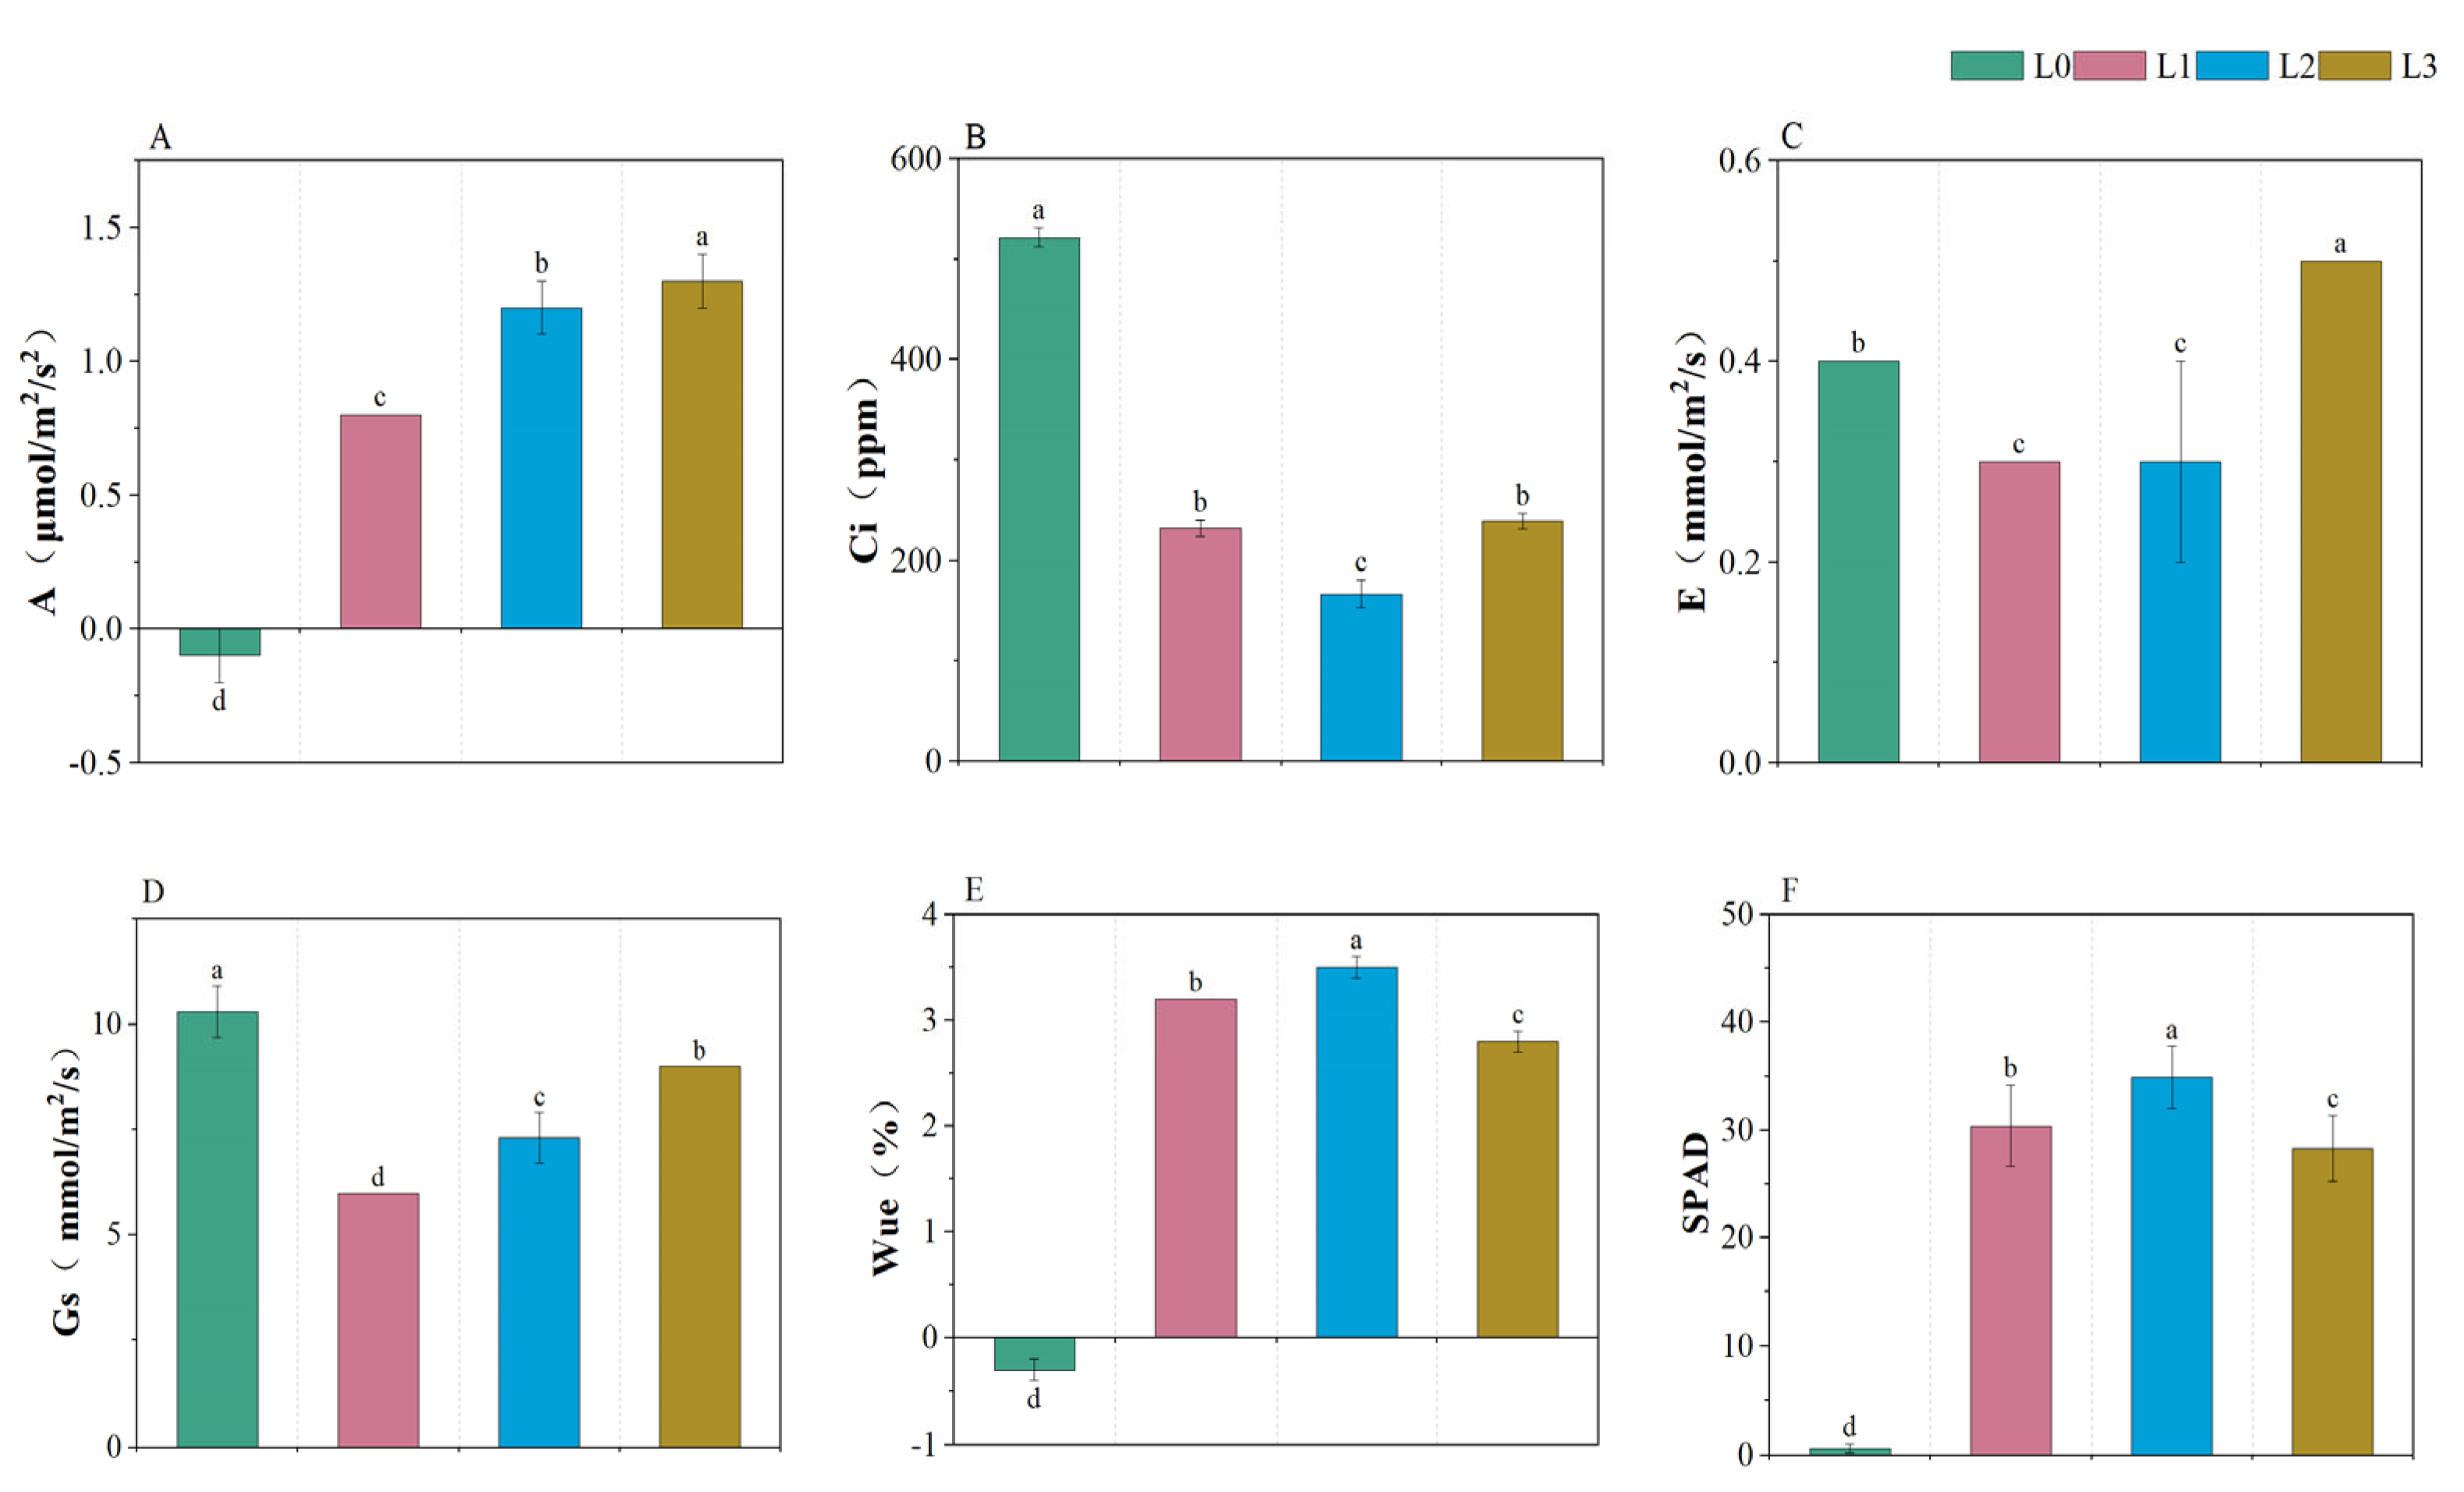
3.2. Comparison of Photosynthetic Parameters in Leaves of Hydroponic Barley Fodder under Different Light Intensities

The photosynthetic parameters of each treatment exhibited variation across different light intensities (Figure 4). In the presence of light, the photosynthetic rate of barley leaves increased gradually from 0.8 μmol/m2/s to 1.33 μmol/m2/s with rising light intensity (Figure 4A). Compared to the control, the photosynthetic rate increased by 715.0% in the low-light intensity treatment L1 and by 1123% in the high-light intensity treatment L3, with significant differences among the treatments. The intercellular CO2 concentration varied significantly among treatments as a result of varying levels of light intensities (Figure 4B). In darkness, the leaves exhibited the highest intercellular CO2 concentration, reaching 521.6 ppm. Among the light treatments, the lowest intercellular CO2 concentration was recorded for the L2 treatment, measuring 28.2% to 30.2% less than that observed under the L1 and L3 treatments, respectively.
The L3 treatment exhibited the highest transpiration rate at 0.5 mmol/m2/s, significantly surpassing other treatments (Figure 4C). In the absence of light (L0), barley leaf transpiration was 0.4 mmol/m2/s, ranking the second highest. Transpiration rates showed no significant difference between the L1 and L2 treatments, but they were significantly lower than the L3 and L0 treatments. In the L0 treatment, the stomatal conductance of barley leaves peaked at 10.33 mmol/m2/s, markedly surpassing that of the light treatments. Nonetheless, as light intensity increased, barley leaf stomatal conductance rose gradually, but it consistently remained 12.9% to 41.9% lower in the light treatments compared to the L0 treatment, with notable differences recorded among all light treatments (Figure 4D). The L2 treatment exhibited the highest water use efficiency, significantly surpassing that of other treatments, whereas L0 showed a markedly lower water use efficiency compared to other treatments (Figure 4E). Taken together, these findings suggest that when light intensity reached 300 μmol/m2/s, the photosynthetic and transpiration rates of barley leaves increased, alongside an increase in stomatal conductance, while leaf water use efficiency decreased. Under low- or no-light conditions, the photosynthetic rate of barley leaves was lower, with inconsistent changes observed in intercellular CO2 concentration, transpiration rate, and stomatal conductance, implying that variations in the photosynthetic rate result from the combined effects of various parameters.
In the L2 treatment, the SPAD value for chlorophyll content peaked at 34.9, followed by L1 and L3 treatments at 30.4 and 28.3, respectively. The lowest SPAD value was recorded in the L0 treatment at 0.6, with leaves appearing yellow (Figure 4F). These findings suggest that under our experimental conditions, light intensity affects the chlorophyll content of barley leaves. A SPAD value of over 30 can be achieved with appropriate light intensity, but it decreases under very high or very low light intensities.

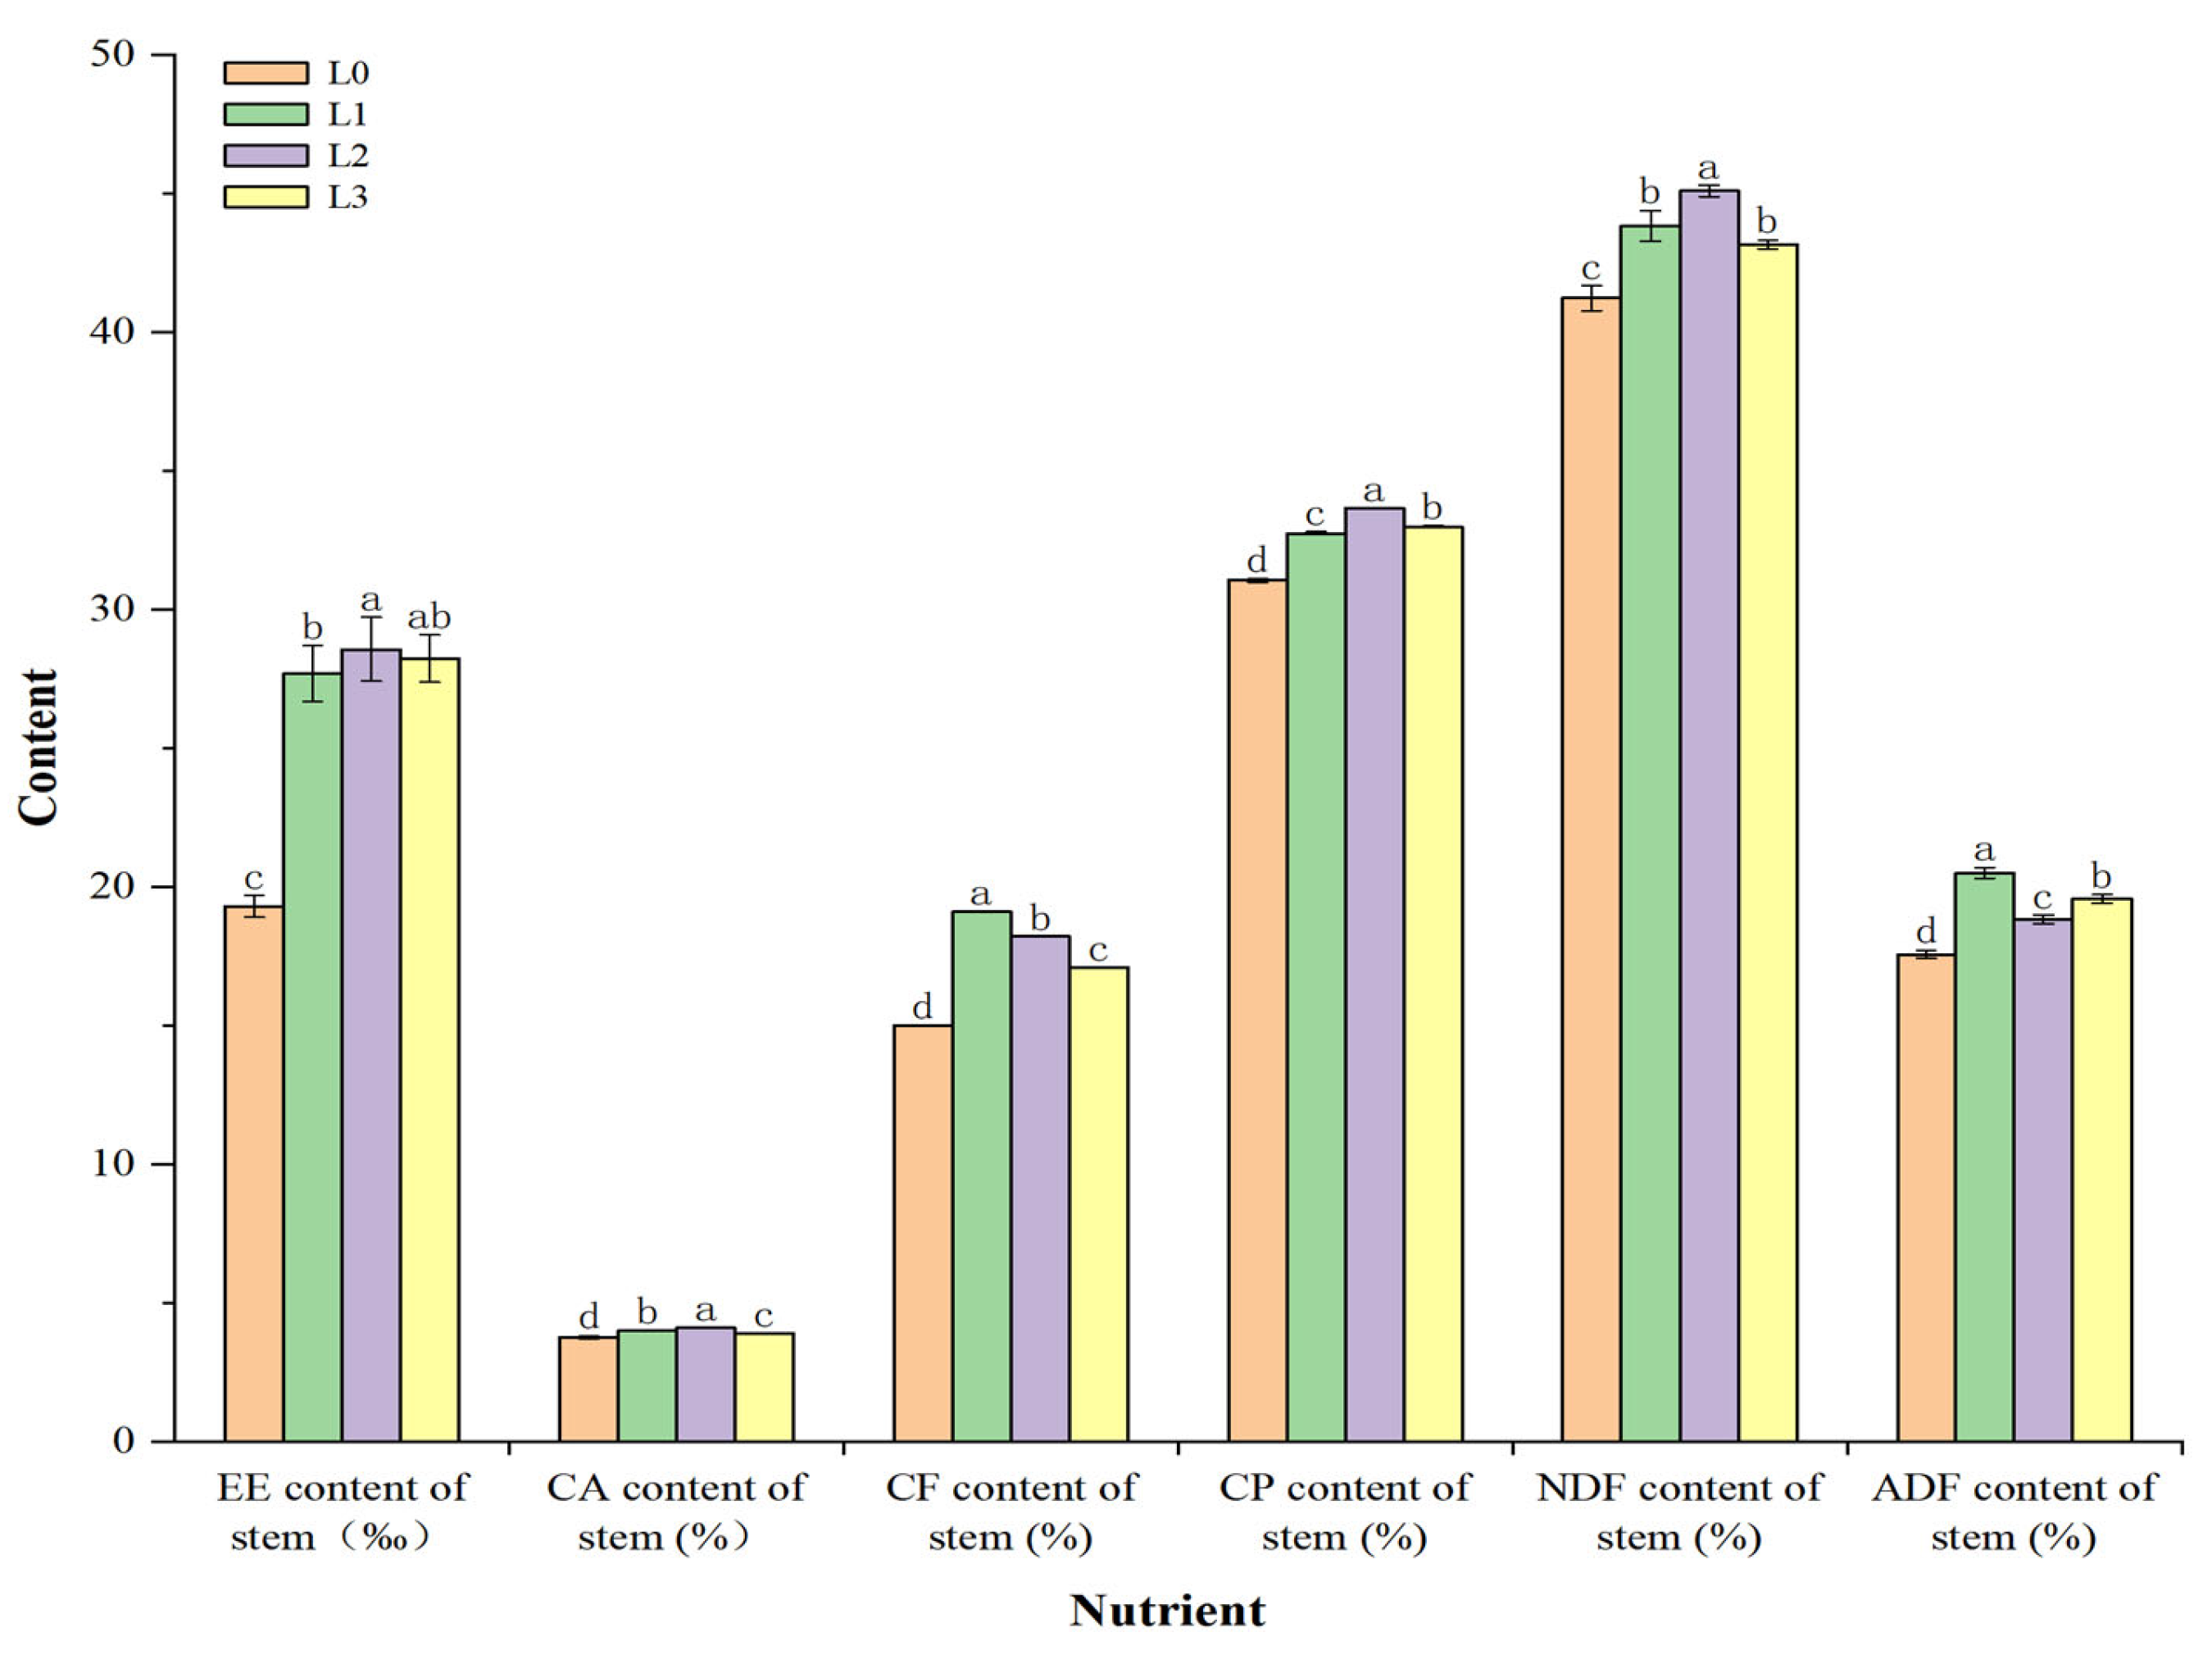
3.3. Feeding Quality of Stems and Leaves of Hydroponic Barley Fodder under Different Light Intensities

To investigate the impact of varying light intensities on the nutritional quality of hydroponic barley fodder, we assessed several key nutritional parameters in the stems and leaves (Figure 5). Our findings indicated that the content of EE, CA, CF, and CP in the barley increased significantly by 43.5–48.0%, 3.7–9.0%, 14–27.3%, and 5.4–8.37%, respectively, across treatments L1, L2, and L3 when compared to the control group. Notably, the L2 treatment demonstrated markedly higher levels of EE, CA, and CP relative to the other light treatments. In terms of fiber components, which are indicative of feed intake and digestibility by herbivorous livestock, the NDF content was significantly elevated in the L2 treatment. In contrast, the ADF content was substantially reduced in the L2 treatment to 18.8%, which was significantly lower (by approximately 3.7–8.2%) than the levels observed in the L1 and L3 treatments. The findings underscore the advantageous effect of light on nutrient synthesis within the stems and leaves of hydroponic barley. Specifically, exposure to a light intensity of 200 µmol/m2·s maximizes the accumulation of EE, CA, and CP in the barley’s stems and leaves. Additionally, at this level of light intensity, a higher content of digestible fiber was recorded.

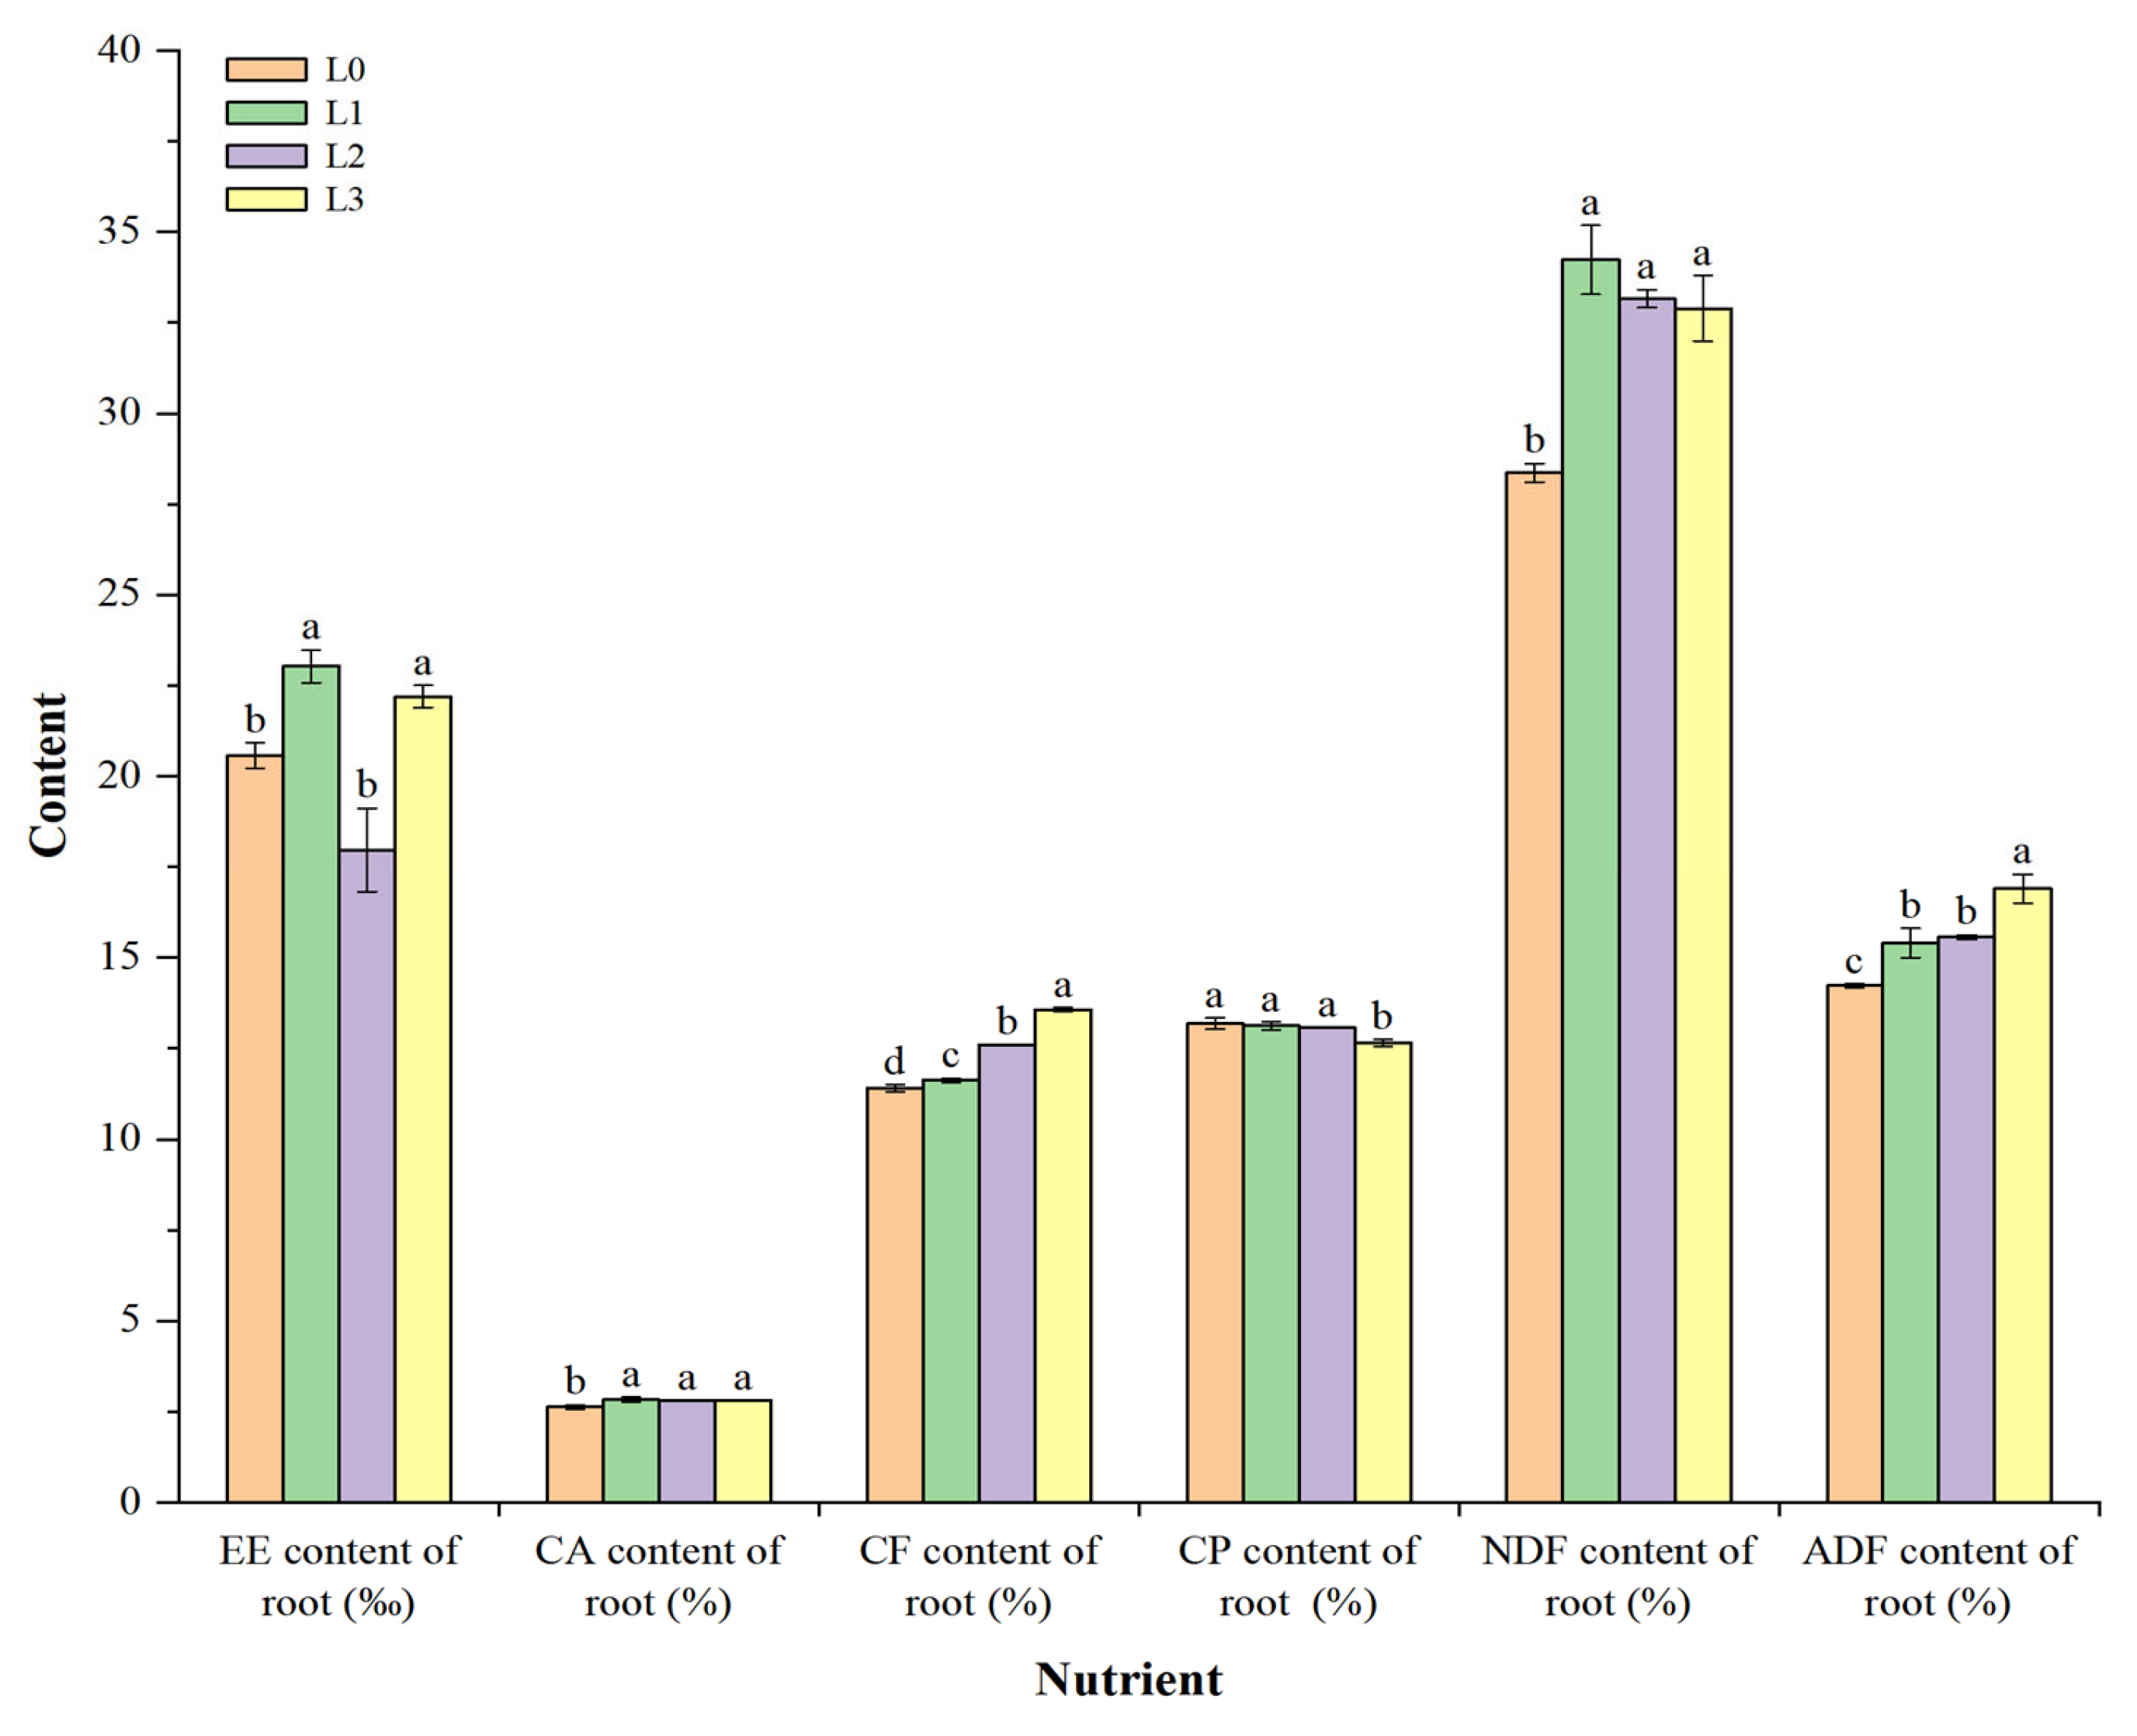
3.4. Feeding Quality of Barley Fodder Roots under Different Light Intensities

The nutritional quality of the root system across different treatments is illustrated in Figure 6. The results showed that the EE content in the L1 and L3 treatments was 23.0% and 22.2%, respectively, marking significant increases of 28.2% and 23.5% compared to the control. No significant differences were noted in the CA content among the light treatments (L1, L2, L3), with values ranging from 2.8% to 2.8%, reflecting a modest elevation of 6.5% compared to the control. As the light intensity increased, there was a gradual increase in the CF content within the barley root system, peaking at 13.6% in the L3 treatment—an approximate 19% rise relative to the control. The CP content was considerably lower in the L3 treatment, and it was significantly different from that recorded for the other treatments. The NDF content varied slightly between 32.9% and 34.2% across all three light treatments, showing no statistically significant differences among them but demonstrating an overall increase of 15.9–20.4% compared to the control. Notably, the ADF content in the L3 treatment was significantly higher than in other treatments. These findings underscore the beneficial role of light in enhancing nutrient accumulation within the root system of hydroponic barley.

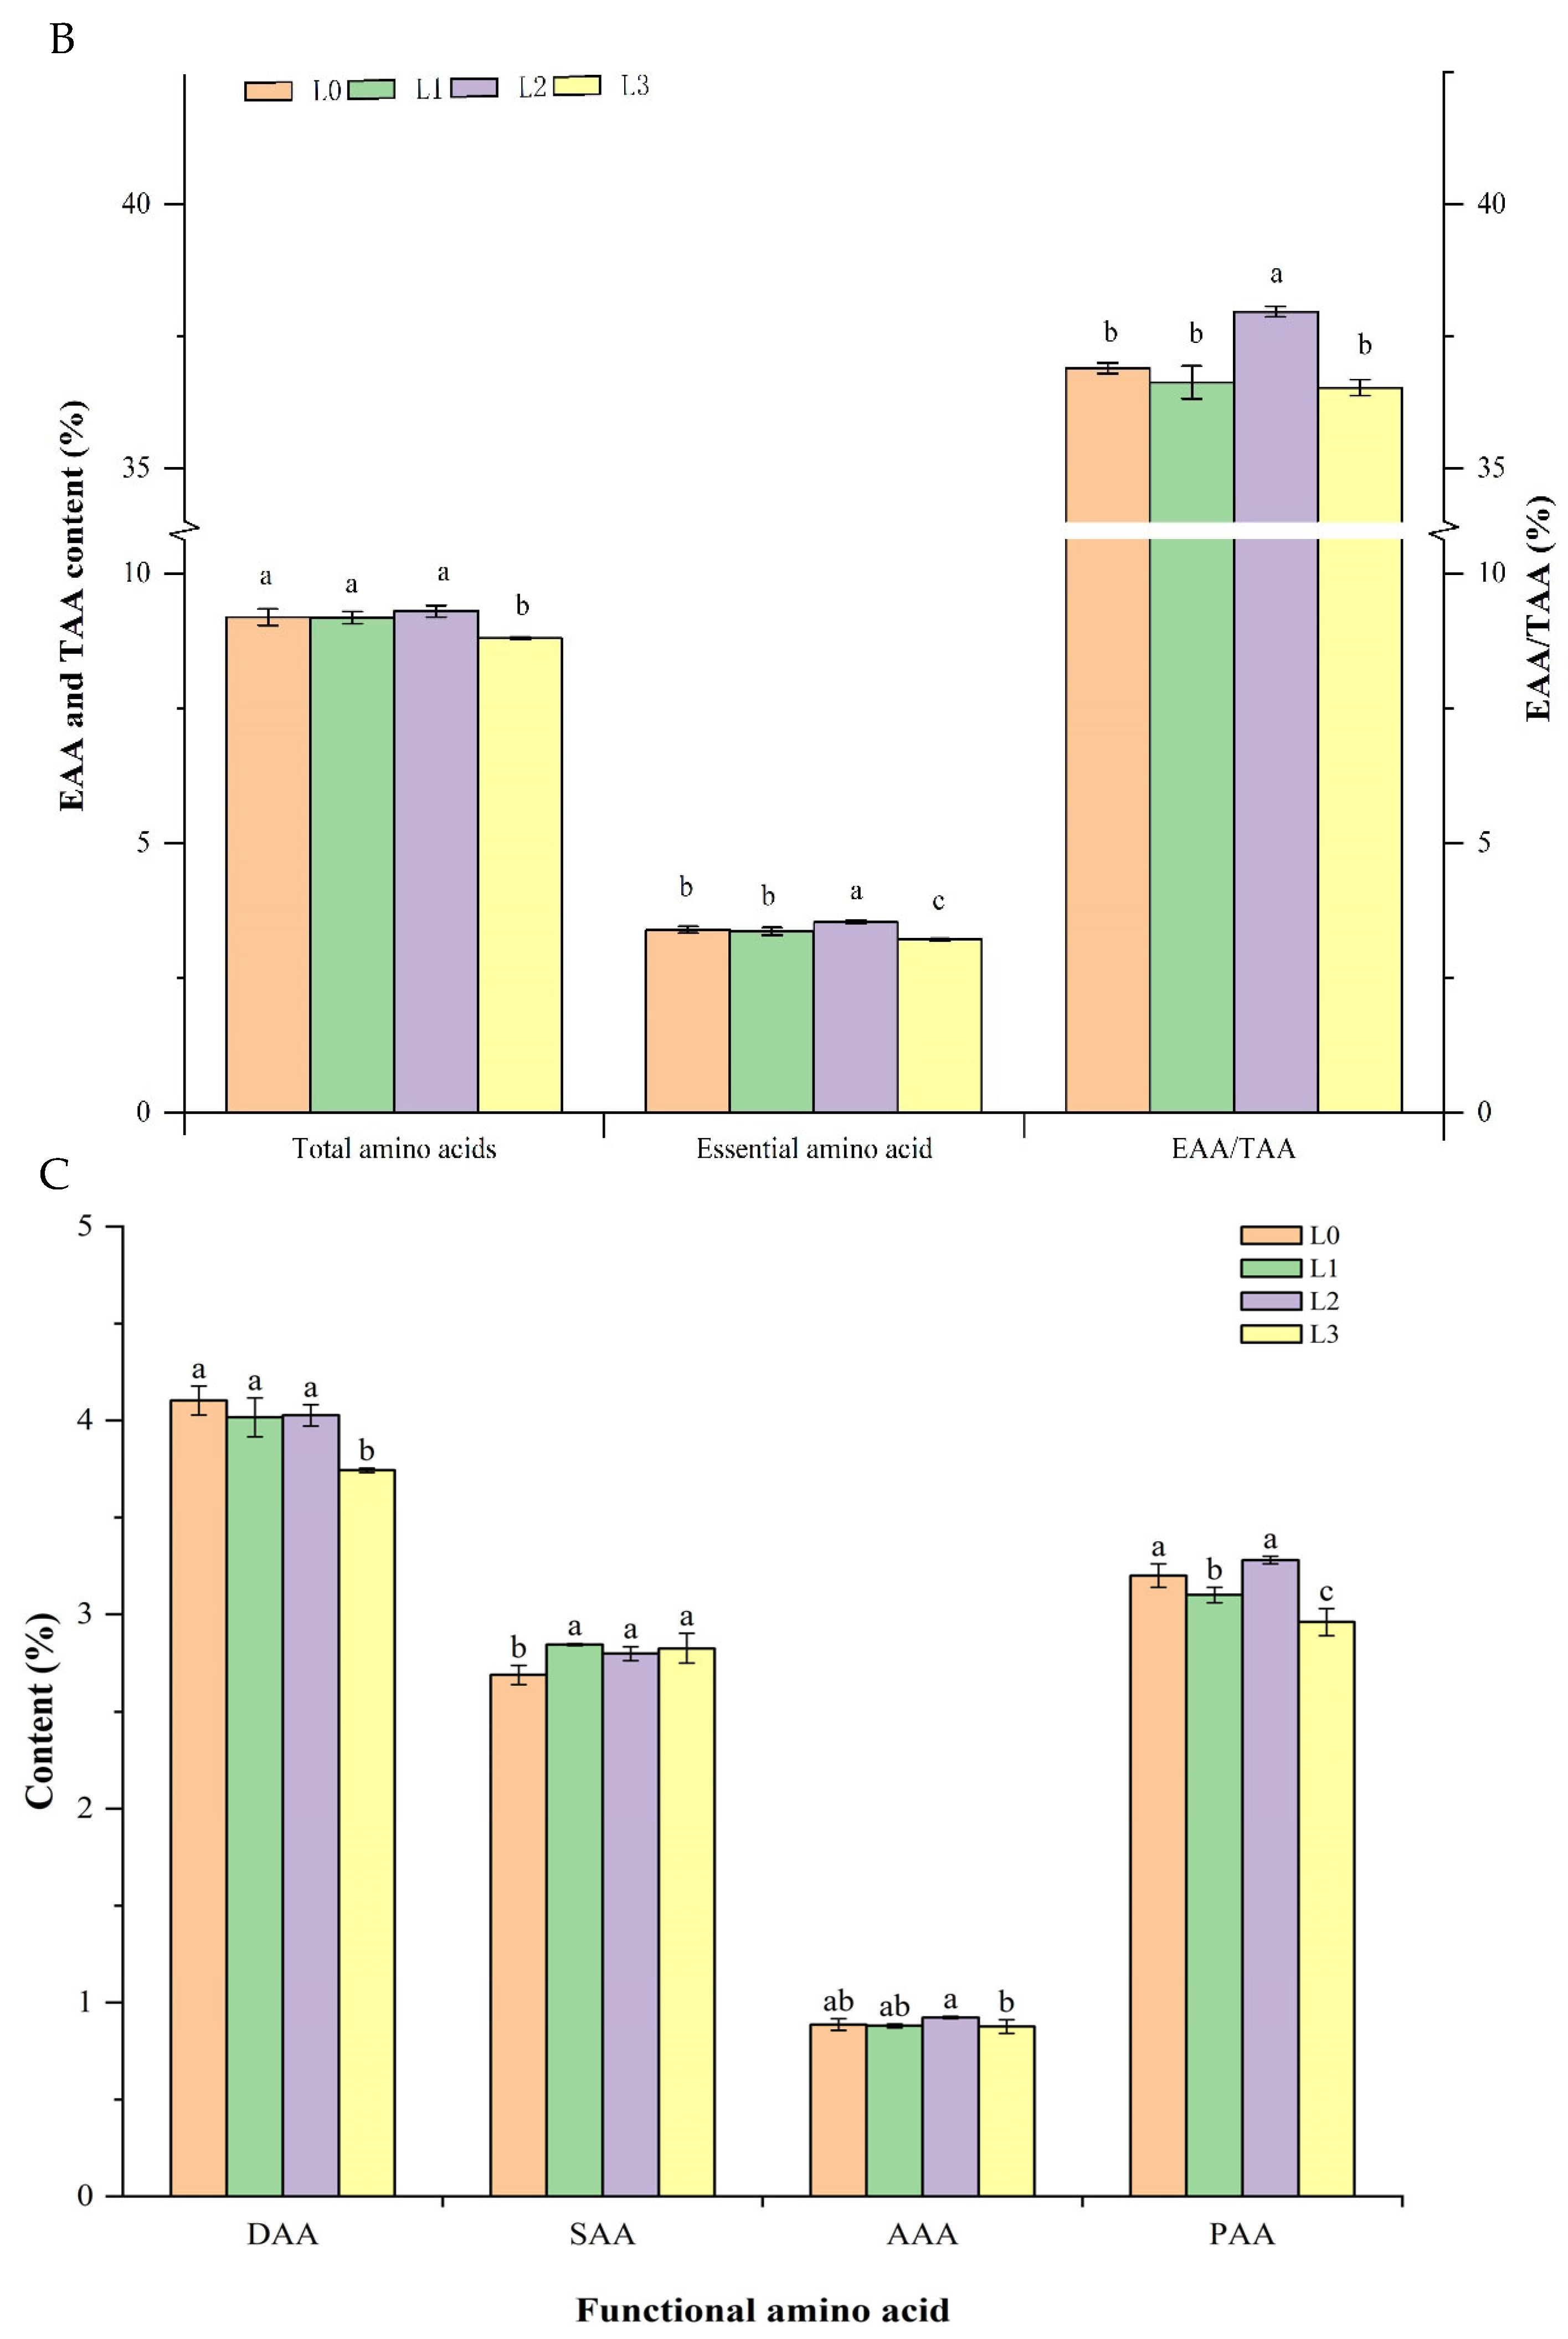
3.5. Analysis of Amino Acid Composition in Hydroponic Barley Fodder under Different Light Intensities

The content of 17 amino acids in hydroponic fodder barley grown under different levels of light intensities was evaluated (Figure 7A). Under various light intensity treatments, no significant differences were observed in the levels of phenylalanine, methionine, valine, tyrosine, and cysteine across all treatments. In the control treatment (L0), arginine and glutamate levels were significantly elevated compared to other treatments, while alanine levels were lower. In the L1 treatment, there were significantly higher levels of proline and alanine compared to the control, whereas the levels of arginine, serine, and glutamate were significantly reduced. In the L2 treatment, the amino acids threonine, isoleucine, serine, and alanine exhibited significantly higher levels relative to the control, whereas proline levels were lower than in other treatments. The histidine content showed a progressive increase with rising light intensity, with the L3 treatment exhibiting a 10.5% increase over the control. However, in the L3 treatment, the levels of lysine, threonine, isoleucine, leucine, aspartate, arginine, and glutamate were significantly lower compared to the control.
The total amino acid content in the treatments (Figure 7B) followed the following sequence: L2 > L0 > L1 > L3. Specifically, the essential amino acid content in the L2 treatment was 3.5%, which was 4.1% higher than the control and significantly surpassed that of other treatments. Additionally, the ratio of essential amino acids to total amino acids (37.9%) showed a substantial increase in the L2 treatment. Within the L2 treatment, the sulfur-containing amino acids (SAAs) were significantly higher, and the aromatic amino acids (AAAs) were 4.1% higher than those in the control (Figure 7C). According to the results, however, the lowest essential amino acid content was recorded under the L3 treatment condition. Furthermore, in the L3 treatment, the dicarboxylic amino acids (DAAs) and proline-rich amino acids (PAAs) were significantly lower, and the AAA content was 1.1% lower than that of the control. These findings suggest that the protein quality of hydroponic barley fodder is affected by varying light intensities. A light intensity of 200 μmol/m2/s yielded a more favorable amino acid profile, enhancing the proportion of essential amino acids. However, lower light intensities or the absence of light might increase certain amino acid components without significantly enhancing the composition of essential amino acids. It appears that excessively high light intensity adversely affects amino acid content. As shown in this study, at a light intensity of 300 μmol/m2/s, the contents of total, essential, DAAs, AAAs, and PAAs were comparatively low.

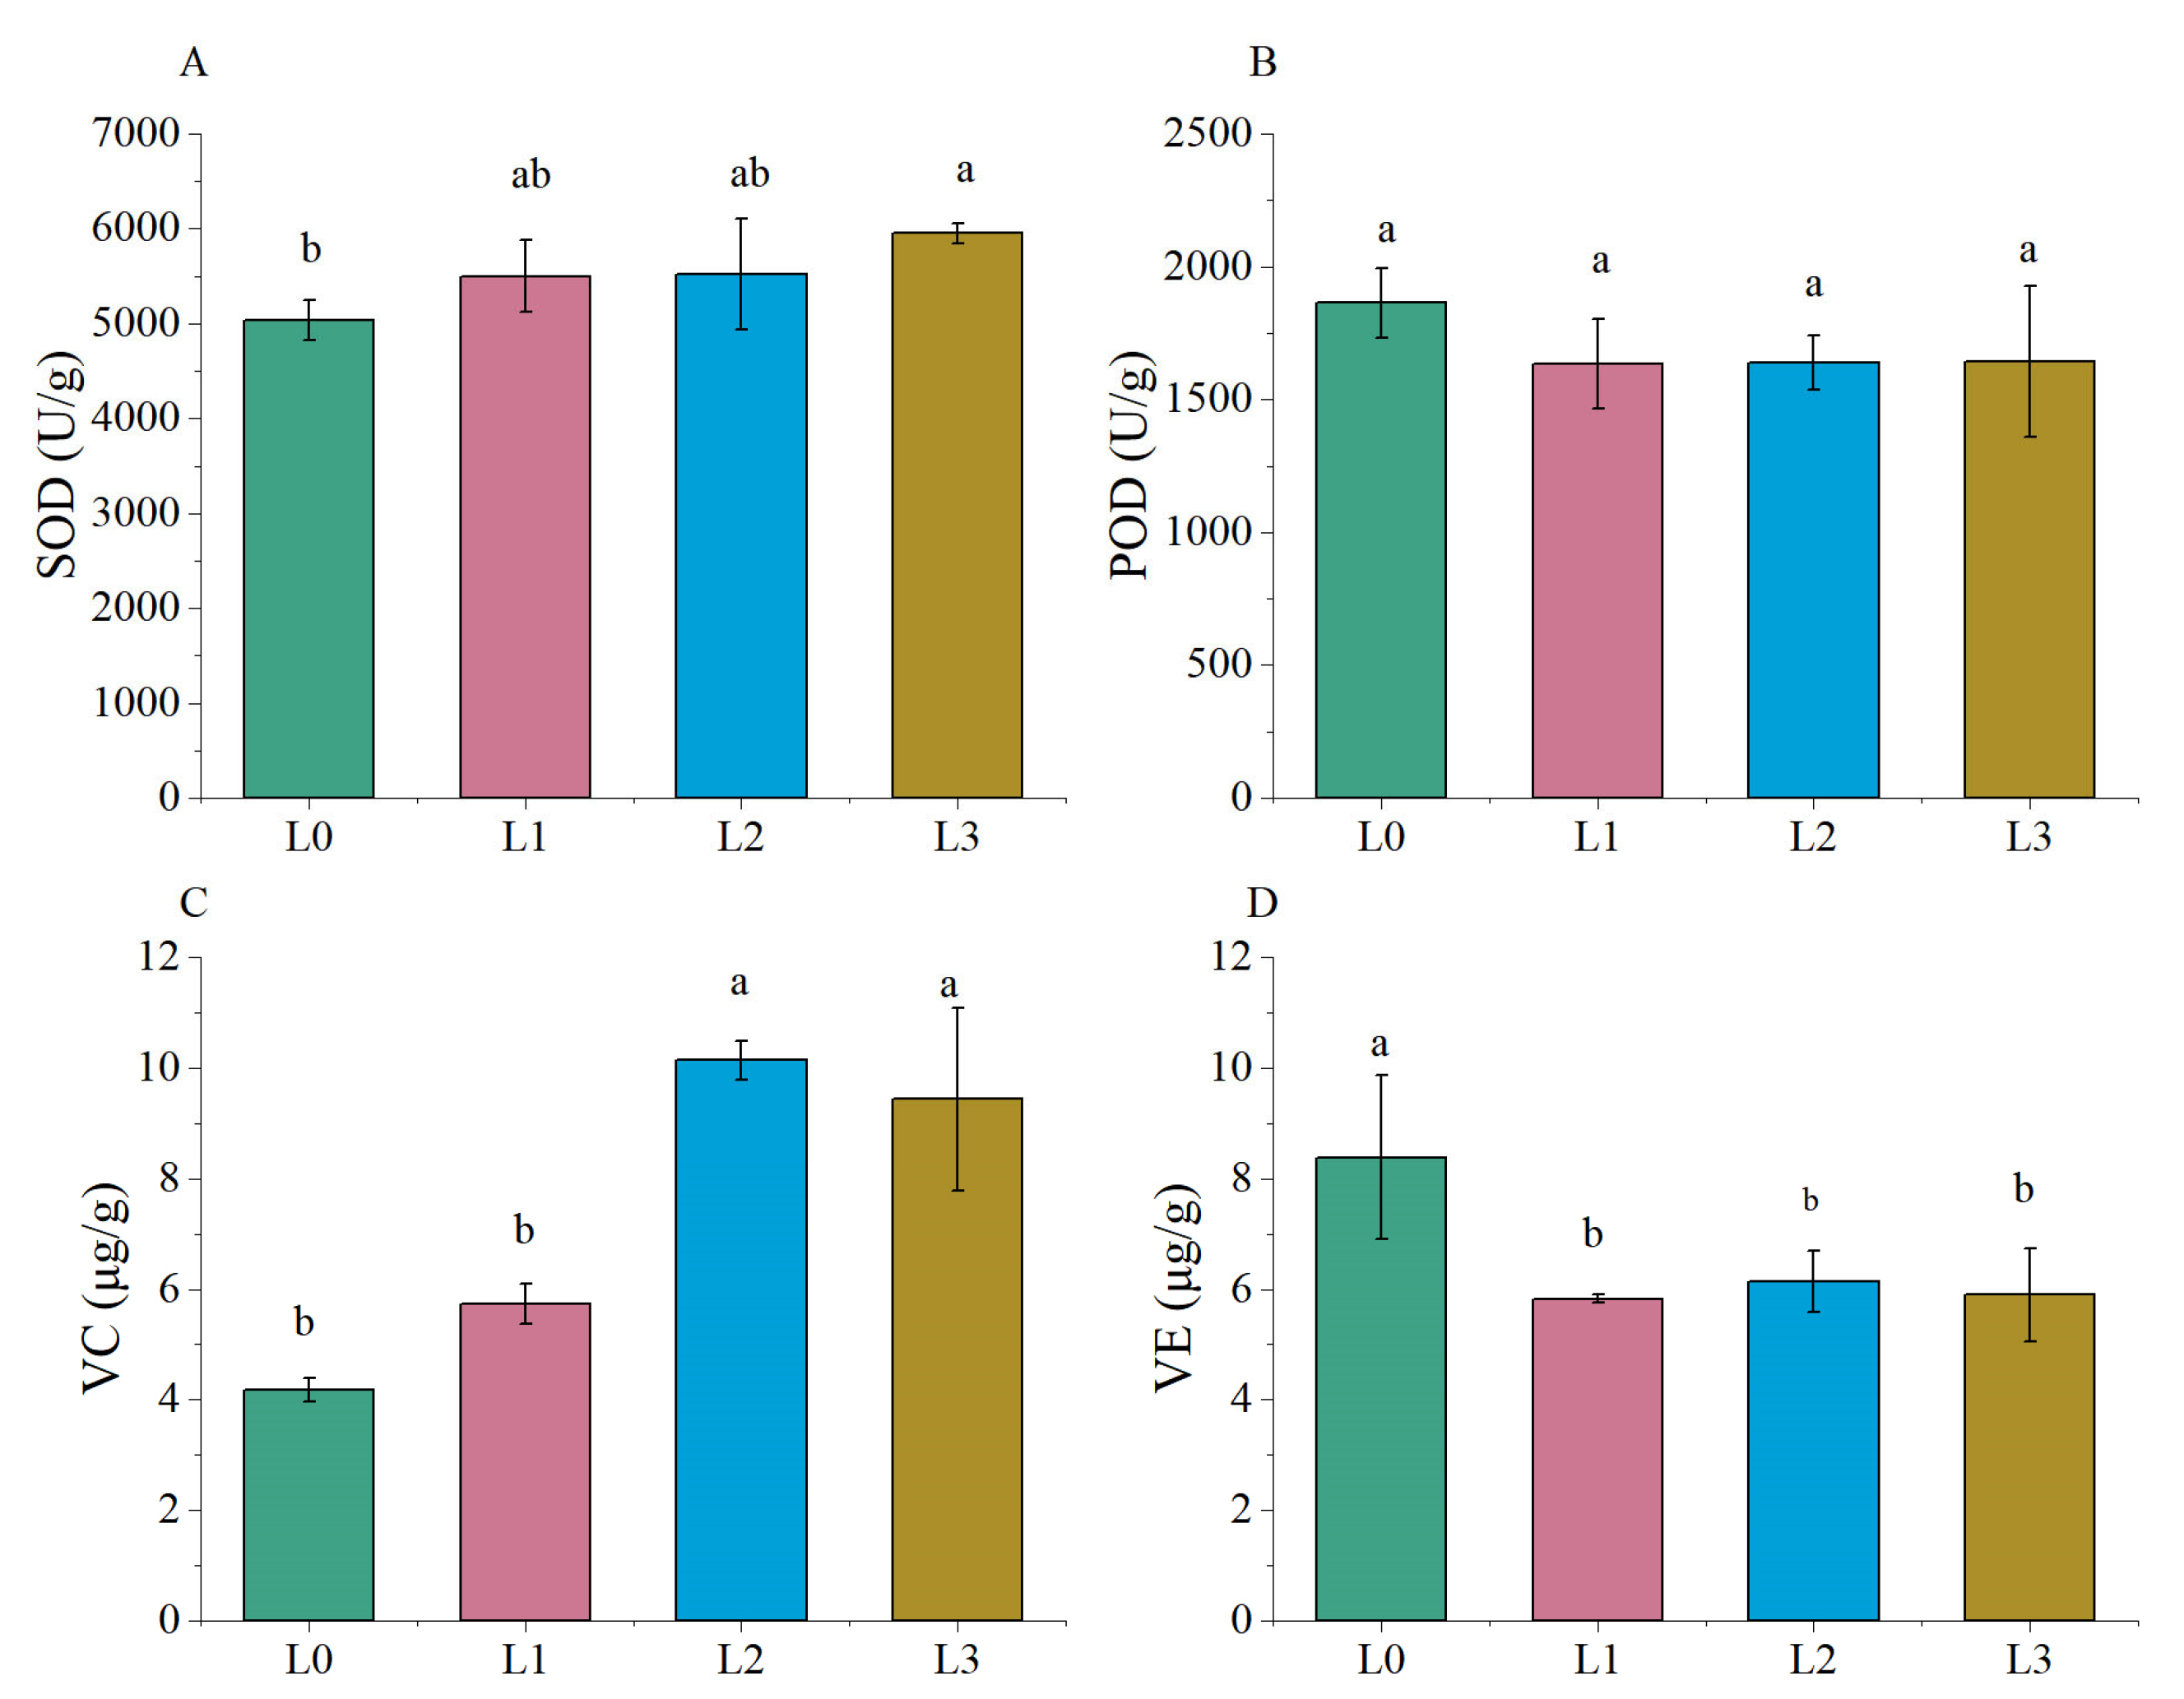
3.6. Analysis of Antioxidant Activity in Hydroponic Barley Seedlings under Different Light Intensities

In this study, we evaluated the enzyme activity and vitamin contents in hydroponic barley plants grown under different light intensities (Figure 8). The results revealed that the L3 treatment achieved the highest total superoxide dismutase (SOD) content (5951.4 U/g), which represented a significant increase of 18.2% over the control (Figure 8A). Meanwhile, the peroxidase (POD) content did not vary significantly across the light treatments (Figure 8B), with the control (L0) recording the highest level (1863 μg/g) and the L1 treatment the lowest (1633 μg/g). As for vitamin contents, the L2 treatment exhibited the highest VC content (10.1 μg/g), closely followed by the L3 treatment (9.4 μg/g) (Figure 8C), marking a substantial increase of 126.1–143.1% compared to the control (L0). However, the highest VE content was found in the L0 treatment (8.39 μg/g), significantly exceeding the levels in the other treatments (Figure 8D). Compared to the control, the VE content in the L1, L2, and L3 treatments decreased significantly by 26.8–30.5%.

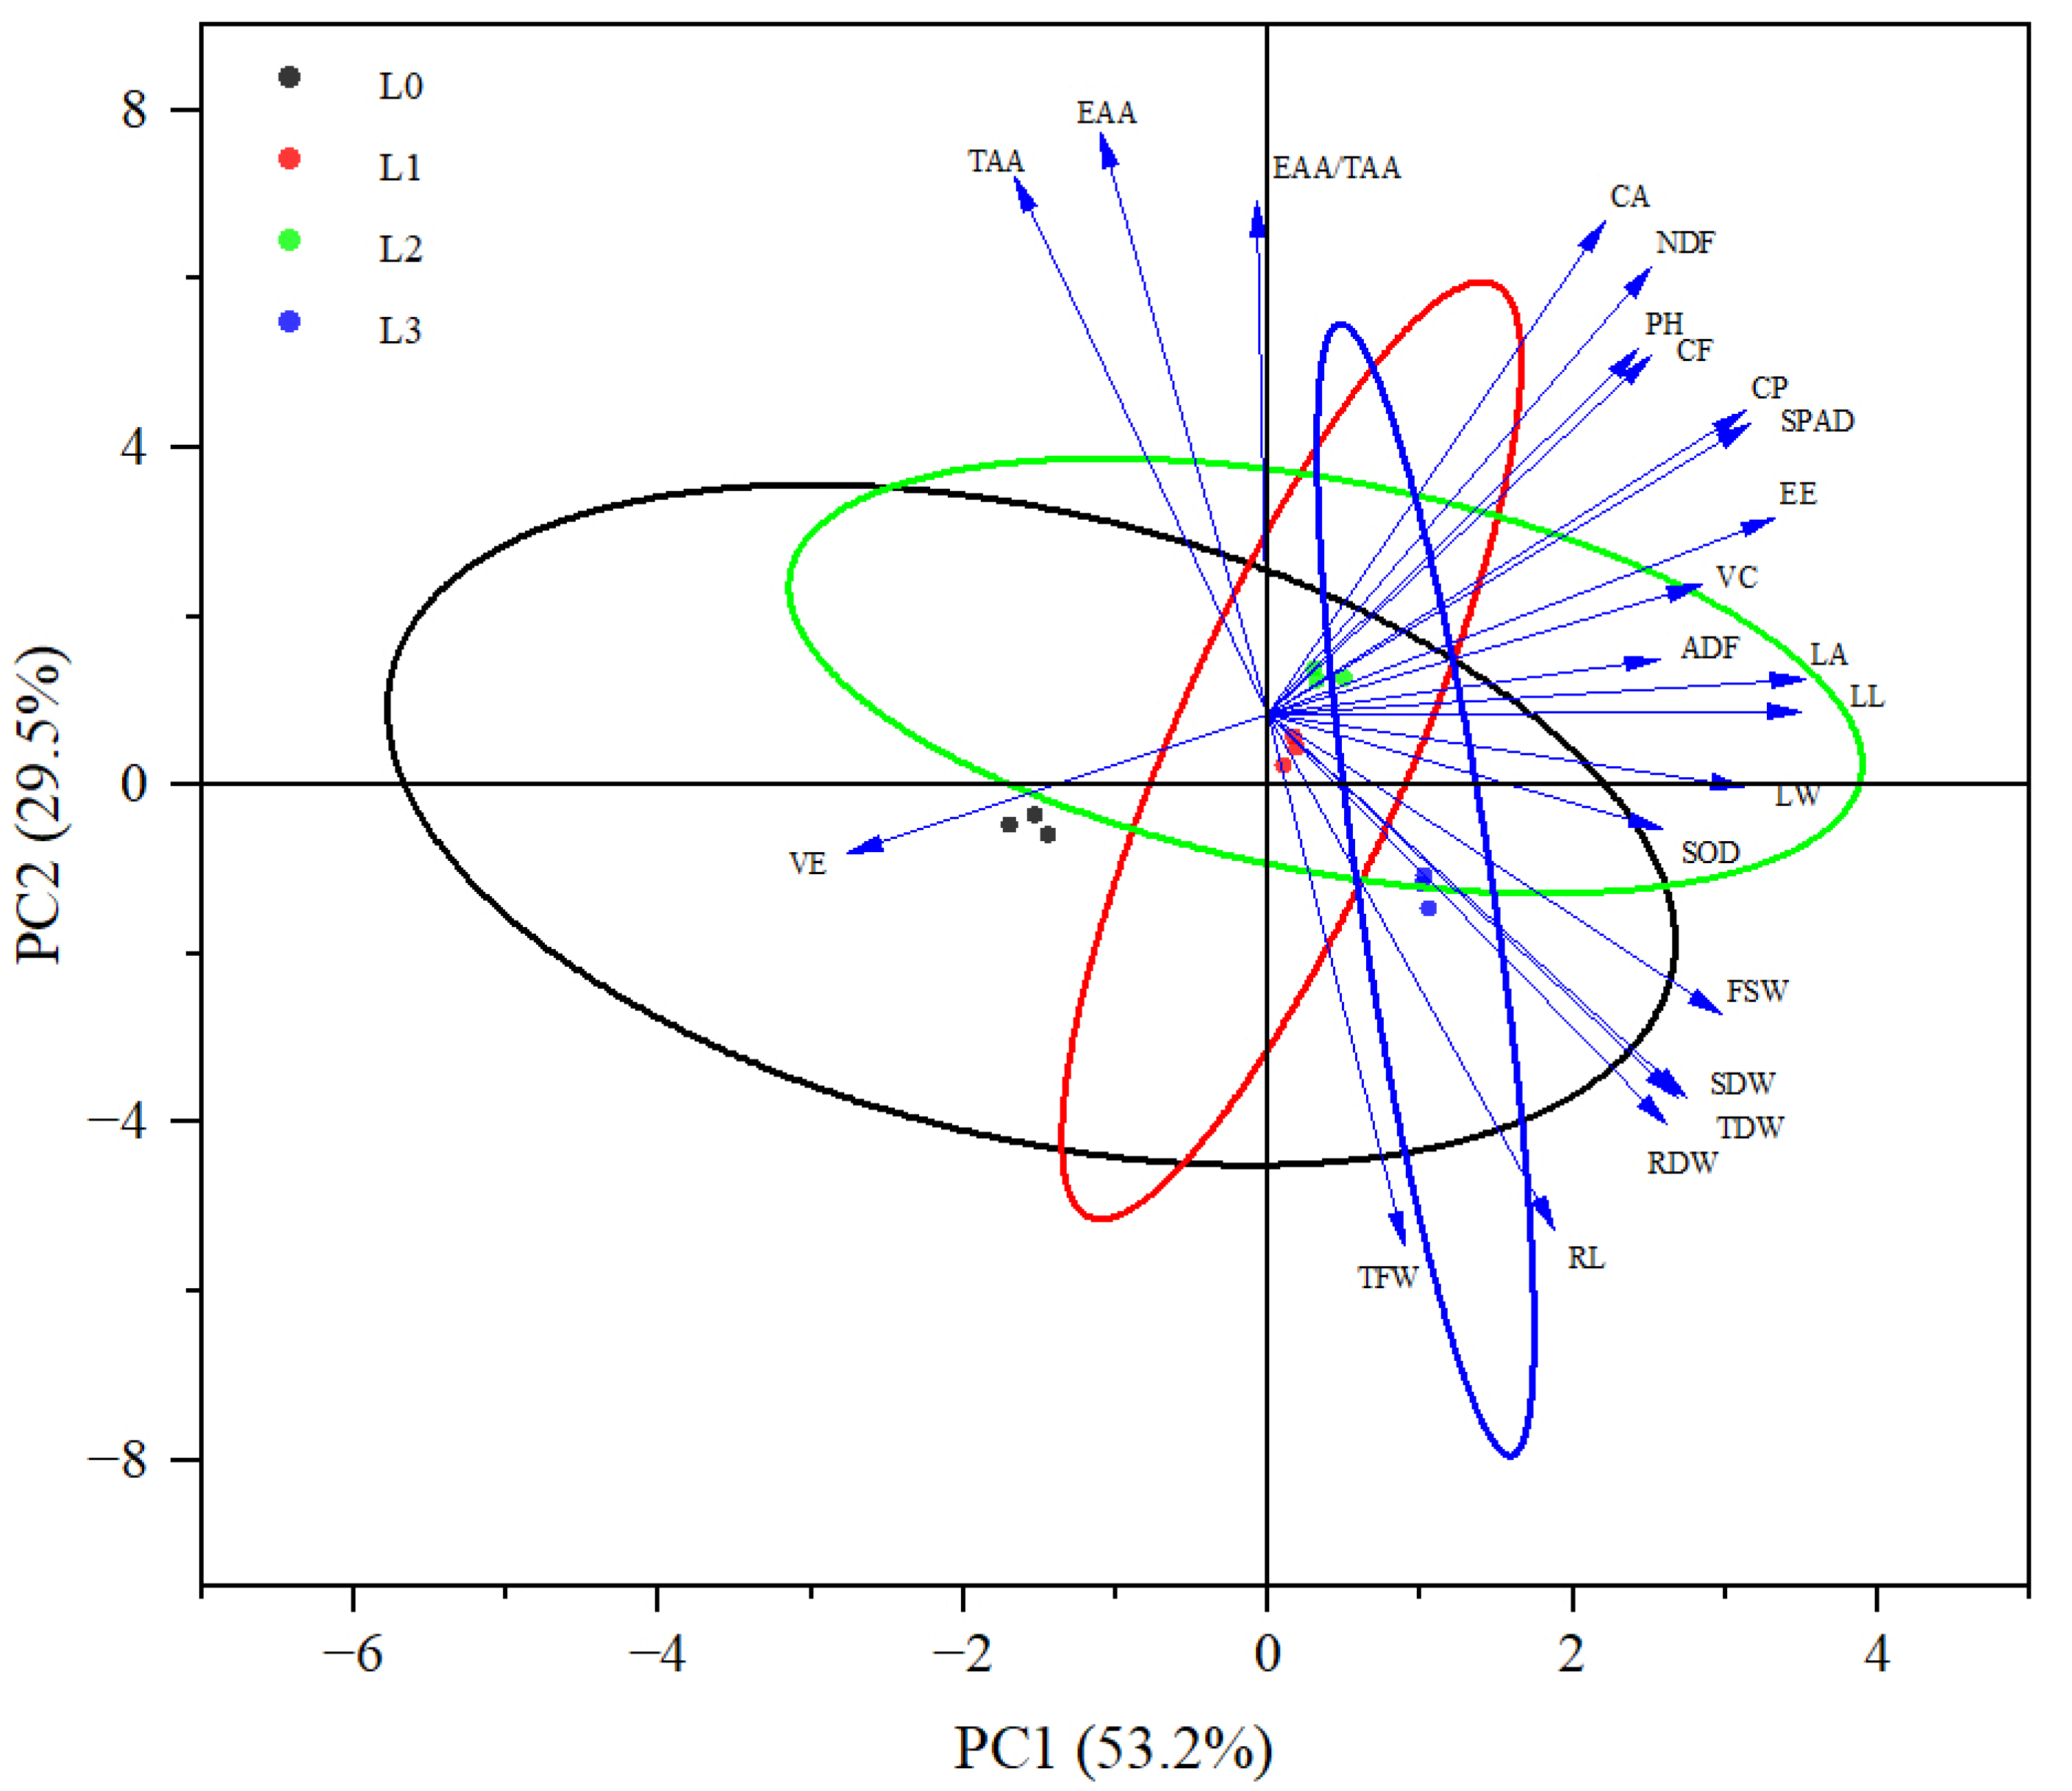
3.7. Principal Component Analysis of Growth and Quality Indicators of Hydroponic Barley Seedlings under Different Light Intensities

Principal component analysis (PCA) was performed on 23 indicators encompassing growth and nutritional components across four treatments (Figure 9). Two principal components were identified, collectively explaining 82.7% of the total variance. Principal component 1, which accounted for 53.2% of the variance, primarily reflects the nutritional and digestibility attributes of barley seedlings and the biomass status of the hay from stems and leaves. This component is characterized by variables such as CF, ADF, and hay yield. Principal component 2, contributing 29.5% to the variance, reflects the active nutritional components, dry matter accumulation, and the yield of fresh grass from barley stems and leaves. It is defined by the total amino acid content, SOD activity, dry grass yield, root dry weight, root length, and fresh stem and leaf weight. Based on the criterion that the cumulative contribution threshold must exceed 80%, these two principal components were utilized to compute the comprehensive scores for the treatments, ranked as follows: L2, L1, L3, and L0, in descending order (Table 1). The scores obtained from the analysis comprehensively represent the growth and nutrient synthesis in hydroponic barley seedlings under various light intensities. It is evident that a light intensity of 200 μmol/m2/s is favorable for promoting both growth and nutrient production in hydroponic barley. Conversely, treatments involving low, high, or no light intensity are less effective for growth. Consequently, a light intensity of 200 μmol/m2/s is recommended as the optimal condition for the production of hydroponic barley fodder.

4. Discussion

Light is a fundamental prerequisite for the growth and development of crops, significantly influencing their morphological characteristics [30]. The alteration in morphological traits in plants in response to different light intensities can influence their capacity to intercept light [31]. The findings from this study revealed that increasing light intensity significantly influenced the leaf morphological characteristics of fodder barley grown hydroponically, including leaf width, leaf perimeter, and leaf area. This outcome is in agreement with previous studies in which it was noted that elevating the level of light intensity enhances plant growth [32]. Increased light intensity appears to trigger adaptations in leaf structure likely aimed at optimizing light capture [16], which is essential for photosynthesis, plant growth, and survival. A larger leaf area, for instance, can increase the surface available for light absorption, thereby enhancing the plant’s ability to generate energy [12]. Similarly, alterations in characteristics related to leaf dimensions, such as leaf width and perimeter, may represent adaptive responses to maximize efficiency in light utilization under varying light conditions [33].
In this study, the results clearly demonstrate that the L3 and L2 treatments were the most effective treatments across almost all measured biomass and morphological indices, indicating their potent effect on promoting growth. However, the L0 and L1 treatments consistently showed the lowest values across all indices. No light or low light intensity can significantly reduce the photosynthesis rate and leaf development [33]. Fodder barley exhibited a significant increase in height and fresh weight at a light intensity of 200 μmol/m2/s compared to other light intensity treatments. However, elevating the light intensity to 300 μmol/m2/s markedly enhanced the dry weight of the crops, albeit at the expense of their water content. Elevating light intensity enhances the photosynthesis process, thereby increasing water consumption within the plant system [14]. Additionally, higher light intensities typically elevate leaf surface temperatures and promote stomatal opening, which increases transpiration rates [34]. The findings of this study indicated that both transpiration and photosynthesis rates were significantly higher under the 300 μmol/m2/s light intensity condition. This suggests that these factors played substantial roles in reducing the water content observed in plants cultivated under this specific condition. In agreement with our results, previous research showed that using high levels of light intensity negatively impacted water content [18].
The findings of this research showed that the stomatal conductance and intercellular CO2 were lower in the L1 treatment compared to the other light treatments. However, an increase in stomatal conductance and intercellular CO2 concentration was recorded with increasing light intensity. With lower light, the internal CO2 concentration in the leaf increases relative to the amount utilized in photosynthesis, due to a slowdown in the photosynthetic process [35,36]. The results also showed that plants grown under 300 μmol/m2/s exhibited the lowest water use efficiency (WUE) compared to other light treatments, while plants grown under 200 μmol/m2/s exhibited the highest WUE. Stomatal conductance and intercellular CO2 concentration intricately influence WUE by regulating the balance between the optimal CO2 uptake for photosynthesis and minimal water loss through transpiration [30]. Alterations in steady-state stomatal conductance in response to light intensity can impact the balance between transpirational water loss and carbon acquisition in plants, thereby influencing WUE [37].
Light intensity can affect the content of pigments such as chlorophyll, with excessive light intensity inducing pigment degradation [38]. Also, as light influences the biosynthesis of chlorophyll, under low- or no-light conditions, the biosynthesis of chlorophyll is reduced, leading to lighter-colored leaves, or in the case of no-light conditions, seedlings will become etiolated similar to those observed in the L0 treatment in this research [9,16]. In this study, the optimal SPAD values were observed at a light intensity of 200 μmol/m2/s, with no further increases as light intensity continued to rise. This is consistent with findings from previous studies, which showed that chlorophyll degradation was enhanced beyond a certain level of light intensity [18,39].
The components of fodder quality, such as EE, CA, CP, and NDF, can be influenced by a combination of environmental conditions, plant genetics, and agricultural practices [40,41]. However, to the best of our knowledge, the impact of light intensity on the fodder quality components of hydroponically grown fodder crops has rarely been investigated. This research found that the level of EE, CA, CP, and NDF, parameters reflecting the content of fat, mineral, protein, and cellulose, respectively, was particularly the highest in the 200 μmol/m2/s treatment. The concentration of these components was consistently lower in plants exposed to 100 and 300 μmol/m2/s compared to those subjected to 200 μmol/m2/s, with the lowest concentrations observed under the condition of no light (L0). These findings demonstrate that the 200 μmol/m2/s treatment significantly improved the nutritional quality of hydroponic barley fodder by supplying essential elements that enhance energy density, nutritional completeness, muscle development, and digestive health in livestock [42].
Light intensity profoundly impacts the regulation of amino acid biosynthesis and utilization in plants [13,43]. This research indicates that the total and favorable amino acid content peaked under the 200 μmol/m2/s light treatment; however, increasing light intensity from 200 to 300 μmol/m2/s adversely impacted the amino acid levels, particularly the essential amino acids. The content of essential amino acids was also adversely affected under the 0 and 100 μmol/m2/s treatment. These findings are in agreement with previous research that indicated light was a critical factor in the biosynthesis and accumulation of amino acids [44,45]. In addition, our results show that that higher light intensities do not necessarily enhance amino acid content, corroborating earlier assertions that excessive light can reduce nutritional quality [46]. High levels of light intensity can negatively affect amino acid biosynthesis in plants by causing photoinhibition and oxidative stress, which disrupt nitrogen assimilation and divert resources from amino acid synthesis to stress response mechanisms [47,48].
Antioxidant enzymes such as SOD and POD are crucial for maintaining normal plant metabolism by participating in the scavenging of reactive oxygen species (ROS) in chloroplasts [49]. The findings of this research indicated that SOD and POD activities reached their peaks under 300 μmol/m2/s and 0 μmol/m2/s light treatments, respectively, suggesting that these two treatments increased ROS levels in hydroponic barley fodder, thereby enhancing the activity of these antioxidant enzymes [50]. Previous research has demonstrated that sub-optimal light conditions induce oxidative stress in plants, thereby triggering enhanced antioxidant responses to mitigate potential damage from ROS [51,52,53]. Vitamins C and E are the other essential antioxidants in plants, with their levels being affected by the intensity of light exposure [9]. This study demonstrated that elevating light intensity increased the VC content in barley, with plants exposed to 200 and 300 μmol/m2/s containing significantly greater amounts of VC compared to those subjected to 0 and 100 μmol/m2/s. This observation aligns with previous research that suggested that higher light intensities activate genes linked to the VC biosynthesis pathway [54]. In contrast, the findings indicated that increasing light intensity did not impact the VE content; however, plants grown in darkness exhibited higher levels of VE compared to those grown under light conditions. This suggests that while light stimulates VC production, it might not influence VE in the same way, and darkness could potentially enhance the accumulation of VE. Previous research suggested that the constant expression of the DXPR (1-deoxy-D-xylulose-5-phosphate reductase) gene, a crucial enzyme in the MEP (methylerythritol phosphate) pathway of VE biosynthesis, could be associated with the elevated levels of VE in plants exposed to dark conditions [17].

5. Conclusions

The impact of light intensity on hydroponically grown fodder crops like barley has been relatively unexplored, with a lack of in-depth studies on their physiological and biochemical responses to varying light levels. This research filled this gap by evaluating how different light intensities affect the nutritional quality of hydroponic barley fodder, focusing on aspects such as photosynthesis, biomass, quality, and nutritional value. This study revealed that while higher light intensities yield increased biomass, they do not necessarily enhance the quality and nutritional value of fodder, which are crucial for providing high-quality feed. The findings also indicated that a light intensity of 200 μmol/m2/s is optimal for hydroponically growing fodder barley, effectively balancing factors critical to fodder quality and overall production efficiency. This optimal setting underscores the importance of adjusting light conditions to meet specific agricultural needs, particularly in hydroponic systems where light can be meticulously controlled.

Author Contributions

Conceptualization, J.Y. and J.S.; methodology, J.Y.; data curation, J.Y. and X.W.; writing—original draft preparation, J.Y.; writing—review and editing, B.Z. All authors have read and agreed to the published version of the manuscript.

Funding

This research was funded by the China Agriculture Research System (CARS-34), a technical system for the high-quality forage industry in the Xinjiang Uygur Autonomous Region (XJARS-13).

Data Availability Statement

Data will be made available on request.

Conflicts of Interest

The authors declare no conflicts of interest.

References

  1. Guo, Q.; Wen, Z.; Ghanizadeh, H.; Fan, Y.; Zheng, C.; Yang, X.; Yan, X.; Li, W. Stochastic processes dominate assembly of soil fungal community in grazing excluded grasslands in northwestern China. J. Soils Sed. 2023, 23, 156–171. [Google Scholar] [CrossRef]
  2. Yang, X.; Yan, X.; Guo, Q.; Ghanizadeh, H.; Li, M.; Tuo, H.; Wen, Z.; Li, W. Effects of different management practices on plant community and soil properties in a restored grassland. J. Soil Sci. Plant Nutr. 2022, 22, 3811–3821. [Google Scholar] [CrossRef]
  3. Tian, Z.; Ma, W.; Yang, Q.; Duan, F. Application status and challenges of machine vision in plant factory—A review. Inf. Proc. Agric. 2022, 9, 195–211. [Google Scholar] [CrossRef]
  4. Sneath, R.; McIntosh, F. Review of Hydroponic Fodder Production for Beef Cattle; Meat & Livestock Australia Limited: Sydney, Australia, 2003; Volume 84, p. 54. [Google Scholar]
  5. Hemathilake, D.M.K.S.; Gunathilake, D.M.C.C. Future Foods; Academic Press: Cambridge, UK, 2022; pp. 555–567. [Google Scholar]
  6. Nikkhah, A. Barley forages for modern global ruminant agriculture: A review. Russ. Agric. Sci. 2013, 39, 206–213. [Google Scholar] [CrossRef]
  7. Gao, Q.; Liao, Q.; Li, Q.; Yang, Q.; Wang, F.; Li, J. Effects of LED red and blue light component on growth and photosynthetic characteristics of coriander in plant factory. Horticulturae 2022, 8, 1165. [Google Scholar] [CrossRef]
  8. Meng, T.; Nakamura, E.; Irino, N.; Joshi, K.; Devkota, H.; Yahara, S.; Kondo, R. Effects of irradiation with light of different photon densities on the growth of young green barley plants. Agric. Sci. 2015, 6, 208–216. [Google Scholar] [CrossRef]
  9. Bian, Z.H.; Yang, Q.C.; Liu, W.K. Effects of light quality on the accumulation of phytochemicals in vegetables produced in controlled environments: A review. J. Sci. Food Agric. 2015, 95, 869–877. [Google Scholar] [CrossRef]
  10. Xu, Y.; Chang, Y.; Chen, G.; Lin, H. The research on LED supplementary lighting system for plants. Optik 2016, 127, 7193–7201. [Google Scholar] [CrossRef]
  11. Ma, Y.; Xu, A.; Cheng, Z.-M. Effects of light emitting diode lights on plant growth, development and traits a meta-analysis. Hortic. Plant J. 2021, 7, 552–564. [Google Scholar] [CrossRef]
  12. Yao, X.; Liu, X.; Xu, Z.; Jiao, X. Effects of light intensity on leaf microstructure and growth of rape seedlings cultivated under a combination of red and blue LEDs. J. Integr. Agric. 2017, 16, 97–105. [Google Scholar] [CrossRef]
  13. Mohsen, A.F.; Nasr, A.H.; Metwalli, A.M. Effect of different light intensities on growth, reproduction, amino acid synthesis, fat and sugar contents in ulva fasciata delile. Hydrobiologia 1973, 43, 125–135. [Google Scholar] [CrossRef]
  14. Zhou, J.; Li, P.; Wang, J. Effects of light intensity and temperature on the photosynthesis characteristics and yield of lettuce. Horticulturae 2022, 8, 178. [Google Scholar] [CrossRef]
  15. Johkan, M.; Shoji, K.; Goto, F.; Hahida, S.; Yoshihara, T. Effect of green light wavelength and intensity on photomorphogenesis and photosynthesis in Lactuca sativa. Environ. Exp. Bot. 2012, 75, 128–133. [Google Scholar] [CrossRef]
  16. Fan, X.-X.; Xu, Z.-G.; Liu, X.-Y.; Tang, C.-M.; Wang, L.-W.; Han, X.-l. Effects of light intensity on the growth and leaf development of young tomato plants grown under a combination of red and blue light. Sci. Hortic. 2013, 153, 50–55. [Google Scholar] [CrossRef]
  17. Li, J.; Lu, Y.; Chen, H.; Wang, L.; Wang, S.; Guo, X.; Cheng, X. Effect of photoperiod on vitamin E and carotenoid biosynthesis in mung bean (Vigna radiata) sprouts. Food Chem. 2021, 358, 129915. [Google Scholar] [CrossRef]
  18. Pan, J.; Guo, B. Effects of light intensity on the growth, photosynthetic characteristics, and flavonoid content of Epimedium pseudowushanense B.L.Guo. Molecules 2016, 21, 1475. [Google Scholar] [CrossRef]
  19. Ilić, Z.S.; Fallik, E. Light quality manipulation improves vegetable quality at harvest and postharvest: A review. Environ. Exp. Bot. 2017, 139, 79–90. [Google Scholar] [CrossRef]
  20. He, J.; Jawahir, N.K.B.; Qin, L. Quantity of supplementary LED lightings regulates photosynthetic apparatus, improves photosynthetic capacity and enhances productivity of Cos lettuce grown in a tropical greenhouse. Photosynth. Res. 2021, 149, 187–199. [Google Scholar] [CrossRef] [PubMed]
  21. Ahamed, M.S.; Sultan, M.; Shamshiri, R.R.; Rahman, M.M.; Aleem, M.; Balasundram, S.K. Present status and challenges of fodder production in controlled environments: A review. Smart Agric. Technol. 2023, 3, 100080. [Google Scholar] [CrossRef]
  22. Ren, P.; Deng, M.; Feng, J.; Li, R.; Ma, X.; Liu, J.; Wang, D. Partial replacement of oat hay with whole-plant hydroponic barley seedlings modulates ruminal microbiota and affects growth performance of Holstein heifers. Microorganisms 2022, 10, 2000. [Google Scholar] [CrossRef]
  23. Grigas, A.; Kemzūraitė, A.; Steponavičius, D.; Steponavičienė, A.; Domeika, R. Impact of slope of growing trays on productivity of wheat green fodder by a nutrient film technique system. Water 2020, 12, 3009. [Google Scholar] [CrossRef]
  24. Girma, F.; Gebremariam, B. Review on hydroponic feed value to livestock production. J. Sci. Innov. Res. 2018, 7, 106–109. [Google Scholar] [CrossRef]
  25. Available online: https://www.chinesestandard.net/PDF/English.aspx/GBT6433-2006 (accessed on 16 May 2024).
  26. Available online: https://www.chinesestandard.net/Related.aspx/GBT6434-2022?Redirect=YES (accessed on 16 May 2024).
  27. Available online: https://www.chinesestandard.net/Related.aspx/GBT20806-2022?Redirect=YES (accessed on 16 May 2024).
  28. Available online: https://www.chinesestandard.net/PDF/English.aspx/GBT18246-2019 (accessed on 16 May 2024).
  29. Li, Z.; Hong, T.; Shen, G.; Gu, Y.; Guo, Y.; Han, J. Amino acid profiles and nutritional evaluation of fresh sweet–waxy corn from three different regions of China. Nutrients 2022, 14, 3887. [Google Scholar] [CrossRef] [PubMed]
  30. Kochhar, S.L.; Gujral, S.K. Plant Physiology: Theory and Applications, 2nd ed.; Cambridge University Press: Cambridge, UK, 2020; pp. 201–252. [Google Scholar]
  31. Poorter, H.; Niinemets, Ü.; Ntagkas, N.; Siebenkäs, A.; Mäenpää, M.; Matsubara, S.; Pons, T. A meta-analysis of plant responses to light intensity for 70 traits ranging from molecules to whole plant performance. New Phytol. 2019, 223, 1073–1105. [Google Scholar] [CrossRef]
  32. Dou, H.; Niu, G.; Gu, M.; Masabni, J.G. Responses of sweet basil to different daily light integrals in photosynthesis, morphology, yield, and nutritional quality. HortScience 2018, 53, 496–503. [Google Scholar] [CrossRef]
  33. Li, Q.; Deng, M.; Xiong, Y.; Coombes, A.; Zhao, W. Morphological and photosynthetic response to high and low irradiance of Aeschynanthus longicaulis. Sci. World J. 2014, 2014, 347461. [Google Scholar] [CrossRef]
  34. Timergalina, L.N.; Vysotskaya, L.B.; Veselov, S.Y.; Kudoyarova, G.R. Effect of increased irradiance on the hormone content, water relations, and leaf elongation in wheat seedlings. Russ. J. Plant Physiol. 2007, 54, 633–638. [Google Scholar] [CrossRef]
  35. Zhou, J.; Li, P.; Wang, J.; Fu, W. Growth, photosynthesis, and nutrient uptake at different light intensities and temperatures in lettuce. HortScience 2019, 54, 1925–1933. [Google Scholar] [CrossRef]
  36. Li, X.; Ghanizadeh, H.; Han, Z.; Wang, Q.; Li, F.; Qiu, Y.; Zhang, Y.; Chen, X.; Liu, J.; Wang, A. Metabolic profile and physiological mechanisms underlying the promoting effects of TiO2NPs on the photosynthesis and growth of tomato. Sci. Hortic. 2023, 322, 112394. [Google Scholar] [CrossRef]
  37. Clavijo-Herrera, J.; Van Santen, E.; Gómez, C. Growth, water-use efficiency, stomatal conductance, and nitrogen uptake of two lettuce cultivars grown under different percentages of blue and red light. Horticulturae 2018, 4, 16. [Google Scholar] [CrossRef]
  38. Shao, Q.; Wang, H.; Guo, H.; Zhou, A.; Huang, Y.; Sun, Y.; Li, M. Effects of shade treatments on photosynthetic characteristics, chloroplast ultrastructure, and physiology of Anoectochilus roxburghii. PLoS ONE 2014, 9, e85996. [Google Scholar] [CrossRef]
  39. Li, T.; Liu, H.; Zhou, F. Effects of light intensity and photoperiod on the fresh locking and quality of Hydroponic arugula in the harvesting period. Agronomy 2023, 13, 1667. [Google Scholar] [CrossRef]
  40. Abeysekara, S.; Christensen, D.A.; Niu, Z.; Theodoridou, K.; Yu, P. Molecular structure, chemical and nutrient profiles, and metabolic characteristics of the proteins and energy in new cool-season corn varieties harvested as fresh forage for dairy cattle. J. Dairy Sci. 2013, 96, 6631–6643. [Google Scholar] [CrossRef] [PubMed]
  41. Tlahig, S.; Neji, M.; Atoui, A.; Seddik, M.; Dbara, M.; Yahia, H.; Nagaz, K.; Najari, S.; Khorchani, T.; Loumerem, M. Genetic and seasonal variation in forage quality of lucerne (Medicago sativa L.) for resilience to climate change in arid environments. J. Agric. Food Res. 2024, 15, 100986. [Google Scholar] [CrossRef]
  42. Wang, T.T.; Liu, D.W.; Huang, C.F.; Liu, L.; Piao, X.S.; Wang, F.L. Determination and prediction of digestible and metabolizable energy from the chemical composition of chinese corn gluten feed fed to finishing pigs. Asian-Australas J. Anim. Sci. 2014, 27, 871–879. [Google Scholar] [CrossRef] [PubMed]
  43. Gyugos, M.; Ahres, M.; Gulyás, Z.; Szalai, G.; Darkó, É.; Végh, B.; Boldizsár, Á.; Mednyánszky, Z.; Kar, R.K.; Dey, N.; et al. Role of light-intensity-dependent changes in thiol and amino acid metabolism in the adaptation of wheat to drought. J. Agron. Crop Sci. 2019, 205, 562–570. [Google Scholar] [CrossRef]
  44. Ma, Q.; Cao, X.; Wu, L.; Mi, W.; Feng, Y. Light intensity affects the uptake and metabolism of glycine by pakchoi (Brassica chinensis L.). Sci. Rep. 2016, 6, 21200. [Google Scholar] [CrossRef] [PubMed]
  45. Zhou, B.; Feng, X.; Huang, W.; Liu, Q.; Ibrahim, S.A.; Liu, Y. Effects of light intensity on the biosynthesis of glucosinolate in Chinese cabbage plantlets. Sci. Hortic. 2023, 316, 112036. [Google Scholar] [CrossRef]
  46. Liu, K.; Gao, M.; Jiang, H.; Ou, S.; Li, X.; He, R.; Li, Y.; Liu, H. Light intensity and photoperiod affect growth and nutritional quality of brassica microgreens. Molecules 2022, 27, 883. [Google Scholar] [CrossRef]
  47. Chen, Y.; Liu, J.; Liu, W. LED red and blue light intensity affected productivity and nitrogen metabolisms of ryegrass. J. Plant Nut. 2024, 47, 705–717. [Google Scholar] [CrossRef]
  48. Gao, M.; He, R.; Shi, R.; Zhang, Y.; Song, S.; Su, W.; Liu, H. Differential effects of low light intensity on broccoli microgreens growth and phytochemicals. Agronomy 2021, 11, 537. [Google Scholar] [CrossRef]
  49. Liu, J.; Li, Z.; Ghanizadeh, H.; Kerckhoffs, H.; Sofkova-Bobcheva, S.; Wu, W.; Wang, X.; Liu, Y.; Li, X.; Zhao, H.; et al. Comparative genomic and physiological analyses of a superoxide dismutase mimetic (SODm-123) for its ability to respond to oxidative stress in tomato plants. J. Agri. Food Chem. 2020, 68, 13608–13619. [Google Scholar] [CrossRef]
  50. Dai, A.-H.; Nie, Y.-X.; Yu, B.; Li, Q.; Lu, L.-Y.; Bai, J.-G. Cinnamic acid pretreatment enhances heat tolerance of cucumber leaves through modulating antioxidant enzyme activity. Environ. Exp. Bot. 2012, 79, 1–10. [Google Scholar] [CrossRef]
  51. Yan, N.; Xu, X.F.; Wang, Z.D.; Huang, J.Z.; Guo, D.P. Interactive effects of temperature and light intensity on photosynthesis and antioxidant enzyme activity in Zizania latifolia Turcz. plants. Photosynthetica 2013, 51, 127–138. [Google Scholar] [CrossRef]
  52. Zhou, Q.; Zhao, F.; Zhang, H.; Zhu, Z. Responses of the growth, photosynthetic characteristics, endogenous hormones and antioxidant activity of Carpinus betulus L. seedlings to different light intensities. Front. Plant Sci. 2022, 13, 1055984. [Google Scholar] [CrossRef] [PubMed]
  53. Ali, M.B.; Hahn, E.-J.; Paek, K.-Y. Effects of light intensities on antioxidant enzymes and malondialdehyde content during short-term acclimatization on micropropagated Phalaenopsis plantlet. Environ. Exp. Bot. 2005, 54, 109–120. [Google Scholar] [CrossRef]
  54. Lu, Y.; Guo, X. The effect of light in vtamin C metabolism regulation and accumulation in mung bean (Vigna radiata) germination. Plant Foods Hum. Nutr. 2020, 75, 24–29. [Google Scholar] [CrossRef]
Figure 1. (A) An overview of the artificial climate chamber used to conduct the experiments. (B) An overview of the grass blanket created by the intertwined barley root system. (CE) Fodder barley grown hydroponically under 0, 100, and 300 μmol/m2/s, respectively. (F) Barley seedlings were grown under different light intensities (L0, control treatment), 100 μmol/m2/s (L1), 200 μmol/m2/s (L2), and 300 μmol/m2/s (L3) at the fifth day after treatment.
Agronomy 14 01099 g001
Figure 2. The growth index of hydroponic barley in the 0 μmol/m2/s (L0, control treatment), 100 μmol/m2/s (L1), 200 μmol/m2/s (L2), and 300 μmol/m2/s (L3) treatments. The bars within each growth component sharing a similar letter are not significantly different at a 5% level of probability, according to Duncan’s new multiple range test.
Agronomy 14 01099 g002
Figure 3. The biomass of hydroponic barley in the 0 μmol/m2/s (L0, control treatment), 100 μmol/m2/s (L1), 200 μmol/m2/s (L2), and 300 μmol/m2/s (L3) treatments. The bars within each growth component sharing a similar letter are not significantly different at a 5% level of probability, according to Duncan’s new multiple range test.
Agronomy 14 01099 g003
Figure 4. The photosynthetic parameter of barley in the 0 μmol/m2/s (L0, control treatment), 100 μmol/m2/s (L1), 200 μmol/m2/s (L2), and 300 μmol/m2/s (L3) treatments. (A) A: net photosynthesis rate. (B) Ci: intercellular CO2. (C) E: evaporation. (D) Gs: stomatal conductance. (E) WUE: water use efficiency. (F) SPAD: relative chlorophyll content. The bars within each figure sharing a similar letter are not significantly different at a 5% level of probability, according to Duncan’s new multiple range test.
Agronomy 14 01099 g004
Figure 5. The effect of different levels of light intensity on ether extract (EE), crude ash (CA), crude fiber (CF), crude protein (CP), neutral detergent fiber (NDF), and acidic detergent fiber (ADF) in stems and leaves in the 0 μmol/m2/s (L0, control treatment), 100 μmol/m2/s (L1), 200 μmol/m2/s (L2), and 300 μmol/m2/s (L3) treatments. The bars within each nutrient component sharing a similar letter are not significantly different at a 5% level of probability, according to Duncan’s new multiple range test.
Agronomy 14 01099 g005
Figure 6. The effect of different levels of light intensity on ether extract (EE), crude ash (CA), crude fiber (CF), crude protein (CP), neutral detergent fiber (NDF), and acidic detergent fiber (ADF) in roots in the 0 μmol/m2/s (L0, control treatment), 100 μmol/m2/s (L1), 200 μmol/m2/s (L2), and 300 μmol/m2/s (L3) treatments. The bars within each nutrient component sharing a similar letter are not significantly different at a 5% level of probability, according to Duncan’s new multiple range test.
Agronomy 14 01099 g006
Figure 7. (A) Amino acid contents of hydroponic barley grass in the 0 μmol/m2/s (L0, control treatment), 100 μmol/m2/s (L1), 200 μmol/m2/s (L2), and 300 μmol/m2/s (L3) treatments. (B) TAAs = total amino acids and EAAs = essential amino acids. (C) Functional amino acid. The bars present the standard error of the mean. The bars within each amino acid sharing a similar letter are not significantly different at a 5% level of probability, according to Duncan’s new multiple range test.
Agronomy 14 01099 g007aAgronomy 14 01099 g007b
Figure 8. (A,B) The activity of superoxide dismutase (SOD) and peroxidase (POD). (C,D) The content of vitamins C and E in hydroponic fodder barley in the 0 μmol/m2/s (L0, control treatment), 100 μmol/m2/s (L1), 200 μmol/m2/s (L2), and 300 μmol/m2/s (L3) treatments. The bars present the standard error of the mean. The bars sharing a similar letter are not significantly different at a 5% level of probability, according to Duncan’s new multiple range test.
Agronomy 14 01099 g008
Figure 9. A biplot based on the first two dimensions of the principal component analysis (PCA) of fodder barley grown hydroponically under 0 μmol/m2/s (L0, control treatment), 100 μmol/m2/s (L1), 200 μmol/m2/s (L2), and 300 μmol/m2/s (L3).
Agronomy 14 01099 g009
Table 1. The scores of the principal component analysis of fodder barley grown hydroponically under different light intensity treatments.
TreatmentsScore of Extracted Reference Factors for Each Treatment
Y (i,1)Y (i,2)Overall Score
L0−5.4413−1.2266−3.2550
L10.52901.07490.5984
L21.30893.37871.6926
L33.6035−3.22710.9640
Disclaimer/Publisher’s Note: The statements, opinions and data contained in all publications are solely those of the individual author(s) and contributor(s) and not of MDPI and/or the editor(s). MDPI and/or the editor(s) disclaim responsibility for any injury to people or property resulting from any ideas, methods, instructions or products referred to in the content.

