Article

Reduced Translocation Confers Paraquat Resistance in Plantago lanceolata

1
Department of Agronomy, University of Stellenbosch, Stellenbosch 7600, South Africa
2
Radioanalysis, South African Nuclear Energy Corporation, Pelindaba 0240, South Africa
3
Radiochemistry, South African Nuclear Energy Corporation, Pelindaba 0240, South Africa
*
Author to whom correspondence should be addressed.
Agronomy 2024, 14(5), 977; https://doi.org/10.3390/agronomy14050977
Submission received: 27 February 2024 / Revised: 23 April 2024 / Accepted: 4 May 2024 / Published: 6 May 2024

Abstract

:
Ribwort plantain (Plantago lanceolata L.) is a common weed in the winter rainfall region of South Africa. This weed is widespread across vineyards, orchards, and roadsides in the region. The weed has already evolved resistance to glyphosate and paraquat; however, the mechanism of paraquat resistance has not been documented. This study aimed to investigate the resistance mechanisms in this resistant (R) biotype. Dose–response trials conducted with R biotypes from the Robertson area reconfirmed paraquat resistance. Dose–response trials established that the paraquat rate causing 50% mortality (LD50) for the R biotype is three times greater than for the susceptible (S) biotype. To find out how paraquat affected the photosynthetic performance of P. lanceolata, the quantum yield of photosystem II was measured. The photosystem reaction centres of the R biotype recovered 24 h after paraquat treatment. To evaluate paraquat transport in the plant cell, selective transport inhibitors were applied. Plantago lanceolata (S) biotypes had the highest electrolyte leakage after paraquat treatment. A combined radio/UV-HPLC was used for the separation and identification of paraquat and its metabolites. Paraquat degradation was not observed, indicating that metabolism was not a resistance mechanism within the R biotype. To assess leaf absorption and translocation, [14C]-labelled paraquat was applied to fully expanded leaves. There were no significant differences in paraquat absorption. However, paraquat translocation differed significantly across the R and S biotypes, indicating that non-target site resistance through reduced paraquat translocation was the main mechanism of resistance in the R biotype. As the resistance of weed species to post-emergence herbicides continues to increase, achieving sustainable weed management necessitates the implementation of diversified weed control strategies.

1. Introduction

Paraquat (1,1′-dimethyl-4,4′-bipyridynium dichloride) is a photosystem I-electron diverting herbicide belonging to the bypyridilium or bipyridinium herbicide family [1,2]. It is a fast-acting, contact, post-emergence herbicide that offers broad-spectrum weed control [2,3,4]. Paraquat diverts electrons from photosystem I to form reactive oxygen species, primarily superoxide [2,5], which causes the oxidative degradation of lipids and cell desiccation or death [2]. Globally, paraquat and its alternatives, glyphosate and glufosinate, are the most widely used non-selective herbicides [6]. Since its discovery in the 1950s, paraquat has been used extensively for weed control around the world [6].
Paraquat is a very effective non-selective post-emergence herbicide, but resistance to this herbicide has now been reported in many weed species [7]. To date, 31 paraquat-resistant weed species have been confirmed worldwide, but the mechanisms of resistance have been identified in only a small portion of these species [8].
Proposed mechanisms of paraquat resistance in weeds include enhanced reactive oxygen species scavenging ability, reduced translocation, and enhanced sequestration [1]. Sequestration involves sequestering paraquat away from its target location in the chloroplast. The intracellular transport mechanisms involved in paraquat sequestration have also been the subject of several studies. For example, Hart et al. [9] demonstrated that paraquat was transported by a carrier system that normally transports diamines. Xi et al. [10] identified a plasma membrane-localized adenosine triphosphate binding-cassette (ABC) transporter as a paraquat transporter in plants.
More recently, in Arabidopsis, AtPQT11 (At1g01600), a member of the cytochrome P450s (CYP450s), was found to detoxify paraquat. The process involves demethylation (removing a methyl group from the paraquat ion). This is not surprising since CYP450s make up the biggest protein family and are known to demethylase and hydroxylase herbicides [3]. However, paraquat degradation has not been reported in ribwort plantain (Plantago lanceolata L.) (see [11,12] for a full review). It has been suggested that understanding paraquat resistance mechanisms will help with resistance management in weed species and potentially the development of paraquat-resistant crops [1].
P. lanceolata is an abundant and competitive weed in vineyards and orchards in the Robertson area [11,12]. Paraquat and glyphosate were effective in weed control until glyphosate-resistant biotypes of P. lanceolata were confirmed. Recently, the same biotype was confirmed to be resistant to paraquat [11,12]. Farmers reported that P. lanceolata seedlings survived post-emergence applications of paraquat in their orchards and vineyards. Therefore, this study aimed to characterize the mechanism that resulted in resistance to paraquat in P. lanceolata.

2. Materials and Methods

2.1. Seed Collection

Seeds of a susceptible (S) P. lanceolata biotype from mixed vegetation located in the Northwest province (26°42′ S, 27°06′ E) and seeds from a resistant (R) biotype (termed R2) located in a vineyard in the Robertson district of the Breede River valley (33°46′ S, 19°45′ E) were collected.

P. lanceolata Selection

The R biotype used in this study was confirmed to be glyphosate and paraquat-resistant (see [11,12] for a full review). Seeds were collected from plants that survived an initial 800 g a.i. ha−1 paraquat application in the field. The seedlings established from this seed were sprayed with 800 g a.i. ha−1 to eliminate susceptible individuals. The seeds from the survivors were planted in isolation and allowed to outcross, as P. lanceolata is self-incompatible [13]. Thereafter, the R biotype was sprayed with the same dose (800 g a.i. ha−1) of paraquat [14]. This process was repeated until the fourth generation. Seeds were collected from approximately 48 individuals in each generation (based on Heap [15]).

2.2. Dose-Response Trials

Seeds from the resulting F4 generation were broadcast into large containers containing coarse sand and placed in a glasshouse. After seven days, four seedlings were transplanted into small plastic pots (64 cm2) also filled with coarse sand. The seeds and seedlings were irrigated with a standard Steiner nutrient solution [16]. The glasshouse temperature was set at 20/25 °C with a 12/12 h night/day photoperiod and 1000 µmol m−2 s−1 photosynthetically active radiation (PAR) for seed germination and for the dose–response experiments. Plants were treated with seven doses of paraquat (Gramoxone®, 200 g a.i. L−1, Syngenta, Midrand, South Africa) at the two- to three-leaf stage using a custom-built pneumatic pot sprayer (Stellenbosch University, Department of Engineering) with a speed of 1 m s −1, calibrated to deliver 400 L ha−1 of the solutions at 200 KPa. The paraquat dosages were 0, 100, 200 (recommended rate), 400, 800, 1600, 3200, and 6400 g a.i. ha−1. Agral® adjuvant (0.05%, Syngenta, Midrand, South Africa) was added to all spray solutions. There were six replicate pots for each herbicide dose, each pot containing four seedlings. The dose–response trial was a factorial experiment arranged in a completely randomised design (CRD) with six replicates. Dose–response trials were conducted at the Stellenbosch University Welgevallen Experimental Farm (33°56′ S, 18°51′ E).

2.3. Quantum Efficiency of Open Photosystem II

The R and S biotypes were grown as described in the dose–response trials. At two- to three-leaf stage, the youngest fully expanded leaf was labelled with a marker for subsequent ratio of variable to maximum fluorescence yield (Fv/Fm) measurements. Paraquat (200 g a.i. L−1) was then applied to whole plants. The marked leaves were dark-adapted for one hour using dark-adaption clips (Hansatech Instruments Ltd., Pentney, UK) before chlorophyll fluorescence measurement with a chlorophyll fluorometer monitoring system (Hansatech Instruments Ltd., Pentney, UK) [17]. Fluorescence was measured before and at 0.5, 1, 2, 5, 24, and 48 h after paraquat treatment (HAPT). The experiment was arranged in a CRD with eight replications and was repeated.

2.4. Paraquat Transport

Using the approach outlined by Brunharo and Hanson [17], paraquat in the plant cell was assessed. Untreated R and S biotypes were harvested at the two- to three-leaf stage. The leaves were then divided into 2 cm2 segments and repeatedly rinsed with deionized water to remove excess electrolytes. Additionally, 100 micromolar (μM) doses of putrescine, sodium orthovanadate, potassium nitrate, and verapamil (Sigma-Aldrich, Johannesburg, South Africa) were added. Also, 0.1% Triton X-100, 1 μM 2-(N-morpholino) ethane sulfonic acid pH 6.5 (MES), and 2% sucrose (w/w) were added. The samples were washed, placed in vials, and 25 μM paraquat was added. Plantago lanceolata R and S controls (without selective transport inhibitors) that were untreated and treated with paraquat were also included. Glass vials were arranged in a CRD layout in the growth chamber. The growth chamber was set at 24 °C, with a 14 h darkness period. After 14 h, 1000 µmol m−2 s−1 PAR was applied. Conductivity was measured in the dark at 0, 11, and 14 h after treatment, and in the light at 19, 22, and 26 h after treatment. To convert the data to a percentage, the resulting conductivity value was divided by the maximum treatment conductivity that could be obtained across both populations and treatments.

2.5. Absorption and Translocation of [14C]-Paraquat

One microliter (µL) of [14C]-labelled paraquat 1.12 MBq (Syngenta, Basel, Switzerland), formulated as Gramoxone®, together with 0.05% (v/v) Agral® adjuvant, was applied on the midrib (between the apex and petiole) of a young leaf of each plant using a microliter pipette. Twenty-four hours after application, R and S biotypes were removed from the soil and divided into four parts, i.e., treated leaves, untreated leaves, roots, and leaf wash (collected after rinsing the treated leaf of each plant with 10 mL 0.1% (v/v) Triton X-100 (Sigma-Aldrich, Johannesburg, South Africa)). The plant sections were oven-dried at 90 °C for 24 h and then subjected to combustion in a biological sample oxidizer (OX 501, RJ Harvey Instrument Corporation, Tappan, NY, USA). The samples were combusted for four minutes using a 370 cc/min flow rate under atmospheric oxygen to a maximum temperature of 900 °C. After combustion, the [14C]-labelled paraquat fractions were automatically trapped into 20 mL vials containing a liquid scintillation counter cocktail (Oxysolve-C). The radioactivity of the leaf sections and leaf wash was then quantified by ultra-low-level liquid scintillation spectrometry (Quantulus 1220, Perkin-Elmer, Turku, Finland). Herbicide translocation was expressed as a percentage of total applied radioactivity [14].

2.6. Paraquat Metabolism

The [14C]-labelled paraquat was applied as described in the absorption and translocation experiment. Plants were dried, and a portable blender was used to grind whole plants. Ten milliliters (10 mL) of methanol and hydrochloric acid at a ratio of 6:4 were used for extraction. Entire samples were transferred to 50 mL plastic tubes, which were then sonicated and centrifuged, after which 1 mL of aliquot was taken from the supernatant. Samples were drawn with a syringe equipped with a filter to remove particulate plant matter and then transferred to 2 mL high-performance liquid chromatography-ultraviolet (UV-HPLC) injection vials. For separation and identification of the parent compound and metabolites, a combined radio/UV-HPLC analysis was carried out using an Agilent 1200-series instrument coupled to a 6100 quadrupole-mass spectrometry detector (Agilent Technologies Inc., Wilmington, DE, USA), with an aligned diode array detector and β-radioactive detector (Ramona Star, Raytest, Straubenhardt, Germany) [17]. The method by Brunharo and Hanson [17] was modified such that the mobile phase consisted of a 10 mM ammonium formate adjusted to pH 3 (Solvent A) and 0.1% formic acid in acetonitrile (Solvent B). In addition, a gradient elution profile was set as follows: 5% (A), 95% (B) for 1 min, 10% (A), 90% (B) for 2 min, 25% (A), 75% (B) for 2.5 min, and 45% (A), 55% (B) for 5 min. From 6 to 15 min, the mobile phase composition was tuned to 5% (A) and 95% (B). The column used was Agilent ZORBAX SB-C18 (4.6 mm × 250 mm, with a 5 µm particle size). The flow rate was set to 1.0 mL/min and the column temperature to 30 °C. ULTIMA-FLOTM M, a liquid scintillation cocktail (PerkinElmer, Waltham, MA, USA), was used for the β radio-detector.

2.7. Phosphor Imaging

After treatment with [14C]-labelled paraquat as described in the absorption and translocation studies, plants were removed from the 64 cm2 pots and care was taken to separate the soil particles from the roots. Plants were then cleaned with 10 mL of 0.1% (v/v) Triton X-100 (Sigma Aldrich, Johannesburg, South Africa), and dried at 90 °C for 24 h. The next day the plants were evenly spread on clean white paper and then transferred to a 20 cm × 40 cm phosphor storage film for 24 h. The film was placed in the phosphor imager (Amersham Typhoon Biomolecular Imagers, GE Healthcare BioSciences Corporation, Marlborough, MA, USA) to develop an image and for visualization of herbicide translocation [14,18]. Following the development of the images, the plant parts were subsequently used for the absorption and translocation experiments.

2.8. Data Collection and Statistical Analysis

Survival was assessed on a scale of 0% to 100%, with 100% representing no visual injury and 0% representing complete plant mortality. Survival rates were then calculated for each population using the formula in Equation (1). The aboveground biomass (living and dead) was cut and oven-dried at 90 °C for two days.
Survival rate (%) = number of live plants in the experimental unit ÷ total number of plants in experimental unit × 100%
All of the experiments were conducted twice. There were no significant differences between repeated experiments; therefore, the data were pooled before statistical analysis. Normality and homogeneity were determined using Shapiro–Wilk and Leven’s tests, respectively. The analysis of variance assumptions was performed under arcsine transformation. Analysis of variance was then used on the transformed values; however, values were transformed back for the purpose of reporting the results [19]. A t-test was employed for the translocation studies. A log-logistic model in R software version 4.0.1 was used to calculate the paraquat rate causing 50% mortality (LD50) or growth reduction (GR50) for each biotype.
Datasets were fitted to log-logistic models:
y = D 1 + exp ( b ( log x log L D 50 )
y = D 1 + exp ( b ( log x log G R 50 )
where D = upper limit, B = slope, and LD50 and GR50 = rate yielding 50% response as described by Ritz et al. [20].

3. Results

3.1. Survival and Biomass (%)

The LD50 value for the S biotype was 191.81 g a.i. ha−1, and the LD50 value for the R biotype was 688.99 g a.i. ha−1 (Table 1). The ratio of R/S LD50 values indicates that the R biotype was three times more resistant to paraquat (Figure 1 and Table 1).
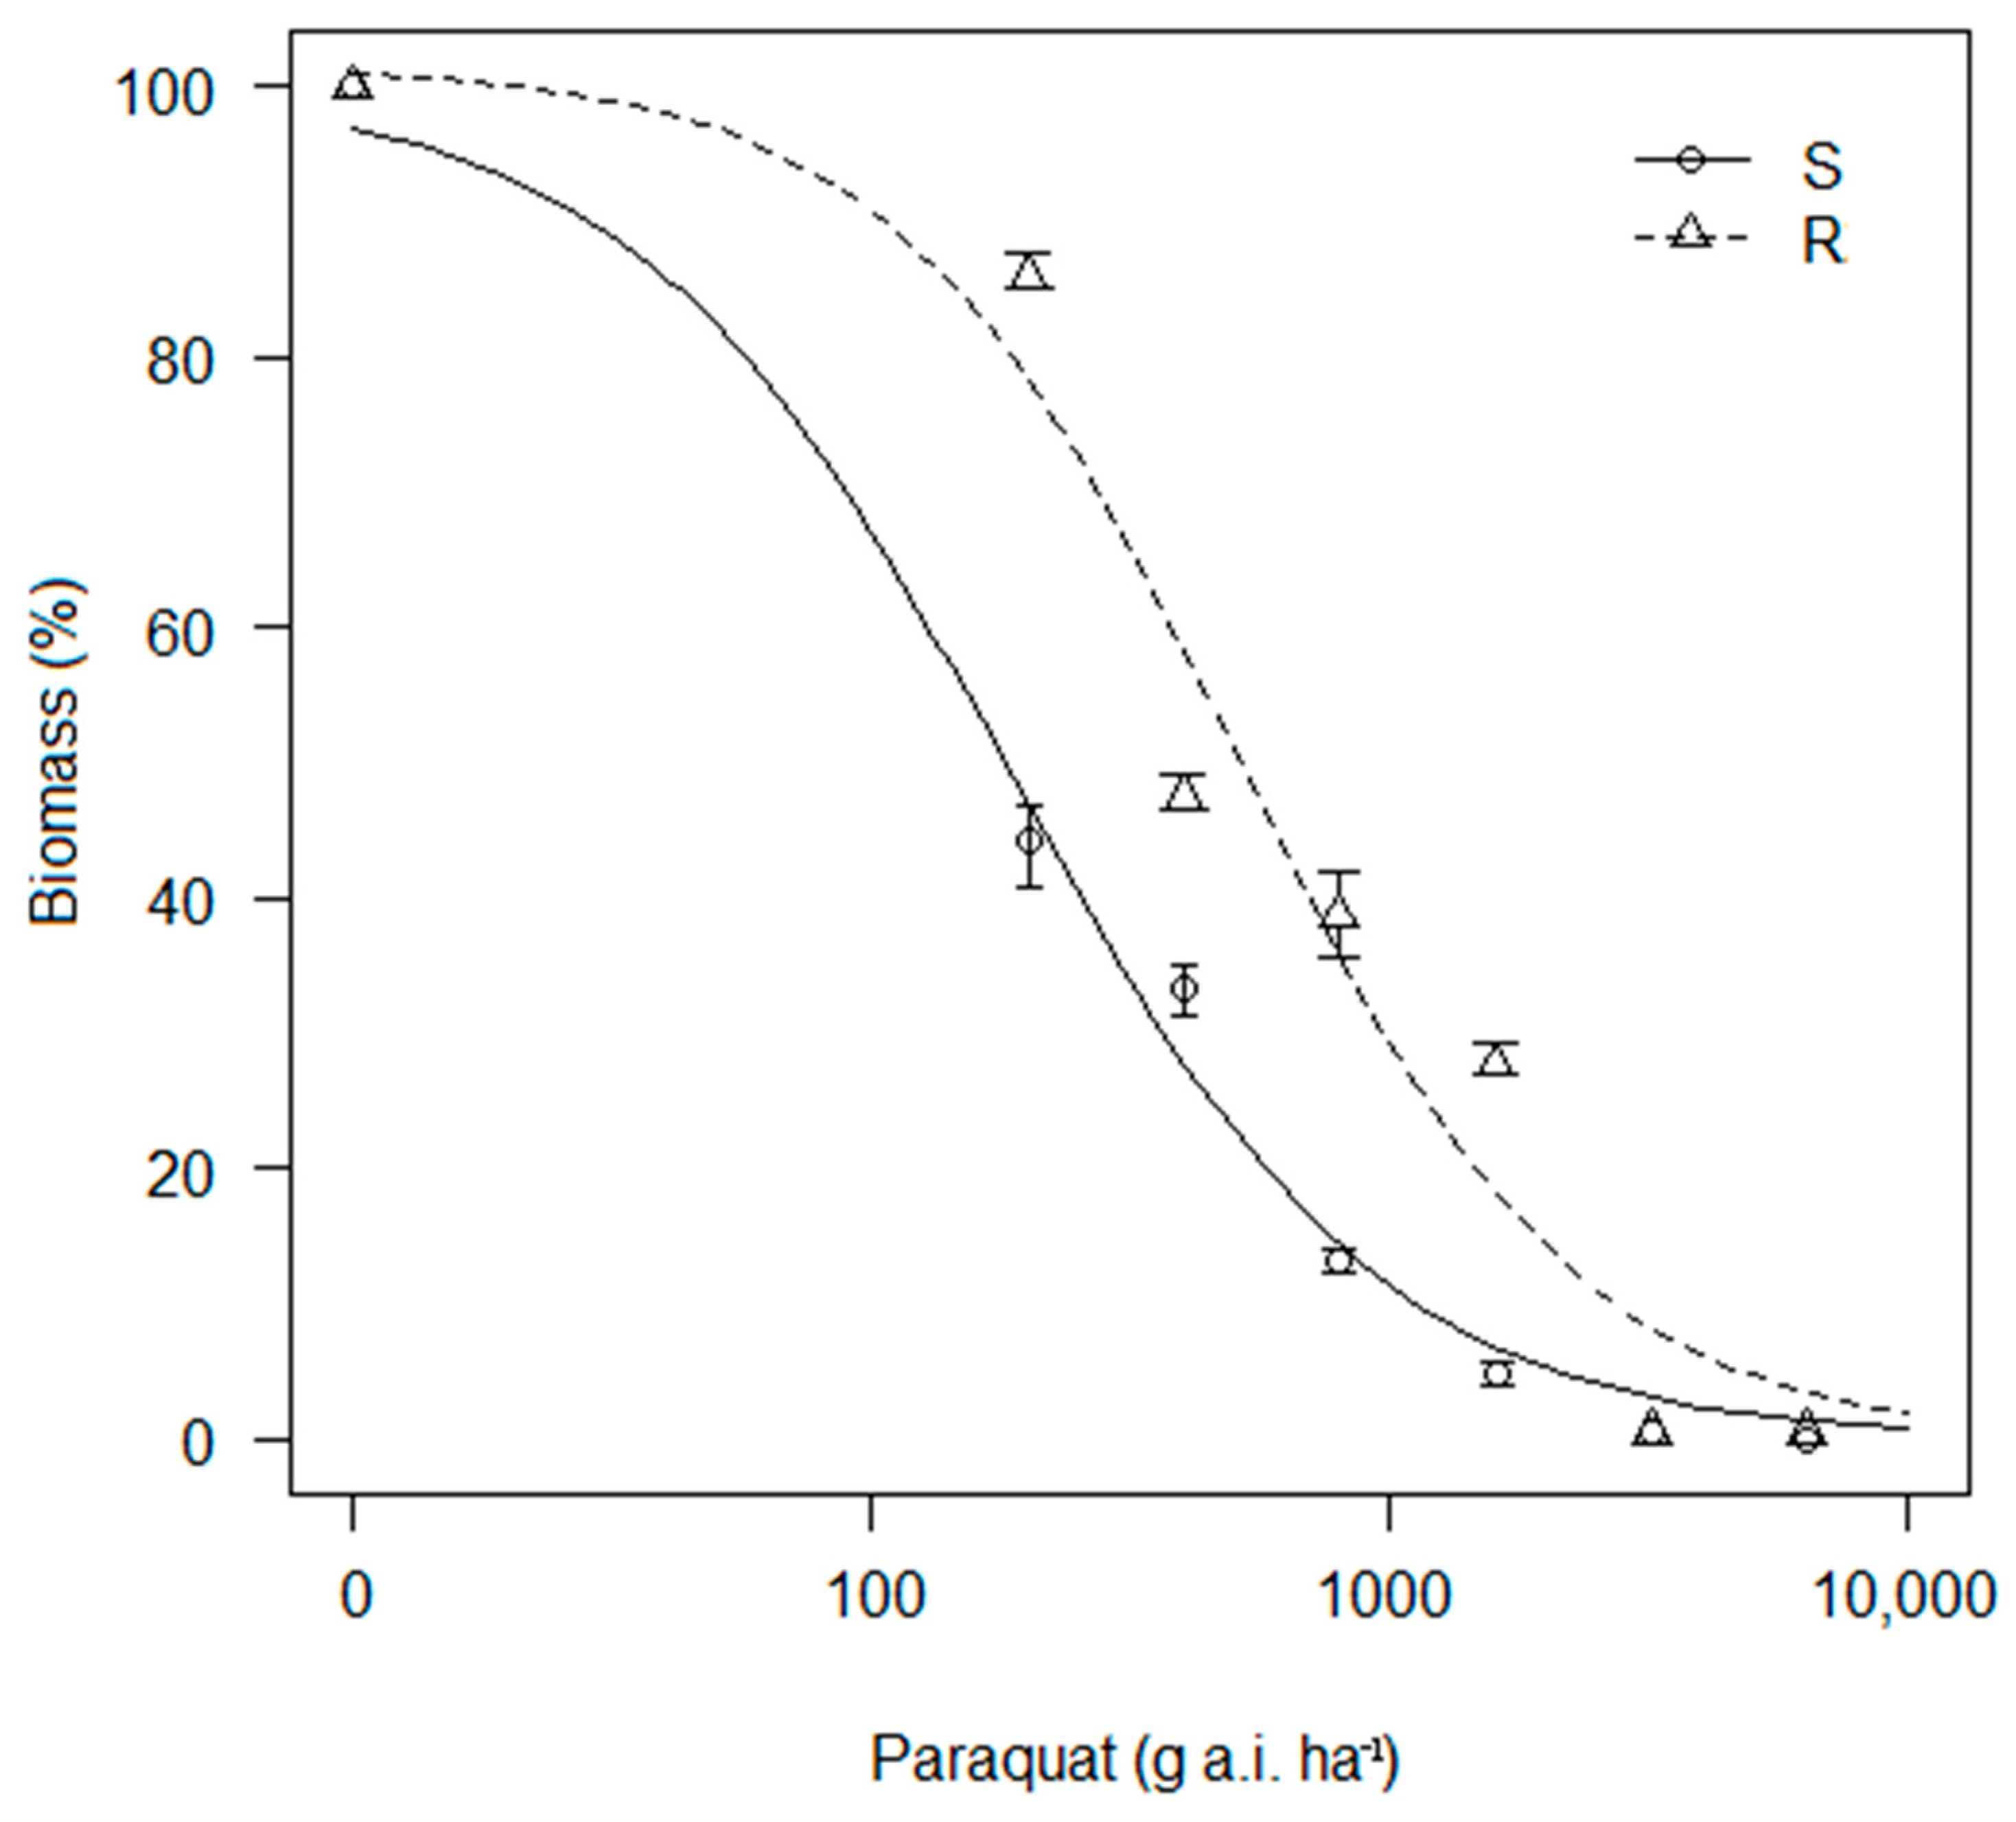
Biomass decreased with increasing paraquat rates for both the R and S biotypes; however, the R biotype biomass accumulation was markedly less reduced by paraquat (Figure 2). An R/S ratio of 2.78 was noted for the R biotype in response to paraquat applications (Table 2).

3.2. Quantum Efficiency of Open Photosystem II

Paraquat rates inflicted damage to the photosystem reaction centres of P. lanceolata biotypes, but the R recovered gradually in the subsequent 24 to 48 h. These suggest the presence of paraquat in the chloroplast in both the R and S biotypes (Figure 3). After 48 h, there were clear differences in the Fv/Fm of the R and the S biotypes at the different paraquat dosages. However, quenching of chlorophyll fluorescence in the S biotype indicated a lack of sequestration, which was also evident from the increased levels of damage observed in the S biotype.

3.3. Paraquat Transport

After 14 h, the R and S biotype electrolyte leakage increased. The R biotype treated with verapamil showed lower electrolyte leakage (Figure 4), whilst the S biotype treated with paraquat had the highest electrolyte leakage. However, the addition of putrescine to the R biotype resulted in electrolyte leakage similar to the S biotype (Figure 4). This suggests that a polyamine transporter is involved in the transport of paraquat to the vacuole.

3.4. Leaf Uptake and Translocation of [14C]-Labelled Paraquat

The applied [14C]-labelled paraquat was absorbed equally by the R and S biotypes because there was no significant difference in leaf uptake (Table 3). A greater amount of [14C]-labelled paraquat translocated to the roots of the S biotype and much less [14C]-labelled paraquat translocated to the roots of the R biotype (Table 3). Similarly, in the R biotype, much more [14C]-labelled paraquat remained in the treated leaf (Table 3).

3.5. Paraquat Metabolism

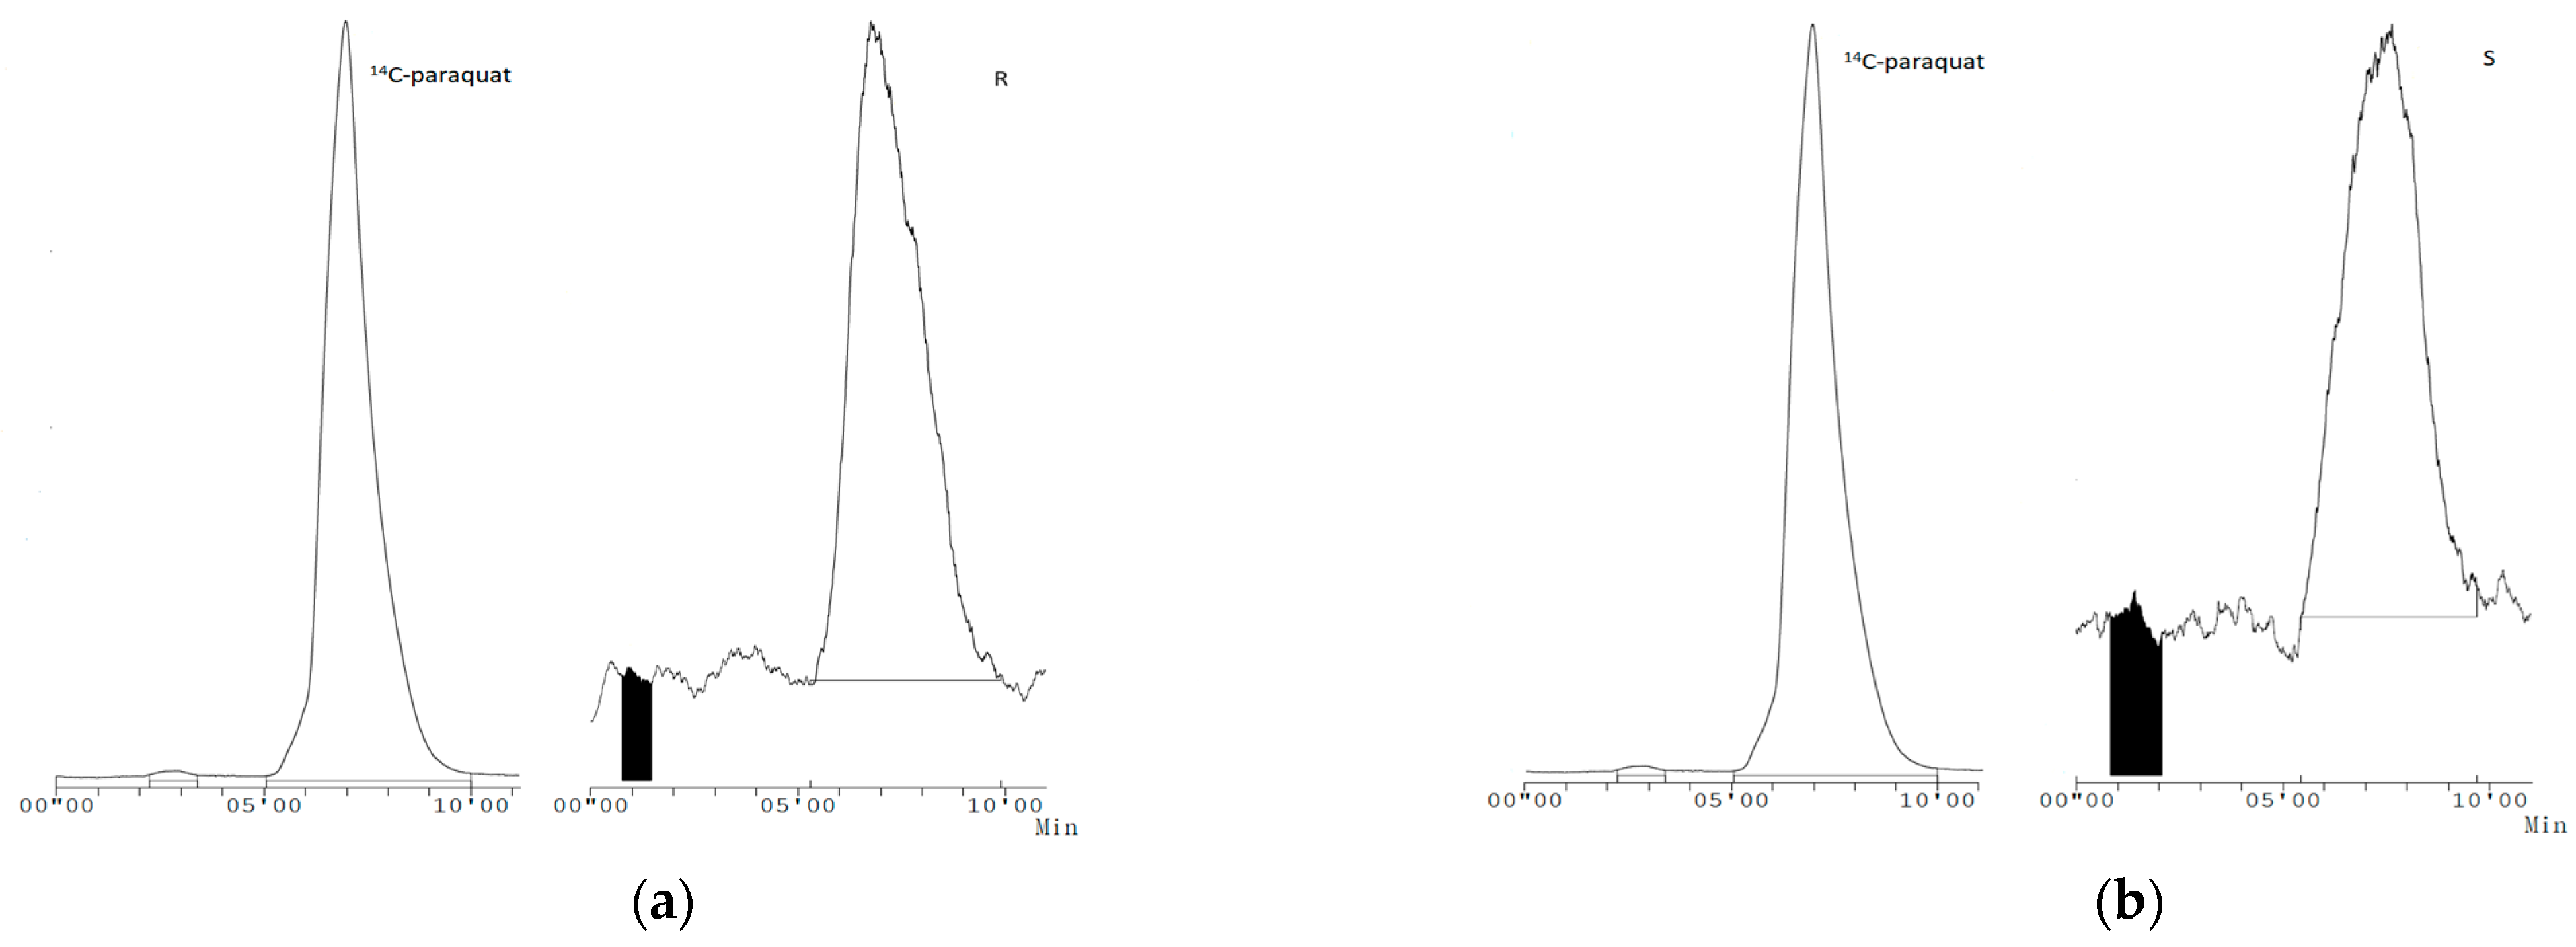
The radio chromatograms showed [14C]-labelled paraquat retention time (RT) at 6.4–8.4 min. Similar retention time peaks were observed for the R and S biotypes, and no other [14C]-labelled paraquat peaks were observed for the R and S biotypes, indicating that paraquat metabolism is not a resistance mechanism within the biotypes (Figure 5a,b).

3.6. Phosphor Imaging

The biotypes had wilted significantly by the time the phosphor images were generated. This resulted in poor phosphor images and consequently, no actual photographs of the plants were taken. However, even in such conditions, differences were noted with regard to paraquat translocation in the R and S biotypes (Supplementary Information, Figure S1a,b). This validated the leaf uptake and translocation study, which showed reduced translocation in the R biotypes. The midpoint where the [14C]-labelled paraquat was applied to the P. lanceolata R biotype indicated a higher concentration of radioactivity, as noted by the darker shade on the phosphor screen (Figure S1a). Much more [14C]-labelled paraquat was seen on the other untreated leaves of the S biotypes, as noted by the intensely shaded areas on the untreated foliage, which were clearly visible in the phosphor images in the S biotypes compared to the R biotypes. This means that much more radiolabelled paraquat translocated from the point of application in S biotypes relative to the R biotype (Figure S1b). The differences between the R and S biotypes point to non-target site resistance (NTSR). This is because reduced herbicide translocation is characteristic of NTSR mechanisms.

4. Discussion

The dose–response trials reconfirmed paraquat resistance in the R biotype. The R biotype is three-fold more resistant to paraquat. Only two other studies have confirmed paraquat resistance in P. lanceolata (see [11,12] for a full review). The R/S ratios from those studies are comparable to the R/S ratios in this study. In a similar paraquat dose-response study, Tehranchian et al. [21] reported an R/S ratio of four in annual ryegrass biotype, which is also comparable to this study. However, other paraquat resistant biotypes were reported to be 20 to 32 times more resistant to paraquat than the S biotype [14,17,22]. Palma-Bautista [23] reported that 2077.1 g a.i. ha−1 (80 times the recommended rate) was required to obtain an LD50 in Conyza bonariensis R biotypes, whereas lower rates of 24.6 g a.i. ha−1 achieved an LD50 in the S biotypes. The observed differences in R/S ratios between the biotypes are due to a variety of factors, including genetic variability, inherent resistance mechanisms, and selection pressure. High selection pressure due to frequent herbicide exposure and intensity may lead to high selection pressure and thus, the development of biotypes with higher R/S ratios [17,24].
The Fv/Fm results indicate that the efficiency of photosystem II in the biotypes is reduced by higher paraquat rates compared to lower rates [17]. The R biotypes showed rapid damage to the photosystem reaction centres after paraquat application, and then gradually recovered after 24 h. Similar to the current study, Jalaludin et al. [25] reported rapid desiccation and necrosis in Eleusine indica R biotypes after paraquat application, followed by vigorous regrowth after two days. These findings indicate that paraquat resistance does not involve its exclusion in the plant cell; instead, paraquat reaches the chloroplasts in both the R and S biotypes. The difference is that the photosynthetic apparatus of the R biotype gradually recovers, suggesting slow sequestration [17].
P. lanceolata R biotypes had the lowest electrolyte leakage, but the addition of putrescine, a polyamine transport inhibitor, resulted in a similar leakage percentage to the S biotypes, indicating that in R biotypes, paraquat was sequestered by the diamine carrier system [9]. Our findings corroborate an earlier study evaluating annual ryegrass [17]. However, Xi et al. [10] reported that mutations of adenosine triphosphate (ATP)-binding cassette granted paraquat resistance by reducing paraquat uptake into Arabidopsis thaliana cells. Based on the results of the current study, it is doubtful that the ATP-binding cassette confers paraquat resistance in P. lanceolata biotypes, because inhibitors of ATP-binding cassettes did not result in the reversal of paraquat resistance [17].
The phosphor imaging results corroborated earlier studies of reduced [14C]-labelled paraquat translocation evaluating annual ryegrass R biotypes from South Africa [14,18]. After 24 h, when the phosphor images were generated, P. lanceolata biotypes began to display substantial whole-plant damage and wilting. Wilting after herbicide application can occur even in R biotypes. Tehranchian et al. [21] observed such symptoms in all R and S annual ryegrass biotypes. Yu et al. [14] reported wilting of the S biotypes and upper part wilting of the R biotypes. The biotypes in the study by Yu et al. [14] had a much higher R/S ratio (24). The P. lanceolata biotypes in this study had a lower R/S ratio (3), which may help explain why they wilted much sooner. However, another study by Yu et al. [26] did not observe wilting and/or desiccation of both paraquat-treated and untreated leaves in resistant annual ryegrass biotypes.
There was no significant difference in [14C]-labelled paraquat leaf uptake between the R and S biotypes. This result suggests that paraquat was equally absorbed, as also reported by Yu et al. [14]. Conversely, [17] reported faster paraquat absorption in the S biotypes relative to the R biotypes. Our phosphor imaging results suggest that reduced translocation is the mechanism of paraquat resistance in the R biotype. This is a qualitative assessment, but translocation and absorption studies have confirmed that in the P. lanceolata R biotype, more [14C]-labelled paraquat stayed in the treated leaves, also indicating reduced paraquat translocation. The available literature demonstrates that the quantification of [14C] is rarely inconsistent with phosphor imaging results (e.g., Yu et al. [27] and Fernández-Moreno et al. [28]) and thus reinforces that reduced paraquat translocation is the mechanism for resistance in the R biotype. Similarly, reduced paraquat translocation was found to be the mechanism of resistance in annual ryegrass biotypes from South Africa [14,18]. Tehranchian et al. [21] reported that treated leaves of the R biotypes retained more [14C]-labelled paraquat relative to the S biotypes. Brunharo and Hanson [17] also reported restricted paraquat translocation in annual ryegrass R biotypes.
Metabolic resistance appears not to be the mechanism conferring paraquat resistance in the R biotypes from the Robertson area. Ismail et al. [29] and Brunharo and Hanson [17] reported no paraquat metabolites in Crassocephalum crepidioides and annual ryegrass, respectively. Hawkes [6] reported that sequestration and metabolism were possible mechanisms of paraquat resistance and could occur simultaneously in one plant. However, the main mechanism of paraquat resistance has been reported to be reduced translocation, presumably due to paraquat sequestration [14]. Paraquat sequestration has been proposed to confer resistance in many species [17,24]. This appears to be the case for the R biotype in this study.
The R biotype used in our study was also proven to be resistant to glyphosate. Reduced glyphosate translocation and a point mutation in the 5-enolpyruvylshikimate-3-phosphate synthase (EPSPS) gene, resulting in an amino acid substitution of proline to serine at position 106 (see [11,12] for a full review), were found to be the mechanisms causing glyphosate resistance. It is worth mentioning that reduced glyphosate and paraquat translocation are independent mechanisms, and both mechanisms can exist in the same plant [24]. Including the glyphosate mechanisms, a total of three mechanisms conferring glyphosate and paraquat resistance were displayed by the one R biotype from the Robertson area. Reduced glyphosate and paraquat translocation have been identified as the mechanisms of glyphosate and paraquat resistance in other species [17,26].
Like the R biotype, the majority of the other weed species in the Robertson region have developed glyphosate resistance. This is a worrying trend since it threatens two of the most essential herbicides. Furthermore, there are currently no integrated weed management (IWM) strategies being implemented in the Robertson area. The focus has mostly been on exploring alternative herbicides and herbicide mixtures. Since P. lanceolata is resistant to glyphosate and paraquat, other herbicides such as 2-methyl-4-chlorophenoxyacetic acid (MCPA), carfentrazone-ethyl, glufosinate, diquat and terbuthylazine + S-metolachlor have been applied alone or as a mixture, and all but one (MCPA) provided sufficient P. lanceolata control (see [11,12] for a full review). Although P. lanceolata is present in most fields in the Robertson area, the use of selective herbicides may not be feasible because there are other grasses and broad-leaved weeds such as Lolium spp. (annual ryegrass), Eleusine spp. (goosegrass), Phalaris spp. (canary grass), Avena spp. (wild oats), Conyza spp. (horseweed), Raphanus raphanistrum L. (wild radish), Chenopodium album L. (lambsquarters), and Amaranthus spp. (pigweed) that may not be controlled by the available selective herbicides. Therefore, selective herbicides, mixtures, and alternatives may only delay resistance; for long-term sustainable weed management, IWM strategies are a better option [11,12], and growers in the Robertson area should urgently adopt them.
The first case of reduced paraquat translocation was confirmed in a P. lanceolata R biotype. Paraquat sequestration by the diamine carrier system coupled with reduced paraquat translocation points to paraquat resistance due to vacuolar sequestration.

Supplementary Materials

The following supporting information can be downloaded at: https://www.mdpi.com/article/10.3390/agronomy14050977/s1, Figure S1: Translocation pattern of [14C]-paraquat in six individual plants of (S1a) resistant (R) and (S1b) susceptible (S) Plantago lanceolata biotypes. The [14C]-labelled paraquat was applied as a 1 µL droplet to the midrib (arrowed) of one leaf of each plant. Three to six-week-old (8–15 cm) plants were treated with [14C]-paraquat and harvested one day after treatment for phosphor imaging.

Author Contributions

Conceptualization, V.N., D.K., B.M.-P., P.J.P., E.E.P. and M.S.S.; Methodology, V.N. and M.S.S.; formal analysis, V.N., B.M.-P. and D.K.; investigation, V.N., D.K., B.M.-P. and M.S.S.; data curation, V.N.; writing—original draft preparation, V.N.; writing—review and editing, V.N., D.K., B.M.-P., E.E.P., P.J.P. and M.S.S.; supervision P.J.P. and E.E.P.; funding acquisition, V.N., P.J.P. and E.E.P. All authors have read and agreed to the published version of the manuscript.

Funding

The first author is grateful to Syngenta (UK) and the Southern African Weed Science Society (SAWSS) for financial support. MS Sonopo is grateful to the National Research Foundation (NRF) NEP grant number 82514 and Thuthuka for funding the cocktail and the biological sample oxidizer.

Data Availability Statement

The data supporting the conclusions of this article will be made available by the authors on request.

Acknowledgments

All the authors would also like to thank Nuclear Medicine Research Infrastructure (NuMeRI) for providing access to the phosphor imager.

Conflicts of Interest

The authors declare no conflicts of interest. The funders had no role in the design of the study; in the collection, analyses, or interpretation of data; in the writing of the manuscript; or in the decision to publish the results.

References

  1. Nazish, T.; Huang, Y.J.; Zhang, J.; Xia, J.Q.; Alfatih, A.; Luo, C.; Cai, X.T.; Xi, J.; Xu, P.; Xiang, C.B. Understanding paraquat resistance mechanisms in Arabidopsis thaliana to facilitate developing paraquat-resistant crops. Plant Commun. 2022, 25, 100321. [Google Scholar] [CrossRef] [PubMed]
  2. Xia, J.Q.; Nazish, T.; Javaid, A.; Ali, M.; Liu, Q.Q.; Wang, L.; Zhang, Z.Y.; Zhang, Z.S.; Huang, Y.J.; Wu, J.; et al. A gain-of-function mutation of the MATE family transporter DTX6 confers paraquat resistance in Arabidopsis. Mol. Plant 2021, 14, 2126–2133. [Google Scholar] [CrossRef] [PubMed]
  3. Huang, Y.J.; Huang, Y.P.; Xia, J.Q.; Fu, Z.P.; Chen, Y.F.; Huang, Y.P.; Ma, A.; Hou, W.T.; Chen, Y.X.; Qi, X.; et al. AtPQT11, a P450 enzyme, detoxifies paraquat via N-demethylation. J. Genet. Genom. 2022, 49, 1169–1173. [Google Scholar] [CrossRef]
  4. Luo, Q.; Chen, S.; Zhu, J.; Ye, L.; Hall, N.D.; Basak, S.; McElroy, J.S.; Chen, Y. Overexpression of EiKCS confers paraquat-resistance in rice (Oryza sativa L.) by promoting the polyamine pathway. Pest Manag. Sci. 2022, 78, 246–262. [Google Scholar] [CrossRef] [PubMed]
  5. Asaduzzaman, M.; Koetz, E.; Wu, H.; Shephard, A. Paraquat resistance and hormetic response observed in Conyza sumatrensis (Retz.) E. Walker (tall fleabane) in Australian cotton cropping systems. Phytoparasitica 2022, 50, 269–279. [Google Scholar] [CrossRef]
  6. Hawkes, T.R. Mechanisms of resistance to paraquat in plants. Pest Manag. Sci. 2014, 70, 1316–1323. [Google Scholar] [CrossRef]
  7. Heap, I. The International Survey of Herbicide-Resistant Weeds. 2024. Available online: www.weedscience.org (accessed on 1 January 2024).
  8. Ghanizadeh, H.; Harrington, K.C. Non-target site mechanisms of resistance to herbicides. Crit. Rev. Plant Sci. 2017, 36, 24–34. [Google Scholar] [CrossRef]
  9. Hart, J.J.; DiTomaso, J.M.; Linscott, D.L.; Kochian, L.V. Transport interactions between paraquat and polyamines in roots of intact maize seedlings. Plant Physiol. 1992, 99, 1400–1405. [Google Scholar] [CrossRef]
  10. Xi, J.; Xu, P.; Xiang, C.B. Loss of AtPDR11, a plasma membrane localized ABC transporter, confers paraquat tolerance in Arabidopsis thaliana. Plant J. 2012, 69, 782–791. [Google Scholar] [CrossRef]
  11. Matshidze, M.M.; Ndou, V. Herbicide resistance cases in South Africa: A review of the current state of knowledge. S. Afr. J. Sci. 2023, 119, 11–12. [Google Scholar] [CrossRef]
  12. Matshidze, M.M.; Ndou, V. A bibliometric analysis of herbicide resistance in Africa. Sci. Afr. 2023, 22, e01899. [Google Scholar] [CrossRef]
  13. Sharma, N.; Koul, P.; Koul, A.K. Pollination biology of some species of genus Plantago L. Bot. J. Linn. Soc. 1993, 111, 129–138. [Google Scholar] [CrossRef]
  14. Yu, Q.; Cairns, A.; Powles, S. Glyphosate, paraquat and ACCase multiple herbicide resistance in a Lolium rigidum biotype. Planta 2007, 225, 499–513. [Google Scholar] [CrossRef]
  15. Heap, I. Identification and documentation of herbicide resistance. Phytoprotection 1994, 75, 85–90. [Google Scholar] [CrossRef]
  16. Steiner, A.A. A universal method for preparing nutrient solutions of a certain desired composition. Plant Soil 1961, 15, 134–154. [Google Scholar] [CrossRef]
  17. Brunharo, C.A.C.G.; Hanson, B.D. Vacuolar sequestration of paraquat is involved in the resistance mechanism in Lolium perenne L. spp. multiflorum. Front. Plant Sci. 2017, 8, 1485. [Google Scholar] [CrossRef]
  18. Eksteen, F.H. Resistance of Ryegrass (Lolium spp.) to Paraquat and Glyphosate in the Western Cape. Ph.D. Thesis, Stellenbosch University, Stellenbosch, South Africa, 2007. [Google Scholar]
  19. Meyer, C.; Norsworthy, J.; Kruger, G. Antagonism in mixtures of glufosinate + glyphosate and glufosinate + clethodim on grasses. Weed Technol. 2021, 35, 12–21. [Google Scholar] [CrossRef]
  20. Ritz, C.; Baty, F.; Streibig, J.; Gerhard, D. Dose–response analysis using R. PLoS ONE 2015, 10, e0146021. [Google Scholar] [CrossRef]
  21. Tehranchian, P.; Nandula, V.; Jugulam, M.; Putta, K.; Jasieniuk, M. Multiple resistance to glyphosate, paraquat and ACCase-inhibiting herbicides in Italian ryegrass populations from California: Confirmation and mechanisms of resistance. Pest Manag. Sci. 2018, 74, 868–877. [Google Scholar] [CrossRef]
  22. Zobiole, L.H.S.; Pereira, V.G.C.; Albrecht, A.J.P.; Rubin, R.S.; Adegas, F.S.; Albrecht, L.P. Paraquat resistance of sumatran fleabane (Conyza sumatrensis). Planta Daninha 2019, 37, e019183264. [Google Scholar] [CrossRef]
  23. Palma-Bautista, C.; Vázquez-García, J.G.; Domínguez-Valenzuela, J.A.; Ferreira Mendes, K.; Alcantara De la Cruz, R.; Torra, J.; De Prado, R. Non-target-site resistance mechanisms endow multiple herbicide resistance to five mechanisms of action in Conyza bonariensis. J. Agric. Food Chem. 2021, 69, 14792–14801. [Google Scholar] [CrossRef] [PubMed]
  24. Powles, S.B.; Yu, Q. Evolution in action: Plants resistant to herbicides. Annu. Rev. Plant Biol. 2010, 61, 317–347. [Google Scholar] [CrossRef] [PubMed]
  25. Jalaludin, A.; Yu, Q.; Powles, S.B. Multiple resistance across glufosinate, glyphosate, paraquat and ACCase-inhibiting herbicides in an Eleusine indica population. Weed Res. 2015, 55, 82–89. [Google Scholar] [CrossRef]
  26. Yu, Q.; Cairns, A.; Powles, S. Paraquat resistance in a population of Lolium rigidum. Funct. Plant Biol. 2004, 31, 247–254. [Google Scholar] [CrossRef] [PubMed]
  27. Yu, Q.; Abdallah, I.; Han, H.; Owen, M.; Powles, S. Distinct non-target site mechanisms endow resistance to glyphosate, ACCase and ALS-inhibiting herbicides in multiple herbicide-resistant Lolium rigidum. Planta 2009, 230, 713–723. [Google Scholar] [CrossRef] [PubMed]
  28. Fernández-Moreno, P.T.; Bastida, F.; De Prado, R. Evidence, mechanism and alternative chemical seedbank-level control of glyphosate resistance of a rigid ryegrass (Lolium rigidum) biotype from southern Spain. Front. Plant Sci. 2017, 8, 450. [Google Scholar] [CrossRef]
  29. Ismail, B.S.; Chuah, T.S.; Khatijah, H.H. Metabolism, uptake and translocation of 14C-paraquat in resistant and susceptible biotypes of Crassocephalum crepidioides (Benth.) S. Moore. Weed Biol. Manag. 2001, 1, 176–181. [Google Scholar] [CrossRef]
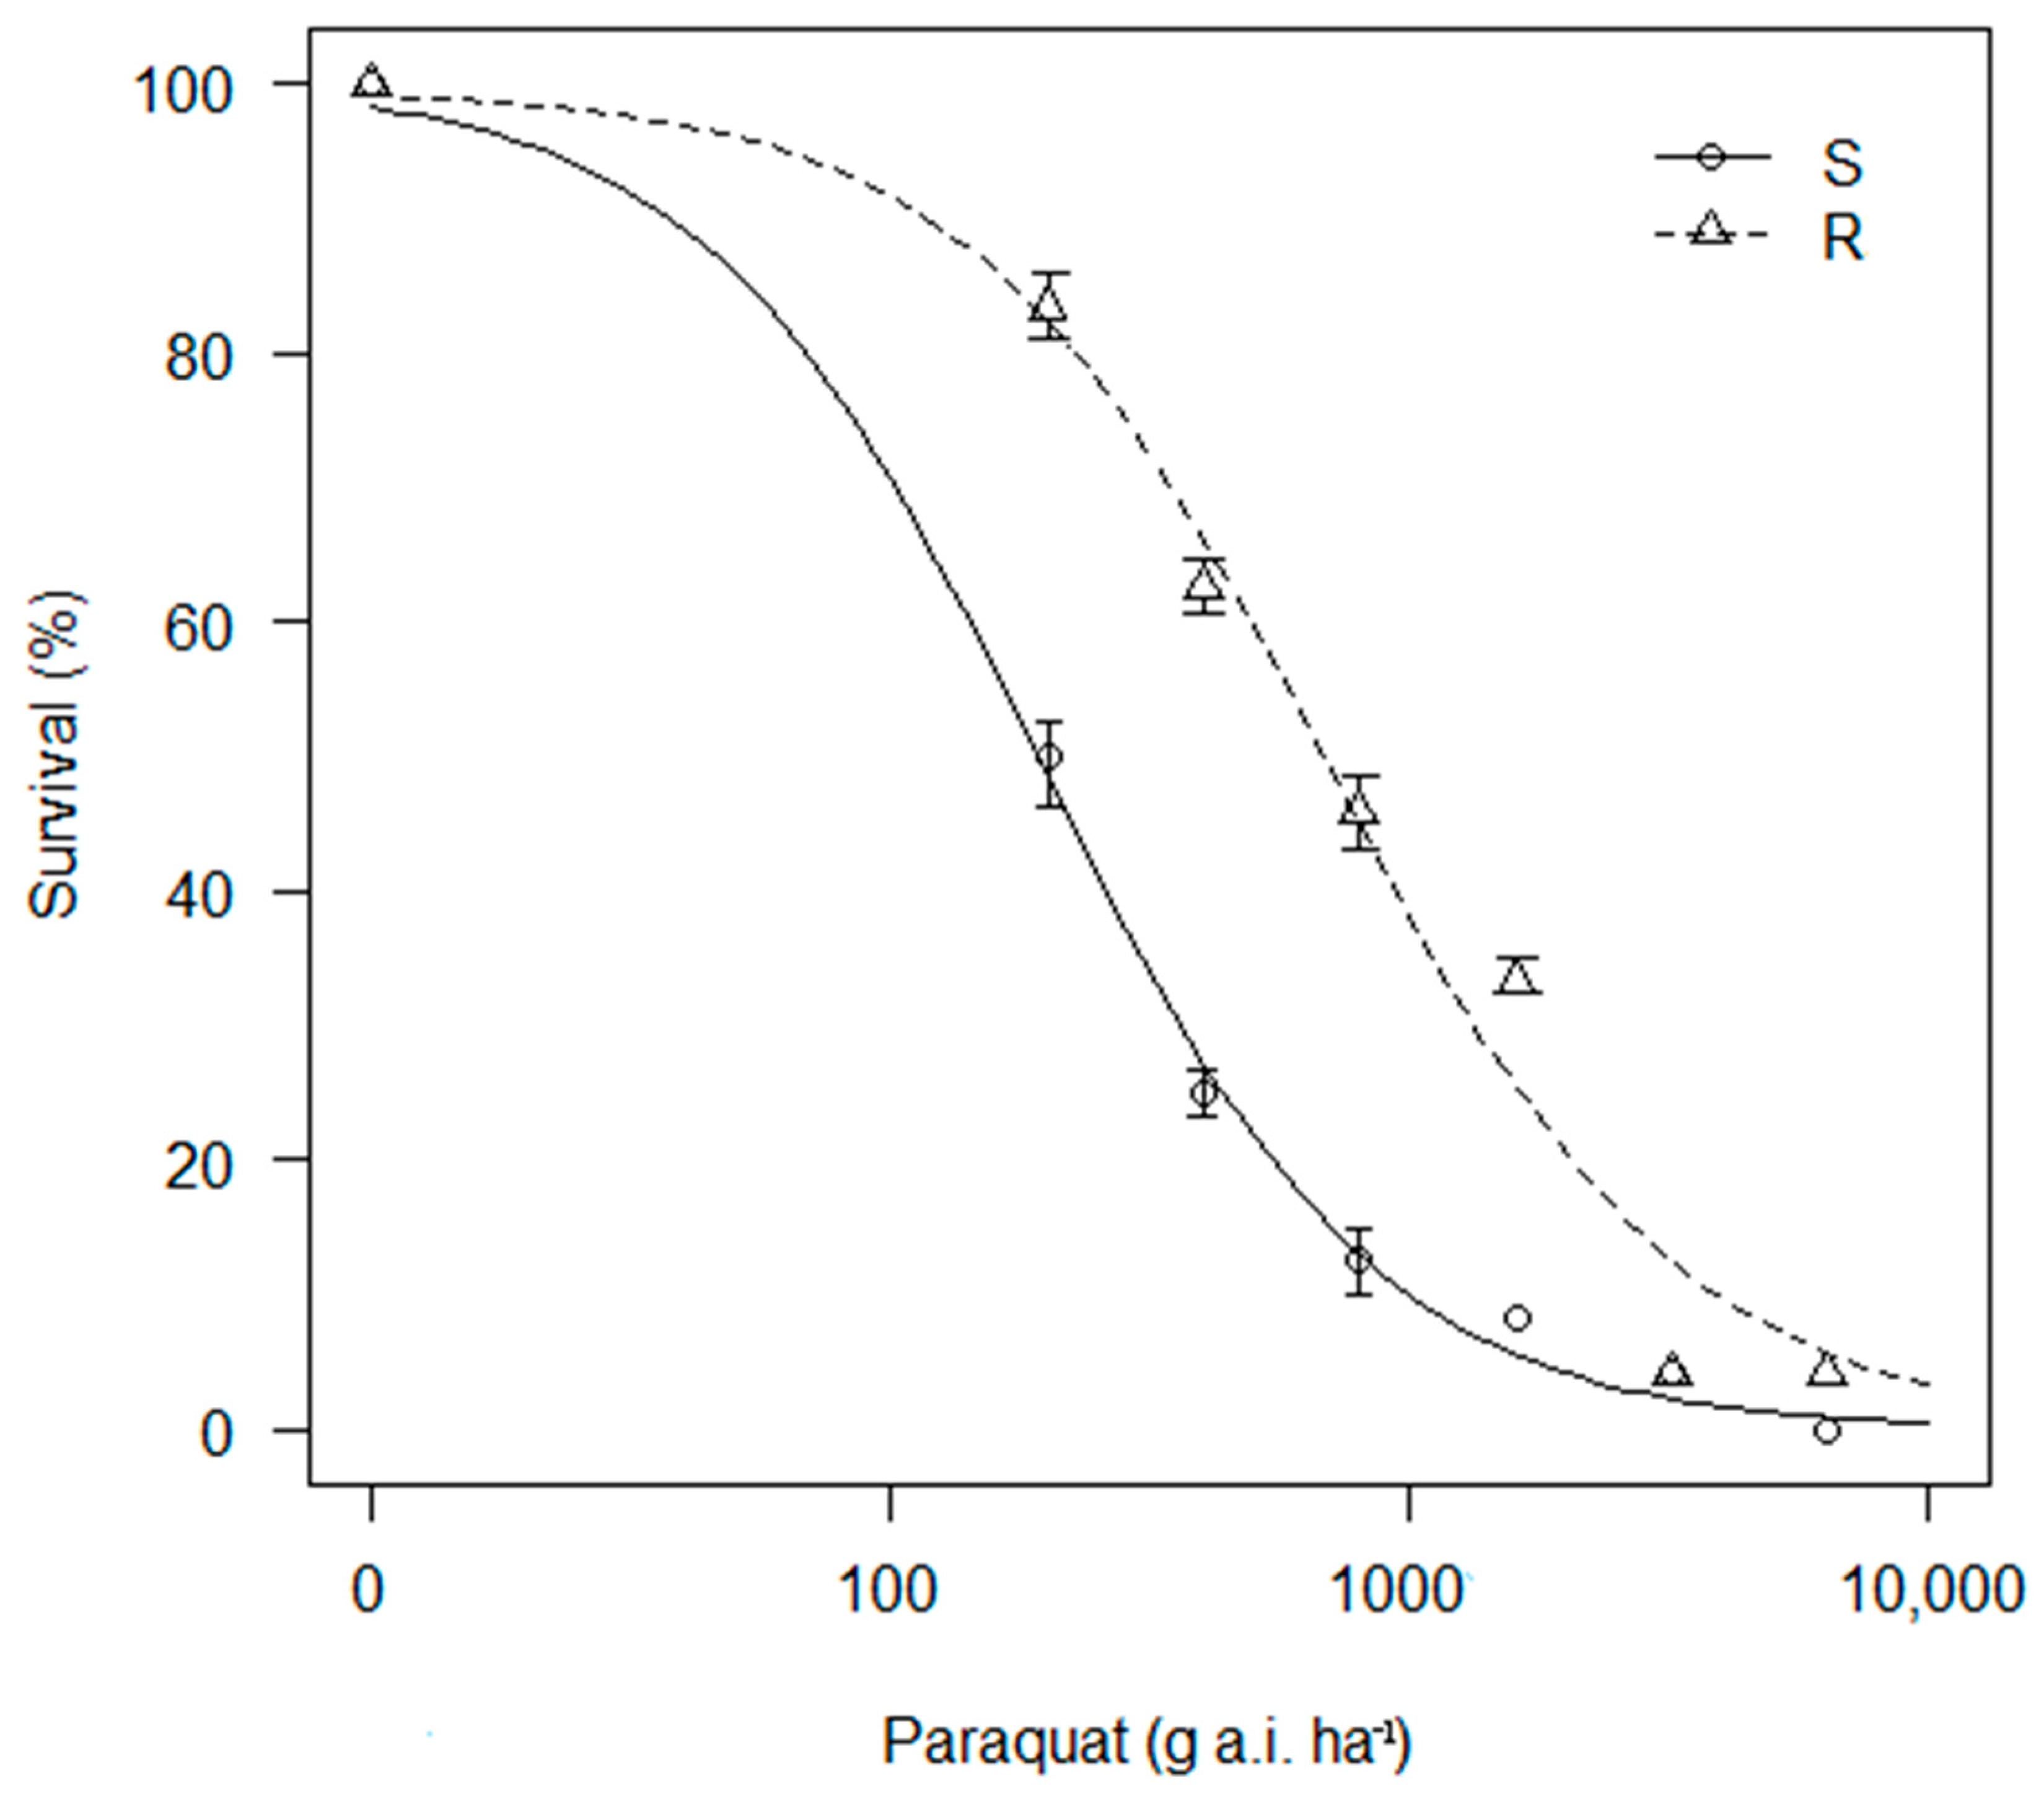
Figure 1. Percentage survival of Plantago lanceolata R and S biotypes after application of different paraquat rates. Values on the x-axis are on a logarithmic scale. Bars on data points represent standard errors.
Agronomy 14 00977 g001
Figure 2. Percentage biomass of Plantago lanceolata R and S biotypes after application of different paraquat rates. Values on the x-axis are on a logarithmic scale. Bars on data points represent standard errors.
Agronomy 14 00977 g002
Figure 3. Maximum quantum yield of photosystem II (Fv/Fm) of R and S Plantago lanceolata biotypes at 0, 1, 2, 5, 24 and 48 h after application (HAT, lower x-axis) of paraquat at various rates (0, 100, 200, 400, 800, 1600, 3200 and 6400 g a.i. ha−1, upper x-axis).
Agronomy 14 00977 g003
Figure 4. Electrolyte leakage of Plantago lanceolata R and S biotypes treated with various pre-treatments. Bars on data points represent standard errors.
Agronomy 14 00977 g004
Figure 5. Representative high-performance liquid chromatography (HPLC) chromatograms of [14C]-paraquat treated (a) R and (b) S Plantago lanceolata biotypes. Radioactivity was detected with a β radiodetector.
Agronomy 14 00977 g005
Table 1. Parameter estimates and associated model statistics for log-logistic survival curves for Plantago lanceolata R and S biotypes in response to paraquat.
BiotypeDBp ValueLD50p ValueR/S Ratio
R99.54 (9.80)1.26 (0.31)***688.99 (191.24)***3.59
S100.14 (10.04)1.33 (0.56) 191.81 (62.62)
D = upper limit, B = slope, and LD50/GR50 = rate yielding 50% response. R/S ratio = resistant/susceptible LD50 ratio. *** p ≤ 0.001; df = 2; f = 10.22; p = 0.000. Standard errors are in parentheses.
Table 2. Parameter estimates and associated model statistics for log-logistic biomass curves for Plantago lanceolata R and S biotypes in response to paraquat.
BiotypeDBp ValueLD50p ValueR/S Ratio
R101.46 (9.08)1.31 (0.29)***505.36 (119.87)***2.78
S99.75 (9.48)1.20 (0.41) 181.61 (62.65)
D = upper limit, B = slope, and LD50/GR50 = rate yielding 50% response. R/S ratio = resistant/susceptible LD50 ratio. *** p ≤ 0.001; df = 2; f = 7.02; p = 0.001. Standard errors are in parentheses.
Table 3. Translocation of [14C]-paraquat from a single treated leaf to other plant sections of Plantago lanceolata R and S biotypes.
Applied [14C]-Paraquat (%)
BiotypeUntreated LeavesRootsTreated LeavesLeaf Wash
R18.03 ± 6.127.86 ± 0.1062.13 ± 9.377.79 ± 0.11
S36.04 ± 9.6933.17 ± 7.4210.71 ± 2.6515.17 ± 7.27
p valueNS*****NS
The means ± standard error. Total recovery of applied radioactivity was 95.81% ± 4.11 and 95.09% ± 4.28 for R and S biotypes, respectively. R; SE = 4.25; df = 48.00; S; SE = 3.85; df = 48.00. NS = not significant, ** p ≤ 0.01 and *** p ≤ 0.001.
Disclaimer/Publisher’s Note: The statements, opinions and data contained in all publications are solely those of the individual author(s) and contributor(s) and not of MDPI and/or the editor(s). MDPI and/or the editor(s) disclaim responsibility for any injury to people or property resulting from any ideas, methods, instructions or products referred to in the content.