Abstract
The effects of intensive and reduced tillage, fertilization, and irrigation on soil chemical and microbiological parameters were studied in a long-term field experiment in Hungary. The treatments were plowing tillage, ripper tillage, strip tillage; control (without fertilization), NPK fertilization (N: 160 kg/ha; P: 26 kg/ha; K: 74 kg/ha); and non-irrigation and irrigation. Soil samples were collected through maize monoculture in the fall of 2021 in the 30th year of the experiment. The soil organic carbon, total nitrogen, soil microbial biomass (based on PLFA analysis), and soil enzyme activity were observed to be significantly high in the strip tillage plots, but were lower in the ripper tillage plots, and even lower in the plowing tillage plots. The fungal, arbuscular mycorrhiza fungal, and bacterial biomasses were significantly higher in the strip tillage and ripper tillage plots compared to the plowing tillage plots. The strip tillage treatment was found to be the most favorable cultivation method for improving the microbial biomass and activity of Chernozem soil, followed by the ripper tillage and plowing tillage treatments. The long-term use of chemical fertilizers greatly reduced the soil microbial biomass and negatively impacted the soil microbial community, leading to a decrease in fungi and Gram-negative bacteria. The ratio of cyclopropyl PLFA precursors to cyclopropyl PLFAs, as a “stress factor”, indicated the most stressful bacterial environment was that found in the fertilized, non-irrigated plowed soil.
1. Introduction
Chernozem soils play a significant role in Europe, particularly in the eastern and southeastern regions of the continent. Chernozems cover nearly 11% of all the soil resources of Europe and 22% in Hungary [1]. These soils are characterized by high fertility, making them crucial in food production.
Due to the increasing influence of human activities, a variety of environmental conditions, such as climate patterns and soil parameters, are currently undergoing significant changes. As a consequence, more attention is being paid to soil protection [2], the use of environmentally conscious cultivation technologies [3], and the focus on the site-specific satisfaction of the needs of the crops grown [4].
The agrotechnical elements of land management, including tillage, fertilization, or irrigation, are all significant anthropogenic activities that can alter the physical, chemical, and microbiological parameters of the soil. Tillage refers to the mechanical techniques used to prepare the soil for seeding or planting and aims at creating suitable conditions for successful plant growth. Tillage methods vary in terms of the tillage depth, extent of soil mixing, treatment of crop residues, and method of nutrient application [5].
Plowing tillage (PT) is a centuries-old traditional agricultural practice in Hungary, where the soil is plowed to a depth of 0–30 cm in the fall to control weeds and incorporate crop residues and fertilizers, followed by secondary cultivation to prepare the seedbed. The disadvantage of PT is the limited protection of the soil surface, which contributes to increased susceptibility to moisture loss and soil erosion [5]. Strip tillage (ST) and ripper tillage (RT) are two alternative methods of reduced tillage that cause less disturbance of the soil, while intentionally leaving crop residue on the soil surface to serve as a protective layer against erosion. ST combines the benefits of traditional and no-till tillage to protect the soil. This involves tilling the soil in a narrow strip, ensuring that the spaces between rows are covered with crop residue and that nutrients are applied in the row zone [6]. RT aims to minimize soil compaction and this method loosens the soil to a medium depth and a ripper is used in conjunction with a disc [7]. In RT, larger amounts of crop residues remain on the soil surface and soil disturbance is less intensive compared to that in PT.
The soil microbial biomass and microbial activity are very sensitive to changes in soil properties caused by environmental changes [8,9]. Drought is a growing environmental problem worldwide that also has a negative impact on soil microbial parameters. Microorganisms play a critical role in several important functions in the soil ecosystem. Microbes are responsible for decomposing organic matter, which supports nutrient cycling and contributes to overall soil fertility. They also help suppress plant diseases, improve soil structure, and promote plant growth [10,11].
The quantitative description of changes in the soil microbial community has attracted considerable interest in soil quality assessment. The measurement of soil microbial biomass and community structure, as well as the assessment of specific microbial functions, such as soil enzyme activities, serve as sensitive indicators for evaluating the impact of agricultural activities on soil health [12]. Soil enzymes play an important role in the decomposition of organic matter and the recycling of nutrients.
Commonly used techniques for studying the soil microbial biomass include phospholipid fatty acid (PLFA) analysis and the nucleic acid (DNA) extraction method [13]. While both methods provide valuable insights into soil microbial communities, they differ in their approach, resolution, and applicability. The advantage of the DNA extraction method is that it provides detailed phylogenetic resolution, enabling the identification of specific microbial taxa present in the soil. However, it is also associated with limitations, such as the potential presence of DNA from non-viable cells. Conversely, PLFA analysis provides information on the cellular membrane composition of living microbial communities, offering insights into the actual microbial activity; however, it lacks taxonomic resolution.
Phospholipid fatty acids (PLFAs) are organic molecules found in living cells of soil microorganisms. Because PLFAs are rapidly degraded after cell death, the total concentration of PLFAs serves as a reliable indicator for measuring the living microbial biomass in soil. Some specific PLFAs selected as biomarkers represent different microbial groups, such as fungi and bacteria; therefore, the analysis of PLFA patterns can be used to describe the changes in the soil microbial community [14]. Microbial communities can be directly affected by tillage through disruption of the soil system [15]. Helgason [16] reported higher bacterial and fungal species diversity in reduced tillage systems compared to conventional tillage. However, arbuscular mycorrhizal fungi (AMF) are generally more abundant in conservation tillage soils [17].
Long-term field experiments provide the opportunity to observe the long-term effects of various agrotechnical treatments [18]. The objective of this study was (1) to assess the response of soil chemical and microbiological parameters to reduced and intensive tillage systems in a 30-year long-term experiment, which was conducted on Chernozem soil; (2) to identify the most sustainable tillage management system that enhances chernozem soil quality, while ensuring a satisfactory crop yield; (3) to evaluate the impacts of long-term NPK fertilization on the examined soil parameters. We hypothesized that reduced tillage systems (RT and ST) would have positive effects on soil fertility and soil microbial activity compared to a highly intensive PT. This knowledge will play an important role in predicting the consequences of different agrotechnical elements.
2. Materials and Methods
2.1. Experimental Design
The long-term tillage experiment was initiated in 1991 in the Research Station of University of Debrecen, located in the northeastern region of Hungary (47°33′ N, 21°26′ E). The natural bioclimatogenic zone in this area is characterized by a continental climate with an average annual temperature of 11 °C and precipitation of about 600 mm per year. The soil reference group is Endocalcic Chernozem (according to IUSS WG WRB-2022) [19], which has a loamy texture with the following parameters: pHKCl = 5.48; soil organic carbon (SOC) = 1.8%; silt and clay = 55.8%; ammonium lactate soluble element concentrations: AL-P = 106 mg/kg; AL-K = 232 mg/kg. The soil genetic horizon sequence is Ap1-Ap2-AC-Ck (Chernic-Calcic horizons (or subsoil with protocalcic properties)); Figure 1.
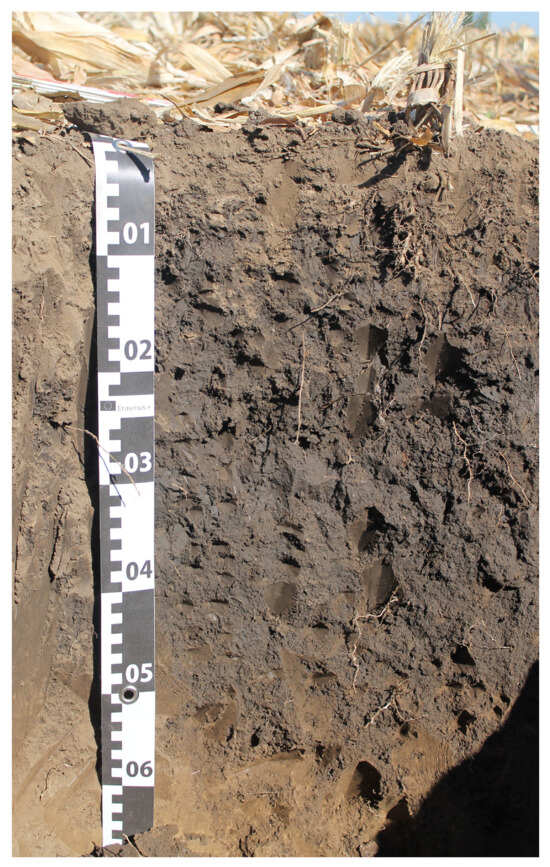
Figure 1.
Endocalcic Chernozem (WRB 2022) soil profile of the experimental area (AP1 0–30; AP2 30–50; AC 50–70).
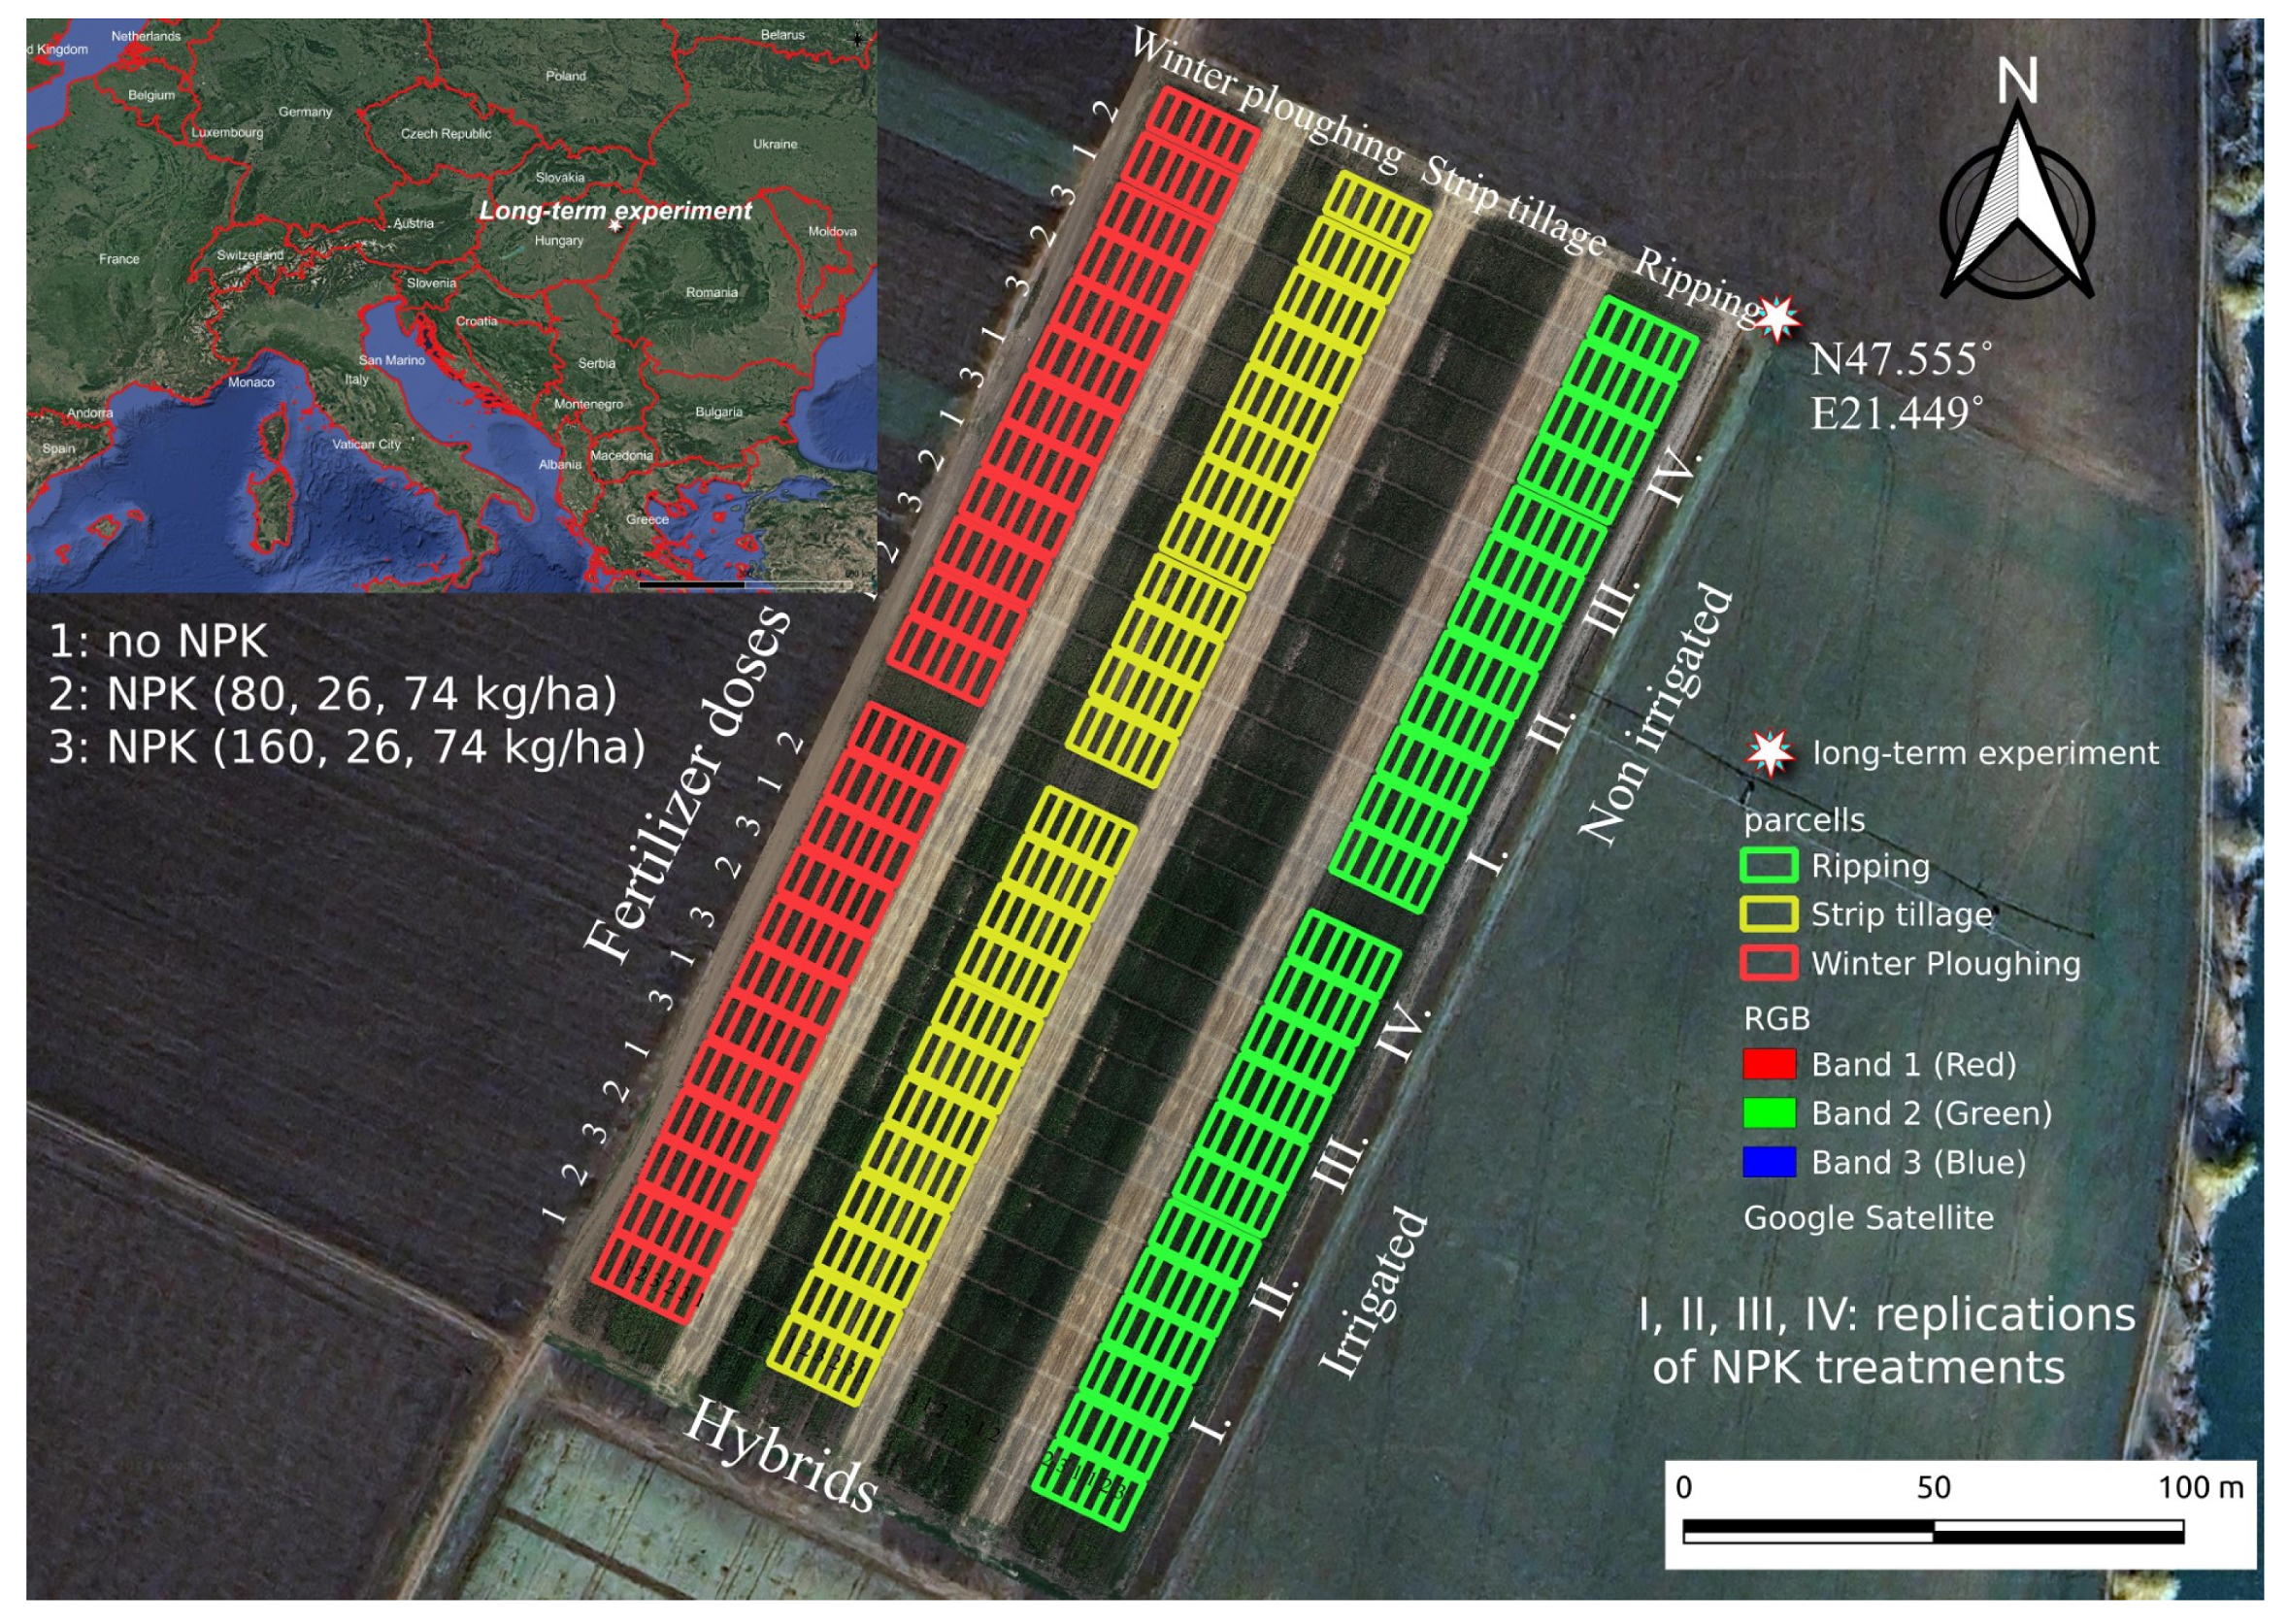
The polyfactorial experiment was laid out in a split-split plot design (Figure 2). The main plots represented the tillage blocks: (1) plowing tillage, PT (tillage depth: 0–30 cm); (2) ripper tillage, RT (tillage depth: 0–45 cm); (3) strip tillage, ST (tillage depth: 0–15 cm). The main plots were divided into two subplots, irrigated and non-irrigated ones. The subplots were further subdivided into control (no fertilizer was applied during the long-term experiment) and NPK treatments (NPK1: N: 80 kg/ha; P: 26 kg/ha; K: 74 kg/ha and NPK2: N: 160 kg/ha; P: 26 kg/ha; K: 74 kg/ha). For our studies, the control and NPK2-treated plots were selected. All treatments were set up with four replications. Maize (Zea mays L.) was grown through monoculture farming. Plant residues were not removed in any of the tillage methods and were handled in different ways. In PT, the plant residues were incorporated at a depth of 0–30 cm, resulting in significantly less crop residue on the soil surface. In plots with ST, crop residues were left on the upper soil layer, and, in RT, were incorporated at a depth of 0–10 cm.
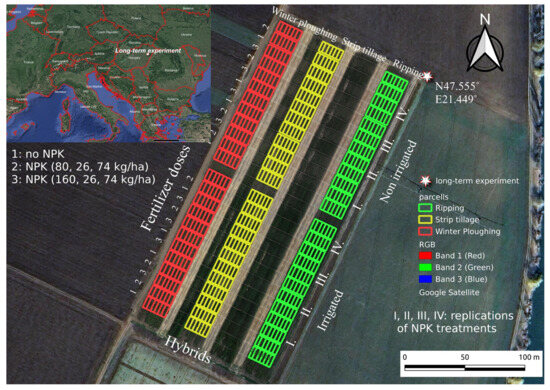
Figure 2.
The experiment design with location in Hungary (Debrecen-Látókép, 2021) [20].
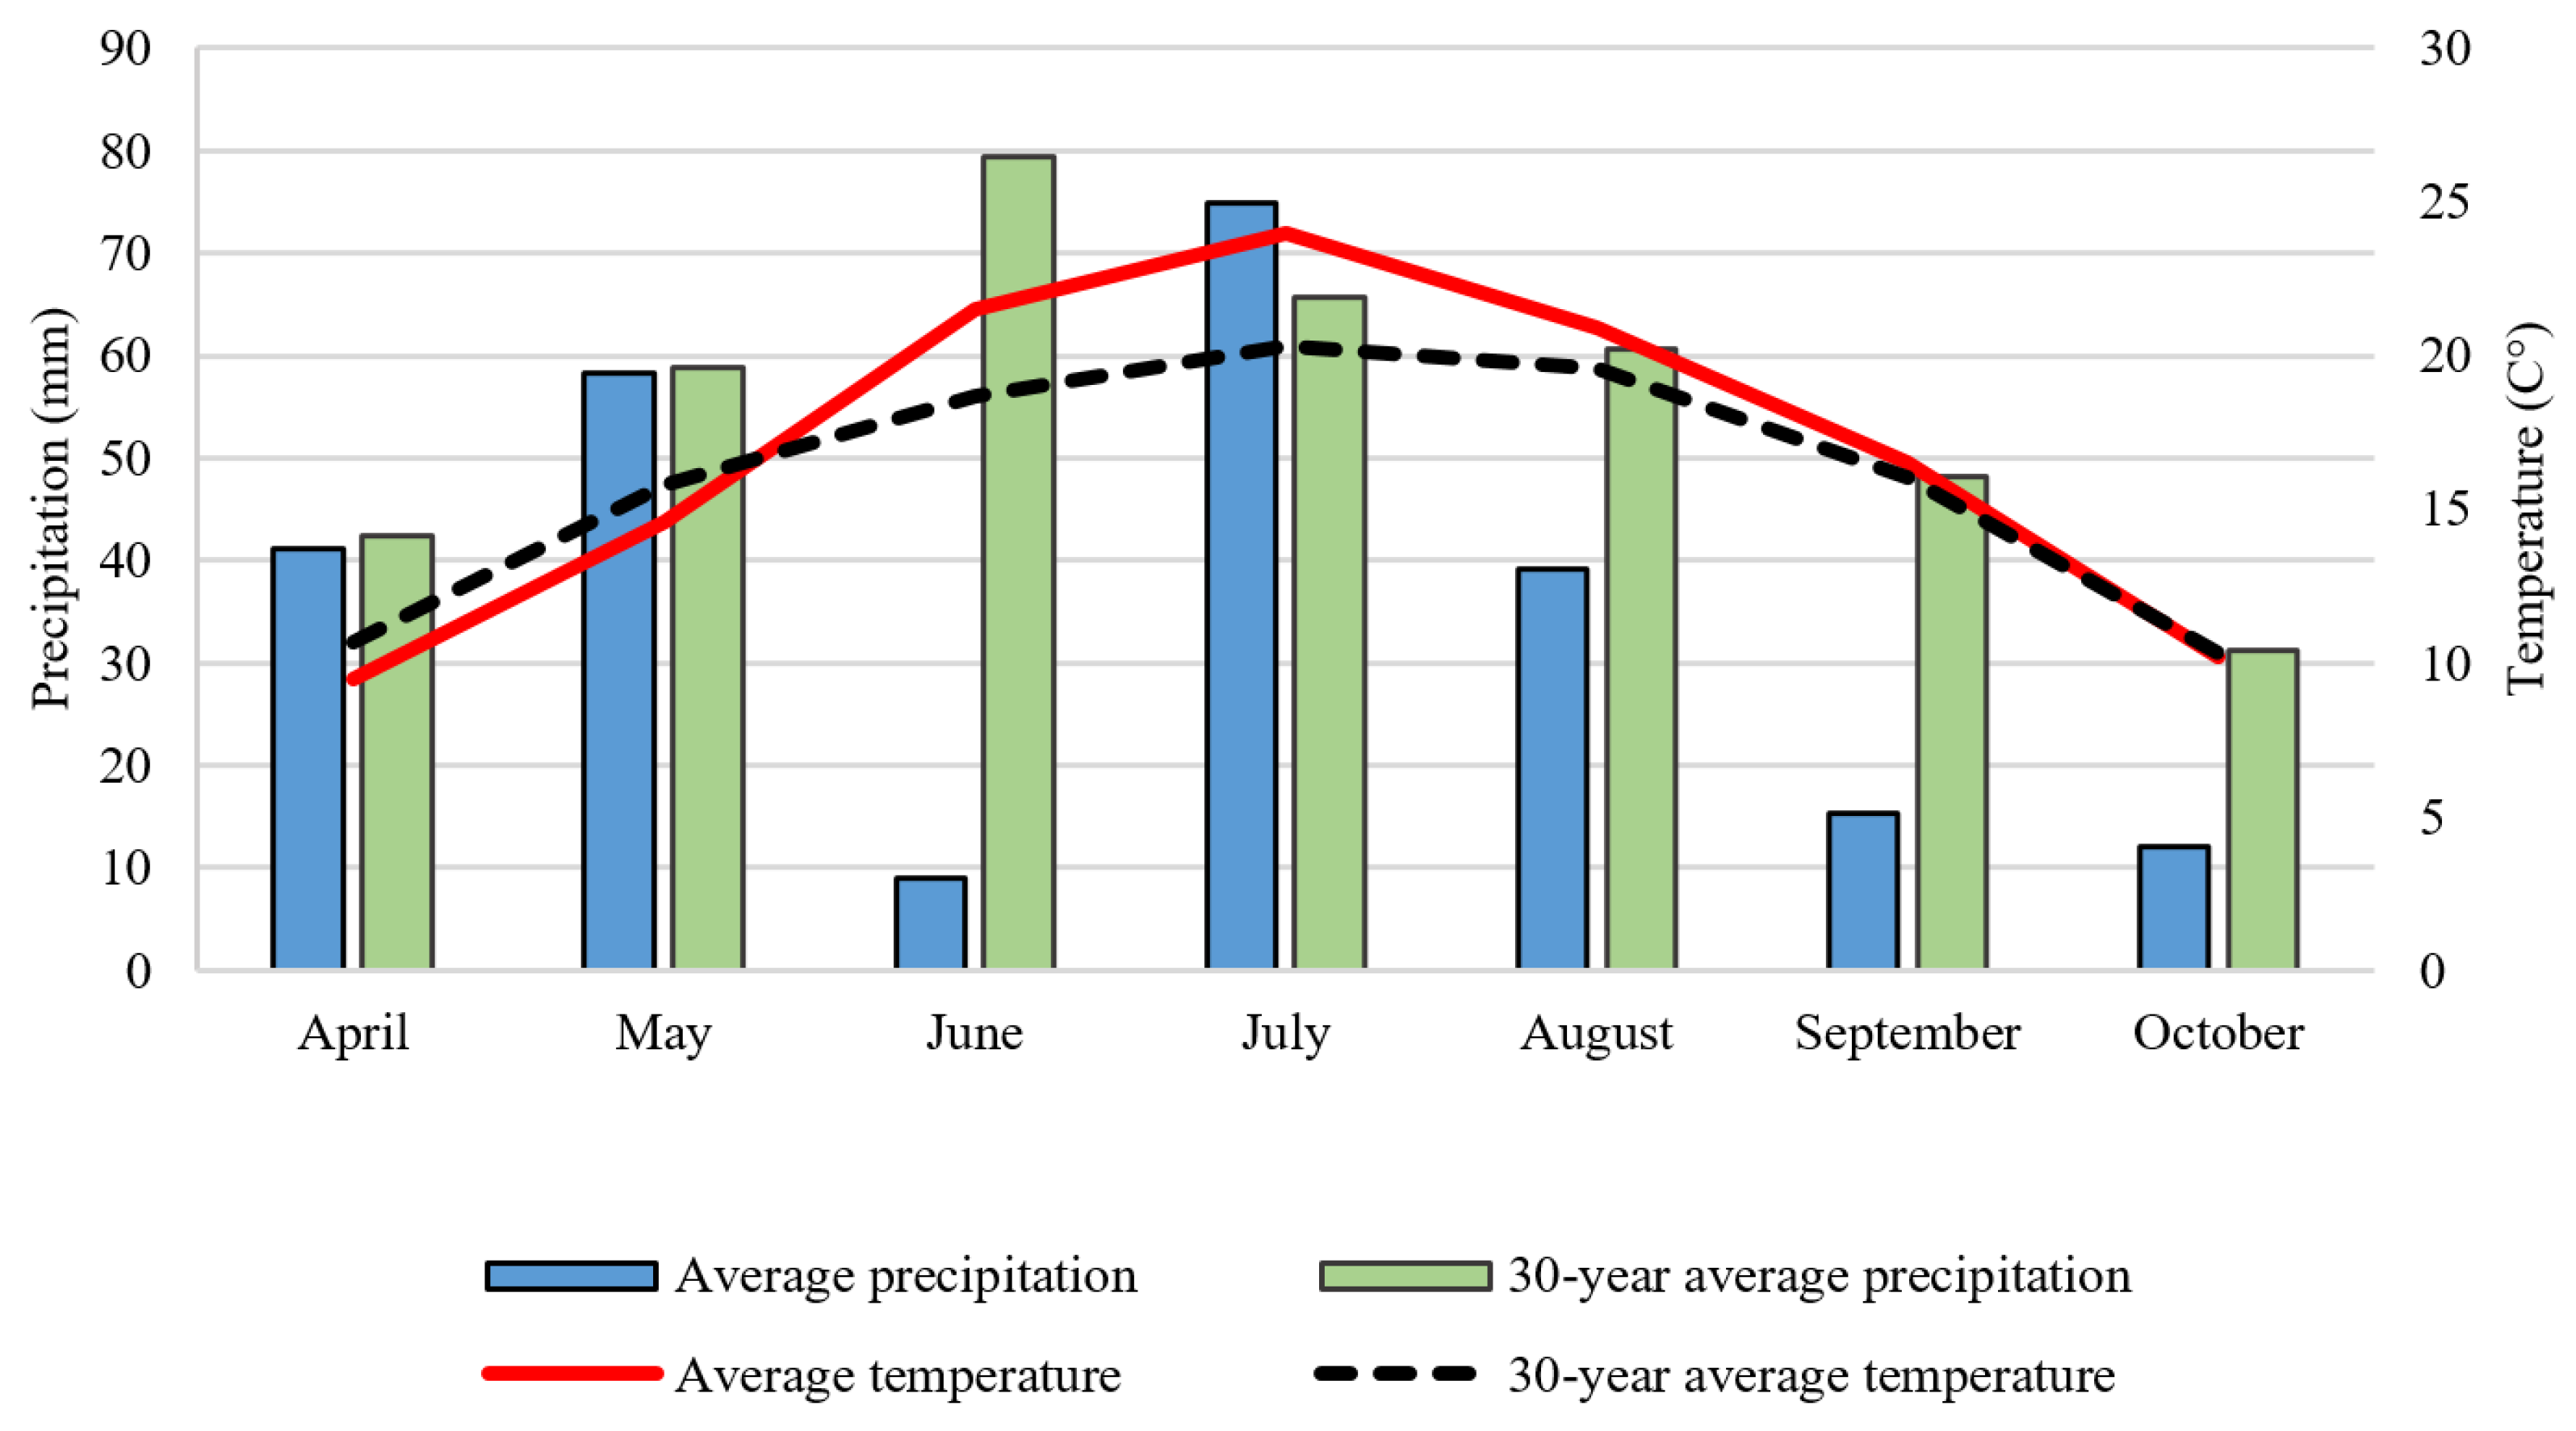
NPK fertilizers were calcium ammonium nitrate, urea ammonium nitrate, ammonium dihydrogen phosphate, and potassium chloride. One-third of the total N, and P and K was applied as a basal fertilizer and two-thirds of the total nitrogen (as urea ammonium nitrate solution) was applied by top-dressing. In PT, fertilizers were incorporated into the 0–30 cm layer, and in RT, into the 0–10 cm soil layer. In ST, fertilizers were applied to the crop rows. Precipitation and average temperatures of the studied crop year (2021) and the 30-year average are shown in Figure 3.

Figure 3.
Monthly precipitation and average temperature compared to the 30-year average (Debrecen-Látókép, 2021) [20].
Precipitation during the growing season (April–September) of the studied crop year (2021) was 249 mm, well below the 30-year average (386 mm), and unevenly distributed. June was particularly dry in 2021; total precipitation was only 9 mm, while the 30-year average was 79 mm. The average temperature in June was 5 °C higher than the 30-year average. Due to the severe drought, the irrigated plots received 25 mm of irrigation water in June and 25–25 mm in early and late July.
2.2. Yield of Maize
The grain yield of the maize (Zea mays L.) for each plot was determined using the built-in weighing unit of the SAMPO ROSENLEW harvester.
2.3. Soil Sampling
Soil samples were collected in September 2021, prior to crop harvest. Representative soil samples were taken by using a soil auger at a depth of 0–30 cm from the plant row. One part of the soil samples was stored at −20 °C for measuring enzyme activities, another part was freeze-dried for microbial community analysis, and the third part was air-dried before analysis of soil chemical parameters.
2.4. Analysis of Soil Chemical Parameters
The moisture content of the soil was determined after drying at 105 °C and was expressed as m/m% dry soil mass. The pHKCl was measured in 1M KCl solution at a ratio of 1:2.5.
The total carbon content (TC) and the total nitrogen content (TN) of the soil were determined by the dry combustion method with the Primacs-SNC100 analyzer and expressed as m/m% of the dry soil mass. The Chernozem soil of the experimental site does not contain carbonate in the upper layer of 0–30 cm; therefore, the TC corresponds to the total organic carbon content (SOC) of the soil.
2.5. Analysis of Soil Microbial Parameters
Soil microbial activity was determined by measuring the microbial respiration, which was the CO2 emitted from 10 g soil incubated for 10 days at 25 °C in the dark. The respired CO2 production was measured with NaOH trapping and expressed in mg CO2/kg soil/10 days [21].
Dehydrogenase activity (DHA) was determined according to Von Mersi [22]. Briefly, after 2 h of soil incubation at 40 °C, reduced iodonitrotetrazolium formazan (INTF) was extracted with dimethylformamide and ethanol and then determined colorimetrically at 464 nm; DHA was expressed as µg INTF/g soil/2 h. Saccharase activity (SA) was measured according to Frankeberger [23] and based on the determination of monosaccharides derived from the degradation of saccharose; SA was expressed as mg glucose/100 g soil/24 h. Urease activity (UA) was measured by quantitative determination of ammonium (mg NH4+-N/100 g soil/2 h) and determined using a UV spectrophotometer at 660 nm according to Kandeler [24]. Phosphatase activity (PA) was measured according to Tabatabai [25] by the amount of phosphoric acid hydrolyzed by colorimetric determination at a wavelength of 640 nm, and was expressed in mg P2O5/100 g soil/2 h.
2.6. PLFA Analysis
Assessment of soil microbial biomass and community composition was performed using phospholipid fatty acid (PLFA) analysis as described by Ellis [26]. Briefly, PLFAs were extracted by methanol, chloroform, and 50 mM K2HPO4 mixture (1:0.5:0.4 v/v/v). After separation and methylation, fatty acid methyl ester (FAME) profiles were analyzed by a gas chromatograph with a flame ionization detector (Agilent 8890). FAMEs were identified by their retention times using the MIDI PLFAD1 method in Sherlock software 6.5 (MIDI, Microbial Identification Inc., Newark, DE, USA). The concentration of each PLFA was determined using an internal 19:0 standard and expressed as nmol PLFA/g dry weight of soil. The total soil microbial biomass was estimated as the amount of total detected PLFAs. Soil microbial community composition was estimated using indicator PLFAs—classified by MIDI—and were categorized into taxonomic groups: AM fungi (16:1ω5 PLFA), fungi (18:2ω6 PLFA) [27], general bacteria [28], Gram-positive bacteria (GP) [29], and Gram-negative bacteria (GN) [29]. The sum of GP, GN, and general bacteria was expressed as total bacteria [30]. The composition and the change in the microbial community was estimated by using the ratio of fungi to total bacteria (F/B) and the ratio of GP to GN bacteria (GP/GN). The ratio between monoenoic precursors of cyclopropyl PLFAs and cyclopropyl PLFAs was regarded (PRE/CY) as the “stress factor” in the bacterial communities [31]. A lower factor indicates greater physiological/nutritional stress to the bacterial community.
2.7. Statistical Analysis
The effects of the interactions between tillage, NPK fertilization, and irrigation on soil parameters were evaluated by a three-way ANOVA analysis of variance between groups. When there were significant interaction effects among the independent variables, one-way ANOVA analysis was performed to evaluate the treatments on split data sets. Mean values of soil parameters were compared using Tukey’s post hoc test at p ≤ 0.05. Data analysis was performed using the SPSS 27.0 software package. Data in the tables are presented as mean ± 2 SEM (standard error of the mean). Principal component analysis (PCA) for the microbial community was also performed using the SPSS statistical program after the standardization of the data.
3. Results
3.1. Yield of Maize
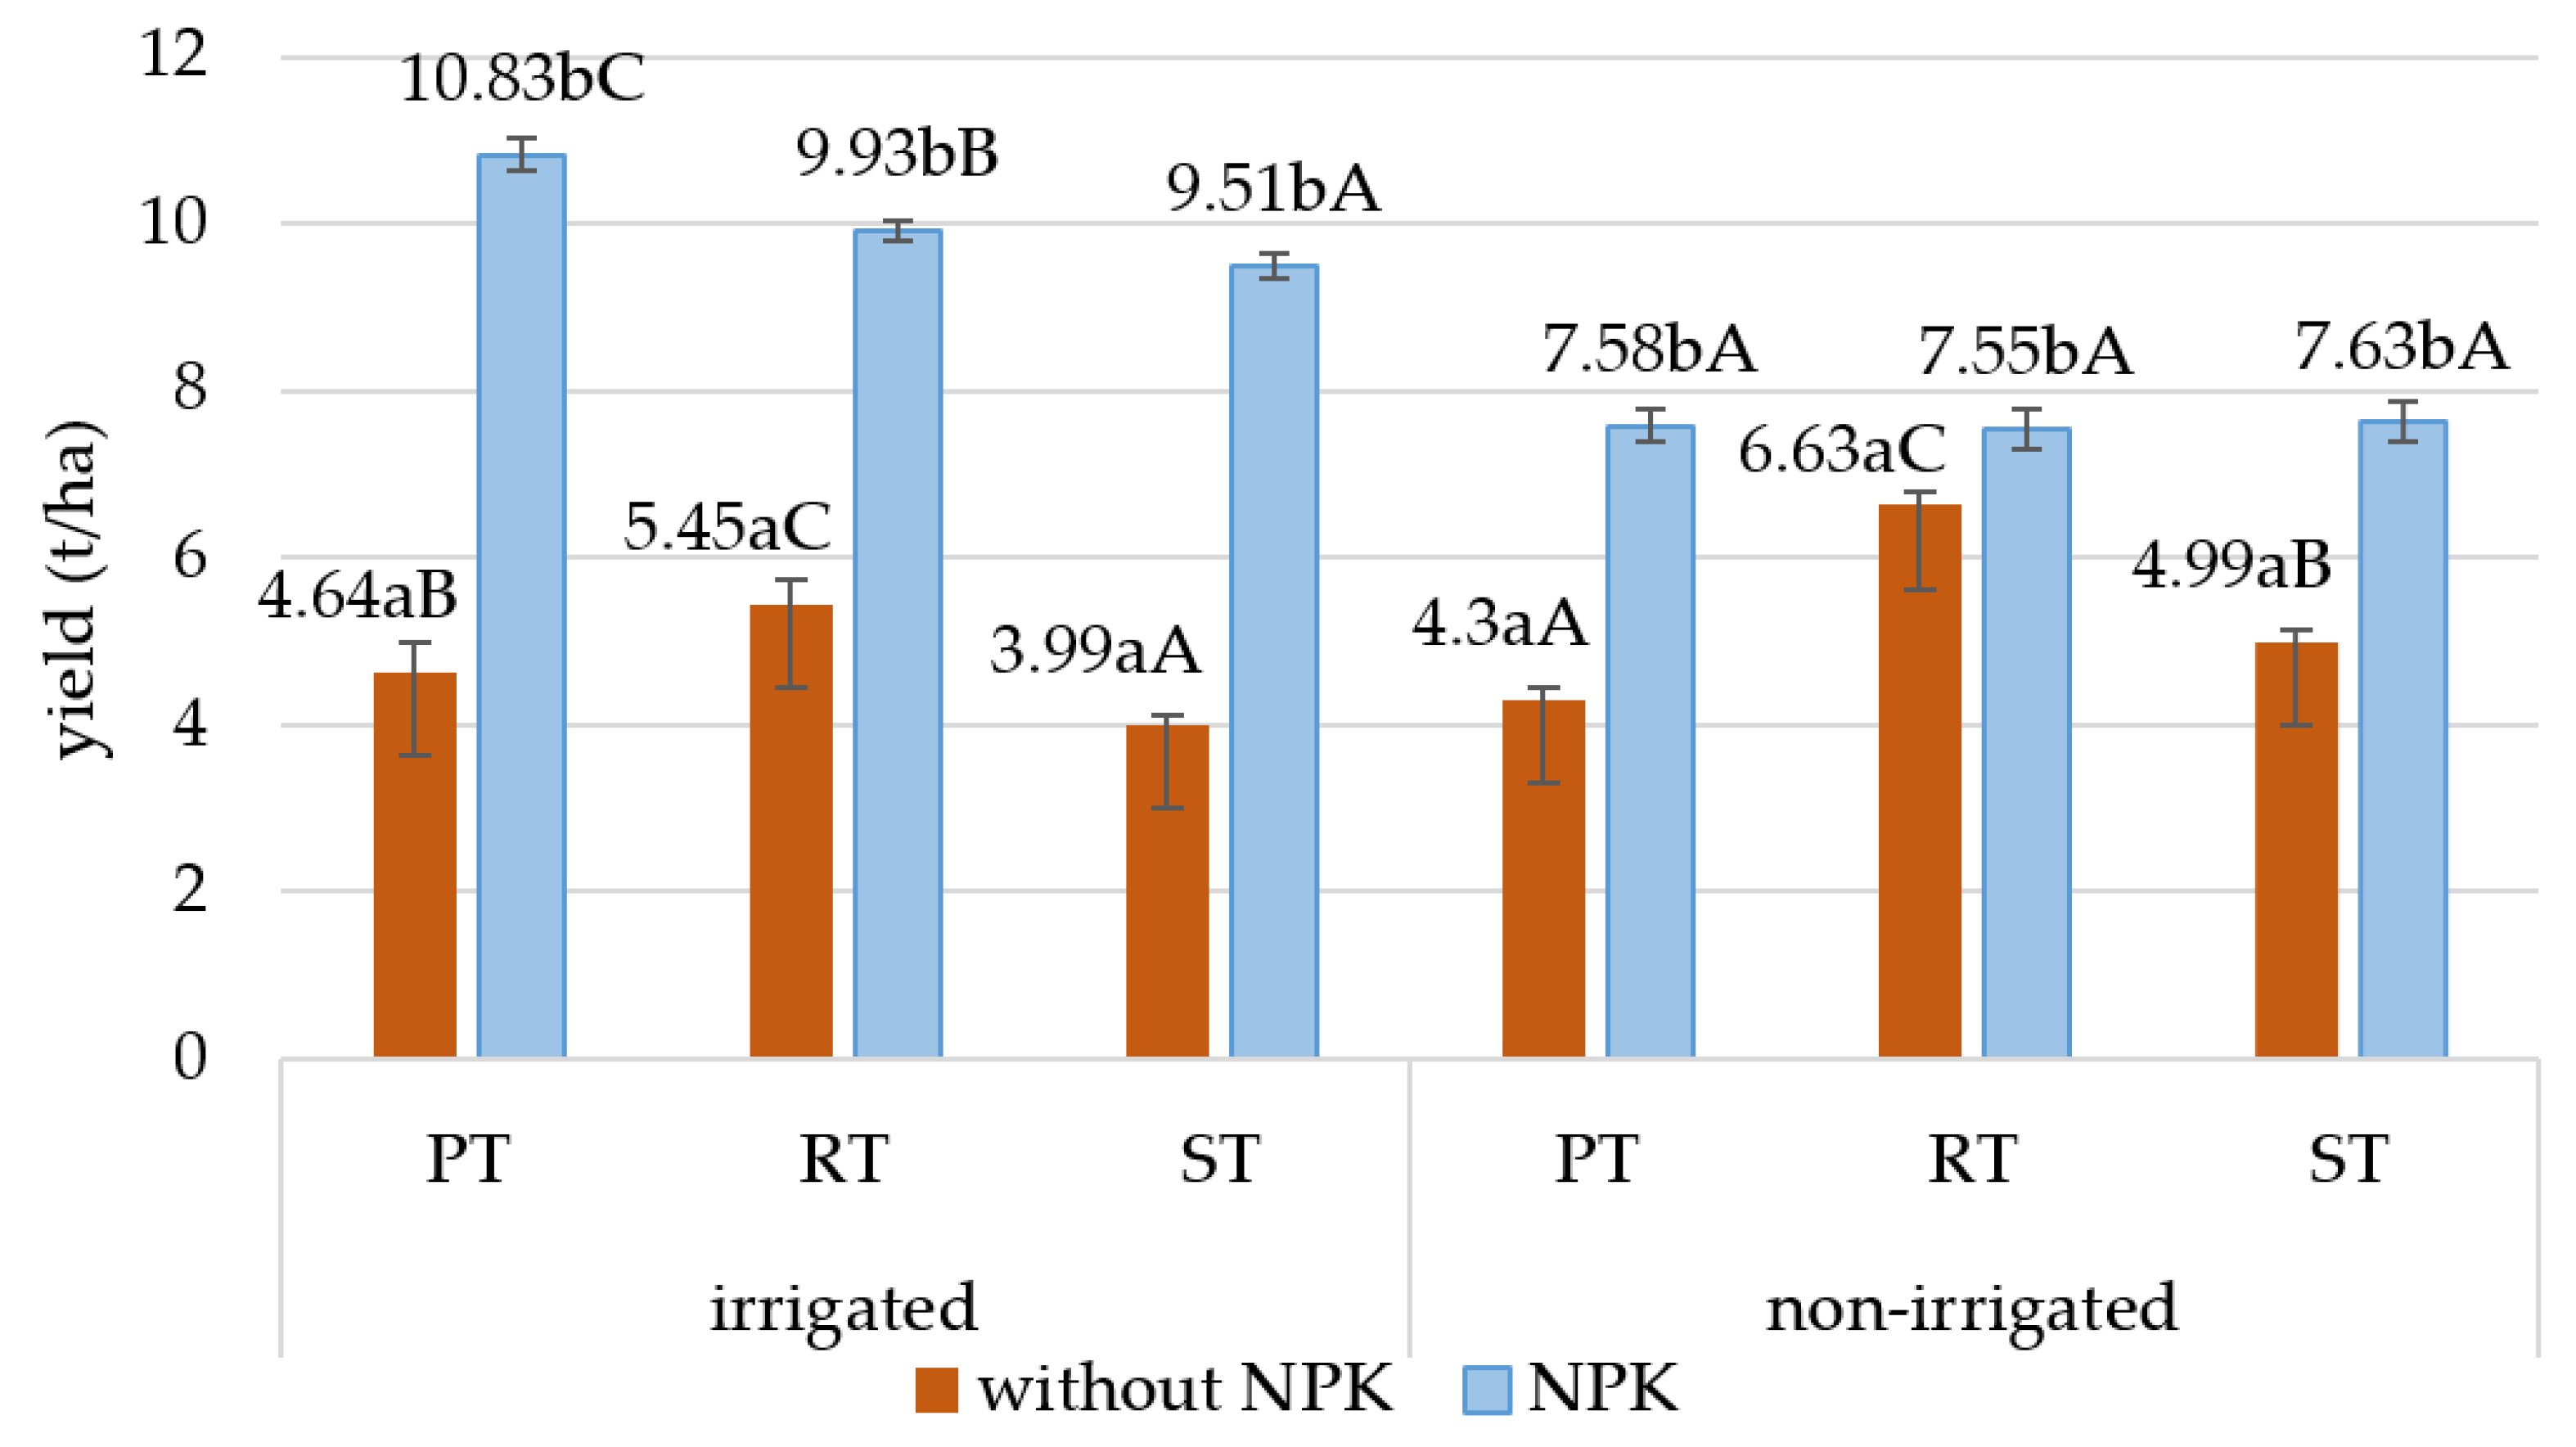
The yield of maize ranged from 4.0 to 10.8 t/ha in the sampling year (2021). NPK fertilization as well as tillage practices and irrigation influenced the maize yield (Figure 4). NPK fertilization significantly increased the maize yield by almost twofold, especially in the irrigated area compared to the plots without fertilization.
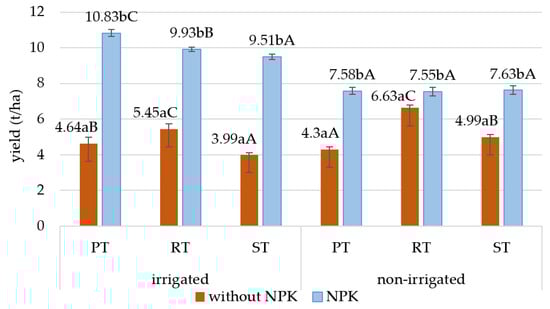
Figure 4.
Effects of NPK treatment and tillage on the yield of maize (t/ha). Different small letters indicate significant (at p ≤ 0.05) differences between control and NPK treatments, and different capital letters indicate significant (at p ≤ 0.05) differences between tillage systems; PT: plowing tillage; RT: ripper tillage, ST: strip tillage.
The effects of tillage were not the same in the irrigated and non-irrigated plots. In the irrigated plots, the yield was the highest in the NPK-fertilized PT plots, but in the plots without fertilization, the yield was highest with RT. In the non-irrigated fertilized plots, there were no differences between the yields of the different tillage methods, but in the plots without fertilization, a higher yield was observed with the two reduced tillage methods.
3.2. The Physicochemical Parameters and Enzyme Activities of Soil
According to the three-way ANOVA analysis, the long-term application of different tillage methods and NPK fertilization resulted in significant changes in the soil chemical and microbiological parameters (Table 1). There were no significant interaction effects between the factors; therefore, the main effects of the tillage methods and NPK fertilization on the soil parameters were interpreted directly (Table 2). The irrigation has no significant effect on the measured soil parameters (except for the soil moisture content); therefore, only the effects of tillage and NPK fertilization are described in Table 2.

Table 1.
Results of three-way analysis for the effects of tillage, NPK fertilization, and irrigation and the effects of their interactions on the soil chemical and microbiological parameters.
Table 2.
Mean values of soil moisture, pHKCl, SOC, TN, CO2 emission, and dehydrogenase, phosphatase, saccharase, and urease activities as affected by tillage systems and NPK fertilization in long-term experiments.
The soil moisture content did not vary with the different tillage methods, but as a result of the NPK fertilization, the value was significantly lower (11.0%) than the control value (12.7%) regardless of the irrigation and different tillage systems.
The soil pH was also not affected by the different tillage methods, but NPK fertilization lowered the soil pHKCl by almost one unit (4.2) compared to the control (5.2).
The soil organic carbon content (SOC) in the RT and ST plots ranged from 2.09 to 2.15% and was significantly higher than the SOC value of the PT plots (1.67%). In the fertilized plots, the SOC tended to increase compared to the control, although the difference was not significant.
The soil total nitrogen (TN) showed a significant response to the different tillage methods and NPK fertilization. The soil TN was significantly higher in the ST and RT plots (0.17%) than in the PT plots (0.13%) and as expected, the value of the TN also increased with fertilization.
The soil microbiological parameters were also affected by the long-term application of tillage and fertilization. The amount of CO2 released during the 10-day soil incubation characterized the soil microbial activity. The CO2 released from the soil samples from the RT and ST plots was significantly higher than that from the PT plots, which may be related to the higher SOC content and the more intense soil microbial activity in the two reduced tillage methods. The CO2 respiration of the soil samples with the NPK treatment was significantly higher (143.6 mg/kg soil/10 days) than the value of the control (138.0 mg/kg soil/10 days).
Biochemical reactions of soil are catalyzed by various enzymes; therefore, the measurement of enzyme activities can be used as a reliable marker of soil biological activity.
Dehydrogenase is a redox enzyme, and its activity (DHA) is an indicator of oxidative microbial activity of soil microorganisms. The DHA was significantly higher (87.73–89.83 µg INTF/g/2 h) in the plots with reduced tilling (RT, ST) compared to that of the PT plots (75.47 µg INTF/g/2 h), but there was no significant difference between the values of the ST and RT plots. The DHA decreased significantly in the fertilized plots (79.69 µg INTF/g/2 h) compared to the control value (88.99 µg INTF/g/2 h).
The phosphatase activity (as a hydrolytic enzyme) was also significantly higher in the plots with reduced tilling, in the RT and ST plots (47.2 and 51.7 mg P2O5/g/2 h, respectively), compared to that of the PT plots (29.8 mg P2O5/g/2 h) and was enhanced in the fertilized plots.
Saccharase as a hydrolytic enzyme (SA) was also affected by the tillage methods. Similar to the DHA, the SA was higher (0.159–0.148 mg glucose/g/24 h) in the RT and ST plots than that in the PT plots (0.105 mg glucose/g/24 h). Fertilization did not affect the activity of this enzyme.
The urease activity (UA)—commonly used as a biological indicator of organic residue decomposition, the urea hydrolysis—was not affected by the tillage methods but was very highly increased in the NPK-fertilized plots (0.767 mg NH4-N/g/2 h) compared to that of the control plots (0.476 mg NH4-N/g/2 h), which was due to the urea ammonium nitrate solution application in these plots.
3.3. Soil Microbial Biomass and Community Composition
The soil microbial biomass has been suggested as an indicator of healthy soil or soil disturbance because soil microbes are sensitive to environmental changes [32]. The microbial community composition (based on the PLFA measurement) was affected by tillage, NPK fertilization, and irrigation to a different extent. In most cases, significant interaction effects were found between the independent variables (Table 3), so the values are presented in the split data sets in Table 4.
Table 3.
Effects of tillage, NPK fertilization, and irrigation and their interactions on soil microbial community (results of three-way ANOVA analysis).
Table 4.
Effects of irrigation, NPK treatment, and tillage on soil microbial community.
The total PLFAs, an index of the amount of microbial biomass, ranged from 175.6 to 376.7 nmol/g dry soil and this value was lower in the plots with PT (175.6–271.2 nmol/g soil) compared to RT (270.0–282.9 nmol/g soil) and even lower than that of ST (310.2–376.7 nmol/g soil) and was also significantly reduced by fertilization.
The microbial community responds rapidly to changing environmental conditions, so community analysis could be a potentially valuable indicator for estimating the effects of various agricultural interventions. Fungi play an important role in soil quality by promoting soil aggregation or decomposing plant residues. The fungal PLFA biomarker changed from 2.56 to 9.62 nmol/g soil and was influenced by tillage but showed no clear trend with fertilization or irrigation. Similarly, Klikocka [33] also observed no direct influence of nitrogen fertilization on the number of fungi. The fungal biomarker was significantly higher with the two less intensive tillage treatments, with RT and ST, compared to with PT and was the highest with ST. Arbuscular mycorrhizal fungi (AM) as plant microbial symbionts could improve plant nutrient supply and stress tolerance. The biomarker of AM ranged from 7.1 to 74.4 nmol/g soil and was mainly influenced by fertilization and was lower in the non-irrigated plots. NPK fertilization significantly reduced the AM fungal biomarker by almost one-third of the control value. According to Oehl [34], the concentration of AM fungi can be severely decreased where mineral fertilizers are applied.
The change in bacterial PLFAs was mainly influenced by tillage. The highest bacterial biomass was measured in the ST plots (240.5–273.8 nmol/g soil), more than in the RT plots (185.8–213.2 nmol/g soil) and in the PT plots (131.3–135.4 nmol/g soil). The GN bacterial PLFA biomarkers ranged from 30.1 to 91.4 nmol/g soil, decreased significantly in the fertilized plots, and were mostly of a lower value in the non-irrigated plots. The highest GN bacteria biomass was obtained in the irrigated control of the ST plots (91.4 nmol/g soil). The biomass of GP bacteria ranged from 55.6 to 112.6 nmol/g soil and its change was less sensitive to the different treatments than that of the GN bacteria. The GP/GN ratio, as an indicator of the change in the soil bacterial community, ranged from 0.87 to 2.28, and its value was affected mainly by fertilization. In the fertilized plots, the GP/GN ratio became higher compared to that of the control plots, indicating that the biomass of the GN bacteria decreased to a greater extent than that of the GP bacteria in the fertilized plots.
The ratio of fungi to bacteria (F/B) in the microbial biomass can also be used to study the response of the soil microbial community to various environmental changes. Our results showed that the ratio was less than 0.045, indicating a low proportion of fungi compared to bacteria. The F/B ratio was affected by tillage and was the lowest in the traditional PT tillage.
The value of the “stress factor (PRE/CY)” assesses stressful environments for bacteria, and a lower value indicates greater physiological/nutritional stress for the bacterial community. The stress factor ranged from 0.92 to 5.86 and was the lowest in the non-irrigated plots with NPK fertilization and PT tillage.
3.4. The Results of PCA
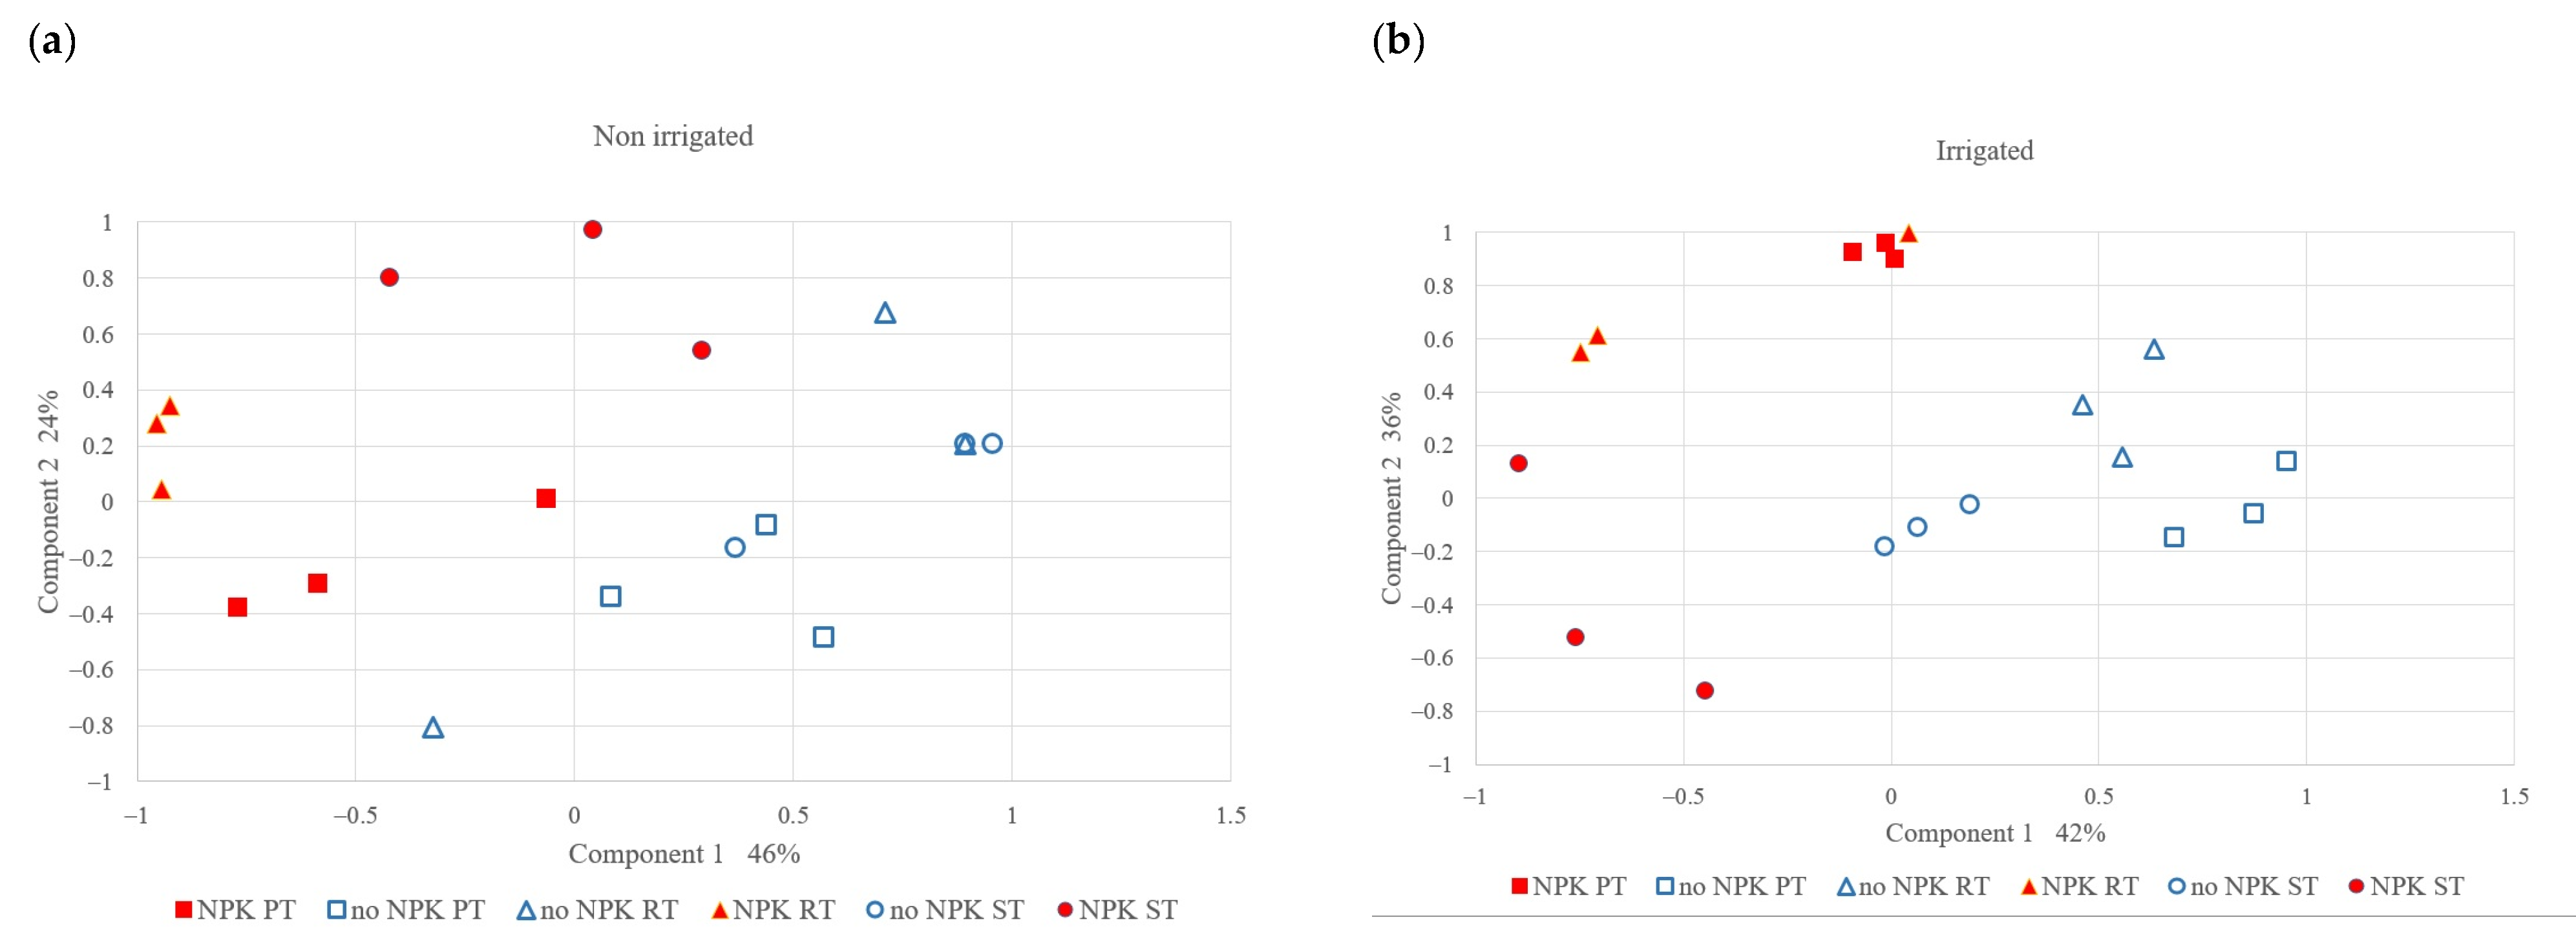
The PCA results showed (Figure 5) that the effect of NPK fertilization on microbial community variation was more dominant than that of tillage and irrigation. The first component explained 46% and 42% of the microbial community variation in the non-irrigated and irrigated treatments, respectively. Notably, the fertilized and control treatments were separated in terms of the first component: the control treatment (without fertilization), was mainly located on the left side and the fertilized treatments were on the right side. The tillage treatments (different shape markers) were not separated in terms of the first component. The second component accounted for 24% and 31% of the microbial community variation in the case of the non-irrigated and irrigated plots, respectively. In the case of the fertilized plots, the different tillage methods were separated along the second axis. Among the three tillage methods, the PT and ST plots were isolated from each other: the ST plots were mainly located in the lower half and the PT plots were in the upper half.
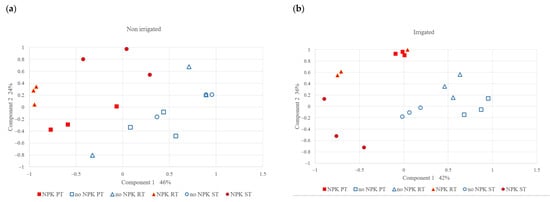
Figure 5.
PCA analysis of microbial community structure (a) in the non-irrigated and (b) irrigated plots.
4. Discussion
4.1. Effects of Tillage Methods
Based on our results, the SOC and TN content were significantly higher in the RT and ST plots compared to the PT plots. The reason for this could be that reduced tillage helps maintain the soil structure and promotes the stability of aggregates, which protects organic matter from decomposition and allows SOC to accumulate. In contrast, intensive tillage disrupts the soil structure and accelerates the decomposition of organic matter. Our results are in good agreement with other comparative studies on carbon sequestration under minimum tillage compared to the plowing tillage method [35]. This study also shows a negative effect of conventional tillage on the soil organic matter content and an increase in the mineralization rate.
The increased amount of SOC and TN, as available nutrient sources for soil microorganisms, in the RT and ST plots resulted in more intense soil microbial activity compared to that in the PT plots. This finding was supported by the fact that the CO2 emission of soil during the 10-day soil incubation period was also significantly higher in the ST and RT plots than in the PT plots. Our results are in good agreement with the study of Iqbal [36], who also observed a positive relationship between CO2 emission and SOC. The dehydrogenase, saccharase, and phosphatase activities were also higher in plots with reduced tillage practices, than with PT. This change was also observed by Romaneckas [37], who found that the saccharase activity increased more in the reduced tillage plots than in the conventional tillage plots.
Not only the enzyme activities and CO2 emission but also the microbial biomass, estimated by the total PLFAs in the soil, was the highest with ST, followed by with RT and then the lowest with PT. The decrease in the microbial biomass with PT is related to the decrease in the fungal biomass. The reason for this could be that PT can be characterized by the strongest physical disturbances leading to fungal decline, as its fragile hyphae are sensitive to soil disturbances [38]. Calderon [39] also found a strong correlation between increasing tillage intensity and declines in fungal PLFA biomarkers. In addition to the alterations in fungal biomass, there was also a decrease in the total bacterial biomass. The bacterial community also changed when comparing PT to RT and ST. Our results showed that the amount of the total bacteria and GN bacteria as well—which are more sensitive to environmental stress—was also the lowest with PT and was the highest in the irrigated control of ST, where environmental stress seemed to be the lowest. This was also confirmed by the high “stress factor (PRE/CY)” value in these plots. At the same time, the amount of GP bacteria, which are generally more tolerant to environmental changes due to their stronger cell walls, did not change with the different tillage systems.
The change in the microbial community, represented by the change in the fungal-to-bacterial ratio (F/B) of the microbial biomass can be used to provide information about environmental change. With PT, where the physical disturbance of the soil seemed to be most severe, the F/B ratio in most cases was lower compared to that with RT and ST. Bardgett [40] also reported that, under disturbed ecosystems, in intensively managed soils, the ratio of fungi to bacteria decreased compared to that in extensively managed soils.
4.2. Effects of NPK Fertilization
As a result of NPK application, the TN and SOC significantly increased, while the soil pH lowered by almost one unit compared to the control. The acidifying effect was due to the long-term application of ammonium nitrate and potassium chloride. The rise in the SOC occurred due to the higher amount of crop residues in the fertilized plots.
The soil bioactivity was affected by chemical fertilization. The dehydrogenase enzyme activity, as an indicator of the microbial activity of soil microorganisms, decreased significantly in the fertilized plots compared to the control. Our results are consistent with those of Rao [41], who also found that N fertilization decreased the soil DHA and stated that a decrease in activity was probably due to soil acidification. At the same time, NPK fertilization significantly increased the UA of the soil. Nitrogen was applied as a urea ammonium nitrate solution in spring, which explains the greater increase in the UA in the fertilized plots. Bååth [42] demonstrated a close relationship between the soil pH and enzyme activity. Each soil enzyme has a specific pH range for its optimal activity. Consequently, the change in the soil pH has different effects on the activities of various soil enzymes [43].
The soil microbial biomass also decreased In the fertilized plots. Since NPK fertilization lowered the soil pH by almost one unit and soil microbes are sensitive to different environmental changes, this could be one of the reasons for the decrease in the microbial biomass [44]. The results of the PCA also confirmed the significant effects of pH on microbes. The separation between the control and fertilized values along the PCA1 axis was also due to the acidifying effect of fertilization, as the correlations between PCA1 and pH were strong: 0.722 ** and 0.718 **, regarding the irrigated and non-irrigated plots, respectively.
The decrease in the microbial biomass in the fertilized plots was related to the decline in the AM fungi and GN bacteria. The amount of GN bacteria, due to their higher environmental sensitivity, decreased more than the amount of GP bacteria in the fertilized plots.
The results of the “PRE/CY stress factor” also suggested a stressful environment for the bacterial community in the fertilized plots, where this factor became significantly lower compared to the control. In parallel, the PCA results also showed that the microbial communities responded primarily to NPK fertilization.
5. Conclusions
Our study highlighted that the different tillage methods and chemical fertilizers with acidifying effects are all-important key factors in influencing the chemical and microbiological parameters of Chernozem soil. The results demonstrated that reduced tillage (ST, RT), especially ST, caused significantly favorable changes in the soil chemical and microbiological parameters. Strip tillage (ST) led to an almost 28% higher SOC and 30% increased TN levels. Alongside this, there was a significant 66% increase in the microbial biomass, and enhanced enzyme activities compared to that with PT. According to our findings, the most environmentally sound tillage method is ST, which improves the quality of chernozem soil while ensuring a satisfactory crop yield.
This study also confirms that although the applied NPK fertilizers increased the crop yield and enhanced the soil TN and SOC levels, they had a negative impact on the soil microbial activity and reduced the microbial biomass, especially affecting AM fungi and GN bacteria.
The results of this study provide insights into the effects of agricultural practices on soil health in Chernozem, contributing to the implementation of sustainable agricultural management strategies in Hungary and similar agricultural regions.
Author Contributions
Conceptualization, A.B.K. and R.K.; data curation, A.B.K. and Á.B.; formal analysis, E.K.J. and Á.B.; investigation, I.K. and Z.S.; methodology, A.B.K., J.K. and T.R.; software, M.T. and R.K.; writing—original draft, A.B.K.; writing—review and editing, A.B.K., E.K.J. and R.K. All authors have read and agreed to the published version of the manuscript.
Funding
This research was funded by the project “GINOP-2.2.1-15-2016-00001—Developing a scale-independent complex precision consultancy system” and Project no. TKP2021-NKTA-32 has been implemented with the support provided by the Ministry of Culture and Innovation of Hungary from the National Research, Development and Innovation Fund, financed under the TKP2021-NKTA funding scheme.
Institutional Review Board Statement
Not applicable.
Informed Consent Statement
Not applicable.
Data Availability Statement
The data presented in this study are available on request from the corresponding author.
Conflicts of Interest
The authors declare no conflicts of interest. The funders had no role in the design of the study; in the collection, analyses or interpretation of the data; in the writing of the manuscript, or in the decision to publish the results.
References
- Ibáñez, J.; Pérez-Gómez, R.; Martínez, F.S.J. The spatial distribution of soils across Europe: A fractal approach. Ecol. Complex. 2009, 6, 294–301. [Google Scholar] [CrossRef]
- Koós, S.; Pirkó, B.; Szatmári, G.; Csathó, P.; Magyar, M.; Szabó, J.; Fodor, N.; Pásztor, L.; Laborczi, A.; Pokovai, K. Influence of the Shortening of the Winter Fertilization Prohibition Period in Hungary Assessed by Spatial Crop Simulation Analysis. Sustainability 2021, 13, 417. [Google Scholar] [CrossRef]
- Szabó, A. Effects of compost treatments on the dry matter-, ash-, total acidity-, sugar- and Vitamin C content of the integrated and organic produced Golden Delicious and Pinova apples. J. MacroTrends Appl. Sci. 2014, 2, 24–42. [Google Scholar]
- Pirkó, B.; Koós, S.; Szabó, J.; Radimszky, L.; Csathó, P.; Árendás, T.; Fodor, N.; Szabó, A. Results of Hungarian field test trials set up for establishing new maximum permitted N dose values. Stud. Agric. Econ. 2020, 122, 77–85. [Google Scholar] [CrossRef]
- Rasmussen, K. Impact of ploughless soil tillage on yield and soil quality: A Scandinavian review. Soil Tillage Res. 1999, 53, 3–14. [Google Scholar] [CrossRef]
- Licht, M.A.; Al-Kaisi, M. Strip-tillage effect on seedbed soil temperature and other soil physical properties. Soil Tillage Res. 2005, 80, 233–249. [Google Scholar] [CrossRef]
- Mupangwa, W.; Twomlow, S.; Walker, S.; Hove, L. Effect of minimum tillage and mulching on maize (Zea mays L.) yield and water content of clayey and sandy soils. Phys. Chem. Earth Parts A/B/C 2007, 32, 1127–1134. [Google Scholar] [CrossRef]
- Luan, H.; Yuan, S.; Gao, W.; Tang, J.; Li, R.; Zhang, H.; Huang, S. Aggregate-related changes in living microbial biomass and microbial necromass associated with different fertilization patterns of greenhouse vegetable soils. Eur. J. Soil Biol. 2021, 103, 103291. [Google Scholar] [CrossRef]
- Csontos, P.; Mucsi, M.; Ragályi, P.; Tamás, J.; Kalapos, T.; Pápay, G.; Mjazovszky, Á.; Penksza, K.; Szili-Kovács, T. Standing Vegetation Exceeds Soil Microbial Communities in Soil Type Indication: A Procrustes Test of Four Salt-Affected Pastures. Agronomy 2021, 11, 1652. [Google Scholar] [CrossRef]
- Bowles, T.M.; Acosta-Martínez, V.; Calderón, F.; Jackson, L.E. Soil enzyme activities, microbial communities, and carbon and nitrogen availability in organic agroecosystems across an intensively-managed agricultural landscape. Soil Biol. Biochem. 2014, 68, 252–262. [Google Scholar] [CrossRef]
- Kovács, A.B.; Kremper, R.; Kincses, I.; Leviczky, Á. Influences of different organic fertilizers on nutrients of humic sandy soil and on the growth of Spinach (Spinacia oleracea L.). Acta Agrar. Debreceniensis 2016, 70, 23–28. [Google Scholar] [CrossRef]
- Cookson, W.R.; Murphy, D.V.; Roper, M.M. Characterizing the relationships between soil organic matter components and microbial function and composition along a tillage disturbance gradient. Soil Biol. Biochem. 2008, 40, 763–777. [Google Scholar] [CrossRef]
- Dai, H.; Zhang, H.; Li, Z.; Liu, K.; Zamanian, K. Tillage Practice Impacts on the Carbon Sequestration Potential of Topsoil Microbial Communities in an Agricultural Field. Agronomy 2021, 11, 60. [Google Scholar] [CrossRef]
- Demeter, I.; Makadi, M.; Tomocsik, A.; Aranyos, T.; Micheli, E.; Posta, K. Chemical and microbiological properties of Hungarian sandy soils under different management practices. Appl. Ecol. Environ. Res. 2018, 16, 3473–3488. [Google Scholar] [CrossRef]
- Young, I.; Ritz, K. Tillage, habitat space and function of soil microbes. Soil Tillage Res. 2000, 53, 201–213. [Google Scholar] [CrossRef]
- Helgason, B.L.; Walley, F.L.; Germida, J.J. Fungal and bacterial abundance in long-term no-till and intensive-till soils of the northern great plains. Soil Sci. Soc. Am. J. 2009, 73, 120–127. [Google Scholar] [CrossRef]
- Säle, V.; Aguilera, P.; Laczko, E.; Mäder, P.; Berner, A.; Zihlmann, U.; van der Heijden, M.G.; Oehl, F. Impact of conservation tillage and organic farming on the diversity of arbuscular mycorrhizal fungi. Soil Biol. Biochem. 2015, 84, 38–52. [Google Scholar] [CrossRef]
- Kádár, I.; Ragályi, P. Mineral fertilization and grass productivity in a long-term field experiment. Arch. Agron. Soil Sci. 2012, 58 (Suppl. S1), S127–S131. [Google Scholar] [CrossRef]
- WRB, I.-W. World reference base for soil resources. World Soil Resour. Rep. 2006, 103, 1–128. [Google Scholar]
- Tamás, A.; Kovács, E.; Horváth, É.; Juhász, C.; Radócz, L.; Rátonyi, T.; Ragán, P. Assessment of NDVI Dynamics of Maize (Zea mays L.) and Its Relation to Grain Yield in a Polyfactorial Experiment Based on Remote Sensing. Agriculture 2023, 13, 689. [Google Scholar] [CrossRef]
- Öhlinger, R. Soil respiration by titration. In Methods in Soil Biology; Springer: Berlin/Heidelberg, Germany, 1995; pp. 95–98. [Google Scholar]
- Von Mersi, W.; Schinner, F. Dehydrogenase activity with the substrate INT. In Methods in Soil Biology; Springer: Berlin/Heidelberg, Germany, 1996; pp. 243–245. [Google Scholar]
- Frankeberger, W.; Johanson, J. Method of measuring invertase activity in soils. Plant Soil 1983, 74, 301–311. [Google Scholar] [CrossRef]
- Kandeler, E.; Gerber, H. Short-term assay of soil urease activity using colorimetric determination of ammonium. Biol. Fertil. Soils 1988, 6, 68–72. [Google Scholar] [CrossRef]
- Tabatabai, M. Soil enzymes. In Methods of Soil Analysis: Part 2 Microbiological and Biochemical Properties; John and Wiley and Son: Hoboken, NJ, USA, 1994; Volume 5, pp. 775–833. [Google Scholar] [CrossRef]
- Ellis, S.; Ritz, K. A modified high-throughput analysis of PLFAs in soil. MethodsX 2018, 5, 1491–1497. [Google Scholar] [CrossRef] [PubMed]
- Frostegård, Å.; Tunlid, A.; Bååth, E. Phospholipid fatty acid composition, biomass, and activity of microbial communities from two soil types experimentally exposed to different heavy metals. Appl. Environ. Microbiol. 1993, 59, 3605–3617. [Google Scholar] [CrossRef] [PubMed]
- Gude, A.; Kandeler, E.; Gleixner, G. Input related microbial carbon dynamic of soil organic matter in particle size fractions. Soil Biol. Biochem. 2012, 47, 209–219. [Google Scholar] [CrossRef]
- Zelles, L. Fatty acid patterns of phospholipids and lipopolysaccharides in the characterisation of microbial communities in soil: A review. Biol. Fertil. Soils 1999, 29, 111–129. [Google Scholar] [CrossRef]
- Bach, E.M.; Baer, S.G.; Meyer, C.K.; Six, J. Soil texture affects soil microbial and structural recovery during grassland restoration. Soil Biol. Biochem. 2010, 42, 2182–2191. [Google Scholar] [CrossRef]
- Reichardt, W.; Mascarina, G.; Padre, B.; Doll, J. Microbial communities of continuously cropped, irrigated rice fields. Appl. Environ. Microbiol. 1997, 63, 233–238. [Google Scholar] [CrossRef]
- Balser, T.C.; Gutknecht, J.L.; Liang, C. How will climate change impact soil microbial communities? In Soil Microbiology and Sustainable Crop Production; Springer: Berlin/Heidelberg, Germany, 2010; pp. 373–397. [Google Scholar] [CrossRef]
- Klikocka, H.; Narolski, B.; Klikocka, O.; Glowacka, A.; Juszczak, D.; Onuch, J.; Gaj, R.; Michałkiewicz, G.; Cybulska, M.; Stepaniuk, S. The effect of soil tillage and nitrogen fertilization on microbiological parameters of soil on which spring Triticale is grown. Pol. J. Environ. Stud. 2012, 21, 1675–1685. [Google Scholar]
- Oehl, F.; Sieverding, E.; Mäder, P.; Dubois, D.; Ineichen, K.; Boller, T.; Wiemken, A. Impact of long-term conventional and organic farming on the diversity of arbuscular mycorrhizal fungi. Oecologia 2004, 138, 574–583. [Google Scholar] [CrossRef] [PubMed]
- Jaskulska, I.; Jaskulski, D. Change in soil properties after 5 years of using strip-till technology. Mech. Agric. Conserv. Resour. 2019, 65, 193–195. [Google Scholar]
- Iqbal, J.; Hu, R.; Feng, M.; Lin, S.; Malghani, S.; Ali, I.M. Microbial biomass, and dissolved organic carbon and nitrogen strongly affect soil respiration in different land uses: A case study at Three Gorges Reservoir Area, South China. Agric. Ecosyst. Environ. 2010, 137, 294–307. [Google Scholar] [CrossRef]
- Romaneckas, K.; Avizienyte, D.; Boguzas, V.; Sarauskis, E.; Jasinskas, A.; Marks, M. Impact of tillage systems on chemical, biochemical and biological composition of soil. J. Elem. 2016, 21, 513–526. [Google Scholar]
- Ghimire, R.; Thapa, V.R.; Acosta-Martinez, V.; Schipanski, M.; Slaughter, L.C.; Fonte, S.J.; Shukla, M.K.; Bista, P.; Angadi, S.V.; Mikha, M.M. Soil Health Assessment and Management Framework for Water-Limited Environments: Examples from the Great Plains of the USA. Soil Syst. 2023, 7, 22. [Google Scholar] [CrossRef]
- Calderon, F.J.; Jackson, L.E.; Scow, K.M.; Rolston, D.E. Short-term dynamics of nitrogen, microbial activity, and phospholipid fatty acids after tillage. Soil Sci. Soc. Am. J. 2001, 65, 118–126. [Google Scholar] [CrossRef]
- Bardgett, R.D.; Jones, A.C.; Jones, D.L.; Kemmitt, S.J.; Cook, R.; Hobbs, P.J. Soil microbial community patterns related to the history and intensity of grazing in sub-montane ecosystems. Soil Biol. Biochem. 2001, 33, 1653–1664. [Google Scholar] [CrossRef]
- Rao, M.; Scelza, R.; Gianfreda, L. Soil enzymes. In Enzymes in Agricultural Sciences; OMICS Group eBooks: Foster City, CA, USA, 2014; pp. 10–43. [Google Scholar]
- Bååth, E. The use of neutral lipid fatty acids to indicate the physiological conditions of soil fungi. Microb. Ecol. 2003, 45, 373–383. [Google Scholar] [CrossRef]
- Aziz, M.A.; Hazra, F.; Salma, S.; Nursyamsi, D. Soil enzyme activities and their relationship to total soil bacteria, soil microbial biomass and soil chemical characteristics of organic and conventional farming. J. Trop. Soils 2019, 23, 133–141. [Google Scholar]
- Rousk, J.; Brookes, P.C.; Bååth, E. The microbial PLFA composition as affected by pH in an arable soil. Soil Biol. Biochem. 2010, 42, 516–520. [Google Scholar] [CrossRef]

Disclaimer/Publisher’s Note: The statements, opinions and data contained in all publications are solely those of the individual author(s) and contributor(s) and not of MDPI and/or the editor(s). MDPI and/or the editor(s) disclaim responsibility for any injury to people or property resulting from any ideas, methods, instructions or products referred to in the content. |
© 2024 by the authors. Licensee MDPI, Basel, Switzerland. This article is an open access article distributed under the terms and conditions of the Creative Commons Attribution (CC BY) license (https://creativecommons.org/licenses/by/4.0/).