Article

Impacts of Cropping Systems on Glyphosate and Aminomethylphosphonic Acid Contents and Microbial Community in Field Crop Soils in Quebec (Canada)

1
GEOTOP and Institut des Sciences de l’Environnement, Université du Québec à Montréal, Montreal, QC H3C 3P8, Canada
2
Institut de Recherche et de Développement en Agroenvironnement (IRDA), Quebec City, QC G1P 3W8, Canada
*
Author to whom correspondence should be addressed.
Agronomy 2024, 14(4), 686; https://doi.org/10.3390/agronomy14040686
Submission received: 28 February 2024 / Revised: 21 March 2024 / Accepted: 22 March 2024 / Published: 27 March 2024

Abstract

:
Glyphosate-based herbicide (GBH) usage is ubiquitous in Quebec field crops, apart from organic management. As glyphosate generally degrades rapidly in agricultural soils, aminomethylphosphonic acid (AMPA) is produced and persists longer than glyphosate. Repeated GBH applications year after year raise questions about glyphosate and AMPA pseudo-persistence in soils and its possible impacts on the soil microbial community. This research aims at understanding the influence of cropping systems and edaphic properties on glyphosate and AMPA contents and on the diversity and composition of the soil microbial community across nine field crop fields located in Southern Quebec (Canada) during 2019 and 2020. Average glyphosate soil contents (0.16 ± 0.15 µg·g−1 dry soil) were lower than average AMPA soil contents (0.37 ± 0.24 µg·g−1 dry soil). Glyphosate and AMPA contents were significantly lower at sites cultivated under organic management than conventional management. For conventional sites, cumulative GBH doses had a significant effect on glyphosate soil contents measured at the end of the growing season, but not on AMPA soil contents. Sites with higher GBH applications appear to accumulate glyphosate over time in the 0–40 cm soil horizon. Glyphosate and AMPA soil contents are inversely proportional to soil pH. Soil prokaryotic and fungal communities’ alpha-diversity, beta-diversity, and functional potential were not impacted by cumulative GBH doses, but rather by soil chemical properties, soil texture, crop rotation, and manure inputs.

1. Introduction

The commercialization of glyphosate-resistant crops in the mid-1990s resulted in a major increase in the use of glyphosate-based herbicide (GBH) [1]. GBH can be applied as pre- and post-emergence applications on glyphosate-resistant crops [2]. In 2021, GBH was the most used herbicide representing close to 50% of all herbicides sold in Quebec, Canada [3]. Glyphosate has an affinity to be adsorbed to soil particles, although it may be transported to lower soil profiles depending on weather conditions and precipitation following GBH application [4,5]. Glyphosate adsorption ability on soil particles is influenced by cation exchange capacity (CEC), soil texture, P and Al contents, soil organic carbon quantity, and pH [6,7,8]. Spayed glyphosate molecules that do not adsorb on plant tissues or soil particles will migrate within soil interstitial waters, where glyphosate is prone to degradation [4]. Glyphosate degradation is mostly biological, although abiotic pathways such as photolysis and thermolysis can degrade glyphosate, producing a variety of metabolites, including aminomethylphosphonic acid (AMPA) [9,10]. Glyphosate biodegradation involves three major metabolites, AMPA, sarcosine, and acetyl-glyphosate [11]. The pathway that produces AMPA is generally favored over the two other pathways in soils, with about 90% of glyphosate metabolites being AMPA molecules [4]. Glyphosate half-life is reported to range between 1 and 197 days, while AMPA half-life is between 23 and 958 days in temperate agricultural soils [12]. Once in the soil, AMPA is more resistant to biodegradation and has a higher affinity to soil particles compared to glyphosate, which increases its half-life in the soil [13,14]. Nonetheless, both molecules have similar physico-chemical properties with high water solubility, low lipophilicity, and very low volatilization potential [15,16]. The main difference between both molecules is their molecular weight (169.07 g·mol−1 for glyphosate and 111.04 g·mol−1 for AMPA) [17].
Conservation agriculture is gaining popularity among farmers and crop advisors to maintain high crop productivity while maintaining soil-beneficial microbial community and ecosystemic functions, reducing GHG, and increasing carbon sequestration and climate change resilience [18]. According to the Food and Agriculture Organization: “Conservation Agriculture is a farming system that promotes minimum soil disturbance (i.e., no tillage), maintenance of a permanent soil cover, and diversification of plant species. It enhances biodiversity and natural biological processes above and below the ground surface, contributing to increased water and nutrient use efficiency and to improved and sustained crop production” [19]. Quebec’s field crop production, such as grain corn, usually involves either mechanical or chemical weeding strategies [20]. For producers adopting Conservation Agriculture principles such as no-till and winter cover crops, mechanical weed control is more restrictive or not recommended, resulting in a dependency on higher herbicide application doses to control problematic weeds such as perennial ones [21]. The use of higher GBH doses could be of concern for potential glyphosate and AMPA accumulation in soils or dissipation into waterways. This is of high relevance as glyphosate and AMPA were, respectively, detected in 98.9% and 93.3% of water samples from agricultural streams in Quebec between 2018 and 2020 [22]. Glyphosate and AMPA were detected in 42% and 70%, respectively, of 45 Québec agricultural soils in 2014 [23].
High-throughput sequencing (HTS), also known as next-generation sequencing, has revolutionized the study of soil microbial communities. Compared to techniques such as culture-based isolation, denaturing gradient gel electrophoresis, temperature gradient gel electrophoresis, single-strand conformation polymorphism, and DNA amplification fingerprinting, HTS is high-throughput, less expensive, and less labor-intensive [24]. With HTS, taxonomic identification is performed based on databases for specific portions of genes, for instance, the V4 region of the rRNA 16S [25], ITS1 [26], and rRNA 18S [27] for prokaryotic, fungal, and eukaryotic communities, respectively. Additionally, quantitative polymerase chain reaction (qPCR) of specific regions of the rRNA genes could be used to estimate microbial biomass, while qPCR of specific microbial genes could also be used to quantify biological pathways such as carbon fixation [28], nitrification [29] or pesticide degradation [30], which can be labor-intensive when analyzing multiple genes. The advent of databases such as Kyoto Encyclopedia of Genes and Genomes (KEGG) allows for the direct attribution of functional potential to microbial communities identified through HTS [31]. Nonetheless, HTS has limitations, based on the quality of the database used for taxonomic and functional potential identifications. For instance, fungal taxonomic identification is limited due to intraspecific variability in ITS1 sequences [32].
Previous investigations of the soil microbial community following GBH application showed no effect on alpha-diversity or on overall composition [33,34,35,36]. On the other hand, cropping techniques used in conservation agriculture, such as reduced tillage or cover crop utilization, are known to significantly increase soil microbial alpha-diversity and have a profound effect on microbial community composition [37,38,39]. The interacting effects of GBH applications and cropping system strategies on soil microbial communities have received little attention so far [33,36]. Studies have so far focused on differences in previous years’ GBH applications [36] or differences in tillage regime (no-till vs. chisel tillage) [33]; however, these studies used experimental plots with controlled cropping systems, focusing on one parameter at a time. To our knowledge, there is no investigation in commercial producers’ fields where these factors (herbicide application history, tillage regime, cover crop utilization) all vary between producers.
To have a better understanding of the interacting effects of management variables that define cropping systems such as crop rotations, manure applications, tillage, and GBH application doses on glyphosate and AMPA contents and on the diversity of microbial communities in soils, we sampled soils on nine field crop fields during two consecutive years. We hypothesized that glyphosate and AMPA contents would be linked to GBH doses applied over the previous years and to soil properties such as CEC, pH, and phosphorus content. Additionally, we hypothesized that the diversity (richness and composition) and functional diversity of the soil microbial community would be influenced by the combination of GBH applications, soil properties, and cropping system management practices.

2. Materials and Methods

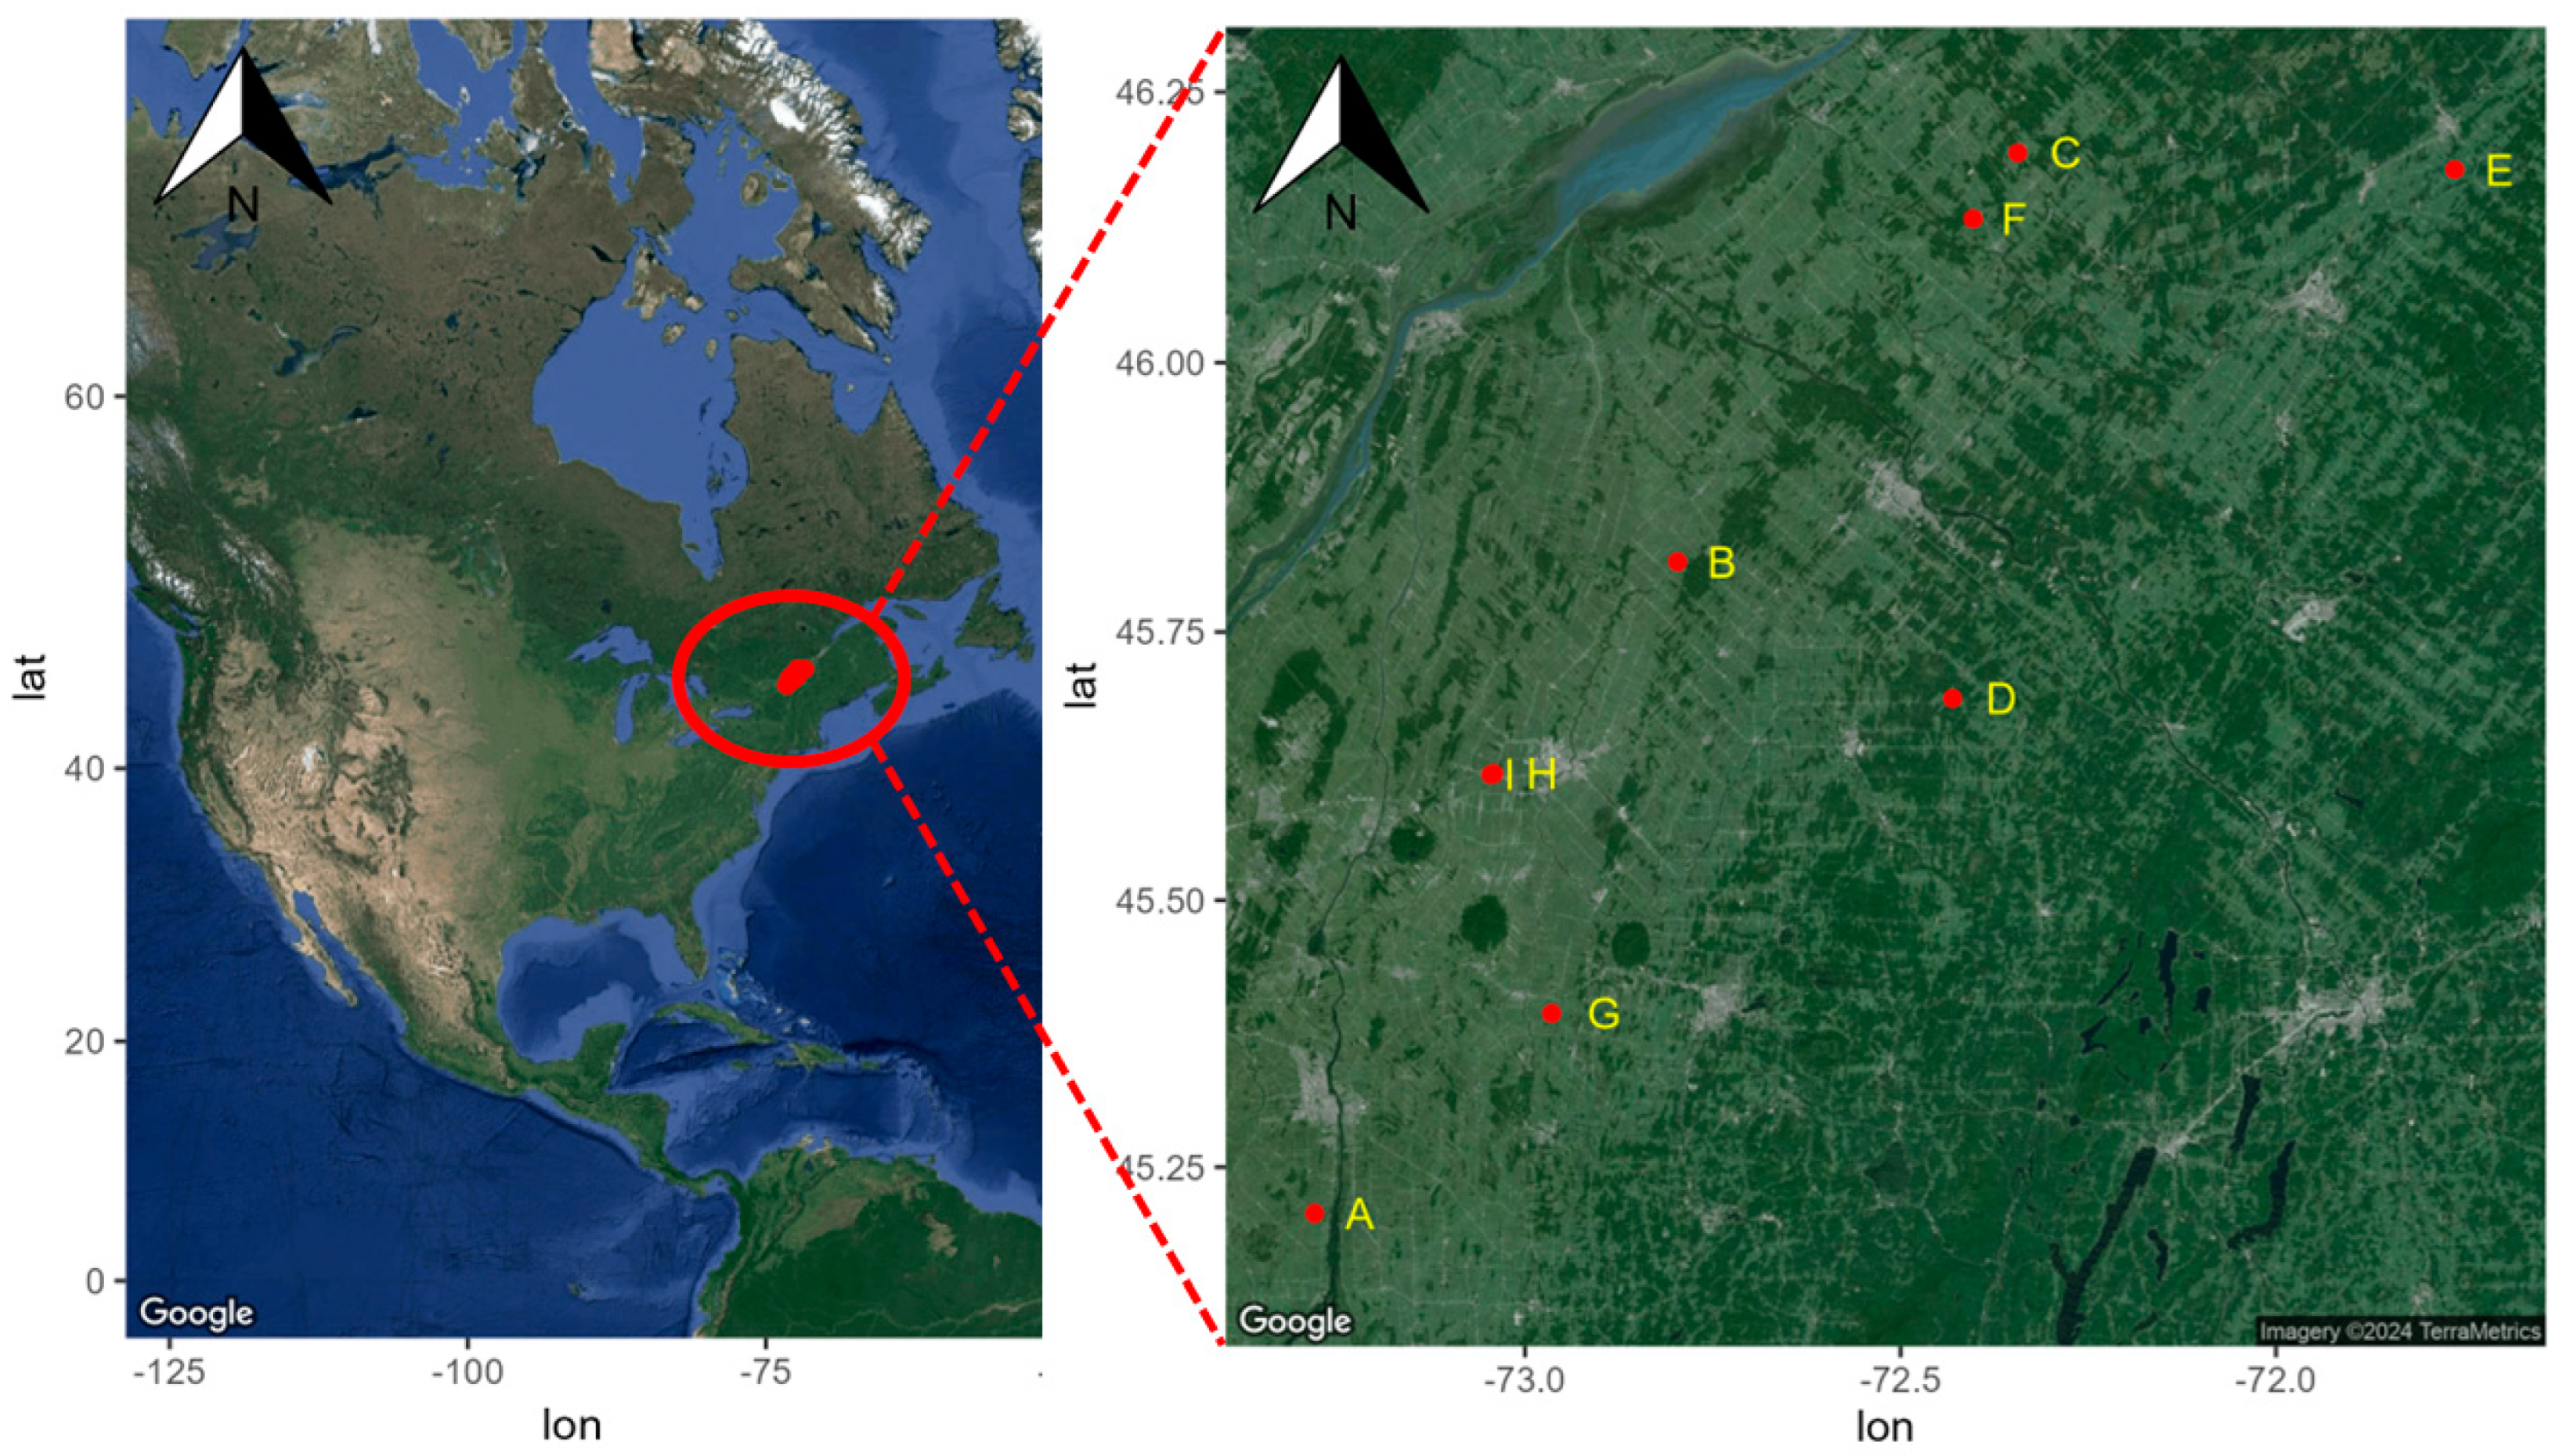
2.1. Sites selection and Description

Nine fields with a rotation, including corn in 2019 and soybean in 2020, were selected in Southern Quebec (Canada). The Montérégie-Est and Centre-du-Québec regions represent, respectively, 62% and 15% of field crop areas in the province (Figure 1). Two fields (sites H and I) are managed by the same producer. Field selection aimed at establishing a gradient of cropping systems ranging from organic systems with no GBH application and conventional tillage to no-till systems with variable doses of GBH applied.
Following site selection, a survey was sent to the farmers owning the nine sites. The survey included questions about soil tillage frequency and intensity, organic and mineral fertilization strategy, pesticide applications, seeding and harvest of field crops’ information, and cover crop usage. From the information collected in the surveys, the nine sites were divided into different groups based on crop rotation used, frequency of manure application, tillage intensity, and cumulative amounts of GBH applied over the past 4 years (Figure 2). Crop rotations were divided into four categories; two rotations were corn alternated with soybean, one under organic management and the other under conventional management. Another rotation included corn and soybean as main crops, along with cereal rye as a cover crop between harvest and seeding. The fourth rotation included corn, soybean, and wheat as main crops; a cover crop mixture was sown after wheat harvest. Manure frequency was based on the applications made between 2017 and 2020. Two applications or more were categorized as frequent, one as infrequent, and no application as never. For GBH applications, the number of grams of glyphosate sprayed per hectare between 2017 and 2020 was compiled (Table 1) and classified into two groups (>5400 g·ha−1 and <5400 g·ha−1). Table 2 shows key physico-chemical properties from the nine sites.

2.2. Soil Sampling

During September 2019 and 2020, each site was sampled at the same four georeferenced locations. These locations represented the extremity of a square, with its side measuring 50 m. At each location, soil cores were collected at two depths (0–20 cm and 20–40 cm) using an 8 cm diameter manual soil corer. Each sample consisted of a composite of four soil cores (total of ±500 g) collected at the extremity of a square with a length of one meter per side. Following sampling, all soils were homogenized, immediately put on ice, and transferred to −20 °C until further processing.

2.3. Analysis of Glyphosate and AMPA Contents

Glyphosate and AMPA extractions were performed according to the approach described by Samson-Brais, et al. [40]. Soils were freeze-dried and crushed using a pillar and mortar. Five grams of soil passed through a 2-mm sieve were mixed with 40 mL of an extraction solution composed of 34.5 mL of NH4OH (28–30%) (Fisher Scientific, Ottawa, ON, Canada) with 13.6 g of KH2PO4 (Fisher Scientific, Ottawa, ON, Canada) in a total volume of 1 L [41]. The solution was mixed on a rotating wheel at 300 rpm for 45 min followed by centrifugation at 3500 rpm for 20 min. Then, 40 µL of the supernatant was transferred and evaporated to dryness under nitrogen flow. Samples were then derivatized using 1 mL of trifluoroacetic anhydride (TFAA) (Sigma-Aldrich, Saint-Louis, MO, USA) and 500 μL of trifluoroethanol (TFE) (Sigma-Aldrich, Saint-Louis, MO, USA), followed by heating for one hour at 100 °C. After heating, samples were cooled to room temperature, evaporated to dryness under nitrogen flow and then resuspended with 1 mL of ethyl acetate before injection (0.5 μL). A Varian CP 3800 gas chromatograph coupled with an electron capture detector and equipped with a Rxi-5Sil MS column (Restek, Bellefonte, PA, USA) (30 m × 0.25 mm × 0.25 μm) was used for glyphosate and AMPA quantification. The injector and detector were held at 280 °C and 300 °C, respectively. Hydrogen was used as the carrier gas with a column flow of 1.4 mL·min−1. The oven temperature program began at an initial temperature of 70 °C, which was held for 1 min, followed by a 1 °C·min−1 increase up to 84 °C, followed by a 4 °C·min−1 increase up to 120 °C, and then followed by an 80 °C·min−1 increase up to 250 °C held for 7 min, for a total run time of 32.63 min.
The calculated limits of detection (LOD) and quantification (LOQ) are, respectively, 0.03 and 0.09 µg·g−1 dry soil for AMPA and 0.02 and 0.05 µg·g−1 dry soil for glyphosate [23]. Samples with values lower than the LOD are adjusted to 0.02 µg·g−1 dry soil for AMPA and 0.01 µg·g−1 dry soil for glyphosate, while samples with values between the LOD and the LOQ are adjusted to 0.06 µg·g−1 dry soil for AMPA and 0.03 µg·g−1 dry soil for glyphosate. To quantify glyphosate and AMPA, a calibration curve was made with a sample matrix including a blank and five different standards for each batch of samples (0, 0.1, 0.2, 0.3, 0.4, and 0.6 μg·g−1, and 0, 0.2, 0.4, 0.6, 0.8, and 1.2 μg·g−1 for glyphosate and AMPA, respectively). Calibration curves showed good linearity (r2 > 0.95; p < 0.0001) within the expected concentration range.

2.4. Soil Physico-Chemical Properties Analysis

Physical (granulometry, texture) and chemical (total C and N, OM, pH, CEC, Mehlich-3 elements) properties (Table 2) were all determined at the IRDA’s laboratory of agroenvironmental analysis. The soil moisture content was determined by oven-drying at 105 °C for 24 h. Composite soil samples were air-dried, homogenized, and sieved to <2 mm. Total C and total N were determined on finely ground (100 mesh) subsamples by dry combustion using a LECO-CN828 analyzer. The percentage of organic matter was determined by loss ignition at 375 °C [42]. Soil pH was determined using a soil:water 1:1 suspension [43]. A similar procedure was used with a soil:SMP solution 1:1 suspension to determine soil buffer pH [44]. The concentrations of P, K, Ca, Mg, Al, B, Cu, Fe, Mn, Zn, and Na were determined using an inductively coupled plasma optical emission spectrometer (ICP-OES, Perkin Elmer Optima 4300DV, Shelton, CT, USA) after Mehlich 3 extraction [45]. The CEC was obtained by calculating base and acid cations using extractable Mehlich-3 K, Ca, Mg, and Na results and soil buffer pH [46]. The phosphorus saturation ratio (ISP) was calculated by dividing extractable Mehlich-3 P by extractable Mehlich-3 Al [47].

2.5. DNA Extraction, Sequencing and Quantitative PCR of Bacterial and Fungal DNA

DNA extractions were performed using a FastDNA Spin Kit for Soil (MPBio, Irvine, CA, USA). Soil samples were added to tubes containing 1 mL of the lysis buffer and 1.4 g of the bead matrix E supplied with the kit. DNA extraction was performed according to the manufacturer’s instructions. The resulting DNA pellet was suspended in 100 µL of sterile molecular-grade water.
DNA extract quantity and quality were evaluated by spectrophotometry using a Biophotometer (Eppendorf, Mississauga, ON, Canada) with a G1.0 μCuvette (Eppendorf, Mississauga, ON, Canada) with readings at 260, 280, 230, and 320 nm. The V4 region of the prokaryota (archaea and bacteria) rRNA 16S gene was amplified using 515FB and 806RB primers [25,48]. For the fungi, the eukaryotic (fungal) ITS1 gene was amplified using BITS-ITS1 and B58S3 primers [26]. For the eukaryotic communities, the eukaryotic rRNA 18S gene was amplified using E572F and B-E1009R primers [27]. All genes were amplified in a two-step dual-indexed approach PCR designed for Illumina instruments by Plateforme d’analyses génomiques (IBIS, Université Laval, Quebec City, QC, Canada).
DNA sequencing was performed by IBIS on an Illumina MiSeq platform, following the methods of Jeanne et al. [49]. The procedures used for fungal DNA amplification and sequencing were similar to the procedures used for prokaryotic DNA amplification. Obtained sequences were demultiplexed based on the tag used. Sequence quality control and features table construction were performed using QIIME2 [50] and the DADA2 plugin [51]. Reference databases SILVA 138 [52] (prokaryotic and eukaryotic communities) and UNITE version 8 [53] (fungal community) were used for taxonomic identification of amplicon sequence variants [54].
Total bacteria and total fungi amounts were quantified following the approach mentioned in [55]. Briefly, the primer pairs Eub-338/Eub518 and FF390/FR1 were used for total bacteria and total fungi, respectively. From the average CT values of samples, amplification units were derived using linear regressions designed by the Microbial Ecology Laboratory of the Institut de Recherche et Développement en Agroenvironnement (IRDA, Québec, QC, Canada) as described in [56].
To assess the functional potential of the prokaryotic community in soil samples, Picrust2 [57] metabolic inference approaches were used with an updated KEGG PATHWAY database (July 2022) [31] and Enzyme Classification numbers from MetaCyc (EC) [58]. Enzymes and metabolic pathways related to glyphosate included thiO (EC:1.4.3.19) [59], phnP (EC:3.1.4.55), phnN (EC:2.7.4.23), phnM (EC:3.6.1.63), phnJ (EC:4.7.1.1) and phnIGHL (EC:2.7.8.37) [60], and shikimate pathway (M00022), which are all related to glyphosate degradation in the soil and also the shikimate pathway known to be affected by glyphosate. Functional potentials of general pathways such as sulfur metabolism (M00176; M00596; M00595), phosphonate metabolism (Ko00440), nitrification (M00175; M00528; M00530; M00531; M00804), denitrification (M00529; M00973), and carbon fixation (M00165 to M00173; M00374 to M00377; M00579; M00620) were computed. Representative amplicon sequence variants (ASV) were used from QIIME2 analysis without filtration, followed by the default pipeline with input gene family abundances unstratified by contributing organisms. These values were normalized by subtracting the sample mean value of the pathway and dividing by the sample standard deviation.

2.6. Downstream Data Analysis and Statistical Analysis

All statistical analyses were carried out in R 4.2.2 [61]. Glyphosate and AMPA quantifications were visualized in the ggplot2 package. Glyphosate and AMPA contents were log-transformed for statistical analysis. Impacts of sampling year and depth and GBH applications on glyphosate and AMPA contents were first assessed using an ANOVA, followed by a post-hoc pairwise comparison using the TukeyHSD function from the stats package. The differences between glyphosate contents in 2019 and 2020 for each sampling location were used to investigate the dissipation of the molecule and relate it to changes in GBH applications between 2019 and 2020. A similar approach was used to compare the dissipation of AMPA to the change in GBH application between 2019 and 2020. The glyphosate and AMPA soil contents in 2014 were collected from Maccario et al. [23]. An ANOVA followed by the TukeyHSD function was performed on log-transformed values to assess the effect of years on glyphosate and AMPA contents. Multiple regressions were used to evaluate the effect of cumulative GBH applications between 2017 and 2020, soil pH, CEC, clay content, and ISP ratio on glyphosate and AMPA content. A first set of multiple regressions was made with organic and conventional sites, while a second set of multiple regressions was made with only the conventional sites.
For soil prokaryotic, fungal, and eukaryotic communities, the number of reads was normalized at 12,500, 13,000, and 3900 reads, respectively, using the rarefy-even-depth function from the phyloseq R package [62]. Alpha-diversity was measured by Shannon and Chao1 indices with the function estimate_richness from the phyloseq package [63]. The impact of cumulative GBH applications and cropping systems on microbial diversity indices and quantification was analyzed using a mixed model with multiple regressions model, including sampling year and depth as fixed covariates and site as a random effect. Beta-diversity was assessed with principal coordinate analysis (PCoA) with Bray–Curtis dissimilarity for unsupervised ordination of the soil microbial community [64]. Distance-based redundancy analyses (db-RDA) were used to assess the marginal effect of all soil physico-chemical properties on microbial communities’ composition. Soil properties with significant marginal effects were included in another db-RDA with soil management variables.

3. Results

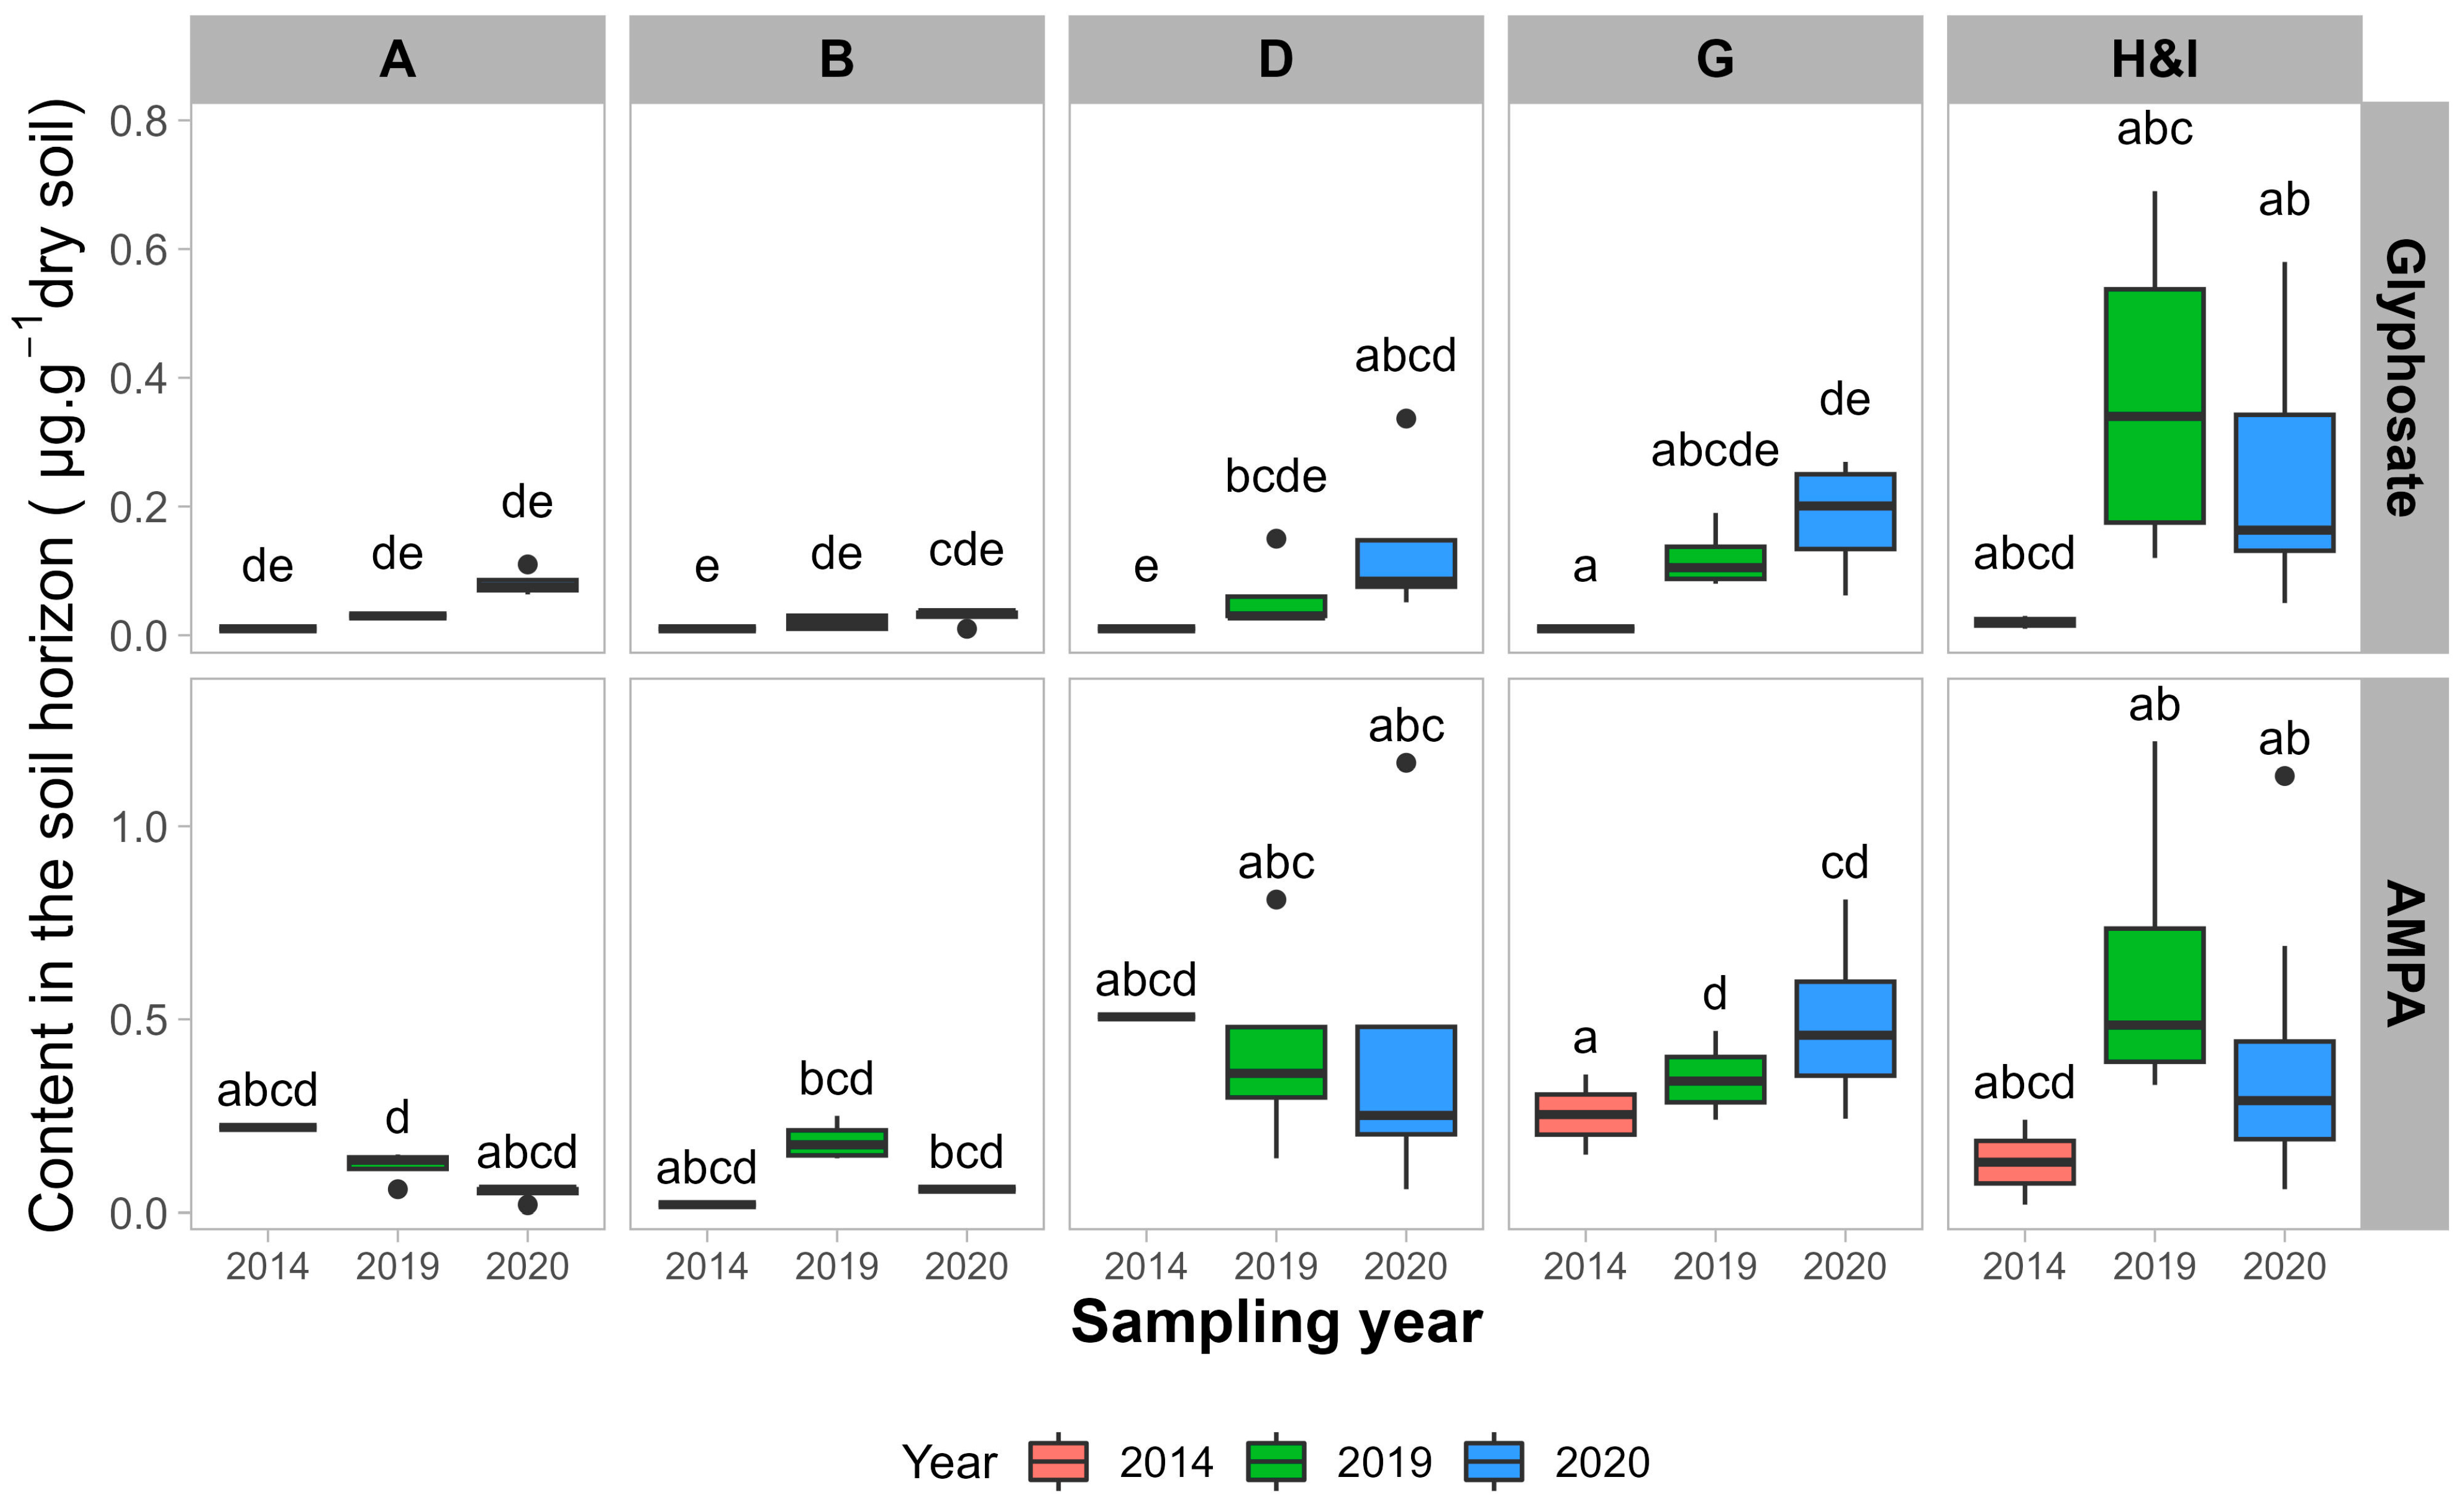
3.1. Glyphosate and AMPA Soil Contents

Soil glyphosate contents range between below the LOD and up to 0.72 µg·g−1 dry soil, while soil AMPA contents range between below the LOD and up to 1.22 µg·g−1 dry soil (Table 3). Overall, 16% and 28% of soil samples present glyphosate contents below the LOD and between the LOD and the LOQ, respectively. Then, 10% and 28% of soil samples have AMPA contents below the LOD and between the LOD and the LOQ, respectively.

3.1.1. Impacts of Sampling Year and Sampling Depth

Glyphosate and AMPA soil contents are significantly related to sampling depth, sampling year, and cumulative GBH applications (p < 0.01). The interaction between sampling year and depth is significant for glyphosate content (p < 0.01), while it is not significant for AMPA (p = 0.66) (Table 3).
Glyphosate soil contents in 2020 at 20–40 cm depth are significantly lower (p < 0.01) than those at 0–20 cm depth for both years and at 20–40 cm depth in 2019. No other significant difference is observed between sampling depth and year. Glyphosate soil contents in conventional sites are significantly higher than those in organic sites (p < 0.01). More specifically, glyphosate soil contents in 2019 at farms that sprayed more than 5400 g·ha−1 between 2017 and 2020 are higher than those at farms that sprayed less than 5400 g·ha−1 (p <0.01).
AMPA soil contents are significantly higher in 2019 compared to 2020 (p < 0.01). AMPA contents are higher in the 0–20 cm depth compared to the 20–40 cm depth (p < 0.01). There is significantly more AMPA in soils at conventional sites compared to organic sites (p < 0.01). However, the difference in AMPA contents between farms that sprayed more than 5400 g·ha−1 and farms that sprayed less than 5400 g·ha−1 is not significant (p = 0.95).
Sites A, B, D, G, H&I are managed by producers who had their fields already sampled in 2014 by Maccario et al. [23]. Comparison between 2014, 2019, and 2020 glyphosate and AMPA content was performed (Figure 3). Organic sites (A and B) exhibit no increase or decrease in glyphosate and AMPA contents. AMPA is not significantly different between all years for all conventional sites, except between 2014 and 2019 for sites H and I. Glyphosate content is significantly higher for sites G and H&I, but not significantly higher for site D. Hence, sites with higher GBH applications between 2017 and 2020 appear to exhibit a significant increase in glyphosate contents between 2014 and 2019–2020.
Glyphosate soil content changes between 2019 and 2020 in the 0–20 cm layer are correlated to changes in GBH applications between the average of 2017–2019 and 2020 (Figure S1). However, this correlation is not observed for glyphosate in the 20–40 cm horizon and AMPA in the 0–20 cm horizon. AMPA contents in the 20–40 cm horizon present a negative correlation with GBH application (Figure S1).

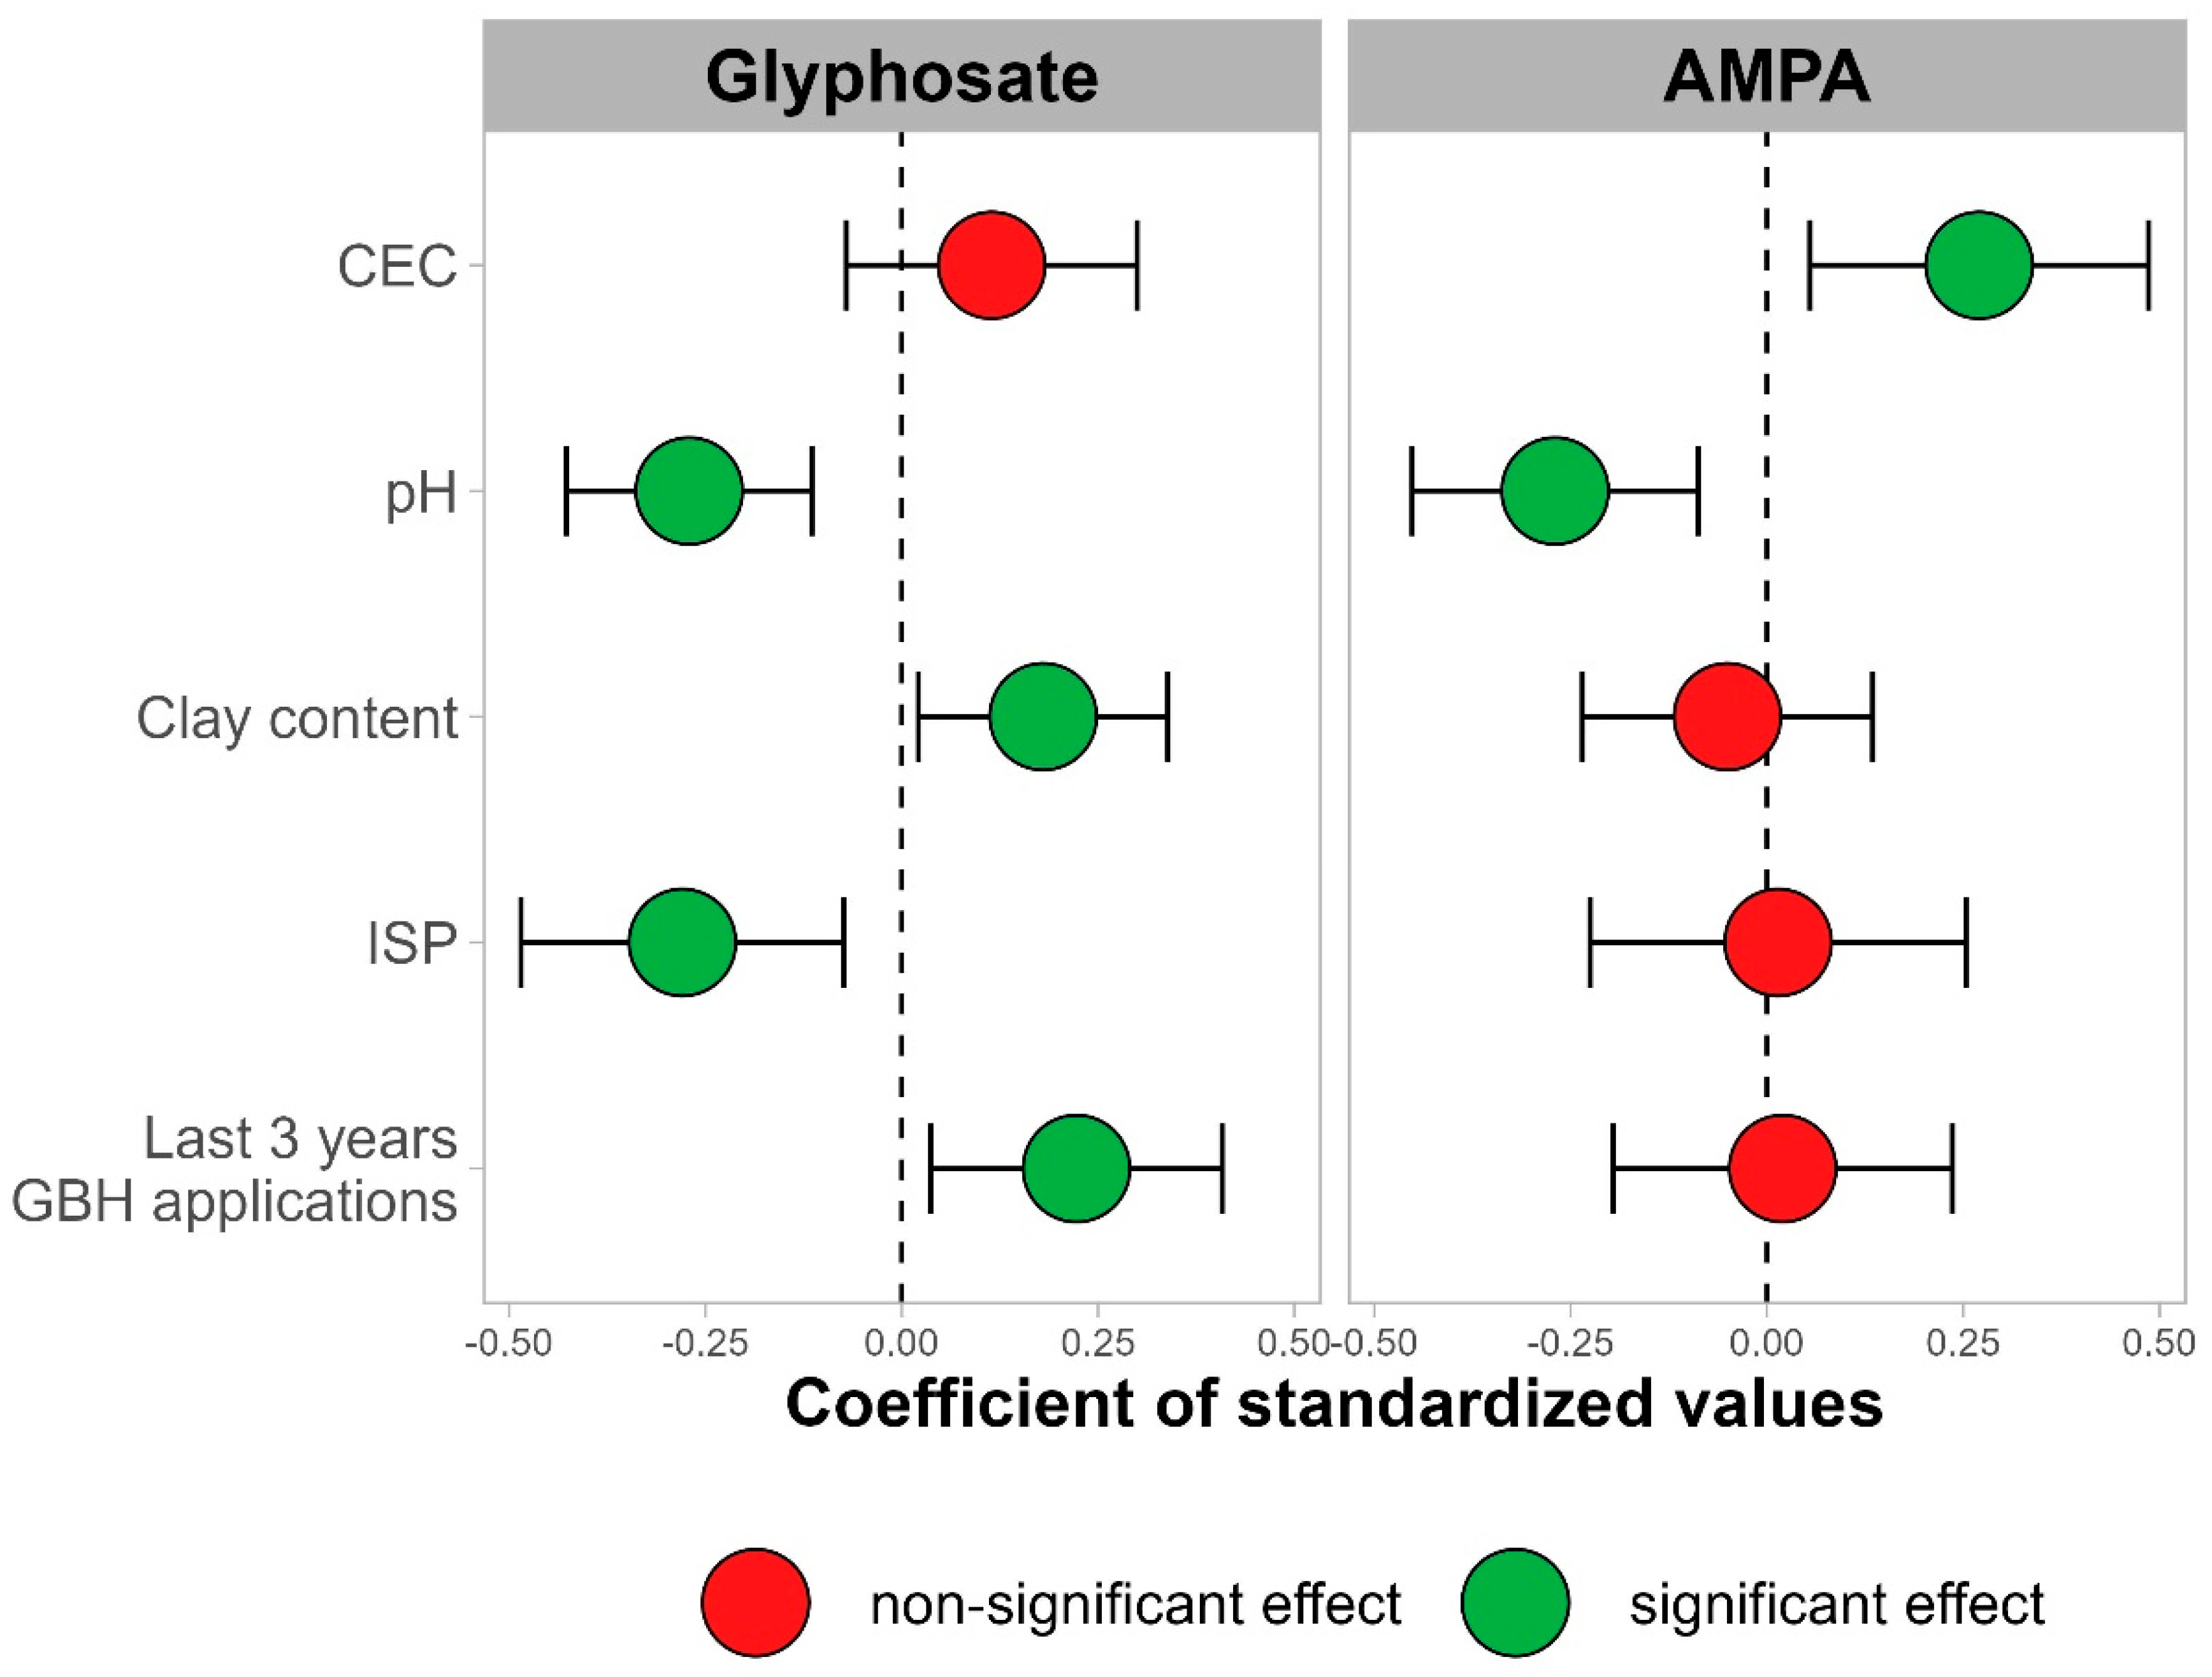
3.1.2. Impacts of Management Practices and Soil Properties

A first set of multiple regressions including organic and conventional sites shows a significant correlation between GBH applications on glyphosate (p < 0.01) and AMPA (p < 0.01) contents in the 0–20 cm soil horizon. In contrast, all soil physical and chemical properties except soil pH do not have a significant correlation (Figure S2). This correlation of GBH applications is driven by the organic sites that had no GBH applications between 2017 and 2020, along with low glyphosate and AMPA contents. After excluding organic sites from the multiple regressions, the effect of GBH applications is significant for glyphosate (p = 0.02) but non-significant for AMPA (p = 0.85) contents (Figure 4).
When excluding organic sites from the multiple regressions, the adjusted R-squared values of the regressions are 50% for glyphosate and 19% for AMPA. Soil pH shows a significant negative effect on glyphosate (p < 0.01) and AMPA (p < 0.01) contents. Soil clay contents show a positive effect on glyphosate contents (p = 0.03) but not on AMPA contents (p = 0.59). Soil CEC has no significant effect on glyphosate (p = 0.22), but a significant positive effect on AMPA contents (p = 0.02). Soil ISP has a significant negative effect on glyphosate contents (p = 0.01) but not on AMPA contents (p = 0.91).

3.2. Soil Microbial Community

Amplicon sequencing on MiSeq of the three microbial groups yielded, after filtration, an average of 27,788 (±4818); 28,740 (±7809); and 4819 (±1464) sequences per sample for prokaryotes, fungi, and eukaryotes, respectively. When combining all samples, the prokaryotic community contained 17,400 unique ASVs, the fungal community contained 17,500 unique ASVs, and the eukaryotic community contained 6000 unique ASVs.

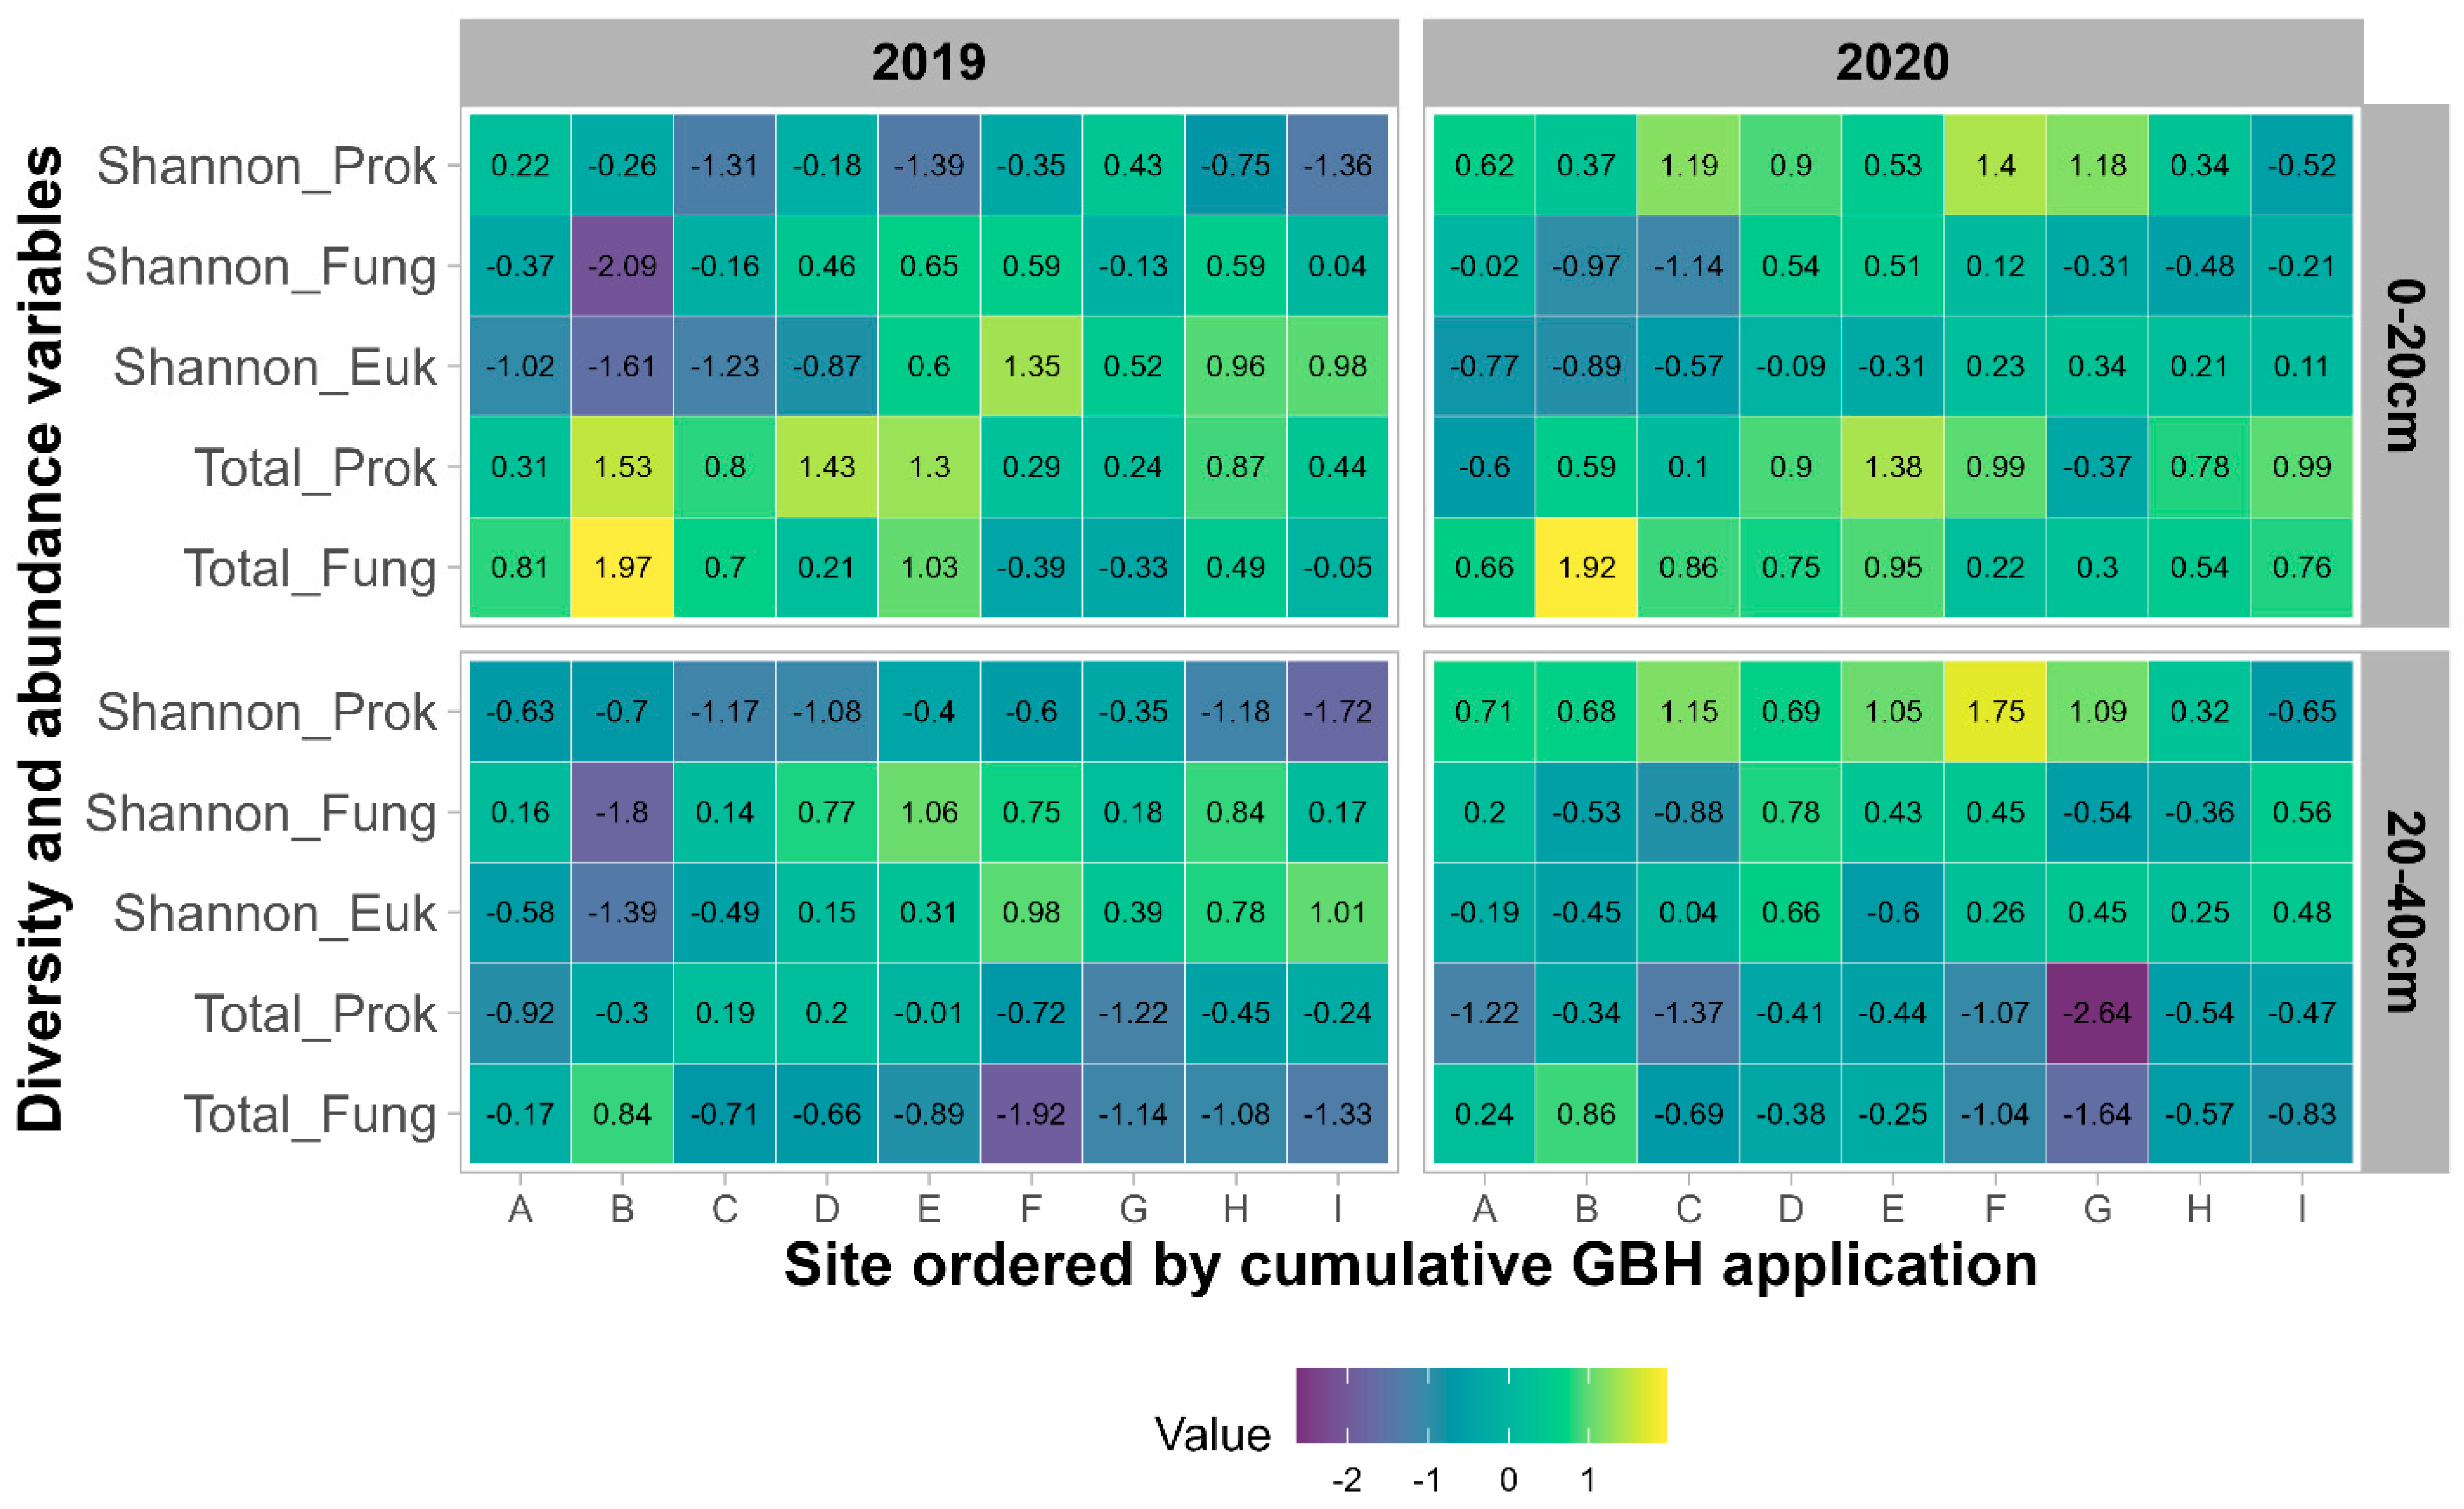
3.2.1. Alpha-Diversity and Abundance

The analysis of alpha-diversity metrics shows a high correlation between Shannon, Chao1, observed ASVs, and evenness metrics for each microbial community. Hence, the Shannon diversity index was used to assess the alpha-diversity of microbial communities, while quantification results assessed the total abundance of prokaryotes and fungi (Figure 5). The Shannon index for fungal and eukaryotic communities is not significantly impacted by sampling depth (p > 0.05) or year (p > 0.10). On the other hand, the prokaryotic Shannon index is significantly impacted by sampling year (p < 0.001) with higher diversity in 2020 compared to 2019, but no significant effect of sampling depth (p = 0.19). Quantification of prokaryotic and fungal communities is significantly impacted by both sampling year (p < 0.001) and sampling depth (p < 0.001). For both microbial communities, total quantities are higher in the 0–20 cm layer. For prokaryotic communities, quantification is higher in 2019 at sites A, B, C, D, G, and H, while it is higher for fungal communities in 2020 at sites C, D, F, G, H, I.
Cumulative GBH applications and cropping management have a small effect on the diversity and richness of microbial communities. Prokaryotic and fungal community Shannon diversity is not significantly impacted by cumulative GBH applications (p > 0.27) and crop rotations (p > 0.05). GBH applications significantly impact eukaryotic diversity (p = 0.02), with higher eukaryotic diversity in fields receiving GBH applications. Cumulative GBH applications and crop rotations do not impact prokaryotic and fungal quantification.

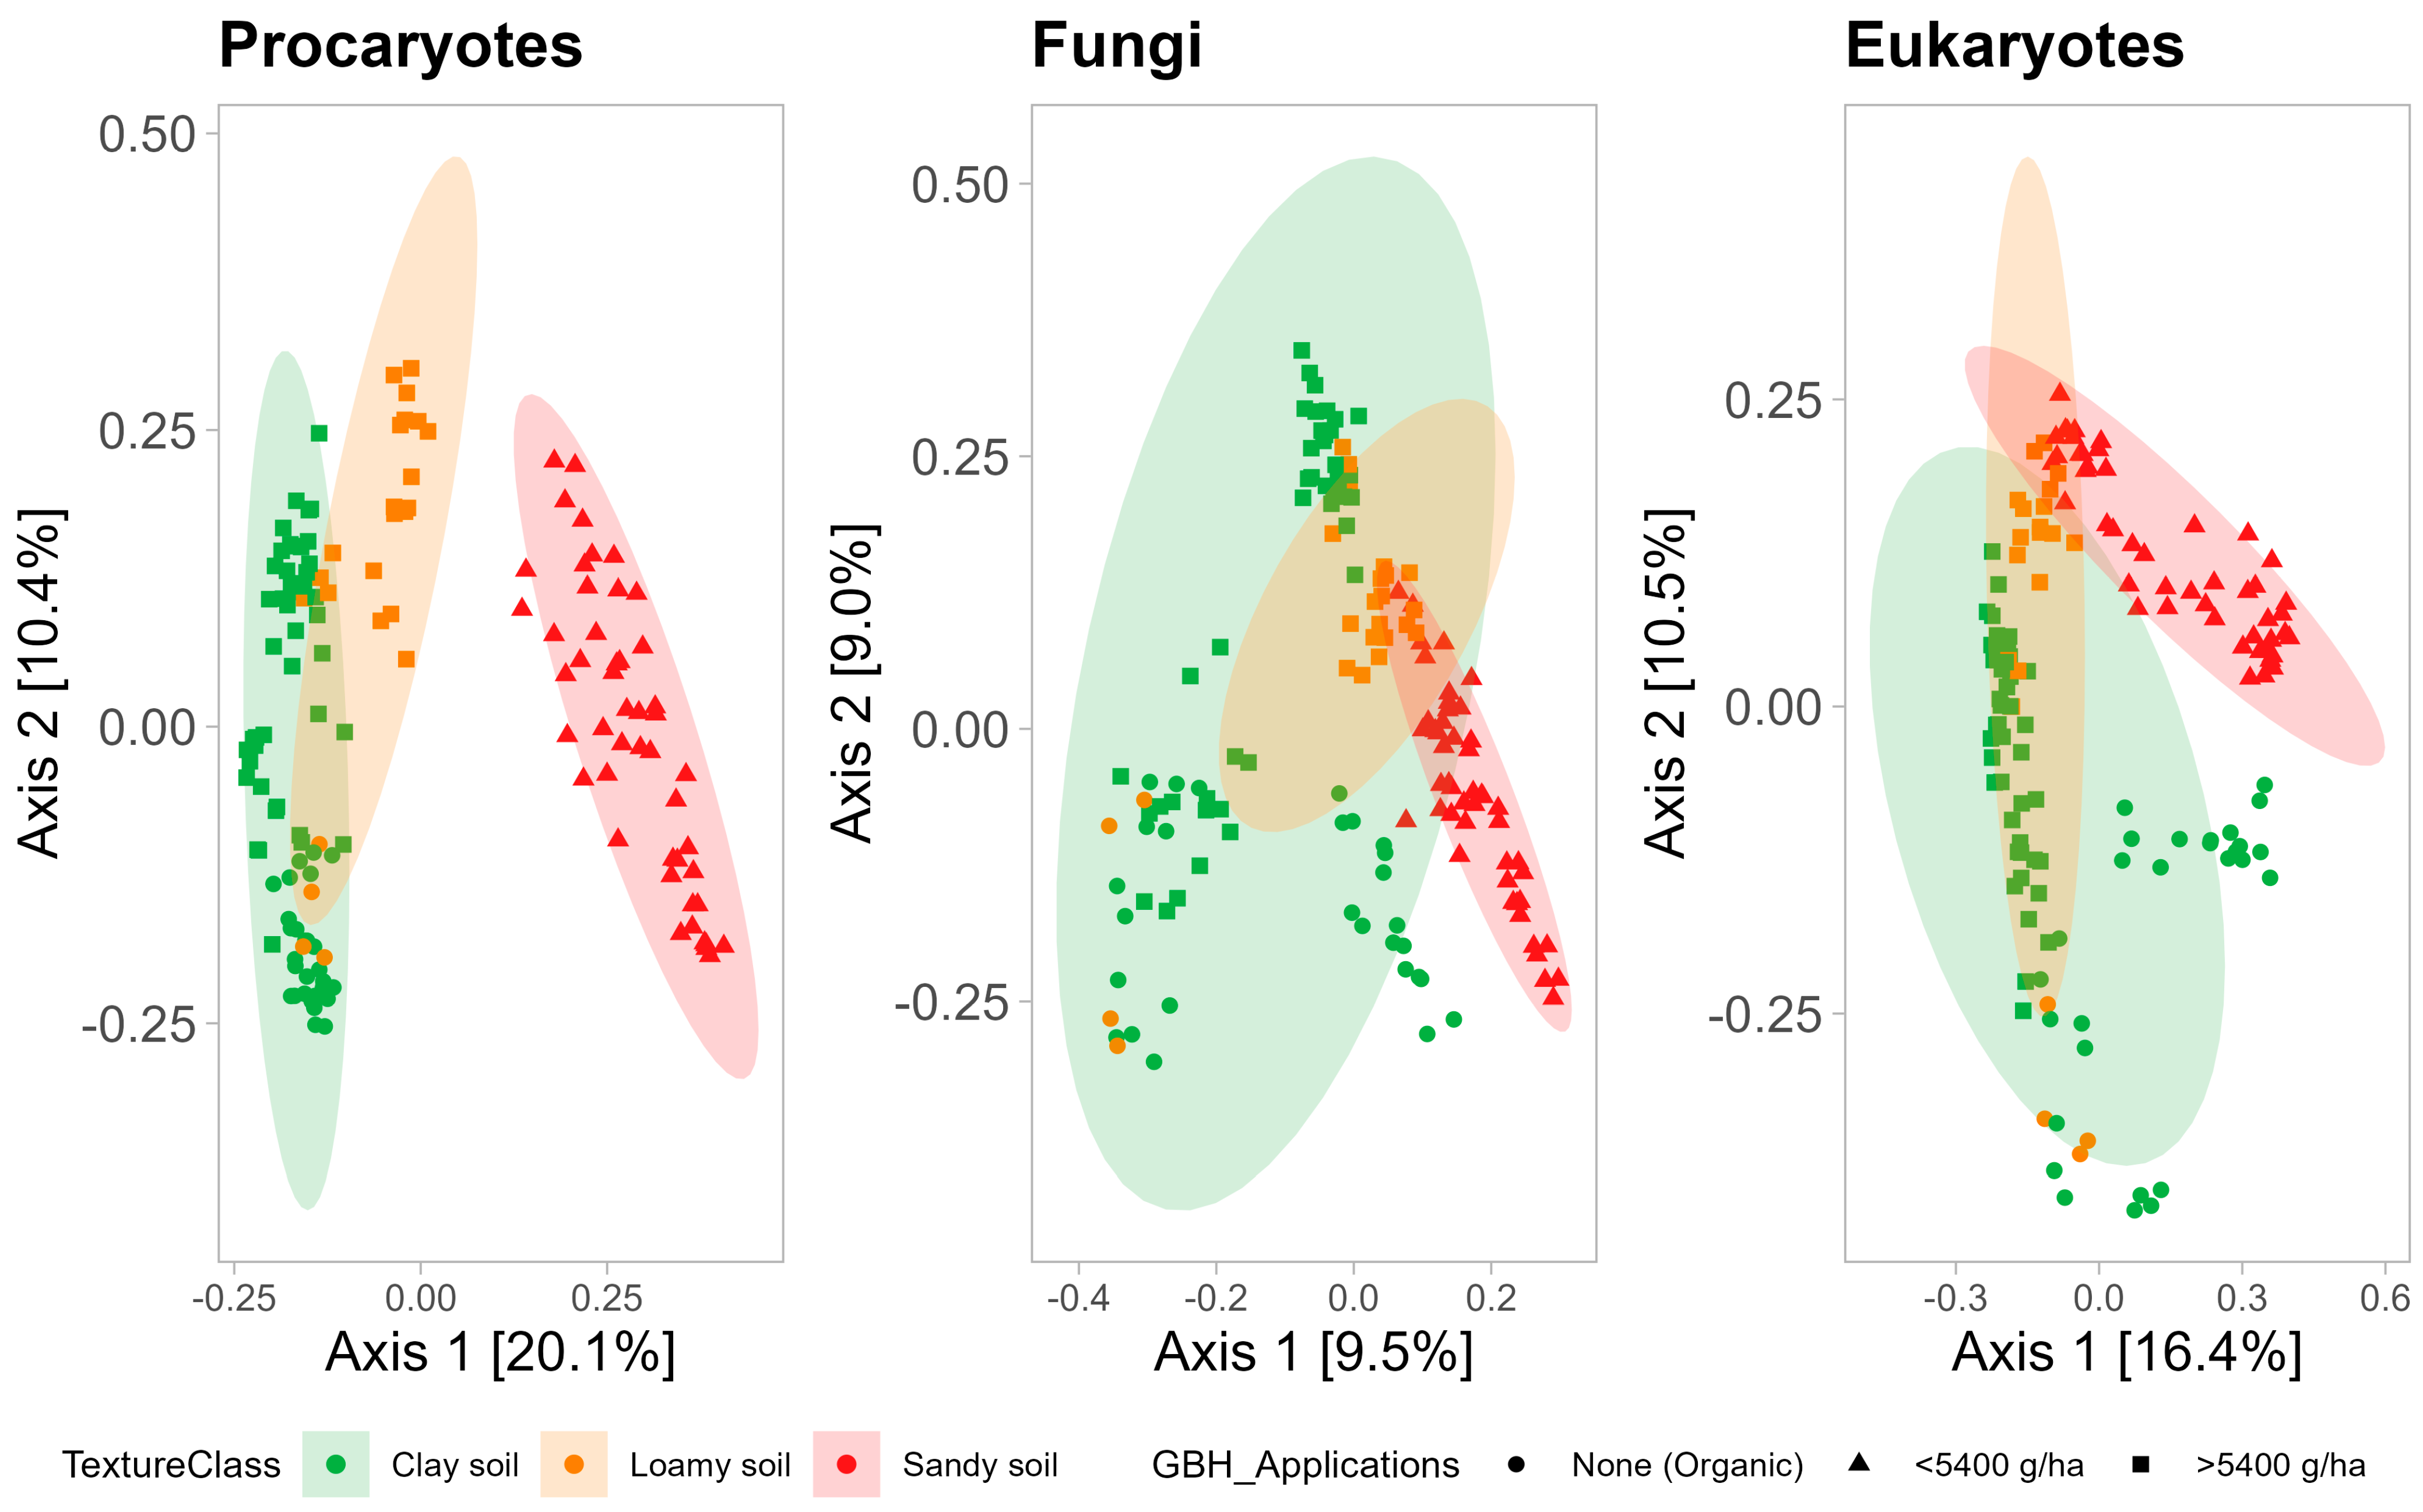
3.2.2. Beta-Diversity

The composition of microbial communities, especially prokaryotic ones, is strongly influenced by soil texture (Figure 6). PCoA analysis shows that microbial communities found in coarse-texture soils tend to differ from those of fine-texture soils, with marked differences for prokaryotic communities and to a lesser degree for fungal and eukaryotic communities. Interestingly, fine-textured soil fungal communities cover a large span of the ordination plot, indicating that fungal communities in fine-textured soil can be quite diverse compared to prokaryotic communities, which are more similar in fine-textured soil (Figure 6).
Using db-RDAs, a set of soil properties variables (OM, Ca, Na, clay content, and sand content) were identified as having a significant effect on all three microbial communities’ composition (Supplemental Table S1). The marginal effect of these selected soil properties is compared to the marginal effect of management practices (Table 4). Overall, sodium concentration has the highest marginal effect for all microbial communities, followed by clay and sand content, then crop rotation, manure inputs, and calcium content. While organic matter content has a significant marginal effect when considering only environmental variables (Supplemental Table S1), the effect is not significant in a model including management variables (Table 4). GBH application doses do not have a significant marginal effect on soil microbial communities.

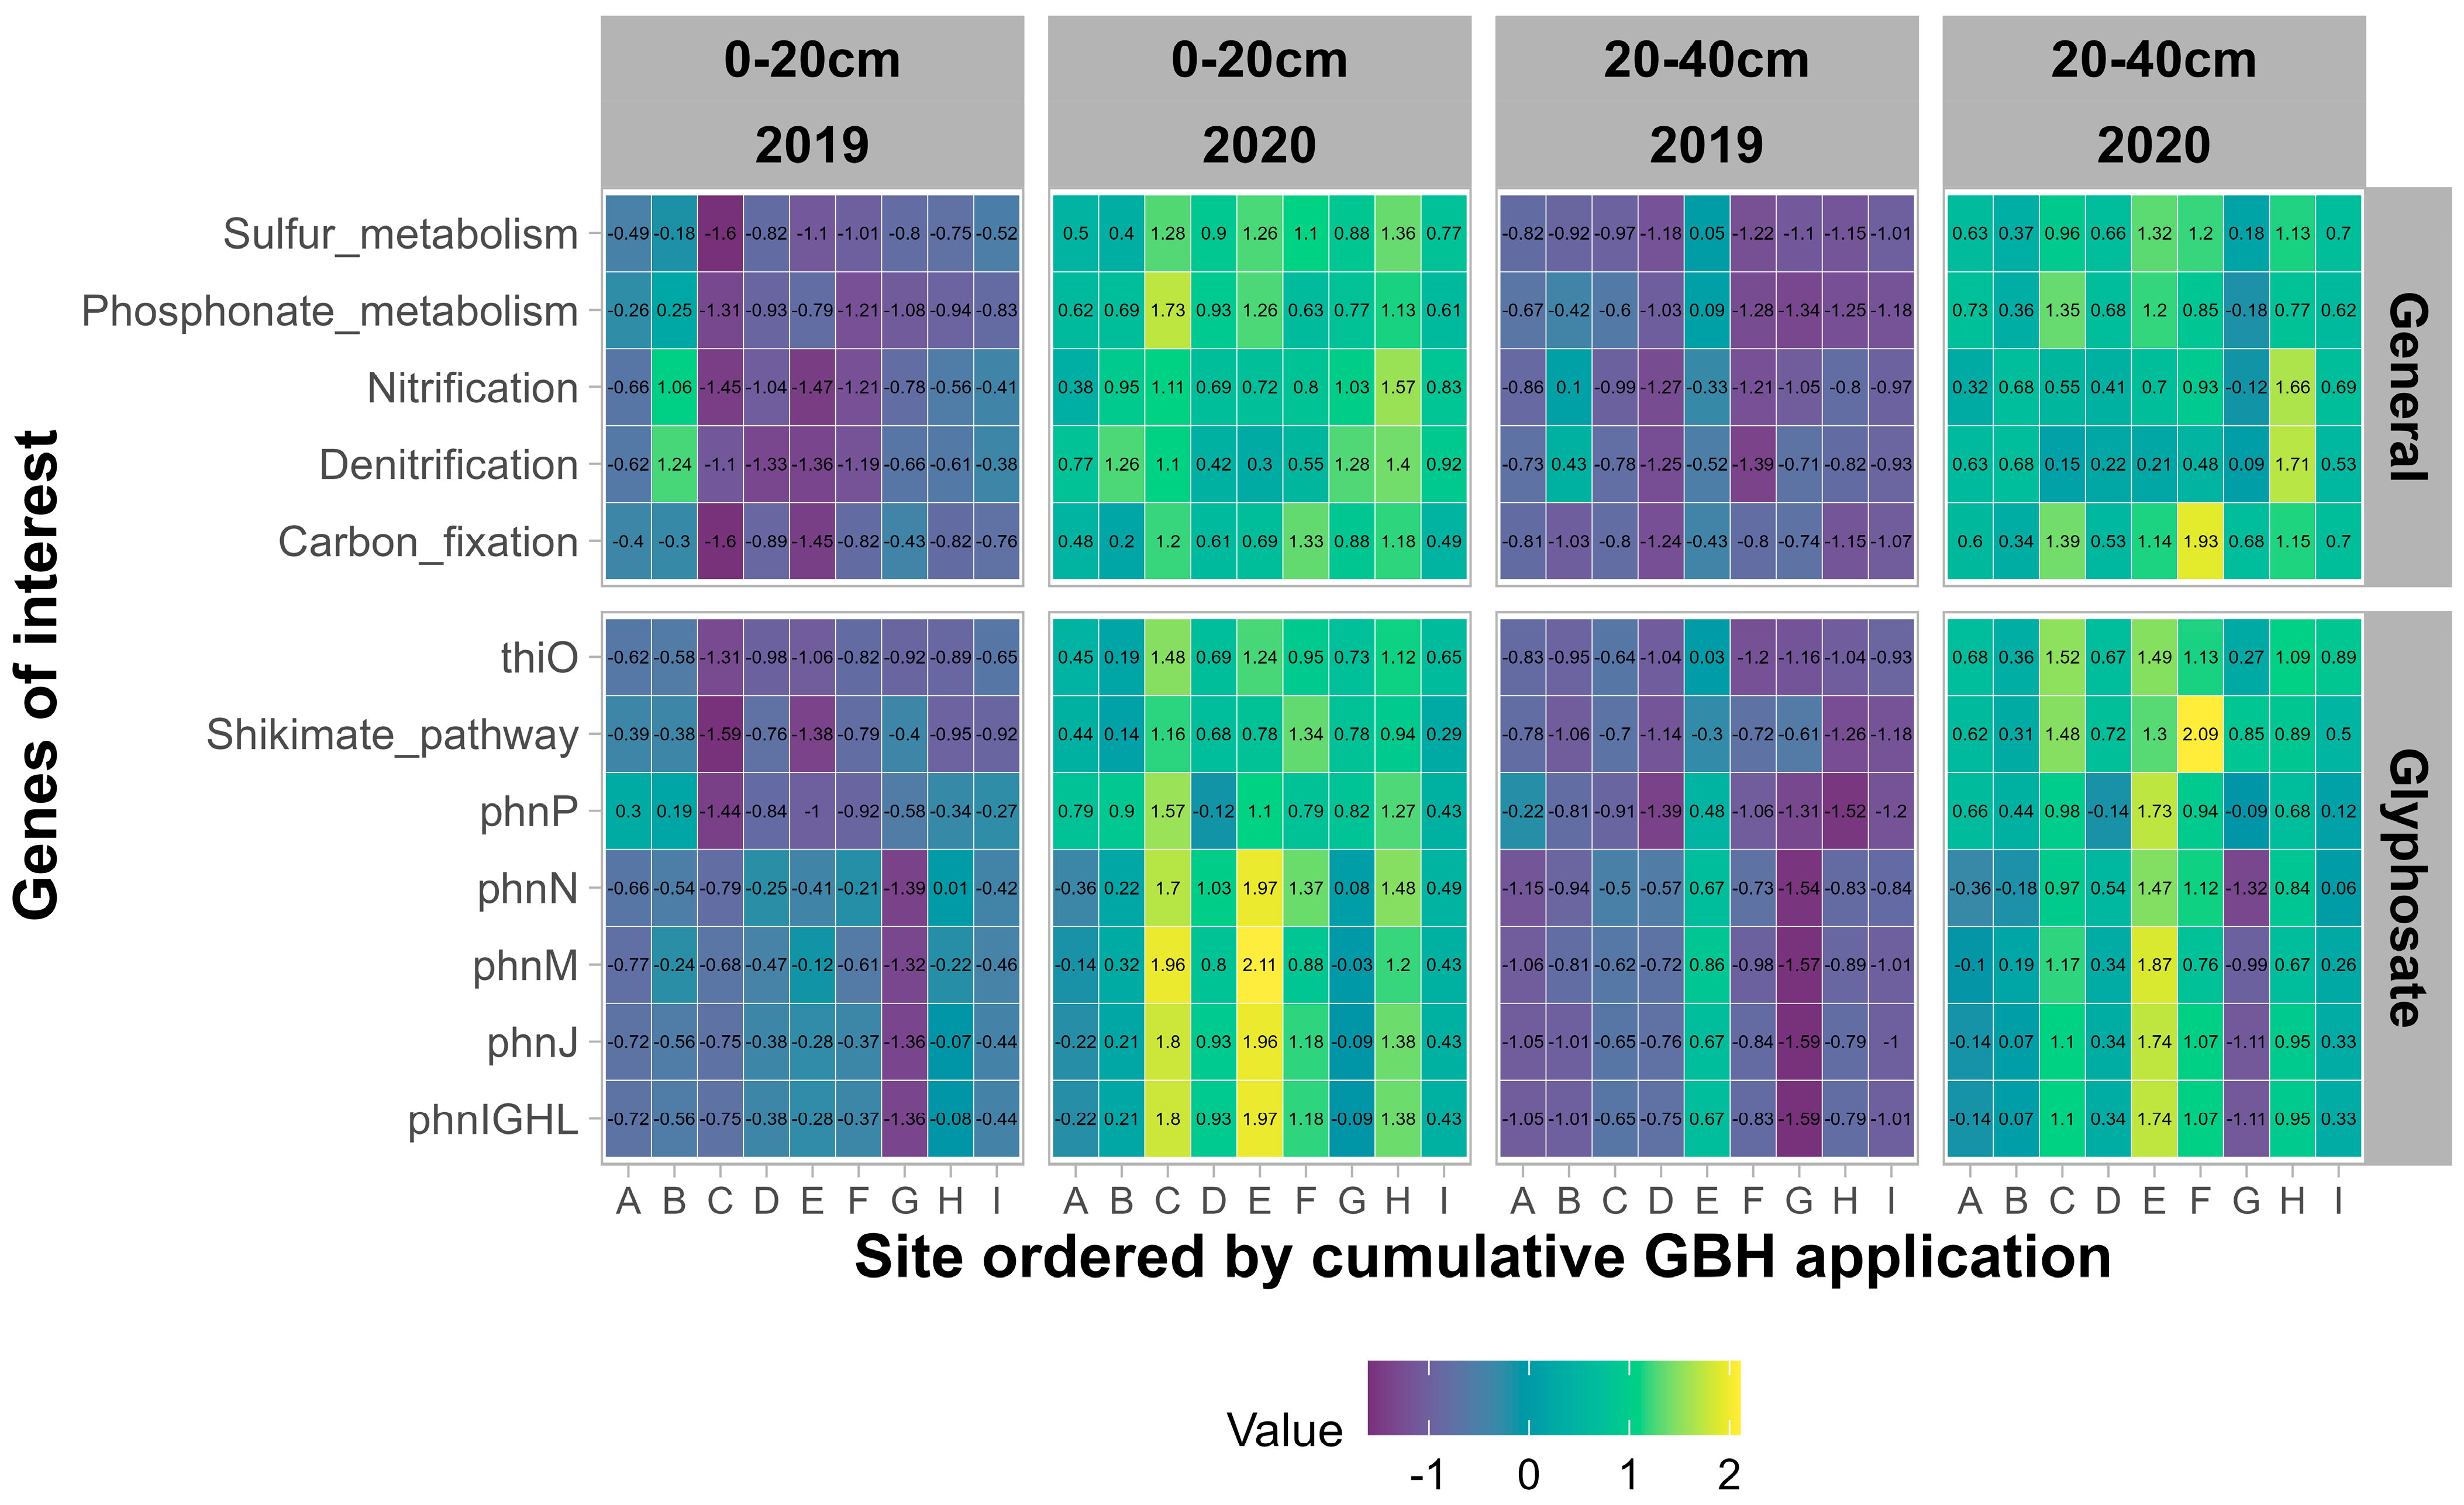
3.2.3. Functional Potential

Tools such as Picrust2 allow for inferring different functional potentials, such as genes involved in glyphosate degradation, or general pathways that are important soil processes from microbial communities observed in our experiment (Figure 7). Overall, sampling year has a highly significant effect (p < 0.001) on all genes and pathways of interest, with higher values in 2020 compared to 2019. Soil horizon does not have a significant effect for all genes, with the exception of the genes related to the phn operon (phnIGHL, phnJ, phnM, phnN, and phnP), for which the potential was higher in the 0–20 cm horizon compared to the 20–40 cm horizon.
Soil texture, expressed as sand and clay contents, has the most effects on both general functions and glyphosate-related functions. Crop rotations and manure inputs show a significant effect on the phn operon, with the exception of phnP. Frequent manure input has a significantly higher (p = 0.044) potential for phnM compared to infrequent manure inputs. Cumulative GBH applications do not have a significant effect on any functions of interest.

4. Discussion

4.1. Pseudo-Persistence of Glyphosate and AMPA in Soils

The pseudo-persistence of pollutants is defined by the constant addition of new molecules that replenish the molecules that are being removed [65]. As GBHs are applied nearly every year on soils that are not under organic management, both glyphosate and AMPA could be seen as pseudo-persistent pollutants in these soils [66]. Glyphosate and AMPA pseudo-persistence in analyzed sampled soils is almost ubiquitous, with 84% of samples containing detectable levels of glyphosate and 90% for AMPA. Sites with no GBH application for over a decade present detectable levels of glyphosate and AMPA in their soils. Traces of glyphosate and AMPA in organic sites can be explained by the frequent application of manure on organic fields. As the manure does not need to come from livestock that is organically managed, it can contain glyphosate and AMPA residues that come from conventional animal feed [67]. Fuchs et al. [67] applied poultry manure to a field that never received GBH. With an extremely high manure application rate (36 MT·ha−1), Fuchs et al. were able to detect 1.7 µg·g−1 dry soil of glyphosate in an organic soil. This glyphosate content is much higher than any measurements reported here in organic and conventional fields, showcasing the ability of manure to import glyphosate and AMPA to organically managed fields.
Previous experiments that focused on field crop soils report slightly lower or similar levels of detection of glyphosate and AMPA in soils from Quebec (42% and 70%), Argentina (100% for both), and Brazil (94% and 100%), respectively [23,66,68]. The lower detection rate recorded in Quebec was observed in soil samples collected in 2014 from soybean fields [23]. All these studies were carried out on soils with frequent application of GBH in corn and soybean production, explaining the ubiquity of glyphosate and AMPA. Although detection rates are similar across regions of the world, our results suggest that Quebec’s non-organic field crop soils that were sampled in this study have slightly higher glyphosate (0.17 µg·g−1 dry soil ±0.15) and AMPA (0.37 µg·g−1 dry soil ±0.24) contents compared to Brazilian (0.08 µg·g−1 dry soil ±0.09 for glyphosate and 0.17 µg·g−1 dry soil ±0.16 for AMPA) and European soils (0.11 µg·g−1 dry soil ±0.13 and 0.13 µg·g−1 dry soil ±0.14) [68,69] although smaller than Argentinian soil (2.30 µg·g−1 dry soil ±0.48 and 4.20 µg·g−1 dry soil ±2.26) [66]. Glyphosate and AMPA contents measured in the 0–20 cm horizon in 2019–2020 are generally higher than Maccario’s study conducted in 2014 (0.06 µg·g−1 dry soil ±0.10 and 0.29 µg·g−1 dry soil ±0.21) [23]. Our analysis shows that AMPA contents are not significantly different between 2014 and 2020 for five producers. On the other hand, there is a significant difference in glyphosate content between 2014 and 2020 for the two producers with GBH applications higher than 5400 g·ha−1 between 2017 and 2020. This finding agrees with Primost et al. [66] who reported that glyphosate content was best correlated with cumulative GBH applications over several years compared to the last spraying dose. Glyphosate accumulation in soil seems to occur at a rate lower than predicted by Primost et al. [66]. It was suggested that an increase in glyphosate content of 1 µg·g−1 dry soil would happen every 5 GBH application [66]. However, in the course of over 6 years with yearly applications of GBH, we observed an average increase of 0.20 µg·g−1 dry soil for three fields (sites G, H, I) and no significant increase for one field (site D).

4.2. Impacts of Soil Properties and Cropping Systems on Glyphosate and AMPA Contents

Our results demonstrate that organic management results in a significant difference in glyphosate and AMPA content in soils, which is intuitive as GBH application is prohibited in this type of cropping system (Figure S2). When excluding organic sites from our analysis, cumulative GBH applications three years prior to sampling significantly influence glyphosate soil content but not AMPA soil content (Figure 4). This difference between the behavior of glyphosate and AMPA soil contents could be explained by the pseudo-persistence of glyphosate related to frequent inputs of glyphosate that are higher than dissipation rates [66] and by the use of crop residues as soil cover for no-till sites [70]. Even with a rapid glyphosate dissipation rate in soils [5,71], relatively high glyphosate inputs (>1350 g·ha−1·year−1) in agricultural soils could result in a partial accumulation of glyphosate that does not degrade in AMPA and further leaching in deeper soil horizons, especially following a heavy rain event [72]. For soil covered with plant biomass (i.e., living plants or crop residues) at the moment of GBH application, a portion of applied GBH is intercepted by plant biomass instead of onto the soil, which modifies glyphosate dissipation [70,73,74,75]. Glyphosate intercepted by plant biomass will generally slow glyphosate dissipation compared to application directly on the soil, as a greater portion of glyphosate is incorporated or adsorbed onto plant biomass compared to soil particles [70,74]. Plant biomass needs to be degraded for adsorbed and incorporated glyphosate to dissipate into the soil [70,73]. Plant biomass that is already partially degraded will adsorb glyphosate more strongly than fresh plant biomass [73] and a larger portion of glyphosate will remain as non-extractible residues found within plant biomass [75]. Usage of tillage to incorporate crop residues will accelerate plant biomass degradation by mixing it with the soil [70]. Hence, sites with no-till practices and frequent cover crop usage (Sites G, H, and I) could result in a slower glyphosate dissipation compared to sites with tillage and lower soil cover by crop residues (Site D). Additionally, repeated GBH applications can lead to lower soil microbial activity and soil respiration [76,77], potentially inhibiting glyphosate biodegradation into AMPA [40]. Hence higher GBH applications could not directly lead to higher AMPA contents in the soil, but rather to an accumulation of glyphosate. Such interpretations could explain the higher glyphosate content in deeper soil profiles for sites with >5400 g·ha−1 of GBH applied between 2017 and 2020 (Table 3) and the increase with time of glyphosate in the same sites sampled in 2014 and in 2020 (Figure 3).
Soil pH, ISP, and clay content have a significant effect on glyphosate and AMPA contents in soil, similar to previous experiments [7,8]. Our observations of a general negative relationship between glyphosate and soil pH and a positive relationship between glyphosate and clay content agree with the literature [78,79,80,81]. A study realized in Argentina showed that glyphosate exhibits a higher affinity to soil surfaces at a certain pH, which varies between soil types but is generally around pH 6 [82], which corresponds to the lower soil pH values recorded in our experiments. In the same study, the presence of phosphate was shown to reduce glyphosate adsorption to soil particles [82], which agrees with our finding of a negative relationship between glyphosate content and soil ISP value (Figure 4). Clay content and ISP do not present a significant correlation with AMPA contents, while soil CEC has a positive relationship with AMPA contents. Maccario et al. [23] also found that soil texture did not have an impact on AMPA content. This could be explained by the soil’s higher affinity to AMPA compared to glyphosate [14,83].

4.3. Impacts of Cropping Systems and Soil Properties on Soil Microbial Community

The alpha-diversity and total biomass of prokaryotic and fungal communities are not affected by crop rotations in our study. Only eukaryotic alpha-diversity is significantly impacted by cumulative GBH applications. High cumulative GBH applications in this study are linked to other management choices such as no-till. Hence, the positive relationship between GBH application and eukaryotic communities could be explained by the adoption of no-till along with high GBH application. Indeed, Kepler et al. [33] showed that the impact of GBH applications on soil microbial communities was negligible compared to tillage practices. Although a meta-analysis has shown no significant impact on fungal diversity from no-till practices [84], other studies have shown the negative effect of tillage on soil eukaryotic community [85,86,87,88], which supports our hypothesis.
Soil microbial community composition and functional potential are influenced by both soil properties and cropping systems in our study. Sodium contents have the most important effect on the composition of microbial communities, which is hard to explain. Soil sodium can have important negative effects at elevated contents (1000 ppm) [89,90]; however, in this study, all soil samples present Na contents below 40 ppm with values as low as 2.7 ppm. There is no report of an important effect of Na on soil microbial communities at the concentrations observed in our study. Soil texture has an important effect on the composition of microbial communities and their functional potential. Numerous studies have confirmed the driving effect of soil texture on shaping the composition and functional potential of microbial communities [91,92,93]. In terms of cropping systems, crop rotation and manure application frequency are often cited as having a significant effect on soil microbial communities [94,95,96]. Guo et al. [95] showed that fertilizer application, especially manure, had a stronger role than crop rotation and crop growth stage on soil microbial communities. Another study has shown that all microbial communities are not impacted similarly by crop rotation, with fungal communities being more responsive to the number of plant species in a crop rotation compared to prokaryotic communities [97]. In the present study, no significant effects from GBH application on soil microbial community structure and functional potential were observed, which is consistent with other reports in the literature using DNA approaches to assess microbial communities [33,77,98,99]. This suggests that other management practices, such as crop rotation, manure inputs, and soil tillage, have a greater impact on soil microbial community composition and functional potential compared to GBH applications.

5. Conclusions

Glyphosate and AMPA were detected in soils at all sites investigated, including organic sites. The cumulative doses of GBH are not correlated to AMPA soil contents in conventional sites. However, glyphosate soil contents were positively correlated to GBH cumulative doses, and there seems to have been an increase in glyphosate soil contents between 2014 and 2020 for sites with the heaviest GBH applications. Low soil pH and high clay content corresponded to higher glyphosate and AMPA pseudo-persistence in soil. Cumulative amounts of GBH applications did not seem to have an impact on soil microbial communities, while crop rotation and manure inputs had a significant impact. Hence, GBH applications seem to have minimal impact on soil microbial communities and on AMPA soil contents. On the other hand, GBH applications seem to increase glyphosate soil contents and should be monitored to ensure the accumulation of glyphosate does not lead to detrimental effects on soil microbial communities.

Supplementary Materials

The following supporting information can be downloaded at: https://www.mdpi.com/article/10.3390/agronomy14040686/s1, Figure S1: Correlation between difference in glyphosate (top) and AMPA (bottom) contents between 2019 and 2020 and the difference in GBH application in 2020 and the yearly average GBH application between 2017 and 2019. Figure S2: Coefficients values along with their 95% confidence interval for all independent variables in multiple regressions for AMPA (right) and glyphosate (left) content for 0–20 cm soil profile of all sites. Figure S3: Chromatographs of a six-point calibration curve for AMPA (A) and a five-point calibration curve for glyphosate (B) on a soil matrix. Supplemental Table S1: Marginal effect of soil properties on microbial communities’ composition for the 0–20 soil horizon.

Author Contributions

Conceptualization, R.H., J.D.-P., T.J., M.M. and M.L.; methodology, W.O., R.H., J.D.-P., T.J., M.M. and M.L.; validation, W.O., J.D.-P. and M.M.; formal analysis, W.O.; investigation, W.O., C.P. and J.D.-P.; data curation, W.O. and C.P.; writing—original draft preparation, W.O.; writing—review and editing, W.O., R.H., J.D.-P., T.J., M.M. and M.L.; visualization, W.O.; supervision, R.H. and M.L.; project administration, R.H.; funding acquisition, R.H. and M.L. All authors have read and agreed to the published version of the manuscript.

Funding

Funding for this research came from the Innov’Action Agroalimentaire program, under the Canadian Agricultural Partnership, an agreement between the governments of Canada and Quebec.

Data Availability Statement

Publicly available datasets were analyzed in this study. This data and figure scripts can be found here: https://github.com/woverbeek/AgronomyMDPI2024 accessed on 27 February 2024.

Acknowledgments

The authors wish to thank all farmers who allowed us to sample their fields and gave their time to answer our questions.

Conflicts of Interest

The authors declare no conflicts of interest.

References

  1. Novotny, E. Glyphosate, Roundup and the Failures of Regulatory Assessment. Toxics 2022, 10, 321. [Google Scholar] [CrossRef] [PubMed]
  2. Szekacs, A.; Darvas, B. Forty Years with Glyphosate. Herbic.-Prop. Synth. Control Weeds 2012, 14, 247–284. [Google Scholar]
  3. Ministère de l’Environnement, de la Lutte Contre les Changements Climatiques. Bilan des Ventes de Pesticides au Québec—Année 2021; Bibliothèque et Archives Nationales du Québec: Montréal, QC, Canada, 2023. [Google Scholar]
  4. Kanissery, R.; Gairhe, B.; Kadyampakeni, D.; Batuman, O.; Alferez, F. Glyphosate: Its Environmental Persistence and Impact on Crop Health and Nutrition. Plants 2019, 8, 499. [Google Scholar] [CrossRef] [PubMed]
  5. Carretta, L.; Cardinali, A.; Onofri, A.; Masin, R.; Zanin, G. Dynamics of Glyphosate and Aminomethylphosphonic Acid in Soil Under Conventional and Conservation Tillage. Int. J. Environ. Res. 2021, 15, 1037–1055. [Google Scholar] [CrossRef]
  6. Motharasan, M.; Yunus; Shukor, Y.; Yasid, N.; Wan Johari, W.L.; Johari, W.; Aqlima, S. Environmental Fate and Degradation of Glyphosate in Soil. Pertanika J. Sch. Res. Rev. 2018, 4, 102–116. [Google Scholar]
  7. Dollinger, J.; Dagès, C.; Voltz, M. Glyphosate sorption to soils and sediments predicted by pedotransfer functions. Environ. Chem. Lett. 2015, 13, 293–307. [Google Scholar] [CrossRef]
  8. De Gerónimo, E.; Aparicio, V.C.; Costa, J.L. Glyphosate sorption to soils of Argentina. Estimation of affinity coefficient by pedotransfer function. Geoderma 2018, 322, 140–148. [Google Scholar] [CrossRef]
  9. Ascolani Yael, J.; Fuhr, J.D.; Bocan, G.A.; Daza Millone, A.; Tognalli, N.; dos Santos Afonso, M.; Martiarena, M.L. Abiotic Degradation of Glyphosate into Aminomethylphosphonic Acid in the Presence of Metals. J. Agric. Food Chem. 2014, 62, 9651–9656. [Google Scholar] [CrossRef]
  10. Papagiannaki, D.; Medana, C.; Binetti, R.; Calza, P.; Roslev, P. Effect of UV-A, UV-B and UV-C irradiation of glyphosate on photolysis and mitigation of aquatic toxicity. Sci. Rep. 2020, 10, 20247. [Google Scholar] [CrossRef]
  11. Singh, S.; Kumar, V.; Gill, J.P.K.; Datta, S.; Singh, S.; Dhaka, V.; Kapoor, D.; Wani, A.B.; Dhanjal, D.S.; Kumar, M.; et al. Herbicide Glyphosate: Toxicity and Microbial Degradation. Int. J. Environ. Res. Public Health 2020, 17, 7519. [Google Scholar] [CrossRef]
  12. Carretta, L.; Masin, R.; Zanin, G. Review of studies analysing glyphosate and aminomethylphosphonic acid (AMPA) occurrence in groundwater. Environ. Rev. 2021, 30, 88–109. [Google Scholar] [CrossRef]
  13. Tang, F.H.M.; Jeffries, T.C.; Vervoort, R.W.; Conoley, C.; Coleman, N.V.; Maggi, F. Microcosm experiments and kinetic modeling of glyphosate biodegradation in soils and sediments. Sci. Total Environ. 2019, 658, 105–115. [Google Scholar] [CrossRef]
  14. Wimmer, B.; Langarica-Fuentes, A.; Schwarz, E.; Kleindienst, S.; Huhn, C.; Pagel, H. Mechanistic modeling indicates rapid glyphosate dissipation and sorption-driven persistence of its metabolite AMPA in soil. J. Environ. Qual. 2023, 52, 393–405. [Google Scholar] [CrossRef]
  15. Blake, R.; Pallett, K. The Environmental Fate and Ecotoxicity of Glyphosate. Outlooks Pest Manag. 2018, 29, 266–269. [Google Scholar] [CrossRef]
  16. von Mérey, G.; Manson, P.S.; Mehrsheikh, A.; Sutton, P.; Levine, S.L. Glyphosate and aminomethylphosphonic acid chronic risk assessment for soil biota. Environ. Toxicol. Chem. 2016, 35, 2742–2752. [Google Scholar] [CrossRef]
  17. Kim, Y.J.; Nitin, N.; Kim, K.B. Negligible Toxicokinetic Differences of Glyphosate by Different Vehicles in Rats. Toxics 2023, 11, 67. [Google Scholar] [CrossRef]
  18. Kassam, A.; Friedrich, T.; Derpsch, R. Global spread of Conservation Agriculture. Int. J. Environ. Stud. 2019, 76, 29–51. [Google Scholar] [CrossRef]
  19. FAO. Top 5 Need-to-Knows about Conservation Agriculture. Available online: http://www.fao.org/zhc/detail-events/en/c/238478/ (accessed on 27 February 2024).
  20. Bilodeau, L.; Marcoux, A.; Miville, D.; Fréchette, I.; Samson, V. Désherbage du Maïs de Grandes Cultures. 2020. Available online: https://www.agrireseau.net/documents/Document_100450.pdf (accessed on 20 February 2024).
  21. Kumar, V.; Mahajan, G.; Dahiya, S.; Chauhan, B.S. Challenges and Opportunities for Weed Management in No-Till Farming Systems. In No-Till Farming Systems for Sustainable Agriculture: Challenges and Opportunities; Dang, Y.P., Dalal, R.C., Menzies, N.W., Eds.; Springer International Publishing: Cham, Switzerland, 2020; pp. 107–125. [Google Scholar]
  22. Giroux, I. Présence de Pesticides dans l’Eau au Québec: Portrait et Tendances dans les Zones de Maïs et de Soya—2018 à 2020; Ministère de l’Environnement et de la Lutte Contre les Changements Climatiques, Direction de la Qualité des Milieux Aquatiques: Québec, QC, Canada, 2022. [Google Scholar]
  23. Maccario, S.; Lucotte, M.; Moingt, M.; Samson-Brais, É.; Smedbol, É.; Labrecque, M. Impact of Soil Characteristics and Weed Management Practices on Glyphosate and AMPA Persistence in Field Crops Soils from the St. Lawrence Lowlands (Quebec, Canada). Agronomy 2022, 12, 992. [Google Scholar] [CrossRef]
  24. Nkongolo, K.K.; Narendrula-Kotha, R. Advances in monitoring soil microbial community dynamic and function. J. Appl. Genet. 2020, 61, 249–263. [Google Scholar] [CrossRef]
  25. Parada, A.E.; Needham, D.M.; Fuhrman, J.A. Every base matters: Assessing small subunit rRNA primers for marine microbiomes with mock communities, time series and global field samples. Environ. Microbiol. 2016, 18, 1403–1414. [Google Scholar] [CrossRef]
  26. Bokulich, N.A.; Mills, D.A. Improved selection of internal transcribed spacer-specific primers enables quantitative, ultra-high-throughput profiling of fungal communities. Appl. Environ. Microbiol. 2013, 79, 2519–2526. [Google Scholar] [CrossRef]
  27. Comeau, A.M.; Li, W.K.W.; Tremblay, J.-É.; Carmack, E.C.; Lovejoy, C. Arctic Ocean Microbial Community Structure before and after the 2007 Record Sea Ice Minimum. PLoS ONE 2011, 6, e27492. [Google Scholar] [CrossRef]
  28. Emerson, J.B.; Thomas, B.C.; Alvarez, W.; Banfield, J.F. Metagenomic analysis of a high carbon dioxide subsurface microbial community populated by chemolithoautotrophs and bacteria and archaea from candidate phyla. Environ. Microbiol. 2016, 18, 1686–1703. [Google Scholar] [CrossRef]
  29. Castellano-Hinojosa, A.; González-López, J.; Vallejo, A.; Bedmar, E.J. Effect of urease and nitrification inhibitors on ammonia volatilization and abundance of N-cycling genes in an agricultural soil. J. Plant Nutr. Soil Sci. 2020, 183, 99–109. [Google Scholar] [CrossRef]
  30. Morales, M.E.; Allegrini, M.; Basualdo, J.; Villamil, M.B.; Zabaloy, M.C. Primer design to assess bacterial degradation of glyphosate and other phosphonates. J. Microbiol. Methods 2020, 169, 105814. [Google Scholar] [CrossRef]
  31. Kanehisa, M.; Furumichi, M.; Sato, Y.; Kawashima, M.; Ishiguro-Watanabe, M. KEGG for taxonomy-based analysis of pathways and genomes. Nucleic Acids Res. 2023, 51, D587–D592. [Google Scholar] [CrossRef]
  32. Nilsson, R.H.; Kristiansson, E.; Ryberg, M.; Hallenberg, N.; Larsson, K.H. Intraspecific ITS variability in the kingdom fungi as expressed in the international sequence databases and its implications for molecular species identification. Evol. Bioinform. Online 2008, 4, 193–201. [Google Scholar] [CrossRef]
  33. Kepler, R.M.; Epp Schmidt, D.J.; Yarwood, S.A.; Cavigelli, M.A.; Reddy, K.N.; Duke, S.O.; Bradley, C.A.; Williams, M.M.; Buyer, J.S.; Maul, J.E. Soil Microbial Communities in Diverse Agroecosystems Exposed to the Herbicide Glyphosate. Appl. Environ. Microbiol. 2020, 86, e01744-19. [Google Scholar] [CrossRef]
  34. Dennis, P.G.; Kukulies, T.; Forstner, C.; Orton, T.G.; Pattison, A.B. The effects of glyphosate, glufosinate, paraquat and paraquat-diquat on soil microbial activity and bacterial, archaeal and nematode diversity. Sci. Rep. 2018, 8, 2119. [Google Scholar] [CrossRef]
  35. Weaver, M.A.; Krutz, L.J.; Zablotowicz, R.M.; Reddy, K.N. Effects of glyphosate on soil microbial communities and its mineralization in a Mississippi soil. Pest Manag. Sci. 2007, 63, 388–393. [Google Scholar] [CrossRef]
  36. Guijarro, K.H.; Aparicio, V.; De Gerónimo, E.; Castellote, M.; Figuerola, E.L.; Costa, J.L.; Erijman, L. Soil microbial communities and glyphosate decay in soils with different herbicide application history. Sci. Total Environ. 2018, 634, 974–982. [Google Scholar] [CrossRef]
  37. Lupwayi, N.Z.; Larney, F.J.; Blackshaw, R.E.; Kanashiro, D.A.; Pearson, D.C.; Petri, R.M. Pyrosequencing reveals profiles of soil bacterial communities after 12 years of conservation management on irrigated crop rotations. Appl. Soil Ecol. 2017, 121, 65–73. [Google Scholar] [CrossRef]
  38. Schmidt, R.; Gravuer, K.; Bossange, A.V.; Mitchell, J.; Scow, K. Long-term use of cover crops and no-till shift soil microbial community life strategies in agricultural soil. PLoS ONE 2018, 13, e0192953. [Google Scholar] [CrossRef]
  39. Giusti, B.; Hogue, R.; Jeanne, T.; Lucotte, M. Impacts of winter wheat and cover crops on soil microbial diversity in a corn–soybean no-till cropping system in Quebec (Canada). Agrosyst. Geosci. Environ. 2023, 6, e20349. [Google Scholar] [CrossRef]
  40. Samson-Brais, É.; Lucotte, M.; Moingt, M.; Tremblay, G.; Paquet, S. Glyphosate and aminomethylphosphonic acid contents in field crops soils under various weed management practices. Agrosyst. Geosci. Environ. 2022, 5, e20273. [Google Scholar] [CrossRef]
  41. Alferness, P.L.; Iwata, Y. Determination of Glyphosate and (Aminomethyl)phosphonic Acid in Soil, Plant and Animal Matrixes, and Water by Capillary Gas Chromatography with Mass-Selective Detection. J. Agric. Food Chem. 1994, 42, 2751–2759. [Google Scholar] [CrossRef]
  42. Conseil des Productions Végétales du Québec. Méthode MA-2; Ministère de l’Agriculture, des Pêcheries et de l’Alimentation (Québec): Québec, QC, Canada, 1993. [Google Scholar]
  43. Centre d’Expertise en Analyse Environnementale du Québec. Détermination du pH: Méthode Électrométrique; Ministère de l’Environnement, de la Lutte contre les changements climatiques, de la Faune et des Parcs: Québec, QC, Canada, 2014; Volume 3. [Google Scholar]
  44. Shoemaker, H.E.; McLean, E.O.; Pratt, P.F. Buffer Methods for Determining Lime Requirement of Soils With Appreciable Amounts of Extractable Aluminum. Soil Sci. Soc. Am. J. 1961, 25, 274–277. [Google Scholar] [CrossRef]
  45. Mehlich, A. Mehlich 3 soil test extractant: A modification of Mehlich 2 extractant. Commun. Soil Sci. Plant Anal. 1984, 15, 1409–1416. [Google Scholar] [CrossRef]
  46. Culman, S.; Mann, M.; Brown, C. Calculating Cation Exchange Capacity, Base Saturation, and Calcium Saturation. 2019. Available online: https://ohioline.osu.edu/factsheet/anr-81 (accessed on 19 February 2024).
  47. CRAAQ. Fertilization Reference Guide, 2nd ed.; CRAAQ: Québec, QC, Canada, 2010. (In French) [Google Scholar]
  48. Apprill, A.; McNally, S.; Parsons, R.; Weber, L. Minor revision to V4 region SSU rRNA 806R gene primer greatly increases detection of SAR11 bacterioplankton. Aquat. Microb. Ecol. 2015, 75, 129–137. [Google Scholar] [CrossRef]
  49. Jeanne, T.; Parent, S.-É.; Hogue, R. Using a soil bacterial species balance index to estimate potato crop productivity. PLoS ONE 2019, 14, e0214089. [Google Scholar] [CrossRef] [PubMed]
  50. Bolyen, E.; Rideout, J.R.; Dillon, M.R.; Bokulich, N.A.; Abnet, C.C.; Al-Ghalith, G.A.; Alexander, H.; Alm, E.J.; Arumugam, M.; Asnicar, F.; et al. Reproducible, interactive, scalable and extensible microbiome data science using QIIME 2. Nat. Biotechnol. 2019, 37, 852–857. [Google Scholar] [CrossRef]
  51. Callahan, B.J.; McMurdie, P.J.; Rosen, M.J.; Han, A.W.; Johnson, A.J.A.; Holmes, S.P. DADA2: High-resolution sample inference from Illumina amplicon data. Nat. Methods 2016, 13, 581–583. [Google Scholar] [CrossRef] [PubMed]
  52. Quast, C.; Pruesse, E.; Yilmaz, P.; Gerken, J.; Schweer, T.; Yarza, P.; Peplies, J.; Glöckner, F.O. The SILVA ribosomal RNA gene database project: Improved data processing and web-based tools. Nucleic Acids Res. 2013, 41, D590–D596. [Google Scholar] [CrossRef] [PubMed]
  53. Kõljalg, U.; Nilsson, R.H.; Abarenkov, K.; Tedersoo, L.; Taylor, A.F.S.; Bahram, M.; Bates, S.T.; Bruns, T.D.; Bengtsson-Palme, J.; Callaghan, T.M.; et al. Towards a unified paradigm for sequence-based identification of fungi. Mol. Ecol. 2013, 22, 5271–5277. [Google Scholar] [CrossRef] [PubMed]
  54. Callahan, B.J.; McMurdie, P.J.; Holmes, S.P. Exact sequence variants should replace operational taxonomic units in marker-gene data analysis. ISME J. 2017, 11, 2639–2643. [Google Scholar] [CrossRef]
  55. Overbeek, W.; Jeanne, T.; Hogue, R.; Smith, D.L. Effects of Microbial Consortia, Applied as Fertilizer Coating, on Soil and Rhizosphere Microbial Communities and Potato Yield. Front. Agron. 2021, 3, 714700. [Google Scholar] [CrossRef]
  56. Jeanne, T.; D’Astous-Pagé, J.; Hogue, R. Spatial, temporal and technical variability in the diversity of prokaryotes and fungi in agricultural soils. Front. Soil Sci. 2022, 2, 945888. [Google Scholar] [CrossRef]
  57. Douglas, G.M.; Maffei, V.J.; Zaneveld, J.R.; Yurgel, S.N.; Brown, J.R.; Taylor, C.M.; Huttenhower, C.; Langille, M.G.I. PICRUSt2 for prediction of metagenome functions. Nat. Biotechnol. 2020, 38, 685–688. [Google Scholar] [CrossRef]
  58. Caspi, R.; Billington, R.; Ferrer, L.; Foerster, H.; Fulcher, C.A.; Keseler, I.M.; Kothari, A.; Krummenacker, M.; Latendresse, M.; Mueller, L.A.; et al. The MetaCyc database of metabolic pathways and enzymes and the BioCyc collection of pathway/genome databases. Nucleic Acids Res. 2016, 44, D471–D480. [Google Scholar] [CrossRef]
  59. Hernández Guijarro, K.; De Gerónimo, E.; Erijman, L. Glyphosate Biodegradation Potential in Soil Based on Glycine Oxidase Gene (thiO) from Bradyrhizobium. Curr. Microbiol. 2021, 78, 1991–2000. [Google Scholar] [CrossRef]
  60. Hove-Jensen, B.; Zechel, D.L.; Jochimsen, B. Utilization of Glyphosate as Phosphate Source: Biochemistry and Genetics of Bacterial Carbon-Phosphorus Lyase. Microbiol. Mol. Biol. Rev. 2014, 78, 176–197. [Google Scholar] [CrossRef] [PubMed]
  61. R Core Team. R: A Language and Environment for Statistical Computing; R Foundation for Statistical Computing: Vienna, Austria, 2020. [Google Scholar]
  62. McMurdie, P.J.; Holmes, S. Waste Not, Want Not: Why Rarefying Microbiome Data Is Inadmissible. PLoS Comput. Biol. 2014, 10, e1003531. [Google Scholar] [CrossRef] [PubMed]
  63. McMurdie, P.J.; Holmes, S. phyloseq: An R Package for Reproducible Interactive Analysis and Graphics of Microbiome Census Data. PLoS ONE 2013, 8, e61217. [Google Scholar] [CrossRef] [PubMed]
  64. Oksanen, J.; Blanchet, G.; Friendly, M.; Kindt, R.; Legendre, P.; McGlinn, D.; Minchin, P.; O’Hara, R.; Simpson, G.; Solymos, P.; et al. Vegan: Community Ecology Package. 2019. Available online: http://CRAN.Rproject.org/package=vegan (accessed on 14 February 2024).
  65. Daughton Christian, G. Cradle-to-cradle stewardship of drugs for minimizing their environmental disposition while promoting human health. I. Rationale for and avenues toward a green pharmacy. Environ. Health Perspect. 2003, 111, 757–774. [Google Scholar] [CrossRef] [PubMed]
  66. Primost, J.; Marino, D.; Aparicio, V.; Costa, J.; Carriquiriborde, P. Glyphosate and AMPA, “pseudo-persistent” pollutants under real-world agricultural management practices in the Mesopotamic Pampas agroecosystem, Argentina. Environ. Pollut. 2017, 229, 771–779. [Google Scholar] [CrossRef] [PubMed]
  67. Fuchs, B.; Saikkonen, K.; Helander, M.; Tian, Y.; Yang, B.; Engström, M.T.; Salminen, J.-P.; Muola, A. Legacy of agrochemicals in the circular food economy: Glyphosate-based herbicides introduced via manure fertilizer affect the yield and biochemistry of perennial crop plants during the following year. Chemosphere 2022, 308, 136366. [Google Scholar] [CrossRef] [PubMed]
  68. Giard, F.; Lucotte, M.; Moingt, M.; Gaspar, A. Glyphosate and aminomethyphosphonic (AMPA) contents in Brazilian field crops soils. Agron. Sci. Biotechnol. 2022, 8, 1–18. [Google Scholar] [CrossRef]
  69. Silva, V.; Montanarella, L.; Jones, A.; Fernández-Ugalde, O.; Mol, H.G.J.; Ritsema, C.J.; Geissen, V. Distribution of glyphosate and aminomethylphosphonic acid (AMPA) in agricultural topsoils of the European Union. Sci. Total Environ. 2018, 621, 1352–1359. [Google Scholar] [CrossRef]
  70. Mamy, L.; Barriuso, E.; Gabrielle, B. Glyphosate fate in soils when arriving in plant residues. Chemosphere 2016, 154, 425–433. [Google Scholar] [CrossRef] [PubMed]
  71. Mencaroni, M.; Cardinali, A.; Costa, L.; Morari, F.; Salandin, P.; Zanin, G.; Dal Ferro, N. Glyphosate and AMPA have low mobility through different soil profiles of the prosecco wine production area: A monitoring study in north-eastern Italy. Front. Environ. Sci. 2022, 10, 971931. [Google Scholar] [CrossRef]
  72. Vereecken, H. Mobility and leaching of glyphosate: A review. Pest Manag. Sci. 2005, 61, 1139–1151. [Google Scholar] [CrossRef] [PubMed]
  73. Cassigneul, A.; Benoit, P.; Bergheaud, V.; Dumeny, V.; Etiévant, V.; Goubard, Y.; Maylin, A.; Justes, E.; Alletto, L. Fate of glyphosate and degradates in cover crop residues and underlying soil: A laboratory study. Sci. Total Environ. 2016, 545–546, 582–590. [Google Scholar] [CrossRef] [PubMed]
  74. Aslam, S.; Iqbal, A.; Lafolie, F.; Recous, S.; Benoit, P.; Garnier, P. Mulch of plant residues at the soil surface impact the leaching and persistence of pesticides: A modelling study from soil columns. J. Contam. Hydrol. 2018, 214, 54–64. [Google Scholar] [CrossRef]
  75. Aslam, S.; Jing, Y.; Nowak, K.M. Fate of glyphosate and its degradation products AMPA, glycine and sarcosine in an agricultural soil: Implications for environmental risk assessment. J. Hazard. Mater. 2023, 447, 130847. [Google Scholar] [CrossRef] [PubMed]
  76. Samson-Brais, É.; Lucotte, M.; Moingt, M.; Tremblay, G.; Paquet, S. Impact of weed management practices on soil biological activity in corn and soybean field crops in Québec (Canada). Can. J. Soil Sci. 2020, 101, 12–21. [Google Scholar] [CrossRef]
  77. Lane, M.; Lorenz, N.; Saxena, J.; Ramsier, C.; Dick, R. The effect of glyphosate on soil microbial activity, microbial community structure, and soil potassium. Pedobiologia 2012, 55, 335–342. [Google Scholar] [CrossRef]
  78. McConnell, J.S.; Hossner, L.R. pH-Dependent adsorption isotherms of glyphosate. J. Agric. Food Chem. 1985, 33, 1075–1078. [Google Scholar] [CrossRef]
  79. de Jonge, H.; Wollesen de Jonge, L. Influence of pH and solution composition on the sorption of glyphosate and prochloraz to a sandy loam soil. Chemosphere 1999, 39, 753–763. [Google Scholar] [CrossRef]
  80. Weber, J.B.; Wilkerson, G.G.; Reinhardt, C.F. Calculating pesticide sorption coefficients (Kd) using selected soil properties. Chemosphere 2004, 55, 157–166. [Google Scholar] [CrossRef]
  81. Kumari, K.G.I.D.; Moldrup, P.; Paradelo, M.; Elsgaard, L.; de Jonge, L.W. Soil Properties Control Glyphosate Sorption in Soils Amended with Birch Wood Biochar. Water Air Soil Pollut. 2016, 227, 174. [Google Scholar] [CrossRef]
  82. De Gerónimo, E.; Aparicio, V.C. Changes in soil pH and addition of inorganic phosphate affect glyphosate adsorption in agricultural soil. Eur. J. Soil Sci. 2022, 73, e13188. [Google Scholar] [CrossRef]
  83. Sidoli, P.; Baran, N.; Angulo-Jaramillo, R. Glyphosate and AMPA adsorption in soils: Laboratory experiments and pedotransfer rules. Environ. Sci. Pollut. Res. 2016, 23, 5733–5742. [Google Scholar] [CrossRef] [PubMed]
  84. Li, Y.; Song, D.; Liang, S.; Dang, P.; Qin, X.; Liao, Y.; Siddique, K.H.M. Effect of no-tillage on soil bacterial and fungal community diversity: A meta-analysis. Soil Tillage Res. 2020, 204, 104721. [Google Scholar] [CrossRef]
  85. Sun, R.; Li, W.; Dong, W.; Tian, Y.; Hu, C.; Liu, B. Tillage Changes Vertical Distribution of Soil Bacterial and Fungal Communities. Front. Microbiol. 2018, 9, 699. [Google Scholar] [CrossRef] [PubMed]
  86. Gao, M.; Li, H.; Li, M. Effect of No Tillage System on Soil Fungal Community Structure of Cropland in Mollisol: A Case Study. Front. Microbiol. 2022, 13, 847691. [Google Scholar] [CrossRef] [PubMed]
  87. Lu, X.; Lu, X.; Liao, Y. Effect of Tillage Treatment on the Diversity of Soil Arbuscular Mycorrhizal Fungal and Soil Aggregate-Associated Carbon Content. Front. Microbiol. 2018, 9, 410634. [Google Scholar] [CrossRef]
  88. Liu, W.; Ma, K.; Wang, X.; Wang, Z.; Negrete-Yankelevich, S. Effects of no-tillage and biologically-based organic fertilizer on soil arbuscular mycorrhizal fungal communities in winter wheat field. Appl. Soil Ecol. 2022, 178, 104564. [Google Scholar] [CrossRef]
  89. Zhang, W.-w.; Wang, C.; Xue, R.; Wang, L.-j. Effects of salinity on the soil microbial community and soil fertility. J. Integr. Agric. 2019, 18, 1360–1368. [Google Scholar] [CrossRef]
  90. Rath, K.M.; Rousk, J. Salt effects on the soil microbial decomposer community and their role in organic carbon cycling: A review. Soil Biol. Biochem. 2015, 81, 108–123. [Google Scholar] [CrossRef]
  91. Obayomi, O.; Seyoum, M.M.; Ghazaryan, L.; Tebbe, C.C.; Murase, J.; Bernstein, N.; Gillor, O. Soil texture and properties rather than irrigation water type shape the diversity and composition of soil microbial communities. Appl. Soil Ecol. 2021, 161, 103834. [Google Scholar] [CrossRef]
  92. Xia, Q.; Rufty, T.; Shi, W. Soil microbial diversity and composition: Links to soil texture and associated properties. Soil Biol. Biochem. 2020, 149, 107953. [Google Scholar] [CrossRef]
  93. Mann, C.; Lynch, D.; Fillmore, S.; Mills, A. Relationships between field management, soil health, and microbial community composition. Appl. Soil Ecol. 2019, 144, 12–21. [Google Scholar] [CrossRef]
  94. Venter, Z.S.; Jacobs, K.; Hawkins, H.-J. The impact of crop rotation on soil microbial diversity: A meta-analysis. Pedobiologia 2016, 59, 215–223. [Google Scholar] [CrossRef]
  95. Guo, Z.; Wan, S.; Hua, K.; Yin, Y.; Chu, H.; Wang, D.; Guo, X. Fertilization regime has a greater effect on soil microbial community structure than crop rotation and growth stage in an agroecosystem. Appl. Soil Ecol. 2020, 149, 103510. [Google Scholar] [CrossRef]
  96. Kracmarova, M.; Uhlik, O.; Strejcek, M.; Szakova, J.; Cerny, J.; Balik, J.; Tlustos, P.; Kohout, P.; Demnerova, K.; Stiborova, H. Soil microbial communities following 20 years of fertilization and crop rotation practices in the Czech Republic. Environ. Microbiome 2022, 17, 13. [Google Scholar] [CrossRef] [PubMed]
  97. Town, J.R.; Dumonceaux, T.; Tidemann, B.; Helgason, B.L. Crop rotation significantly influences the composition of soil, rhizosphere, and root microbiota in canola (Brassica napus L.). Environ. Microbiome 2023, 18, 40. [Google Scholar] [CrossRef] [PubMed]
  98. Hart, M.M.; Powell, J.R.; Gulden, R.H.; Dunfield, K.E.; Peter Pauls, K.; Swanton, C.J.; Klironomos, J.N.; Antunes, P.M.; Koch, A.M.; Trevors, J.T. Separating the effect of crop from herbicide on soil microbial communities in glyphosate-resistant corn. Pedobiologia 2009, 52, 253–262. [Google Scholar] [CrossRef]
  99. Daniel, C.S.; Yin, C.; Hulbert, S.; Burke, I.; Paulitz, T. Impacts of Repeated Glyphosate Use on Wheat-Associated Bacteria Are Small and Depend on Glyphosate Use History. Appl. Environ. Microbiol. 2017, 83, e01354-17. [Google Scholar] [CrossRef]
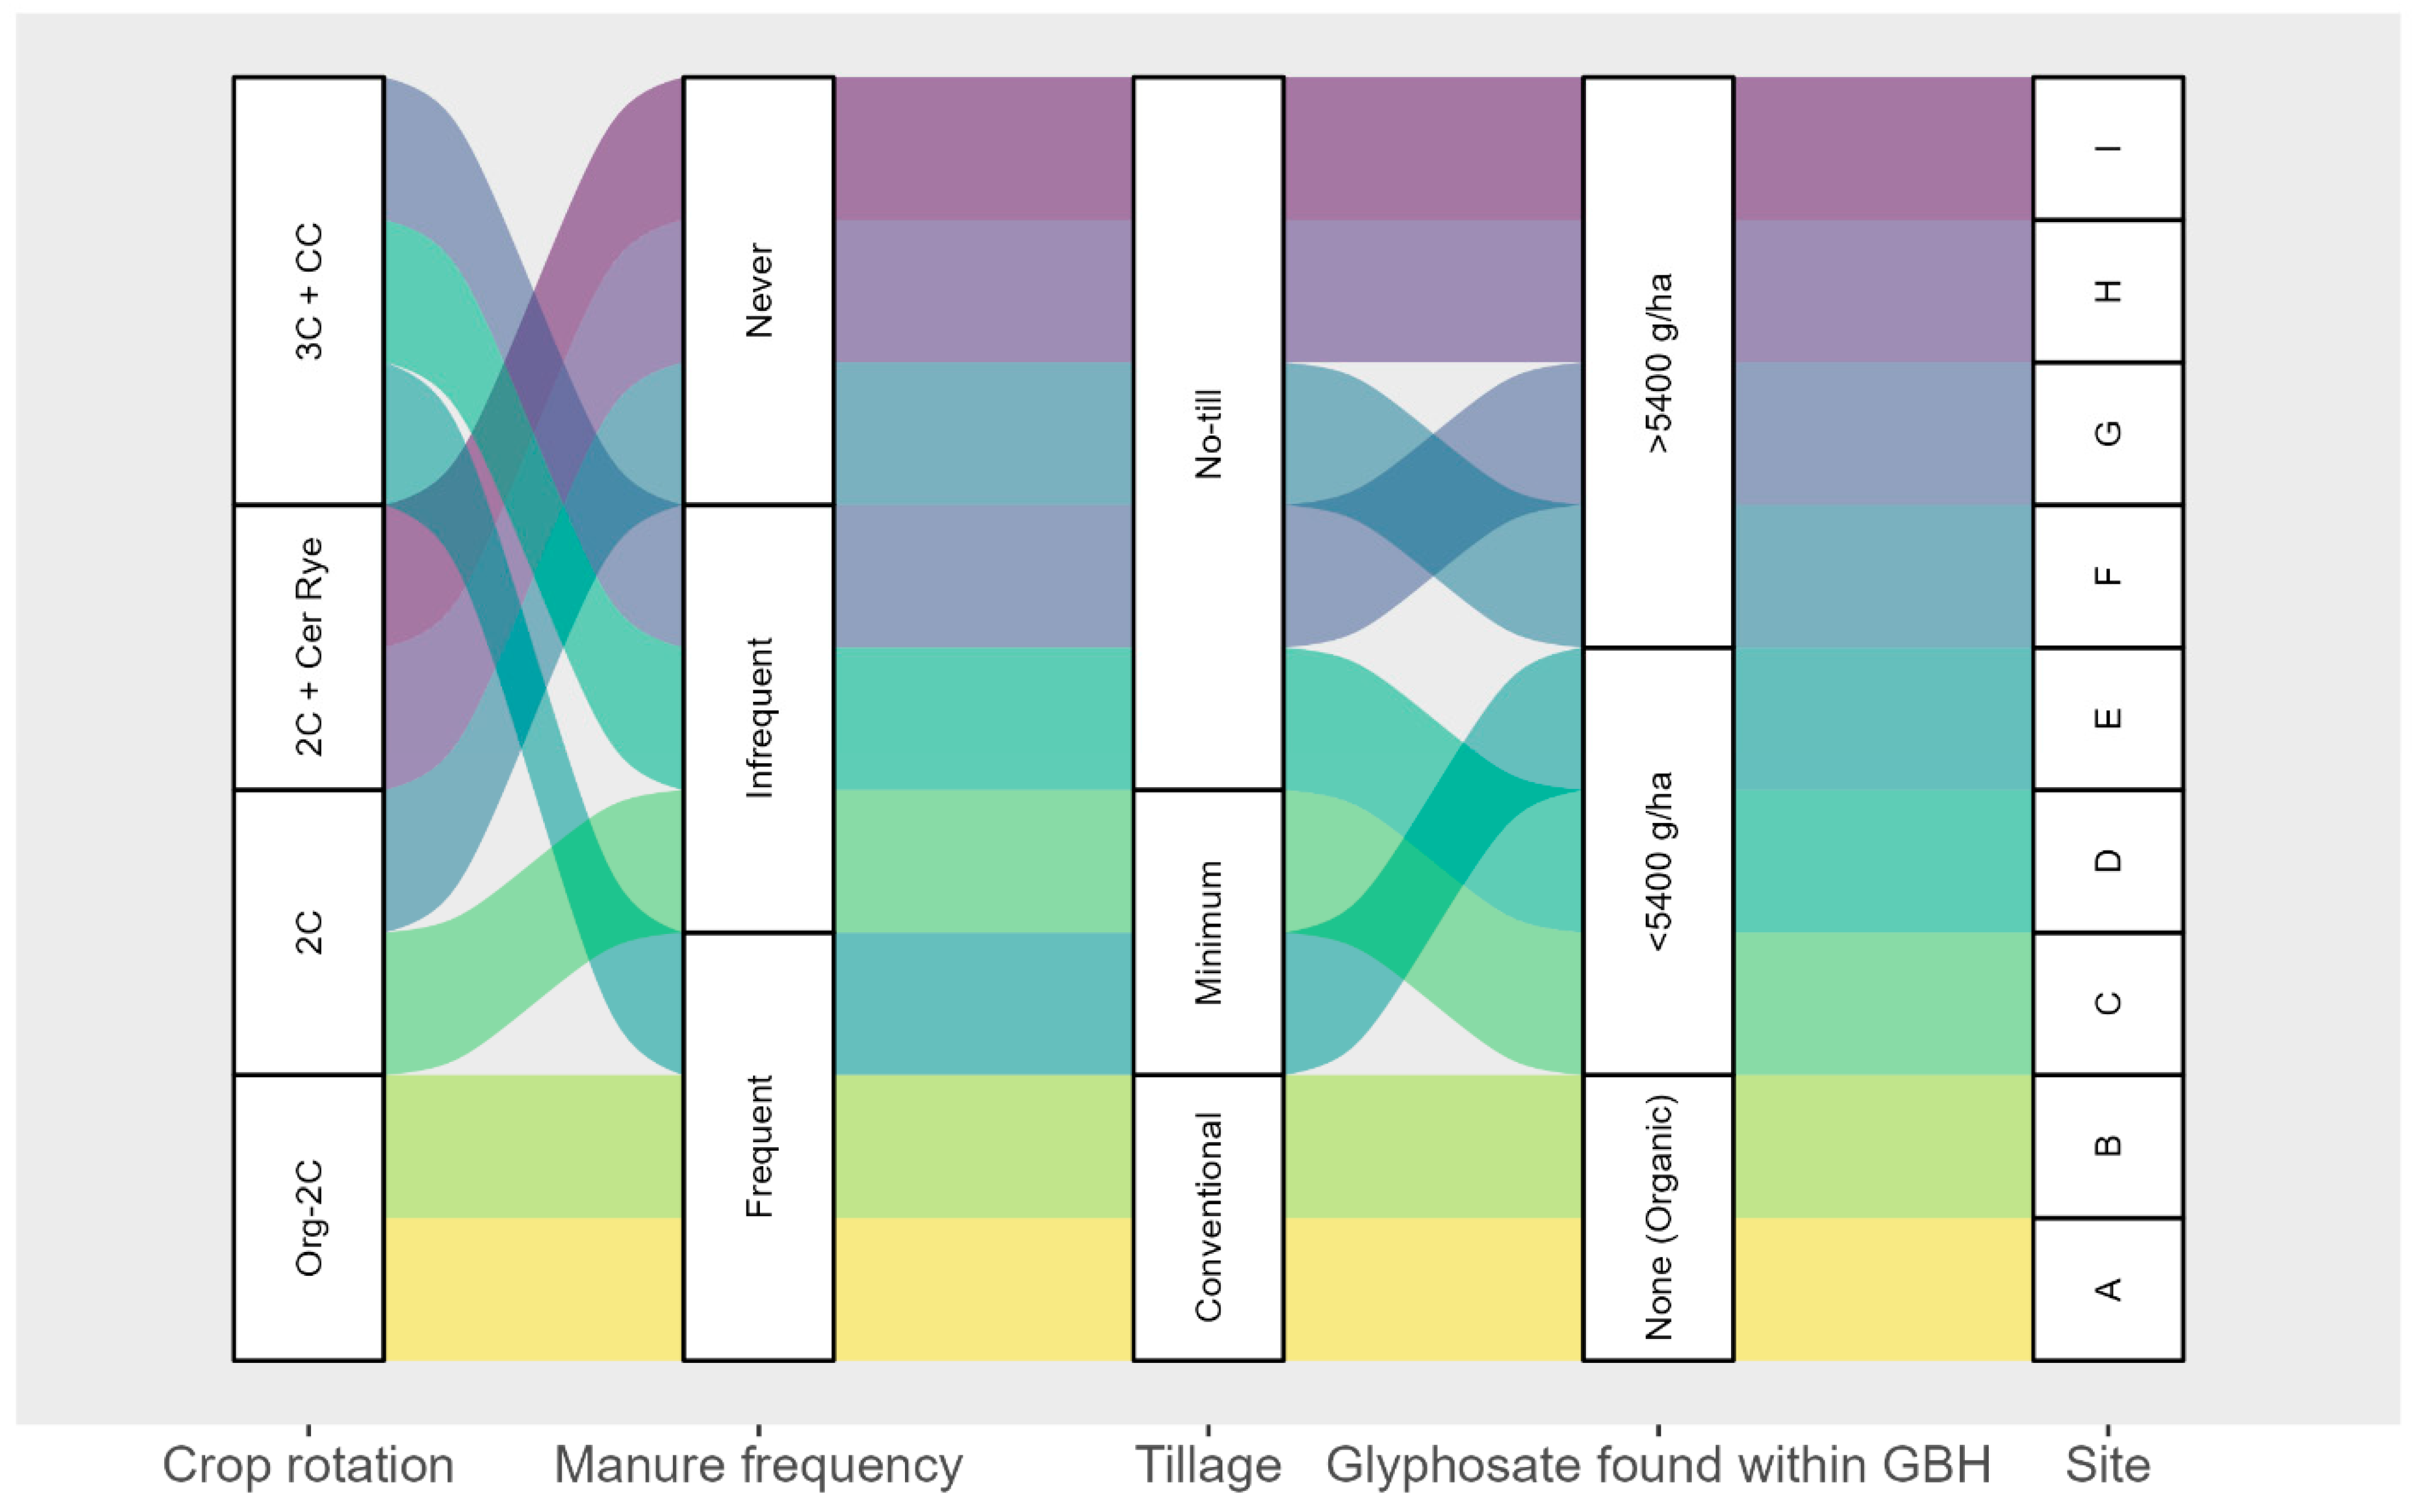
Figure 1. Location of the study sites (n = 9) in the province of Quebec, Canada. A red circle and a yellow letter denote each site.
Agronomy 14 00686 g001
Figure 2. Classification of the nine sites based on crop rotation, frequency of manure application, soil tillage and cumulative GBH application between 2017 and 2020. Acronyms: Org-2c: organic system with maize and soybean (M-S); 2C: conventional system M-S; 3C + CC: conventional system M-S-Wheat and cover crops (cereal, radish, peas) after wheat harvest; 2C + Cer Rye: conventional system with M-S with cover crop (cereal rye) after every crop harvest.
Agronomy 14 00686 g002
Figure 3. Glyphosate and AMPA soil contents at producers’ fields that were part of both this experiment in 2019 and 2020 and of that of Maccario et al. [23]’s study in 2014. Soils were sampled at 0–20 cm depth. Letters represent post-hoc analysis for each molecule using Tukey adjustment.
Agronomy 14 00686 g003
Figure 4. Coefficients values along with their 95% confidence interval for all independent variables in multiple regressions for AMPA (right) and glyphosate (left) content for 0–20 cm soil horizon of conventional sites.
Agronomy 14 00686 g004
Figure 5. Normalized value for Shannon diversity index of prokaryotic (Shannon_Prok), fungal (Shannon_Fung), and eukaryotic (Shannon_Euk) communities along with total bacteria (Total_Prok) and total fungi (Total_Fung) quantification for each site for years 2019 (corn) and 2020 (soybean) and both horizons (0–20 cm and 20–40 cm).
Agronomy 14 00686 g005
Figure 6. Principal coordinate analysis of prokaryotic (left), fungal (middle), and eukaryotic (right) communities. Point colors represent the groups based on GBH cumulative applications between 2017 and 2020. Point shapes and ellipses colors represent soil texture. Ellipses signification threshold was 0.05.
Agronomy 14 00686 g006
Figure 7. Normalized functional potential of prokaryotic communities for genes related to general metabolism (top) and genes related to glyphosate metabolism (bottom) for both years (2019 and 2020) and both soil horizons (0–20 cm and 20–40 cm).
Agronomy 14 00686 g007
Table 1. Information on GBH applications at the nine sites.
SitesGBH Group: Cumulative Applications
2017–2020 (g·ha−1)
GBH 2019 Application (g·ha−1)Cumulative GBH Applications 2017–2019 (g·ha−1)GBH 2020 Application (g·ha−1)Cumulative GBH Applications 2018–2020 (g·ha−1)
ANone0000
BNone0000
C<5400432793.813502144
D<5400378199818362916
E<5400999267321603159
F>5400108045908102430
G>54001950501015006510
H>54002700718224306912
I>54002700810024307830
Table 2. Physico-chemical properties of each site for the 0–20 cm soil profile. Mean values are shown for 2019 and 2020 samples. p-values comes from an analysis of variance for each variable; letters come from a post-hoc pair-wise comparison using Tukey adjustment.
SitesSand %Silt %Clay %OM %pHISP (%)CEC (meq/100 g)Na (ppm)
A3.50 ± 2.6750.25 ± 2.31 ab46.25 ± 2.314.72 ± 0.45 ab6.71 ± 0.11 a4.10 ± 0.94 c18.94 ± 1.24 a23.74 ± 3.92 a
B36.25 ± 9.0820.75 ± 4.3 ab43.00 ± 6.84.68 ± 0.58 ab6.50 ± 0.16 ab6.46 ± 2.48 c15.63 ± 1.84 b26.28 ± 9.97 a
C69.75 ± 6.7318.50 ± 4.69 b11.75 ± 2.053.45 ± 0.62 cd6.19 ± 0.19 bc20.62 ± 3.69 a8.99 ± 1.30 d3.96 ± 0.9 c
D63.00 ± 6.9623.75 ± 4.56 ab13.25 ± 3.585.02 ± 0.73 a6.50 ± 0.35 ab14.39 ± 6.04 b10.13 ± 1.57 d4.37 ± 1.02 c
E57.75 ± 2.8729.75 ± 3.73 a12.50 ± 0.934.81 ± 0.31 a5.99 ± 0.33 c5.30 ± 1.49 c12.19 ± 0.90 c9.20 ± 2.48 bc
F42.25 ± 6.6138.50 ± 5.26 ab19.25 ± 2.193.96 ± 0.28 bc6.75 ± 0.44 a7.48 ± 2.63 c9.67 ± 1.50 d4.39 ± 0.63 c
G3.25 ± 2.1945.50 ± 0.53 a51.25 ± 2.064.30 ± 0.22 ab6.87 ± 0.24 a5.04 ± 1.46 c18.12 ± 1.39 a14.44 ± 2.22 b
H33.75 ± 9.7736.25 ± 4.56 ab36.50 ± 3.424.58 ± 0.51 ab6.23 ± 0.24 bc4.90 ± 1.00 c14.75 ± 1.61 bc11.45 ± 1.63 b
I40.25 ± 5.6328.25 ± 3.81 ab31.50 ± 4.042.97 ± 0.26 d6.53 ± 0.13 ab7.60 ± 2.73 c9.58 ± 0.69 d10.08 ± 1.28 bc
p-value0.3130.010.162<0.01<0.01<0.01<0.01<0.01
Table 3. Average soil glyphosate and AMPA contents in 2019 and 2020 with respect to cumulative GBH application categories between 2017 and 2020.
Cumulative GBH Applications
2017–2020
Soil ProfileGlyphosate (µg·g−1 Dry Soil)AMPA (µg·g−1 Dry Soil)
AverageMaxDetection %AverageMaxDetection %
None0–20 cm0.04 ± 0.030.11810.10 ± 0.060.2594
20–40 cm0.03 ± 0.020.06500.05 ± 0.020.0669
<5400 g·ha−10–20 cm0.14 ± 0.130.581000.45 ± 0.261.16100
20–40 cm0.06 ± 0.030.13830.20 ± 0.210.7379
>5400 g·ha−10–20 cm0.23 ± 0.180.691000.45 ± 0.271.2297
20–40 cm0.23 ± 0.180.72970.15 ± 0.120.6988
Table 4. Marginal effect from distance-based redundancy analysis of each environmental and management variables on soil microbial communities.
Type of VariableVariabled.f.Prokaryotic CommunityFungal CommunityEukaryotic Community
Pseudo-F Valuep-ValuePseudo-F Valuep-ValuePseudo-F Valuep-Value
Environmental variablesOrganic matter10.8820.5741.110.2620.980.408
Ca11.200.2111.650.0231.870.023
Na12.320.0121.750.0092.050.012
Clay content12.080.0152.090.0032.050.013
Sand content11.780.0331.790.0091.680.032
Management variablesCumulative GBH application10.8530.5851.180.1980.8780.55
Crop rotation31.410.0451.460.0041.690.005
Manure inputs22.050.0052.060.0012.040.002
Disclaimer/Publisher’s Note: The statements, opinions and data contained in all publications are solely those of the individual author(s) and contributor(s) and not of MDPI and/or the editor(s). MDPI and/or the editor(s) disclaim responsibility for any injury to people or property resulting from any ideas, methods, instructions or products referred to in the content.

