Article

Transcriptome and Metabolome Analyses Reveal Ascorbic Acid Ameliorates Cold Tolerance in Rice Seedling Plants

1
Agronomy College, Jilin Agricultural University, Changchun 130118, China
2
National Key Laboratory of Rice Biology, China National Rice Research Institute, Hangzhou 310006, China
3
Shanghai Agrobiological Gene Center, Shanghai 201106, China
4
Management College, Nanchang Business College of Jiangxi Agricultural University, Nanchang 330013, China
*
Authors to whom correspondence should be addressed.
These authors contributed equally to this work.
Agronomy 2024, 14(4), 659; https://doi.org/10.3390/agronomy14040659
Submission received: 23 February 2024 / Revised: 18 March 2024 / Accepted: 21 March 2024 / Published: 24 March 2024
(This article belongs to the Section Farming Sustainability)

Abstract

:
Ascorbic acid (AsA) plays a crucial role in the physiological processes of rice plants when they encounter various biotic and abiotic stresses. However, the specific mechanism by which AsA affects cold tolerance in rice seedlings remains unclear. Two rice genotypes, Zhongzao39 (ZZ39) and its recombinant inbred line RIL82, were exposed to cold stress, resulting in more damage observed in RIL82 compared to ZZ39. This damage included higher levels of relative electrolytic leakage (REC), malondialdehyde (MDA), H2O2, a lower Fv/Fm, and a lower survival rate. A comprehensive analysis of transcriptome and metabolome data indicated that AsA was involved in regulating cold tolerance in ZZ39 and RIL82 seedling plants. AsA content increased in ZZ39 while it decreased in RIL82 under cold stress. Additionally, analysis of carbohydrate contents highlighted their important role in the responses to cold stress of these two genotypes. Importantly, exogenous AsA and sucrose, either alone or in combination, enhanced the values of maximum fluorescence quantum yield (Fv/Fm) and effective quantum yield (YII) as well as decreased H2O2 and MDA levels to improve cold tolerance in both genotypes compared with plants treated with H2O. These findings highlight the potential significance of AsA in mitigating the effects of cold stress on rice seedling plants.

1. Introduction

Due to the increasingly severe global warming and unpredictable weather patterns, low temperature has emerged as a significant environmental stressor impacting the growth, development, and spatial distribution of plants [1,2,3]. Typically, low temperature stress can be categorized into two types: cold stress (0–15 °C) and freezing stress (<0 °C). Exposure to cold stress during the seedling, flowering, and grain-filling stages in rice was found to weaken the efficiency of light utilization in the leaves at these stages, lower the photosynthetic rate in rice leaves, inhibit the synthesis and transport of assimilates, affect the growth rate of rice, and cause an increase in the source/sink growth ratio, leading to a reduction in rice production [4]. Similar results were also found in other studies of rice subjected to cold stress at different growth stages [5,6]. The occurrence of late spring coldness during the rice seedling stage severely affects the safe production of rice. Cold stress during the seedling stage often leads to various physiological changes in crop plants, such as leaf rolling, yellowing, stunting, and wilting, depending on the severity of the cold stress and the plants’ ability to withstand it [7,8,9].
Rice, an essential cereal crop, plays a pivotal role in feeding over half the global population [10]. Thriving in tropical or subtropical regions, rice exhibits a heightened sensitivity to cold stress [11,12]. This stress factor significantly impacts rice yield and quality, thereby constraining its distribution [13,14,15]. In response to cold stress, rice initiates an oxidative stress reaction characterized by a decline in photosynthesis and an accumulation of malondialdehyde (MDA) and reactive oxygen species (ROS) [16,17]. Fv/Fm is an index used to measure the maximum photochemical efficiency of PSII. Cold stress often leads to oxidative damage to PSII, decreasing the ratio of FvFm and finally reducing photosynthesis [18,19]. This, in turn, affects crucial antioxidant enzymes such as superoxide dismutase (SOD), catalase (CAT), and peroxidase (POD) [12,20]. Additionally, cold stress prompts the accumulation of compatible osmolytes, including free proline, proline metabolism products, lipids, and soluble sugars, aimed at preserving cell membrane stability [21,22]. Furthermore, non-enzymatic antioxidants like ascorbic acid (AsA) play a role in this protective mechanism.
AsA, known as vitamin C, plays a pivotal role in plant growth and development, including the synthesis and signal transduction of plant hormones, photosynthesis, cell division, cell wall synthesis, flowering, and fruit development [23,24,25,26,27,28]. Exogenous application of AsA modulates the activity of photosynthetic enzymes, upholds chlorophyll content, and maintains the stability of photosynthetic membranes, thereby fostering photosynthesis in rice [29]. AsA-deficient mutants of Arabidopsis thaliana exhibit precocious flowering under long-day conditions [30]. Importantly, AsA, recognized as a potent non-enzymatic antioxidant, plays a crucial role in neutralizing free radicals and reducing oxidative stress on plant cells caused by abiotic stress [31,32,33]. It has been reported that exogenous AsA ameliorates damage caused by salt stress in rice by increasing nitrogen (N), potassium ions (K+), chlorophyll, and photosynthesis [34]. Under cold stress, exogenous glutathione (GSH) and AsA enhance the enzyme activities of CAT, POD, ascorbate peroxidase (APX), SOD, amylase, and α-amylase, as well as soluble sugar content, thus increasing seed germination in tomatoes and rice [35,36]. However, studies on the function of AsA in enhancing cold tolerance in rice seedling plants are scarce, and more research is required to reveal the underlying mechanism.
In this experiment, two rice genotypes, namely Zhongzao39 (ZZ39) and the recombinant inbred line 82 (RIL82), which was selected from a F9 RIL population derived from the rice cross ZZ39 × ZJZ17 (Zhongjiazao17), differing in cold tolerance, were subjected to cold stress at the seedling stage [18]. During this period, analyses of transcriptome and metabolome data, AsA, MDA, maximum fluorescence quantum yield of photosystem II (Fv/Fm), antioxidant enzyme activities, and carbohydrate content were conducted to reveal the underlying mechanism of AsA’s enhancement of cold tolerance in rice seedling plants.

2. Experimental Materials and Methods

2.1. Experimental Design

This research study was carried out at the China National Rice Research Institute (CNRRI), situated in Fuyang District, Hangzhou City, Zhejiang Province. To initiate the process, seeds of both ZZ39 and RIL82 varieties were submerged in water at 30 °C for 48 h, followed by a germination phase at 35 °C lasting 24 h. Subsequently, these seeds were sown in square pots. Upon reaching the three-leaf stage, the rice seedlings were transplanted into pots with a height of 10 cm and a radius of 5 cm, accommodating 8 seedlings per pot.
For cold stress treatment, the pots were divided into two groups. One group was directly exposed to temperatures of 13/10 °C (day/night), while the other group served as the control and was maintained at a constant temperature of 28/23 °C (day/night). Both groups were cultivated under controlled humidity (70–80%) and light intensity (300 μmol·m−2·s−1). Following the treatment, photographs were taken, and samples were collected for physiological measurements. The plant mortality rate was then calculated, and the plants were returned to the control temperature.

2.2. Measurement Indicators and Methods

2.2.1. Measurement of Chlorophyll Fluorescence Parameters

The plants underwent a 12 h cold stress treatment, with subsequent periods of darkness lasting 30 min at 48 h and 168 h after the conclusion of the cold stress treatment. A Dual-PAM 100 dual-channel modulated chlorophyll fluorometer (Heinz Walz GmbH Effeltrich, Nuremberg, Bavaria, Germany) was employed to measure the maximum quantum efficiency of chlorophyll fluorescence (Fv/Fm). The measurement followed the methodology outlined by Zhao et al. (2017) with slight modifications [19].

2.2.2. Measurement of Relative Electrical Conductivity (REC)

Leaf samples weighing approximately 0.1 g and devoid of veins were cut into roughly 25 mm2 fragments and thoroughly mixed. REC was measured following the method described by Hatsugai et al. (2018) with slight adjustments [37]. Each sample was placed in a centrifuge tube with 10 mL of distilled water, ensuring the leaf fragments were submerged at the tube’s bottom using vacuum extraction. Subsequently, the tubes were incubated at 25 °C for 24 h. After incubation, the initial electrical conductivity (EC1) was measured with a conductivity meter. The tubes then underwent a 100 °C water bath for 0.5 h, followed by cooling in an ice bath to 25 °C. The final electrical conductivity (EC2) was measured, and the relative electrical conductivity (ion leakage, REC) was calculated using the formula: EC1/EC2.

2.2.3. Measurement of H2O2 and Malondialdehyde (MDA) Content

In accordance with the adapted approach outlined by Brennan and Frenkel (1977) [38], the H2O2 content in leaf samples was assessed. After 12 h of cold stress, the latest fully developed leaves of rice seedlings were clipped and rapidly frozen with liquid nitrogen. Frozen leaf samples, weighing 0.1 g, were ground in 1.8 mL of 10 mM 3-amino-1,2,4-triazole. The resulting homogenate underwent centrifugation at 8000× g, 4 °C, for 10 min. The collected supernatant was mixed with an equal volume of 20% H2SO4 containing 0.1% titanium tetrachloride (TiCl4). Following a further centrifugation step to eliminate impurities, the absorbance of the supernatant was measured at 410 nm using a spectrophotometer (Lambda25; Perkin Elmer, Freemont, CA, USA).
Based on the modified method detailed by Chen and Zhang (2016) [39], leaf samples (0.1 g) were ground in 1.8 mL of trichloroacetic acid (TCA) to form a homogenate. The extract underwent centrifugation at 6000× g, 25 °C for 15 min. To 1 mL of the supernatant, 1 mL of TCA containing 0.6% thiobarbituric acid (TBA) was added. The reaction mixture was shaken, heated in a boiling water bath for 10 min, and subsequently cooled in an ice bath. After an additional centrifugation step for impurity removal, the absorbance of the supernatant was measured at 450 nm, 532 nm, and 600 nm using a spectrophotometer. The concentration of malondialdehyde (MDA) was then calculated using the formula: CMDA = 6.45 × (λ532 − λ600) − 0.56 × λ450.

2.2.4. Measurement of Antioxidant Enzyme Activity

After 12 h of cold stress, the latest fully developed leaves of rice seedlings were clipped and rapidly frozen with liquid nitrogen. A total of 0.1 g of frozen leaf samples was ground into powder using liquid nitrogen. The powder was homogenized in 100 mM PBS (pH 7.0). The resulting solution was centrifuged at 12,000× g for 15 min at 4 °C and the supernatant was stored at −20 °C for subsequent analysis.
Superoxide dismutase (SOD) activity was assessed following the procedure outlined by Giannopolitis and Ries (1977) [40]. Peroxidase (POD) activity was determined using the method specified by Maehly and Chance (1954) [41]. Catalase (CAT) activity was measured in accordance with the method detailed by Chen and Zhang (2016) [39]. Ascorbate peroxidase (APX) activity was evaluated based on the methodology described by Bonnecarrère et al. (2011) [42].

2.2.5. Carbohydrate Measurement

The sulfuric anthrone colorimetric method, modified from Dubois et al. (1956) [43], was utilized as a benchmark to quantify the levels of total soluble sugars and starch. The extraction procedure for sucrose, glucose, and fructose remained consistent with that used for total soluble sugars. Following modifications outlined by Zhang et al. (2018) [44], the content of sucrose, glucose, and fructose was assessed. The total non-structural carbohydrate (NSC) content is the aggregate of soluble sugars and starch.

2.2.6. RNA Extraction and Quantitative Real-Time Polymerase Chain Reaction (qRT-PCR) Analysis

After 12 h of cold stress, the latest fully developed leaves of rice seedlings were collected for qRT-PCR. After freezing and grinding the leaf samples in a mortar with liquid nitrogen, total RNA extraction was conducted using TriPure reagent (Aidlab Biotechnologies, Beijing, China). Subsequently, RNA concentration and quality were assessed using a NanoDrop One spectrophotometer (Thermo Fisher Scientific, Madison, WI, USA). The extracted RNA samples underwent reverse transcription into single-stranded cDNA, utilizing a high-quality ReverTra Ace qPCR RT Master Mix (TOYOBO, Shanghai, China) as the template for subsequent PCR amplification.
For qRT-PCR analysis, amplification reactions were performed using the highly sensitive SYBR Green I fluorescent dye (TOYOBO) and the advanced Thermal Cycler Dice Real-Time System II (TaKaRa Biotechnology, Dalian, China). Primers were designed with PRIMER 6 software, and detailed primer sequences are provided in the Supplementary Table S2. Rice ubiquitin5 was used to normalize the detection for each reaction. The qRT-PCR procedure followed the methodology outlined by Feng et al. (2013) [45], and relative gene expression levels were analyzed using the 2−ΔΔCT method. Three biological and technical replicates were used in qRT-PCR analysis.

2.2.7. RNA Sequencing (RNA-Seq) and Bioinformatics Analysis

After 12 h of cold stress treatment, fresh top second leaves were harvested and immediately preserved in liquid nitrogen. Total RNA was subsequently extracted from the frozen leaf tissue. Following this, all transcribed mRNAs from the samples underwent sequencing at Shanghai Applied Protein Technology Co., Ltd., Shanghai, China, carried out via the HiSeq platform. A library was prepared and then sequencing analysis was performed using the Illumina TruSeqTM RNA Sample Prep Kit methodology.
Publicly available tools were used to analyze raw sequences in FASTQ format gained from the Illumina platform. Low-quality bases (Q < 15) were trimmed from both ends of the sequences via a customized program, and Cut adapt was used to trim the adapters. The sequences were mapped to the complete set of CDS from Rice_9311 (https://rice.genomics.org.cn/rice2/link/download.jsp, accessed on 12 October 2023) using TopHat2 [19]. Reference-based assembly of the reads was performed using Cufflinks and Cuffmerge (https://cufflinks.cbcb.umd.edu/, accessed on 12 October 2023). The expression level of each gene was defined as the fragments per transcript kilobase per million fragments mapped (FPKM) value; FPKM = cDNA fragments/(mapped fragments × transcript length). Differentially expressed genes (DEGs) were identified as the corrected p value ≤ 0.01 and fold change ≥2 [46].
Subsequently, the significant enrichment analysis of Gene Ontology (GO) functionality provided GO function entries that were significantly enriched in DEGs, compared to the genomic background. This divulged which biological functions DEGs were notably involved in. The process was initiated by mapping all DEGs to the respective terms in the Gene Ontology database (https://www.geneontology.org/, accessed on 15 October 2023) and calculating the number of genes for each term. Subsequently, entries that were remarkably enriched in DEGs compared to the whole genomic background were identified. The significant enrichment analysis of GO annotations, using GO Terms as the unit, employed hypergeometric tests to discover terms that were significantly enriched in DEGs in relation to all genes annotated (p ≤ 0.05). By leveraging the KEGG database (Kyoto Encyclopedia of Genes and Genomes, https://www.genome.jp/kegg/, accessed on 16 October 2023), genes were classified based on the pathways they participated in or the functions they executed. Following this, KOBAS (https://kobas.cbi.pku.edu.cn/home.do, accessed on 16 October 2023) was employed to carry out an enrichment analysis of KEGG pathways (p ≤ 0.05).

2.2.8. Metabolomics Analysis

After 12 h of cold stress treatment, fresh top second leaves were harvested and immediately preserved in liquid nitrogen. Metabolites were extracted following the procedure provided by the company (Shanghai Applied Protein Technology Co., Ltd.). After the analysis, using UHPLC-Orbitrap Exploris™ 480 MS (Vanquish UHPLC, Thermo and Orbitrap Exploris™ 480, Thermo Fisher Scientific, Madison, WI, USA), raw data were collected. First, the data underwent conversion to MzXML files via ProteoWizard MSConvert before being imported into the freely available XCMS software, https://xcmsonline.scripps.edu/landing_page.php?pgcontent=mainPage, accessed on 10 November 2023. Then, the annotation of isotopes and adducts was performed using CAMERA (Collection of Algorithms of MEtabolite pRofile Annotation). After these, the compound identification of metabolites involved comparing the accuracy of m/z values (<10 ppm) and MS/MS spectra with an in-house database established using available authentic standards.
Following sum-normalization, the processed data underwent analysis using the R package (ropls), which subjected it to multivariate data analysis, including Pareto-scaled principal component analysis (PCA) and orthogonal partial least-squares discriminant analysis (OPLS-DA). To evaluate model robustness, a 7-fold cross-validation and response permutation testing was conducted. Variable importance in the projection (VIP) value of each variable in the OPLS-DA model was calculated to indicate its contribution to classification. Statistical significance between two groups of independent samples was assessed using Student’s t-test. Differentially expressed metabolites (DEMs) were screened based on VIP > 1 and p-value < 0.05.

2.2.9. Exogenous Spraying of Sucrose and Ascorbic Acid (AsA) under Cold Stress

The validation experiment for exogenous application involved ZZ39 and its recombinant inbred line RIL82 as the selected testing materials, following the planting and treatment methods outlined in Section 2.1. To assess sucrose metabolism and ascorbic acid metabolism, exogenous application of sucrose and ascorbic acid was conducted. The determined appropriate concentrations for sucrose and ascorbic acid, based on Feng et al. (2020) [27], were 0.1% and 10 mM, respectively. Additionally, a combination of both compounds was administered, with the addition of 0.1% Tween 20 as a surfactant for the exogenous application.
The cold stress treatment lasted 12 h. Post treatment, samples were collected to measure relevant physiological indicators. Following this, the treatment persisted for an additional 12 h, during which fully expanded leaves of the plants were selected for the determination of the maximum fluorescence quantum yield (Fv/Fm) and effective quantum yield (YII).

2.2.10. Measurement of AsA Content

Ascorbic acid (vitamin C) is an acidic hexose lactone compound with vital functions as a coenzyme, antioxidant, free radical scavenger, electron donor/acceptor, and biosynthetic substrate crucial for the formation of plant stress tolerance. The determination of ascorbic acid content was carried out using the ascorbic acid content detection kit manufactured by BoxBio (Beijing Boxbio Science & Technology Co., Ltd., Beijing, China).
To extract ascorbic acid, 0.1 g frozen leaves was ground into a powder in liquid nitrogen, and 1 mL of the extraction solution was added for grinding and homogenization in an ice bath. Following centrifugation at 4 °C and 8000× g for 20 min, the supernatant was collected as the ascorbic acid extract. Ascorbic acid oxidase catalyzed the oxidation of ascorbic acid to generate dehydroascorbic acid. The characteristic absorption peak of ascorbic acid at 265 nm was measured using a UV spectrophotometer, and the ascorbic acid content was calculated.

2.2.11. Measurement of Ascorbate Oxidase Activity

Following the method outlined by Yu and Qiao (2003) [47] with slight adjustments, 0.1 g of frozen leaf tissue was ground into a powder using liquid nitrogen. The resulting powder was combined with 0.1 M pH 6.0 phosphate-buffered saline (PBS) and homogenized on an ice bath. The homogenate underwent centrifugation at 4 °C, 4000× g, for 10 min, and the supernatant was collected as the ascorbate oxidase extract.
In each of the 50 mL test tubes, 1 mL of pH 6.0 PBS and 0.1% ascorbic acid (AsA) were sequentially added. A blank tube was prepared with 1 mL of 10% trichloroacetic acid (TCA). Subsequently, 0.75 mL of the enzyme solution was added to each tube per minute, with the time of enzyme addition recorded. After shaking the tubes, the enzyme-catalyzed reaction proceeded for 5 min in a water bath at 18–20 °C. Following this, 1 mL of 10% TCA was added to halt the reaction. Two drops of 1% starch solution served as an indicator in each bottle. Titration was conducted using iodine solution prepared with potassium iodate and potassium iodide, and the endpoint was indicated by a light blue color of the solution. The volume of iodine solution used for titration was recorded to calculate the ascorbate oxidase activity.

2.2.12. Statistical Analysis

Data were processed using SPSS software 11.5 (IBM Corp., Armonk, NY, USA). The mean values and standard errors in the figures are from at least three replicates of independent experiments. Two-way analysis of variance (ANOVA) for two factors (genotypes and cold stress treatments) and one-way ANOVA (cold stress in one genotype) were conducted to compare the difference with a least significant difference test at p < 0.05 for the data.

3. Results

3.1. Effects of Cold Stress on the Morphological and Physiological Characteristics of Rice Seedlings

Under cold stress, the two rice genotypes exhibited distinct phenotypic variations, with RIL82 notably experiencing more adverse damage compared to ZZ39 (Figure 1). Within the first 12 h of cold treatment, RIL82 rice leaves curled, while ZZ39 displayed no significant changes. After 24 h, both genotypes experienced leaf curling, with RIL82 showing more severe symptoms. As the recovery time increased after the cold stress subsided, ZZ39 leaves gradually unfolded to a fully expanded state. In contrast, RIL82 leaves turned yellow, wilted, and exhibited a significant mortality rate of 52% (Figure 1A,B).
Regarding Fv/Fm, it significantly decreased after 24 h of cold stress in ZZ39 leaves, yet the decrease was less pronounced compared to RIL82. During recovery from cold stress, RIL82 leaves sustained severe damage, in contrast to ZZ39. Fv/Fm continued to decrease after recovery, with the decline progressively intensifying over the recovery period (Figure 1C). In contrast, the levels of relative electrolytic leakage (REC), H2O2 (hydrogen peroxide), and MDA (malondialdehyde) in the leaves of ZZ39 were obviously increased by cold stress, while no obvious difference between the control and cold stress was found in RIL82, except for H2O2, which revealed that cold stress substantially elevated H2O2 content in both genotypes (Figure 1D–F).

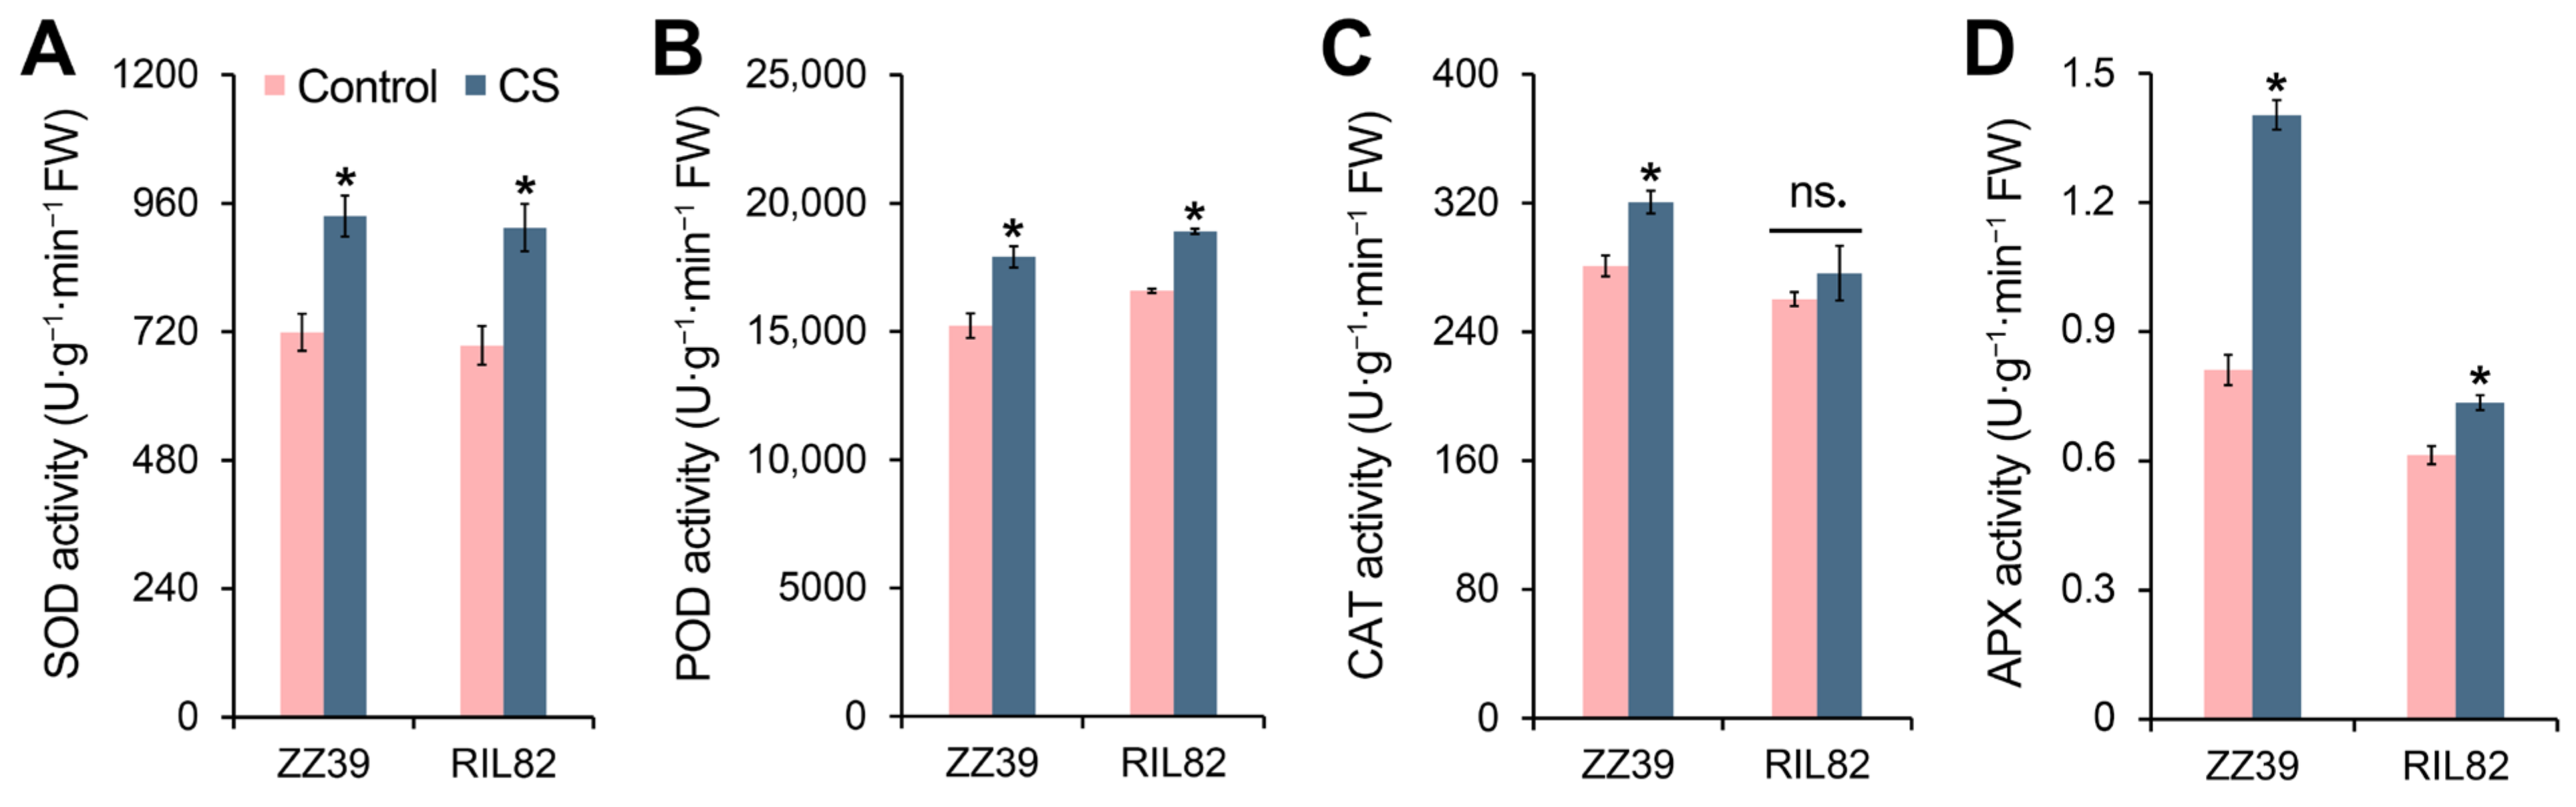
3.2. Effects of Cold Stress on Antioxidant Enzyme Activity in Rice Seedlings

Cold stress significantly increased SOD activity in both ZZ39 and RIL82 leaves. Notably, the rise in SOD activity was slightly more pronounced in RIL82, increasing by 31.6%, compared to ZZ39’s increase of 30.2% (Figure 2A). Additionally, during cold stress, both ZZ39 and RIL82 demonstrated a noteworthy increase in POD activity, with ZZ39 increasing by 14.4% and RIL82 by 12.1%, respectively (Figure 2B). In terms of catalase (CAT), ZZ39 exhibited a significant increase of 14.1%, while RIL82 showed no significant difference (Figure 2C). Furthermore, ascorbate peroxidase (APX) experienced a substantial increase in both genotypes, but the enhancement in ZZ39 was considerably higher than that in RIL82, with increases of 72.9% and 19.8%, respectively (Figure 2D).

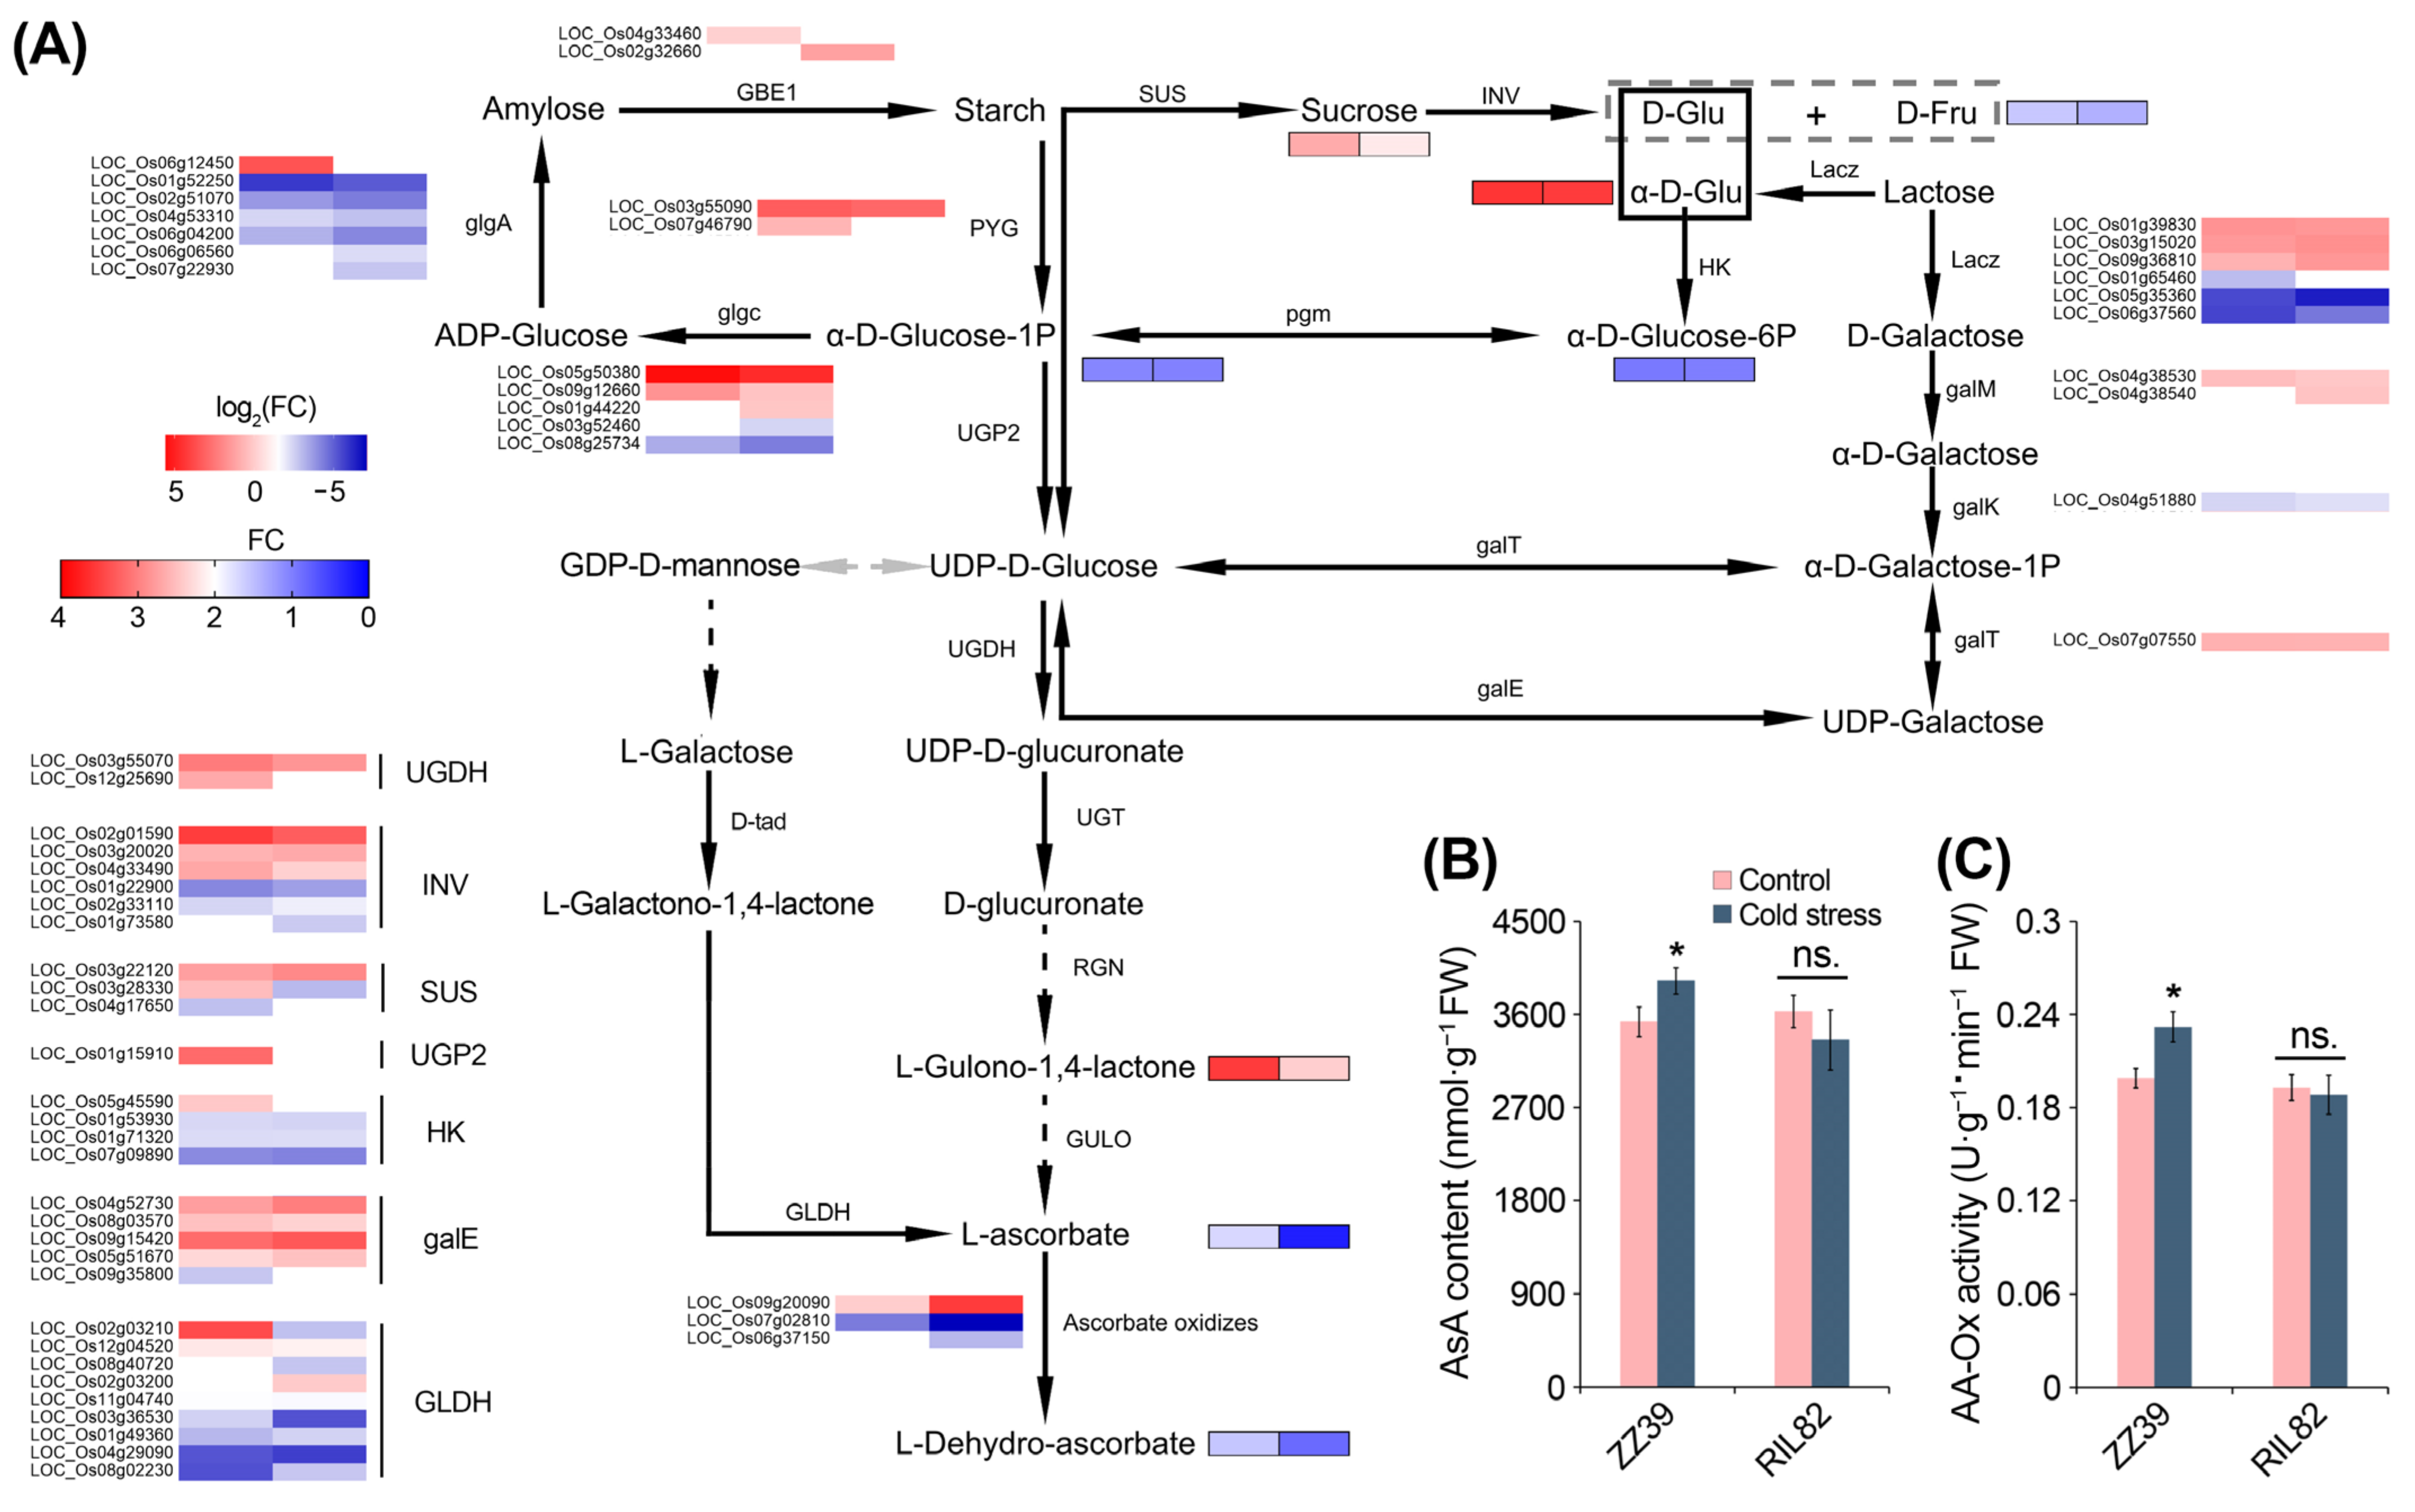
3.3. Comparative Transcriptome and Metabolome Profiling Revealed the Important Role of Ascorbic Acid in Cold Response of Rice

A comprehensive joint analysis of transcriptome and metabolome data was conducted for both genotypes (ZZ39 and RIL82) to reveal the underlying mechanism. Differentially expressed genes (DEGs) and differentially expressed metabolites (DEMs) (fold change > 2, p < 0.05) were identified in 106 metabolic pathways and 71 KEGG metabolic pathways, respectively (Table S1). The combined analysis of ZZ39 and RIL82 transcriptome and metabolome data revealed their involvement in 60 and 64 KEGG pathways, respectively, highlighting significant differences in both transcriptomics and metabolomics under cold stress (Figure 3A).
Subsequent analysis of the enrichment significance levels of DEGs and DEMs in each KEGG pathway emphasized the role of carbohydrate metabolic pathways in plant cold tolerance. Following cold stress treatment, seven DEGs and DEMs in ZZ39 were significantly enriched in the top 20 carbohydrate-related KEGG metabolic pathways, whereas RIL82 only exhibited four enrichments in the top 20 carbohydrate-related KEGG pathways (Figure 3B).
A closer examination of DEGs and DEMs in the carbohydrate KEGG pathway for both genotypes revealed a significant reduction in the number of DEGs in the sucrose and starch metabolism pathway of ZZ39 compared to RIL82, with no significant difference in DEMs. In pathways such as amino sugar and nucleotide sugar metabolism, galactose metabolism, fructose metabolism, and glycolysis/gluconeogenesis, ZZ39 displayed a higher number of DEGs compared to RIL82, while DEMs showed no significant difference (Figure 3C).
Further analysis of carbohydrate KEGG pathways were conducted using DEGs. The results showed that the enrichment of the carbohydrate and sucrose metabolism pathways was more significant in RIL82 than ZZ39 in terms of the downregulation of DEGs. Additionally, the ascorbic acid and aldoate metabolism pathways were enriched in downregulated DEGs in RIL82, while these pathways were enriched in upregulated DEGs in ZZ39 (Figure 4A–D).
In-depth enriched chord diagram analyses of differentially expressed genes (DEGs) related to carbohydrate metabolism in the KEGG pathways for ZZ39 and RIL82 under cold stress were conducted using an online website (https://www.bioinformatics.com.cn, accessed on 17 November 2023). It was unveiled that under cold stress, RIL82 exhibited a higher degree of downregulation in the sucrose and starch metabolism to ascorbic acid synthesis pathway compared to ZZ39 (Figure 4E,F).
In addition, six genes were randomly selected for qRT-PCR analysis. In general, qRT-PCR data were consistent with the RNA-Seq results, suggesting that the RNA-Seq data are reliable (Figure S1).
The enrichment outcomes of differentially expressed genes (DEGs) shed light on the variances in the pathways of ascorbic acid and glucose metabolism during the development of cold tolerance in ZZ39 and RIL82 (Figure 5). When subjected to cold stress, ZZ39 exhibited a higher degree of upregulation in genes related to the synthesis and metabolism of starch, α-regulation of starch, and α-synthesis and metabolism of D-glucose-1P. Notably, ZZ39 controlled the upregulation of PYG, glgC, glgA, GBE1, UGP2, and UGDH synthesis genes to a greater extent than RIL82, whereas RIL82 displayed a higher degree of downregulation in these synthesis genes.
In the process of ascorbic acid synthesis under cold stress, both genotypes exhibited an increase in sucrose content. In the regulation and metabolism of sucrose, ZZ39 controlled the upregulation of SUS and INV synthesis-related genes more than RIL82, while the downregulation of these genes was lower than in RIL82. This resulted in a higher upregulation of D-glucose in ZZ39 compared to RIL82, while RIL82 showed higher downregulation of D-fructose and D-glucose-1P than ZZ39. Hexokinase (HK), a crucial player in hexose metabolism, had its synthesis-related genes upregulated in ZZ39 but downregulated in RIL82 under cold stress.
Examining the genes related to the rate-limiting enzyme GLDH (critical for ascorbic acid synthesis) revealed that cold stress upregulated the expression of ZZ39’s GLDH synthesis gene LOC_Os02g03210, inhibiting its expression in RIL82. Unlike in ZZ39, in RIL82, cold stress significantly downregulated LOC_Os08g40720 and LOC_Os03g36530, affecting ascorbic acid synthesis. Additionally, the upregulation of L-Gulono-1,4-lactone, a precursor of ascorbic acid synthesis, was notably higher in ZZ39 than in RIL82. Also, an increase in AsA content was observed in ZZ39, while a decrease was observed in RIL82 under cold stress (Figure 5A,B).
Ascorbic acid oxidase, a key enzyme for AsA degradation which is crucial for stress resistance, also showed distinctions between ZZ39 and RIL82. Under cold stress, ZZ39 displayed a lower increase in the synthesis of ascorbic acid oxidase LOC_Os09g20090 compared to RIL82, while the downregulation of LOC_Os07g02810 was less pronounced in ZZ39 than in RIL82. The inhibition of sucrose and ascorbic acid metabolism may consequently impact antioxidant processes in both genotypes, influencing the cold tolerance of rice (Figure 5A,C).

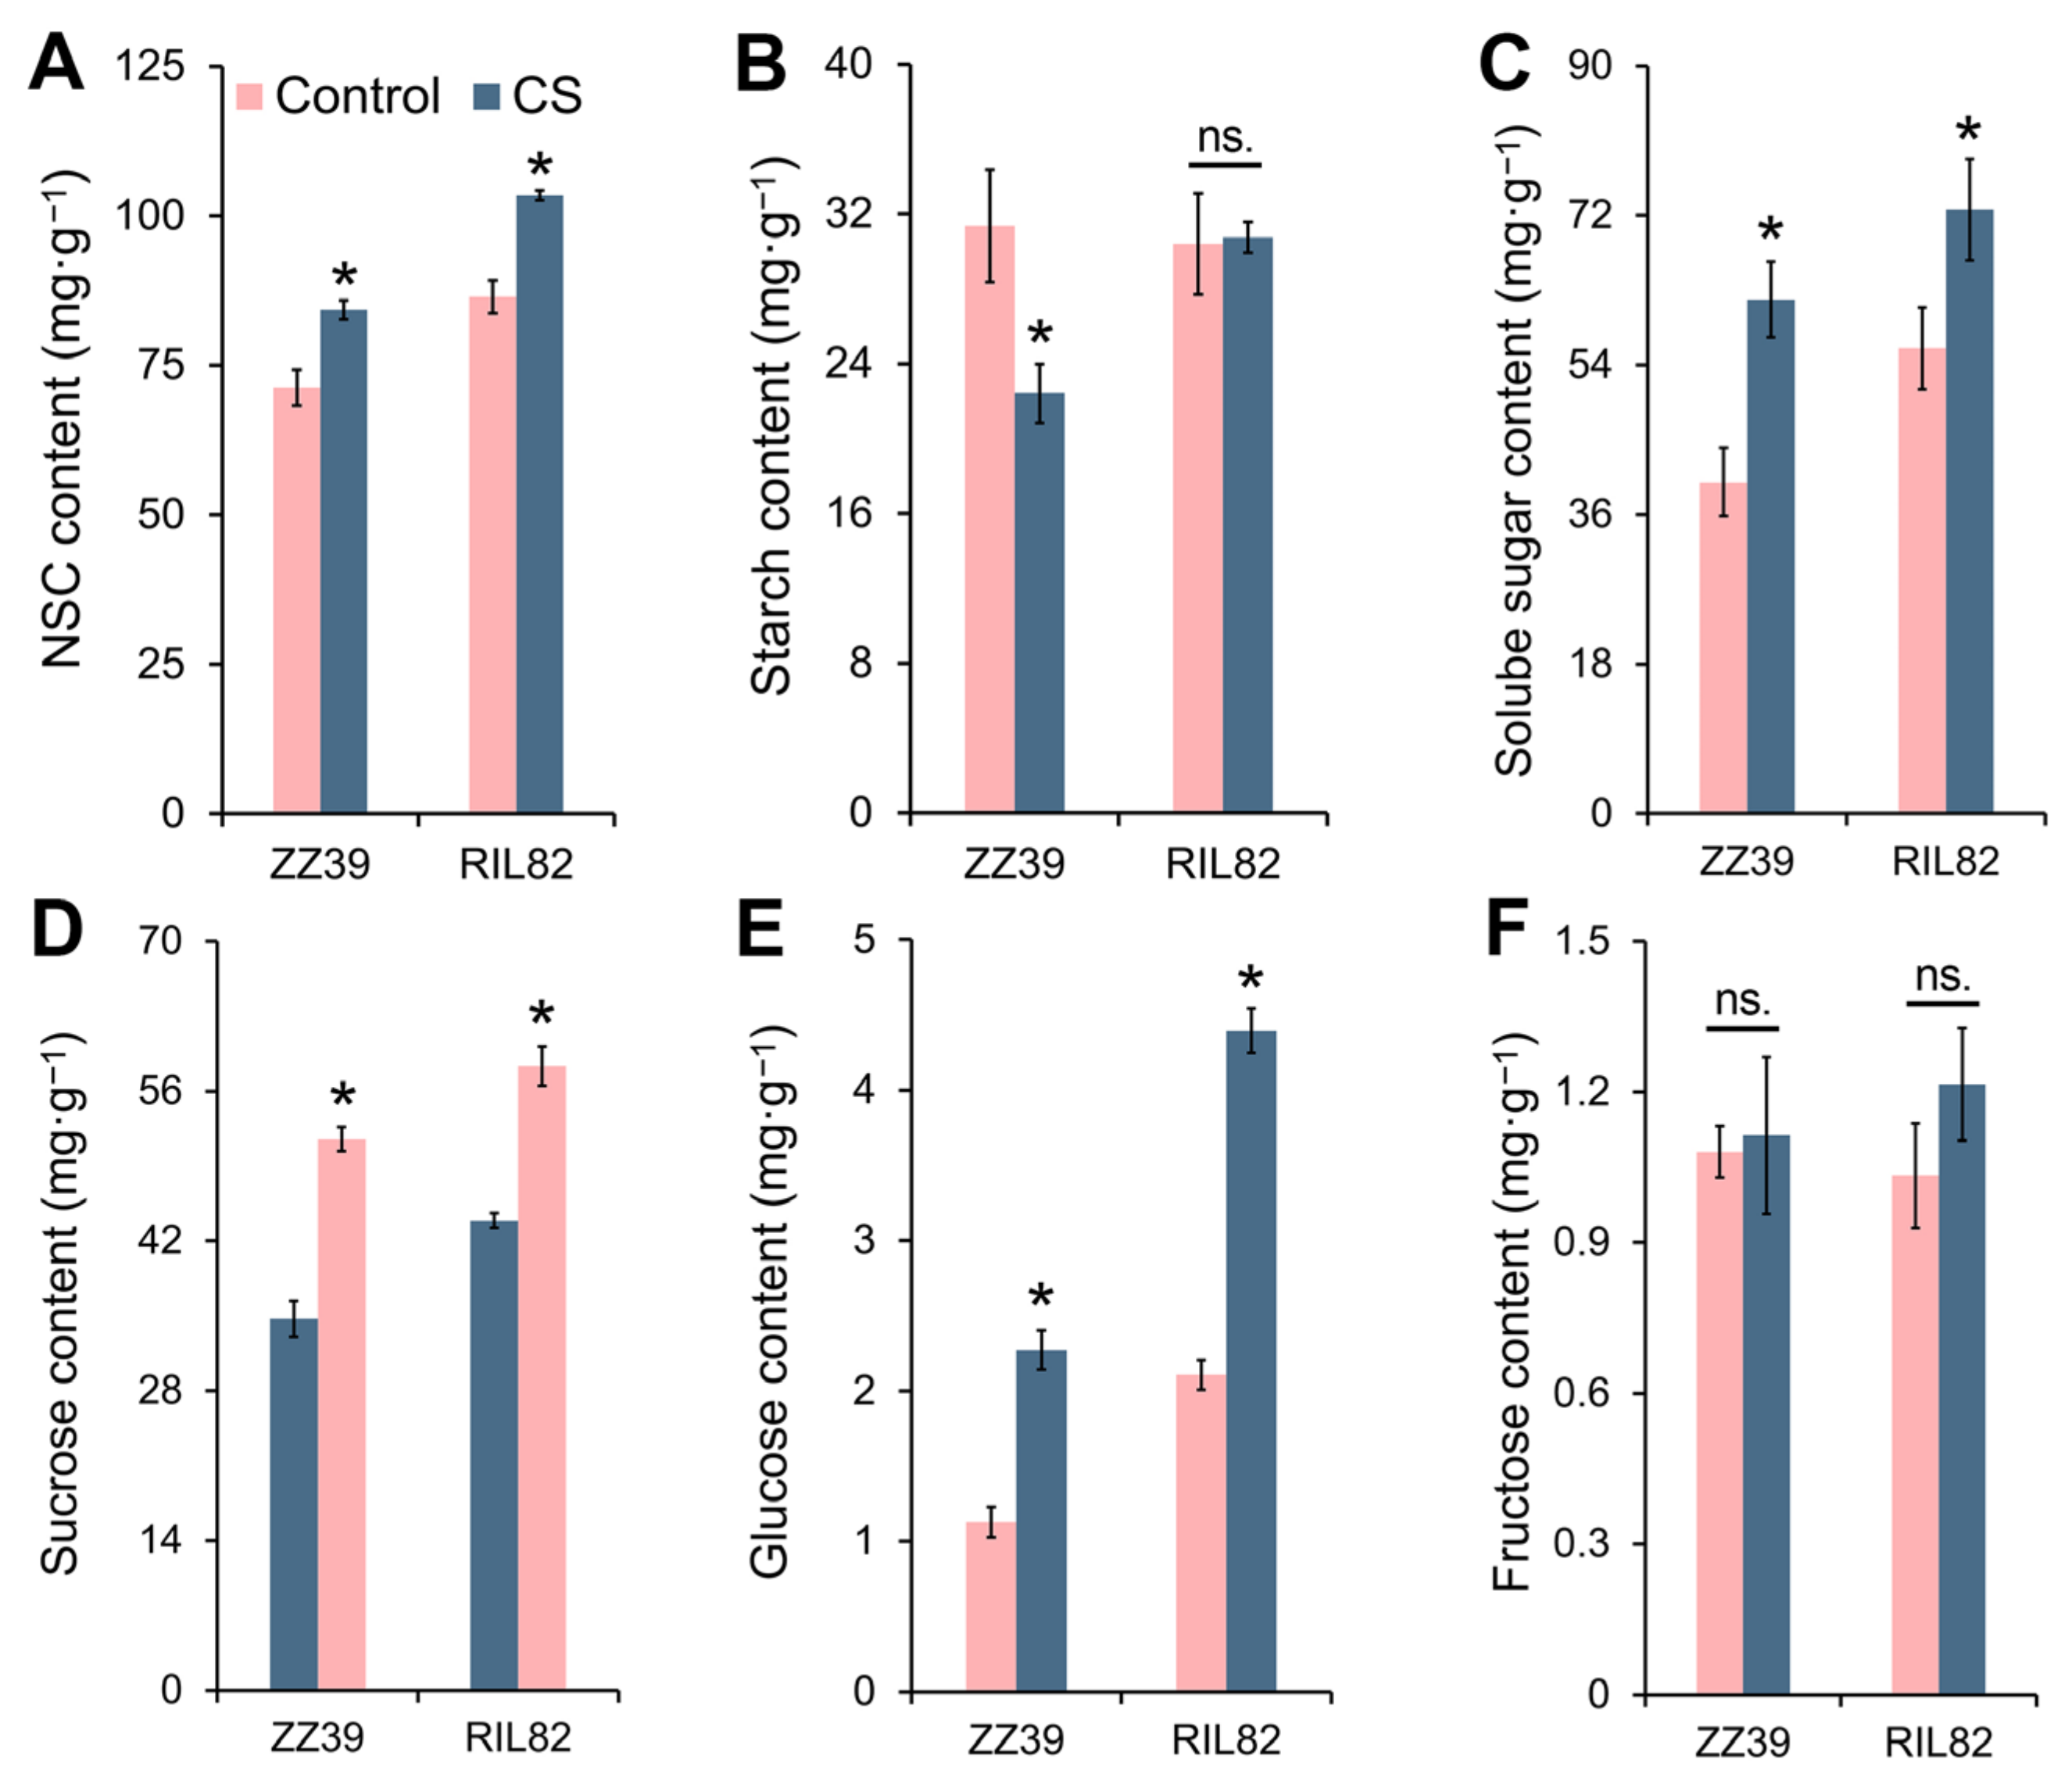
3.4. Effects of Cold Stress on the Carbohydrate Contents of Rice Seedlings

The results of non-structural carbohydrate (NSC) content analysis showed that cold stress led to a substantial increase in both ZZ39 and RIL82 (Figure 6A). In contrast to RIL82, ZZ39 exhibited a significant 28.4% reduction in leaf starch content under cold stress (Figure 6B). In the presence of cold stress, both ZZ39 and RIL82 demonstrated a significant rise in soluble total sugar content, with ZZ39 experiencing a higher increase (55%) compared to RIL82 (29.7%) in comparison to the control (Figure 6C).
Cold stress also led to a notable increase in sucrose content for both ZZ39 and RIL82, with ZZ39 showing a higher increase (16.78%) than RIL82 (14.44%) (Figure 6D). Although glucose content increased significantly in both rice genotypes under cold stress, the increase was more pronounced in RIL82 than in ZZ39. This observation suggests that glucose in ZZ39 is intricately involved in the synthesis and metabolism of ascorbic acid (Figure 6E). Additionally, cold stress induced an increase in fructose content for both ZZ39 and RIL82, with no significant difference observed between the two genotypes (Figure 6F).

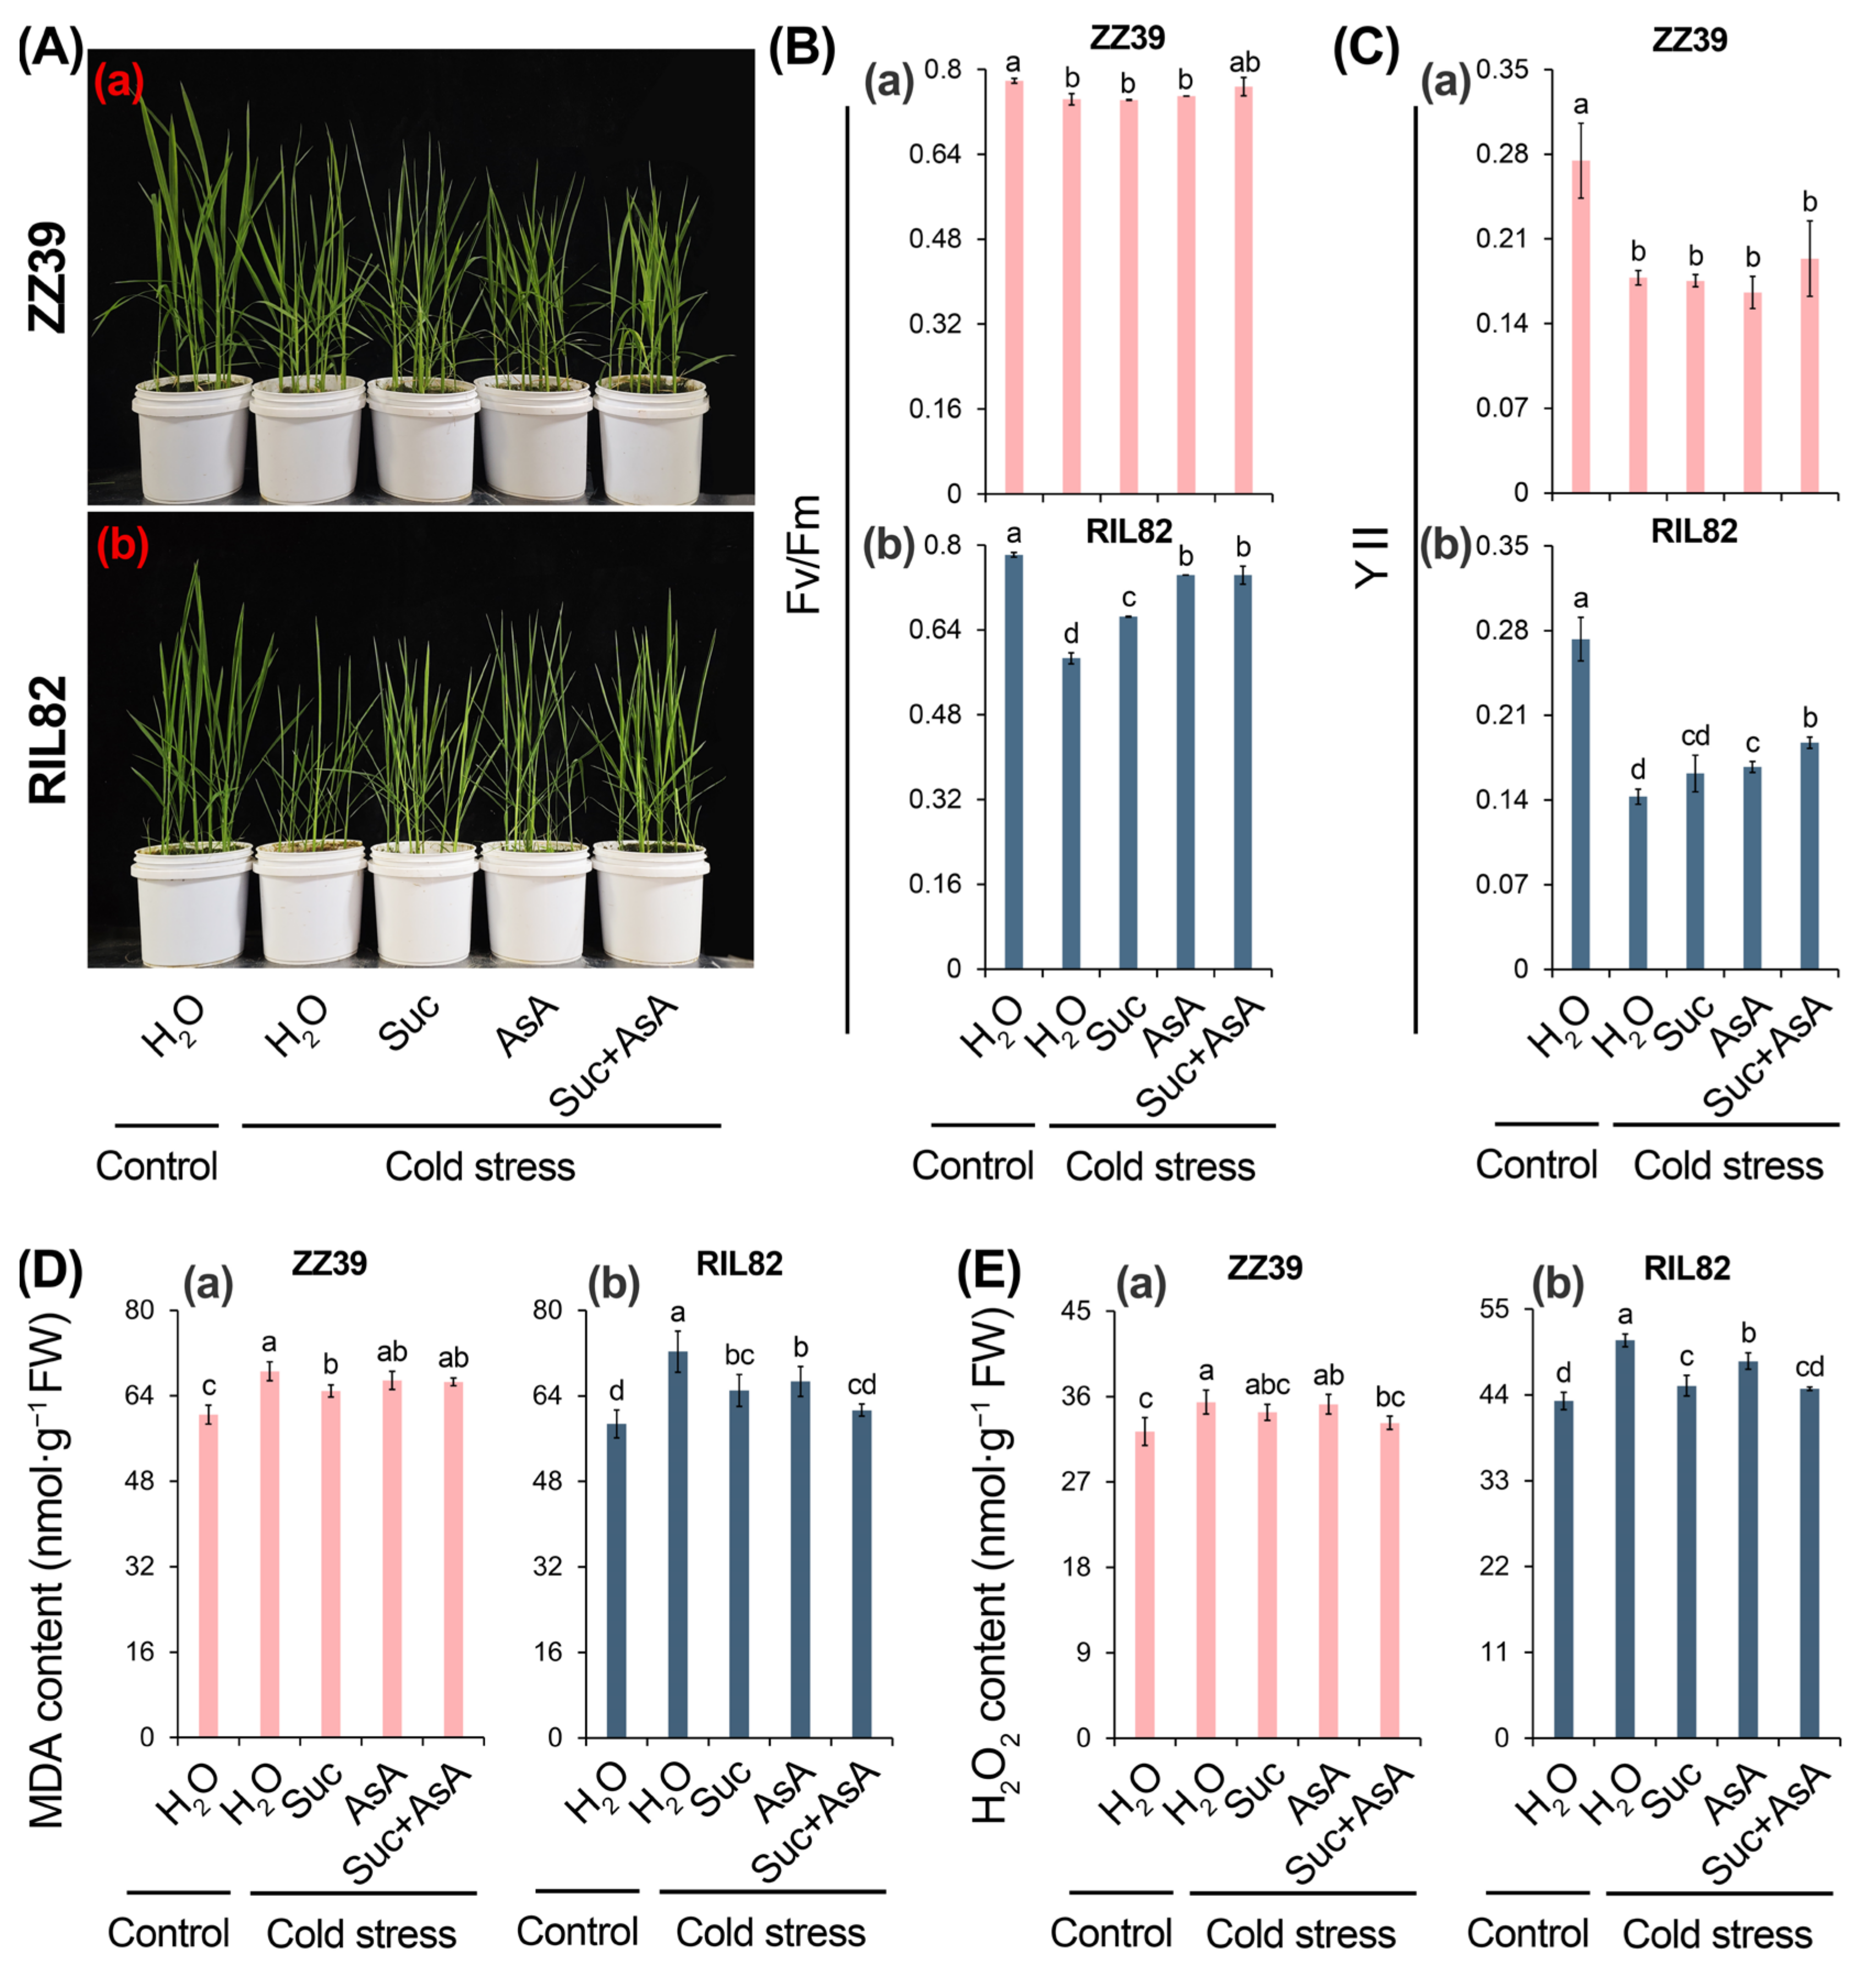
3.5. Effects of Sucrose and Ascorbic Acid Alone and in Combination on Cold Tolerance in Rice Seedlings

The joint analysis of the transcriptome and metabolome highlighted variations in sucrose and ascorbic acid metabolism processes between the two rice genotypes, suggesting a potential influence on the development of cold tolerance. To validate this hypothesis, exogenous spraying experiments involving sucrose, ascorbic acid, and a combination of both were conducted. The results revealed that, under cold stress, compared to the control, exogenous spraying of sucrose (Suc), ascorbic acid (AsA), and sucrose+ascorbic acid (Suc+AsA) mitigated water loss-induced shrinkage from cold injury in ZZ39 and RIL82 leaves (Figure 7A(a,b)).
Cold stress significantly decreased the Fv/Fm of both rice genotypes, particularly RIL82. Exogenous spraying of Suc, AsA, and Suc+AsA significantly increased the value of Fv/Fm for both genotypes, with the combination showing the maximum increase (Figure 7B(a,b)). Regarding actual fluorescence quantum efficiency (YII), it was obviously decreased by cold stress in ZZ39 and RIL82. However, these results could be reversed by Suc, AsA, and Suc+AsA, particularly in RIL82. While YII increased in ZZ39, the difference was not statistically significant (Figure 7C(a,b)).
Under cold stress, exogenous spraying of Suc, AsA, and Suc+AsA decreased the levels of MDA and hydrogen peroxide (H2O2) in both genotypes (Figure 7D,E). In ZZ39, Suc significantly decreased MDA and H2O2 contents, while AsA and Suc+AsA spraying decreased MDA content without significant differences (Figure 7D,E(a)). Notably, the most substantial decrease in MDA and H2O2 in both ZZ39 and RIL82 leaves was observed with Suc+AsA spraying (Figure 7D,E).

4. Discussion

The previous results indicated that the genotypes ZZ39 and RIL82 were exposed to more intense stress damage after enduring 48 h of cold stress at a temperature of 13/10 °C during the day/night. ZZ39 displayed a superior leaf phenotype, lower REC, H2O2, MDA content, and higher Fv/Fm. Following recovery at 28/22 °C, ZZ39 maintained a higher survival rate [18], which was consistent with our study’s findings (Figure 1B–F). Under cold stress, RIL82 leaves experienced dehydration, wrinkling, and curling earlier than ZZ39, and withered and died after low-temperature recovery, with a survival rate of only 48%, while ZZ39 had a survival rate of up to 90% (Figure 1A,B). After 24 h of cold stress, both RIL82 and ZZ39 exhibited significant reductions in leaf Fv/Fm compared to the control. The decrease in Fv/Fm was less pronounced in ZZ39 compared to RIL82. Upon returning to normal temperature, Fv/Fm recovered in ZZ39, while it decreased significantly in RIL82 (Figure 1C). Su et al. (2015) demonstrated that under cold stress, as the temperature gradually decreases, the leaf Fv/Fm of cold-tolerant grape varieties is higher than that of cold-sensitive grape varieties [48], which is consistent with the results of this study. These results suggested that ZZ39 exhibited stronger cold tolerance compared to RIL82.
Cold stress typically leads to alterations in plant metabolic processes, influencing plant cold tolerance. Reactive oxygen species (ROS), such as superoxide anions, H2O2, hydroxyl radicals, singlet oxygen, and redox signals, are crucial for maintaining normal metabolic function in plant cells, regulating stress adaptation processes, and controlling signaling pathways [49,50]. The regulation of ROS and redox signaling in plants necessitates a high degree of coordination and balance within the plant’s cells and metabolic pathways [51,52,53]. Excessive ROS levels can cause cell and tissue damage and significantly impact gene expression regulation under cold conditions [54,55,56]. Previous studies have shown that low-temperature stress induces higher ROS accumulation in cold-sensitive rice varieties [18], which aligns with the results of our study. After 12 h of low-temperature treatment, RIL82 leaves accumulated more H2O2 (Figure 1E). Furthermore, under cold stress, RIL82 also accumulated more MDA in its leaves compared to ZZ39, leading to more severe cell damage in RIL82 (Figure 1F).
Multiple studies have demonstrated that plants have developed two distinct biological processes, enzymatic and non-enzymatic antioxidant reactions, to counteract the excessive formation of ROS under abiotic stress, which consequently impacts plant growth, development, and stress tolerance [39,57,58,59,60,61,62]. Within the antioxidant enzyme system, SOD, POD, CAT, and APX play crucial roles in managing excessive ROS in cells under abiotic stress [63,64]. Research by Islam et al. (2023) indicated that under cold stress, rice plants with the OsLPXC gene knocked out exhibited reduced SOD, POD, CAT, and APX activities, increased electrolyte leakage, elevated ROS and MDA content, and decreased cold tolerance [65]. Similarly, Karami Moalem et al. (2018) found that highly active SOD, CAT, and APX in the cold-tolerant chickpea variety (Sel96Th11439) improved its ability to clear ROS, reducing ROS accumulation and enhancing cold tolerance [66]. Consequently, enhancing antioxidant enzyme activity is vital for effectively clearing ROS accumulation and plays a significant role in plant survival, growth, and development under low-temperature stress. These findings align with our study. Following 12 h of low-temperature stress, the increase in SOD, POD, CAT, and APX in ZZ39 leaves was higher than in RIL82, enhancing ROS clearance (Figure 2).
In addition to enzymatic reactions, non-enzymatic antioxidants play a crucial role in preventing excessive ROS accumulation and facilitating ROS clearance. Among these, AsA, as the most abundant antioxidant in plants, has diverse biological functions [67,68], influencing photosynthesis, cell division, expansion, osmotic regulation, and hormone biosynthesis [20,69,70], thereby impacting plant growth, development, and stress resistance. This study observed inhibited AsA synthesis in RIL82 leaves under cold stress compared to the control, while AsA content significantly increased in ZZ39 leaves (Figure 6B). Prior studies have shown that Arabidopsis thaliana with high levels of ascorbic acid accumulates more biomass in the aboveground parts and exhibits stronger tolerance to various stresses [69], aligning with this study’s results. The L-Galactose pathway and the GDP-D-mannose pathway, catalyzed by GME, are crucial for AsA synthesis, with L-Galactono-1,4-lactone and L-Gulono-1,4-lactone serving as the final synthetic substrates of AsA via GLDH and GULO conversion to L-ascorbate [71,72,73]. GLDH, located on the inner mitochondrial membrane, is a key rate-limiting enzyme in AsA synthesis, closely associated with the mitochondrial respiratory electron transport chain [74,75]. In this study, under cold stress, the expression level of the GLDH-related gene LOC_ Os02g03210 in ZZ39 was upregulated compared with the control, while RIL82 showed downregulation. Additionally, the trend of upregulation or downregulation of other related genes in RIL82 was lower or higher than that of ZZ39, directly leading to the inhibition of AsA synthesis (Figure 5A,B).
Moreover, during AsA catabolism, ascorbic acid oxidase (AA-Ox) breaks down AsA into unstable monodehydroascorbic acid (MDHA), accompanied by ROS production [21,76,77]. For APX, AsA serves as an electron donor, oxidizing APX to produce MDHA and catalyzing the production of H2O from H2O2 [75,76,78]. This study’s results indicate a significant increase in AA-Ox activity in ZZ39 leaves under cold stress compared to the control, while RIL82 leaves exhibited a slight decrease without significant difference (Figure 5A,C). Additionally, prior studies have suggested that increased APX activity in ZZ39 under cold stress may be an important factor in regulating H2O2 content and reducing cell damage compared to RIL82.

5. Conclusions

Transcriptome and metabolome analyses have become increasingly important techniques for studying the mechanisms underlying plant responses to biotic and abiotic stresses. In this study, two genotypes (ZZ39 and its recombinant inbred line RIL82) with contrasting responses to cold stress were utilized to investigate this mechanism. A comprehensive analysis of transcriptome and metabolome data indicated that AsA might be responsible for the difference in ZZ39 and RIL82 under cold stress. AsA levels increased in ZZ39 when exposed to cold stress, while they decreased in RIL82 under the same conditions. Furthermore, carbohydrate content results underscored its significant contribution to responses to cold stress in both genotypes. Notably, the application of exogenous AsA and sucrose, either independently or in combination, indicated their role in enhancing cold tolerance in both genotypes under seedling stage. These results emphasize the potential importance of AsA in alleviating the impact of cold stress on rice seedlings.

Supplementary Materials

The following supporting information can be downloaded at: https://www.mdpi.com/article/10.3390/agronomy14040659/s1, Figure S1: The qRT-PCR for RNA-Seq data certification; Table S1. Primers used for qRT-PCR; Table S2. The list of the DEGs and DEMs.

Author Contributions

Data curation, H.W., T.L. and W.Y.; Formal analysis, T.L., P.Y., J.L. and X.S.; Funding acquisition, T.C., G.F. and B.F.; Investigation, H.W. and W.F.; Project administration, G.F.; Writing—original draft, H.W., T.C. and B.F.; Writing—review and editing, G.F., Z.W. and B.F. All authors have read and agreed to the published version of the manuscript.

Funding

This work was funded by the National Key Research and Development Program of China (2022YFD1500400), “Sannongliufang” Science and Technology Cooperation Project of Zhejiang province (2023SNJF001), and the Zhejiang Provincial Natural Science Foundation, China (LY22C130003, Z23C130001 and Z24C130019).

Data Availability Statement

The original contributions presented in the study are included in the article/Supplementary Materials, further inquiries can be directed to the corresponding author.

Conflicts of Interest

The authors declare no conflicts of interest.

References

  1. Hasanuzzaman, M.; Nahar, K.; Fujit, M. Extreme temperature responses, oxidative stress and antioxidant defense in plants. In Abiotic Stress-Plant Responses and Applications in Agriculture; InTech: London, UK, 2013; pp. 169–205. [Google Scholar] [CrossRef]
  2. Thomashow, M.F. Plant cold acclimation: Freezing tolerance genes and regulatory mechanisms. Annu. Rev. Plant Biol. 1999, 50, 571–599. [Google Scholar] [CrossRef]
  3. Zhou, M.Q.; Shen, C.; Wu, L.H.; Tang, K.X.; Lin, J. CBF-dependent signaling pathway: A key responder to low temperature stress in plants. Crit. Rev. Biotechnol. 2011, 31, 186–192. [Google Scholar] [CrossRef]
  4. Shi, Y.Y.; Guo, E.J.; Cheng, X.; Wang, L.Z.; Jiang, S.K.; Yang, X.L.; Ma, H.Y.; Zhang, T.Y.; Li, T.; Yang, X.G. Effects of chilling at different growth stages on rice photosynthesis, plant growth, and yield. Environ. Exp. Bot. 2022, 203, 105045. [Google Scholar] [CrossRef]
  5. Guo, E.J.; Wang, L.Z.; Jiang, S.K.; Xiang, H.T.; Shi, Y.Y.; Chen, X.; Wang, X.Y.; Zhang, T.Y.; Wang, L.M.; Feng, Y.J.; et al. Impacts of chilling at the tillering phases on rice growth and grain yield in Northeast China. J. Agron. Crop Sci. 2022, 208, 510–522. [Google Scholar] [CrossRef]
  6. Zhang, T.Y.; Guo, E.J.; Shi, Y.Y.; Cheng, X.; Zhu, X.; Dong, X.; Li, T.; Wang, L.Z.; Jiang, S.K.; Xiang, H.T.; et al. Modelling the advancement of chilling tolerance breeding in Northeast China. J. Agron. Crop Sci. 2021, 6, 984–994. [Google Scholar] [CrossRef]
  7. Andaya, V.C.; Tai, T.H. Fine mapping of the qCTS4 locus associated with seedling cold tolerance in rice (Oryza sativa L.). Mol. Breeding 2007, 20, 349–358. [Google Scholar] [CrossRef]
  8. Lou, Q.; Chen, L.; Sun, Z.; Xing, Y.Z.; Li, J.; Xu, X.Y.; Mei, H.W.; Luo, L.J. A major QTL associated with cold tolerance at seedling stage in rice (Oryza sativa L.). Euphytica 2007, 158, 87–94. [Google Scholar] [CrossRef]
  9. Lu, X.; Zhou, Y.; Fan, F.; Peng, J.; Zhang, J. Coordination of light, circadian clock with temperature: The potential mechanisms regulating chilling tolerance in rice. J. Integr. Plant Biol. 2020, 62, 737–760. [Google Scholar] [CrossRef]
  10. Fairhurst, T.H.; Dobermann, A. Rice in the global food supply. Better Crops Int. 2002, 16, 3–6. [Google Scholar]
  11. Ding, Y.; Yang, S. Surviving and thriving: How plants perceive and respond to temperature stress. Dev. Cell 2022, 57, 947–958. [Google Scholar] [CrossRef]
  12. Soualiou, S.; Duan, F.Y.; Li, X.; Zhou, W.B. Crop production under cold stress: An understanding of plant responses, acclimation processes, and management strategies. Plant Physiol. Biochem. 2022, 190, 47–61. [Google Scholar] [CrossRef]
  13. Kovach, M.J.; Sweeney, M.T.; McCouch, S.R. New insights into the history of rice domestication. Trends Genet. 2007, 23, 578–587. [Google Scholar] [CrossRef]
  14. Gross, B.L.; Zhao, Z. Archaeological and genetic insights into the origins of domesticated rice. Proc. Natl. Acad. Sci. USA 2014, 111, 6190–6197. [Google Scholar] [CrossRef]
  15. Zhang, Z.; Wang, P.; Chen, Y.; Song, X.; Wei, X.; Shi, P.J. Global warming over 1960–2009 did increase heat stress and reduce cold stress in the major rice-planting areas across China. Eur. J. Agron. 2014, 59, 49–56. [Google Scholar] [CrossRef]
  16. Baier, M.; Bittner, A.; Prescher, A.; van Buer, J. Preparing plants for improved cold tolerance by priming. Plant Cell Environ. 2019, 42, 782–800. [Google Scholar] [CrossRef] [PubMed]
  17. Li, J.; Zhang, Z.; Chong, K.; Xu, Y. Chilling tolerance in rice: Past and present. J. Plant Physiol. 2022, 268, 153576. [Google Scholar] [CrossRef] [PubMed]
  18. Yu, P.H.; Jiang, N.; Fu, W.M.; Zheng, G.J.; Li, G.Y.; Feng, B.H.; Chen, T.T.; Ma, J.Y.; Li, H.B.; Tao, L.X.; et al. ATP hydrolysis determines cold tolerance by regulating available energy for glutathione synthesis in rice seedling plants. Rice 2020, 13, 23. [Google Scholar] [CrossRef] [PubMed]
  19. Zhao, X.; Feng, B.H.; Chen, T.T.; Zhang, C.X.; Tao, L.X.; Fu, G.F. Transcriptome analysis of pale-green leaf reveals photosynthetic regulatory pathways. Acta Physiol. Plant. 2017, 39, 274. [Google Scholar] [CrossRef]
  20. Zheng, S.; Su, M.; Wang, L.; Zhang, T.G.; Wang, J.; Xie, H.C.; Wu, X.X.; Haq, S.I.U.; Qiu, Q.S. Small signaling molecules in plant response to cold stress. J. Plant Physiol. 2021, 266, 153534. [Google Scholar] [CrossRef] [PubMed]
  21. Uemura, M.; Tominaga, Y.; Nakagawara, C.; Shigematsu, S.; Minami, A.; Kawamura, Y. Responses of the plasma membrane to low temperatures. Physiol. Plant. 2006, 126, 81–89. [Google Scholar] [CrossRef]
  22. Steponkus, P.L. Role of the plasma membrane in freezing injury and cold acclimation. Ann. Rev. Plant Physiol. 1984, 35, 543–584. [Google Scholar] [CrossRef]
  23. Smirnoff, N. BOTANICAL BRIEFING: The function and metabolism of ascorbic acid in plants. Ann. Bot. 1996, 78, 661–669. [Google Scholar] [CrossRef]
  24. Gallie, D.R. The role of L-ascorbic acid recycling in responding to environmental stress and in promoting plant growth. J. Exp. Bot. 2013, 64, 433–443. [Google Scholar] [CrossRef]
  25. Ajila Celi, G.E.; Gratão, P.L.; Lanza, M.G.D.B.; Reis, A.R.D. Physiological and biochemical roles of ascorbic acid on mitigation of abiotic stresses in plants. Plant Physiol. Biochem. 2023, 202, 107970. [Google Scholar] [CrossRef]
  26. Akram, N.A.; Shafiq, F.; Ashraf, M. Ascorbic acid-a potential oxidant scavenger and its role in plant development and abiotic stress tolerance. Front. Plant Sci. 2017, 8, 613. [Google Scholar] [CrossRef] [PubMed]
  27. Barth, C.; De Tullio, M.; Conklin, P.L. The role of ascorbic acid in the control of flowering time and the onset of senescence. J. Exp. Bot. 2006, 57, 1657–1665. [Google Scholar] [CrossRef]
  28. Liao, G.L.; Xu, Q.; Allan, A.C.; Xu, X.B. L-Ascorbic acid metabolism and regulation in fruit crops. Plant Physiol. 2023, 192, 1684–1695. [Google Scholar] [CrossRef]
  29. Feng, B.H.; Li, G.Y.; Islam, M.; Fu, W.M.; Zhou, Y.Q.; Chen, T.T.; Tao, L.X.; Fu, G.F. Strengthened antioxidant capacity improves photosynthesis by regulating stomatal aperture and ribulose-1,5-bisphosphate carboxylase/oxygenase activity. Plant Sci. 2020, 290, 110245. [Google Scholar] [CrossRef]
  30. Kotchoni, S.O.; Larrimore, K.E.; Mukherjee, M.; Kempinski, C.F.; Barth, C. Alterations in the endogenous ascorbic acid content affect flowering time in Arabidopsis. Plant Physiol. 2009, 149, 803–815. [Google Scholar] [CrossRef]
  31. Majzoobi, M.; Beparva, P.; Farahnaky, A.; Badii, F. Physicochemical properties of cross-linked wheat starch affected by L-ascorbic acid. J. Agric. Sci. Technol. 2014, 16, 355–364. [Google Scholar]
  32. Gęgotek, A.; Skrzydlewska, E. Chapter nine—Ascorbic acid as antioxidant. Vitam. Horm. 2023, 121, 247–270. [Google Scholar] [CrossRef]
  33. Gill, S.S.; Tuteja, N. Reactive oxygen species and antioxidant machinery in abiotic stress tolerance in crop plants. Plant Physiol. Biochem. 2010, 48, 909–930. [Google Scholar] [CrossRef]
  34. Alhasnawi, A.N.; Kadhimi, A.A.; Isahak, A.; Mohamad, A.; Yusoff, W.M.W.; Zain, C.R.C.M. Exogenous application of ascorbic acid ameliorates detrimental effects of salt stress in rice (MRQ74 and MR269) seedlings. Asian J. Crop Sci. 2015, 7, 186–196. [Google Scholar] [CrossRef]
  35. Liu, T.; Hu, X.; Zhang, J. H2O2 mediates ALA-induced glutathione and ascorbate accumulation in the perception and resistance to oxidative stress in Solanum lycopersicum at low temperatures. BMC Plant Biol. 2018, 18, 34. [Google Scholar] [CrossRef]
  36. Monajjem, S.; Soltani, E.; Zainali, E.; Esfahani, M.; Ghaderi-Far, F.; Chaleshtori, M.H.; Rezaei, A. Seed priming improves enzymatic and biochemical performances of rice during seed germination under low and high temperatures. Rice Sci. 2023, 30, 335–347. [Google Scholar] [CrossRef]
  37. Hatsugai, N.; Katagiri, F. Quantification of plant cell death by electrolyte leakage assay. Bio. Protoc. 2018, 8, e2758. [Google Scholar] [CrossRef]
  38. Brennan, T.; Frenkel, C. Involvement of hydrogen peroxide in the regulation of senescence in pear. Plant Physiol. 1977, 59, 411–416. [Google Scholar] [CrossRef] [PubMed]
  39. Chen, T.Z.; Zhang, B.L. Measurements of proline and malondialdehyde content and antioxidant enzyme activities in leaves of drought stressed cotton. Bio. Protoc. 2016, 6, e1913. [Google Scholar] [CrossRef]
  40. Giannopolitis, C.N.; Ries, S.K. Superoxide dismutases: I. occurrence in higher plants. Plant Physiol. 1977, 59, 309–314. [Google Scholar] [CrossRef] [PubMed]
  41. Maehly, A.C. The assay of catalases and peroxidases. Methods Biochem. Anal. 1954, 1, 357–424. [Google Scholar] [CrossRef]
  42. Bonnecarrère, V.; Borsani, O.; Díaz, P.; Capdevielle, F.; Blanco, P.; Monza, J. Response to photoxidative stress induced by cold in japonica rice is genotype dependent. Plant Sci. 2011, 180, 726–732. [Google Scholar] [CrossRef]
  43. Dubois, M.; Gilles, K.; Hamilton, J.; Rebers, P.; Smith, F. Colorimetric method for determination of sugars and related substances. Anal. Chem. 1956, 28, 350–356. [Google Scholar] [CrossRef]
  44. Zhang, C.X.; Feng, B.H.; Chen, T.T.; Fu, W.M.; Li, H.B.; Li, G.Y.; Jin, Q.Y.; Tao, L.X.; Fu, G.F. Heat stress-reduced kernel weight in rice at anthesis is associated with impaired source-sink relationship and sugars allocation. Environ. Exp. Bot. 2018, 155, 718–733. [Google Scholar] [CrossRef]
  45. Feng, B.H.; Yang, Y.; Shi, Y.F.; Shen, H.C.; Wang, H.M.; Huang, Q.N.; Xu, X.; Lü, X.G.; Wu, J.L. Characterization and genetic analysis of a novel rice spotted-leaf mutant HM47 with broad-spectrum resistance to Xanthomonas oryzae pv. oryzae. J. Integr. Plant Biol. 2013, 55, 473–483. [Google Scholar] [CrossRef] [PubMed]
  46. Robinson, M.D.; McCarthy, D.J.; Smyth, G.K. edgeR: A Bioconductor package for differential expression analysis of digital gene expression data. Bioinformatics 2010, 26, 139–140. [Google Scholar] [CrossRef]
  47. Yu, Z.G.; Qiao, L.Y. Study on the relationship between the activity of ascorbate oxidase and disease resistance in wheat. Hubei Agric. Sci. 2003, 1, 31–33. Available online: http://www.cqvip.com/qk/93129x/200301/7365556.html (accessed on 12 January 2024).
  48. Su, L.Y.; Dai, Z.W.; Li, S.H.; Xin, H.P. A novel system for evaluating drought–cold tolerance of grapevines using chlorophyll fluorescence. BMC Plant Biol. 2015, 15, 82. [Google Scholar] [CrossRef]
  49. Mittler, R.; Zandalinas, S.I.; Fichman, Y.; Breusegem, F.V. Reactive oxygen species signalling in plant stress responses. Nat. Rev. Mol. Cell Biol. 2022, 23, 663–679. [Google Scholar] [CrossRef]
  50. Suzuki, N.; Koussevitzky, S.; Mittler, R.; Miller, G. ROS and redox signalling in the response of plants to abiotic stress. Plant Cell Environ. 2012, 35, 259–270. [Google Scholar] [CrossRef]
  51. Baxter, A.; Mittler, R.; Suzuki, N. ROS as key players in plant stress signalling. J. Exp. Bot. 2014, 65, 1229–1240. [Google Scholar] [CrossRef]
  52. Mittler, R. ROS Are Good. Trends Plant Sci. 2017, 22, 11–19. [Google Scholar] [CrossRef]
  53. Waszczak, C.; Carmody, M.; Kangasjarvi, J. Reactive oxygen species in plant signaling. Annu. Rev. Plant Biol. 2018, 69, 209–236. [Google Scholar] [CrossRef]
  54. Chinnusamy, V.; Zhu, J.H.; Zhu, J.K. Cold stress regulation of gene expression in plants. Trends Plant Sci. 2007, 12, 444–451. [Google Scholar] [CrossRef] [PubMed]
  55. Dreyer, A.; Dietz, K.J. Reactive oxygen species and the redox-regulatory network in cold stress acclimation. Antioxidants 2018, 7, 169. [Google Scholar] [CrossRef]
  56. Zhang, H.M.; Zhu, J.H.; Gong, Z.Z.; Zhu, J.K. Abiotic stress responses in plants. Nat. Rev. Genet. 2022, 23, 104–119. [Google Scholar] [CrossRef]
  57. Apel, K.; Hirt, H. Reactive oxygen species: Metabolism, oxidative stress, and signal transduction. Annu. Rev. Plant Biol. 2004, 55, 373–399. [Google Scholar] [CrossRef]
  58. Choudhury, F.K.; Rivero, R.M.; Blumwald, E.; Mittler, R. Reactive oxygen species, abiotic stress and stress combination. Plant J. 2017, 5, 856–867. [Google Scholar] [CrossRef]
  59. Gusain, S.; Joshi, S.; Joshi, R. Sensing, signalling, and regulatory mechanism of cold-stress tolerance in plants. Plant Physiol. Biochem. 2023, 197, 107646. [Google Scholar] [CrossRef]
  60. Leisner, C.P.; Potnis, N.; Sanz-Saez, A. Crosstalk and trade-offs: Plant responses to climate change-associated abiotic and biotic stresses. Plant Cell Environ. 2023, 46, 2946–2963. [Google Scholar] [CrossRef] [PubMed]
  61. Nakabayashi, R.; Saito, K. Integrated metabolomics for abiotic stress responses in plants. Curr. Opin. Plant Biol. 2015, 24, 10–16. [Google Scholar] [CrossRef] [PubMed]
  62. Zhang, J.Y.; Li, X.M.; Lin, H.X.; Chong, K. Crop improvement through temperature resilience. Annu. Rev. Plant Biol. 2019, 70, 753–780. [Google Scholar] [CrossRef]
  63. Huang, X.; Wu, Y.Q.; Zhang, S.S.; Yang, H.; Wu, W.L.; Lyu, L.F.; Li, W.L. Changes in antioxidant substances and antioxidant enzyme activities in raspberry fruits at different developmental stages. Sci. Hortic. 2023, 321, 12314. [Google Scholar] [CrossRef]
  64. Martin, R.E.; Postiglione, A.E.; Muday, G.K. Reactive oxygen species function as signaling molecules in controlling plant development and hormonal responses. Curr. Opin. Plant. Biol. 2022, 69, 102293. [Google Scholar] [CrossRef] [PubMed]
  65. Islam, F.; Khan, M.S.S.; Ahmed, S.; Abdullah, M.; Hannan, F.; Chen, J. OsLPXC negatively regulates tolerance to cold stress via modulating oxidative stress, antioxidant defense and JA accumulation in rice. Free Radic. Biol. Med. 2023, 199, 2–16. [Google Scholar] [CrossRef] [PubMed]
  66. Karami-Moalem, S.; Maali-Amiri, R.; Kazemi-Shahandashti, S.-S. Effect of cold stress on oxidative damage and mitochondrial respiratory properties in chickpea. Plant Physiol. Biochem. 2018, 122, 31–39. [Google Scholar] [CrossRef] [PubMed]
  67. Smirnoff, N. Ascorbic acid: Metabolism and functions of a multi-facetted molecule. Curr. Opin. Plant Biol. 2000, 3, 229–235. [Google Scholar] [CrossRef]
  68. Macknight, R.C.; Laing, W.A.; Bulley, S.M.; Broad, R.C.; Johnson, A.A.; Hellens, R.P. Increasing ascorbate levels in crops to enhance human nutrition and plant abiotic stress tolerance. Curr. Opin. Biotechnol. 2017, 44, 153–160. [Google Scholar] [CrossRef] [PubMed]
  69. Acosta-Gamboa, L.M.; Liu, S.X.; Jarrod, W.C.; Zachary, C.C.; Raquel, T.; Jessica, P.Y.; Argelia, L. Characterization of the response to abiotic stresses of high ascorbate Arabidopsis lines using phenomic approaches. Plant Physiol. Biochem. 2020, 151, 500–515. [Google Scholar] [CrossRef]
  70. Aboobucker, S.I.; Lorence, A. Recent progress on the characterization of aldonolactone oxidoreductases. Plant Physiol. Biochem. 2016, 98, 171–185. [Google Scholar] [CrossRef]
  71. Pignocchi, C.; Foyer, C.H. Apoplastic ascorbate metabolism and its role in the regulation of cell signalling. Curr. Opin. Plant Biol. 2003, 6, 379–389. [Google Scholar] [CrossRef]
  72. Wheeler, G.; Jones, M.; Smirnoff, N. The biosynthetic pathway of vitamin C in higher plants. Nature 1998, 393, 365–369. [Google Scholar] [CrossRef]
  73. Baig, M.M.; Kelly, S.; Loewus, F. L-ascorbic acid biosynthesis in higher plants from L-Gulono-1,4-lactone and L-Galactono-1, 4-lactone. Plant Physiol. 1970, 46, 277–280. [Google Scholar] [CrossRef]
  74. Bartoli, C.G.; Pastori, G.M.; Foyer, C.H. Ascorbate biosynthesis in mitochondria is linked to the electron transport chain between complexes III and IV. Plant Physiol. 2000, 123, 335–343. [Google Scholar] [CrossRef] [PubMed]
  75. Schertl, P.; Sunderhaus, S.; Klodmann, J.; Grozeff, G.E.G.; Bartoli, C.G.; Braun, H.P. L-galactono-1,4-lactone dehydrogenase (GLDH) forms part of three subcomplexes of mitochondrial complex I in Arabidopsis thaliana. J. Biol. Chem. 2012, 287, 14412–14419. [Google Scholar] [CrossRef] [PubMed]
  76. Munne-Bosch, S.; Queval, G.; Foyer, C.H. The impact of global change factors on redox signaling underpinning stress tolerance. Plant Physiol. 2013, 161, 5–19. [Google Scholar] [CrossRef] [PubMed]
  77. Venkatesh, J.; Park, S.W. Role of L-ascorbate in alleviating abiotic stresses in crop plants. Bot. Stud. 2014, 55, 38. [Google Scholar] [CrossRef] [PubMed]
  78. Foyer, C.H.; Kyndt, T.; Hancock, R.D. Vitamin C in plants: Novel concepts, new perspectives, and outstanding issues. Antioxid. Redox Signal 2020, 32, 463–485. [Google Scholar] [CrossRef]
Figure 1. Response of rice plants to cold stress. (A) Morphological changes to ZZ39 and RIL82 plants during cold stress and recovery after cold stress. (a,b,g,h) Morphological changes to ZZ39 and RIL82 plants during 12–24 h of cold stress. (cf,il) Morphological changes to ZZ39 and RIL82 plants during the recovery process after cold stress at 36 h, 48 h, 132 h, and 168 h. (B) Plant survival rate of ZZ39 and RIL82 168 h during recovery following cold stress. (C) Changes in Fv/Fm (maximum quantum efficiency of PSII photochemistry) of fully expanded leaves of ZZ39 and RIL82 during cold stress and recovery. (D) Measurement of REC (relative electrolyte leakage) in fully expanded leaves of ZZ39 and RIL82 24 h after cold stress. (E) Measurement of H2O2 (hydrogen peroxide) content in leaves of ZZ39 and RIL82 12 h after cold stress. (F) Measurement of malondialdehyde (MDA) content in leaves of ZZ39 and RIL82. Vertical black lines represent standard deviation. The t-test was used to analyze differences between different treatments within ZZ39 and RIL82 groups. (*) indicates significant differences at p < 0.05. “ns.” indicates no significant differences at p < 0.05.
Agronomy 14 00659 g001
Figure 2. Effect of cold stress on antioxidant enzyme activity in rice plant leaves. (A) Measurement of superoxide dismutase (SOD) activity in leaves of ZZ39 and RIL82 12 h after cold stress. (B) Measurement of peroxidase (POD) activity. (C) Measurement of catalase (CAT) activity. (D) Measurement of ascorbate peroxidase (APX) activity. Vertical black lines in the figure represent standard deviation, and the t-test was used to analyze differences between different treatments within the ZZ39 and RIL82 groups. “*” indicates significant differences at p < 0.05, “ns.” indicates no significant differences at p < 0.05.
Agronomy 14 00659 g002
Figure 3. Integrated transcriptomic and metabolomic profiling of ZZ39 and RIL82 under normal and cold stress conditions. (A) represents the quantity of KEGG (Kyoto Encyclopedia of Genes and Genomes) pathways associated with differentially expressed genes and metabolites in both rice genotypes following cold stress treatment. The pathways in which these genes and metabolites are concurrently involved are also depicted. The green circles indicate the pathways associated with differentially expressed genes as observed in transcriptomic studies, whereas the blue circles correspond to the pathways with differentially expressed metabolites identified through metabolomic analysis. The intersecting area of the circles illustrates the number of metabolic pathways that both genotypes share. (B) details the top 20 most significantly differentiated genes and metabolites in the KEGG pathways of ZZ39 and RIL82 leaves post cold stress. It presents the levels of significance for the enrichment of these differentially expressed genes (DEGs) and differentially expressed metabolites (DEMs) in KEGG pathways after exposure to cold stress in both ZZ39 and RIL82. (C) focuses on the carbohydrate metabolism pathways in ZZ39 and RIL82 during cold stress, highlighting the number of involved differential genes and metabolites.
Agronomy 14 00659 g003
Figure 4. Integrated transcriptomic and metabolomic analysis of gene and metabolite differences in ZZ39 and RIL82 under cold stress. (A,C) Enrichment of KEGG (Kyoto Encyclopedia of Genes and Genomes) pathways with upregulated DEGs in the carbohydrate metabolism pathway. (B,D) Enrichment of KEGG pathways with downregulated DEGs in the carbohydrate metabolism pathway. (E,F) Expression of DEGs (log2(fold change), p < 0.05) in the two rice genotypes, ZZ39 and RIL82, within four major carbohydrate metabolism pathways.
Agronomy 14 00659 g004
Figure 5. Integrated transcriptomic and metabolomic analysis of the carbohydrate KEGG pathway and ascorbic acid metabolism under cold stress. (A) Pathway diagrams with solid/dashed black arrows represent direct or indirect metabolic products, respectively. Additionally, the silver-gray dashed arrows indicate metabolites that are products of the amino sugar and nucleotide sugar metabolism pathway, which do not share a direct metabolic relationship. In the diagram, heatmaps without black borders show the expression levels of differentially expressed genes (DEGs) (log2(fold change), p < 0.05) between the two rice genotypes under cold stress, whereas heatmaps with black borders represent levels of differentially expressed metabolites (DEMs) (fold change, p < 0.05). The left side of each heatmap corresponds to ZZ39CS/ZZ39CON, and the right side corresponds to RIL82CS/RIL82CON. DEGs and DEMs are indicated by the scale on the left. (B) Changes in ascorbic acid (AsA) content in the leaves of the two rice genotypes under cold stress. (C) Variations in ascorbate oxidase (AA-Ox) activity in the leaves of the two rice genotypes under cold stress. The asterisks (*) on the bars in figures (B,C) denote significant differences at p < 0.05, “ns.” indicates no significant differences at p < 0.05.
Agronomy 14 00659 g005
Figure 6. Impact of cold stress on the content of non-structural carbohydrates in rice. (A) Changes in non-structural carbohydrate content in ZZ39 and RIL82 under cold stress. (B) Changes in starch content in ZZ39 and RIL82 under cold stress. (C) Changes in total soluble sugars in ZZ39 and RIL82 under cold stress. (D) Changes in sucrose content in ZZ39 and RIL82 under cold stress. (E) Changes in glucose content in ZZ39 and RIL82 under cold stress. (F) Changes in fructose content in ZZ39 and RIL82 under cold stress. In the figure, an asterisk (*) denotes a significant difference between the two rice genotypes at p < 0.05, while “ns.” indicates no significant difference between the samples at p < 0.05.
Agronomy 14 00659 g006
Figure 7. Effects of exogenous sucrose and ascorbic acid (AsA) spraying on plant morphology and physiology under cold stress. (A) Influence of exogenous sucrose and AsA spraying on the morphology of ZZ39 and RIL82 plants under cold stress. (B) Impact of exogenous sucrose and AsA on the maximum quantum efficiency of PSII photochemistry (Fv/Fm) in ZZ39 and RIL82 leaves under cold stress. (C) Effect of exogenous sucrose and AsA on the actual quantum efficiency of PSII photochemistry (YII) in ZZ39 and RIL82 leaves under cold stress. (D) Influences of exogenous sucrose and AsA spraying on the content of malondialdehyde (MDA) in leaves of ZZ39 and RIL82 under cold stress. (E) Effects of exogenous sucrose and AsA on hydrogen peroxide (H2O2) content in leaves of ZZ39 and RIL82 under cold stress. All (a) in the figure represent ZZ39 and all (b) represent RIL82.
Agronomy 14 00659 g007
Disclaimer/Publisher’s Note: The statements, opinions and data contained in all publications are solely those of the individual author(s) and contributor(s) and not of MDPI and/or the editor(s). MDPI and/or the editor(s) disclaim responsibility for any injury to people or property resulting from any ideas, methods, instructions or products referred to in the content.

