Article

The Early Effects of an Agrivoltaic System within a Different Crop Cultivation on Soil Quality in Dry–Hot Valley Eco-Fragile Areas

1
China Institute of Water Resources and Hydropower Research, Beijing 100038, China
2
National Research Center for Sustainable Hydropower Development, Beijing 100038, China
3
SPIC Yunnan International Power Investment Co., Ltd., Kunming 650228, China
4
College of Water Resources Science and Engineering, Taiyuan University of Technology, Taiyuan 030024, China
*
Author to whom correspondence should be addressed.
Agronomy 2024, 14(3), 584; https://doi.org/10.3390/agronomy14030584
Submission received: 5 January 2024 / Revised: 9 March 2024 / Accepted: 13 March 2024 / Published: 14 March 2024
(This article belongs to the Section Farming Sustainability)

Abstract

:
The co-allocation of photovoltaic arrays with crops presents a promising strategy to mitigate the conflict between photovoltaics and agricultural land. However, there is a notable lack of quantitative research on the impact of agrivoltaic system on land quality in fragile areas. In this study, peanuts (Arachis hypogaea) and ryegrass (Lolium perenne) were cultivated in photovoltaic array in the dry–hot valley of southwest China, with an off-site native land serving as the control. Sixteen soil physicochemical and biochemical parameters were measured in the gap and under-panel and control area. Results demonstrated that the agrivoltaic system significantly enhanced soil moisture, organic carbon, nitrogen–phosphorus–potassium nutrients, microbial biomass, and urease activity. It also led to varying degrees of increase in soil pH and electrical conductivity, along with reduced soil sucrase and phosphatase activity. In comparison to the control, the agrivoltaic system notably improved soil quality and multifunctionality. Specially, gap cultivation had a more pronounced positive impact on soil quality than under-panel cultivation, and the cultivation of peanuts had a greater effect on soil quality and multifunctionality improvement than ryegrass. This study provides fundamental data to support the improvement of land quality in photovoltaic developed regions, and to alleviate the conflict between photovoltaics and agricultural land.

1. Introduction

In 2022, the global newly installed capacity of the photovoltaic (PV) market reached 230 GW, representing a 35.3% increase compared to 2021 and setting a new historical record for newly installed capacity. It is estimated that by 2050, global solar energy deployment will reach 8500 GW [1], making PV power generation one of the fastest-growing renewable energy sources worldwide. PV development is crucial for mitigating global climate change and greenhouse gas emissions [2]. However, the expansion of PV facilities also raises concerns about land use, as the installation of PV systems requires a significant amount of land [3], posing a major challenge for the PV industry’s sustainable development [4]. Assuming an average land use rate of 3 hectares per megawatt, deploying the target installed capacity on the ground will require approximately 25 million hectares of land by 2050 [5]. Meanwhile, the land for the cultivation of agricultural crops is 1600 million hectares, which only accounts for 12% of the global land area [6]. The potential conflict of land use among agriculture and PV is growing assertively. The Chinese government has made substantial efforts to promote the solar energy industry and contribute to achieving the dual-carbon goals, with the cumulative PV installed capacity exceeding 470 GW. In fragile areas, such as western China, solar and land resources are relatively abundant, making them potential energy bases for China’s future [7]. However, large-scale PV power plants are often installed in eco-fragile and sensitive areas, such as deserts, which may affect key processes of ecosystem service functions. Numerous studies have indicated that the effective utilization of solar resources in eco-fragile areas has varying degrees and directions of impact on the evolution of fragile ecosystems, while also bringing economic benefits [8].
Changes in land use significantly impact soil properties. The construction of PV power plants alters the original landscape, thereby affecting the ecological functions of soil hydrology, carbon and vegetation dynamics, and biological activities [9]. In the pursuit of achieving net-zero emissions by 2050, integrating crops with deployed PV components to establish an “agrivoltaic” ecosystem on fragile land may offer a promising strategy to enhance the spatial heterogeneity of soil quality within PV array areas [10]. For example, the shading effect of PV systems can mitigate drought stress on plants in arid regions, leading to increased crop yields. Furthermore, integrating crops into PV power plants provides a synergistic solution for improving the physical, chemical, and biological land properties [11,12]. Therefore, agrivoltaic systems present a promising and attractive win–win land use strategy. The largest agricultural PV project to date is located in the Gobi Desert in China, with a capacity of up to 1 GWp [13]. In 2021, the global installed capacity of agricultural PV was approximately 14 GWp [14]. Most agrivoltaic studies were carried out in the United States and Germany, and some typical preliminary studies were carried out in Fraunhofer Institute of Solar Energy Systems (Fraunhofer ISE) in Germany, and Biosphere 2 in the United States [15].
One challenge with agrivoltaic systems is the variability of light resources under the panels. The shading caused by PV modules creates a strip-shaped microhabitat on the ground with continuously changing energy inputs due to variations in the solar elevation angle [16]. These fluctuating energy inputs contribute to an increased spatial heterogeneity of soil quality. Simultaneously, the PV modules provide shaded shelter for the growth of crops under hot and dry weather conditions [17]. The cultivation of perennial grasses and shade-tolerant food and oil crops in PV array areas can enhance the land use efficiency by promoting organic carbon accumulation and output, thereby transforming “low-yield” native land [18]. Furthermore, it is noteworthy that PV modules in arrays with crops have lower temperatures compared to arrays without crops, resulting in improved module performance [10].
Research in agrivoltaic systems has primarily focused on the impact of PV shading on crop growth, yield [17], quality [19], and economic benefits [20]. Studies investigating the ecological effects of soil following the construction of PV modules have predominantly been conducted in natural ecosystems, such as grasslands and deserts [21]. In the arid ecosystem of the Mu Us Sandland in China, compared to areas without PV arrays, there was a notable decrease in the soil evaporation rate and a significant increase in soil moisture under the PV array area [8]. In the degraded grassland ecosystem of the Songnen Plain in northeastern China, the PV array area exhibited a 17.93% increase in soil carbon storage and a 0.75% increase in soil nitrogen storage [22]. Similarly, in the northwest region of China, there was a significant increase in soil carbon content in the PV array area [23]. However, contrasting results have been reported, with some studies finding no significant changes in the physicochemical properties of soil in the PV array area in northeastern China [24].
The implementation of agriculture in PV fields could increase soil resistivity through agricultural management practices. The redistribution of water by modules can accelerate the leaching process of NO3-N, promoting the sustainability of solar energy development while managing agriculture [12]. On the other hand, research has also indicated that agrivoltaic systems may reduce the soil quality and affect processes such as water infiltration, water retention, and nutrient cycling [9]. For instance, in a natural grassland ecosystem in coastal areas of Italy, PV power plants operated for 7 years resulted in a significant decrease of 61% and 50% in soil organic matter and total nitrogen in the soil beneath the panels, respectively, while soil enzyme activity also decreased, and soil electrical conductivity and pH increased [5,25]. Similarly, changes in soil physical characteristics were observed in a PV power plant in southern France, although no significant changes in soil chemical properties were reported [26]. However, these studies have provided limited direct evidence on whether agrivoltaic systems would alter soil quality and the specific nature of such changes.
Utilizing PV array areas for agricultural development under suitable conditions presents a highly promising strategy to address conflicts related to PV land use. However, the changes in the physical, chemical, and biological soil features resulting from the increasing agrivoltaic land use, influenced by factors such as land use and vegetation coverage, are not well understood. The study of the evolution of soil functional characteristics under the increasing agrivoltaic land use remains insufficient. The question of whether agrivoltaic systems can improve land quality in fragile areas remains unresolved. Thus, there is a need to quantify soil quality changes resulting from crop cultivation to reflect the ecological effects of the agrivoltaic system.
Therefore, this study seeks to address the knowledge gap by providing insights into the impacts of agrivoltaic systems on soil properties. We will explore whether the strip-shaped microhabitat and the differences in crop types in the PV array area contribute to spatial variations in soil properties. We hypothesize that agrivoltaic systems have complex impacts on soil physicochemical and biochemical characteristics, and that these impacts vary depending on the differences in the strip-shaped microhabitat and crop types. Thus, an agrivoltaics experiment was conducted through cultivation of peanuts (Arachis hypogaea) and ryegrass (Lolium perenne) on the land of a photovoltaic power plant in the dry–hot valley of southwest China, with an off-site native land serving as the control. Sixteen soil physicochemical and biochemical parameters were measured in the gap and under-panel of the peanuts and ryegrass array and in the control area in the peanut harvest period. The results contribute to improving the understanding of the ecological implications of integrating agriculture with photovoltaic systems.

2. Materials and Methods

2.1. Study Site

The research was conducted at a 1.04 MW “PV + Ecological Restoration” photovoltaic power plant situated in the Jinsha River Dry–Hot Valley region of southwestern China (103°8′30″ E, 26°9′55″ N). The PV array, comprising the gap area and under-panel area, was established and put into operation in 2020, featuring 2340 dual-sided, double-glass monocrystalline silicon photovoltaic modules, each rated at 445 Wp. The modules were installed on the site, with a fixed-tilt PV array positioned 2.5 m above the ground to optimize land use efficiency. All modules were oriented southward, with a spacing of 6.5 m between the PV arrays and a module width of 4.208 m. The tilt angle was set at 28°, and the system’s performance ratio was 81.0%. The average annual grid-connected electricity output over 25 years is projected to be 1316 MW·h.
The power plant is situated at an elevation of approximately 1280 m. The administrative region experiences an average annual temperature of 14.9 °C, with an annual precipitation of about 1000.5 mm, primarily concentrated from May to September. Annual evaporation is measured at 1856.4 mm, while the annual sunshine duration is 2327.5 h. The average annual solar radiation exceeds 5000 MJ·m−2, indicating a relatively abundant solar resource area. Native vegetation in the PV array area was largely removed during the construction of the PV array to facilitate agricultural development. The surrounding native vegetation is akin to a tropical “savanna” and predominantly consists of spear grass (Heteropogon contortus), Chinese dicliptera herb (Dicliptera chinensis), painted spurge (Euphorbia cyathophora), and Barleria cristata.
The environment conditions were monitored from 18 July to 1 August. Environmental data were recorded by a light monitoring instrument (TB-1H), a temperature and humidity monitoring instrument (FM-3A) to collect photosynthetically active radiation (PAR), and soil temperature and humidity microenvironment data. All the data were recorded every 30 min. Preliminary research findings during the peak growth season in July revealed distinct patterns in light intensity at a height of 1.5 m above the ground and soil temperature at a depth of 20 cm below the ground across different areas: native land > gap area > under-panel area. The PAR was calculated using the data from 7:00 to 19:30. The photosynthetic photon flux density was recorded at (38.81 ± 14.93) mol·m−2·d−1, (27.68 ± 12.64) mol·m−2·d−1, and (1.85 ± 0.44) mol·m−2·d−1, respectively. Soil average temperatures were measured at (23.30 ± 1.52) °C, (21.18 ± 1.30) °C, and (19.09 ± 0.63) °C, and the soil moisture values were (36.48 ± 3.69)%, (42.88 ± 3.80)%, and (57.49 ± 1.00)%, respectively (Figure 1). These observations indicated significant variations in light intensity and soil temperature among microhabitats.

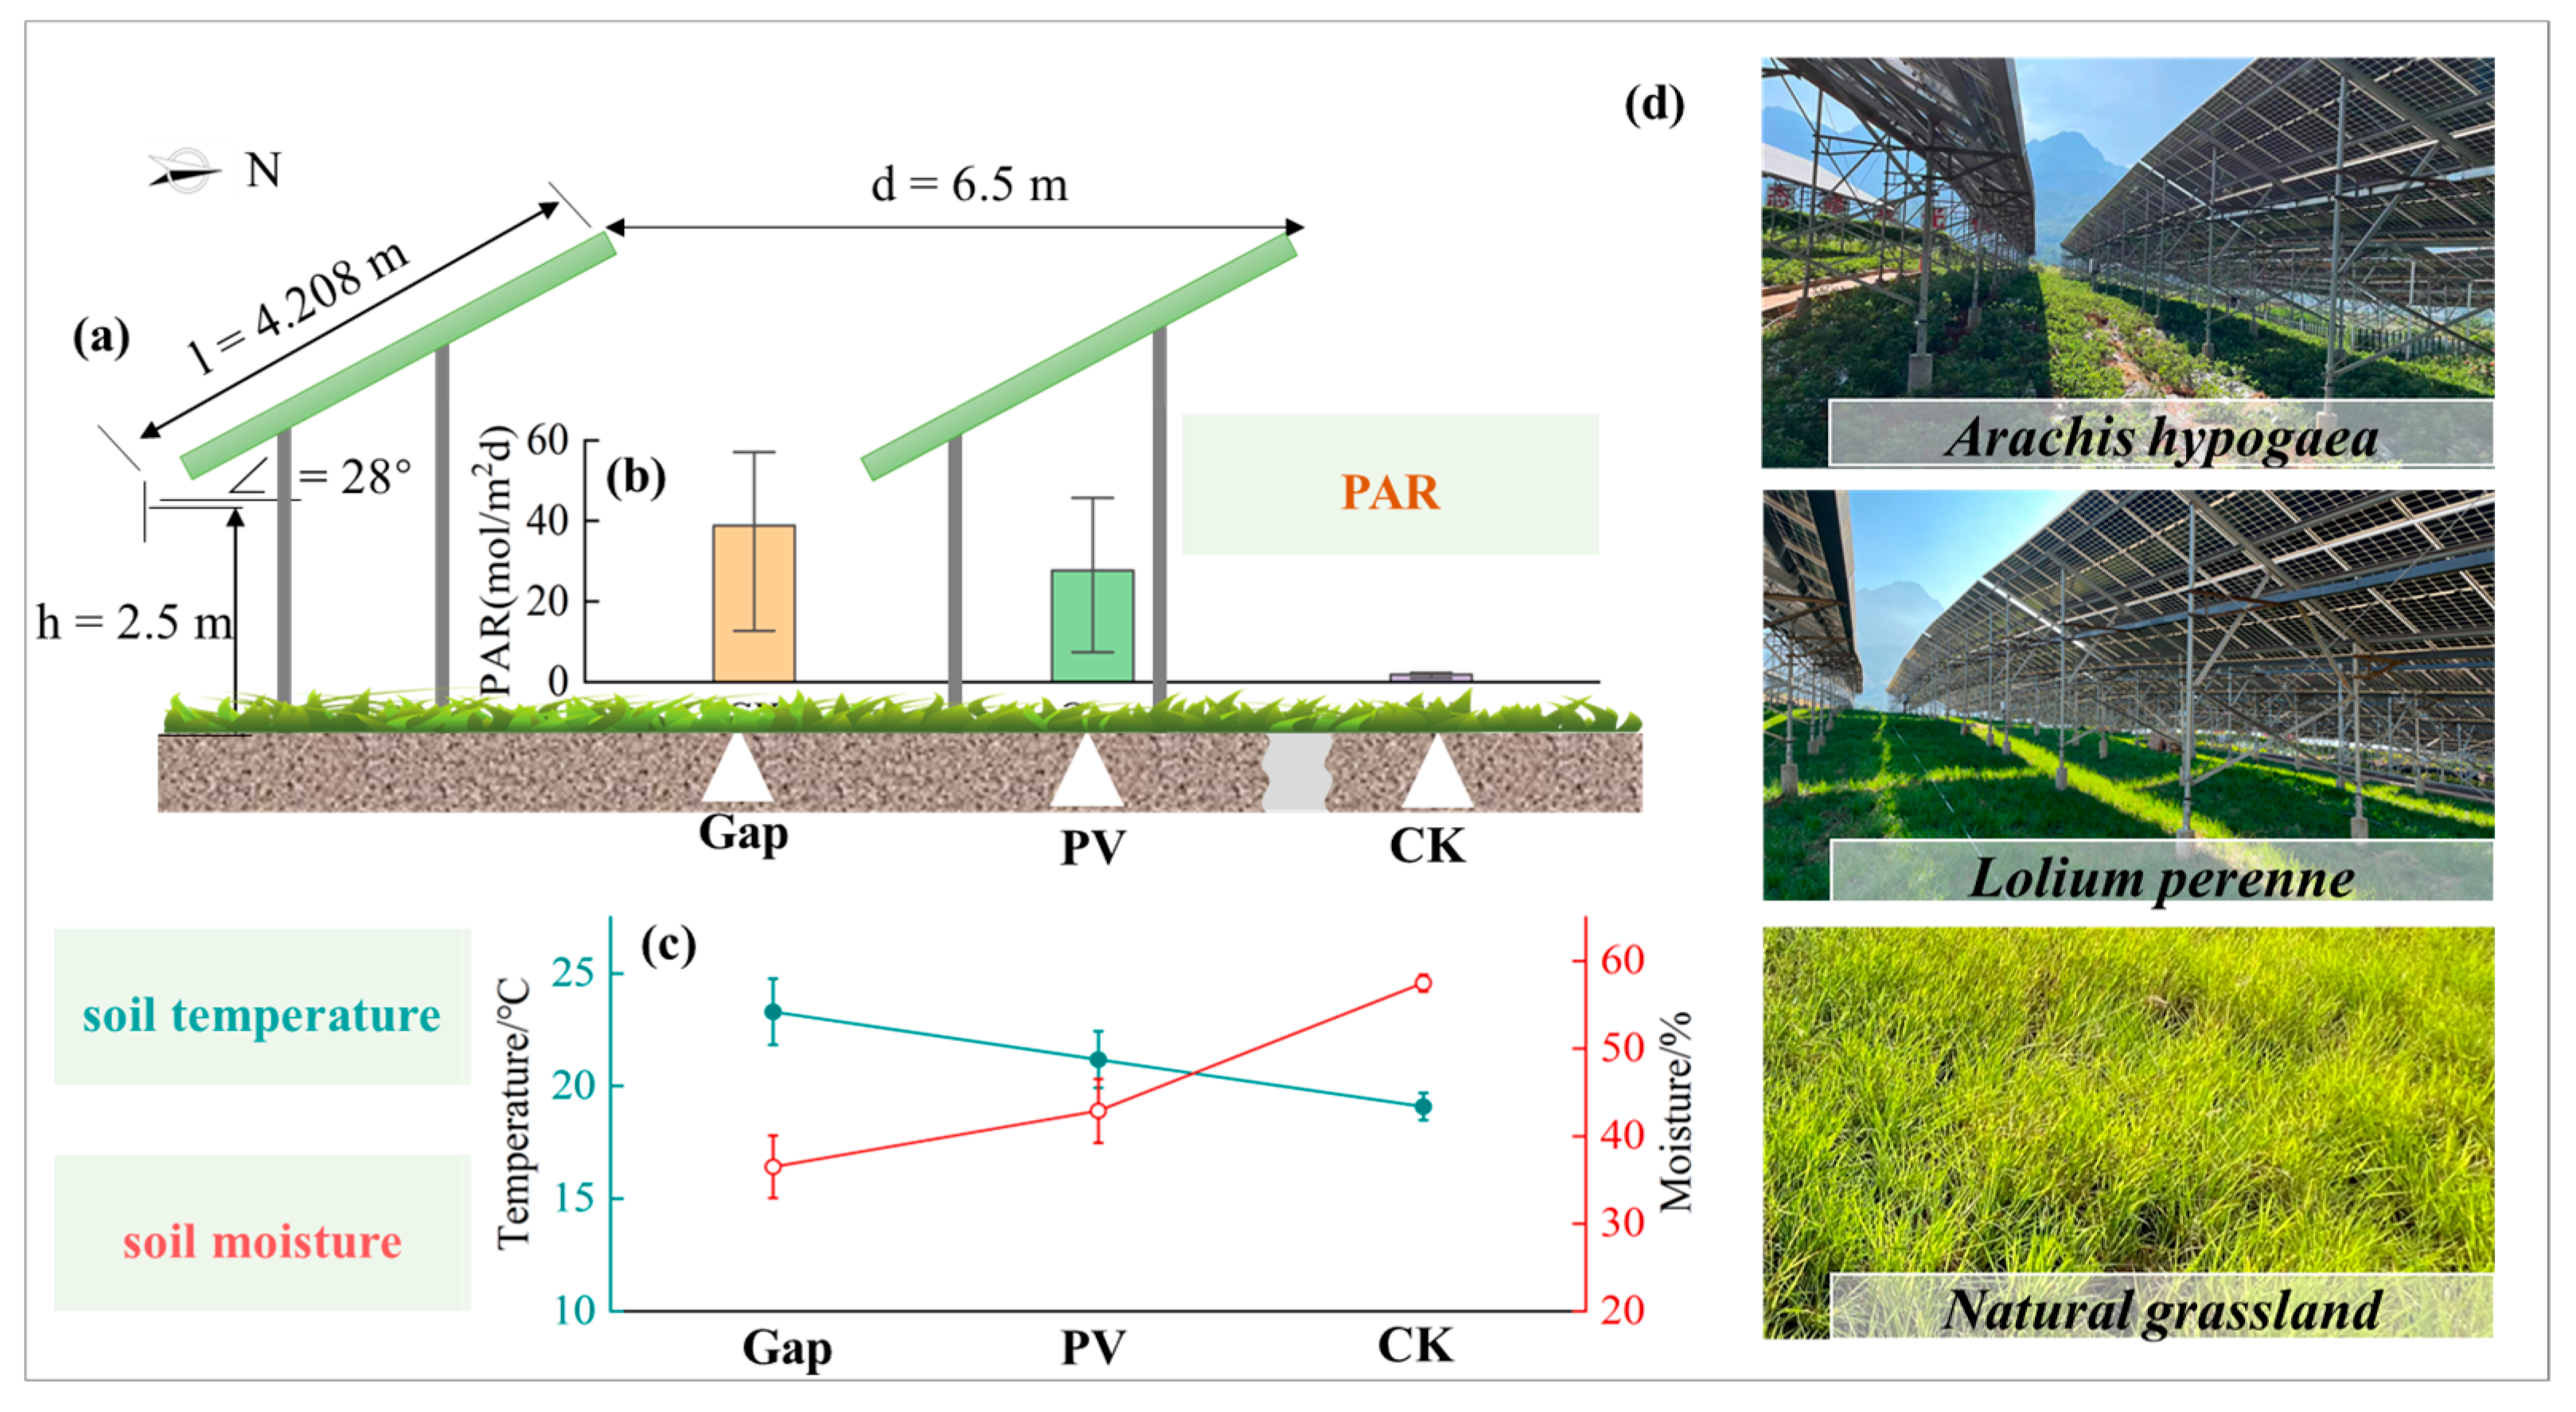
2.2. Agrivoltaic Experimental Design

The PV array area was partitioned into multiple plots to establish agrivoltaic systems. Two plots were designated for crop cultivation following preparatory measures, including land plowing, drying, and leveling. To mitigate potential edge effects during sampling, strip-shaped microhabitats consisting of under-panel and gap areas were evenly distributed within each plot, with each plot encompassing at least three rows of PV modules. Taking into account the impact of crop height on PV modules, access to light resources, as well as economic and ecological benefits, two low-growing herbaceous crops—peanut (Arachis hypogaea) and ryegrass (Lolium perenne)—were selected. Peanut employs a strategy of biological nitrogen fixation through the formation of root nodules, addressing its own nitrogen requirements and enhancing the soil quality [27]. Ryegrass serves as high-quality forage for livestock and is commonly utilized in grassing measures in orchards, regulating soil nutrients and microbial communities. Its well-developed root system also contributes to soil stabilization [28]. In April 2022, pre-selected and dried ryegrass and peanut seeds were sown in the designated functional plots. Ryegrass was sown in a strip planting pattern, while peanuts were sown individually. Following sowing, the crops were adequately irrigated, and conventional management practices for different growth stages, including the seedling stage, nutrition stage, and reproductive stage, were implemented.

2.3. Soil Collection

In August 2022, soil samples were collected from the under-panel ryegrass (PV-Lp), gap ryegrass (Gap-Lp), under-panel peanuts (PV-Ah), gap peanuts (Gap-Ah), and the control area outside the PV array (CK). The CK was the adjacent native land dominated by H. contortus, and it was free of any distinct shaded obstructions or human activity distractions. Sampling was conducted in areas without disease or pest infestation, dead plants, trampling, or grazing (Figure 1). Soil samples were collected from a depth of 0–20 cm, considering the primary distribution depth of plant roots.
The entire plants of peanuts, ryegrass, and H. contortus were excavated, and the soil associated with plant roots within the 0–20 cm-depth range was collected. Five sampling points were selected, and soil from each point was mixed to form one composite sample, representing one replicate. In total, 15 mixed-soil samples were obtained from 75 sampling points. Each mixed-soil sample weighed about 500 g. Each mixed-soil sample was sieved through a 2 mm soil sieve to remove plant residues, gravel, and other impurities. Approximately 30 g of the sieved soil sample was immediately placed into an aluminum box for soil water content determination. Meanwhile, the aboveground fresh weight of peanut and ryegrass was weighed, and it showed that the aboveground biomass of ryegrass at the under-panel and gap were 480.27 ± 43.39 g·m−2 and 270.30 ± 75.59 g·m−2, respectively, and the peanut aboveground biomass at the under-panel and gap were 47.57 ± 8.82 g per individual plant and 87.62 ± 19.64 g per individual plant, respectively. Additionally, there were 12 peanut plants per square meter.
Subsequently, each mixed-soil sample was divided into two portions, averagely. One portion was placed in a non-woven cloth bag, brought back to the laboratory, air-dried, ground, and sieved through 0.25 mm and 1 mm sieves for the analysis of the soil physicochemical properties. The other portion was stored in a refrigerator at 4 °C for the analysis of soil microbial biomass and soil enzyme activity.

2.4. Soil Measurements

The soil’s basic physicochemical properties, total and available nutrients, and biochemical properties were monitored referencing the “analytical method of soil agriculture chemistry” [29] and “soil enzyme and its research method” [30].

2.4.1. Soil Basic Physicochemical Properties

Soil water content (WC) was determined using the oven-drying method and weighing. Specifically, the fresh soil was stored in aluminum boxes and weighed by electronic balance (0.01 g), and then weighed again after the soil was dried for 24 h at 105 °C. The aluminum specimen boxes were also weighed. The WC was calculated using Equation (1):
WC = m 1 m 0 m 2 m 0 m 1 m 0 × 100 %
where m1, m2, and m0 represent the fresh soil sample and aluminum box weight after collection, the dried soil sample and aluminum box weight after drying, and the aluminum box weight, respectively.
pH was measured using a 5:1 water-to-soil ratio and an electrode (PHS-3E, INESA Scientific Instrument Co., Ltd, Shanghai, China). Electrical conductivity (EC) was measured using a 5:1 water-to-soil ratio and a conductivity meter (DDS-307, INESA Scientific Instrument Co., Ltd, Shanghai, China).
Soil organic carbon (SOC) was determined using the potassium dichromate–sulfuric acid heating method.

2.4.2. Soil Total and Available Nutrients

Total nitrogen (TN) was determined using the Kjeldahl method. Total phosphorus (TP) was determined using the molybdenum antimony colorimetric method. Total potassium (TK) was determined using the flame photometry method. Available phosphorus (AP) was determined using the molybdenum blue colorimetric method. Available potassium (AK) was determined using the flame photometry method. Nitrate nitrogen (NO3-N) was determined using the ultraviolet spectrophotometry method.

2.4.3. Soil Biochemical Properties

Soil microbial biomass carbon (MBC), microbial biomass nitrogen (MBN), and microbial biomass phosphorus (MBP) were determined using the chloroform fumigation extraction method. The MBC, MBN, and MBP contents were calculated by dividing the conversion coefficient between fumigated and unfumigated soil extracts by the coefficients of 0.38, 0.45, and 0.40, respectively. Urease activity (U), sucrase activity (S), and phosphatase activity (P) were determined using the phenol sodium–hypochlorite colorimetric method, the 3,5-dinitrosalicylic acid colorimetric method, and the phosphorus benzene sodium colorimetric method, respectively.

2.4.4. Calculation of Soil Quality Index (SQI)

First, standardization and principal component analysis (PCA) were conducted on the soil indicators using SPSS (IBM SPSS Statistics, version 25, SPSS Inc., Chicago, IL, USA; for the results, refer to Supplementary Table S1). Principal components with eigenvalues greater than 1, explaining at least 5% of the variance, were extracted. The cumulative contribution rate of all principal components that reflected more than 80% of the variance was examined. Then, within each principal component (PC), the indicators with factor loadings exceeding 90% of the highest factor loading were considered as key soil quality indicators and were retained in the minimum dataset (MDS). The key soil parameters were transformed into dimensionless values ranging from 0 to 1 according to Formula (2). For parameters where higher values indicated better soil quality (including SOC, TN, TP, TK, NO3-N, AP, AK, MBC, MBN, MBP, U, S, and P), an S-shaped membership function was used, and the dimensionless values were calculated using Equation (2):
S i = 1 ,   X i X m a x X i X m i n X m a x X m i n 0 ,   X i X m i n ,   X m i n < X i < X m a x
where Si, Xi, Xmin, and Xmax represent the dimensionless value, actual measurement value, minimum measurement value, and maximum measurement value of the key soil quality indicator, respectively.
For parameters such as pH, EC, C:N, N:P, and C:P, a nonlinear scoring model was used, and the dimensionless values were calculated using Equation (3):
S i = 1 1 + X i X m b
where Xm is the average measurement value, and b is the slope of the equation, either 2.5 or −2.5 [31].
The soil quality index (SQI) was calculated using Equation (4):
SQI = i = 1 n W i · S i
where Wi is the weight of the key soil quality indicator, and n is the number of indicators in the minimum dataset (MDS).

2.4.5. Calculation of Soil Multifunctionality Index (MFI)

Soil multifunctionality reflects the cycling of carbon, nitrogen, phosphorus, and the supply capacity of soil available resources. Based on the measured pH, EC, WC, SOC, TN, TP, TK, NO3-N, AP, AK, MBC, MBN, MBP, U, S, and P, a total of 16 functional parameters were used to calculate the MFI. The min–max normalization method was applied to ensure that all indicators were on the same scale, and the average method was used to calculate the MFI [32]. The calculation equations were as follows (5)–(7):
f i = x i max i
Mf = f i min fi max fi min fi
MFI = 1 N i = 1 N g f i
where xi represents the functional parameter of the ecosystem i, maxi is the maximum value of the functional parameter within the ecosystem i, maxfi is the maximum value of f(i) within the ecosystem i, minfi is the minimum value of f(i) within the ecosystem i, ensuring that Mf remains within the range of 0–1, N is the number of soil parameters, and g is the normalization function.

2.5. Data Statistical Analysis

The data distribution was tested by the Shapiro–Wilk test at p < 0.05. For the data that were in accordance with a normal distribution, a one-way ANOVA was applied to test the soil properties’ differences. The least significant difference (LSD, p < 0.05) was employed to compare the variations in soil characteristics among different treatments when the sample variance was homogeneous. Otherwise, Tamhane’T2 was used to test and compare the variations in soil characteristics among different treatments. For the abnormal distribution data, the Kruskal–Wallis H nonparametric test was used to test the differences among the samples at p < 0.05. All data preprocessing was conducted using Microsoft 365 Excel software (version number 18.2311.1071.0). IBM SPSS Statistics 25 software was used to test the differences among various indicators. Graphs were generated using Origin 2022.

3. Results

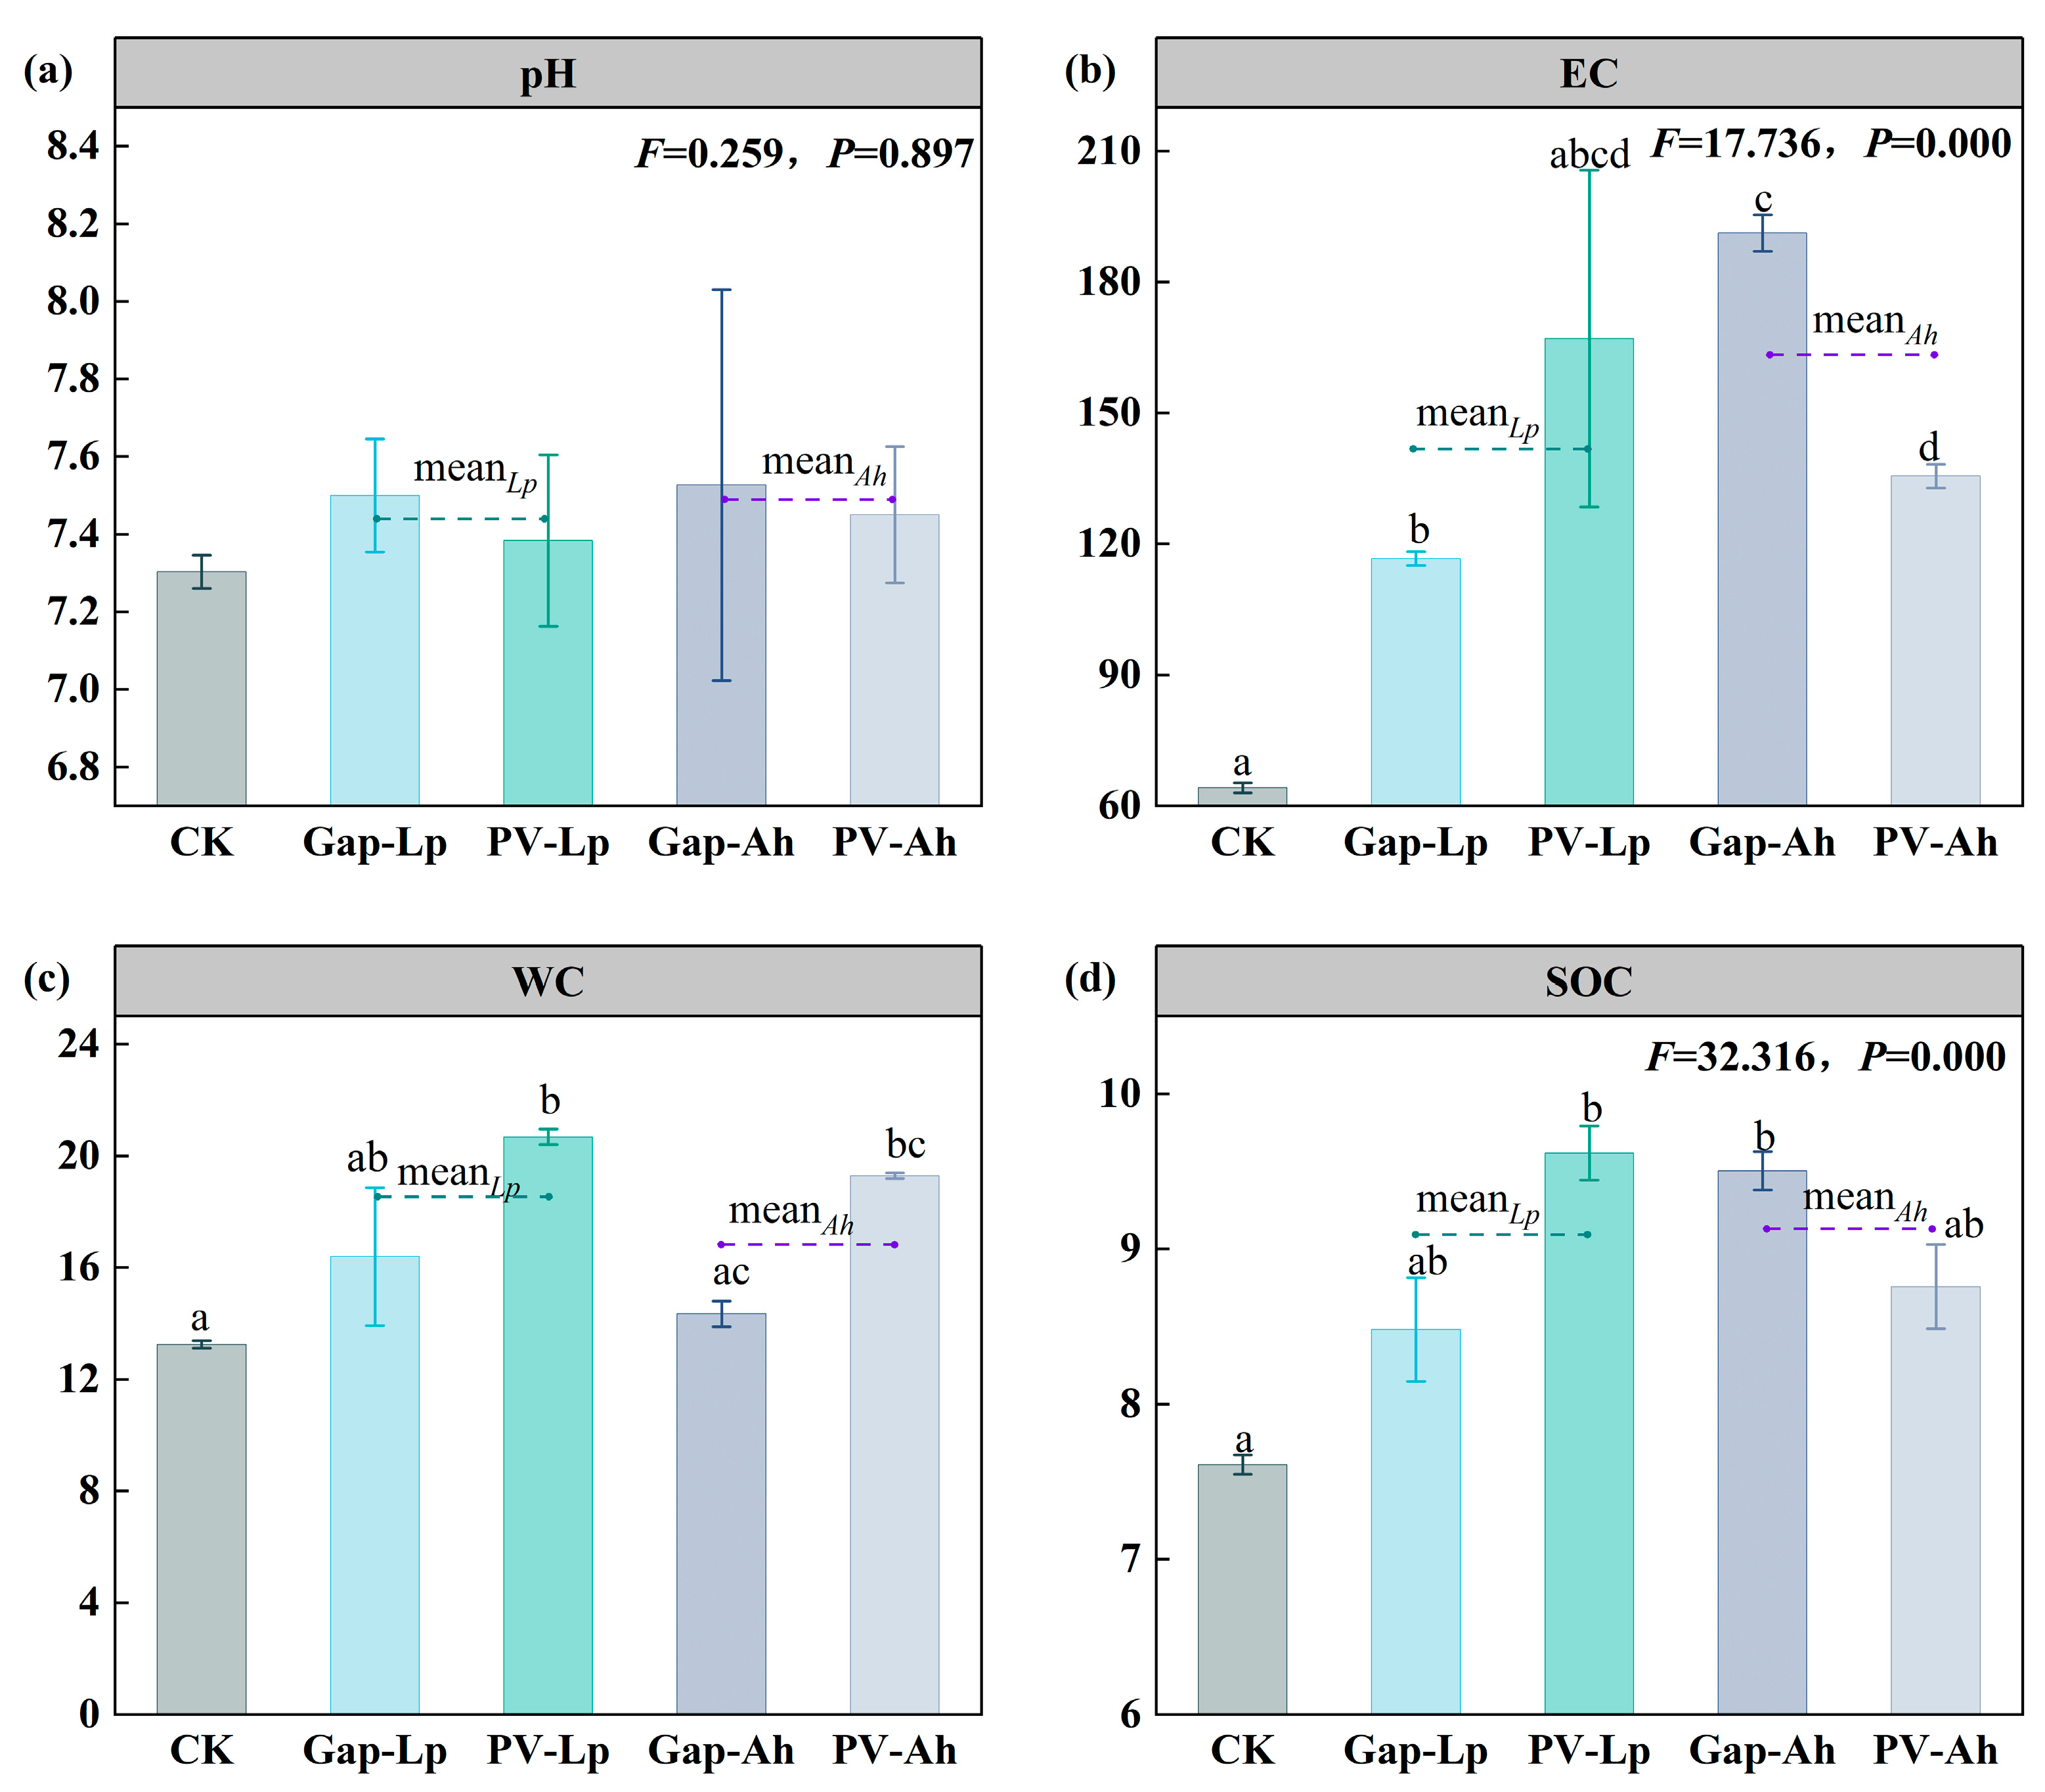
3.1. Soil Basic Physicochemical Properties

Cultivation of ryegrass and peanuts in the PV array resulted in increased WC, pH, EC, and SOC content compared to the CK (Figure 2). The impact of under-panel cultivation on WC was more pronounced than that of gap cultivation, with a 23.69% increase in Gap-Lp (p < 0.001), a 56.06% increase in PV-Lp (p < 0.001), an 8.22% increase in Gap-Ah, and a 45.57% increase in PV-Ah (p < 0.001; Figure 2c). The increase in EC and SOC in PV-Lp was 78.68% and 14.94% higher, respectively, than that in Gap-Lp when compared with the CK. Conversely, the increase in EC and SOC in PV-Ah was 86.90% and 9.81% lower, respectively, than that in Gap-Ah (Figure 2b,d). The increase in soil pH in PV-Lp and PV-Ah was not significantly different from that in the gap (p > 0.05; Figure 2a).

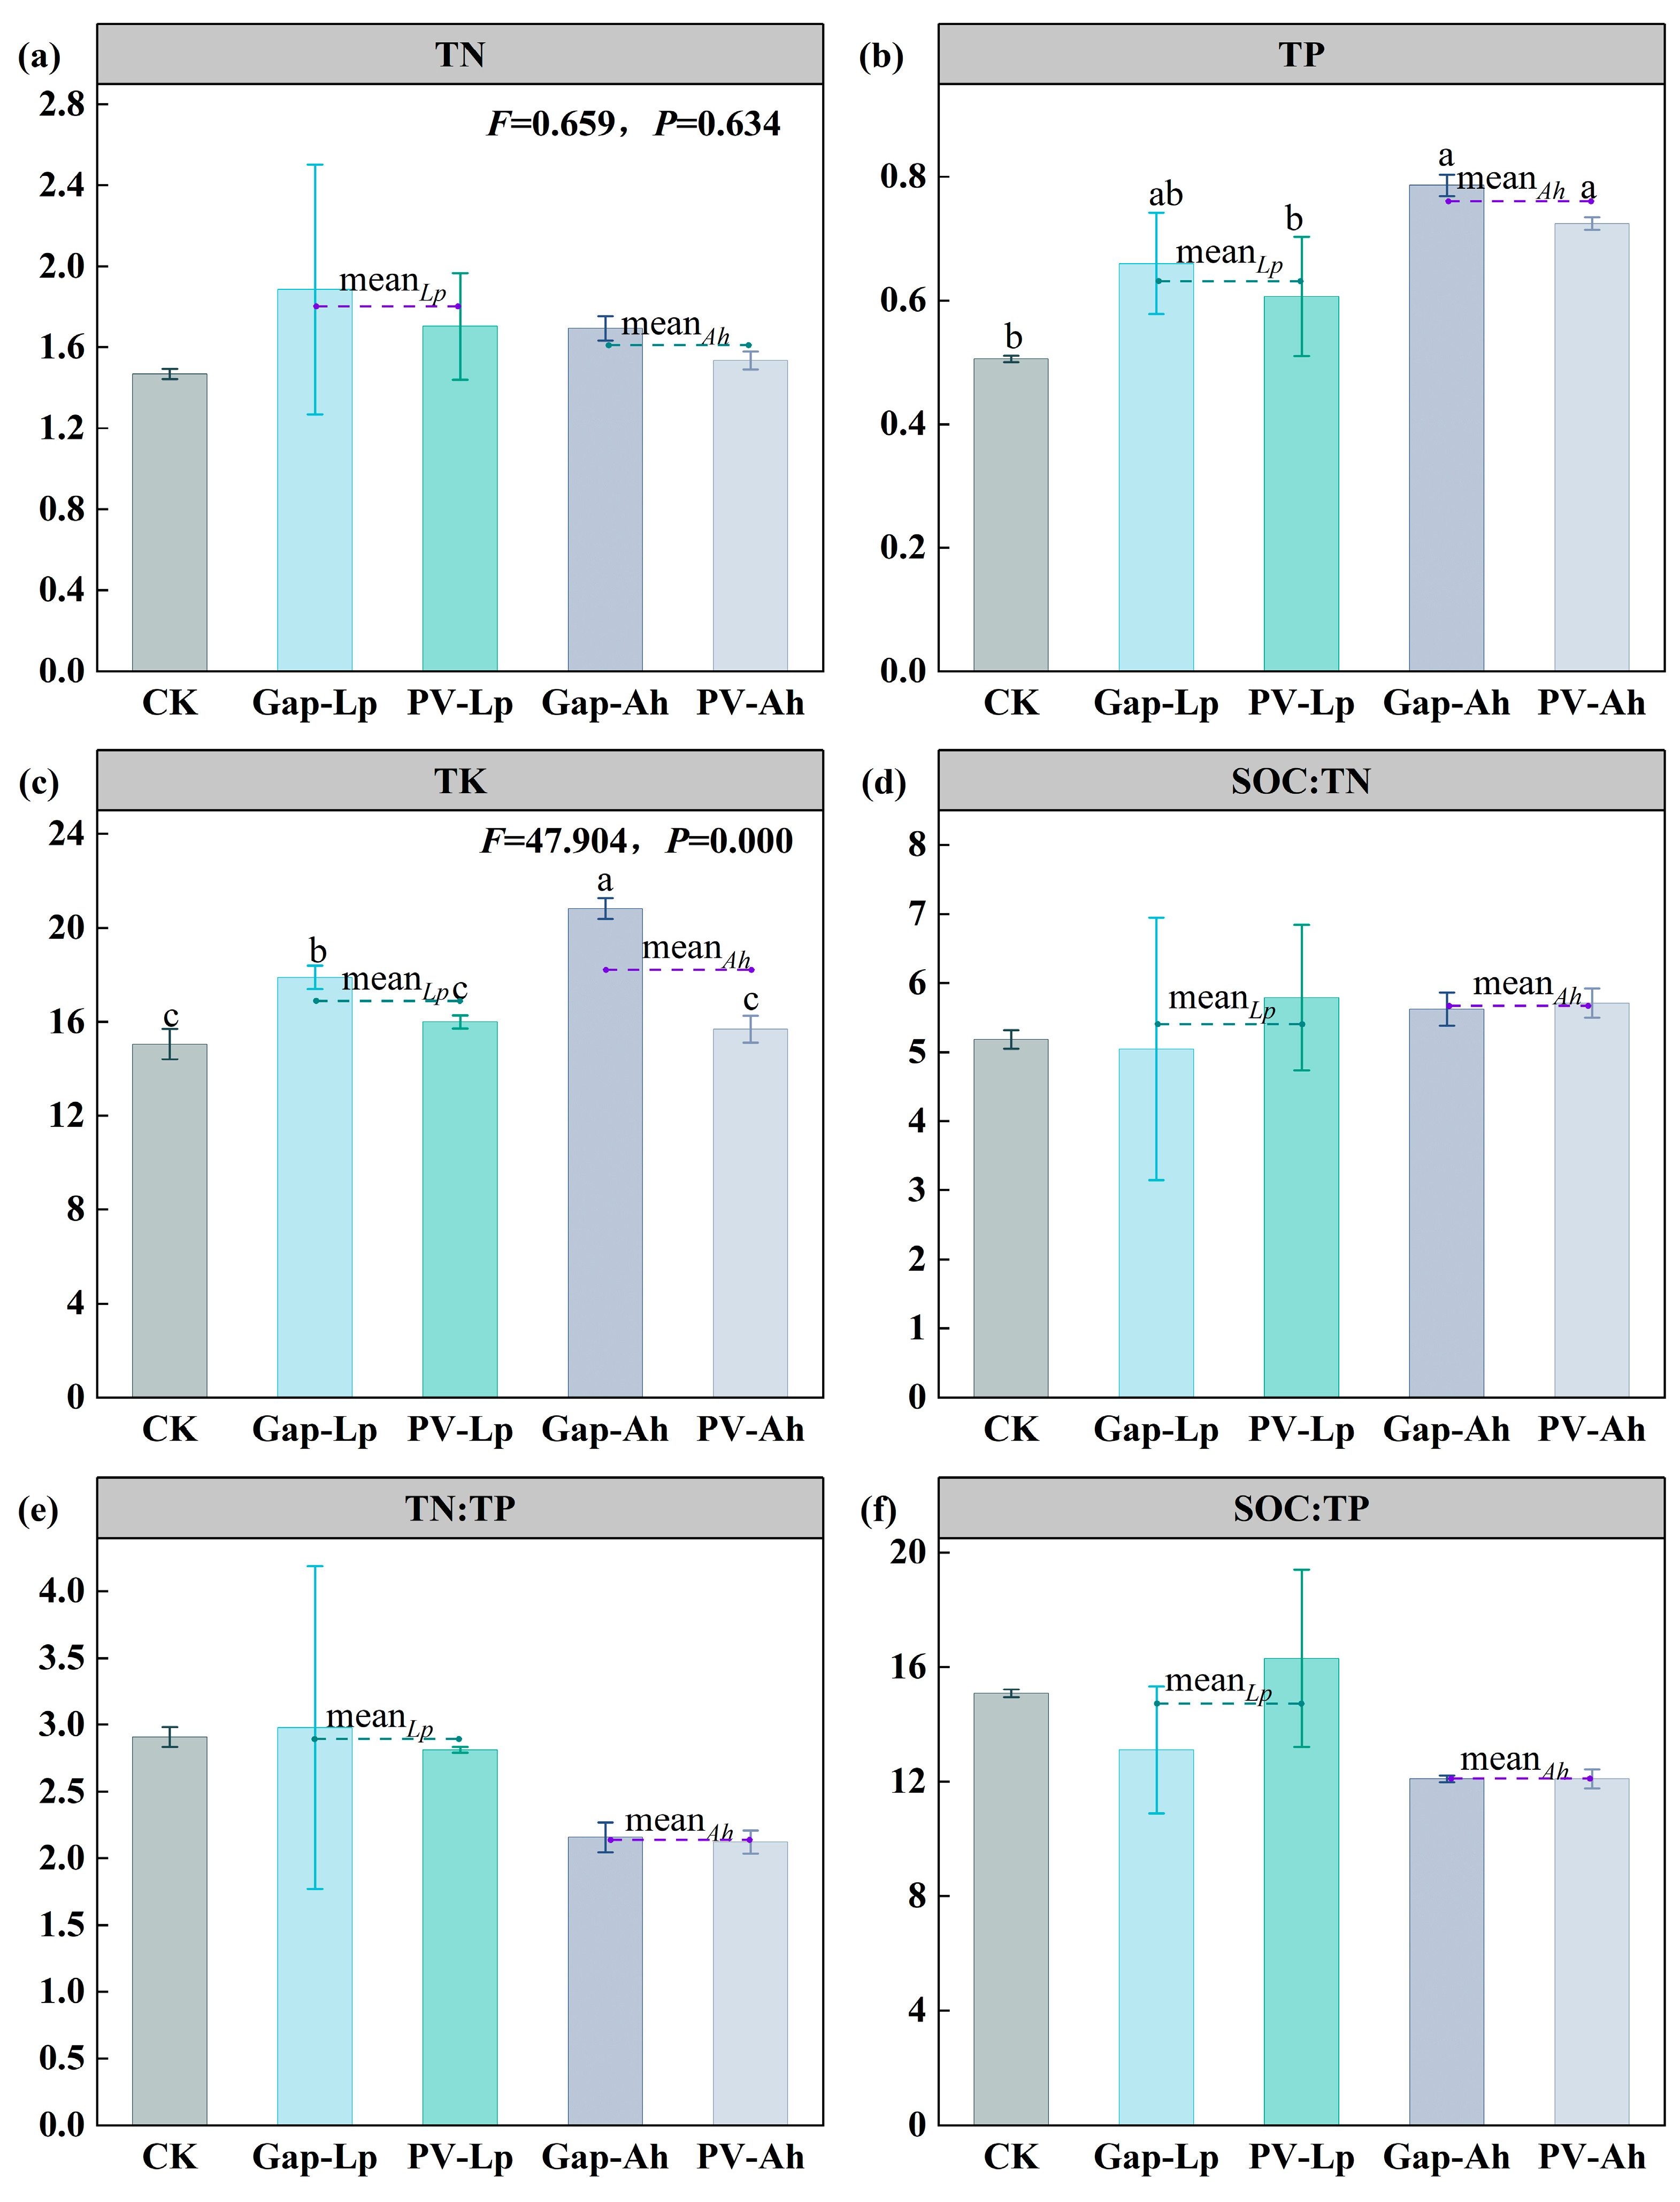
3.2. Soil Total Nutrient Characteristics

Cultivation of ryegrass and peanuts led to increased TN, TP, and TK in both the gap and under-panel areas compared to the CK. The TN content increased from 1.47 g/kg in CK to 1.88 g/kg in Gap-Lp and 1.70 g/kg in PV-Lp, as well as 1.69 g/kg in Gap-Ah and 1.53 g/kg in PV-Ah, respectively (p > 0.05; Figure 3a). Additionally, TP increased by 29.60% and 55.26% in Gap-Lp and Gap-Ah, and 19.74% and 42.75% in PV-Lp and PV-Ah, respectively (Figure 3b). TK increased by 18.83% and 38.41% in Gap-Lp and Gap-Ah, respectively (p < 0.05), while showing a slight increase under the panel (p > 0.05; Figure 3c). Furthermore, the SOC:TN ratio in the agrivoltaic system exhibited a slight increase, while most of the TN:TP and SOC:TP ratios showed a decreasing trend (p > 0.05; Figure 3d–f). These results suggest that the agrivoltaic system promotes an increase in TN, TP, and TK content, with higher nutrient increases observed in the gap compared to the under-panel area treated with the same crop, with TP and TK showing a more sensitive response.

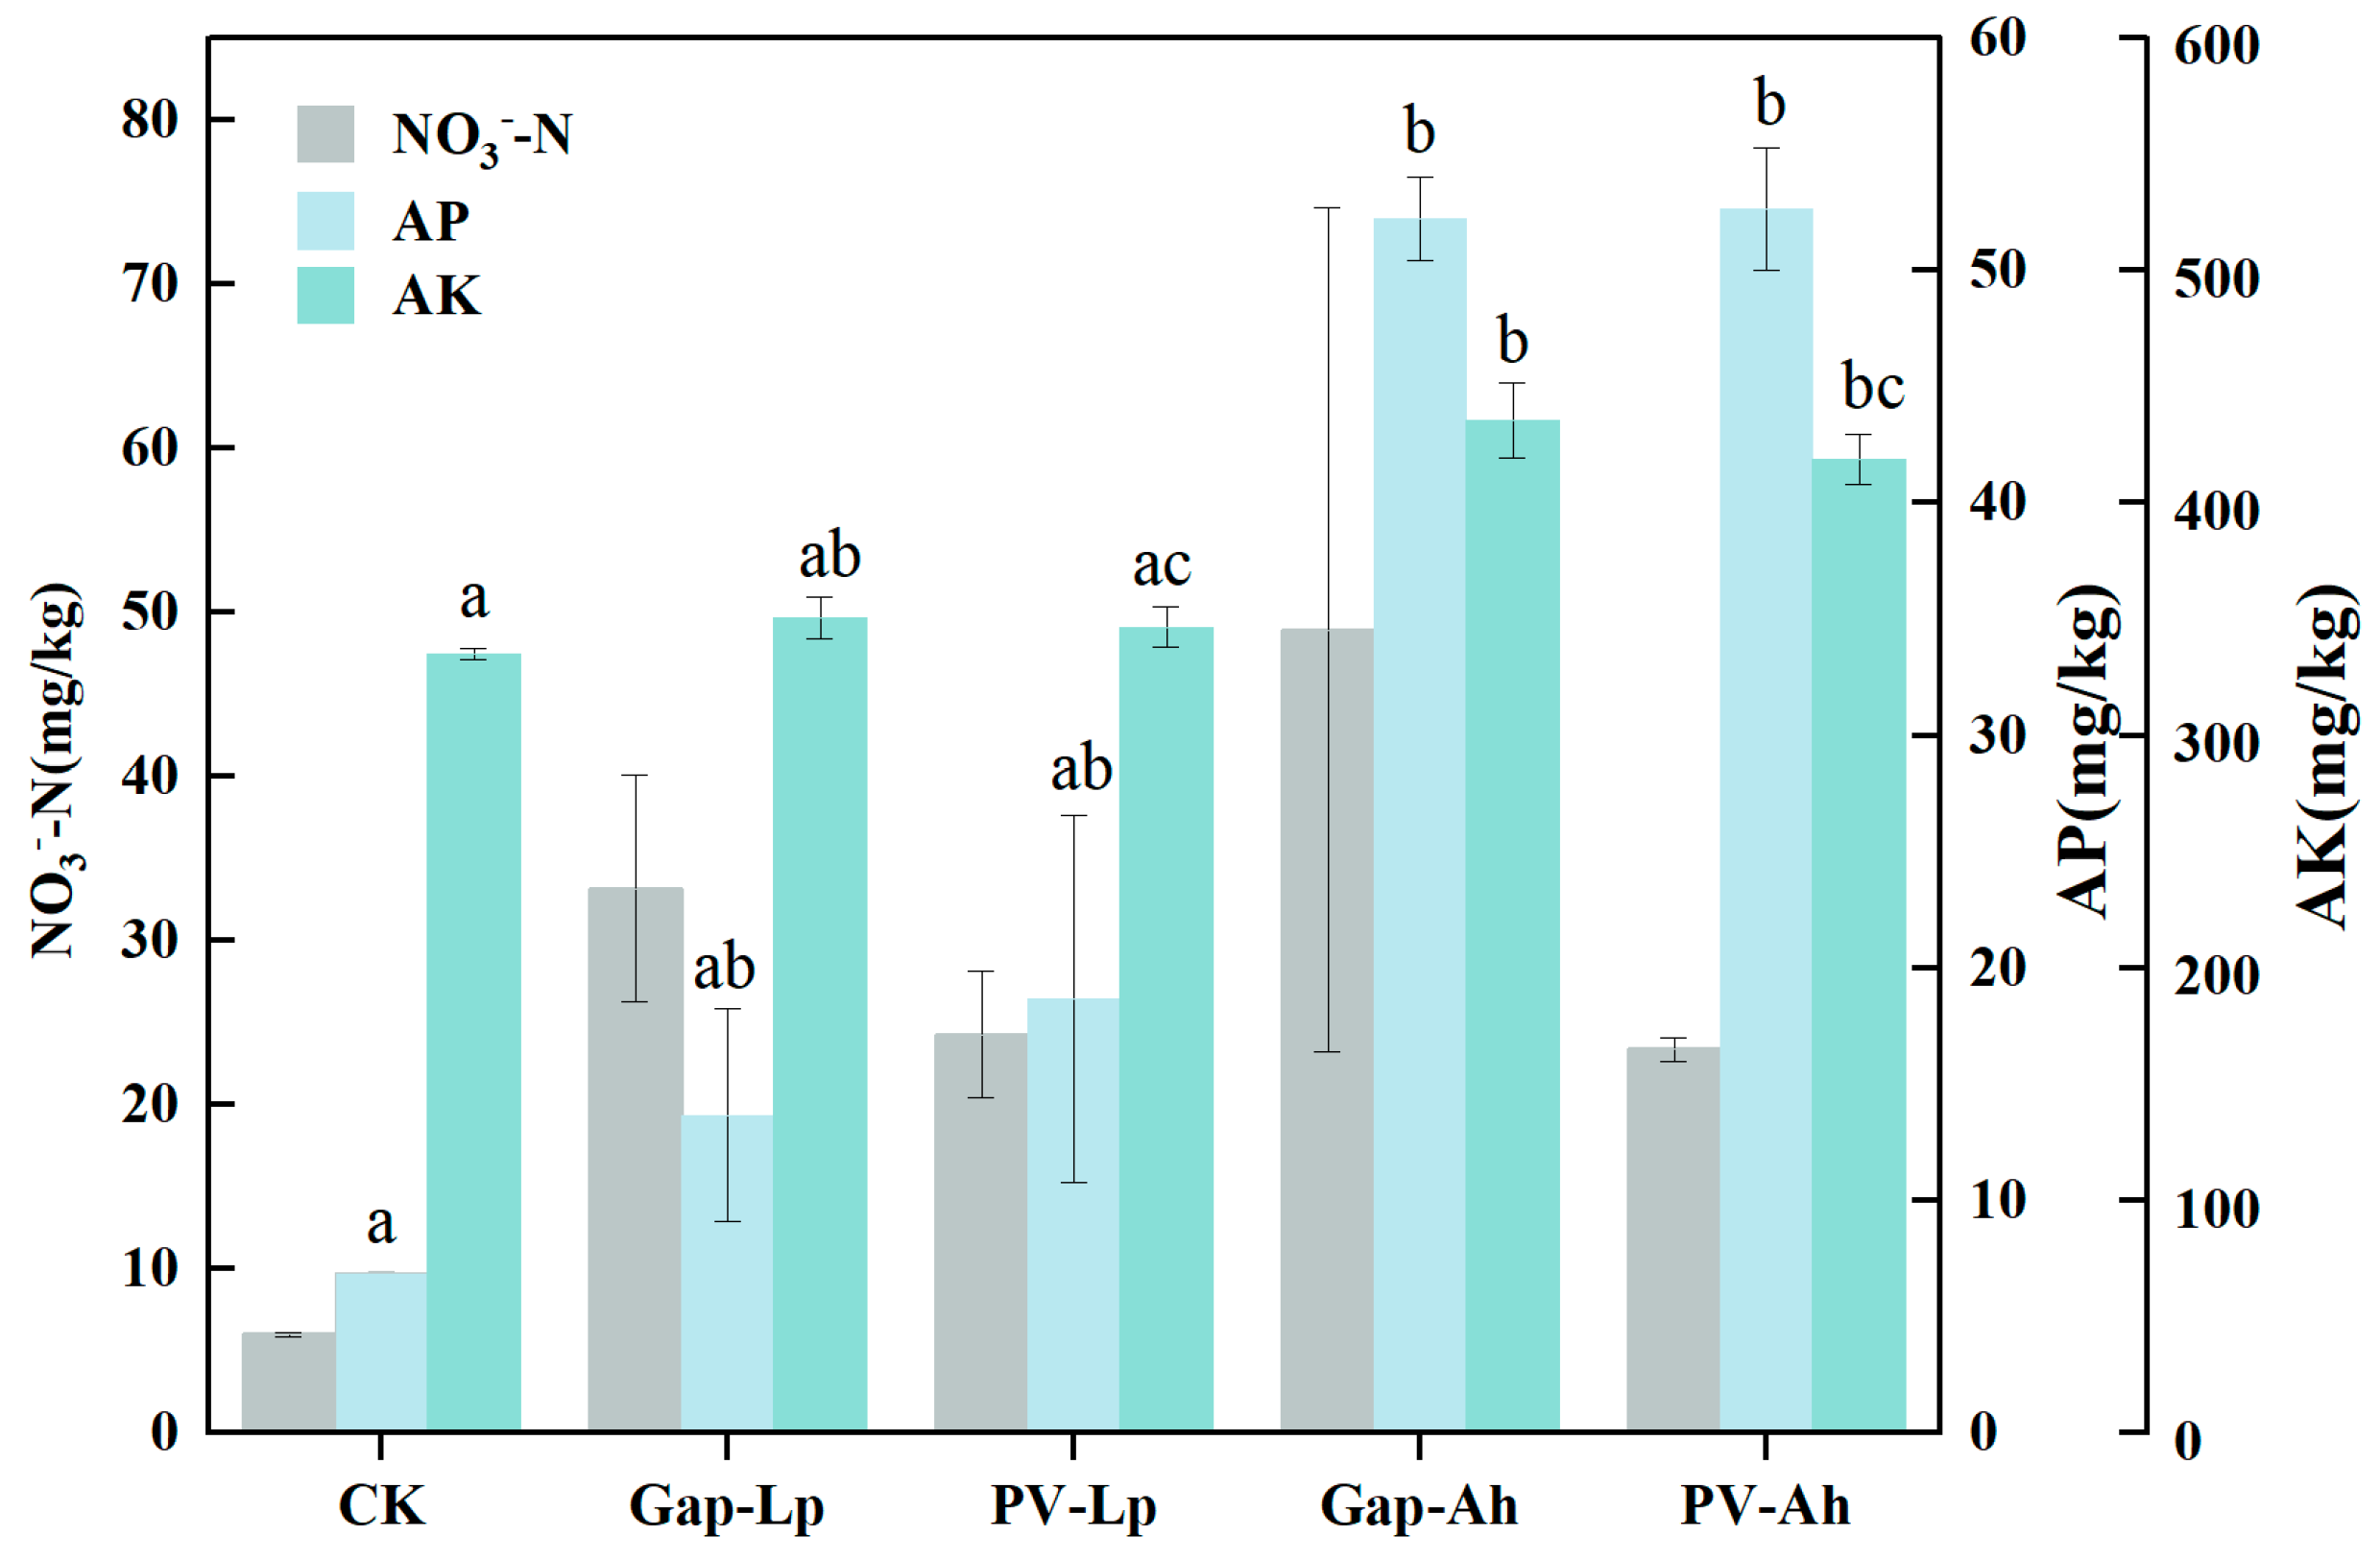
3.3. Soil Available Nutrient Characteristics

The agrivoltaic system demonstrated improvements in NO3-N, AP, and AK (Figure 4). The NO3−N levels were 5.52 times and 8.15 times higher in Gap-Lp and Gap-Ah, while 4.04 times and 3.89 times in PV-Lp and PV-Ah, compared to those in the CK, respectively. In comparison to Gap-Lp and PV-Lp, the areas with peanuts’ cultivation exhibited significantly higher AP, and the AK contents also significantly increased in Gap-Ah (+29.97%) and PV-Ah (+24.96%; p < 0.05). A slight increase in AK was observed in Gap-Lp (+4.66%) and PV-Lp (+3.48%; p > 0.05). Therefore, the agrivoltaic system significantly enhanced soil available nutrients, with the improvement effect of peanuts’ cultivation being notably superior to that of ryegrass.

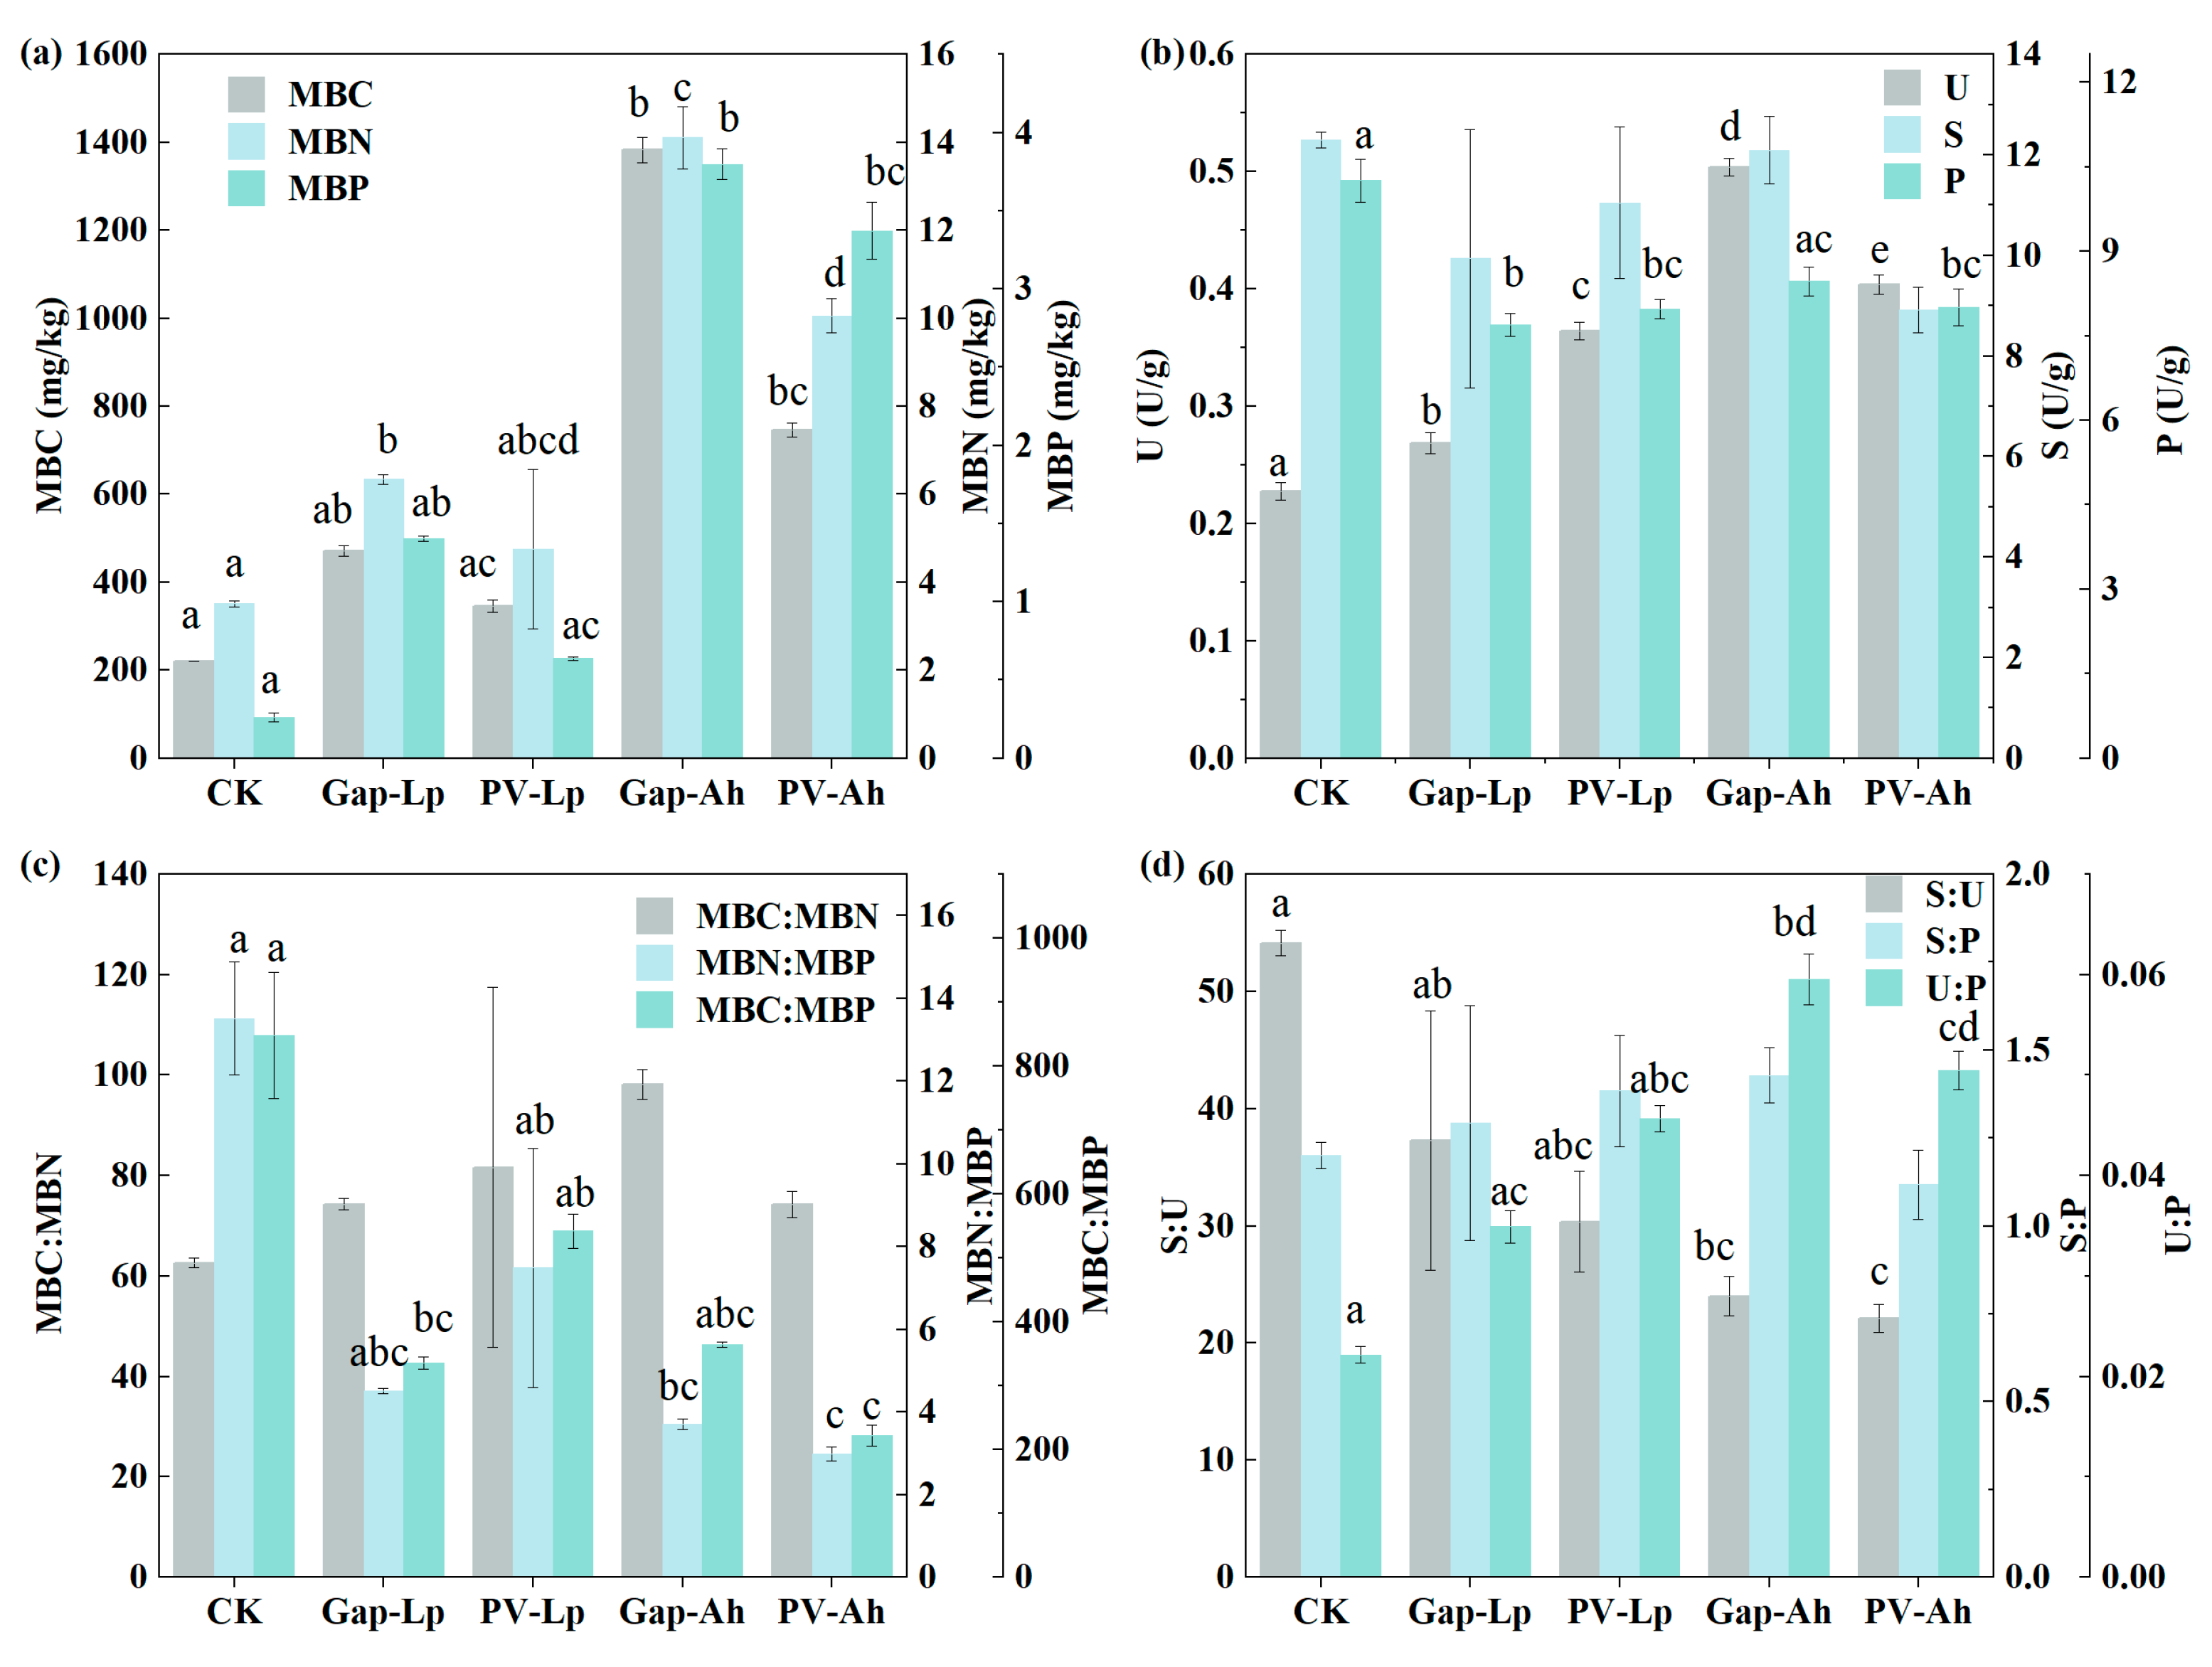
3.4. Soil Biochemical Properties

The agrivoltaic system significantly increased MBC, MBN, and MBP (p < 0.001), with the highest levels observed in Gap-Ah > PV-Ah > Gap-Lp > PV-Lp > CK. MBC, MBN, and MBP in Gap-Ah were 6.29 times, 4.02 times, and 14.42 times higher than that in CK, respectively. In PV-Lp, MBC, MBN, and MBP increased by 57.14%, 35.61%, and 141.82%, respectively. The MBC:MBN ratio increased, while the MBN:MBP (p < 0.05) and MBC:MBP (p < 0.05) ratios decreased significantly. Notably, the MBC:MBN value reached as high as 98.13 in Gap-Ah. Peanuts promoted a higher MBC:MBN ratio in the gap, whereas ryegrass promoted a higher ratio under the panel. The rate of decrease in MBN:MBP and MBC:MBP was greatest in PV-Ah and lowest in PV-Lp (Figure 5a,c).
S and P (p < 0.05) levels decreased, while U (p < 0.001) increased in the agrivoltaic system. A significant reduction of S in PV-Ah and a decrease in P across all treatments were observed. Specifically, P in Gap-Lp was significantly lower than that in Gap-Ah, with little difference between PV-Ah and PV-Lp. Furthermore, the S:U ratio decreased, and the U:P ratio notably increased in the agrivoltaic system (p < 0.05), with peanut cultivation leading to a lower S:U ratio and a higher U:P ratio compared to ryegrass cultivation (Figure 5b,d).

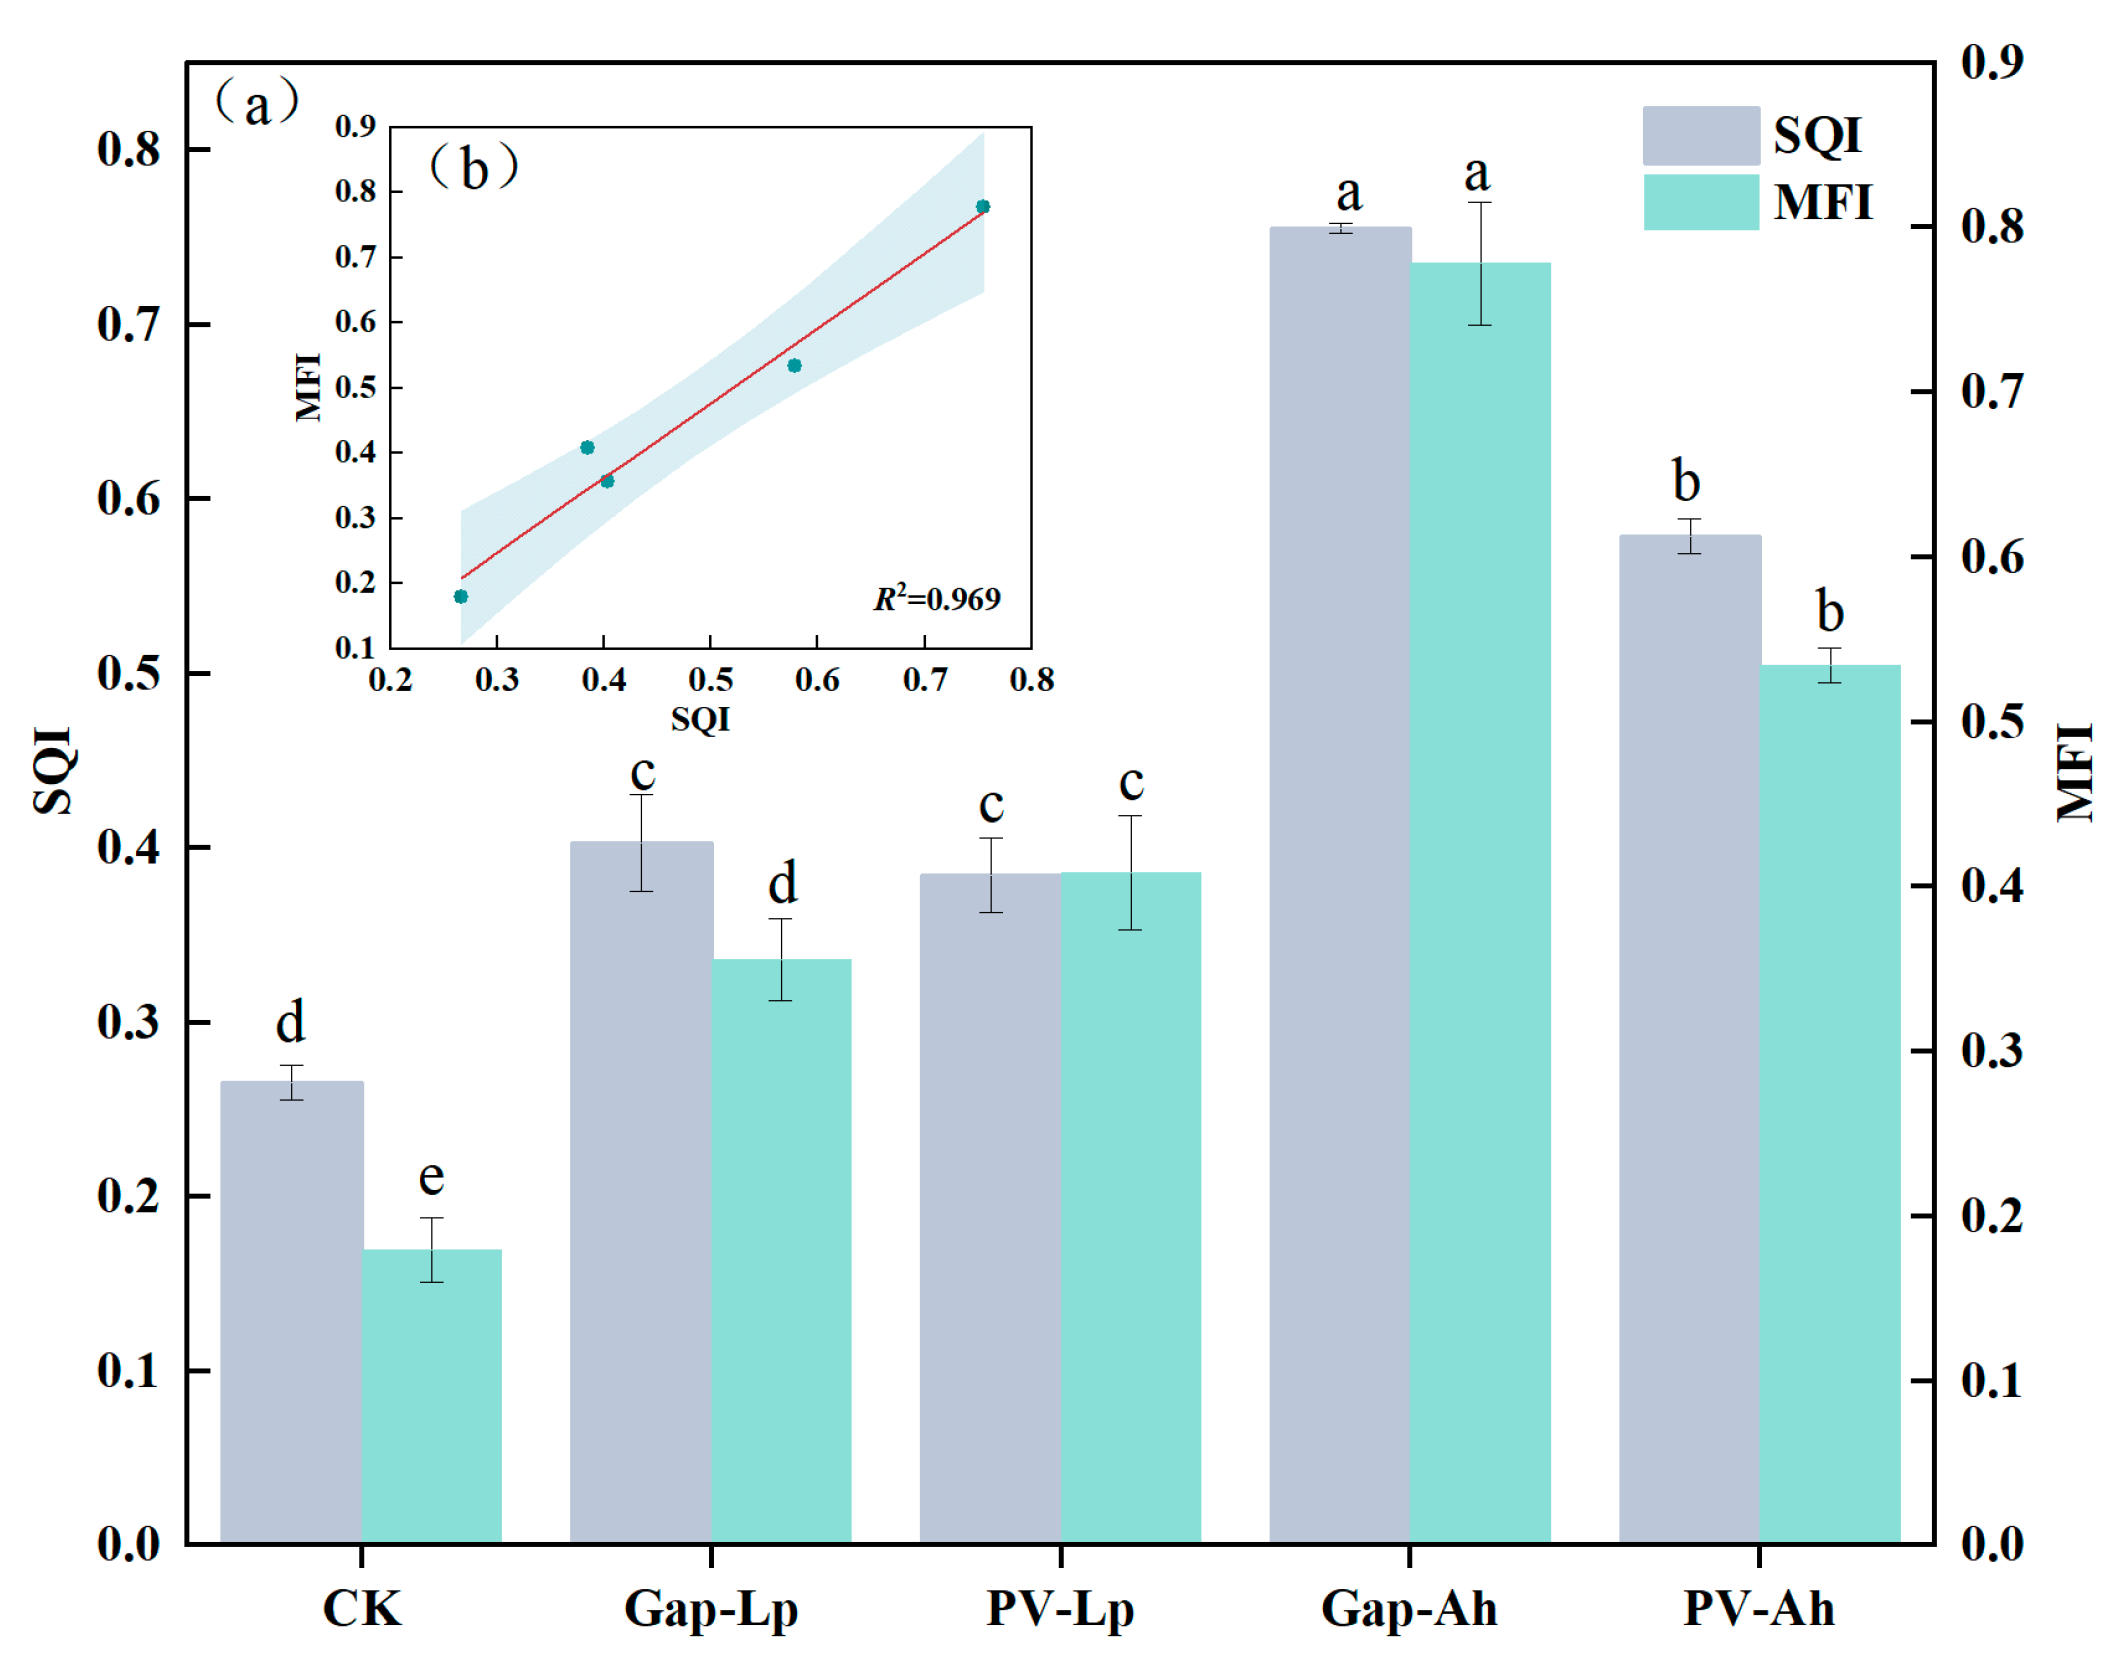
3.5. Soil Quality and Multifunctionality

The agrivoltaic system significantly improved the SQI and MFI. There were extremely significant differences in the SQI and MFI among CK, Gap-Ah, PV-Ah, Gap-Lp, and PV-Lp (FSQI = 384.523, p < 0.001; FMFI = 201.948, p < 0.001). The SQI was higher in the gap than under the panel, and peanut cultivation led to a significantly higher SQI compared to ryegrass cultivation. Cultivation of ryegrass and peanuts in the gap increased the SQI by 51.61% and 184.02% compared with CK, respectively. Additionally, the SQI increased by 117.58% in PV-Ah compared with CK and by 50.37% compared with PV-Lp (Figure 6a).
Similarly, peanut cultivation resulted in a more substantial improvement in the MFI. The MFI was significantly higher in PV-Lp than in Gap-Lp. In Gap-Ah, the MFI was improved by 445.68% compared to the CK. Moreover, the MFI in PV-Ah was notably 197.74%, 50.11%, and 30.71% higher than in CK, Gap-Lp, and PV-Lp, respectively (Figure 6a). Regression analysis of the SQI and MFI showed a significant positive correlation (R2 = 0.969; Figure 6b).

4. Discussion

The implementation of agricultural activities in PV power plants can effectively offset the land occupation caused by PV arrays and simultaneously cause positive environmental consequences [33]. This study provides real-world evidence for the advancement of agrivoltaics according to the incipient effects of an agrivoltaic system on barren soil in a dry–hot valley region. It provides a level of foundation with a more targeted strategy, aiming to enhance land quality and promote sustainable land utilization throughout the 25-year operation period of PV power plants.

4.1. Effects of Agrivoltaics on Soil Physicochemical Properties

The presence of PV panels serves to reduce soil evaporation due to their wind-blocking effect, while vegetation coverage and root absorption contribute to enhanced soil moisture retention through a positive plant–soil moisture feedback process [34,35]. Consequently, a notable improvement in soil moisture was observed in our agrivoltaic system compared to the native land, suggesting a potential mitigation of soil water deficit limitations for crop growth in dry–hot valleys. The influence of crop cultivation on soil moisture improvement was more pronounced under the panels, likely due to the interception of shortwave and longwave radiation by the PV panels, as well as the lower wind speed, air temperature, and soil temperature under the panels compared to in the gap [36,37].
It is important to note that irrespective of microhabitats or crop differences, the soil electrical conductivity (EC) and pH in the agrivoltaic system exhibited an increasing trend compared to native grasslands. Agricultural activities, such as crop cultivation and management, may lead to an increase in soil EC through nutrient leaching [35]. Furthermore, the cumulative effect of crop cover on the evapotranspiration process could also contribute to the variations in EC among different microhabitats resulting from different crops. The rise in soil salinity and alkalinity underscores the need for caution regarding the risk of soil salinization and alkalization during the long-term development of agrivoltaic systems.
The previous findings indicated that cultivation results in significant carbon loss in agricultural and grassland soils [38]. On the contrary, this preliminary study, conducted on native poor land where the PV array has been constructed for two years, with an agrivoltaic system, revealed a noteworthy enrichment in soil organic carbon, nitrogen, phosphorus, and potassium nutrients. The soil C:N ratio increased, while the N:P ratio and C:P ratio decreased. The disturbance caused by power plant construction increased the content of aggregates in the topsoil, which aids in nutrient retention [39]. Additionally, nutrients applied into the soil through tillage, along with crop management measures, may continuously enhance the content of small particles in the soil, thereby improving its nutrient retention capacity [35]. A study on changes in soil characteristics in a degraded grassland PV array found an increase of 17.93% in soil carbon stock and 0.75% in nitrogen stock [22]. Similarly, in this study, irrespective of crop or microhabitat differences, the increase in organic carbon content exceeded that of total nitrogen. Moreover, in the strip-shaped microhabitat of the PV array, the improvement effect of peanut cultivation on available nutrients was stronger than that of ryegrass, while the enhancement in total nutrient content mainly occurred in the gap area. This difference may be attributed to the gap area receiving more sunlight during the growing season, leading to higher-assimilation products being deposited into the soil through photosynthesis [40]. Additionally, available nutrients are usually more sensitive to environmental changes and exhibit strong spatial variability [41]. Peanut, as a leguminous dicotyledon, possesses biological nitrogen fixation capabilities, and its root exudates promote the transformation of available nutrients and increase microbial biomass, thereby enhancing soil nutrient supply levels [42].
Soil microbial biomass and enzyme activity are active components in soil nutrient cycling, driving nutrient transformations and playing a positive role in improving soil fertility on fragile lands. They provide a comprehensive reflection of soil fertility characteristics and biological activity. Our findings indicate that the agrivoltaic system significantly promoted soil microbial biomass carbon (MBC), microbial biomass nitrogen (MBN), microbial biomass phosphorus (MBP), MBC:MBN, the ratio of urease to phosphatase activity (U:P), and urease activity compared with the native barren land. However, phosphatase activity and sucrase activity, as well as MBN:MBP, MBC:MBP, and sucrase-to-urease ratios, were reduced in the agrivoltaic system. These results suggest that the agrivoltaic system alleviates carbon limitations on microbial activity in soil, reduces soil organic carbon mineralization, promotes an increase in organic carbon content, enhances soil fertility, and improves phosphorus availability. Additionally, soil microbes alleviate nutrient limitations by regulating the ratio of nitrogen and phosphorus-acquiring enzymes [43]. The significant differences in microbial biomass and urease activity between gap and under-panel areas, as well as between ryegrass and peanut, suggest that variations in light and crop jointly regulate soil biological characteristics. The introduction of crop cultivation, especially peanut planting, in the PV array area creates better conditions for microbial growth and reproduction compared to the strip-shaped microhabitat of the photovoltaic array. The higher microbial biomass in the gap areas than under the panels may be explained by the fact that gap crops receive more sunlight, facilitating the accumulation of organic matter and providing more nutrients to support microbial life activities, so that it demonstrated a higher microbial functional diversity [25]. The increase in microbial biomass may, in turn, promote nutrient transformations and increase the soil nutrient content [44].

4.2. Improvement of Soil Quality in an Agrivoltaic System

The construction of PV arrays represents a short-term disturbance process, yet the operation of a power plant typically spans 25 years. Under natural conditions, damaged land surfaces often require an extended period to recover. This study demonstrated that co-allocating the PV array and cultivating crops significantly enhanced the soil quality and multifunctionality indices compared to native land. Consequently, land utilized for agrivoltaics may support more diversified utilization patterns. We hypothesized that if the differences in soil quality and multifunctionality mostly resulted from the PV array strip-shaped microhabitat, then the physicochemical and biochemical characteristics of the soil should not differ significantly within the same strip-shaped microhabitat when different crop types are planted. However, our findings suggested otherwise.
In this study, soil quality and multifunctionality were markedly higher in the gap and under-panel areas when peanuts were cultivated compared to ryegrass. These disparities in soil quality and functional improvement effects can likely be attributed to the ecological functional differences of the crops [45]. Peanuts, as upright broadleaf leguminous plants, can form symbiotic relationships with rhizobia for biological nitrogen fixation. Previous studies have shown that intercropping peanuts significantly increased the soil nutrient content, such as nitrogen, phosphorus, and potassium, thereby promoting nutrient cycling, enhancing soil microbial diversity, and improving soil quality [46]. On the other hand, ryegrass, as a clumping narrow-leaved grass species, is not only cultivated as a forage crop but also utilized as a cover crop due to its rapid growth, high biomass, and extensive coverage, which significantly improves the microenvironment of soil organic matter and nutrients [47]. These differences result in varying root exudates in response to changes in environmental factors, such as light, water, and nutrients, leading to distinct regulatory processes of soil enzyme activity and nutrient microenvironments [48]. Additionally, the improvements in soil quality and multifunctionality offer a potential avenue for resolving the conflict between PV and agricultural land in eco-fragile areas. Through the development of agrivoltaic projects, it is feasible to achieve the integrated utilization of solar energy resources and agricultural production in ecologically fragile areas [49], while also enhancing the resilience of dryland agriculture to climate change [10,50].

4.3. Current Measures and Future Considerations

Native lands in eco-fragile areas, such as dry–hot valleys, are often constrained by water availability, nutrient limitations, and intense sunlight, which present significant obstacles to agricultural activities. The construction of PV arrays alters the microhabitat conditions of the underlying surface, making it conducive to agricultural production and improving the inefficiency of native vegetation. As previous studies have pointed out, the agrivoltaic systems could make it a useful water conservation strategy in water-scarce regions [51]. When conducting agricultural activities in the PV array, it is crucial to balance soil quality improvement, enhancement of soil functions, appropriate crop selection, and the layout of crops within the strip-shaped heterogeneous habitats of the PV array.
It is well recognized that different crops have varying light requirements. Crops that are unsuitable for planting in native habitats with intense sunlight may thrive in areas with PV shading, resulting in better yields and improved nutritional value [52]. The modulation of soil nutrient cycling by different crops, whether through monoculture or mixed planting strategies, is a key influencing factor in regulating soil quality. For instance, a study on three different drought-tolerant crops: Chiltepin pepper, jalapeños peppers, and tomatoes, under a photovoltaic array in an arid environment found that the fruit yield of Chiltepin pepper and tomatoes increased by 2 times and 1 time, respectively, while there was no significant change in the fruit yield of jalapeños peppers [10]. In precipitation-abundant areas, such as the western coast of Oregon, USA, and Montpellier, France, forage crop yields under the panels increased by 90% compared to fully illuminated areas and by 126% compared to gap areas [36]. However, shading from the panels had inhibitory effects on tomato fruit and lettuce yield, and lettuce yield did not show significant changes when the shading rate was below 50% [53,54]. Additionally, PV shading has the effect of increasing winter temperatures and reducing summer temperatures on the underlying surface, while reducing soil evaporation and improving soil water use efficiency [37]. Crop cultivation may also cool the photovoltaic modules and improve the electricity generation efficiency [35]. Planting high-reflectance crops has advantages in increasing the power gain of bifacial photovoltaic modules and obtaining dual ecological and economic benefits [55].
Furthermore, this study demonstrated that introducing crops into the PV array area can significantly improve the soil quality and multifunctionality. Importantly, the improvements were influenced by the types of crops and PV array microhabitats. However, it is worth noting that these are preliminary results since the PV array has only run for two years. There is no doubt that a longer experimentation period (3–4 years or more) should be carried out and more details should be taken into account to eliminate the effects of initial fluctuations and draw more convincing conclusions. Therefore, we propose two preferred strategies to promote agrivoltaic development in fragile regions. Firstly, the selection of suitable crops for agrivoltaic systems should be based on the increase in PV power generation, crop light suitability, soil quality, and functionality. Meanwhile, the necessary ratio of capital investment and economic benefit effected by agrivoltaic activity is an inescapable factor to achieve widespread application [15]. Additionally, spatial and temporal configuration and layout patterns of crops in the agrivoltaic system should be constructed based on the PV array strip-shaped microhabitat characteristics, the improvement effects of crops on the soil, and the ecological effects of crop-planting patterns. Thus, further studies may pay attention to the selection of shade-resistant, high-yield, high economic added value, and soil improvement function crops, as well as cropping patterns, such as rotation and intercropping. These approaches have the potential to achieve multiple benefits for agrivoltaic systems in vulnerable areas and may boost the conversion from barren land into cultivatable land [56].

5. Conclusions

This study provided valuable insights into the changes in soil characteristics following the construction of an agrivoltaic system in the dry–hot valley of southwest China. It represents the first known investigation into the impact of agrivoltaic systems on soil quality in dry–hot valley eco-fragile areas. Our results demonstrated that the cultivation of peanuts and ryegrass in the PV array significantly altered the physicochemical and biochemical characteristics of the soil. Specifically, soil moisture, electrical conductivity, pH, nitrate nitrogen, available phosphorus, available potassium, organic carbon, total nitrogen, phosphorus, and potassium, as well as microbial biomass carbon, nitrogen, phosphorus, and urease, increased to varying degrees. Conversely, the soil phosphatase and sucrase activities decreased. Changes in the stoichiometric ratios of soil C–N–P indicated that the agrivoltaic system reduced soil carbon mineralization rates and enhanced phosphorus availability. Additionally, peanuts and ryegrass cultivation in the photovoltaic array significantly improved the soil quality index (SQI; +44.70% to 184.02%) and multifunctionality index (MFI; +18.06% to 117.49%). The improvement effect of peanuts on the SQI and MFI was stronger than that of ryegrass, and overall, the improvement effect in the gap soil was greater than in the under-panel soil. However, it is important to note that these findings were based on a study of two crops in one year of cultivation, and further investigation with long-term data and model simulations is necessary to obtain more comprehensive results. In conclusion, this study underscores the significance of crop selection and their spatial layout within the array area. Further research and long-term monitoring are essential to the development of effective strategies for the integrated utilization of solar energy resources and agricultural production in fragile ecosystems.

Supplementary Materials

The following supporting information can be downloaded at: https://www.mdpi.com/article/10.3390/agronomy14030584/s1, Table S1. Results of PCA of soil parameters and variance of common factors.

Author Contributions

J.L., Z.L. and W.S. performed the measurements; W.L. presided over the construction of the agricultural photovoltaic system; J.L., Z.L. and X.S. processed the experimental data, performed the analysis, drafted the manuscript, and designed the figures. All authors discussed the results and commented on the manuscript. All authors have read and agreed to the published version of the manuscript.

Funding

This work was supported by the Technical Service Project “the study on key technologies of ecological photovoltaics in a fragile rocky desertification area of Yunnan Province” (Grant No. XNY-DC-QT-2022-001).

Data Availability Statement

The data presented in this study are available upon request from the corresponding author.

Conflicts of Interest

The authors declare no conflicts of interest relevant to this study. Author Wen Li was employed by the company SPIC Yunnan International Power Investment Co., Ltd. The remaining authors declare that the research was conducted in the absence of any commercial or financial relationships that could be construed as a potential conflict of interest. The authors declare that this study received funding from SPIC Yunnan International Power Investment Co., Ltd. The funder had the following involvement with the study: presided over the construction of agricultural photovoltaic system.

References

  1. IRENA. Global Energy Transformation: A Roadmap to 2050; International Renewable Energy Agency: Abu Dhabi, United Arab Emirates, 2018; Available online: https://www.irena.org/Publications/2019/Apr/Global-energy-transformation-A-roadmap-to-2050-2019Edition (accessed on 4 January 2024).
  2. Aguirre-Mendoza, A.M.; Díaz-Mendoza, C.; Pasqualino, J. Renewable energy potential analysis in non-interconnected islands. Case study: Isla Grande, Corales del Rosario Archipelago, Colombia. Ecol. Eng. 2019, 130, 252–262. [Google Scholar] [CrossRef]
  3. Hernandez, R.R.; Hoffacker, M.K.; Murphy-Mariscal, M.L.; Wu, G.C.; Allen, M.F. Solar energy development impacts on land cover change and protected areas. Proc. Natl. Acad. Sci. USA 2015, 112, 13579–13584. [Google Scholar] [CrossRef]
  4. Dias, L.; Gouveia, J.P.; Lourenco, P.; Seixas, J. Interplay between the potential of photovoltaic systems and agricultural land use. Land Use Pol. 2019, 81, 725–735. [Google Scholar] [CrossRef]
  5. Choi, C.S.; Cagle, A.E.; Macknick, J.; Bloom, D.; Caplan, J.; Ravi, S. Effects of revegetation on soil physical and chemical properties in solar photovoltaic infrastructure. Front. Environ. Sci. 2020, 8, 140. [Google Scholar] [CrossRef]
  6. FAO. The State of the World’s Land and Water Resources for Food and Agriculture: Managing Systems at Risk; Food and Agriculture Organization: Rome, Italy, 2011; Available online: http://www.fao.org/3/i1688e/i1688e03.pdf (accessed on 28 February 2024).
  7. Wu, Z.Y.; Hou, A.P.; Chang, C.; Huang, X.; Shi, D.Q.; Wang, Z.F. Environmental impacts of large-scale CSP plants in Northwestern China. Environ. Sci.-Proc. Imp. 2014, 16, 2432–2441. [Google Scholar] [CrossRef] [PubMed]
  8. Liu, Y.; Zhang, R.Q.; Huang, Z.; Cheng, Z.; López-Vicente, M.; Ma, X.R.; Wu, G.L. Solar photovoltaic panels significantly promote vegetation recovery by modifying the soil surface microhabitats in an arid sandy ecosystem. Land Degrad. Dev. 2019, 30, 2177–2186. [Google Scholar] [CrossRef]
  9. Yousuf, H.; Koo, L.; Cho, Y.H. A review on the agri-voltaic and fence PV system. Curr. Photovolt. Res. 2022, 10, 116–120. [Google Scholar] [CrossRef]
  10. Barron-Gafford, G.A.; Pavao-Zuckerman, M.A.; Minor, R.L.; Sutter, L.F.; Barnett-Moreno, I.; Blackett, D.; Thompson, M.; Dimond, K.; Gerlak, A.K.; Nabhan Gary, P.; et al. Agrivoltaics provide mutual benefits across the food-energy-water nexus in drylands. Nat. Sustain. 2019, 2, 848–855. [Google Scholar] [CrossRef]
  11. Ravi, S.; Macknick, J.; Lobell, D.; Field, C.; Ganesan, K.; Jain, R.; Elchinger, M.; Stoltenberg, B. Colocation opportunities for large solar infrastructures and agriculture in drylands. Appl. Energy 2016, 165, 383–392. [Google Scholar] [CrossRef]
  12. Ya’acob, M.E.; Lu, L.; Zulkifli, S.A.; Roslan, N.; Wan Ahmad, W.F.H. Agrivoltaic approach in improving soil resistivity in large scale solar farms for energy sustainability. Appl. Energy 2023, 352, 121943. [Google Scholar] [CrossRef]
  13. Chen, N.; Wu, P.; Gao, Y.; Ma, X. Review on photovoltaic agriculture application and its potential on grape farms in Xinjiang, China. Adv. Sci. Eng. 2018, 10, 73–81. [Google Scholar] [CrossRef]
  14. Trommsdorff, M.; Dhal, I.S.; Özdemir, Ö.E.; Ketzer, D.; Weinberger, N.; Rosch, C. Chapter 5-Agrivoltaics: Solar power generation and food production. In Solar Energy Advancements in Agriculture and Food Production Systems; Gorjian, S., Campana, P.E., Eds.; Academic Press: Cambridge, MA, USA, 2022; pp. 159–210. [Google Scholar] [CrossRef]
  15. Al Mamun, M.A.; Dargusch, P.; Wadley, D.; Zulkarnain, N.A.; Aziz, A.A. A review of research on agrivoltaic systems. Renew. Sust. Energy Rev. 2022, 161, 112351. [Google Scholar] [CrossRef]
  16. Cossu, M.; Murgia, L.; Ledda, L.; Deligios, P.A.; Sirigu, A.; Chessa, F.; Pazzona, A. Solar radiation distribution inside a greenhouse with south-oriented photovoltaic roofs and effects on crop productivity. Appl. Energy 2014, 133, 89–100. [Google Scholar] [CrossRef]
  17. Weselek, A.; Bauerle, A.; Hartung, J.; Zikeli, S.; Lewandowski, I.; Högy, P. Agrivoltaic System Impacts on Microclimate and Yield of Different Crops within an Organic Crop Rotation in a Temperate Climate. Agron. Sustain. Dev. 2021, 41, 59. [Google Scholar] [CrossRef]
  18. Reasoner, M.; Ghosh, A. Agrivoltaic engineering and layout optimization approaches in the transition to renewable energy technologies: A review. Challenges 2022, 13, 43. [Google Scholar] [CrossRef]
  19. Ko, D.Y.; Chae, S.H.; Moon, H.W.; Kim, H.J.; Seong, J.; Lee, M.S.; Ku, K.M. Agrivoltaic farming insights: A case study on the cultivation and quality of kimchi cabbage and garlic. Agronomy 2023, 13, 2625. [Google Scholar] [CrossRef]
  20. Trommsdorff, M.; Hopf, M.; Hörnle, O.; Berwind, M.; Schindele, S.; Wydra, K. Can synergies in agriculture through an integration of solar energy reduce the cost of agrivoltaics? An economic analysis in apple farming. Appl. Energy 2023, 350, 121619. [Google Scholar] [CrossRef]
  21. Tian, Z.Q.; Zhang, Y.; Liu, X.; Chen, S.Y.; Liu, B.L.; Wu, G.H. Effects of Photovoltaic Power Station Construction on Terrestrial Environment: Retrospect and Prospect. Environ. Sci. 2024, 45, 239–247. (In Chinese) [Google Scholar] [CrossRef]
  22. Zhang, B.; Zhang, R.H.; Li, Y.; Wang, S.W.; Zhang, M.H.; Xing, F. Deploying photovoltaic arrays in degraded grasslands is a promising win-win strategy for promoting grassland restoration and resolving land use conflicts. J. Environ. Manag. 2024, 349, 119495. [Google Scholar] [CrossRef]
  23. Bai, Z.Y.; Jia, A.M.; Bai, Z.J.; Qu, S.M.; Zhang, M.; Kong, L.H.; Sun, R.H.; Wang, M.J. Photovoltaic panels have altered grassland plant biodiversity and soil microbial diversity. Front. Microbiol. 2022, 13, 1065899. [Google Scholar] [CrossRef]
  24. Li, C.; Liu, J.X.; Bao, J.B.; Wu, T.H.; Chai, B.F. Effect of light heterogeneity caused by photovoltaic panels on the plant-soil-microbial system in solar park. Land 2023, 12, 367. [Google Scholar] [CrossRef]
  25. Moscatelli, M.C.; Marabottini, R.; Massaccesi, L.; Marinari, S. Soil properties changes after seven years of ground mounted photovoltaic panels in Central Italy coastal area. Geoderma Reg. 2022, 29, e00500. [Google Scholar] [CrossRef]
  26. Lambert, Q.; Bischoff, A.; Cueff, S.; Cluchier, A.; Gros, R. Effects of solar park construction and solar panels on soil quality, microclimate, CO2 effluxes, and vegetation under a Mediterranean climate. Land Degrad. Dev. 2021, 32, 5190–5202. [Google Scholar] [CrossRef]
  27. Farooq, T.H.; Kumar, U.; Mo, J.; Shakoor, A.; Wang, J.; Rashid, M.H.U.; Tufail, M.A.; Chen, X.; Yan, W. Intercropping of peanut-tea enhances soil enzymatic activity and soil nutrient status at different soil profiles in subtropical Southern China. Plants 2021, 10, 881. [Google Scholar] [CrossRef]
  28. Zheng, J.K.; Zhang, G.; Zeng, Q.T.; Zhu, L. Mechanical characteristics of herbaceous roots and soil anti-scourability on the slope of dump yards. Sci. Soil Water Conserv. 2022, 20, 59–66. (In Chinese) [Google Scholar] [CrossRef]
  29. Lu, R.K. Analytical Method of Soil Agriculture Chemistry; China Agricultural Science and Technology Press: Beijing, China, 2000. (In Chinese) [Google Scholar]
  30. Guan, S.Y. Soil Enzyme and Its Research Method; China Agriculture Press: Beijing, China, 1986. (In Chinese) [Google Scholar]
  31. Mamehpour, N.; Rezapour, S.; Ghaemian, N. Quantitative assessment of soil quality indices for urban croplands in a calcareous semi-arid ecosystem. Geoderma 2021, 382, 114781. [Google Scholar] [CrossRef]
  32. Xu, H.D.; Yu, M.K.; Cheng, X.R. Abundant fungal and rare bacterial taxa jointly reveal soil nutrient cycling and multifunctionality in uneven-aged mixed plantations. Ecol. Indic. 2021, 129, 107932. [Google Scholar] [CrossRef]
  33. Wagner, M.; Lask, J.; Kiesel, A.; Lewandowski, I.; Weselek, A.; Högy, P.; Trommsdorff, M.; Schnaiker, M.A.; Bauerle, A. Agrivoltaics: The environmental impacts of combining food crop cultivation and solar energy generation. Agronomy 2023, 13, 299. [Google Scholar] [CrossRef]
  34. Cramer, M.D.; Barger, N.N.; Tschinkel, W.R. Edaphic properties enable facilitative and competitive interactions resulting in fairy circle formation. Ecography 2017, 40, 1210–1220. [Google Scholar] [CrossRef]
  35. Choi, C.S.; Macknick, J.; Li, Y.; Bloom, D.; McCall, J.; Ravi, S. Environmental co-benefits of maintaining native vegetation with solar photovoltaic infrastructure. Earth’s Future 2023, 11, e2023EF003542. [Google Scholar] [CrossRef]
  36. Adeh, E.H.; Selker, J.S.; Higgins, C.W. Remarkable agrivoltaic influence on soil moisture, micrometeorology and water-use efficiency. PLoS ONE 2018, 13, e0203256. [Google Scholar] [CrossRef]
  37. Armstrong, A.; Ostle, N.J.; Whitaker, J. Solar park microclimate and vegetation management effects on grassland carbon cycling. Environ. Res. Lett. 2016, 11, 074016. [Google Scholar] [CrossRef]
  38. Sanderman, J.; Hengl, T.; Fiske, G.J. Soil carbon debt of 12,000 years of human land use. Proc. Natl. Acad. Sci. USA 2017, 114, 9575–9580. [Google Scholar] [CrossRef] [PubMed]
  39. Bashagaluke, J.B.; Logah, V.; Opoku, A.; Sarkodie-Addo, J.; Quansah, C. Soil nutrient loss through erosion: Impact of different cropping systems and soil amendments in Ghana. PLoS ONE 2018, 13, e0208250. [Google Scholar] [CrossRef]
  40. Nie, S.A.; Zhou, P.; Ge, T.D.; Tong, L.C.; Xiao, H.A.; Wu, J.S.; Zhang, Y.Z. Quantifying rice (Oryza sativa L.) photo-assimilated carbon input into soil organic carbon pools following continuous 14C labeling. Environ. Sci. 2012, 33, 1346–1351. (In Chinese) [Google Scholar] [CrossRef]
  41. Yuan, Y.; Zhao, Z.Q.; Niu, S.Y.; Li, X.Z.; Wang, Y.Y.; Bai, Z.K. Reclamation promotes the succession of the soil and vegetation in opencast coal mine: A case study from Robinia pseudoacacia reclaimed forests, Pingshuo mine, China. Catena 2018, 165, 72–79. [Google Scholar] [CrossRef]
  42. Li, X.X.; Yang, Y.Q.; Zhong, Y.J.; Liao, H. Genetic improvement for nutrient efficient roots of leguminous crops adapted to acidic soils. J. South China Agric. Univ. 2019, 40, 186–194. (In Chinese) [Google Scholar] [CrossRef]
  43. Bai, X.; Dippold, M.A.; An, S.S.; Wang, B.R.; Zhang, H.X.; Loeppmann, S. Extracellular enzyme activity and stoichiometry: The effect of soil microbial element limitation during leaf litter decomposition. Ecol. Indic. 2021, 121, 107200. [Google Scholar] [CrossRef]
  44. Yang, T.; Zhang, H.R.; Zheng, C.H.; Wu, X.J.; Zhao, Y.T.; Li, X.Y.; Liu, H.Z.; Dong, L.; Lu, Z.C.; Zhou, J.X.; et al. Bacteria life-history strategies and the linkage of soil C-N-P stoichiometry to microbial resource limitation differed in karst and non-karst plantation forests in southwest China. Catena 2023, 231, 107341. [Google Scholar] [CrossRef]
  45. Wang, X.L.; Gong, X.W.; Li, X.Y.; Sun, S.T.; Dang, K.; Feng, B.L. Microbial nutrient limitation in rhizosphere soils of different food crop families: Evidence from ecoenzymatic stoichiometry. Land. Degrad. Dev. 2023, 34, 1019–1034. [Google Scholar] [CrossRef]
  46. Ge, L.F.; Li, J.; Liu, P.; Huang, Z.X.; Tan, S.B.; Wu, W.H.; Chen, T.; Huang, X.; Yi, K.J.; Chen, H.L. Effects of intercropping Pinto Peanut between Sisal lines on soil microbial community. Mol. Plant Breed. 2024, 22, 1613–1624. (In Chinese) [Google Scholar] [CrossRef]
  47. Jin, X.M.; Wang, Y.Y.; Liu, C.Y.; Long, X.M.; He, S.B. Effects on soil nutrients and bacterial communities of different cover crops in an organic kiwifruit orchard in the Guanzhong region of China. Acta Prataculturae Sin. 2022, 31, 53–63. (In Chinese) [Google Scholar] [CrossRef]
  48. Shen, F.Y.; Wu, W.G.; Li, Y.N.; Liu, D.Q.; Teng, Y. Study on microecological effects of root exudates of garden plants with different concentrations. Ecol. Environ. Sci. 2021, 30, 313–319. (In Chinese) [Google Scholar] [CrossRef]
  49. Leirpoll, M.E.; Nss, J.S.; Cavalett, O.; Dorber, M.; Hu, X.P.; Cherubini, F. Optimal combination of bioenergy and solar photovoltaic for renewable energy production on abandoned cropland. Renew. Energ. 2021, 168, 45–56. [Google Scholar] [CrossRef]
  50. Edouard, S.; Combes, D.; Van Iseghem, M.; Tin, M.N.W.; Escobar-Guti’errez, A.J. Increasing land productivity with agriphotovoltaics: Application to an alfalfa field. Appl. Energy 2023, 329, 120207. [Google Scholar] [CrossRef]
  51. Sturchio, M.A.; Kannenberg, S.A.; Knapp, A.K. Agrivoltaic arrays can maintain semi-arid grassland productivity and extend the seasonality of forage quality. Appl. Energy 2024, 356, 122418. [Google Scholar] [CrossRef]
  52. Harold, S. Photovoltaics alter plant productivity. Nat. Ecol. Evol. 2023, 7, 494. [Google Scholar] [CrossRef] [PubMed]
  53. Valle, B.; Simonneau, T.; Sourd, F.; Pechier, P.; Hamard, P.; Frisson, T.; Rychewaert, M.; Christophe, A. Increasing the total productivity of a land by combining mobile photovoltaic panels and food crops. Appl. Energy 2017, 206, 1495–1507. [Google Scholar] [CrossRef]
  54. Al-Agele, H.A.; Proctor, K.; Murthy, G.; Higgins, C. A case study of tomato (Solanum lycopersicon var. Legend) production and water productivity in agrivoltaic systems. Sustainability 2021, 13, 2850. [Google Scholar] [CrossRef]
  55. Rodriguez-Pastor, D.A.; Ildefonso-Sanchez, A.F.; Soltero, V.M.; Peralta, M.E.; Chacartegui, R. A new predictive model for the design and evaluation of bifacial photovoltaic plants under the influence of vegetation soils. J. Clean. Prod. 2023, 385, 135701. [Google Scholar] [CrossRef]
  56. Roy, S.; Ghosh, B. Land utilization performance of ground mounted photovoltaic power plants: A case study. Renew. Energ. 2017, 114, 1238–1246. [Google Scholar] [CrossRef]
Figure 1. Location of the PV, crop layout under photovoltaic panels, microclimate measuring stations in operation, and the soil sampling scheme. (a) The bracket parameters of PV in this study. (b) The photosynthetically active radiation (PAR) conditions in Gap, PV, and CK. (c) The soil temperature and moisture were continuously monitored by the temperature and humidity sensor at a 30 min frequency in August 2022. (d) The real scenes of this study. The three photos of Arachis hypogaea, Lolium perenne, and natural grassland were taken by the authors.
Agronomy 14 00584 g001
Figure 2. Results of the soil basic physicochemical properties responses to the agrivoltaic system. (a) soil pH; (b) electrical conductivity (EC); (c) water content (WC); (d) soil organic carbon (SOC). CK, native land; PV, under-panel area; Gap, between-panels area; Lp, Lolium perenne; Ah, Arachis hypogaea. Different lowercase letters indicate significant differences among PV-Lp, Gap-Lp, PV-Ah, Gap-Ah, and CK (p < 0.05). The WC was tested using the Kruskal–Wallis H test: p (WC) = 0.017. There was no significant difference among the treatments without the letters on the bar, the same as below.
Agronomy 14 00584 g002
Figure 3. Results of the soil total nutrient characteristics responses to the agrivoltaic system. (a) soil total nitrogen (TN); (b) total phosphorus (TP); (c) total potassium (TK); (d) C:N ratio (SOC:TN); (e) N:P ratio (TN:TP); (f) C:P ratio (SOC:TP). Different lowercase letters indicate significant differences among PV-Lp, Gap-Lp, PV-Ah, Gap-Ah, and CK (p < 0.05). The TP, SOC:TN, TN:TP, and SOC:TP were tested using the Kruskal–Wallis H test: p (TP) = 0.021, p (SOC:TN) = 0.525, p (TN:TP) = 0.144, and p (SOC:TP) = 0.112.
Agronomy 14 00584 g003
Figure 4. Results of the soil nitrate nitrogen (NO3−N), available phosphorus (AP), and available potassium (AK) responses to the agrivoltaic system. Different lowercase letters indicate significant differences of a certain factor among PV-Lp, Gap-Lp, PV-Ah, Gap-Ah, and CK (p < 0.05). The NO3−N, AP, and AK were tested using the Kruskal–Wallis H test: p (NO3−N) = 0.056, p (AP) = 0.016, and p (AK) = 0.017.
Agronomy 14 00584 g004
Figure 5. Results of the soil biochemical properties responses to the agrivoltaic system. (a) soil microbial biomass carbon (MBC), microbial biomass nitrogen (MBN), microbial biomass phosphorus (MBP); (b) sucrase (S), urease (U), phosphatase (P); (c) the ratios of MBC:MBN, MBN:MBP, MBC:MBP; (d) the ratios of S:U, S:P, U:P. Different lowercase letters indicate significant differences of a certain factor among PV-Lp, Gap-Lp, PV-Ah, Gap-Ah, and CK (p < 0.05). The MBC, MBP, S, P, MBC:MBN, MBN:MBP, MBC:MBP, S:U, and U:P were tested using the Kruskal–Wallis H test: p (MBC) = 0.009, p (MBP) = 0.009, p (S) = 0.242, p (P) = 0.024, p (MBC:MBN) = 0.118, p (MBN:MBP) = 0.012, p (MBC:MBP) = 0.009, p (S:U) = 0.012, and p (U:P) = 0.009.
Agronomy 14 00584 g005
Figure 6. The soil quality and multifunctionality. (a) The SQI and MFI variances among the different sites; (b) a general linear model of SQI and MFI. Different lowercase letters indicate significant differences of a certain factor among PV-Lp, Gap-Lp, PV-Ah, Gap-Ah, and CK (p < 0.05).
Agronomy 14 00584 g006
Disclaimer/Publisher’s Note: The statements, opinions and data contained in all publications are solely those of the individual author(s) and contributor(s) and not of MDPI and/or the editor(s). MDPI and/or the editor(s) disclaim responsibility for any injury to people or property resulting from any ideas, methods, instructions or products referred to in the content.

