Article

Effect of Different Herbicides on Development and Productivity of Sweet White Lupine (Lupinus albus L.)

by
Csaba Juhász
1,
Nóra Mendler-Drienyovszki
2,*,
Katalin Magyar-Tábori
2,
László Radócz
1 and
László Zsombik
2
1
Kerpely Kálmán Doctoral School of Crop Production and Horticultural Sciences, University of Debrecen, Böszörményi St. 138, 4032 Debrecen, Hungary
2
Research Institute of Nyíregyháza, Institutes for Agricultural Research and Educational Farm (IAREF), University of Debrecen, P.O. Box 12, 4400 Nyiregyhaza, Hungary
*
Author to whom correspondence should be addressed.
Agronomy 2024, 14(3), 488; https://doi.org/10.3390/agronomy14030488
Submission received: 1 February 2024 / Revised: 13 February 2024 / Accepted: 26 February 2024 / Published: 28 February 2024
(This article belongs to the Special Issue Herbicides and Chemical Control of Weeds)

Abstract

:
White lupine (Lupinus albus L.) is a well-known green manure crop in Hungary, but the production of seeds can be badly impacted by weeds. The sweet white lupine ‘Nelly’ was grown on acidic sandy soil, and experimental plots were treated with different herbicides. Flumioxazin (0.06 kg ha−1), pendimethalin (5 L ha−1), dimethenamid-P (1.4 L ha−1), pethoxamid (2 L ha−1), clomazone (0.2 L ha−1), metobromuron (3 L ha−1), and metribuzin (0.55 L ha−1) were applied pre-emergence (1–2 days after sowing). Imazamox was also tested and applied post-emergence (1 L ha−1) when some basal leaves were clearly distinct (BBCH 2.3). In this paper, the weed control efficiency and the phytotoxicity of herbicides applied to lupine are examined. Vegetation index datasets were collected 12 times using a manual device and 2 times using an unmanned aerial vehicle (UAV). The phytotoxicity caused by herbicides was visually assessed on several occasions throughout the breeding season. The frequency of weed occurrence per treatment was assessed. The harvested seed yields, in kg ha−1, were analyzed after the seeds were cleaned. The herbicides metribuzin and imazamox caused extensive damage to white lupine. While pendimethalin, dimethenamid-P, pethoxamid, and clomazone were outstanding in several measured indicators, the final ranking which summarizes all the variables showed that only the pethoxamid and clomazone treatments performed better than the control. Metribuzin and imazamox were highly phytotoxic to white lupine. In the future, it would be appropriate to integrate more post-emergence active substances into trials, and the pre-emergence herbicides involved in this study should be further tested.

1. Introduction

White lupine (Lupinus albus L.) is a leguminous crop (Fabaceae) belonging to the genus Lupinus, which contains about 200 species [1,2]. Lupinus albus (white lupine), Lupinus luteus (yellow lupine), Lupinus angustifolius (blue or narrow-leafed lupine), and Lupinus mutabilis (pearl lupine) are the most economically important and cultivated lupine species worldwide [3].
Lupine seeds have high nutrient content (protein, carbohydrates, dietary fiber, calcium, potassium, phosphorus, magnesium, iron, zinc, and vitamin C) [4]. Its glycemic index and calories are lower compared to other legumes, and it is a good source of polyphenols and zeaxanthin and contains all the essential amino acids; however, the seeds of wild lupine species have a bitter taste due to their high alkaloid content [5,6]. For this reason, in the 1920s, breeding companies focused on selecting varieties with low alkaloid contents, and as a result, recently cultivated sweet white lupine varieties were developed.
Lupines have a high nitrogen fixation ability [7], and they are extremely adaptable to temperate and cold climates, low-fertility soils, and extreme conditions, making them ideal for low-input agriculture [5]. In addition to being a valuable source of protein, lupine is a valuable crop for sustainable agricultural practices as it increases the nutrient supply capacity of the soil with significant nitrogen fixation and improves the condition of the soil when used as green manure. Lupine can also be used as a silage crop [8,9], and white lupine can also be grown for human consumption or as a fodder crop. In addition, new research suggests that white lupine may be a raw material for medicinal uses due to the bioactive compounds with antidiabetic effects found in the seeds [10]. In Hungary, where white lupine is a well-known but “forgotten crop”, only 200 tons of seed yield was produced on 190 ha in 2021, compared to 1,384,963 tons on 984,191 ha worldwide [11]. The low yield results in Hungary do not reflect the genetic potential of the crop, because it is typically cultivated in extremely unfavorable environments, mainly on acidic sandy soils [12]. Due to the lack of knowledge about its nutritional value, white lupine is commonly viewed as an unimportant crop and is rarely consumed [13,14]. The importance of white lupine may yet increase as interest in plant-based proteins is growing, and species that can enrich the soil with organic nitrogen may come to the fore [5,13,15]. Sweet white lupine may have an additional indirect positive impact on human nutrition, as animals that are fed the lupine produce milk with a higher proportion of unsaturated fatty acids and a lower proportion of saturated fatty acids, in comparison to the milk of animals that are fed soybean (Glycine max L. Merr.) [16]. Lupine species native to Europe are a viable alternative to soybeans in the future due to their high protein content, positive health benefits, sustainable cultivation, and consumer acceptance [13].
Among the possible risks—pathogens, pests, and weeds—the weeds have the strongest effect on white lupine cultivation, especially when it is grown for seed yield. In addition to its high herbicide sensitivity, white lupine has a long growing season, and the crop’s ability to enrich the soil with nitrogen works against the yield by promoting the growth of weeds. This risk is further exacerbated by limited possibilities of mechanical weed control [17].
Lupine’s competitiveness with weeds is low due to its slow growth, which allows the weeds to overtake it, especially on sandy soils [18,19], and in the case of white lupine, when sown early [20].
Weeds have a significant impact on crop growth and yield. They compete with crops for essential resources (nutrients, moisture, light, or CO2) [14], and can also affect the morpho-physiological parameters, such as plant height, dry matter accumulation, leaf area index, and chlorophyll content. As a result, the weeds can reduce plant growth and ultimately cause yield losses ranging from 10 to 100% in lupine crops [21]. Moreover, a large quantity of above-ground weed biomass makes harvesting difficult and contaminates seed yield.
The lack of registered herbicides for weed control in a lupine field is a significant problem for its agricultural practice. Without effective weed control, growing lupine is not economically viable [22].
In a study published in 1995, it was reported that the Canadian authority was considering the registration of metobromuron for sweet white lupine [16], and some other herbicides were tested in field experiments, worldwide. Sencor (metribuzin) was applied to different lupine varieties in a mixture of Brodal (diflufenican) and Simazine (simazine) herbicides [23]. The efficiency of flumioxazin also was evaluated in lupine through pre- and post-emergence application in Alabama during the years 2007 and 2008 [24].
The main problem with previously approved herbicides (metobromuron, trifluralin, diuron, metolachlor, diclofop-methyl) was their short-term effect (30–60 days). Several active substances, including pendimethalin and clomazone, were tested for pre-emergent use. In addition, the lack of effective post-emergent treatment was also an issue [25].
Recently, the active ingredients and treatment combinations dimethenamid-P, pendimethalin, dimethenamid-P plus pendimethalin, dimethenamid-P plus terbuthylazine, pethoxamid, flumioxazin, clomazone, metolachlor, and metolachlor plus terbuthylazine have been recommended for weed control in white lupine [26].
According to the latest research, the pre-emergence application of herbicide combinations (pendimethalin + clomazone, pendimethalin + terbuthylazine, and clomazone + metribuzin), and post-emergence application of imazamox may be promising solutions for weed control in lupine [27]. Previously, imazamox’s active substance has been used successfully in other leguminous plants, such as alfalfa (Medicago sativa L.) [28].
The availability of plant protection chemicals for lupine and other crops in Austria, Belgium, the Czech Republic, Germany, the Netherlands, Hungary, Poland, and Slovakia was examined [29]. It was reported that there are insufficient products available and no universally available active ingredient for lupine weed control, which causes further difficulties in lupine cultivation [29].
The effect of plant protection intervention is usually monitored by traditional methods, but new methods are constantly being tested to increase efficiency and accuracy. Many spectral reflectance measurements and vegetation indices have revealed a strong relationship between plant health and yield increase [30]. It was found that vegetation indices recorded by unmanned air vehicles (UAVs) provided more accurate results of herbicide damage than visual assessment [31]. The conventional methods for determining herbicide damage such as measuring plant height in the field or shoot dry weight are labor- and time-consuming and cannot provide information in sufficient time [32]. The non-destructive evaluation of herbicide effects could help with the integrated management of weed control [33]. This approach to precision agriculture is enabled by new technological practices based on UAVs, including providing farmers with information on the health of their crops and the spraying of pesticides [34]. The application of artificial intelligence in weed control may increase agricultural productivity, optimize the use of herbicides, and promote sustainable agricultural practices. Internet of Things (IoT) devices and cameras, along with terrestrial vehicles, complement UAVs by monitoring and automating weed removal processes [35]. For instance, an IoT-based automated system was developed that can quickly, efficiently, and with high accuracy identify and distinguish between monocotyledonous, dicotyledonous, and smaller weeds, using 350 images [36]. The normalized difference vegetation index (NDVI) is a commonly used technology within the agricultural industry to measure plant health with the GreenSeeker 505 active remote sensor [37].
In recent years, there have been very few published papers on lupine weed control [16,20,23,24,25,26,27,28]. Based on the results of these papers, our research experiments included those active substances that they have tested, and we considered them as prospects in our region. In addition, imazamox (included in our experiment) was preliminarily tested only in alfalfa. Moreover, the safety of lupine seed production can be facilitated using appropriate herbicides and the introduction of different precision tools; thus, we tested these methods. The main aim of our research is to investigate the tolerance of white lupine to some herbicides and to explore the potential benefits of herbicide application. The additional objective of our study was to examine the effect of certain herbicides on the yield of white lupine and to observe the effects of herbicides using both a UAV and manual devices. The novel aspect of our work (i) is the investigation of active ingredients in special environmental conditions (e.g., acidic sandy soil, moderate continental climate), including imazamox, that have not been tested in lupine before. Furthermore, (ii) comparison and analysis of the applicability of precision methods in the evaluation of weed management practices was undertaken. (iii) We explored connections between the vegetation index and traits related both to the responses of lupine to herbicides and the efficiency of weed control.

2. Materials and Methods

2.1. Research Field Location, Plant Material, and Experiment Setting

The experiment was carried out in 2022 in the research field of the Research Institute of Nyíregyháza, Institutes for Agricultural Research and Educational Farm, University of Debrecen, Hungary (47°97745′ N, 21°70446′ E) on humic sandy soil (Table 1).
White sweet lupine (Lupinus albus L.) variety ‘Nelly’ was used in the experiment. ‘Nelly’ (developed by the Research Institute of Nyíregyháza) was registered on the National Variety list in 1985. The stem is branched, and it is 70–100 cm high. This variety has good drought tolerance and may increase the nitrogen content of soil by 120–180 kg per hectare.
The raw protein content of the seed is 45%, the total alkaloid content is ≤0.1%, and it contains 9% oil and 18% fiber. Its B2, B3, and B6 content are also significant [38]. The seed is of great importance as the primary raw material of some foods to replace soya products.
The previous crop in this research field rotation was corn. The sowing rate of lupine was 200 kg ha−1, which was determined based on the measured 1000-seed weight (250 g), resulting in a plant density of approximately 800,000 plants per hectare. 1.7 × 5 m sized plots were sown in a randomized complete block design (RCBD) in four replications. Untreated lupine seeds were sown on 7 April. Fertilizers were not applied at all.

2.2. Herbicide Treatments

Eight treatments were tested in four replications: seven active substances were applied as pre-emergence treatments (flumioxazin (T1), pendimethalin (T2), dimethenamid-P (T3), pethoxamid (T4), clomazone (T5), metobromuron (T6), and metribuzin (T7)) and one was applied as a post-emergence treatment (imazamox (T8)) (Table 2). The selection of these active ingredients was based on the available literature. The pre-emergence treatments were applied 1–2 days after sowing. The post-emergence treatment was applied on 9 May, when the bases of some basal leaves were clearly distinct (BBCH 2.3). A Stihl brand Sg 71 back sprayer (Andreas Stihl AG & Co. KG, Waiblingen, Germany) was used to spray on the active substances, delivered with 300 L ha−1 water. The BBCH scale from GRDC was used to track the developmental phases of the lupine.

2.3. Vegetation Index (VI) Datasets Collected by Manual Device and UAV

NDVI datasets were collected 12 times with the Trimble GreenSeeker HCS-100 (Trimble Inc., Sunnyvale, CA, USA) manual device. The range of these vegetation indices is from 0 to 1; for example, an NDVI value above 0.82—measured in control plots—is considered to indicate a good health status in Andean lupine (Lupinus mutabilis Sweet.) [39]. Additionally, normalized difference vegetation index (NDVI), green normalized difference vegetation index (GNDVI), and enhanced normalized difference vegetation index (ENDVI) datasets were collected using the Phantom 4 pro-UAV’s six-channel camera system (SZ DJI Technology Co., Ltd., Shenzhen, China). Measurements were made at BBCH 3.4 (open flower phase) and BBCH 4.2 (50% of the space between the septa is occupied by seeds) on the 2 and 24 June, respectively. These dates were very close to dates of manual measurements.

2.4. Visual Assessment of Damage Caused by Herbicides

Monitoring of the phytotoxicity of herbicides began before the application of the post-emergence active substance at the beginning of May (BBCH 2: elongation of stems) and lasted until the beginning of July (BBCH 4.7: the pods are turning khaki-colored). During the visual assessment of herbicide phytotoxicity, we observed the proportion of plants in the plots showing symptoms and the extent of damage to the plants according to the herbicide test methodology reported by Dancza [40]. According to the methodology, a % value was defined for the field assessment, which was later converted to individual scale values to be analyzed by the statistical software (Jamovi free software (version 2.3.21) [41]. A scale of 1 to 9 was used, where 1 indicates symptom-free and 9 indicates completely dead plants.

2.5. Identification of Weed Species and Assessing the Number of Weeds per Square Meter

Weeds found in the plots were documented five times during the growing season. Using the sampling frame (0.5 × 0.5 m quadrant), the number of weeds was determined once per 0.25 m−2 of each plot. In the graphical representation, the number of weeds is shown per unit area, while in the subsequent sections, it is shown per square meter. Determination of the number of weeds lasted until BBCH stage 3.9, when the lupine became podded and covered the soil due to the large leaf mass. The weed species of the experimental area were ranked. The most frequent weed was ragweed (Ambrosia artemisiifolia L.), followed by lady’s thumb (Persicaria maculosa GRAY.), lamb’s quarters (Chenopodium album L.), saltmarsh bulrush (Bolboschoenus maritimus L.), wild radish (Raphanus raphanistrum L.), hemp (Cannabis sativa L.), wild oat (Avena fatua L.).
Common ragweed and lamb’s quarters are the most aggressive weeds that cause the most problems in Hungary [42], while lamb’s quarters are the third most important [43].

2.6. Harvesting and Seed-Cleaning Processes

On 20 July, ‘Reglone air’ (diquat dibromide, 1.5 L ha−1) was used for desiccation to stabilize the harvest. The lupine was harvested in early August using the Zürn 130 Se plot combine (Zürn Harvesting GmbH & Co. KG, Waldenburg, Germany). After harvesting, the seeds were dried in a greenhouse to avoid fungal diseases. A Westrup Kamas laboratory air screen cleaner was used to clean the seeds. The adjustment of screening for sizes and shapes were as follows, top 12 mm round, bottom 4.25 mm oval. The net yield (kg) was calculated after cleaning: the amount of total yield (kg) was reduced by the amount of waste (kg) removed during cleaning (weed seeds, dry and green plant residues).

2.7. Weather Datasets from the Deployed Meteorological Station

Since 1932, the Research Institute of Nyíregyháza has been collecting datasets on the precipitation and average temperatures on its arable land. The crop year of 2022 was extremely dry in Hungary, which caused serious difficulties in crop production. Figure 1 shows the total precipitation and the average temperature for the period from the beginning of March to the end of July. The amount of precipitation was only 125 mm during the growing season, which was the lowest in the last 50 years.

2.8. Rainfall and Temperature Datasets for the Months of the Growing Season

In 2022, the lowest rainfall was in May, when the plants were in their pre-flowering and flowering stages (Table 3). The sweet white lupine is the most drought-sensitive of the three species [44]. There was not such a big difference between the average temperature results.

2.9. Statistical Analysis of the Datasets

Data for the vegetation index (NDVI) were collected manually 12 times during the whole growing period (every 7–10 days), whereas NDVI aerial, GNDVI, and ENDVI data were collected from 2 measurement times (DAS 57 and 79). Phytotoxicity was also monitored throughout almost the entire growing season (9 times), whereas the number of weeds per area unit was recorded 5 times. After seed cleaning, the net yield data and seed contamination data were recorded. To clarify the main effect of herbicides on observed variables using the average of all collection times, the statistical analysis was carried out using One-Way Analysis of Variance (ANOVA) followed by a Tukey Post Hoc Test (p < 0.05) with SPSS software, version 22.0 (SPSS®) for Windows and Jamovi free software (version 2.3.21). Further statistical analysis was performed to visualize graphically the box plots using OriginPro 2018 software. These box plots showing the mean, median, and distribution of data are in the Supplementary Materials.
Correlation analyses (Spearman’s rho) were performed between variable means (NDVI manual, NDVI aerial, seed yield, phytotoxicity, weed number, and seed contamination) to reveal relationships between them using Jamovi free software (version 2.3.21). Pearson correlation analysis was performed between manual and aerial NDVI results with OriginPro 2018 software.
Table S1 shows the test results, which were analyzed with Tukey at level p < 0.05. The averaged results of the measured indicators were used to rank the treatments, including the control (Table S2).

3. Results

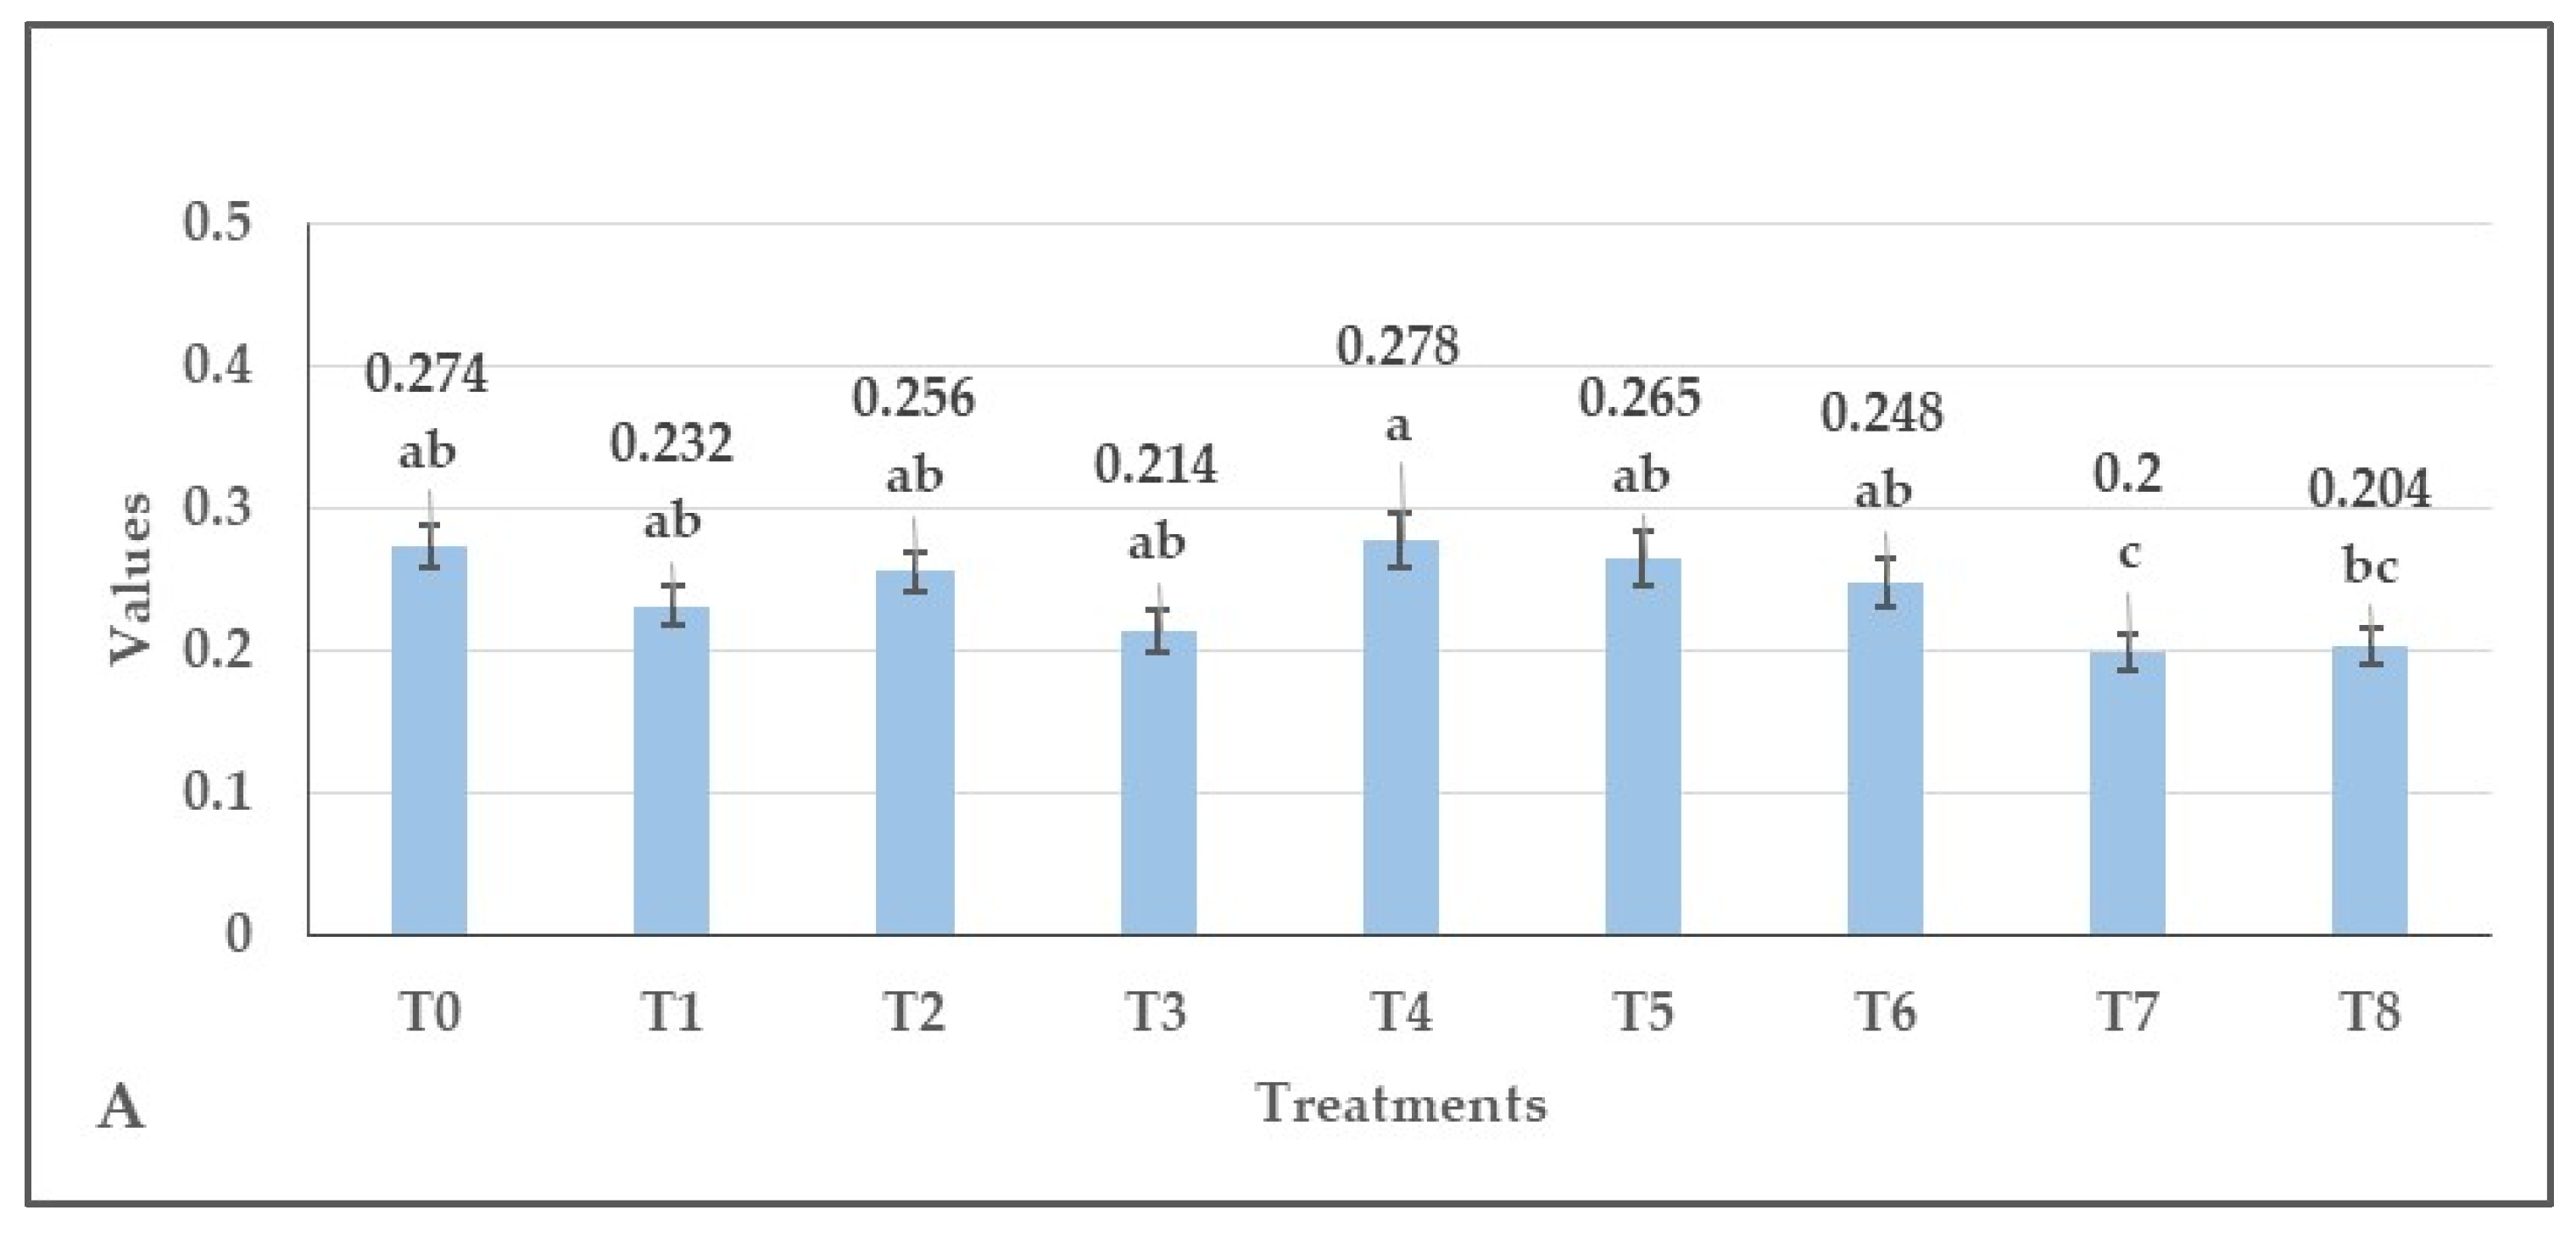
3.1. Effect of Herbicides on the Normalized Difference Vegetation Index (NDVI) Measured by GreenSeeker HCS-100 Manually

The herbicide treatments resulted in significant differences between NDVI values (F(8, 175) = 11.9, p < 0.001). The lowest results were obtained on plots treated by metribuzin, which significantly differed from those measured on plots treated by other chemicals and the control (Figure 2). Similarly, we also measured very low results after T8 (imazamox) treatment, which were significantly lower than those measured in plots treated by clomazone, pendimethalin, pethoxamid, and metobromuron, or in control plots.
The NDVI values of plants treated with flumioxazin (T1), pendimethalin (T2), dimethenamid-P (T3), pethoxamid (T4), clomazone (T5), and metobromuron (T6) did not differ significantly from the NDVI values of control plants. Box plots of the dataset show the data distribution and significant differences at three levels in Figure S1.

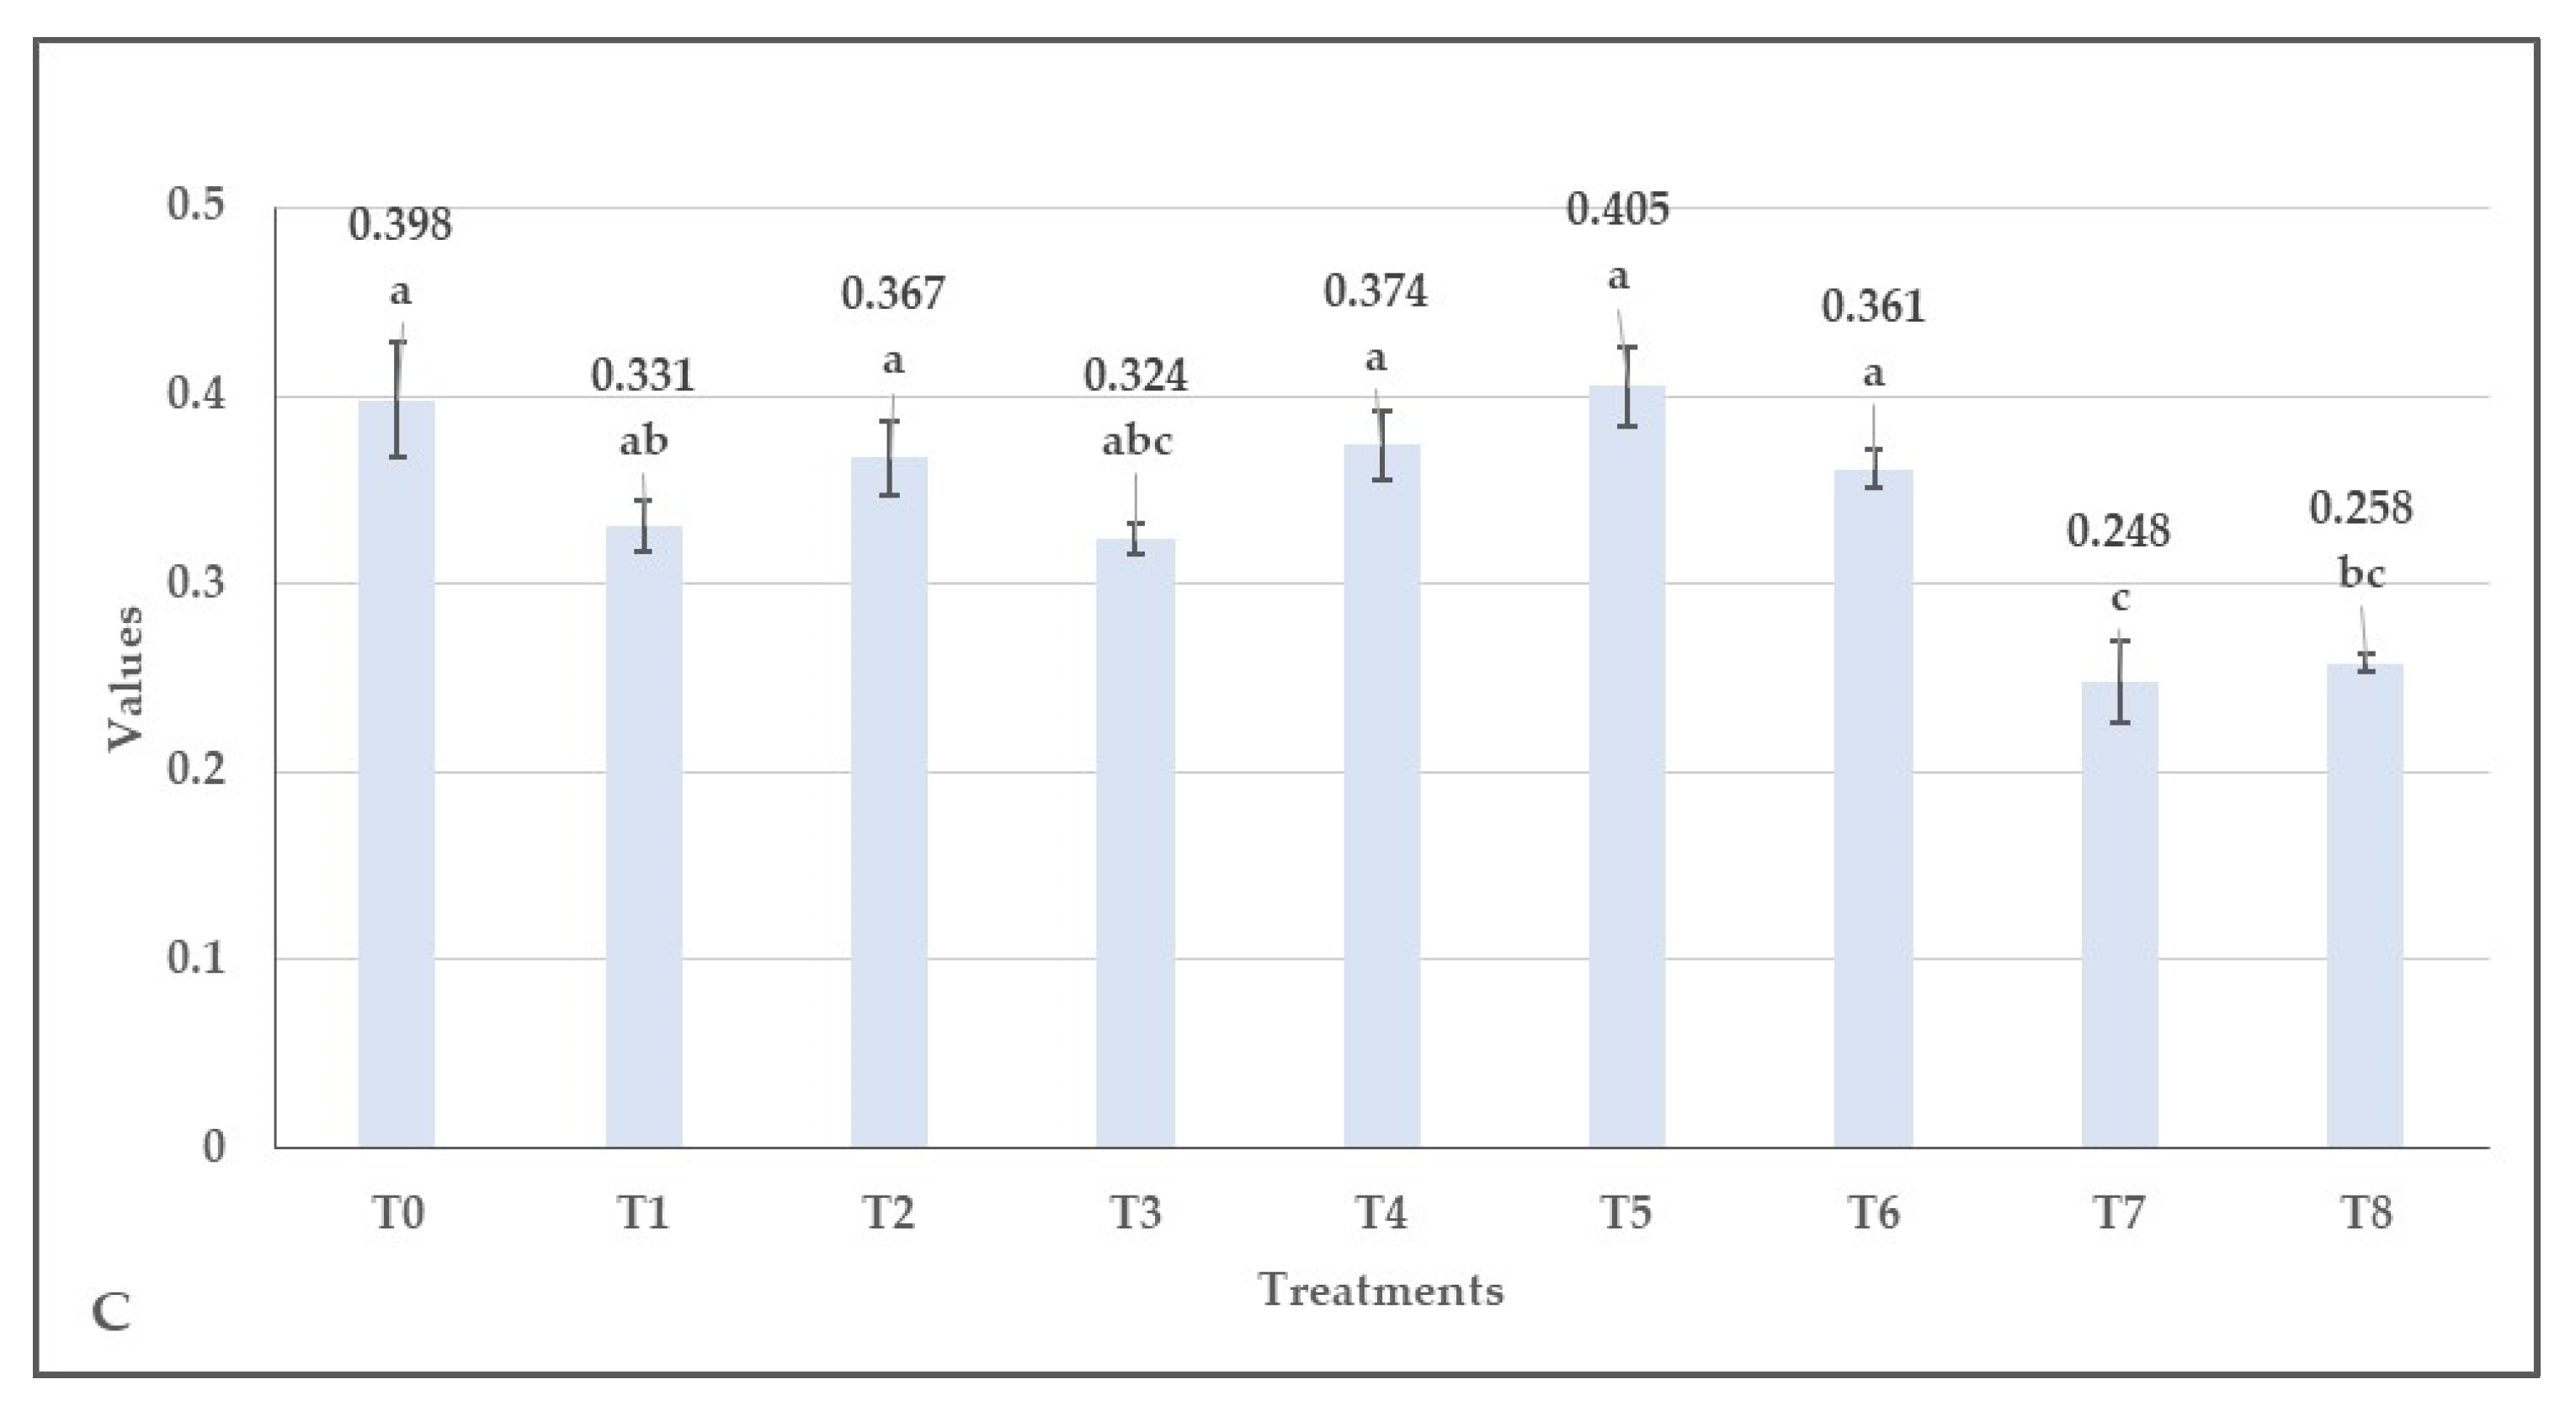
3.2. Effect of Herbicides on the Values of Normalized Difference Vegetation Index (NDVI), Green Normalized Difference Vegetation Index (GNDVI), Enhanced Normalized Difference Vegetation Index (ENDVI) Obtained from Aerially Recorded Datasets

Based on the results from the spectral camera-equipped UAV (Figure 3A–C), we detected significant differences in the NDVI (F(8, 26.2) = 3.53, p < 0.007) and ENDVI values (F(8, 25.6) = 19.7, p < 0.001) between herbicide treatments. The ENDVI data were determined by reflection results of several light wavelengths; therefore, it gives more sensitive results [45]. We did not detect any significant differences between the treatments in terms of GNDVI data (F(8, 26.1) = 1.42, p < 0.236). However, for each vegetation index, the lowest values were shown by the treatments with metribuzin (T7) and imazamox (T8). The highest vegetation index values were obtained with pethoxamid (T4) and clomazone (T5) treatments and in the control plot (T0). Box plots of the dataset show the data distribution in Figure S2.

3.3. The Changes in the Normalized Difference Vegetation Indices over Time

During the growing season, manual NDVI measurements were performed regularly (Figure 4). The manually measured NDVI values and their changes on the plots that did not suffer serious or any herbicide damage (from T1 to T6) were very similar to those observed in the control plot. However, on the plots where serious damage was detected, the NDVI values either suddenly decreased (T8) (post-emergence application) or showed significantly lower values permanently (T7) (pre-emergence application), compared to the other treatments and controls. A slight and slow increase in values could be seen for both treatments. However, at the end of the growing period, decreased NDVI values were measured, due to senescence. Anyway, all NDVI values were below 0.8, suggesting that plants may have suffered from drought.
In contrast, the NDVI, GNDVI, and ENDVI measurements were made only two times. Results obtained on 2 June and 24 June (DAS 57 and 79, respectively) did not differ significantly from each other (NDVI: F(1, 69.6) = 0.218, p < 0.642; GNDVI: F(1, 65.9) = 3.43, p < 0.068; and ENDVI: F(1, 68.3) = 1.58, p < 0.213 ) in the average of all herbicide treatments (Figure 5). Box plots of the dataset show the data distribution in Figure S3.

3.4. Phytotoxicity of Herbicides Evaluated Visually

During the growing season, the metribuzin treatment caused the most severe symptoms in white lupine. Figure 6 shows that phytotoxicity scores of metribuzin (T7) were significantly higher compared to the other treatments (F(8, 315) = 99.5, p < 0.001). Similarly, phytotoxicity scores in the imazamox (T8)-treated plots were significantly higher than the majority of treatments, although it had lower phytotoxicity scores and less damage than metribuzin treatment (T7). The other treatments caused very minimal symptoms, or no symptoms could be detected at all (Figure 6). Box plots of the dataset show the data distribution and significant differences at three levels in Figure S4.
Phytotoxicity monitoring was undertaken between 3 May and 7 July. Although the flumioxazin-treated plants were smaller and lighter earlier (on 18 May), they regenerated later (Figure 7A). The plants in the flumioxazin-treated plots exhibited a robust and healthy lupine canopy on 1 June. Figure 7B shows the most severe symptoms, caused by metribuzin, which initially manifested as leaf-scorch symptoms and resulted in dwarfism typical of lupines treated with metribuzin. The most striking feature of these plots is the large-scale death of plant populations. The plants grown in plots treated with imazamox were yellowish and smaller than healthy lupines, as shown in Figure 7C. The other treatments caused either minimal symptoms or no symptoms at all.

3.5. Herbicide Efficacy against Weeds

Based on the weed survey results, metobromuron (T6) was the least effective against weeds in the experimental area (Figure 8); however, it did not differ from the control (T0), pethoxamid (T4), clomazone (T5), and imazamox (T8). The active substance dimethenamid-P (T3) was the most effective for weed suppression, followed by the metribuzin (T7) and then the flumioxazin (T1) treatments, resulting in significantly lower results than the majority of other treatments (F(8, 68.5) = 25.4, p < 0.001). Box plots of the dataset show the data distribution and significant differences at three levels in Figure S5.
Photographs of the plant stand were taken 92 days after sowing. Figure 9A shows a dimethenamid-P-treated plot, while Figure 9B shows a control plot with a high weed density.

3.6. The Effect of Different Herbicides on the Yields of the White Lupine

Although the highest phytotoxicity score was measured in the metribuzin (T7)-treated plots, the lowest seed yield was obtained from the imazamox (T8) plots (Figure 10). Seed yields of imazamox (T8) were significantly lower than those of other treatments and the control, except for metribuzin (T7) (F(8, 11.1) = 17, p < 0.001). The highest mean seed yield (822 kg ha−1) was harvested from plots of the pendimethalin (T2) treatment, whereas the lowest yield (92 kg ha−1) was obtained from T8-treated plots. Box plots of the dataset show the data distribution and significant differences at three levels in Figure S6.

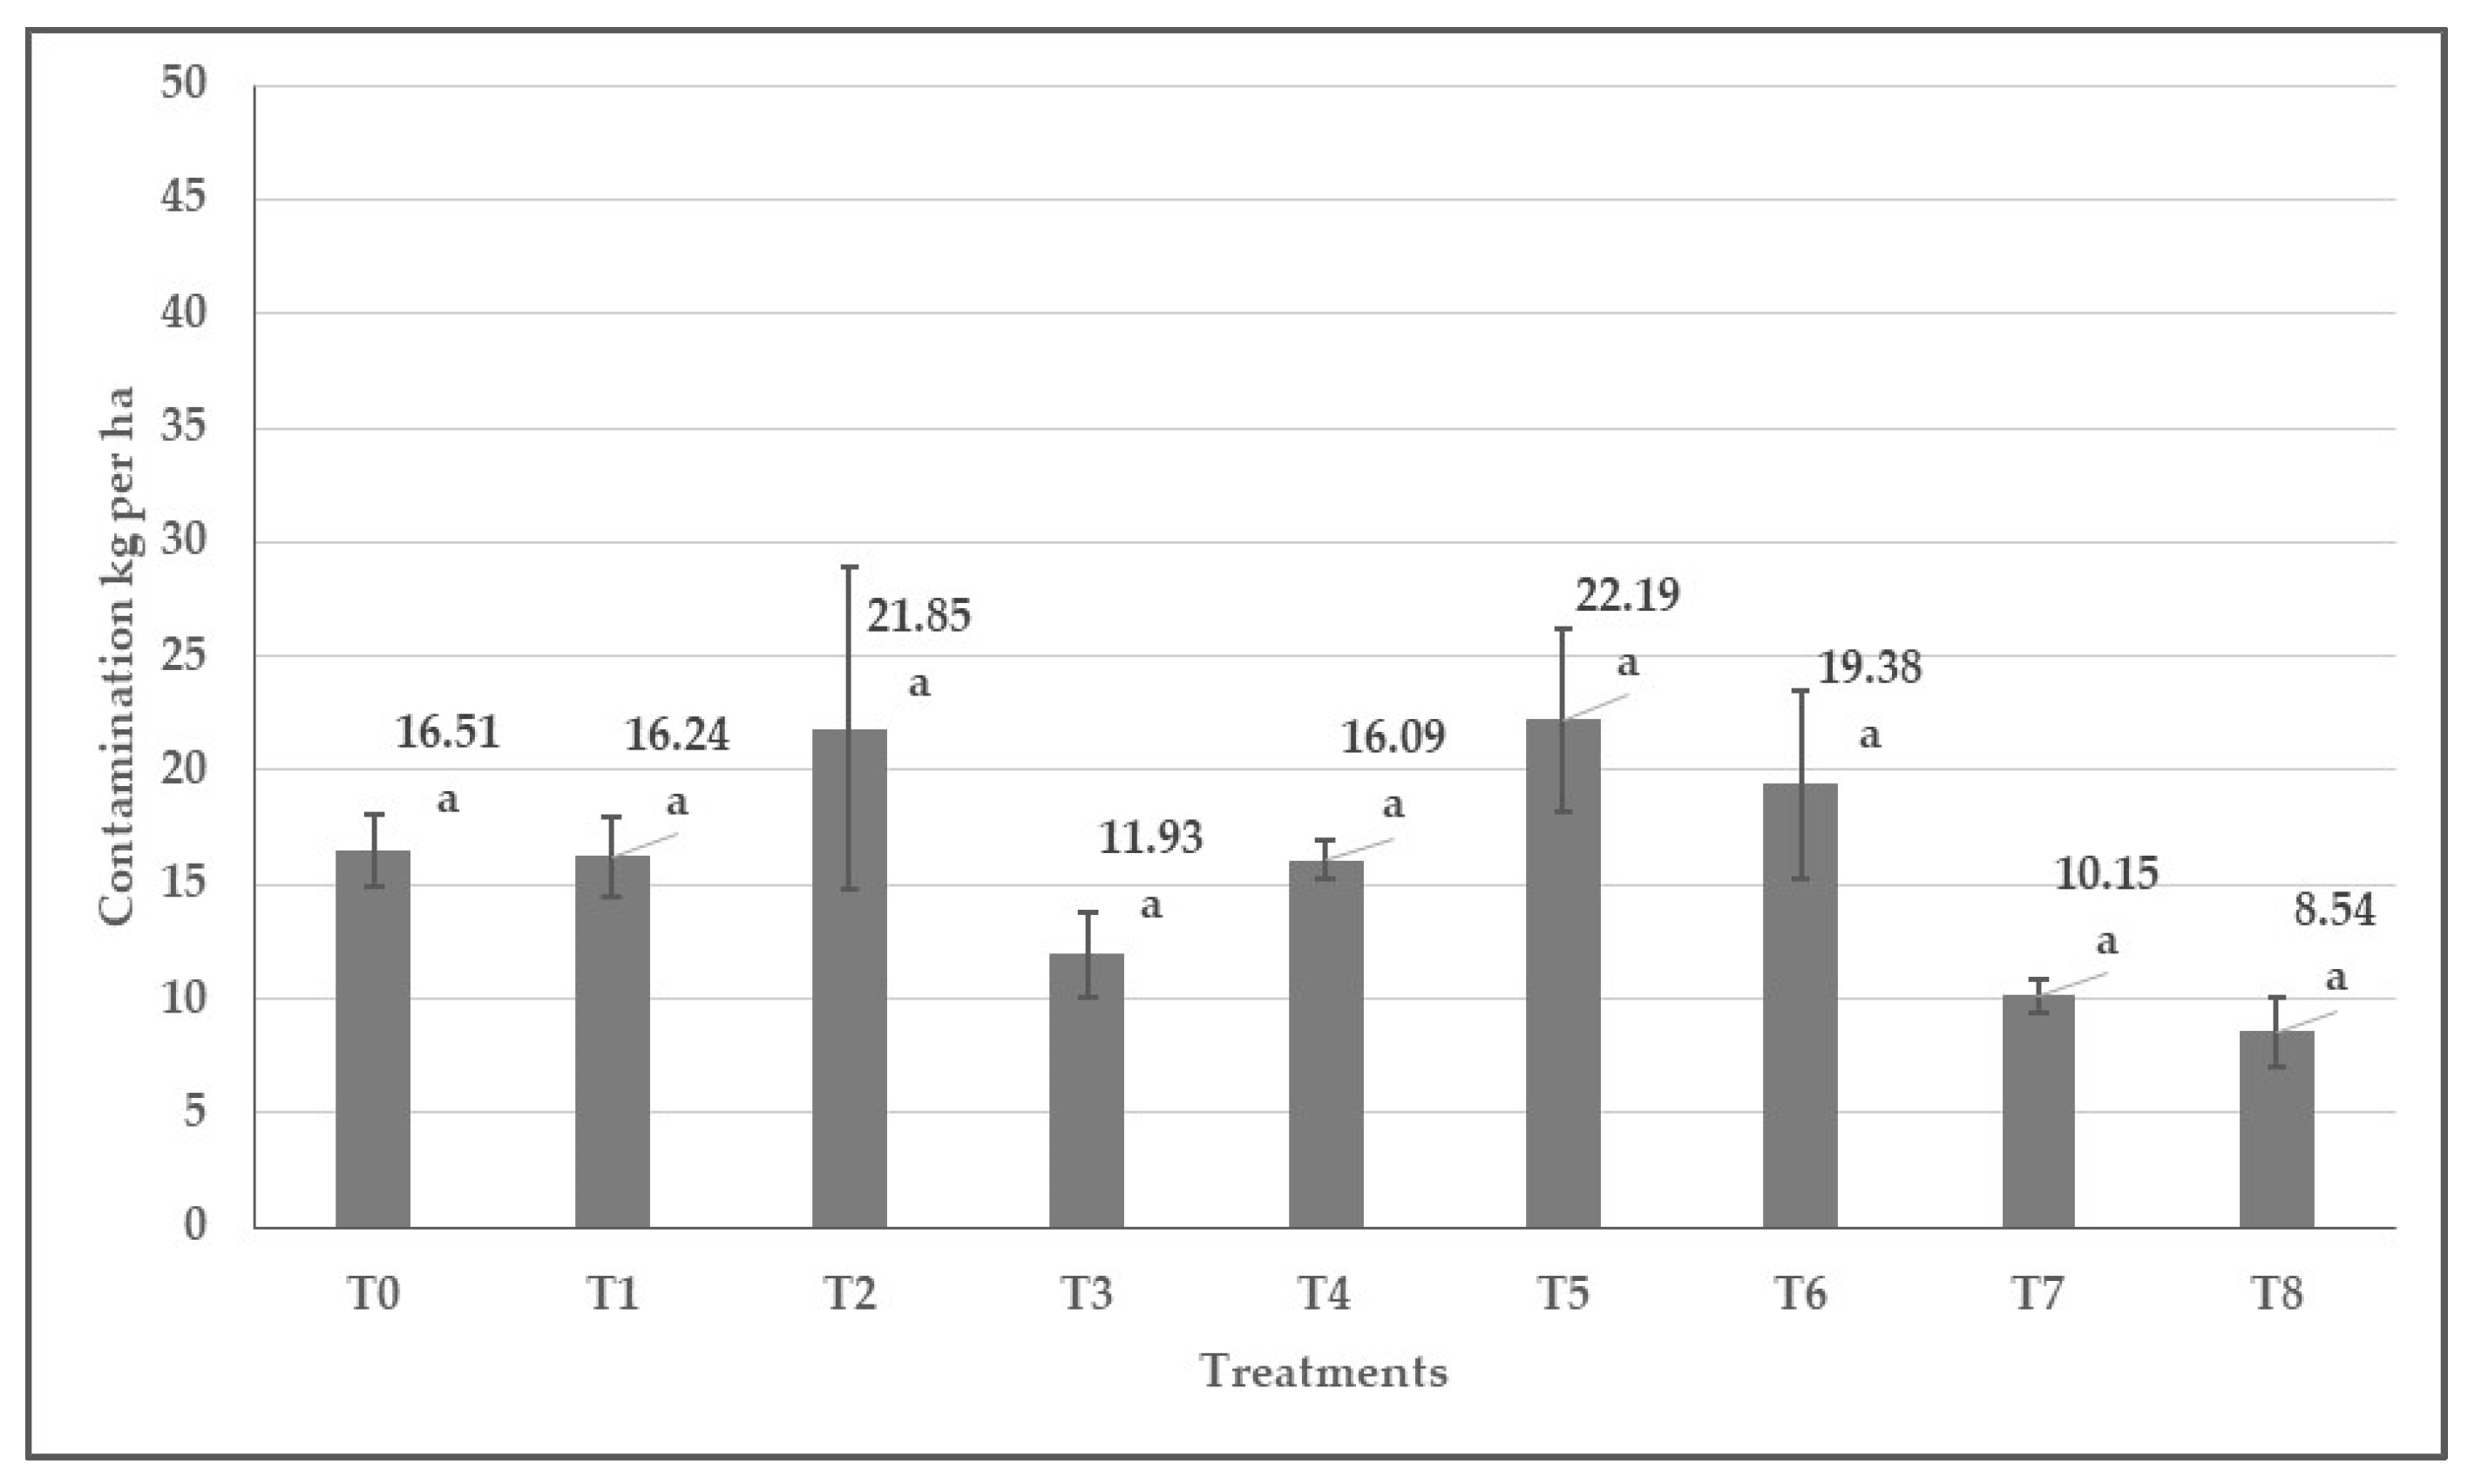
3.7. The Impact of Herbicide Treatments on the Quantity of Seed Yield Contamination

Figure 11 illustrates the seed yield contamination obtained after treatments (calculated into kg ha−1). The highest seed contamination was separated from the yield of clomazone-treated (T5) plots (22.2 kg ha−1), although one plot in the pendimethalin (T2) treatment had exceptionally high plant contamination (42.3 kg ha−1). The least contamination was obtained in the seed yield harvested from the T8 treatment (7.5 kg ha−1), whereas the seed yield from control plots contained 16.5 kg ha−1 contamination. Box plots of the dataset show the data distribution in Figure S7.

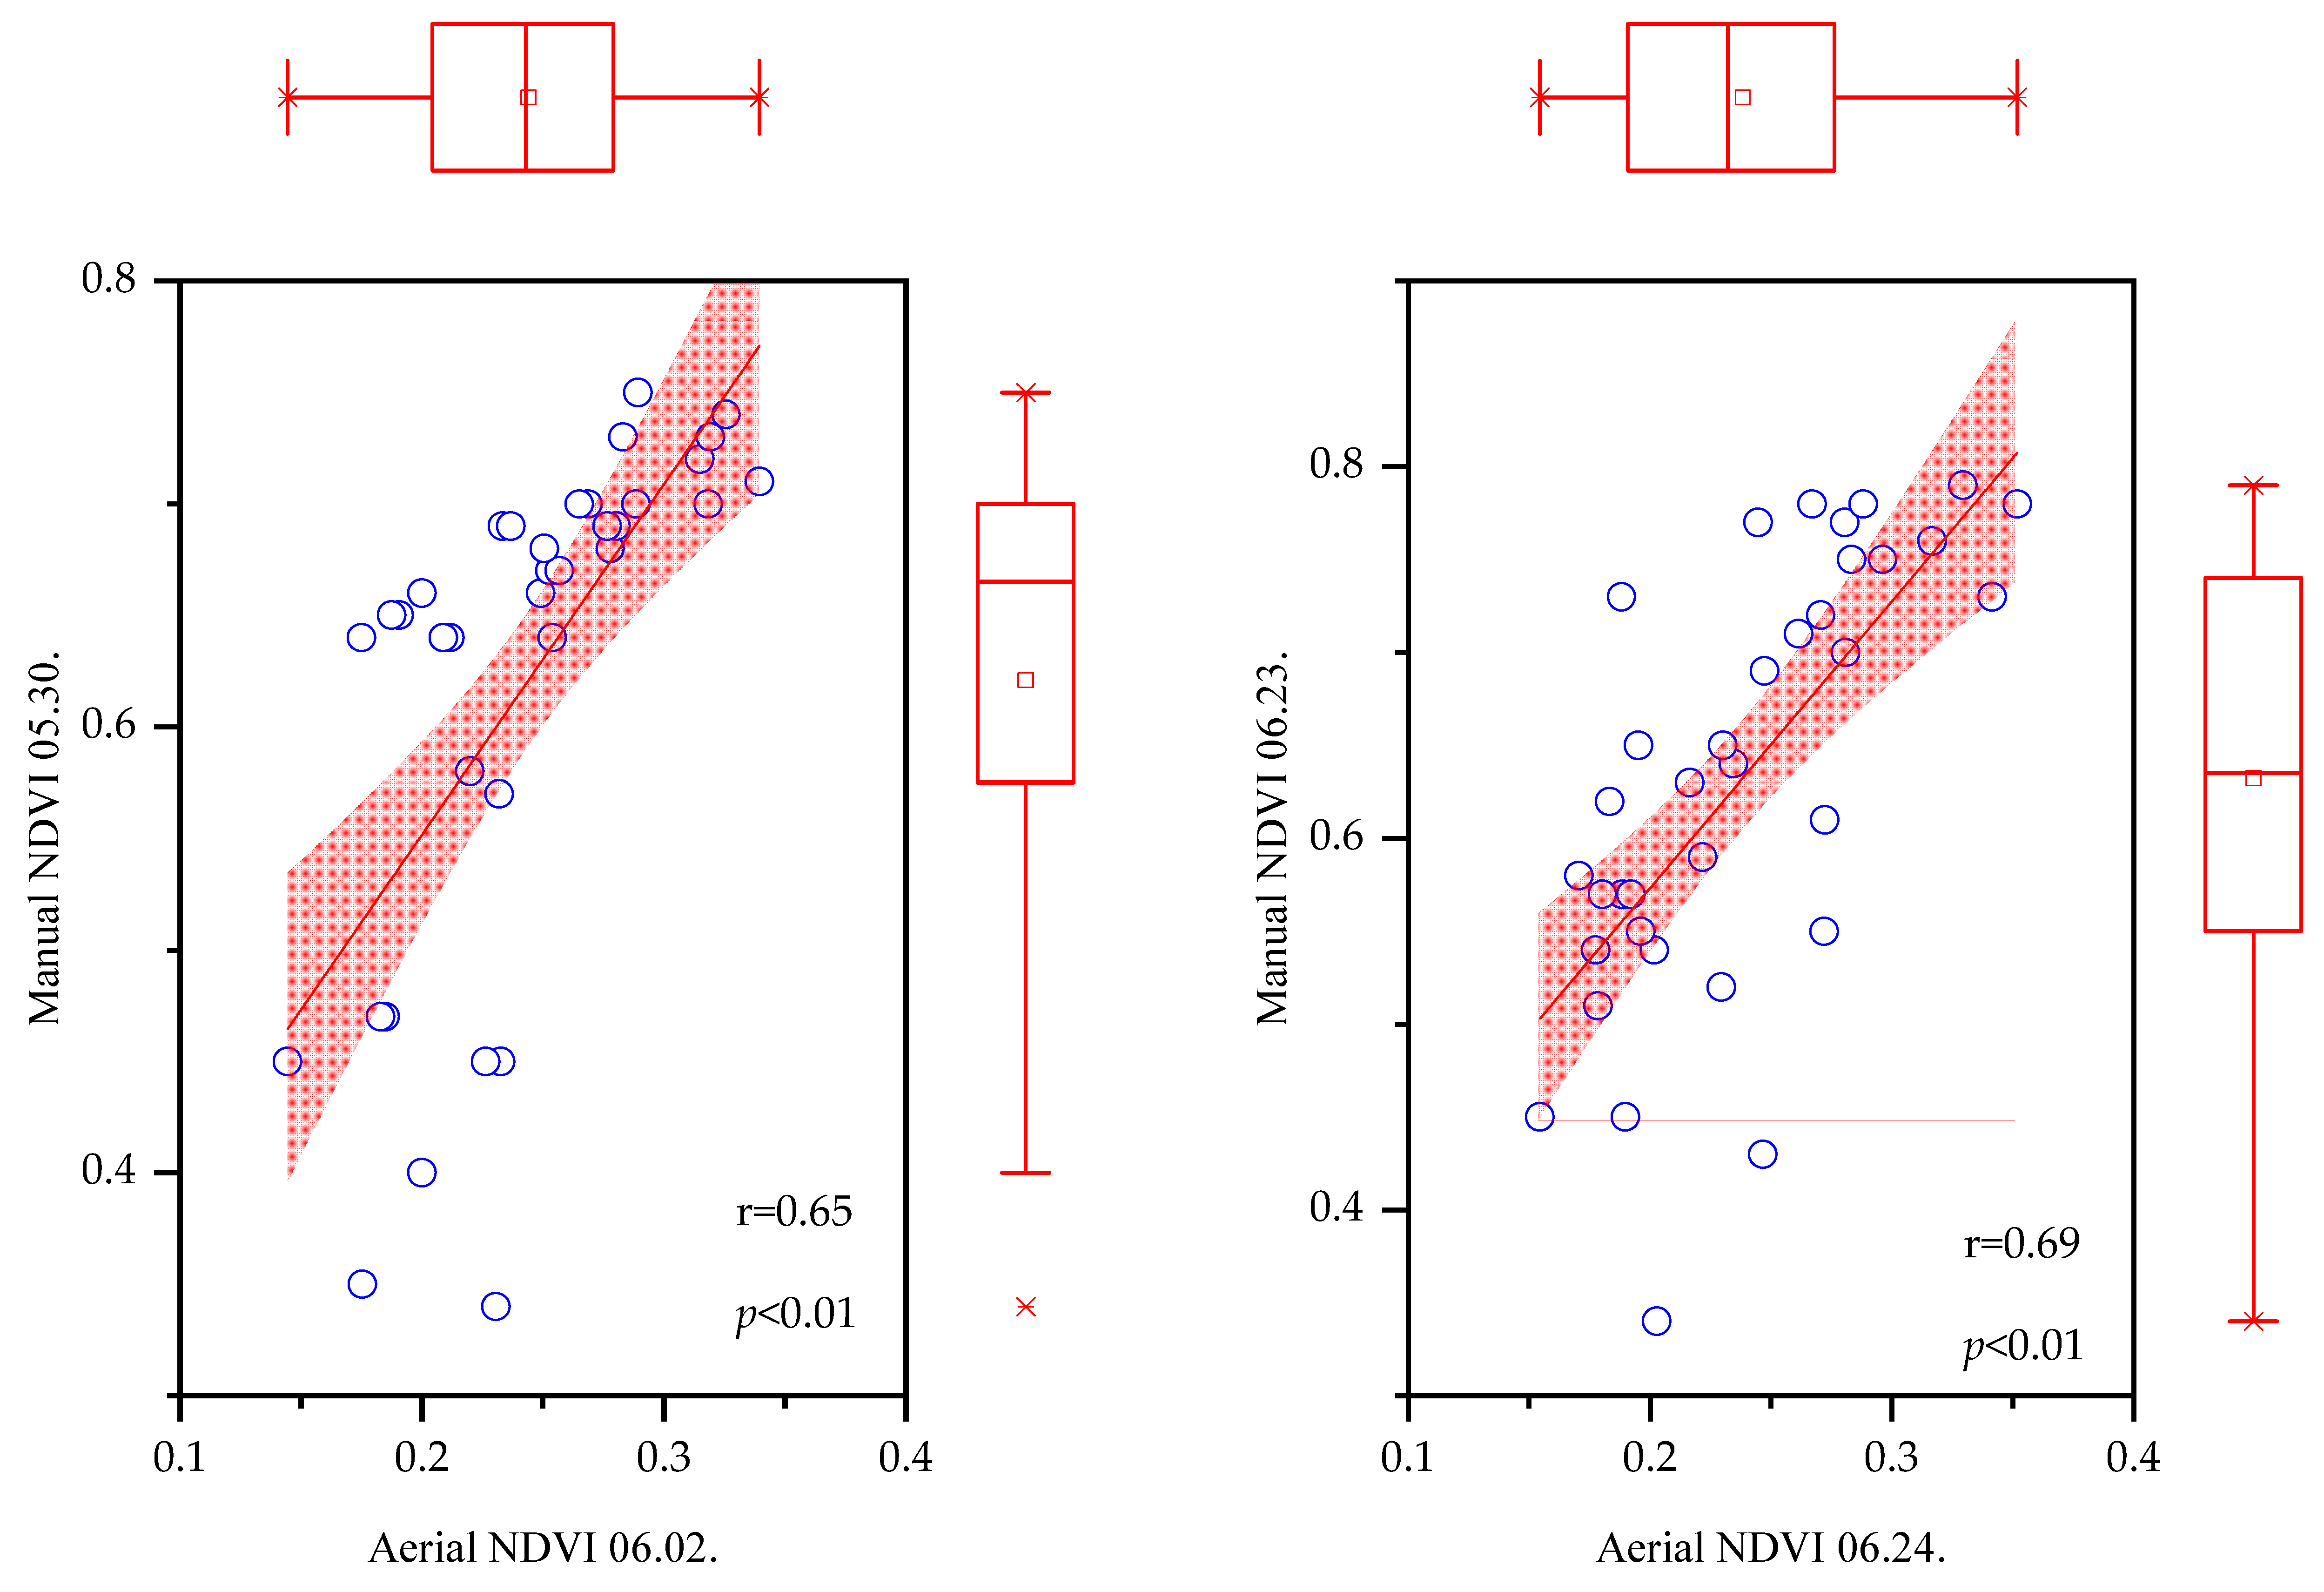
3.8. Correlation between NDVI Data Measured by Manual and Aerial Methods

A significant correlation (p < 0.01) was found between the values of aerial and manual NDVI measurements when the recording dates were very close (Figure 12). A significant correlation value (r = 0.65) was obtained between the NDVI values recorded with the manual device on 30 May and those recorded with the UAV spectral camera on 2 June. The mean and median of the 2 June UAV values are much closer to each other than the mean and median of the NDVI values recorded manually. There was a similar correlation (r = 0.69) between the values measured by the manual device on 23 June and the values measured by the aerial method on 24 June, although these measurement dates were closer to each other. The negative directional standard deviation of the manual recordings on the charts is substantially larger than that of the aerial recordings.

3.9. Correlation Test Results at Two Levels

Relationships were observed between several indicators (Table 4). Manual and aerial NDVI values were correlated at the 0.01 level. Seed yield was also correlated with both measured NDVI values at the 0.01 level, but there was a slightly stronger correlation between manual NDVI and seed yield than between aerial NDVI and seed yield (r = 0.666 and 0.481, respectively). The correlation test showed a positive correlation between manually recorded NDVI values and plant contamination at the 0.001 level, and at the 0.05 level, plant contamination and seed yield were positively correlated.
Phytotoxicity was negatively correlated with all indicators. The strongest negative correlation (r = −0.615) was between phytotoxicity and manual NDVI, followed by phytotoxicity and seed yield contamination.

4. Discussion

Although the cultivation of grain legumes would fit well in sustainable agriculture practices, the growth of the cultivation area is restricted by the low profitability of cultivation, and the lack of farmer interest in its cultivation [46]. The cultivation of white lupine for seed may be very difficult due to the presence of weeds, for which, at the moment, chemical weed control would provide the best solution. We tested the weed control activity and phytotoxicity of seven herbicides to find a solution for weed control in white lupine cultivation.
In our experiments, metribuzin caused the strongest damage to white lupine, followed by imazamox, whereas the other herbicides were not proven to be highly phytotoxic. The average phytotoxicity score for clomazone (T5)-treated plots was 1.31, which is not significantly higher than the values measured for plots treated with pethoxamid (T4), pendimethalin (T2), and metobromuron (T6), but it remains relatively low.
In contrast, other researchers tested pendimethalin plus clomazone, pendimethalin plus terbuthylazine, and clomazone plus metribuzin, applied as pre-emergence treatment combinations, among others, and imazamox as a post-emergence application. The study concluded that none of the tested substances caused phytotoxicity in white lupine [27]. Even though the soil was very similar to that in our experiments, the higher sensitivity of the crop may be due to the other weather conditions and/or other lupine cultivars involved in their experiment (‘Multitalia’).
Similarly, the clomazone (72 g ha−1), dimethenamid-P (720 g ha−1) and pendimethalin (1000 g ha−1) applied pre-emergence did not cause any phytotoxic symptoms in lupine, which largely agrees with our results [47]. In the experiment involving the sweet white lupine cultivar ‘Ultra’, it was found that pendimethalin also did not damage the plants [48].
Pendimethalin alone or in combination with metribuzin provided successful treatment and did not damage the white lupine ‘Lucyanne’ [49]. The effect of metribuzin was also tested on sweet white lupine, and it hardly damaged the plants and did not affect the yield significantly when 500 g ha−1 was applied. Higher dosages (750 and 1000 g ha−1) resulted in a significant decrease in both yield and 1000-seed weight [50]. Furthermore, metribuzin applied at a low dosage (175 g ha−1) caused growth inhibition and necrosis in sweet lupines [47].
The effect of the pre- and post-emergence herbicides on the nodulation and yield in cowpea (Vigna unguiculata L. Walp) was studied in Brazil. Using a post-emergence combination of imazamox plus bentazon and quizalofop-p-ethyl plus imazamox, the seed yield and root and nodulation development were satisfactory. According to the findings of this research, a post-emergence application of the active ingredient imazamox to cowpea (Vigna unguiculata (L.) Walp.; Fabaceae) did not result in a reduction in yield [51]. Other research results are in agreement with ours, as pendimethalin and clomazone were harmless to the plants in our experiment, but metribuzin almost completely exterminated the plots and imazamox caused severe symptoms and resulted in the lowest seed yield.
In our study, the active ingredient metobromuron (T6) controlled the weeds with the least efficiency (7.40 weeds 0.25 m−2 unit area), although the seed yield was higher than the seed yield of the control (T0) plots. It did not cause any phytotoxicity, and the average manual NDVI values of its plots were very similar to that of the control (T0).
Several active substances were tested for their weed control efficiency, and metobromuron was not effective against common hemp-nettle (Galeopsis tetrahit), wild radish (Raphanis raphanistrum), and common chickweed (Stellaria media) [50]. Although wild radish is not very abundant in the experimental field, it was present in several treatment plots in our experiment. Pre-emergence herbicides, including flumioxazin, caused less crop damage than post-emergence herbicides, and were 80–98% effective against hemp-nettle (Galeopsis tetrahit L.) and 71–95% effective against hairy vetch (Vicia villosa Roth.) [24]. Similarly, in earlier experiments, involving common vetch (Vicia sativa L.), the plots treated with flumioxazin showed the lowest average phytotoxicity score of 1.81, and produced a higher yield compared to the control, so this herbicide resulted in the best performance [41]. In that study, the methodology of phytotoxicity testing was the same as the one described in this paper. In our study, the flumioxazin-treated lupines initially were small, but later started to develop, and the crop recovered from the mild wilt.
Several vegetation indices can be applied for monitoring the plant condition, which have different advantages and disadvantages, so it is necessary to find which method is most suitable for completing the given task [52,53]. Thus, we tested some vegetation indices to assess the rate of herbicide damage. We compared the manually measured NDVI and aerially measured NDVI, GNDVI, and ENDVI. We found that both NDVI measurement methods can be used for monitoring the plant condition after herbicide application to detect damage. The correlation between the aerial and manual NDVI values was high (R2 = 0.83), similar to the findings of other researchers, when hand-held sensor and aerially measured NDVI results were compared in wheat experiments [54]. In this study, manual NDVI values were higher than the aerial measurements. The difference between aerial and manual NDVI values taken at the same or nearly the same time may be due to several factors such as the distance between the camera and the plant surface, the type of camera, the field size recorded by the camera, and, mostly, the spectral resolution [55,56]. However, values of the GNDVI measured aerially did not show any differences between treatments; they ranged from 0.141 to 0.167. Actually, the GNDVI has been mainly recommended for detecting signs of aging and withering [53]. In addition to NDVI values, the phytotoxic effect of herbicides was also clearly detectable with the ENDVI method. The ENDVI proved to be the best index for the estimation of the nitrogen levels of the plants; when non-destructive methods were searched for, a study of the effect of the fertilization of sweetleaf (Stevia rebaudiana Bertoni) [57].
Despite the fact that there were periods during the growing season when the NDVI hardly changed, the measurements were taken throughout the growing period. Repeating the measurements is justified because significant changes occurred during the entire growing season. The use of several vegetation indices and the repetition of measurements several times during the vegetation period are also recommended by others [53].
To summarize, the obtained temporal indices (NDVI and ENDVI) varied with treatments, and it seems that the new technology may be used as an alternative to visual evaluations (R2 = 0.65–0.94) and as a quick way to monitor herbicide activity. In our study, too, the vegetation index values recorded with precision agriculture techniques proved to be reliable.

5. Conclusions

Based on the analysis of phytotoxicity average scores and visual assessment, it was observed that both metribuzin (T7) and imazamox (T8) exhibited significant negative impacts on plants. The most phytotoxic herbicide in the trial was metribuzin (T7), and it also had the lowest average NDVI results. The significantly lowest yield (92 kg ha−1) was harvested on the plots treated with post-emergence imazamox. Clomazone (T5), pethoxamid (T4), dimethenamid-P (T3), and pendimethalin (T2) exhibited favorable performances across multiple indicators. Except for metribuzin and imazamox, the NDVI values of the treated plots were very similar to the values of the control plots.
After cleaning seeds, plots treated with pendimethalin (T2) had the highest net seed yields, followed by plots treated with clomazone (T5), pethoxamid (T4), dimethenamid-P (T3), flumioxazin (T1), and metobromuron (T6), which all had higher seed yields than control (T0) plots. Considering all measured, observed, and calculated variables, pethoxamid and clomazone treatments had the best results.
The research findings have led to new questions. Do herbicides have any effect on important agronomic traits and characters, such as 1000-seed weight, nutritional values, or germination rate? The location of weed control experiments on a field with irrigation possibilities can provide the required conditions for the weed control activities of herbicides. In future research, we intend to incorporate measurement methods provided by precision farming (e.g., vegetation index) to complement and reinforce visual assessment methods. Relationships between NDVI results and seed yield, and phytotoxicity, detected in our experiments confirmed that these tools may be involved in this kind of experiment. Further trials of the active substances, other than metribuzin (T7) and imazamox (T8), are justified in the future (while including more lupine varieties), due to their low phytotoxicity and adequate weed control abilities.

Supplementary Materials

The following supporting information can be downloaded at https://www.mdpi.com/article/10.3390/agronomy14030488/s1; Figure S1: Box plots of the manually measured NDVI results. Each box shows the mean, median, and distribution of the dataset; Figure S2: Box plots of values of normalized difference vegetation index (NDVI) (A), green normalized difference vegetation index (GNDVI) (B), and enhanced normalized difference vegetation index (ENDVI) (C) obtained from aerially recorded datasets; Figure S3: Box plots of the NDVI, GNDVI, and ENDVI data with the average of all treatments measured on 2 June (BBCH 3.4) and on 24 June (BBCH 4.2); Figure S4: Box plots of visually assessed phytotoxicity scores in plots treated by different herbicides; Figure S5: Weed control efficiency of herbicides, data presented as the average of each observation; Figure S6: Box plots of net seed yields; Figure S7: The means of contamination in the seed yield in different treatments; Table S1: Efficiency of herbicide treatments on the weed control and yield characters and their effects on the phytotoxicity variables; Table S2: Ranking of different herbicides based on the results of experimental tests.

Author Contributions

Conceptualization, C.J., N.M.-D. and L.Z.; methodology, C.J. and L.R.; software, C.J. and L.R.; validation, C.J. and L.R.; investigation, C.J., L.R. and L.Z.; resources, C.J. and L.Z.; data curation, C.J.; writing—original draft preparation, C.J., K.M.-T. and N.M.-D.; writing—review and editing, C.J., K.M.-T., N.M.-D., L.R. and L.Z.; visualization, C.J. and L.R.; supervision, L.Z. All authors have read and agreed to the published version of the manuscript.

Funding

Project C1771371 has been implemented with the support provided by the Ministry of Culture and Innovation of Hungary from the National Research, Development and Innovation Fund, financed under the KDP-2021 funding scheme.

Data Availability Statement

Data are contained within the article.

Acknowledgments

The authors would like to thank PANNON-MAG-AGRÁR KFT and Zsolt Kovács-Csomor, Production and Commercial Director, for their professional support. The authors would like to thank Hazel Brown for her English-language editing.

Conflicts of Interest

The authors declare no conflicts of interest.

References

  1. Romeo, F.V.; Fabroni, S.; Ballistreri, G.; Muccilli, S.; Spina, A.; Rapisarda, P. Characterization and Antimicrobial Activity of Alkaloid Extracts from Seeds of Different Genotypes of Lupinus spp. Sustainability 2018, 10, 788. [Google Scholar] [CrossRef]
  2. Ishaq, A.R.; El-Nashar, H.A.S.; Younis, T.; Mangat, M.A.; Shahzadi, M.; Ul Haq, A.S.; El-Shazly, M. Genus Lupinus (Fabaceae): A review of ethnobotanical, phytochemical and biological studies. J. Pharm. Pharmacol. 2022, 74, 1700–1717. [Google Scholar] [CrossRef] [PubMed]
  3. Gabur, I.; Simioniuc, D.P. Pearl lupin (Lupinus mutabilis): A neglected high protein and oil content crop. In Neglected and Underutilized Crops; Academic Press: Cambridge, MA, USA, 2023; Chapter 16; pp. 413–436. [Google Scholar]
  4. Spina, A.; Saletti, R.; Fabroni, S.; Natalello, A.; Cunsolo, V.; Scarangella, M.; Rapisarda, P.; Canale, M.; Muccilli, V. Multielemental, Nutritional, and Proteomic Characterization of Different Lupinus spp. Genotypes: A Source of Nutrients for Dietary Use. Molecules 2022, 27, 8771. [Google Scholar] [CrossRef]
  5. Pereira, A.; Ramos, F.; Sanches Silva, A. Lupin (Lupinus albus L.) Seeds: Balancing the Good and the Bad and Addressing Future Challenges. Molecules 2022, 27, 8557. [Google Scholar] [CrossRef] [PubMed]
  6. Khedr, T.; Juhász, A.; Singh, K.B.; Foley, R.; Nye-Wood, M.G.; Colgrave, M.L. Development and validation of a rapid and sensitive LC-MS/MS approach for alkaloid testing in different Lupinus species. J. Food Compos. Anal. 2023, 121, 105391. [Google Scholar] [CrossRef]
  7. Ladha, J.K.; Peoples, M.B.; Reddy, P.M.; Biswas, J.C.; Bennett, A.; Jat, M.L.; Krupnik, T.J. Biological nitrogen fixation and prospects for ecological intensification in cereal-based cropping systems. Field Crops Res. 2022, 283, 108541. [Google Scholar] [CrossRef]
  8. Zapata-Hernandez, I.; Rodriguez-Macias, R.; Garcia-Lopez, P.M.; Salcedo-Perez, E.; Lara-Rivera, A.H.; Zamora-Natera, J.F. Dry matter yield and nitrogen content in Lupinus spp. (Leguminosae) with potential as a green manure. Legum. Res. 2019, 42, 523–527. [Google Scholar]
  9. Natera, J.F.Z.; Hernández, I.Z.; Jiménez, C.E.A.; Aguilar, F.B.M.; Galdámez, J.G. Assessing the biomass yield and nitrogen fixation of Lupinus angustifolius varieties as green manure in Jalisco, Mexico. Eurasian J. Soil Sci. 2023, 12, 320–327. [Google Scholar] [CrossRef]
  10. Eldin, S.M.S.; Shawky, E.; Ghareeb, D.A.; El Sohafy, S.M.; Sallam, S.M. Metabolomics and Chemometrics Depict the Changes in the Chemical Profile of White Lupine (Lupinus albus L.) Bioactive Metabolites during Seed Germination. Food Chem. 2023, 418, 135967. [Google Scholar] [CrossRef]
  11. FAO. (Food and Agriculture Organization of the United Nation). Crops and Livestock Products. 2022. Available online: https://www.fao.org/faostat/en/#data/QCL (accessed on 27 October 2023).
  12. Zsombik, L. Alternatív fehérjenövények: Lehetőség vagy örök ígéret? Állattenyésztés Takarmányozás 2018, 67, 225–236. [Google Scholar]
  13. Lucas, M.M.; Stoddard, F.L.; Annicchiarico, P.; Frías, J.; Martínez-Villaluenga, C.; Sussmann, D.; Duranti, M.; Seger, A.; Zander, P.M.; Pueyo, J.J. The future of lupin as a protein crop in Europe. Front. Plant Sci. 2015, 6, 705. [Google Scholar] [CrossRef] [PubMed]
  14. Damalas, C.A.; Koutroubas, S.D. Weed Competition Effects on Growth and Yield of Spring-Sown White Lupine. Horticulturae 2022, 8, 430. [Google Scholar] [CrossRef]
  15. Abraham, E.M.; Ganopoulos, I.; Madesis, P.; Mavromatis, A.; Mylona, P.; Nianiou-Obeidat, I.; Parissi, Z.; Polidoros, A.; Tani, E.; Vlachostergios, D. The Use of Lupin as a Source of Protein in Animal Feeding: Genomic Tools and Breeding Approaches. Int. J. Mol. Sci. 2019, 20, 851. [Google Scholar] [CrossRef] [PubMed]
  16. Brebaum, S.; Boland, G.J. Sweet white lupin: A potential crop for Ontario. Can. J. Plant Sci. 1995, 75, 841–849. [Google Scholar] [CrossRef]
  17. Borbély, F.; Lenti, I.; Kövics, G.J. Csillagfürtfajok növényvédelme. Technológia. Növényvédelem 2008, 44, 279–296. [Google Scholar]
  18. Seiffert, M.; Makowski, N.; Moll, A.; Naumann, S.; Oehme, H.; Schulz, H.; Wicke, H.J.; Wirsing, F. Drusch- und Hackfruchtproduktion; Veb Deutscher Landwirtschaftsverlag: Berlin, Gennany, 1981; 399p. [Google Scholar]
  19. Stoddard, F.L. Grain Legumes: An Overview. In Legumes in Cropping Systems; CABI: London, UK, 2017. [Google Scholar]
  20. Folgart, A. Evaluation of Weed Management Practices in White Lupin (Lupinus albus L.). Master’s Thesis, Auburn University, Auburn, AL, USA, 2009. [Google Scholar]
  21. Toit, S.A. Efficacy and phytotoxicity of simazine and terbuthylazine on lupins. S. Afr. J. Plant Soil. 2003, 20, 188–192. [Google Scholar] [CrossRef]
  22. Van Der Mey, A.M. Annual lupins reports. In Reports of the Research Activities of the Oil and Protein Seed Centre; Pakendorf, K.W., Ed.; Grain Crops Institute: Potchefstroom, South Africa, 1991. [Google Scholar]
  23. Newman, P. Herbicide tolerance of new lupin varieties. In Crop Updates; Grains Research & Development Corporation: Canberra Australia, 1999; pp. 44–46. [Google Scholar]
  24. Folgart, A.; Price, A.J.; Kelton, J.A.; van Santen, E.; Wehtje, G.R. Evaulation of Herbicide Efficacy, injury, and Yield in White Lupin (Lupinus albus L.). In Herbicides; Price, A., Kelton, J., Saruniate, L., Eds.; IntechOpen: London, UK, 2015; pp. 137–153. [Google Scholar] [CrossRef]
  25. Halász, A. A fehérvirágú édes csillagfürt gazdasági jelentősége, termesztésének problémái. Agrártudományi Közlemények 2003, 10, 1–4. [Google Scholar]
  26. Kádár, A. Chemical Weed Control and Crop Control, 6th ed.; Mezőgazda Kiadó: Budapest, Hungary, 2019; 440p. [Google Scholar]
  27. Kousta, A.; Katsis, C.; Tsekoura, A.; Chachalis, D. Effectiveness and Selectivity of Preand Post-Emergence Herbicides for Weed Control in Grain Legumes. Plants 2024, 13, 211. [Google Scholar] [CrossRef]
  28. Pacanoski, Z. Weed control in newly seeded alfalfa (Medicago sativa L.) with post-emergence herbicides. Herbologia 2011, 12, 55–64. [Google Scholar]
  29. Matyjaszczyk, E. Protection possibilities of agricultural minor crops in the European Union: A case study of soybean, lupin and camelina. J. Plant Dis. Prot. 2020, 127, 55–61. [Google Scholar] [CrossRef]
  30. Haghighattalab, A.; Crain, J.; Mondal, S.; Rutkoski, R.; Singh, P.R.; Poland, J. Application of Geographically Weighted Regression to Improve Grain Yield Prediction from Unmanned Aerial System Imagery. Crop Sci. 2017, 57, 2478–2489. [Google Scholar] [CrossRef]
  31. Duddu, H.S.N.; Johnson, E.N.; Willenborg, C.J.; Shirtliffe, S.J. High-Throughput UAV Image-Based Method Is More Precise Than Manual Rating of Herbicide Tolerance. Plant Phenom. 2019, 2019, 6036453. [Google Scholar] [CrossRef] [PubMed]
  32. Huang, Y.; Yao, H.; Zhao, F.; Reddy, K. Detection of crop herbicide injury through plant hyperspectral remote sensing of chlorophyll fluorescence. In Proceedings of the 2017 IEEE International Geoscience and Remote Sensing Symposium (IGARSS), Fort Worth, TX, USA, 23–28 July 2017; pp. 5069–5072. [Google Scholar] [CrossRef]
  33. Streibig, J.C.; Rasmussen, J.; Andújar, D.; Andreasen, C.; Berge, T.W.; Chachalis, D.; Dittmann, T.; Gerhards, R.; Giselsson, T.M.; Hamouz, P.; et al. Sensor-based assessment of herbicide effects. Weed Res. 2014, 54, 223–233. [Google Scholar] [CrossRef]
  34. Pederi, A.Y.; Cheporniuk, S.H. Unmanned Aerial Vehicles and New Technological Methods of Monitoring and Crop Protection in Precision Agriculture. In Proceedings of the IEEE 3rd International Conference Actual Problems of Unmanned Aerial Vehicles Developments (APUAVD), Kyiv, Ukraine, 13–15 October 2015; pp. 298–301. [Google Scholar]
  35. Vasileiou, M.; Kyrgiakos, L.S.; Kleisiari, C.; Kleftodimos, G.; Vlontzos, G.; Belhouchette, H.; Pardalos, P.M. Transforming weed management in sustainable agriculture with artificial intelligence: A systematic literature review towards weed identification and deep learning. Crop Prot. 2024, 176, 106522. [Google Scholar] [CrossRef]
  36. Ahmad, M.; Adnan, A.; Chehri, A. A Real-Time IoT and Image Processing based Weeds Classification System for Selective Herbicide. In Proceedings of the 2022 IEEE 95th Vehicular Technology Conference, Helsinki, Finland, 19–22 June 2022; pp. 1–5. [Google Scholar] [CrossRef]
  37. Singh, T.; Singh, M. Hand Held Device for Detection of Pesticides using NDVI. Int. J. Comput. Appl. 2016, 154, 29–35. [Google Scholar] [CrossRef]
  38. Csutoras, C.; Giran, L.; Hudak, O.; Racz, L. Development and evaluation of potential functional food biscuits made from White Lupin. Prog. Agric. Eng. Sci. 2021, 17, 89–100. [Google Scholar] [CrossRef]
  39. Marsujitullah, M.; Kaligis, D.A.; Manggau, F.X. Health Analysis of Rice Plants Based on the Normalized Difference Vegetation Index (NDVI) Value in Image of Unmanned Aircraft (Case Study of Merauke—Papua Selatan). Eng. Technol. J. 2023, 8, 1986–1991. [Google Scholar] [CrossRef]
  40. Dancza, I. Herbicide Testing Methodology; Department of Plant and Soil Protection of the Ministry of Agriculture and Rural Development: Budapest, Hungary, 2004; 245p. [Google Scholar]
  41. Juhász, C.; Hadházy, Á.; Abido, W.; Pál, V.; Zsombik, L. Impact of some herbicides on the growth and the yield of common vetch (Vicia sativa L.). Agron. Res. 2023, 21, 135–155. [Google Scholar] [CrossRef]
  42. Pinke, G. Effect of Abiotic and Management Factors on the Species Composition of Arable Weeds in Hungary. Ph.D. Thesis, Széchenyi István University, Mosonmagyaróvár, Hungary, 2017; pp. 1–22. [Google Scholar]
  43. Novák, R.; Dancza, I.; Szentey, L.; Karamán, J. The weed vegetation of Hungary’s arable fields. In Fifth National Arable Field Weed Survey (2007–2008); Novák, R., Ed.; FVM: Budapest, Hungary, 2009. [Google Scholar]
  44. Kutasy, E. Beech species. 212–222. In Alternative Plants; Pepó, P., Ed.; Mezőgazda Publishing House: Budapest, Hungary, 2019; 259p. [Google Scholar]
  45. Vasudevan, D.A.K.; Bhuvaneswari, N.S. Precision farming using unmanned aerial and ground vehicles. In Proceedings of the 2016 IEEE Technological Innovations in ICT for Agriculture and Rural Development (TIAR), Chennai, India, 15–16 July 2016; pp. 146–150. [Google Scholar] [CrossRef]
  46. Stagnari, F.; Maggio, A.; Galieni, A.; Pisante, M. Multiple benefits of legumes for agriculture sustainability: An overview. Chem. Biol. Technol. Agric. 2017, 4, 2. [Google Scholar] [CrossRef]
  47. Dewitte, K.; Latré, J.; Haesaert, G. Possibilities of chemical weed control in Lupinus albus and Lupinus luteus-screening of herbicides. Commun. Agric. Appl. Biol. Sci. 2006, 3, 743–751. [Google Scholar]
  48. Penner, D.; Leep, R.H.; Roggenbucb, F.C.; Lempke, J.R. Herbicide efficacy and tolerance in sweet white lupin. Weed Technol. 1993, 7, 42–46. [Google Scholar] [CrossRef]
  49. Knott, C.M. Tolerance of autumn-sown determinate lupins (Lupinus albus) to herbicides. Test Agrochem. Cultiv. 1996, 17, 52–53. [Google Scholar] [CrossRef]
  50. Ivany, A.J.; Mccully, V.K. Evaluation of Herbicides for Sweet White Lupin (Lupinus albus). Weed Technol. 1994, 8, 819–823. [Google Scholar] [CrossRef]
  51. Cruz, A.B.D.S.; Albuquerque, J.D.A.A.D.; Rocha, P.R.R.; Souza, L.T.D.; Cruz, D.L.D.S.; Soares, M.B.B.; Castro, T.S.; Santos, T.S.D.; Silva, E.S.D. Effect of the use of pre- and post-emergence herbicides on nodulation and production of cowpea (Vigna unguiculata L.) in the Amazonian savannah. Agron. Colomb. 2020, 38, 280–286. [Google Scholar] [CrossRef]
  52. Singh, K.D.; Geddes, C.M.; Johnson, E.; Tidemann, B.; Shirtliffe, S.; Wang, H.; Natarajan, M.; Jaster, A.; Zuidhof, J.; Turkington, T.K. Proximal and remote sensing based imaging technology to quantify herbicide responses in field crops. Authorea 2022. [Google Scholar] [CrossRef]
  53. Kurbanov, R.K.; Zakharova, N.I. Application of vegetation indexes to assess the condition of crops. Agric. Mach. Technol. 2020, 14, 4. [Google Scholar] [CrossRef]
  54. Duan, T.; Chapman, S.C.; Guo, Y.; Zheng, B. Dynamic monitoring of NDVI in wheat agronomy and breeding trials using an unmanned aerial vehicle. Field Crops Res. 2017, 210, 71–80. [Google Scholar] [CrossRef]
  55. Rodriguez, J.E.; Alonso-Jimenez, C.; Alfonso, T.M.A.; Benito, R.M.; Díaz-Ambrona, C.G.H. Comparison of NDVI fields obtained from different remote sensors. In Proceedings of the European Geosciences Union General Assembly, Vienna, Austria, 7–12 April 2013; p. 14153. [Google Scholar]
  56. Fan, X.; Liu, Y. A comparison of NDVI intercalibration methods. Int. J. Remote Sens. 2017, 38, 5273–5290. [Google Scholar] [CrossRef]
  57. Anchal, S.; Bahuguna, S.; Priti; Pal, P.K.; Kumar, D.; Murthy, P.V.S.; Kumar, A. Non-destructive method of biomass and nitrogen (N) level estimation in Stevia rebaudiana using various multispectral indices. Geocarto Int. 2022, 37, 6409–6421. [Google Scholar] [CrossRef]
Figure 1. The amount of rainfall and average temperature over the past 50 years, beginning in early March and ending in late July.
Agronomy 14 00488 g001
Figure 2. Mean values of manually measured NDVI results. Each bar shows the mean and standard error of the dataset. Different letters indicate significant differences between means of treatments (Tukey Post Hoc Test; p < 0.05).
Agronomy 14 00488 g002
Figure 3. Values of normalized difference vegetation index (NDVI) (A), green normalized difference vegetation index (GNDVI) (B), and enhanced normalized difference vegetation index (ENDVI) (C) obtained from aerially recorded datasets. Each bar shows the mean and standard error of the dataset. Different letters indicate significant differences between means of treatments (Tukey Post Hoc Test; p < 0.05).
Agronomy 14 00488 g003aAgronomy 14 00488 g003bAgronomy 14 00488 g003c
Figure 4. Values of normalized difference vegetation index (NDVI) measured manually on the plots treated by different herbicides and at different times of growing season.
Agronomy 14 00488 g004
Figure 5. Comparison of the NDVI, GNDVI, and ENDVI data in terms of the average of all treatments measured on 2 June (BBCH 3.4) and on 24 June (BBCH 4.2). Each bar shows the mean and standard error of the dataset. (NDVI-1, GNDVI-1, ENDVI-1 = 2 June; NDVI-2, GNDVI-2, ENDVI-2 = 24 June).
Agronomy 14 00488 g005
Figure 6. Means of visually assessed phytotoxicity scores in plots treated by different herbicides. Each bar shows the mean and standard error of the dataset. Different letters indicate significant differences between means of treatments (Tukey Post Hoc Test; p < 0.05).
Agronomy 14 00488 g006
Figure 7. The plot treated by flumioxazin (A), the plot treated by metribuzin (B), and the plot treated by imazamox (C). Photos were taken on 1 June (55 days after sowing).
Agronomy 14 00488 g007
Figure 8. Weed control efficiency of herbicides; data presented as the average of each observation. Each bar shows the mean and standard error of the dataset. Different letters indicate significant differences between means of treatments (Tukey Post Hoc Test; p < 0.05).
Agronomy 14 00488 g008
Figure 9. A dimethenamid-P treated plot (A) and a control plot (B) were documented in photographs 92 days after sowing.
Agronomy 14 00488 g009
Figure 10. Means of net seed yields in different treated plots. Each bar shows the mean and standard error of the dataset. Different letters indicate significant differences between means of treatments (Tukey Post Hoc Test; p < 0.05).
Agronomy 14 00488 g010
Figure 11. The means of contamination in the seed yield for different treatments. Each bar shows the mean and standard error of the dataset. Different letters indicate significant differences between means of treatments (Tukey Post Hoc Test; p < 0.05).
Agronomy 14 00488 g011
Figure 12. Result of a correlation test between NDVI values recorded by manual device and UAV. The correlation is statistically significant at the 0.01 level. The blue circles show the individual data points, the red shaded areas show the confidence intervals for the red regression lines.
Agronomy 14 00488 g012
Table 1. The main soil characters of experiment field (sampling depth 0–30 cm).
Soil CharactersQuantitative Indicators
pH (KCl)7.46
Plasticity index by Arany26
Water-soluble salt (m/m) %<0.02
Carbonated lime content (m/m) %0.844
Humus content (m/m) %1.11
Phosphorus pentoxide mg kg−1440
Potassium oxide mg kg−1252
Table 2. The time of application of herbicide substances, the applied doses, and the treatment codes.
Active SubstancesTime of ApplicationChemical NameDosesCodes of the Treatments
Control- -T0
Flumioxazin [24]Pre-emergenceN-(7-fluoro-3,4-dihydro-3-oxo-4-prop-2-ynyl-2H-1,4-benzoxazin-6-yl)cyclohex-1-ene-1,2-dicarboxamide0.06 kg ha−1T1
Pendimethalin [25]Pre-emergence3,4-Dimethyl-2,6-dinitro-N-(pentan-3-yl)aniline5.0 L ha−1T2
Dimethenamid-P [26]Pre-emergence(S)-2-chloro-N-(2,4-dimethyl-3-thienyl)-N-(2-methoxy-1-methylethyl)acetamide1.4 L ha−1T3
Pethoxamid [26]Pre-emergence2-chloro-N-(2-ethoxyethyl)-N-(2-methyl-1-phenylprop-1-enyl)acetamide2.0 L ha−1T4
Clomazone [27]Pre-emergence2-(2-chlorobenzyl)-4,4-dimethyl-1,2-oxazolidin-3-one0.2 L ha−1T5
Metobromuron [16]Pre-emergence3-(4-bromophenyl)-1-methoxy-1-methylurea3.0 L ha−1T6
Metribuzin [23]Pre-emergence4-amino-6-tert-butyl-3-methylsulfanyl-1,2,4-triazin-5-one0.55 L ha−1T7
Imazamox [28]Post-emergence2-[(RS)-4-isopropyl-4-methyl-5-oxo-2-imidazolin-2-yl]-5-methoxymethylnicotinic acid1.0 L ha−1T8
Table 3. The precipitation and the mean temperatures in the lupine growing season (Nyíregyháza, Hungary).
Crop Year 2022
MarchAprilMayJuneJuly
Temperature (°C)4.89.1817.422.223.4
Precipitation (mm)21.942.13.921.935.4
Table 4. Relationship between variables. Correlation matrix test results of the measured indicators.
Seed YieldsManual-NDVI Data SetsAerial-NDVIPhytotoxicityNumber of WeedsContamination
Seed yields
Manual-NDVI data sets0.676***
Aerial-NDVI0.536***0.834***
Phytotoxicity−0.471**−0.615***−0.427**
Number of weeds−0.106 0.282 0.205 −0.377*
Contamination0.419*0.567***0.446**−0.607***0.16
Note. * p < 0.05, ** p < 0.01, *** p < 0.001 Spearman’s rho. The color of the cells shows the direction of the correlation (positive direction: blue color, negative direction: red color), as well as the strength of the correlation: the darker the color shade, the stronger the correlation.
Disclaimer/Publisher’s Note: The statements, opinions and data contained in all publications are solely those of the individual author(s) and contributor(s) and not of MDPI and/or the editor(s). MDPI and/or the editor(s) disclaim responsibility for any injury to people or property resulting from any ideas, methods, instructions or products referred to in the content.

