Article

The Influence of Human Agricultural Activities on the Quality of Selected Fluvisols from the Vistula River Valley, Poland—Preliminary Research

by
Karolina Furtak
1,*,
Karolina Gawryjołek
1,
Anna Marzec-Grządziel
1 and
Jacek Niedźwiecki
2
1
Department of Agricultural Microbiology, Institute of Soil Science and Plant Cultivation—State Research Institute, Czartoryskich Str. 8, 24-100 Pulawy, Poland
2
Department of Soil Science Erosion and Land Conservation, Institute of Soil Science and Plant Cultivation—State Research Institute, Czartoryskich Str. 8, 24-100 Pulawy, Poland
*
Author to whom correspondence should be addressed.
Agronomy 2024, 14(3), 480; https://doi.org/10.3390/agronomy14030480
Submission received: 29 January 2024 / Revised: 22 February 2024 / Accepted: 26 February 2024 / Published: 27 February 2024
(This article belongs to the Section Soil and Plant Nutrition)

Abstract

:
Studies on the impact of human agricultural activities on the soil microbiome and soil quality are extremely important, but such studies on floodplains in river valleys are lacking. The aim of this preliminary study was to determine the impact of blackcurrant cultivation on Fluvisols located in the Vistula River valley (Poland). The dehydrogenases (DHa) and phosphatases (acid-AcP, and alkaline-AlP) activities, carbon (MBC) and nitrogen (MBN) contents of the microbial biomass, the metabolic potential of the microbial community (EcoPlate™ Biolog) and taxonomic diversity of the soil microbiome were determined (next-generation sequencing (NGS) of the 16S rRNA gene). Enzymatic activity and metabolic potential and diversity (EcoPlate™) were higher in the soils from meadows, but MBC and MBN and biodiversity indices derived from NGS were higher in the cultivated soils. It can be confirmed that human activities affect the physicochemical, biological and microbiological parameters of Fluvisols. This may indicate that microorganisms are numerically more abundant and taxonomically more diverse in the cultivated soils, but are more active in the soils from meadows.

1. Introduction

The soil environment has many diverse functions, of which, from the point of view of human activity, the most important are those related to agriculture—crop production [1,2]. Soil fertility, its organic matter abundance, water storage capacity, but also the diversity and activity of microorganisms directly and indirectly affect crop production [3,4,5]. Microorganisms and their activity can also be used as indicators of soil environmental quality [6,7]. Human activities, on the other hand, also affect soil quality through modifications in the soil microbiome. Numerous studies have shown that agricultural activities alter the microbial activity of soils by directly affecting their habitat conditions: including changes in the microclimate, nutrient content and access, introduction of toxins, changes in soil spaces, and changes in water content and availability [1,2,3].
Due to their high fertility and proximity to water, river valleys have been used for centuries as agricultural land all over the world [8]. The attractiveness of these areas for humans is confirmed by the historic development of settlements in the river valleys of the Nile, Euphrates and Tigris [9,10,11]. Although these areas are characterised by the risk of flooding, the riverside areas are also used for agricultural and horticultural purposes [4]. Fluvisols are soils characterised by high fertility due to their location, formation and development near rivers [12]. Their type depends on the changes in the surroundings and the nature of the river next to which they were formed [4]. They are characterised by the presence in their profile of alternating layers of different granulometric composition. The dominant formation types determine the species of the muds, which can be divided into light, medium and heavy [12]. The World reference base for soil resources 2014 updates the 2015 International soil classification system for naming soils and creating legends for soil maps [13]. In Poland, the most extensive area of Fluvisols occurs along the Vistula River [14]. The Vistula is the longest river in Poland and the ninth longest river in Europe [15]. It flows entirely through Poland and its catchment area is 193,866 km2. The soils in its basin are actively used as grassland and arable land [16].
The flat, low-lying riparian areas are affected by flooding at more or less regular intervals, which affects their fertility and use [17,18]. At the same time, riverine areas are used for human activities: agriculture, mining, industry, services (including tourism), and for development [18]. Human interference with riverine ecosystems affects their services, functioning and quality [19,20]. Agricultural use in these areas involves tillage (mainly orchards, fruit bushes, vineyards) and associated treatments (ploughing, fertilisation, etc.), the mowing of meadows and grazing of animals, etc. Such activities affect the soil environment of Fluvisols, among other things by changing the content and properties of organic matter [14,16]. However, there is a lack of research in the literature on the influence of riparian land use on the microbiological and biological parameters of Fluvisols. In recent years, several papers have been published on the impact of floods and flood surges on the microbiology of riverine soils, but they did not deal with a comparison of the use of these lands [21,22,23,24,25]. Meanwhile, a study by [26] found that the type of land use of riparian zones can have a much greater impact on soil microorganism communities than just flooding, particularly bacteria involved in the nitrogen cycle.
The aim of this preliminary study was to determine the impact of blackcurrant cultivation on three different Fluvisols located in the Vistula River valley, behind the embankment in Lubelskie voivodship. The reference was the nearest neighbouring meadow. Based on previous studies using Fluvisols, we made the following hypotheses: (1) the three different Fluvisols will differ in biological activity and microbiome; (2) soils from under blackcurrant cultivation will have lower biological activity and bacterial diversity compared to meadow soils. In order to verify the hypotheses, analyses of enzymatic activity, carbon and nitrogen content of the microbial biomass and the metabolic potential of microorganisms were determined using the Biolog® EcoPlate™ method and the structure of the soil bacterial community using next-generation sequencing (NGS).

2. Materials and Methods

2.1. Soil Location and Sampling

The research was conducted in eastern Poland, in the Lubelskie Voivodeship. Soils were selected on the basis of a soil and agricultural map on the scale of 1:25,000. The soil and agricultural map provided us with preliminary information on the particle size distribution of these soils, which allowed us to select suitable locations for the collection of soil samples. Three different Fluvisols were taken from the Vistula floodplains of the Vistula River Gorge, Lesser Poland in Opatkowice.
The selected sites are located behind flood barriers, which are natural floodplains (terraces) of the Vistula River and are subject to flooding in summer when the water level rises in the riverbed (after heavy rainfall). Each sample of mud was taken in two variants: from under the blackcurrant crop (C) and from the nearest neighbouring meadow (M), which was the reference object. Samples were taken after the fruit harvest. Soil sampling abbreviations and locations are shown in Table 1. The Supplementary Materials contains a detailed characterisation of the sites (fertilisation, vegetation) (Table S1).
The climate in the area is classified as a temperate climate (Cfb, according to the Köppen climate classification). The mean annual temperature is 9.3 °C (from an average of −2.1 °C in January; to an average of 20.3 °C in July) and the mean annual precipitation is 711 mm (from an average of 43 mm in February; to an average of 90 mm in July) [27].
Soil samples were collected in July 2022 from a 0–20 cm depth from 15 representative spots (from an area of approximately 0.04 ha; 20 m × 20 m) per variant. Soil samples were pooled (~1 kg), sieved through a 2 mm sieve, and quickly stored at 4 °C until analysis of the soil biological properties and metabolic potential of the microbial community, and in −20 °C until DNA extraction.

2.2. Soil Physicochemical Parameters

The soil particle size distribution (PSD; %) was measured by a laser diffraction method on a Mastersizer 2000 analyser (Malvern Panalytical, Malvern, UK) [28].
The soil pH in H2O was measured potentiometrically. From each sample, 10 g was suspended in 10 mL of sterile water and incubation at room temperature for 24 h. After 24 h, the pH was determined using a pH-meter (edge® Multiparameter pH meter, HANNA Instrument, Woonsocket, RI, USA).
The organic carbon (OC) and organic matter (OM) concentrations (%) in the soil were measured using the Tiurin modified method [29].
The total nitrogen (TN) contents (%) in the soil were determined on a Vario Macro Cube analyser from Elementar (Germany) using the dry combustion method [30].
The contents (mg kg−1 of soil) of ammonium (N-NH4), nitrite (N-NO2) and nitrate (N-NO3) nitrogen were determined by continuous flow analysis with segmented flux and spectrophotometric detection on a flow analyser QuAAtro39 (Seal Analytical GmbH, Norderstedt, Germany) after extraction with 1 M K2SO4 solution in a weight/volume ratio of 1:10 [31].
The contents (mg 100 g−1 of soil) of available forms of phosphorus (P) and potassium (K) were established with Egner–Riehm’s method and magnesium (Mg) with Schachtschabel’s method [28].
The content of selected trace elements, i.e., Cr, Mn, Fe, Co, Ni, Cu, Zn, Mo, Cd, Pb, Na, Mg, K and Ca (g kg−1 of soil), in the soil were assessed using microwave digestion (CEM MARS Xpress) with a mixture (1:3 v:v) of ultrapure HCl and HNO3. Next, the contents of elements were determined using the inductively coupled plasma mass spectrometer (ICP-MS) Agilent 7500ce (Agilent Technologies Inc., Santa Clara, CA, USA).

2.3. Soil Biological Parameters

The activity of soil dehydrogenases (DHa) was determined using 2,3,5-triphenyl-tetrazolium chloride (TTC) as a substrate [32]. The activities of DHa are reported as µg of triphenyl formazan (TPF) per g dry mass (d.m.) soil per incubation time of 24 h.
The measurement of alkaline (AlP) and acid (AcP) phosphatases activities (µg PNP g−1 d.m. of soil 1 h−1) was performed with ρ-nitrophenyl phosphate (ρ-NPP) as a substrate [33].
Analyses of enzymatic activity were performed spectrophotometrically using a Nicolet spectrophotometer (Thermo Fisher Scientific, Waltham, MA, USA) in quintuplicate (n = five for each soil sample).
Microbial biomass carbon (MBC) and microbial biomass nitrogen (MBN) contents (µg C/N g−1 d.m. of soil) in the soil were measured via the chloroform fumigation–extraction method [34].

2.4. Soil Microbiome Analysis

The diversity of the metabolic potential of the soil bacterial community was determined using a Biolog EcoPlate™ (Biolog Inc., Hayward, CA, USA) method with 31 different carbon sources. Analysis was conducted as described in a previous paper [21]. Briefly, 1 g of a fresh soil sample was suspended in 99 mL of sterile water, shaken for 20 min and incubated at 4 °C for 30 min [35]. Next, each of the 96 wells of the microplate was inoculated with 120 µL of soil inoculums. Plates were incubated at 25 °C for 120 h. The intensity of the wells’ colour development was determined spectrophotometrically at λ = 590 nm [36] for a period of 120 h at 24-intervals using a MicroStation ID (Biolog Inc., Hayward, CA, USA) plate reader at OD590. The most intensive metabolic activity was observed after 120 h of incubation and the results obtained at this time are presented. The classification of substrates into five biochemical groups was made according to [35].
Taxonomic diversity of microbiome in the soil was analysed by the next-generation sequencing (NGS) method. Total DNA was extracted from each soil sample with a FastDNA™ SPIN Kit for Soil (MPBiomedical, Santa Ana, CA, USA) according to the manufacturer’s instructions. The V3–V4 region of the 16S rRNA gene was sequenced using 341F and 785R primers [37] at Eurofins Genomics (Ebersberg, Germany), in 2 bp × 250 bp paired-end technology using an Illumina MiSeq system.

2.5. Data Analysis and Visualisation

Statistical analyses were performed using a packet Statistica.PL ver. 13.0 (StatSoft. Inc., Tulsa, OK, USA). Significant differences were calculated according to One-Way ANOVA with a post hoc Tukey’s HSD (honest significant difference) test at the α = 0.05 significance level. Selected results were also submitted to principal component analysis (PCA) in order to determine the common relations between parameters (StatSoft. Inc., Tulsa, OK, USA).
On the basis of the data obtained at 120 h of incubation of the Biolog EcoPlate™ from MicroStation ID, the average well colour development (AWCD), richness (R), Shannon diversity (H’) and evenness (E) indices were calculated following [38,39]. The data were standardised by the AWCD in each microplate to remove inoculum density effects [40]. Heat maps were developed using data from the average absorbance values after 120 h of incubation of the Biolog EcoPlate™ using Statistica.PL ver. 13.0 (StatSoft. Inc., Tulsa, OK, USA).
For the processing of demultiplexed fastq files, a DADA2 (1.14) package [41] in R software (3.6.0) [42] was used. Forward and reverse sequences were trimmed off based on the quality plots. The next steps of the analysis were LearnErrors, dada, removeBimeraDenovo. For the taxonomy assignment, the latest version of the modified RDP (Ribosomal Database Project) v18 database [43] was used using IDTAXA [44]. The results were achieved with a phyloseq (1.22.3) package [45]. Statistical and graphical analysis were prepared using a microeco package [46]. All sequences are available in the NCBI database under the bioproject accession number: PRJNA1055027 (details in Table S2).

3. Results and Discussion

3.1. Soil Physicochemical Properties

As can be seen in Table 2, the selected Fluvisols varied in texture, confirming the information gleaned from the maps. The soils were classified as loamy sand (F1) and sandy loam (F2 and F3). An important observation is the existence of differences between soils with different management practices. These differences were shown for each of the three Fluvisols in terms of pH values, OC, OM, TN, nitrogen forms and P, K and Mg content (Table 2). For OM, OC, TN, N-NH4, Mg values were higher in all soils from the meadow (_M, not cultivated) compared to samples from under blackcurrant (_C). The contents of N-NO2, N-NO3, P and K in F1 and F2 were higher in samples from the meadow compared to soil from under cultivation, but lower in F3.
Research by [47] on Fluvisols from the Nitra River catchment showed that the differences in the physicochemical properties of the studied soils were mainly influenced by their use and soil management practices. The results presented in Table 2 allow similar conclusions to be drawn, as despite a similar texture, cultivated and uncultivated soils differ in both pH and N, C, P, K and Mg content. In a study by [16], it was shown that arable soils (fluvisols, Fordonska Valley, Poland) had significantly lower organic carbon, total nitrogen, dissolved organic nitrogen and dissolved organic carbon values compared to grassland. The authors emphasise that the type of soil use significantly influenced the properties of organic matter, and thus of humic acids. The lower values of OC, TN and OM in soils from the blackcurrant crop obtained in this study are consistent with these results. The pH values found are lower than those obtained by [48] on samples which were taken from grasslands in floodplain areas in the Lower Vistula River and by us in Fluvisols located about 22 km from the discussed location [39].
The heavy metal content (Table S3) showed that the medium (F2) and heavy (F3) Fluvisols have the ability to bind higher amounts of Ni and Cr than the light Fluvisols (F1). The metal levels found in the soils tested did not exceed the metal contamination levels specified in the Ministry of the Environment ruling of 9 September 2002 on Soil Quality Standards (Group B) [49]. The results obtained are similar to the values obtained for Fluvisols in the Vistula River valley in earlier studies [39]. Pb, Cu and Cr values were similar to those obtained by [50] in soils from the Łyna River valley (NE Poland). The manganese content of the examined Fluvisols ranged from 0.24 to 0.85 g kg−1 of soil, which corresponds to the values obtained by [48] in Fluvisols from the Chełmiński and Nadwiślański Complex of Landscape Parks (Vistula River valley, Poland). There was no correlation between soil use and metal content; e.g., Fe content was higher in meadow soil from F1 and F2, compared to soil from under blackcurrant, but for F3 significantly more Fe was detected in the soil from under crops. In contrast, for Zn, higher amounts were detected in the F2 and F3 cultivated soil, compared to the grassland soil. Cd and Mb were not detected in the Fluvisols tested.

3.2. Biological Activity in Fluvisols

Enzymatic activity (Figure 1) differed between both Fluvisols types and variants. DHa (Figure 1A) showed statistically significantly higher values in M at F2 and F3 compared to C (by 36.75% and 30.07%, respectively). At the same time, the results obtained for the M variant samples were statistically significantly different from each other depending on the soil and were arranged as follows: F1_M > F2_M > F3_M. The same relationship was recorded for blackcurrant soils (F1_C > F2_C > F3_C). DHa in F1_C was 65.06% higher than in F2_C and 72.02% higher than in F3_C.
AcP activity was significantly higher than AlP, which is due to the acidic nature of the soils analysed (Figure 1B and Table 2). AcP activity was significantly higher in F3, compared to F1 and F2 (Figure 1B). The differences in variant M between F3 and F1 were as high as 68.75% and between F3 and F2 66.69%, and were statistically significant. For variant C, the differences were 64.05 and 54.16%, respectively. There were no statistically significant differences between F2 and F1 for variant M. AcP activities obtained for variant C soils were statistically significantly different between the Fluvisols, with the highest recorded at F3. AlP activity was also highest at F3, and the differences between Fluvisols were statistically significant. Between F3_C and F1_C and F2_C, the differences were 66.44% and 47.08%, respectively; and between F3_M and F1_M and F2_M, 73.79% and 50.79%, respectively.
The activity of dehydrogenases obtained for F1 and F2_M corresponds to the activity of these enzymes obtained in soils of good quality in Poland (e.g., Cambic Leptosol); whereas the values obtained for F2_C and F3 correspond to the activity of soils of poor quality (e.g., Haplic Luvisol) [51]. Fluvisols collected from the vicinity of Atamanskoe Lake (Russia) obtained a DHa activity of 70.73 µg TPF h−1 [52]. Phosphatases activity is related to soil pH, so it mainly depends on the pH and soil type [53]. The AcP and AlP values obtained are higher than in Eutric Fluvisol (Poland) tested by [54]. At the same time, the authors observed that both enzymes showed higher activity in soil with reduced tillage compared to conventional tillage, which is consistent with our results, as higher phosphatases values were observed in meadow soils.
The content of MBC and MBN differed between Fluvisols and between variants (Table 3). The highest value for both parameters was recorded in F3_M and the lowest in F1_C. In F1 and F3, the content of MBC and MBN was higher in the M, uncultivated variant, and in F2, in the soil under cultivation. The difference between the MBC content in F3_M and F1_M was as high as 69.22%, and for the C variant 63.85%. For MBN, the differences were 63.12% and 59.88% for variants M and C, respectively.
The MBC and MBN contents obtained are not different from those obtained by other Fluvisols researchers. In China, MBC was found to be 19.93–435.21 mg kg−1 and MBN 4.62–86.13 mg kg−1 [55]. Ref. [54] found MBC and MBN higher in soil with reduced tillage compared to conventional tillage but the values obtained (for both measurements) were significantly lower than those achieved in the present study. Previous studies of soils from the Vistula River valley in the Fluvisols medium, such as our F2, obtained MBC of 575 µg C g−1 d.m. soil and MBN of 106 µg N g−1 d.m. soil, which is about 50% and 60% (MBC and MBN, respectively) lower [39].

3.3. Microbiome Diversity of Fluvisols

The EcoPlate™ analysis showed statistically significant differences in the AWCD index between variants M and C, indicating a higher metabolic activity of microorganisms in the soil from the meadow in F2 and F3, and in F1 in the soil under the blackcurrant crop (Table 4). The calculated Shannon (H’) diversity and richness (R) indices were at a similar level in all samples; only for F2_C was a value statistically significantly lower than the others.
The results obtained from the EcoPlate™ analysis do not indicate statistically significant metabolic differences (H’, R) between the tested communities, but only differences in growth itself (AWCD index). The microorganisms from soil F1_C show the highest growth on the EcoPlate™, whereas the microorganisms from the uplifted variant from soil F2 and F3 show significantly lower growth. This confirms the results obtained for dehydrogenase activity, which indicate the presence of live microorganisms [53].
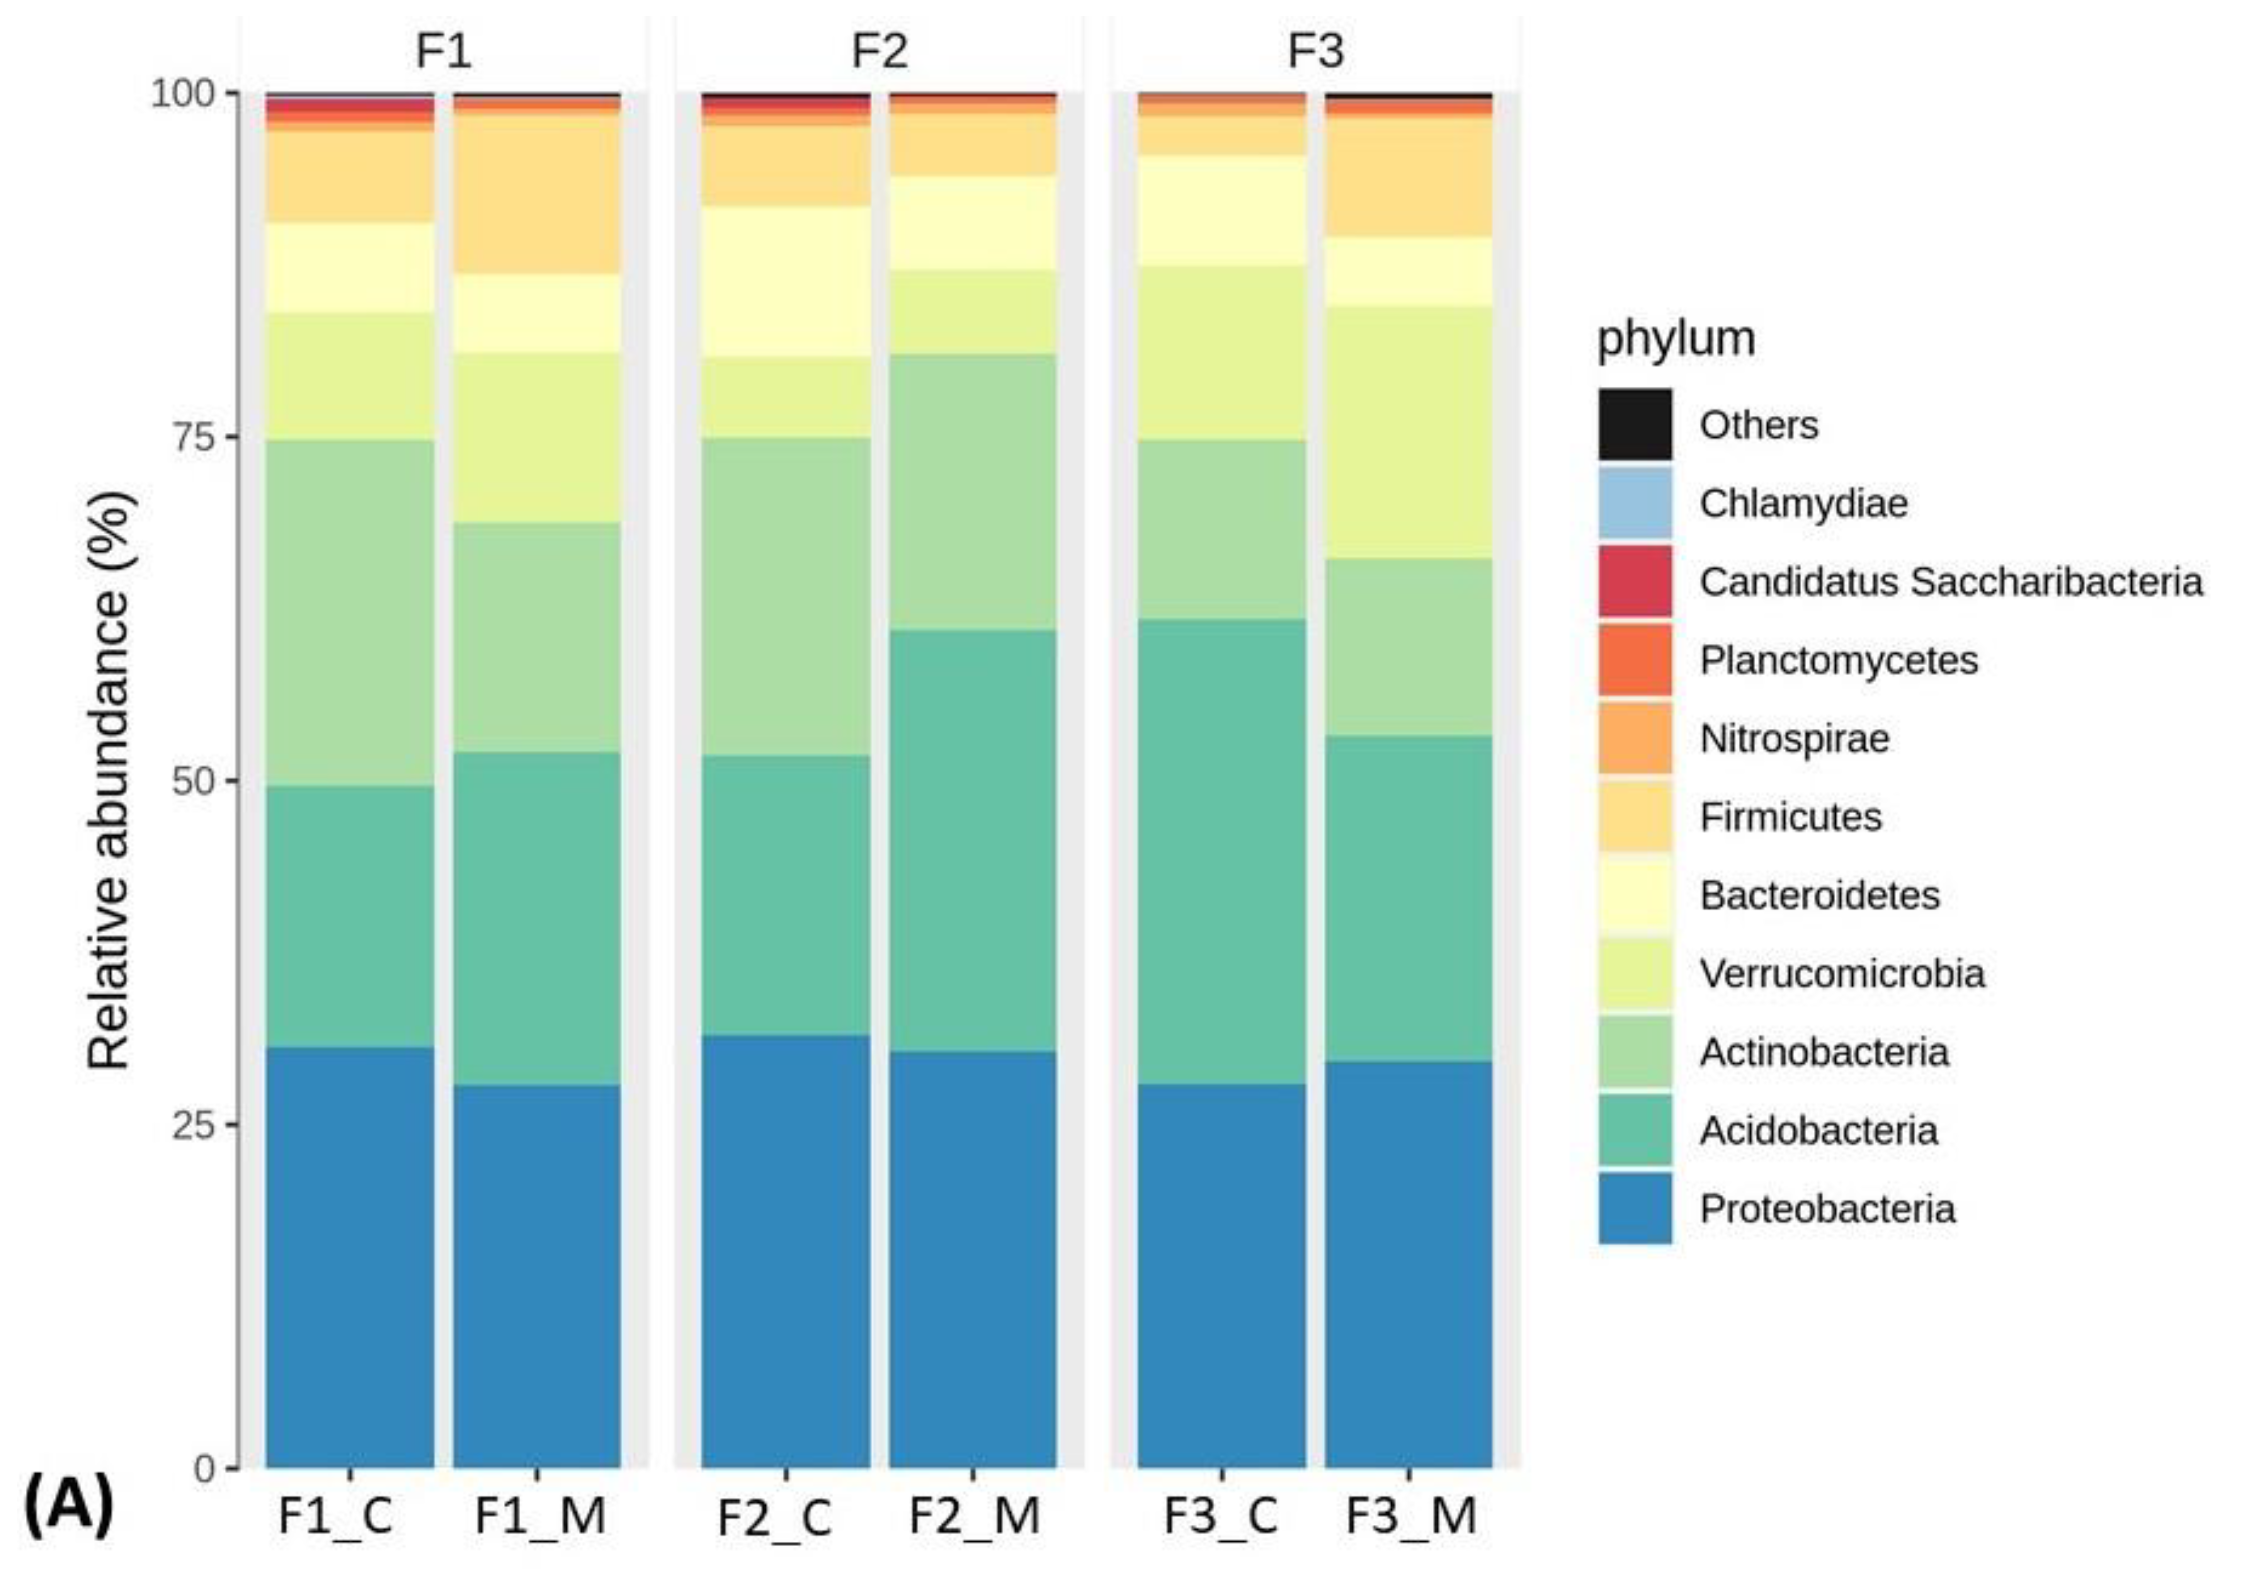
Although one would expect this soil to be characterised by the same dominant bacterial taxa, the differences are clear. Even at the phylum level, differences in the structure of the microbiome between the soils analysed are evident (Figure 2). The dominant bacteria found were the Proteobacteria (27.83%–31.50%), Acidobacteria (18.99%–33.74%), and Actinobaceria (12.90%–25.16%), but their proportion varied between soils and variants (Figure 3A). Based on relative abundance (%), the following pattern of the most abundant phyla can be observed:
  • F1_M: Proteobacteria > Acidobateria > Actinobacteria > Verrucomicrobia;
  • F1_C: Proteobacteria > Actinobacteria > Acidobacteria > Verrucomicrobia;
  • F2_M: Acidobacteria > Proteobacteria > Actinobacteria > Bacteroidetes;
  • F2_C: Proteobacteria > Actinobacteria > Acidobacteria > Bacteroidetes;
  • F3_M: Proteobacteria > Acidobateria > Verrucomicrobia > Actinobacteria;
  • F3_C: Acidobacteria > Proteobacteria > Actinobacteria > Verrucomicrobia.
Bacteria from the phyla Proteobacteria, Acidobacteria and Actinobacteria were also identified as dominant in a worldwide compilation of the soil microbiome [56] and in earlier studies in the Vistula River valley in Poland [21,39], as well as in Fluvisols in Vietnam (Pu Hoat Reserve) [57], or China (Beijing) [55]. A study by Praeg et al. (2020) on the microbiome of alpine meadows showed again the dominance of the phylum Actinobacteria [58]. The shift of Acidobacteria in F1_C and F2_C soils may be related to the significant N-NO3 content in these soils, as studies [59] have shown that an increase in soil nitrogen content causes a decrease in the abundance of bacteria from this phylum. Also, higher P content in soils causes a decrease in the abundance of Acidobacteria, with an increase in Actinobacteria, which is consistent with our observations of [55].
Although these differences are not statistically significant, an interesting observation is also the presence of the phyla Latescibacteria (0.11%) in F1, or Chloroflexi (0.16%) in F3. The presence of Latesibacteria in F1 soil is surprising, as representatives of this taxon prefer anaerobic- and nutrient-rich environments, particularly those with a high carbon content [60], and F1 is not particularly rich in OC and OM. At the same time, Latesibacteria have the ability to grow in environments contaminated with hydrocarbons and chlorinated solvents, and to degrade various types of polymers [61]. Perhaps such capabilities of the microbiome were needed in this particular soil. Again, bacteria of the Chloroflexi cluster are considered to be oligotrophs occurring more abundantly in nutrient-poor soils [62], which cannot be said for soil F3, which had up to three times more OC and OM compared to F1.
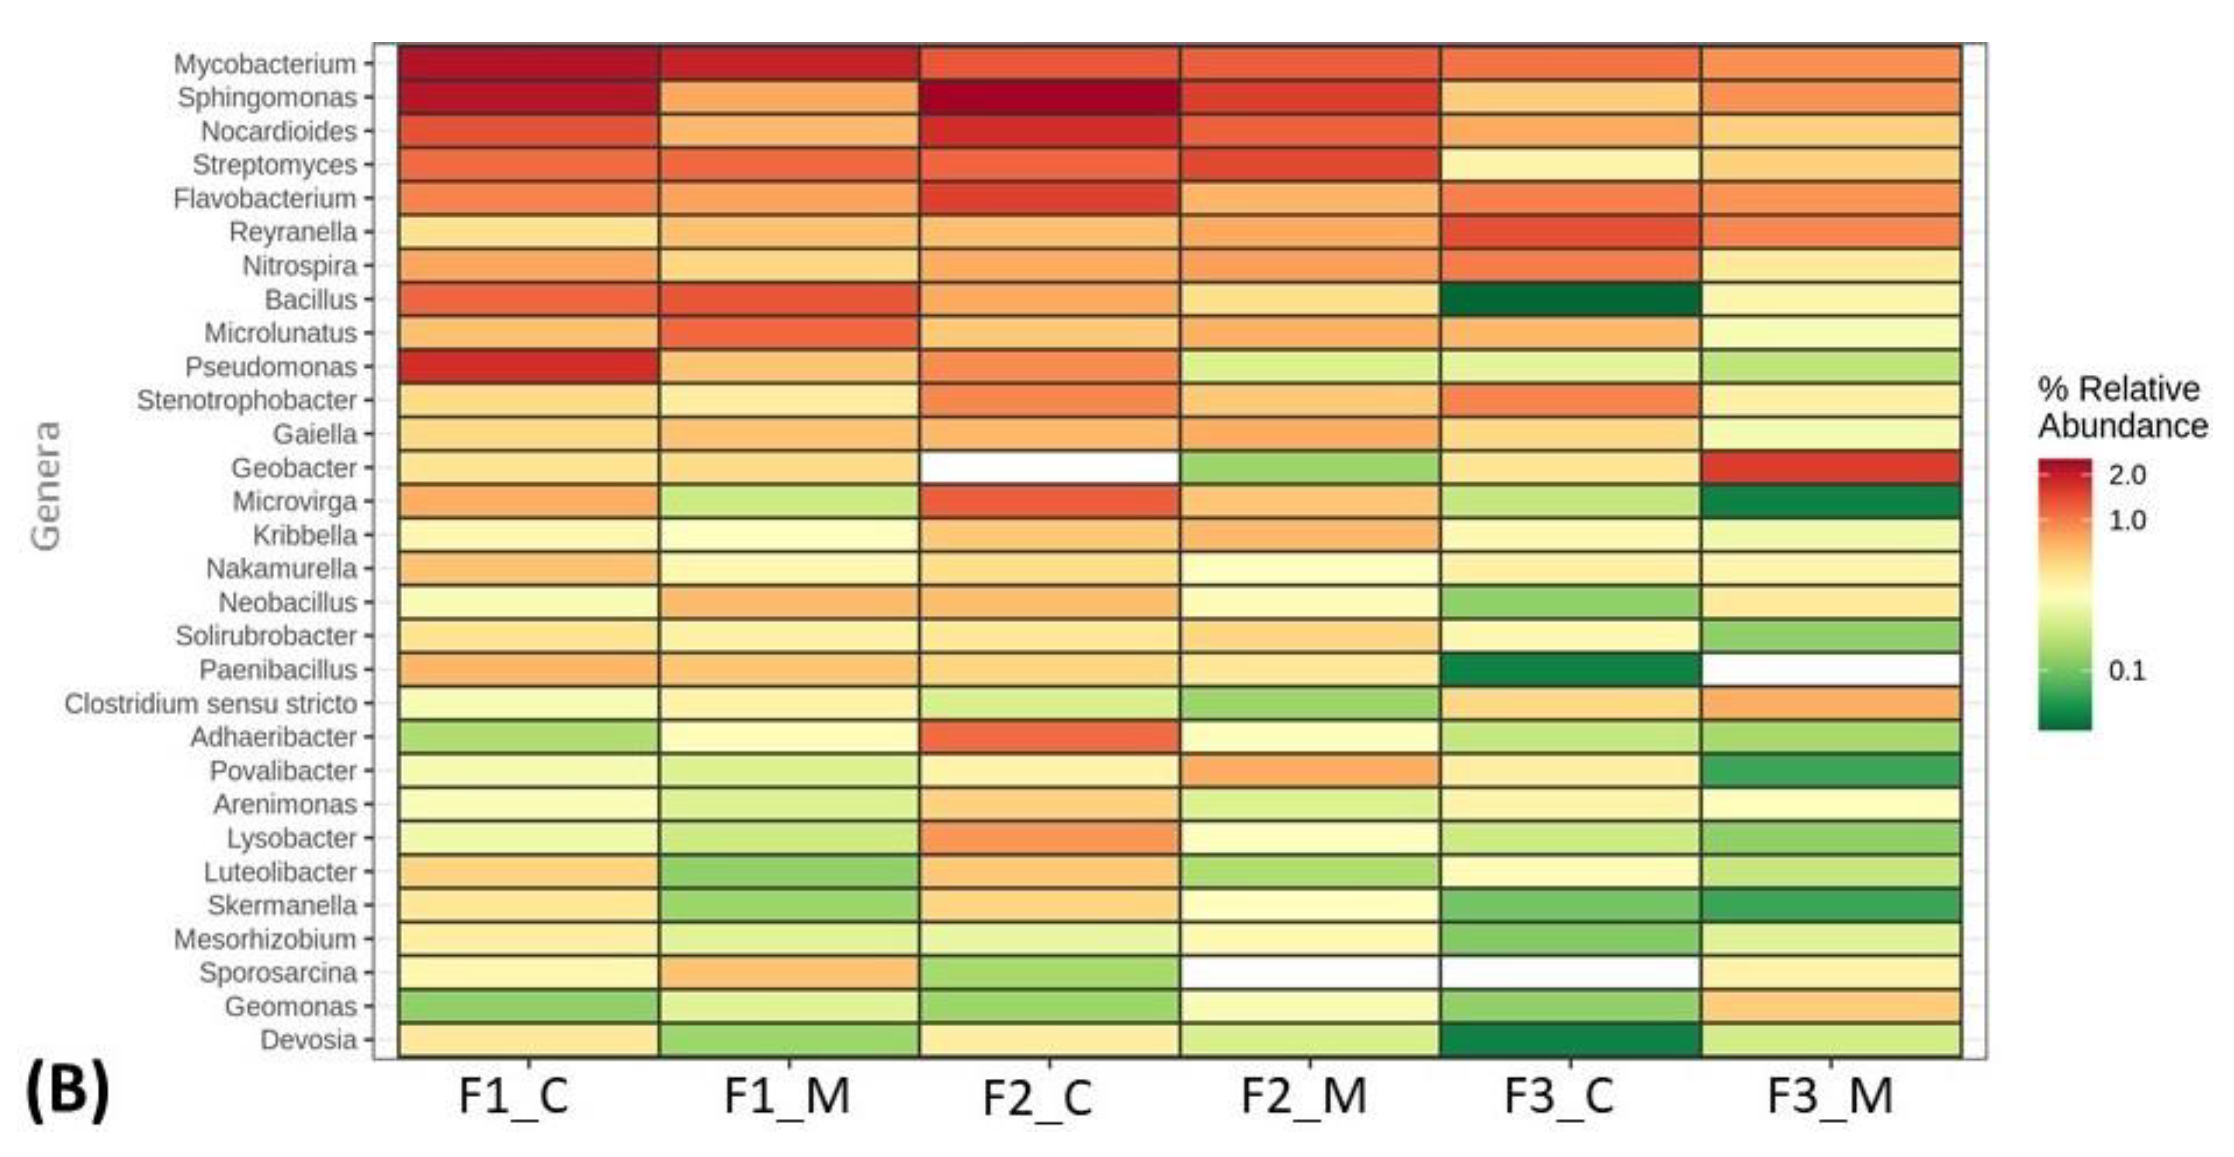
Analysis of bacterial diversity at the genus level (Figure 2B) showed that Mycobacterium predominated among the identified taxa, although their distribution of occurrence differed between soils. Based on relative abundance (%), the following pattern of the most abundant identified genera can be observed:
  • F1_M: Mycobacterium > Bacillus > Streptomyces > Microlunastus;
  • F1_C: Mycobacterium > Sphingomonas > Pseudomonas > Nocardioides;
  • F2_M: Sphingomonas > Streptomyces > Mycobacterium > Nocardioides;
  • F2_C: Sphingomonas > Nocardioides > Flavobacterium > Mycobacterium;
  • F3_M: Geobacter > Sphingomonas > Flavobacterium > Mycobacterium;
  • F3_C: Sphingomonas > Reyranella > Mycobacterium > Flavobacterium.
An interesting observation is the abundance of Geobacter sp. in F3_M (1.56%), whereas in the other soils it was present at a level of 0.13–0.50%, and was not detected at all in F2_C. The relative abundance of bacteria of the genus Pseudomonas was high in F1_C (1.72%), while it was much lower in the others (0.17–0.92%). The relative abundance of bacteria of the genus Bacillus was highest in F1 (1.32% and 1.17% in M and C, respectively), and the lowest in F3 (0.37% and 0.04% in M and C, respectively). Of the genera with relative abundance above 1.00%, the presence of Microvirga at 1.24% in F2_C is noteworthy, when in the other soils its occurrence was determined at 0.05–0.73%.
Statistically significant differences in relative abundance are evident at the phylum level when we analyse the differences between C and M (Figure 3A). Both variants were dominated by Proteobacteria (M—29.25%; C—30.03%), Acidobacteria (M—26.17%; C—24.37%) and Actinobacteria (M—16.58%; C—20.46%), but the differences between the abundance of these bacteria in both soil utilisation variants were statistically significant. A study by [26] showed that it is the type of land use that significantly influences the composition of the soil microbial community at the cluster level, in floodplain soils. A high abundance of Actinobacteria and Proteobacteria is characteristic of soils with high nutrient availability [63].
At the genus level, the dominant taxon in all soils was non-identified bacteria from the class Acidobacteria at 11.59% and 12.69% in the meadow and cultivated soil, respectively. Also showing high relative abundance were non-identified genus-level bacteria from the order Rhizobiales (10.99% and 8.28% for M and C, respectively) and the class Spartobacteria (9.78% and 6.10% for M and C, respectively). Among the identified genera, the predominant bacteria in cultivated soils were: Sphingomonas (1.77%), Mycobacterium (1.36%), and Nocardioides (1.29%) (Figure 3B). In contrast, meadow soil was dominated by identified bacteria from the genera: Mycobacterium (1.36%), Sphingomonas (1.07%), Streptomyces (1.05%). The higher occurrence of bacteria of the genus Sphingomonas in cultivated soils is consistent with the results of Wang et al. (2020) [64], which indicate a statistically higher abundance of these bacteria in disturbed Fluvisols (grazing animals), compared to controls. Bacteria in this genus are known to have diverse functions, some possessing plant growth-promoting properties and increasing tolerance to environmental stresses [65].
Looking for clear differences between the variants, the distribution of bacteria at genus level was carefully analysed (Figure 3C). Although both land use types in this study had similar dominant phyla and types, they differed significantly in the abundance of rare taxa. Although the differences obtained appear to be significant, e.g., Luteolibacter, Ohtaekwangia, Luteiealea, Cellulomonas, Nitrospira, Flavisolibacter, which were more abundant in C, or Geomonas, Matabacillus, Labrys, which predominated in M, these differences are not statistically significant. Ref. [26] indicate that soil microorganisms presumably involved in nitrogen cycling (e.g., Nitrosotaleales, Nitrososphaerales) in riparian zones were more dependent on land-use type than on flooding, with Nitrosospira only on land-use type. In the results discussed above, Nitrospira abundance was higher in F1 and F3_C compared to their M variants (by 0.25% and 0.59%, respectively), but in F2 the bacteria were more abundant in M (0.81%) than in C (0.74%). Bacteria of the genus Rhizobium, Nitrosospira were more abundant in C compared to M in each of the three soils tested. The higher abundance of Rhizobium bacteria under blackcurrant cultivation is surprising, as no legumes were observed there. The higher abundance of Nitrospira in cultivated soils is also surprising, as most studies indicate that in soils with high nitrogen content (especially N-NO3) their abundance decreases [59].
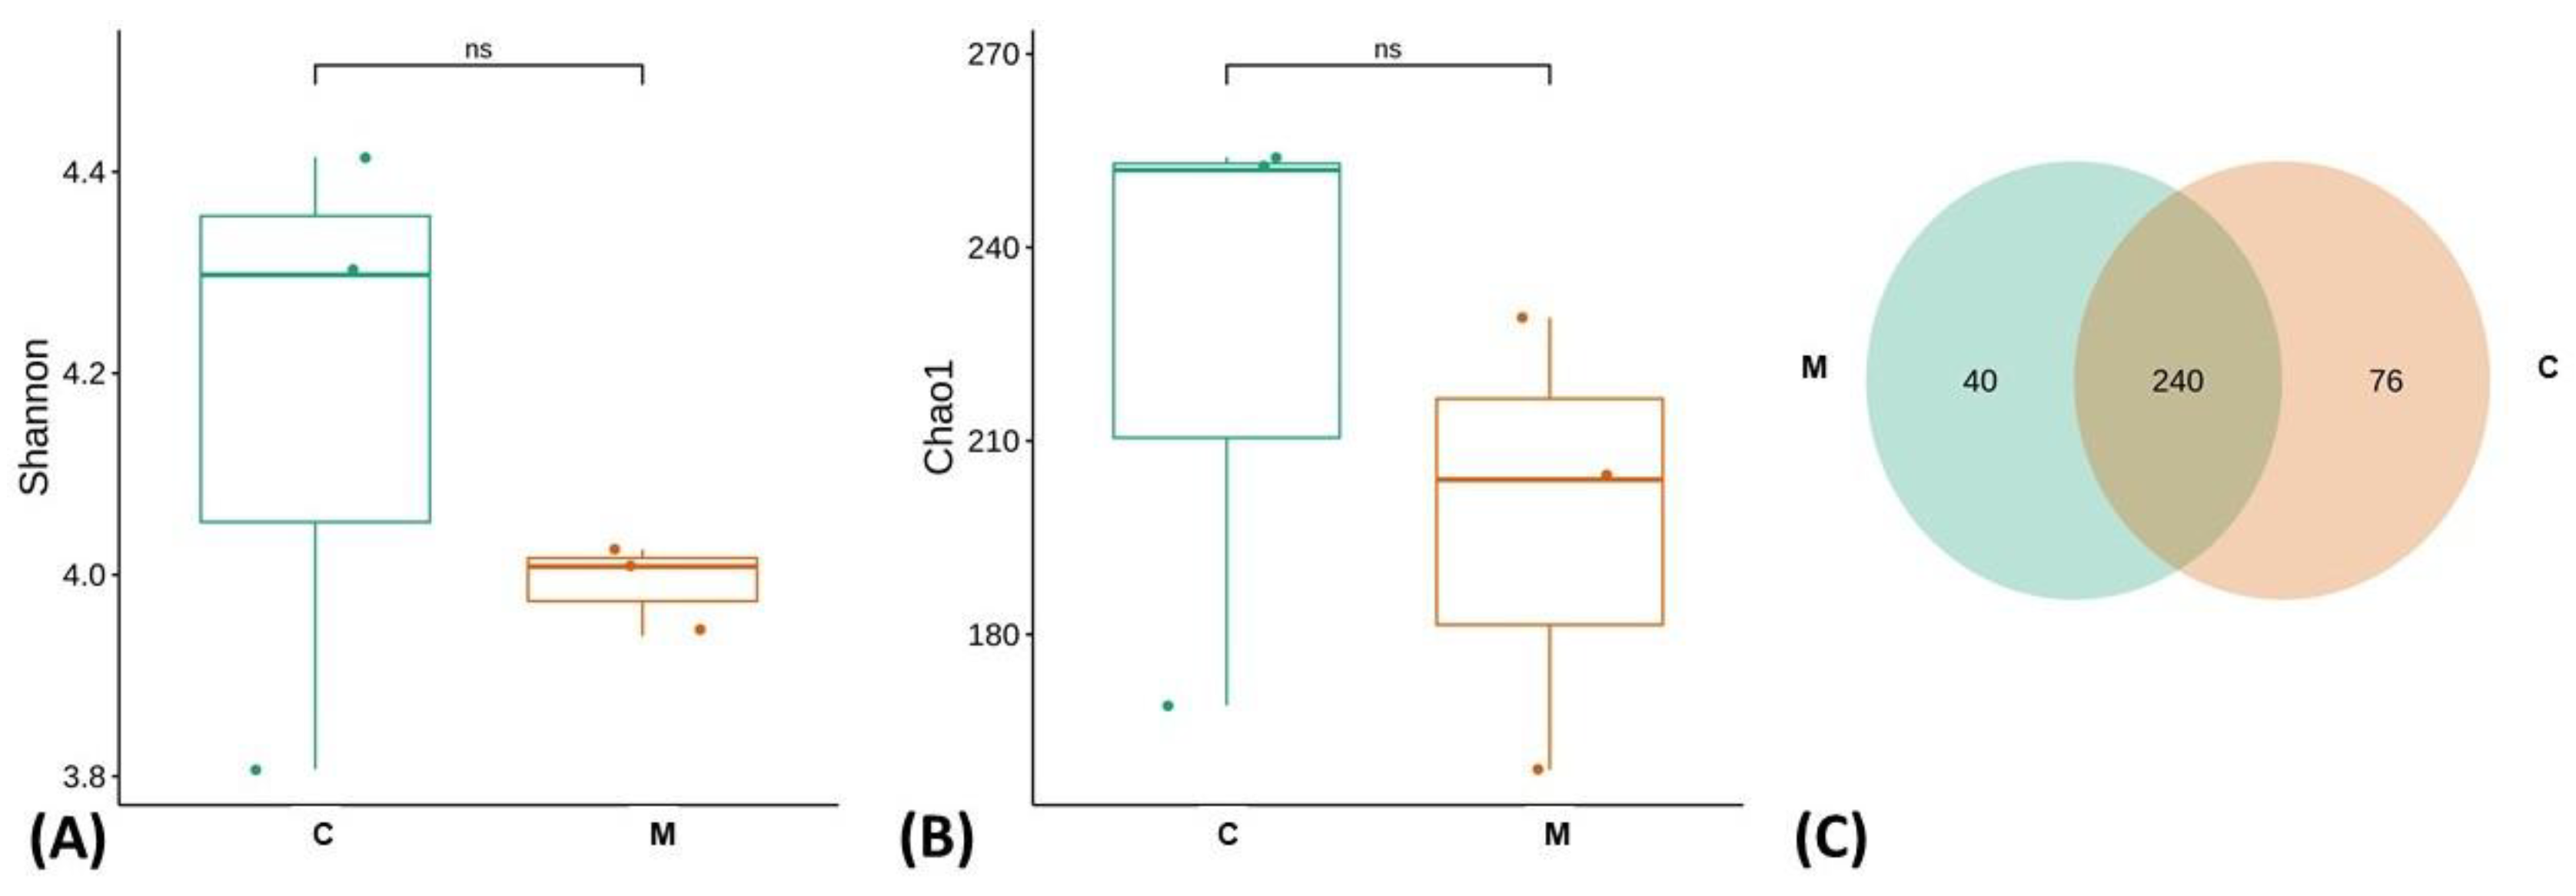
When we analysed the Chao 1 and Shannon indices obtained for the variants, differences were noted, but these were not statistically significant (Figure 4). The cultivated soil had a higher diversity (Shannon and Chao 1 indices) compared to the meadow soil (Figure 4A,B). Meadow and cultivated soils shared 240 bacterial taxa (Figure 4C).
Georgfuchsia sp., Dictyobacter sp., Polaromonas sp., Dokdonella sp. can be distinguished among the 40 taxa that are the hallmark of soil from grasslands. Georgfuchsia sp. has the ability to degrade aromatic compounds, can grow anaerobically with Fe(III) utilisation as the final electron acceptor and has been identified as an endophyte of rice [66]; Dictyobacter sp. has also been identified in soils from under rice cultivation, and representatives of this species are commonly isolated from geothermal sites [67]; Polaromonas sp. is a genus isolated from Arctic and PAH-contaminated environments known for its ability to degrade aromatic compounds [68]; Dokdonella sp. is a genus of bacteria isolated from soil, several species can perform aerobic nitrate reduction and are considered active root colonizing agents [69,70]. In contrast, Microbacterium sp., Daejeonella sp., Ohtaekwangia sp., Oligoflexus sp., Altererythrobacter sp., Peredibacter sp. were identified as characteristic of the soil under blackcurrant cultivation. Bacteria of the genus Microbacterium have been isolated from a wide range of hosts and environments, including sites contaminated with heavy metals [71]; Daejeonella sp. has been isolated from rice fields and composts [72]; Ohtaekwangia sp. is considered a plant growth-promoting bacterium and was isolated in soil from an apple orchard [73]; Oligoflexus sp. has been identified as a bacterium of the rhizosphere of maize, buckwheat or barley and has some plant growth-promoting characteristics and may assist with salt stress [74,75]; Altererythrobacter sp has been isolated from petroleum-contaminated soils and from the rhizosphere [76,77]; Peredibacter sp. is a predatory bacterium—a bacterivore—found in soil and wastewater and isolated in river sediments [78]. The occurrence of such diverse taxa in the same soil but one cultivated and the other not cultivated is very intriguing. The presence of contaminant-degrading bacteria (PAHs, metals, etc.) may indicate some historical availability of contaminants in these soils. As the area is a floodplain of the River Vistula, PAH contamination may have occurred there under the influence of flooding, but hydrocarbon analysis was not the focus of this study. The occurrence of bacteria with plant growth-promoting properties is very beneficial to the crops and orchards grown in the area. As can be seen, some of these bacteria (e.g., Daejeonella, Peredibacter, Dictyobacter, Georgfuchsia) were isolated from rice fields or riverine areas, which corresponds to the nature of the soils studied—Fluvisols in the floodplain.
Cultivated soils tend to have less biodiversity, whereas natural ecosystems are more complex [79]. Intensive cultivation is also reflected in the microbiome of the fruits themselves [80]. In the present study, we found a higher biological activity of meadow soils, but at the same time a higher bacterial taxonomic biodiversity in the soils under blackcurrant cultivation. This is a surprising observation. It may be due, in our opinion, to several reasons: (1) fertilisation is applied to the currant rows, which provides an additional source of nutrients for the microbes; (2) the blackcurrant itself secretes root secretions into the rhizosphere, which influences the diversity of the microbiome; (3) the maintenance of an ecological equilibrium in non-agricultural soil does not require the involvement of many bacterial taxa. Soil nitrogen addition affects the soil microbiome; however, how changes occur depends on the soil type, vegetation, etc. Research by [81] showed a non-linear response of bacteria to N addition, but the loss of biodiversity was explained by a combination of parameters such as increasing N content, decreasing pH, plant community. Studies showed that cultivation of alfalfa and maize increased alpha bacterial diversity in the soil compared to meadows cropping, and even increases in long-term, continuous cultivation [63]. However, studies confirming currants’ production of compounds attractive to soil bacteria are not available. It is known that currant fruit juice has a rich composition of carbohydrate, uronic acid, protein, anthocyanin and calcium [82], but no work has been found on root secretions. Nevertheless, it can be assumed that several years of currant cultivation modify the chemical properties of the soil and especially of the rhizosphere. The secretion of flavonoids and plant hormones into the soil may affect the diversity of microorganisms [63]. Soil redundancy and the preservation of eubiosis may be more important than the addition of nutrients to the soil [83]. The high diversity of the microbiome enables the ecosystem function to be maintained under stress [84]. Our previous analyses in riparian areas showed that Fluvisols with lower fertility had a higher microbial diversity [21,39]. It seems likely, therefore, that in the present study we observe a similar relationship—the cultivated soil has higher NGS biodiversity indices, while the F1 soil with the lowest physico-chemical indices had the highest diversity (Figure S1).

4. Conclusions

The evaluation of the impact of blackcurrant cultivation on the biological activity of Fluvisols clearly confirmed that human activity affects all soil quality parameters: physico-chemical, biological and microbiological. However, the results obtained do not completely support the hypothesis that grassland soils have higher biological activity and microbial diversity compared to soils under cultivation. Enzymatic activity and metabolic potential and diversity (EcoPlate™) were higher in the grassland variants, but C and N contents of microbial biomass and biodiversity indices obtained from NGS were higher in the cultivated soils.
This may indicate that microorganisms are numerically more abundant and taxonomically more diverse in the cultivated soils, but are more active in the grassland soils. This may be related to the availability of nutrients such as N, C and Mg, which were more abundant in the grassland soils. We hypothesise that a smaller pool of microorganisms is sufficient to perform all functions in the soil ecosystem in fertile soils unaffected by agrotechnical activities, whereas the maintenance of eubiosis in mechanically and fertilised agricultural soils requires the involvement of more microorganisms with a wider functional spectrum. This is suggested by NGS results, including shifts in the ratio of microbiome species composition and higher taxonomic diversity in cultivated soils. However, the results presented are preliminary and these conclusions require further investigation. It would be worth investigating the composition of blackcurrant root secretions and delving into bacterial functionality to determine whether a smaller number of taxa is actually sufficient for all soil functions (biogeochemical cycles).

Supplementary Materials

The following supporting information can be downloaded at: https://www.mdpi.com/article/10.3390/agronomy14030480/s1, Figure S1: Indices obtained from NGS at genera level for different Fluvisols: (A) Chao 1; (B) Shannon indices; (C) Venn diagram; Table S1: Detailed characterisation of the sampling sites; Table S2: Information on deposited sequences in NCBI database (Bioproject PRJNA1055027); Table S3: Trace elements contents (g kg−1 of soil) in examined Fluvisols; Table S4: Relative abundance (%) of bacterial taxa in examined Fluvisols.

Author Contributions

Conceptualization, K.F. and K.G.; methodology, K.F., K.G., A.M.-G. and J.N.; investigation, K.F., K.G., A.M.-G. and J.N.; writing—original draft preparation, K.F. and A.M.-G.; writing—review and editing, K.F.; visualization, K.F. and A.M.-G.; project administration, K.F.; funding acquisition, K.F. All authors have read and agreed to the published version of the manuscript.

Funding

The research was carried out within the framework of project No. 2019/35/N/NZ9/00830 entitled: “The search for bacteria adapting to extreme soil moisture conditions and the assessment of the effects of hydric stress on the quality of the soil environment” funded by the National Science Centre Poland (NCN).

Data Availability Statement

Publicly available datasets were analyzed in this study. This data can be found here: https://www.ncbi.nlm.nih.gov/bioproject/PRJNA1055027/.

Acknowledgments

The authors of the manuscript would like to thank Beata Bartosiewicz for allowing the research to be carried out on her land.

Conflicts of Interest

The authors declare no conflicts of interest. The funders had no role in the design of the study; in the collection, analyses, or interpretation of data; in the writing of the manuscript; or in the decision to publish the results.

References

  1. Lehmann, J.; Bossio, D.A.; Kögel-Knabner, I.; Rillig, M.C. The Concept and Future Prospects of Soil Health. Nat. Rev. Earth Environ. 2020, 1, 544–553. [Google Scholar] [CrossRef]
  2. Zwetsloot, M.J.; van Leeuwen, J.; Hemerik, L.; Martens, H.; Simó Josa, I.; Van de Broek, M.; Debeljak, M.; Rutgers, M.; Sandén, T.; Wall, D.P.; et al. Soil Multifunctionality: Synergies and Trade-Offs across European Climatic Zones and Land Uses. Eur. J. Soil Sci. 2021, 72, 1640–1654. [Google Scholar] [CrossRef]
  3. Delgado-Baquerizo, M.; Reich, P.B.; Trivedi, C.; Eldridge, D.J.; Abades, S.; Alfaro, F.D.; Bastida, F.; Berhe, A.A.; Cutler, N.A.; Gallardo, A.; et al. Multiple Elements of Soil Biodiversity Drive Ecosystem Functions across Biomes. Nat. Ecol. Evol. 2020, 4, 210–220. [Google Scholar] [CrossRef]
  4. Girvan, M.S.; Bullimore, J.; Pretty, J.N.; Osborn, A.M.; Ball, A.S. Soil Type Is the Primary Determinant of the Composition of the Total and Active Bacterial Communities in Arable Soils Soil Type Is the Primary Determinant of the Composition of the Total and Active Bacterial Communities in Arable Soils. Soil Biol. Biochem. 2014, 8, 1–8. [Google Scholar] [CrossRef]
  5. de Gannes, V.; Eudoxie, G.; Bekele, I.; Hickey, W.J. Relations of Microbiome Characteristics to Edaphic Properties of Tropical Soils from Trinidad. Front. Microbiol. 2015, 6, 01045. [Google Scholar] [CrossRef] [PubMed]
  6. Suzuki, C.; Kunito, T.; Aono, T.; Liu, C.-T.; Oyaizu, H. Microbial Indices of Soil Fertility. J. Appl. Microbiol. 2005, 98, 1062–1074. [Google Scholar] [CrossRef]
  7. Gałązka, A.; Łyszcz, M.; Abramczyk, B.; Furtak, K.; Grządziel, J.; Czaban, J.; Pikulicka, A. Biodiversity of Soil Environment—Overview of Parameters and Methods in Soil Biodiversity Analyses; Monografie i Rozprawy naukowe IUNG-PIB: Puławy, Poland, 2016; ISBN 978-83-7562-246-1. [Google Scholar]
  8. Özcan, H. Fluvisols; Springer: Berlin/Heidelberg, Germany, 2018. [Google Scholar]
  9. Mays, L.W. Water Technology in Ancient Egypt. In Ancient Water Technologies; Springer: Dordrecht, The Netherlands, 2010; pp. 53–65. ISBN 9789048186310. [Google Scholar]
  10. Morozova, G.S. A Review of Holocene Avulsions of the Tigris and Euphrates Rivers and Possible Effects on the Evolution of Civilizations in Lower Mesopotamia. Geoarchaeology 2005, 20, 401–423. [Google Scholar] [CrossRef]
  11. Li, Y.; Jiang, Z.; Chen, Z.; Yu, Y.; Lan, F.; Shan, Z.; Sun, Y.; Liu, P.; Tang, X.; Rodrigo-Comino, J. Anthropogenic Disturbances and Precipitation Affect Karst Sediment Discharge in the Nandong Underground River System in Yunnan, Southwest China. Sustainability 2020, 12, 3006. [Google Scholar] [CrossRef]
  12. FAO. World Reference Base for Soil Resources 2006; FAO: Rome, Italy, 2006. [Google Scholar]
  13. Anjos, L.; Gaistardo, C.; Deckers, J.; Dondeyne, S.; Eberhardt, E.; Gerasimova, M.; Harms, B.; Jones, A.; Krasilnikov, P.; Reinsch, T.; et al. World Reference Base for Soil Resources 2014. In International Soil Classification System for Naming Soils and Creating Legends for Soil Maps, JRC91947 ed.; Schad, P., Van Huyssteen, C., Micheli, E., Eds.; FAO: Rome, Italy, 2014; ISBN 9789251083697. [Google Scholar]
  14. Banach-Szott, M.; Kondratowicz-Maciejewska, K.; Kobierski, M. Humic Substances in Fluvisols of the Lower Vistula Floodplain, North Poland. Environ. Sci. Pollut. Res. 2018, 25, 23992–24002. [Google Scholar] [CrossRef]
  15. Cyberski, J.; Grześ, M.; Gutry-Korycka, M.; Nachlik, E.; Kundzewicz, Z.W. History of Floods on the River Vistula. Hydrol. Sci. J. 2006, 51, 799–817. [Google Scholar] [CrossRef]
  16. Kobierski, M.; Banach-Szott, M. Organic Matter in Riverbank Sediments and Fluvisols from the Flood Zones of Lower Vistula River. Agronomy 2022, 12, 536. [Google Scholar] [CrossRef]
  17. Orzechowski, M.; Smólczyński, S.; Kalisz, B.; Sowiński, P. Origin, Properties and Agricultural Value of Alluvial Soils in the Vistula and Pasłęka Deltas, North Poland. Soil Sci. Annu. 2022, 73, 157350. [Google Scholar] [CrossRef]
  18. Rodrigo-Comino, J.; Keshavarzi, A.; Senciales-González, J.M. Evaluating Soil Quality Status of Fluvisols at the Regional Scale: A Multidisciplinary Approach Crossing Multiple Variables. River Res. Appl. 2023, 39, 1367–1381. [Google Scholar] [CrossRef]
  19. Shi, M.; Wu, H.; Fan, X.; Jia, H.; Dong, T.; He, P.; Baqa, M.F.; Jiang, P. Trade-Offs and Synergies of Multiple Ecosystem Services for Different Land Use Scenarios in the Yili River Valley, China. Sustainability 2021, 13, 1577. [Google Scholar] [CrossRef]
  20. Shi, F.; Liu, S.; Sun, Y.; An, Y.; Zhao, S.; Liu, Y.; Li, M. Ecological Network Construction of the Heterogeneous Agro-Pastoral Areas in the Upper Yellow River Basin. Agric. Ecosyst. Environ. 2020, 302, 107069. [Google Scholar] [CrossRef]
  21. Furtak, K.; Grządziel, J.; Gałązka, A.; Niedźwiecki, J. Prevalence of Unclassified Bacteria in the Soil Bacterial Community from Floodplain Meadows (Fluvisols) under Simulated Flood Conditions Revealed by a Metataxonomic Approachss. Catena 2020, 188, 104448. [Google Scholar] [CrossRef]
  22. Silvana, V.M.; Carlos, F.J.; Lucía, A.C.; Natalia, A.; Marta, C. Colonization Dynamics of Arbuscular Mycorrhizal Fungi (AMF) in Ilex Paraguariensis Crops: Seasonality and Influence of Management Practices. J. King Saud. Univ. Sci. 2020, 32, 183–188. [Google Scholar] [CrossRef]
  23. Sánchez-Rodríguez, A.R.; Nie, C.; Hill, P.W.; Chadwick, D.R.; Jones, D.L. Extreme Flood Events at Higher Temperatures Exacerbate the Loss of Soil Functionality and Trace Gas Emissions in Grassland. Soil Biol. Biochem. 2019, 130, 227–236. [Google Scholar] [CrossRef]
  24. Mhuantong, W.; Wongwilaiwalin, S.; Laothanachareon, T.; Eurwilaichitr, L.; Tangphatsornruang, S.; Boonchayaanant, B.; Limpiyakorn, T.; Pattaragulwanit, K.; Punmatharith, T.; McEvoy, J.; et al. Survey of Microbial Diversity in Flood Areas during Thailand 2011 Flood Crisis Using High-Throughput Tagged Amplicon Pyrosequencing. PLoS ONE 2015, 10, e0128043. [Google Scholar] [CrossRef]
  25. Ralph, T.J.; Kobayashi, T. Impact of Inundation on Soil Microbiology. Microbiol. Aust. 2023, 44, 181–184. [Google Scholar] [CrossRef]
  26. Ding, L.; Zhou, J.; Li, Q.; Tang, J.; Chen, X. Effects of Land-Use Type and Flooding on the Soil Microbial Community and Functional Genes in Reservoir Riparian Zones. Microb. Ecol. 2022, 83, 393–407. [Google Scholar] [CrossRef]
  27. Climate date.org. Climate Date. Available online: https://en.climate-data.org/ (accessed on 11 January 2019).
  28. Litynski, T.; Jurkowska, H.; Gorlach, E. Chemical and Agricultural Analysis; Wydawnictwo Naukowe PWN: Warszawa, Poland, 1976. [Google Scholar]
  29. Ostrowska, A.; Gawliński, S.; Szczubiałka, Z. Methods of Analysis and Assessment of Soil and Plant Properties: Catalogue; Dział Wydawnictw IOŚ: Warszawa, Poland, 1991. [Google Scholar]
  30. DIN/ISO 13878:1998; Soil Quality—Determination of Total Nitrogen Content by Dry Combustion (“Elemental Analysis”). American National Standards Institute: Washington, DC, USA, 2007.
  31. ISO 13395:1996; Water Quality—Determination of Nitrite Nitrogen and Nitrate Nitrogen and the Sum of Both by Flow Analysis (CFA and FIA) and Spectrometric Detection. American National Standards Institute: Washington, DC, USA, 1996.
  32. Casida, L.; Klein, D.; Santoro, T. Soil Dehydrogenase Activity. Soil Sci. 1964, 98, 371–376. [Google Scholar] [CrossRef]
  33. Tabatabai, M.A. Soil Enzymes. In Methods of Soil Analysis; Page, A.L., Miller, R.H., Keeney, D.R., Eds.; American Society of Agronomy Inc.; Soil Science Society of America Inc.: Madison, WI, USA, 1982; pp. 903–948. [Google Scholar]
  34. PN-ISO 1038-6:1998; Soil Quality—Determination of Soil Microbial Biomass—Part 2: Fumigation-Extraction Method. American National Standards Institute: Washington, DC, USA, 2007.
  35. Weber, K.P.; Legge, R.L. One-Dimensional Metric for Tracking Bacterial Community Divergence Using Sole Carbon Source Utilization Patterns. J. Microbiol. Methods 2009, 79, 55–61. [Google Scholar] [CrossRef] [PubMed]
  36. Insam, H.; Goberna, M. Use of Biolog® for the Community Level Physiological Profiling (CLPP) of Environmental Samples. In Molecular Microbial Ecology Manual; Kowalchuk, G.A., de Brujin, F.J., Head, I.M., Akkermans, A.D., van Elsas, J.D., Eds.; Kluwer Academic Publishers: Dordrecht, The Netherlands, 2004; pp. 853–860. [Google Scholar]
  37. Klindworth, A.; Pruesse, E.; Schweer, T.; Peplies, J.; Quast, C.; Horn, M.; Glöckner, F.O. Evaluation of General 16S Ribosomal RNA Gene PCR Primers for Classical and Next-Generation Sequencing-Based Diversity Studies. Nucleic Acids Res. 2013, 41, e1. [Google Scholar] [CrossRef] [PubMed]
  38. Garland, J.L.; Mills, A.L. Classification and Characterization of Heterotrophic Microbial Communities on the Basis of Patterns of Community-Level Sole-Carbon-Source Utilization. Appl. Environ. Microbiol. 1991, 57, 2351–2359. [Google Scholar] [CrossRef]
  39. Furtak, K.; Grządziel, J.; Gałązka, A.; Niedźwiecki, J. Analysis of Soil Properties, Bacterial Community Composition, and Metabolic Diversity in Fluvisols of a Floodplain Area. Sustainability 2019, 11, 3929. [Google Scholar] [CrossRef]
  40. Frąc, M.; Oszust, K.; Lipiec, J. Community Level Physiological Profiles (CLPP), Characterization and Microbial Activity of Soil Amended with Dairy Sewage Sludge. Sensors 2012, 12, 3253. [Google Scholar] [CrossRef]
  41. Callahan, B.J.; McMurdie, P.J.; Rosen, M.J.; Han, A.W.; Johnson, A.J.A.; Holmes, S.P. DADA2: High-Resolution Sample Inference from Illumina Amplicon Data. Nat. Methods 2016, 13, 581–583. [Google Scholar] [CrossRef] [PubMed]
  42. R Core Team. R: A Language and Environment for Statistical Computing. In R Foundation for Statistical Computing; R Core Team: Vienna, Austria, 2016. [Google Scholar]
  43. Wang, Q.; Garrity, G.M.; Tiedje, J.M.; Cole, J.R. Naive Bayesian Classifier for Rapid Assignment of RRNA Sequences into the New Bacterial Taxonomy. Appl. Environ. Microbiol. 2007, 73, 5261–5267. [Google Scholar] [CrossRef]
  44. Murali, A.; Bhargava, A.; Wright, E.S. IDTAXA: A Novel Approach for Accurate Taxonomic Classification of Microbiome Sequences. Microbiome 2018, 6, 140. [Google Scholar] [CrossRef]
  45. McMurdie, P.J.; Holmes, S. Phyloseq: An R Package for Reproducible Interactive Analysis and Graphics of Microbiome Census Data. PLoS ONE 2013, 8, e61217. [Google Scholar] [CrossRef]
  46. Liu, C.; Cui, Y.; Li, X.; Yao, M. Microeco: An R Package for Data Mining in Microbial Community Ecology. FEMS Microbiol. Ecol. 2021, 97, 255. [Google Scholar] [CrossRef]
  47. Šimanský, V. Can Soil Properties of Fluvisols Be Influenced by River Flow Gradient? Acta Fytotech. Zootech. 2018, 21, 63–76. [Google Scholar] [CrossRef]
  48. Kobierski, M. Evaluation of the Content of Heavy Metals in Fluvisols of Floodplain Area Depending on the Type of Land Use. J. Ecol. Eng. 2015, 16, 23–31. [Google Scholar] [CrossRef] [PubMed]
  49. Journal of Laws 2002 No 165 Item 1359 Dziennik Ustaw 2002. Rozporza˛dzenie Ministra S´rodowiska, Z˙ Elichowski, S. z Dn. 09.09.2002 w Sprawie Standardów Jakos´ci Gleby Oraz Jakos´ci Ziemi. Dz. U. 2002, Nr 165, Poz. 1359. Available online: http://prawo.sejm.gov.pl/isap.nsf/DocDetails.xsp?%20id=WDU200216%2051359 (accessed on 10 December 2023).
  50. Sowiński, P.; Glińska-Lewczuk, K.; Kalisz, B.; Astel, A. Distribution of heavy metals in soils in a postglacial river valley—A geochemical landscape approach. Environ. Eng. Manag. J. (EEMJ) 2016, 15, 1323–1335. [Google Scholar] [CrossRef]
  51. Grządziel, J.; Gałązka, A.; Gałazka, A. Microplot Long-Term Experiment Reveals Strong Soil Type Influence on Bacteria Composition and Its Functional Diversity. Appl. Soil Ecol. 2018, 124, 117–123. [Google Scholar] [CrossRef]
  52. Zamulina, I.V.; Gorovtsov, A.V.; Minkina, T.M.; Mandzhieva, S.S.; Burachevskaya, M.V.; Bauer, T.V. Soil Organic Matter and Biological Activity under Long-Term Contamination with Copper. Environ. Geochem. Health 2022, 44, 387–398. [Google Scholar] [CrossRef] [PubMed]
  53. Furtak, K.; Gałązka, A. Enzymatic Activity as a Popular Parameter Used to Determine the Quality of the Soil Environment. Pol. J. Agron. 2019, 37, 22–30. [Google Scholar] [CrossRef]
  54. Gajda, A.M.; Czyż, E.A.; Klimkowicz-Pawlas, A. Effects of Different Tillage Intensities on Physicochemical and Microbial Properties of a Eutric Fluvisol Soil. Agronomy 2021, 11, 1497. [Google Scholar] [CrossRef]
  55. Liu, C.; Zhao, X.; Lin, Q.; Li, G. Decrease in Diversity and Shift in Composition of the Soil Bacterial Community Were Closely Related to High Available Phosphorus in Agricultural Fluvisols of North China. Acta Agric. Scand. B Soil Plant Sci. 2019, 69, 618–630. [Google Scholar] [CrossRef]
  56. Delgado-Baquerizo, M.; Oliverio, A.M.; Brewer, T.E.; Benavent-González, A.; Eldridge, D.J.; Bardgett, R.D.; Maestre, F.T.; Singh, B.K.; Fierer, N. A Global Atlas of the Dominant Bacteria Found in Soil. Science 2018, 359, 320–325. [Google Scholar] [CrossRef]
  57. Kniazeva, A.V.; Lysak, L.V.; Manucharova, N.A.; Lapygina, E.V.; Aleksandrova, A.V. Abundance and Taxonomic Diversity of Prokaryotes in Fluvisol and Associated Substrates (Vietnam, Pu Hoat Reserve). Eurasian Soil Sci. 2022, 55, 1460–1469. [Google Scholar] [CrossRef]
  58. Praeg, N.; Seeber, J.; Leitinger, G.; Tasser, E.; Newesely, C.; Tappeiner, U.; Illmer, P. The Role of Land Management and Elevation in Shaping Soil Microbial Communities: Insights from the Central European Alps. Soil Biol. Biochem. 2020, 150, 107951. [Google Scholar] [CrossRef]
  59. Yu, X.Y.; Zhu, Y.J.; Wang, B.; Liu, D.; Bai, H.; Jin, L.; Wang, B.T.; Ruan, H.H.; Mao, L.; Jin, F.J.; et al. Effects of Nitrogen Addition on Rhizospheric Soil Microbial Communities of Poplar Plantations at Different Ages. For. Ecol. Manag. 2021, 494, 119328. [Google Scholar] [CrossRef]
  60. Lan, J.; Wang, S.; Wang, J.; Qi, X.; Long, Q.; Huang, M. The Shift of Soil Bacterial Community After Afforestation Influence Soil Organic Carbon and Aggregate Stability in Karst Region. Front. Microbiol. 2022, 13, 901126. [Google Scholar] [CrossRef]
  61. Farag, I.F.; Youssef, N.H.; Elshahed, M.S. Global Distribution Patterns and Pangenomic Diversity of the Candidate Phylum “Latescibacteria” (WS3). Appl. Environ. Microbiol. 2017, 83, e00521-17. [Google Scholar] [CrossRef]
  62. Choudhary, S.; Mishra, B.K.; Singh, R.; Sharma, R. Bacterial Diversity and Bio-Chemical Properties in the Rhizosphere Soils of Cumin and Coriander. Trop. Ecol. 2021, 62, 368–376. [Google Scholar] [CrossRef]
  63. Yang, Z.; Xu, Y.; Li, H.; Li, S.; Wang, X.; Chai, H. Difference of Bacterial Community Structure in the Meadow, Maize, and Continuous Cropped Alfalfa in Northeast China. Front. Microbiol. 2022, 13, 794848. [Google Scholar] [CrossRef] [PubMed]
  64. Wang, H.; Liu, S.; Kuzyakov, Y.; Zhan, P.; Wang, Q.; Hettenhausen, C.; Xiao, D.; Qi, J.; Zhang, Z. Differentiating Microbial Taxonomic and Functional Responses to Physical Disturbance in Bulk and Rhizosphere Soils. Land. Degrad. Dev. 2020, 31, 2858–2871. [Google Scholar] [CrossRef]
  65. Asaf, S.; Numan, M.; Khan, A.L.; Al-Harrasi, A. Sphingomonas: From Diversity and Genomics to Functional Role in Environmental Remediation and Plant Growth. Crit. Rev. Biotechnol. 2020, 40, 138–152. [Google Scholar] [CrossRef] [PubMed]
  66. Zhang, X.; Hu, Z.; Pan, H.; Bai, Y.; Hu, Y.; Jin, S. Effects of Rare Earth Elements on Bacteria in Rhizosphere, Root, Phyllosphere and Leaf of Soil–Rice Ecosystem. Sci. Rep. 2022, 12, 2089. [Google Scholar] [CrossRef] [PubMed]
  67. Rachmania, M.K.; Ningsih, F.; Sari, D.C.A.F.; Sakai, Y.; Yabe, S.; Eshananda, Y.; Yokota, A.; Sjamsuridzal, W. Identification and Screening of Enzymatic Abilities of Ktedonobacteria from Forest Soil of Cisolok Geothermal Area, Indonesia. Biodiversitas 2022, 23, 4686–4695. [Google Scholar] [CrossRef]
  68. Jurelevicius, D.; da Pereira, R.S.; da Mota, F.F.; Cury, J.C.; de Oliveira, I.C.; Rosado, A.S.; Mason, O.U.; Jansson, J.K.; Seldin, L. Metagenomic Analysis of Microbial Communities across a Transect from Low to Highly Hydrocarbon-contaminated Soils in King George Island, Maritime Antarctica. Geobiology 2022, 20, 98–111. [Google Scholar] [CrossRef]
  69. Sakineh, A.; Ayme, S.; Akram, S.; Naser, S. Streptomyces Strains Modulate Dynamics of Soil Bacterial Communities and Their Efficacy in Disease Suppression Caused by Phytophthora Capsici. Sci. Rep. 2021, 11, 9317. [Google Scholar] [CrossRef]
  70. Villamil, M.B.; Kim, N.; Riggins, C.W.; Zabaloy, M.C.; Allegrini, M.; Rodríguez-Zas, S.L. Microbial Signatures in Fertile Soils Under Long-Term N Management. Front. Soil Sci. 2021, 1, 765901. [Google Scholar] [CrossRef]
  71. Corretto, E.; Antonielli, L.; Sessitsch, A.; Höfer, C.; Puschenreiter, M.; Widhalm, S.; Swarnalakshmi, K.; Brader, G. Comparative Genomics of Microbacterium Species to Reveal Diversity, Potential for Secondary Metabolites and Heavy Metal Resistance. Front. Microbiol. 2020, 11, 531937. [Google Scholar] [CrossRef]
  72. García-López, M.; Meier-Kolthoff, J.P.; Tindall, B.J.; Gronow, S.; Woyke, T.; Kyrpides, N.C.; Hahnke, R.L.; Göker, M. Analysis of 1000 Type-Strain Genomes Improves Taxonomic Classification of Bacteroidetes. Front. Microbiol. 2019, 10, 415297. [Google Scholar] [CrossRef]
  73. Cao, Y.; Zhang, J.; Du, P.; Ji, J.; Zhang, X.; Xu, J.; Ma, C.; Liang, B. Melatonin Alleviates Cadmium Toxicity by Regulating Root Endophytic Bacteria Community Structure and Metabolite Composition in Apple. Tree Physiol. 2024, 44, tpae009. [Google Scholar] [CrossRef]
  74. DiLegge, M.J.; Manter, D.K.; Vivanco, J.M. Soil Microbiome Disruption Reveals Specific and General Plant-Bacterial Relationships in Three Agroecosystem Soils. PLoS ONE 2022, 17, e0277529. [Google Scholar] [CrossRef]
  75. Wang, Y.; Sun, Q.; Liu, J.; Wang, L.; Wu, X.; Zhao, Z.; Wang, N.; Gao, Z. Suaeda Salsa Root-Associated Microorganisms Could Effectively Improve Maize Growth and Resistance under Salt Stress. Microbiol. Spectr. 2022, 10, e0134922. [Google Scholar] [CrossRef] [PubMed]
  76. Fan, K.; Feng, Q.; Li, K.; Lin, J.; Wang, W.; Cao, Y.; Gai, H.; Song, H.; Huang, T.; Zhu, Q.; et al. The Metabolism of Pyrene by a Novel Altererythrobacter sp. with in-situ Co-Substrates: A Mechanistic Analysis Based on Pathway, Genomics, and Enzyme Activity. Chemosphere 2022, 307, 135784. [Google Scholar] [CrossRef] [PubMed]
  77. Li, H.P.; Yao, D.; Shao, K.Z.; Han, Q.Q.; Gou, J.Y.; Zhao, Q.; Zhang, J.L. Altererythrobacter Rhizovicinus sp. Nov., Isolated from Rhizosphere Soil of Haloxylon Ammodendron. Int. J. Syst. Evol. Microbiol. 2020, 70, 680–686. [Google Scholar] [CrossRef] [PubMed]
  78. Fifer, J.E.; Bui, V.; Berg, J.T.; Kriefall, N.; Klepac, C.; Bentlage, B.; Davies, S.W. Microbiome Structuring Within a Coral Colony and Along a Sedimentation Gradient. Front. Mar. Sci. 2022, 8, 805202. [Google Scholar] [CrossRef]
  79. Tsiafouli, M.A.; Thébault, E.; Sgardelis, S.P.; de Ruiter, P.C.; van der Putten, W.H.; Birkhofer, K.; Hemerik, L.; de Vries, F.T.; Bardgett, R.D.; Brady, M.V.; et al. Intensive Agriculture Reduces Soil Biodiversity across Europe. Glob. Change Biol. 2015, 21, 973–985. [Google Scholar] [CrossRef]
  80. Wicaksono, W.A.; Buko, A.; Kusstatscher, P.; Cernava, T.; Sinkkonen, A.; Laitinen, O.H.; Virtanen, S.M.; Hyöty, H.; Berg, G. Impact of Cultivation and Origin on the Fruit Microbiome of Apples and Blueberries and Implications for the Exposome. Microb. Ecol. 2023, 86, 973–984. [Google Scholar] [CrossRef]
  81. Liu, W.; Jiang, L.; Yang, S.; Wang, Z.; Tian, R.; Peng, Z.; Chen, Y.; Zhang, X.; Kuang, J.; Ling, N.; et al. Critical Transition of Soil Bacterial Diversity and Composition Triggered by Nitrogen Enrichment. Ecology 2020, 101, e03053. [Google Scholar] [CrossRef]
  82. Salleh, N.; Goh, K.K.T.; Sims, I.M.; Bell, T.J.; Huffman, L.M.; Weeks, M.; Matia-Merino, L. Characterization of Anthocyanin-Bound Pectin-Rich Fraction Extracted from New Zealand Blackcurrant (Ribes Nigrum) Juice. ACS Food Sci. Technol. 2021, 1, 1130–1142. [Google Scholar] [CrossRef]
  83. Widdig, M.; Heintz-Buschart, A.; Schleuss, P.M.; Guhr, A.; Borer, E.T.; Seabloom, E.W.; Spohn, M. Effects of Nitrogen and Phosphorus Addition on Microbial Community Composition and Element Cycling in a Grassland Soil. Soil Biol. Biochem. 2020, 151, 108041. [Google Scholar] [CrossRef]
  84. Wertz, S.; Degrange, V.; Prosser, J.I.; Poly, F.; Commeaux, C.; Guillaumaud, N.; Le Roux, X. Decline of Soil Microbial Diversity Does Not Influence the Resistance and Resilience of Key Soil Microbial Functional Groups Following a Model Disturbance. Environ. Microbiol. 2007, 9, 2211–2219. [Google Scholar] [CrossRef] [PubMed]
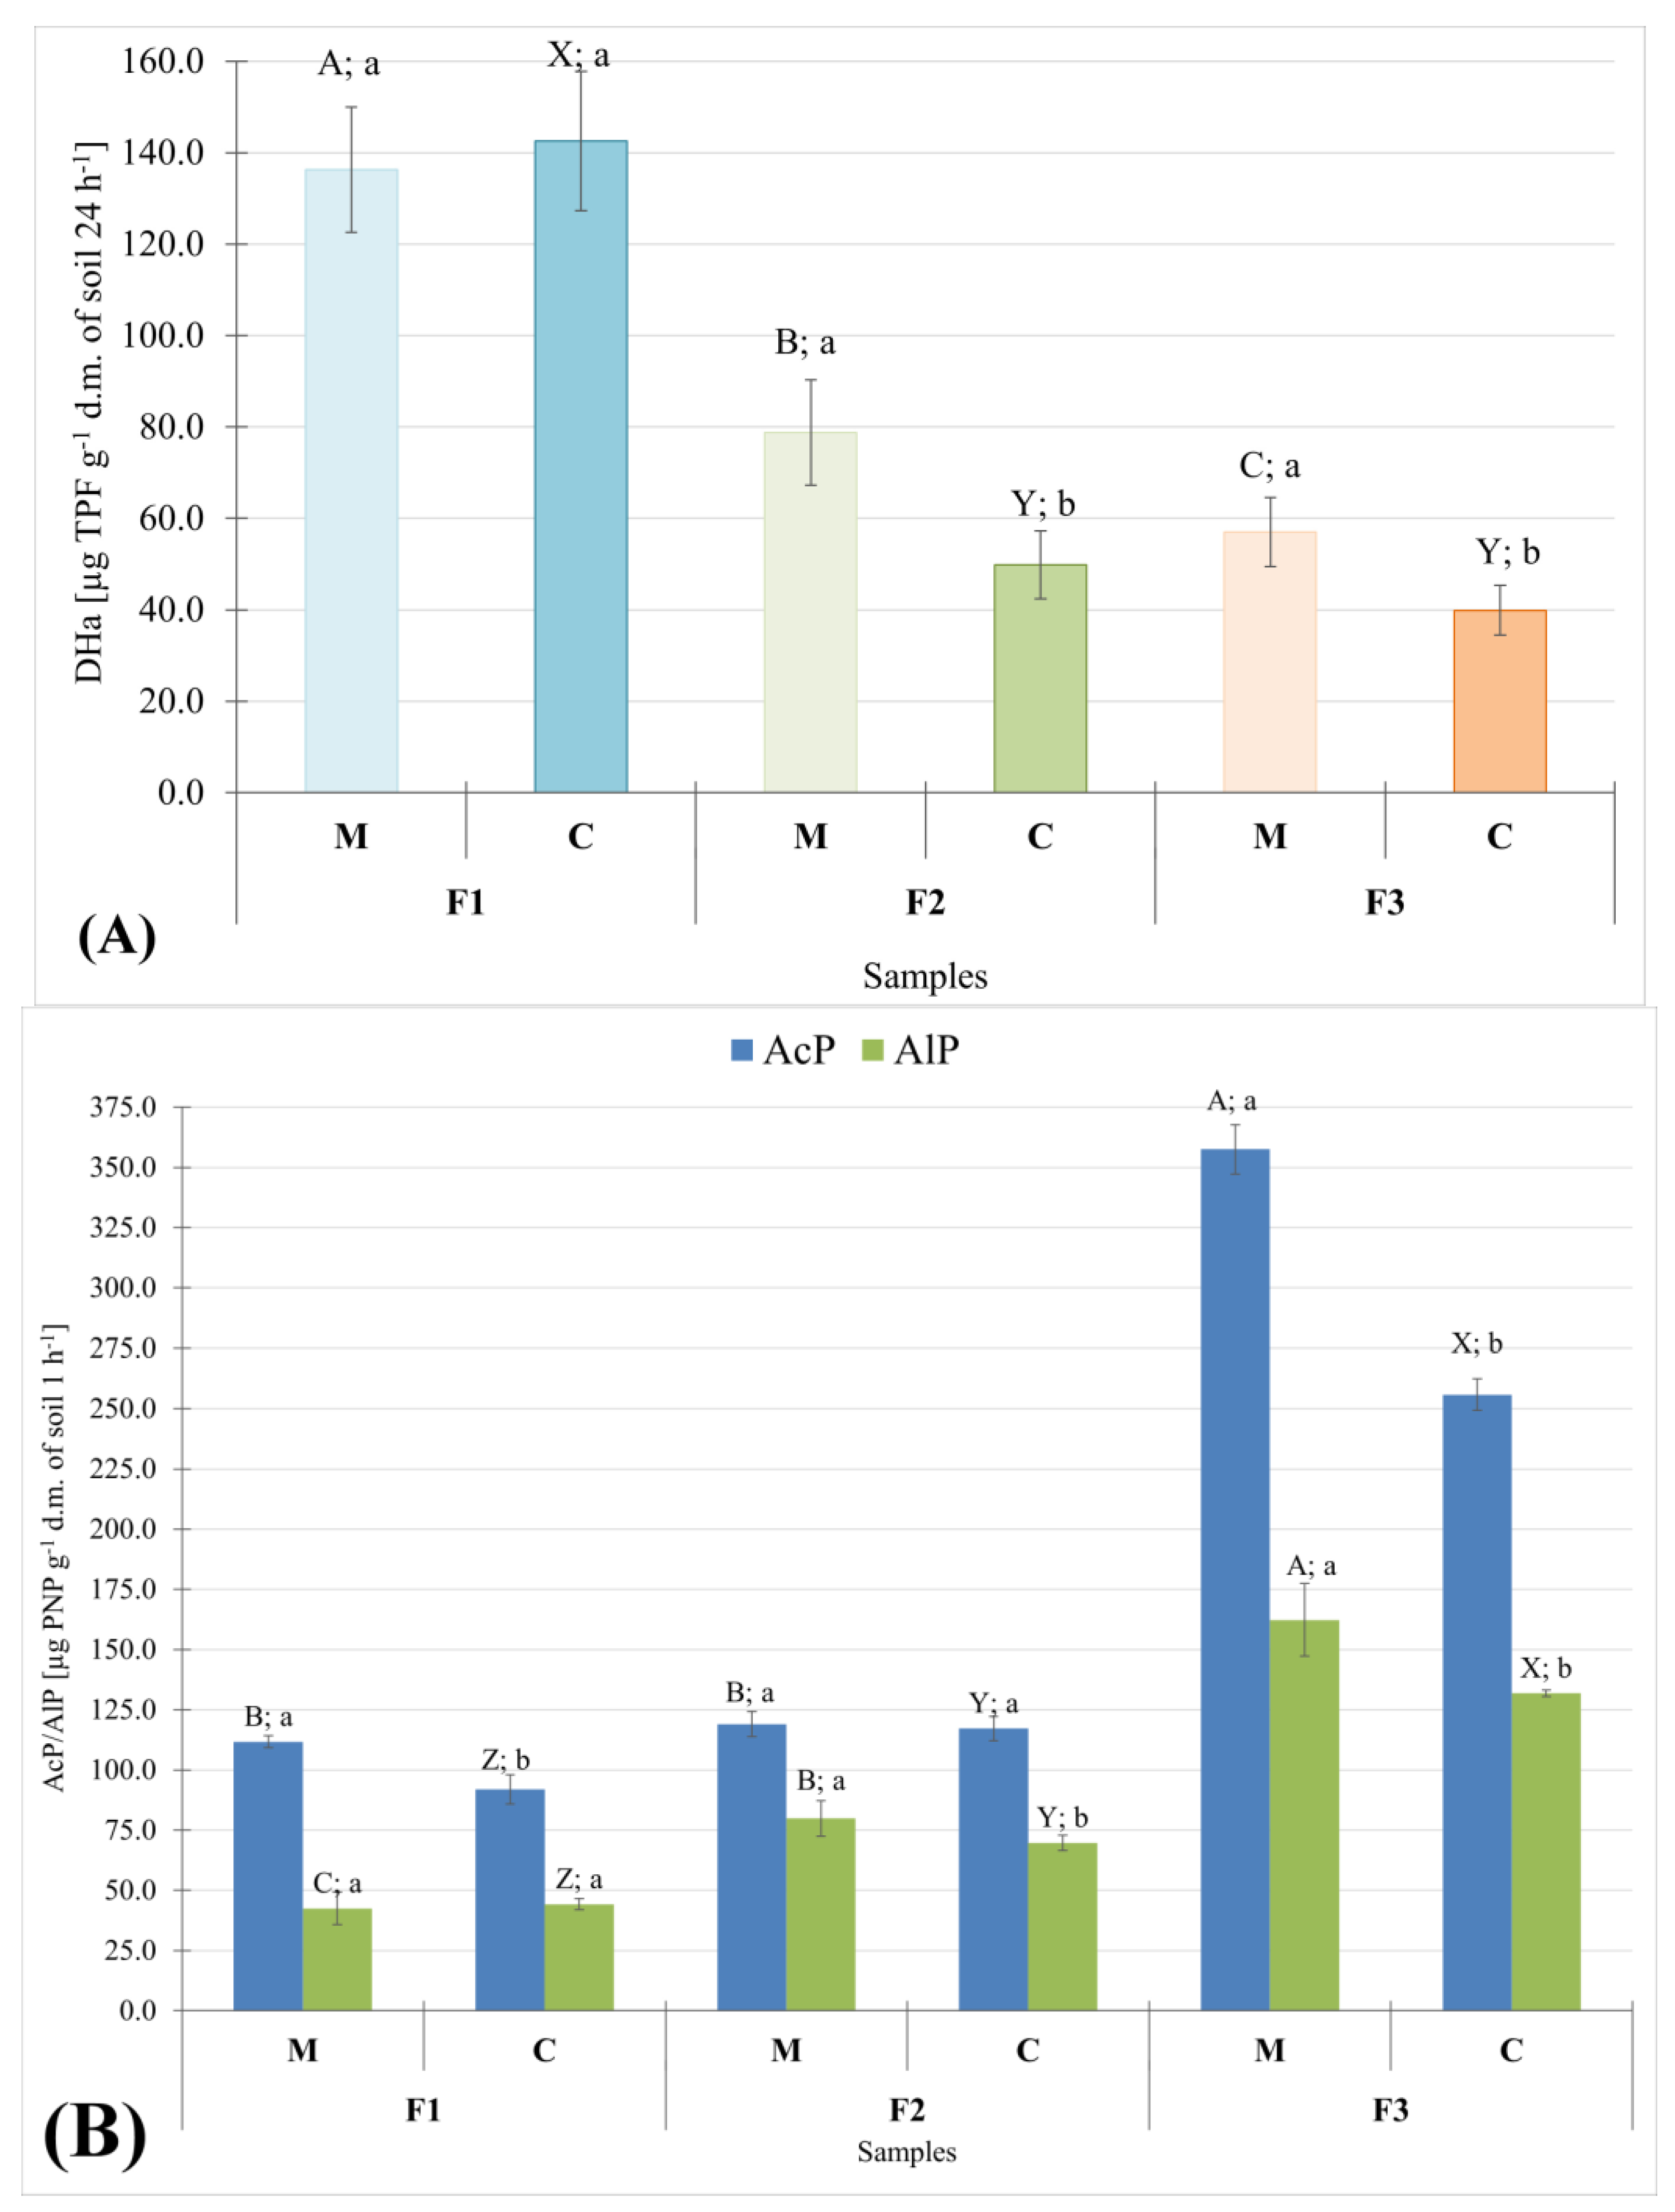
Figure 1. Enzymatic activity of examined Fluvisols: (A) DHa; (B) AcP and AlP. The values are the average of n = 5. Different lowercase letters a–b indicate statistically different values between M and C for each Fluvisol. Capital letters A−C denote statistically different values between M variants for different soils. Capital letters X−Z denote statistically different values between C variants for different soils. Horizontal lines indicate the standard deviation. ANOVA analysis, Tukey HSD test, p < 0.05 (n = 5). Explanations of the sample’s abbreviation can be found in Table 1.
Agronomy 14 00480 g001
Figure 2. Comparison of microbiome structure in examined soils (A) at phyla level between all Fluvisols; (B) at genera level between all Fluvisols.
Agronomy 14 00480 g002aAgronomy 14 00480 g002b
Figure 3. Comparison of microbiome structure in examined soils (A) at phyla level between variant C and M; (B) at genera level between variant C and M; (C) selected genera with the greatest variation between variants. Explanations of the samples’ abbreviation can be found in Table 1.
Agronomy 14 00480 g003
Figure 4. Indices obtained from NGS at genera level for different soil management variants: (A) Chao 1; (B) Shannon indices; (C) Venn diagram. Explanations of the samples’ abbreviation can be found in Table 1.
Agronomy 14 00480 g004
Table 1. Soil samples used in the experiment.
AbbreviationSoilGPS CoordinatesVariants
F1_MLight Fluvisols51°27′35.9″ N 21°52′07.8″ Emeadow
F1_Ccultivation
F2_MMedium Fluvisols51°27′44.9″ N 21°52′14.1″ Emeadow
F2_Ccultivation
F3_MHeavy Fluvisols51°27′37.2″ N 21°52′08.6″ Emeadow
F3_Ccultivation
Table 2. Selected soil characteristics parameters for examined Fluvisols (depth 0–20 cm).
SampleSoil Texture, mm (%)Textural Classes USDA pHH2OOCOMTNN-NH4N-NO2N-NO3PKMg
2.0–0.050.05–0.002<0.002(%)(mg kg−1 of Soil)(mg 100 g−1 of Soil)
F1_M77212LS5.111.422.440.130.990.434.735.015.88.6
F1_C81172LS5.741.021.760.100.760.188.757.418.43.1
F2_M385210SL6.131.462.510.190.810.384.113.812.417.0
F2_C365311SL5.940.621.080.080.130.1015.547.015.310.0
F3_M295813SL4.914.477.700.5223.710.061.483.434.230.0
F3_C276013SL5.501.813.120.230.340.174.952.315.817.9
According to the USDA classification: LS—loamy sand; SL—sandy loam. OC—organic carbon content; OM—organic matter content; TN—total nitrogen content; OM—organic matter content; N-NH4—ammonium content; N-NO2—nitrite nitrogen content; N-NO3—nitrate nitrogen content; P—available forms of phosphorus content; K—available forms of potassium content; Mg—available forms of magnesium content. Explanations of the samples’ abbreviation can be found in Table 1.
Table 3. MBC and MBN contents (µg C/N g−1 d.m. soil) in examined Fluvisols.
SampleMBCMBN
F1_M247.79 ± 6.95 a;C29.89 ± 1.07 a;C
F1_C205.71 ± 3.88 b;Z26.34 ± 0.69 b;Z
F2_M281.33 ± 10.14 a;B38.82 ± 1.91 b;B
F2_C299.47 ± 22.68 a;Y42.98 ± 1.86 a;Y
F3_M805.12 ± 24.16 a;A81.15 ± 1.59 a;A
F3_C569.07 ± 10.50 b;X65.65 ± 3.17 b;X
The values are the average of n = 5. Different lowercase letters a,b indicate statistically different values between M and C for each Fluvisol. Capital letters A–C denote statistically different values between M variants for different soils. Capital letters X–Z denote statistically different values between C variants for different soils. ± indicate the standard deviation. ANOVA analysis, Tukey HSD test, p < 0.05 (n = 5). Explanations of the samples’ abbreviation can be found in Table 1.
Table 4. Indices obtained from EcoPlate™ analysis at 120 h of plate incubation.
IndexF1_MF1_CF2_MF2_CF3_MF3_C
AWCD1.51 ± 0.07 abc1.83 ± 0.11 d1.68 ± 0.09 ad1.39 ± 0.05 bc1.62 ± 0.12 bd1.28 ± 0.05 c
H’3.40 ± 0.02 a3.41 ± 0.01 a3.39 ± 0.01 a3.34 ± 0.01 b3.40 ± 0.01 a3.39 ± 0.02 a
E0.88 ± 0.00 ab0.84 ± 0.01 c0.86 ± 0.01 ac0.89 ± 0.01 b0.87 ± 0.02 bc0.92 ± 0.01 d
R30.67 ± 0.58 a30.67 ± 0.58 a 30.67 ± 0.58 a29.00 ± 0.00 b31.00 ± 0.00 a30.67 ± 0.58 a
The values are the average of n = 3. Values denoted by different letters are statistically significantly different at p < 0.05 (n = 3; ANOVA analysis, Tukey HSD test). Explanations of the samples’ abbreviation can be found in Table 1.
Disclaimer/Publisher’s Note: The statements, opinions and data contained in all publications are solely those of the individual author(s) and contributor(s) and not of MDPI and/or the editor(s). MDPI and/or the editor(s) disclaim responsibility for any injury to people or property resulting from any ideas, methods, instructions or products referred to in the content.