Abstract
In order to obtain the quality information of Taishan black tea and provide data support for the establishment of assessment criteria for quality control of Taishan black tea, in this study, 45 samples of Taishan black tea were collected during the summer to investigate their quality characteristics. The results showed that the Taishan black tea typically exhibited a dark-brown, curly appearance and a uniform texture. The tea soup displayed a bright orange-red color. The tea was mainly described as having a fruity aroma, followed by a caramel flavor, sweet aroma, flowery flavor, and clean aroma, with a strong and enduring fragrance. The taste profile was mostly heavy and mellow or heavy and strong, with fewer samples exhibiting slight bitterness and astringency. The tea leaves were characterized by a reddish-auburn color, a soft texture, and an even appearance. The main biochemical components of the Taishan black tea fell within the following ranges: water extracts (38.65–43.35%), free amino acids (1.41–3.45%), tea polyphenols (9.80–15.05%), catechins (6.11–9.03%), and caffeine (1.65–3.05%). The phenolic acid/amino acid ratio was 2.31–6.65%. Catechins and tea polyphenols emerged as critical indicators influencing taste quality, followed by amino acids, water extracts, and caffeine. The aroma analysis identified common compounds, such as 3-methyl-butanal, 2-methyl-butanal, decanal, 2-methyl-propanal, 1-octen-3-ol, and β-ionone, in most samples. These compounds exhibited relatively high contents and high odor activity values, making them the primary contributors to the tea’s aroma. This investigation into the quality of Taishan black tea offers valuable scientific insights, providing a foundation for the standardization of Taishan black tea’s quality.
1. Introduction
As one of the three most-common non-alcoholic beverages, tea is highly favored by consumers for its distinctive taste and diverse aroma. The Tai’an tea area is situated in the south-central region of Shandong Province, which is primarily known for its production of Taishan green tea. Consumers are drawn to this variety because of its high aroma, strong taste, and brewing resistance [1]. However, climatic factors have led to limited spring and autumn tea production in the Tai’an tea area [2], making summer the primary season for tea cultivation. During this season, tea trees produce substances with a higher phenolic content and a stronger bitter taste, greatly impacting tea quality [3]. To enhance the value of tea tree raw materials during the summer, Taishan black tea was produced. On 22 December 2017, the former Ministry of Agriculture of the People’s Republic of China officially granted registration and protection for the geographical indications for Taishan black tea, and in November 2023, 11 companies had received approval for its production and use.
The quality of Taishan black tea is influenced by many factors, including the tea tree variety, processing technology, and production season. Sun et al. [1] compared Taishan black tea harvested during the summer to existing tea varieties and reported that the quality of Taishan black tea was superior when processed by ‘Fuding Dabai’ and ‘Qimenzhong’. Another study by Fan et al. focused on 13 tea clones imported from Tai ‘an, and it was observed that the ratio of phenol to ammonia in summer tea raw extracts of ‘Jinxuan’, ‘Fuding Dabai’, and ‘Zhenggu Dabai’ exceeded 12, resulting in excellent sensory quality, which was suitable for processing Taishan black tea. Li et al. [4] reported that the best qualities for Taishan black tea were found in the spring. The concentration of catechin compounds, including catechin (C) and epicatechin (EC), was found to be significantly higher in summer tea compared to spring black tea, reaching a level of 30.01 mg/g. Furthermore, the amino acid content in spring black tea was observed to be 3.08% greater than that in summer black tea [5]. However, due to temperature and humidity fluctuations, the fermentation of black tea was slow, leading to a noticeable greenish taste of the tea infusion. The characteristics of summer black tea, described as thick and strong, were more pronounced, and the tea soup was brilliant-red and bright. Conversely, autumn black tea leaves exhibited higher hardness, indicating insufficient fermentation and resulting in an overall quality slightly lower than that of spring and summer teas.
The quality of Taishan black tea sold on the market is affected by many factors, and the consistency of its quality is poor. At the same time, there are also some differences between products. In order to improve and stabilize the quality of Taishan black tea, assessment criteria for managing the quality of Taishan black tea needs to be established urgently. In this work, we studied the products marketed by 15 major Taishan black tea manufacturers, and their compounds were analyzed using both national standard methods and gas chromatography–mass spectrometry. To conduct a comprehensive analysis, multivariate statistical analysis techniques, including principal component analysis, systematic clustering, and orthogonal partial least-square discriminant analysis, were employed. Aiding in this evaluation was the calculation of aroma vitality values, which helped clarify characteristic flavor components [6]. This study will evaluate the quality of Taishan black tea objectively and accurately, and provide data support for the quality judgment, standard formulation, and quality management of Taishan black tea products.
2. Materials and Methods
2.1. Tea Sample Source
The tea samples were taken from 15 companies mainly producing Taishan black tea in the Tai’an tea area. The summer black tea products were randomly sampled, and the tea samples were labeled as shown in Figure 1 and Table S1.
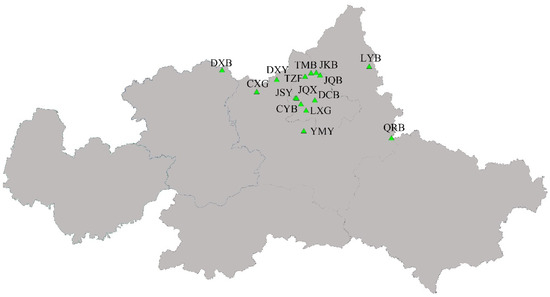
Figure 1.
Map of the Taishan black tea sampling sites.
2.2. Test Methods
2.2.1. Sensory Review
In order to ensure a comprehensive evaluation, eight professional tea tasters (four females and four males, aged 30–60 years) from the Shandong Agriculture University formed a sensory evaluation panel. All panel members had national professional qualification certificates and had more than fifteen years of experience in descriptive sensory analyses of tea. The task of this panel was to provide a detailed description of the Taishan black tea according to the standard method for the sensory evaluation of tea (GB/T 23776-2018) [7], and to score the weights of the appearance, infusion color, aroma, taste, and leaf base of the Taishan black tea with the ‘Terminology of Tea Evaluation’ as a reference framework. According to GB/T 23776-2018 [7], 100 g of dry tea was placed on the evaluation tray for appearance evaluation. Subsequently, 3 g of dry tea was weighed, according to the tea-to-water ratio (1:50), and brewed for 5 min. After filtration, the aroma, color, taste, and leaf base were evaluated according to GB/T 14487-2017 [7] and scored using a percentage system. The weights of the appearance, infusion color, aroma, taste, and leaf base were 25%, 10%, 25%, 30%, and 10%, respectively. In the sensory evaluation of the Taishan black tea, a textual description was a common description made by the experts, and the score for each quality was the average value of the experts’ scores.
2.2.2. Determination of Biochemical Components
The content of water extracts was determined according to GB/T 8305-2013 [8]. The ground tea samples were extracted in a boiling water bath for 45 min, filtered under heat and a vacuum, and then washed with boiling distilled water several times. After washing, the tea residue was dried and cooled to room temperature before being weighed. The content of free amino acids was determined via ninhydrin colorimetry according to GB/T 8314-2013 [8]. After preparing the sample solution according to the standard method, a phosphate-buffered solution with pH = 8 and 0.5% ninhydrin solution were added, heated in boiling water, and cooled to a constant volume, and the absorbance was determined. The contents of tea polyphenols and catechins were determined via Folin phenol colorimetry and high-performance liquid chromatography according to GB/T 8313-2018 [8], respectively. The required solution was prepared using the standard method. A gallic acid working solution, water, the test solution, and the Folin phenol reagent were added according to the order and dosage requirements, and then the sodium carbonate solution was added and the volume was fixed to the scale, and the absorbance was measured after being placed at room temperature for 1 h. The mother liquor and test solution were prepared according to the standard method, the chromatographic conditions were controlled, and the blank operation was carried out after the flow rate and column temperature were stabilized. Then, we accurately absorbed 10 L of the standard series working liquid for injection, and HPLC-injected 10 L of the test liquid under the same chromatographic conditions. The test solution was quantified according to the peak area. Caffeine was determined using ultraviolet spectrophotometry according to GB/T 8312-2013 [9]: The test liquid was prepared according to the standard method, the chromatographic conditions were controlled, 10–20 μL of the preparation liquid was accurately absorbed and injected into the Agilent 1100 chromatograph (Agilent, Palo Alto, CA, USA), and once a standard curve was made for the caffeine content of the standard working liquid, chromatographic determination was performed.
2.2.3. Determination of Black Tea Aroma
The black tea aroma was determined via the Headspace solid-phase microextraction gas chromatography–mass spectrometry (HS-SPME-GC-MS) method [10]. For the preparation of the aroma sample, the solid-phase microextraction head (Supelco 57328-U, composite DVB/CAR/PDMS, MerckKGaA, Darmstadt, Germany) was installed at the inlet of the gas chromatograph (GC-2014G, Shimadzu, Kyoto, Japan) and aged at 250 °C for 30 min. Subsequently, 3 g of dry tea was weighed and placed in a 100 mL conical flask. After adding 150 mL of ultrapure water previously heated to 80 °C, 10 μL of cyclohexanol internal standard solution (HPLC, 99% purity, Sigma-Aldrich, St. Louis, MO, USA) was immediately added. The conical flask mouth was sealed with aluminum foil and sterile preservative film and placed in a water bath set to 80 °C for 10 min. The conical flask was then placed on a heating pad to maintain the temperature at 80 °C, and the extraction device was inserted into the conical flask for headspace adsorption for 60 min. Subsequently, the needle was recovered, and the extraction device was inserted into the inlet of the gas chromatograph. Thermal desorption was performed at 230 °C for 5 min, as described in an earlier study [11].
The GC conditions were as follows: the dimensions of the Rtx-5MS quartz capillary column were 30.0 m × 0.32 mm × 0.25 μm (Restek, Belfort, CA, USA); the carrier gas was He (99.999%); the pre-column pressure was 5.9 psi; the split ratio was 5:1; the injector temperature was 250 °C; and the initial temperature was maintained at 40 °C for 1 min, increased to 150 °C at 6 °C/min, increased to 200 °C at 4 °C/min for 1 min, and finally increased to 250 °C at 2 °C/min for 3 min.
The MS conditions were as follows: an electron ion source was used; the ion source temperature was 200 °C; the electron energy was 70 eV; the photomultiplier voltage was 800 V; the mass scanning was 35 to 450 amu; and the scanning speed was 909 amu/s.
2.3. Data Processing
2.3.1. Qualitative and Quantitative Analyses of Volatile Components
For the qualitative analysis, the retention times of the volatile components were used, combined with the data from the database for the identification of volatile components.
For the relative quantitative analysis, the relative content of each volatile component in the black tea samples was calculated according to the following formula:
where Ai is the peak area of the volatile component in the sample being tested; L is the peak area of the internal standard substance; m is the mass of the internal standard substance; and M is the sample quality being tested.
2.3.2. Calculation of Aroma Vitality Value
For the aroma vitality value analysis, the odor active value of each volatile component in the black tea samples was calculated according to the following formula:
where Ci is the relative content of the volatile component, and OTi is the threshold value of the volatile component in water.
2.3.3. Data Analyses
Excel 2010 and IBM SPSS Statistics 26 software were used for statistical analyses of the test data. Tea samples and biochemical composition distributions were obtained using Origin 2020 software for frequency determination and the Wekemo Bioincloud cloud platform (https://www.bioincloud.tech/task-meta, accessed on 2 December 2023) for PCA, as well as OPLS-DA model prediction and clustering figure preparation.
3. Results
3.1. Sensory Evaluation of Taishan Black Tea
The sensory qualities of the Taishan black tea were evaluated by multiple experts. The appearance of the Taishan black tea was primarily characterized by a dark-brown color, with a curly appearance. The tea soup exhibited a bright orange-red hue. The tea was primarily described as having a fruity aroma, followed by a caramel flavor, sweet aroma, flowery flavor, and clean aroma, with a strong and enduring fragrance. The taste was mostly heavy and mellow or heavy and strong, and fewer samples exhibited a slight bitterness and astringency. The tea leaves were characterized by a reddish-auburn color, a soft texture, and an even appearance (Table S2, Figure 2).
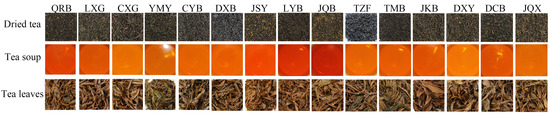
Figure 2.
Appearances of the dried tea, tea soup, and tea leaves of the tea samples.
3.2. Quality and Composition Characteristics of Taishan Black Tea
3.2.1. Quality Ingredients of Taishan Black Tea
The water extract content ranged from 36.32% to 45.72% (Table 1 and Table 2). The frequency of black tea samples with a water content ranging from 38.65% to 43.35% was high, constituting a cumulative percentage of 80%. The content of free amino acids ranged from 1.41% to 5.43%. Moreover, the predominant distribution interval for 31 tea samples was 1.41% to 3.45%, with a cumulative percentage of 68.89%. The content of tea polyphenols ranged from 9.80% to 20.31%. A concentrated distribution frequency was observed in 22 samples, accounting for 82.22%, with the content ranging from 9.80% to 15.05%. The content of catechins ranged from 6.11% to 11.91%. The most prevalent catechin content range was 6.11% to 9.03%, with a cumulative percentage of 82.22%. The content of caffeine varied between 1.18% and 3.05%. A substantial number of the tea samples fell within the caffeine content range of 1.65% to 3.05%, with a cumulative percentage of 91.11%. The phenol-to-ammonia ratio ranged from 2.31 to 8.10. Of the 45 samples, 40 exhibited a phenol-to-ammonia ratio distribution between 2.31 and 6.65, representing a cumulative proportion of 88.89%.

Table 1.
Comparison of biochemical components of the Taishan black tea. The results were reported as the mean ± SD. Each treatment was conducted with three replicates. Different small letters after data in the same column indicate significant differences among treatments (p < 0.05).
Table 2.
Distribution frequency of biochemical components of the Taishan black tea.
3.2.2. Comprehensive Evaluation of Taishan Black Tea Taste and Quality
A principal component analysis (PCA) can illustrate the overall differences between groups and the degree of variability among samples within each group. Figure 3 presents the PCA results for black tea samples from different companies. Except for JQB, there were differences in taste quality among the black tea samples, although these distinctions were not significant. This finding indicates a high degree of similarity in taste and quality among Taishan black tea varieties.
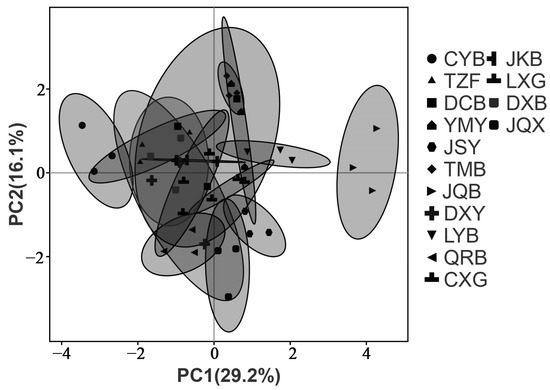
Figure 3.
Distribution map of the Taishan black tea samples based on PCA.
As shown in Table 3, the cumulative contribution rate of the first three principal components reached 89.14%, which could explain most of the data of the samples. PC1 explained 51.16% of the total information, primarily synthesizing the data on catechins and tea polyphenols. These compounds are important factors influencing the taste intensity, bitterness, and freshness of Taishan black tea soup. PC2 encompassed 22.21% of the data, and its size was mainly determined by the amino acids and water extracts, crucial factors that impact the freshness, mellowness, and thickness of Taishan black tea soup. PC3 contained 15.77% of the data, and its size was mainly determined by caffeine. Caffeine, with its inherent bitter taste, contributes to both freshness and bitterness when combined with catechins and theaflavins. Consequently, caffeine emerged as a significant factor affecting the overall taste profile of the Taishan black tea soup. In summary, catechins and tea polyphenols emerged as crucial indicators influencing the taste quality of the Taishan black tea, followed by amino acids, water extracts, and caffeine.
Table 3.
Eigenvectors of first three principal components and their contribution rates to the total variance.
3.3. Aroma Analysis of Taishan Black Tea
3.3.1. Volatile Components of Taishan Black Tea
Our analysis of 45 black tea samples from 15 companies detected 231 volatile substances, including 40 alcohols, 38 aldehydes, 28 esters, 29 olefins, 24 ketones, 21 alkanes, 18 aromatic hydrocarbons, 18 heterocycles, 10 terpenes, 2 ethers, 2 acids, and 1 alkyne. As shown in Table S3, the black teas produced by various companies predominantly featured alcohols, aldehydes, esters, ketones, aromatic hydrocarbons, and heterocyclic components among their detected volatile components.
3.3.2. Screening of Key Volatile Components in Taishan Black Tea
Screening of Key Volatile Components Based on the OPLS-DA Model
In this experiment, we evaluated 45 Taishan black tea samples by employing the OPLS-DA model. To ensure robustness, 200 random arrangement and combination experiments were conducted on the data. The strength of the evaluation model was determined by assessing the fitting parameters, with a focus on R2 values approaching 1 and Q2 values exceeding 0.5, indicating stronger predictive ability. As shown in Figure 4, the fitting parameters demonstrated high values: R2Y = 0.985, Q2 = 0.996, and both Q2 and R2Y p-values were below 0.005, indicating the high prediction accuracy of the model established in this experiment.
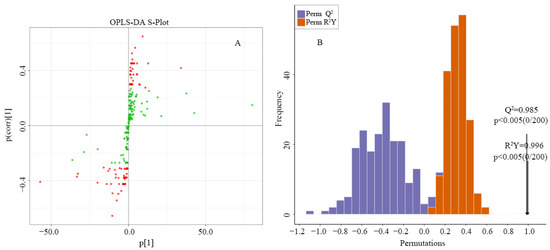
Figure 4.
OPLS-DA prediction model. (A), OPLS-DA S-plot; (B), prediction model. The red dots indicate that the VIP values of these volatile substances were greater than or equal to 1, and the green dots indicate that the VIP values of these volatile substances were less than or equal to 1.
Utilizing the outcomes of the OPLS-DA model, the variable importance projection (VIP) value was employed to identify the key volatile components in Taishan black tea. As shown in Table S4, 91 volatile components had a VIP value exceeding 1, including 18 alcohols, 15 aldehydes, 12 ketones, 8 esters, 10 alkanes, 10 olefins, 3 aromatic hydrocarbons, 5 terpenes, and 9 heterocyclic compounds.
Key Volatile Component Screening Based on Principal Component Analysis
Volatile substances with VIP values exceeding 1 were utilized for the cluster analysis of 15 tea companies. Notably, 10 tea companies (LXG, QRB, DXB, JSY, LYB, JQB, TZF, JQX, JKB, DXY) exhibited similar characteristics (Figure 5), indicating that the Taishan black tea samples from these companies shared a relatively similar volatile profile. Conversely, the black tea samples from the remaining five companies displayed significant differences. Moreover, the sample size of the 10 companies accounted for 66.67% of the total sample size, surpassing the 50% mark. Consequently, the samples from these 10 companies were selected for the PCA, aiming to further identify and screen the key volatile components.
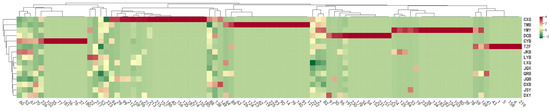
Figure 5.
Cluster analysis of volatile substances based on VIP values exceeding 1. The numbers in the figure correspond to the numbers of volatile substances in Table S4.
The cumulative contribution rate of the initial six principal components was 86.29% (Table 4), indicating that these principal components effectively captured and represented the overall sample information. Consequently, the weight coefficients of the rotation matrix were calculated specifically for these six principal components (Table S5). The weight coefficient of the rotation matrix was >0.4, as is the standard for screening; 31 volatile compounds played important roles in the 6 principal components, respectively.
Table 4.
Principal component characteristic values, contribution rates, and cumulative contribution rates of volatile components of the Taishan black tea.
Odor Activity Values of Key Volatile Components
The odor activity value (OAV) serves as a tool for assessing the overall flavor of foods dominated by a single odor component. Key aroma compounds with an OAV greater than 1 are generally considered significant contributors to the overall aroma [12]. In our analysis, we calculated the OAVs for volatile components with VIP values greater than 1. Except for 1-amyl alcohol, all other volatile components in the Taishan black tea samples exhibited OAVs greater than 1 (excluding undetected volatile components and those with unspecified threshold values) (Table S6).
3-methylbutyraldehyde, 2-methylbutyraldehyde, capric aldehyde, isobutyraldehyde, 1-octene-3-ol, and β-ionone were consistently detected in most samples, demonstrating high OAVs. These six types of volatile substances imparted fruity, caramel, sweet, green, and flowery flavor aromas, respectively. Moreover, the relative content of these key volatile components confirmed their prominence (Figure 6), with consistently high relative concentrations across the samples.
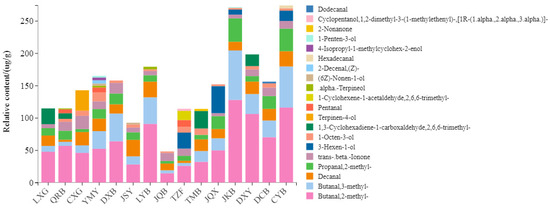
Figure 6.
Relative contents of the key volatile components.
4. Discussion
Taste constitutes a crucial sensory attribute of tea, and is influenced by a multitude of chemical components and intricate interactions [13,14,15]. The divergence in various tea flavors stems from the distinct contributions of non-volatile components to the resultant tea flavor [16]. Our analysis of the flavor characteristics of Taishan black tea revealed that polyphenols and catechins played pivotal roles in shaping taste quality, followed by amino acids, water extracts, and caffeine (Table 4). Polyphenols exerted a significant influence on the taste quality, forming the basis for the heavy and strong and heavy and mellow taste profiles. They were mainly responsible for the astringency, brightness, color, and freshness of the black tea soup [17]. Catechins, known for their bitter and astringent properties, impacted the final quality and taste of the tea [18,19]. The high contents of polyphenols and catechins in the Taishan black teas imparted characteristics of heavy and strong and heavy and mellow tastes, consistent with an earlier study [20]. By comparison, it was found that the average proportion of catechins in Taishan black tea was 8.16%, which was much higher than that of Anhui and Yunnan black tea, and the caffeine content of Taishan black tea was 2.3%, which was slightly higher than that of Anhui and Yunnan black tea [21].
Despite the elevated levels of phenolic compounds, the sensory evaluation in this study indicated that more tea samples exhibited heavy and mellow tastes, with only a few tea samples displaying bitterness. This observation can be attributed to two factors. Firstly, free amino acids played a role in enhancing the freshness, mellowness, and thickness of the tea [22]. Secondly, caffeine formed complexes with the polyphenols, amino acids, catechins, chlorogenic acid, and other substances in the tea infusion, enhancing the bitterness and astringency while improving the freshness [23]. Additionally, the color of the bottom of the leaves revealed that partially brewed Taishan black tea leaves retained a greenish hue, suggesting incomplete fermentation of the fresh tea leaves. The low content of thearubigins in the incompletely fermented black tea leaves resulted in a light and astringent tea soup [20]. This issue was further corroborated by the content of water extracts (Table 2) and the aroma description (Table S1).
Aroma, a critical parameter for evaluating the overall quality of black tea, constitutes a significant focus in black tea quality improvement research. Previous studies have found that the tea cultivars, processing techniques, and environmental conditions could influence the aroma of black tea [24]. For example, the Xinyang black tea has a sugary honey-like aroma [24], Keemun black tea has a distinct rose aroma/Keemun aroma [25], Sichuan black tea has a sweet and citrus-like aroma [26], Guangdong black tea has a sweet and floral aroma [27], and Jinxuan (Oolong tea cultivar) black tea possesses a higher floral aroma [28]. In this study, the aroma of Taishan black tea was mainly fruity, followed by a caramel, sweet aroma, with a strong and enduring fragrance. Due to the intricate nature of aromas, a single aromatic property falls short in adequately expressing the contribution of all components [29]. The characteristic aroma of black tea hinges on the interaction and coordination of different aromatic functional groups present in its diverse volatile substances. In Chinese black tea, volatile compounds are dominated by alcohols and aldehydes, with a considerable content of ketones [30]. Similar findings were observed in this study, where alcohols were the prevalent compounds in the black tea, often formed through the reduction of aldehydes or the decomposition of hydroperoxides into fatty acids [31]. A total of 231 volatile substances and 40 alcohol substances were detected in the 45 samples analyzed. The OAVs of 1-octene-3-alcohol, (1R-(1) α), 2. α., 3. α.)]-1, 2-dimethyl-3-(1-methyl vinyl)-cyclopentanol, α-terpineol, 1-pentene-3-alcohol, shun-6-nonene-1-alcohol, anti-3-hexene-1-alcohol, 4-isopropyl-1-methylcyclohex-2-enol, and 4-terpinol exceeded 1, signifying their contribution to the overall aroma. Notably, 1-octene-3-ol, a volatile component with a greenish fragrance, was detected in most samples.
Aldehydes, with lower aroma thresholds than their corresponding alcohols, play a crucial role in the aroma of black tea. Most aldehydes have greenish, malty, fatty, sweet, and floral flavors, which are usually the products of lipid auto-oxification during production [20]. In Jinjunmei, Keemun, and Dianhong, 2-methylbutanal and 3-methylbutanal showed a high degree of aroma contribution [32]. In this study, 38 aldehydes were detected, with key aroma components including 2,6,6-trimethyl-1-cyclohexene-1-acetaldehyde, 3-methylbutanal, decylaldehyde, laural, valeraldehyde, isobutanal, 2,6,6-trimethyl-1, 3-cyclohexenedien-1-formaldehyde, 2-methylbutanal, cetylaldehyde, and cis-2-decenal. 3-methylbutyraldehyde, 2-methylbutyraldehyde, capric aldehyde, and isobutyraldehyde were detected in most samples. Fruity, caramel, sweet, and fruity notes were associated with 3-methylbutyraldehyde, 2-methylbutyraldehyde, capric aldehyde, and isobutyraldehyde, respectively. These aldehydes, with both having higher relative contents (Figure 5) and OAVs exceeding 1 (Table S5), significantly contributed to the flavor of the Taishan black tea.
Ketones, generated through thermal oxidation and polyunsaturated fatty acid degradation, play a crucial role in the overall aroma of tea due to their relatively low aroma thresholds [31]. In this study, 24 ketones were detected, with β-ionone and 2-nononone emerging as the main key aroma components. Furthermore, β-ionone, detected in most samples, exhibits a fruity aroma, resulting from the degradation of carotenoids. It contributes a distinctive black tea aroma, playing an essential role in the overall tea aroma [33].
The results of the sensory evaluation, combined with the prevalent flavor of volatile compounds in most samples, suggest that Taishan black tea exhibits a pronounced fruity and caramel flavor. This flavor profile is primarily attributed to the high drying temperature (120 to 130 °C) applied during the processing of Taishan black tea, and the elevation in the drying temperature is conducive to the Maillard reaction, which enhances the tea aroma and produces fruity and caramel notes [34]. The caramelized Dianhong black tea has a similar processing process [35]. The high drying temperature of Taishan black tea can be influenced by several factors. Firstly, producers may opt to increase the drying temperature to cater to the preferences of consumers who seek a robust tea aroma. Secondly, increasing the drying temperature can reduce the production and processing time. Thirdly, producers may use high-temperature drying to address quality issues such as raw taste and astringency, which can result from uneven and inadequate tea fermentation caused by one or several stages of black tea processing. However, whether the objective is to develop fruity or caramel aromas or to rectify defects, the control of temperature appeared to be inadequately managed in some samples in this study. This was particularly evident in samples containing compounds causing more green aromas, such as trans-3-hexene-1-ol, and as the temperature of the tea infusion decreased, the green aroma became increasingly prominent.
5. Conclusions
The flavor profiles of the Taishan black tea samples were mainly heavy and strong, or heavy and mellow. The key indicators influencing the taste quality were identified as catechins and polyphenols. The aroma of the Taishan black tea was characterized as being fruity, caramel, and sweet. Components such as 3-methylbutyraldehyde, 2-methylbutyraldehyde, capric aldehyde, isobutyraldehyde, 1-octene-3-ol, and β-ionone were consistently present in the samples, contributing to the main aroma characteristics. Upon combining the sensory evaluation with the quality component detection, it was observed that the Taishan black tea on the market generally lacked outstanding sensory qualities such as a special flavor, and the processing technology had a potential insufficiency. To enhance the brand value and economic benefits of Taishan black tea, we recommend strengthening independent breeding and moderately introducing tea varieties with unique aromas. Additionally, there is a need to systematically improve the processing technology employed in the production of Taishan black tea. This study provides data support for the quality judgment, standard formulation, and quality management of Taishan black tea products.
Supplementary Materials
The following supporting information can be downloaded at https://www.mdpi.com/article/10.3390/agronomy14020360/s1. Table S1: The source of Taishan black tea sample; Table S2: Sensory evaluation of Taishan black tea; Table S3: Relative content of volatile substances in Taishan black tea; Table S4: Key aroma substances of Taishan black tea (VIP greater than 1); Table S5: Rotation matrix of principal components in terms of weight coefficient; Table S6: Thirty-one key volatile compounds’ OAVs.
Author Contributions
Conceptualization, X.H.; methodology, X.W. and X.C.; formal analysis, X.W., X.C. and T.X.; sample collection, J.L. and H.S.; writing—original draft preparation, X.W. and T.X.; writing—review and editing, X.H.; project administration, X.H.; funding acquisition, X.H. All authors have read and agreed to the published version of the manuscript.
Funding
This work was supported by the 2022 Taishan Black Tea Geographical Indication Agricultural Product Protection Project (funder: Ministry of Agriculture and Rural Affairs of the People’s Republic of China) and Tai’an City Science and Technology Innovation Major Project (agricultural variety) (funder: Tai’an Science and Technology Bureau; funding number: 2022NYLZ08).
Data Availability Statement
Data are contained within the article and Supplementary Materials.
Conflicts of Interest
The authors declare no conflict of interest.
References
- Sun, Q.; Zhang, L.; Wang, X.; Wang, N.; Han, X.; Xu, X. Selection of suitable varieties for processing of Congou black tea in Shandong. China Tea Process. 2012, 3, 14–17. (In Chinese) [Google Scholar]
- Zhang, L.; Zhao, S.; Wang, G.; Yang, R.; Li, X. Analysis on climatic conditions of tea planting in Tai’an City. Chin. J. Agrometeorol. 2006, 27, 244–248. (In Chinese) [Google Scholar]
- Fan, Y.; Zhang, L.; Xiang, Q.; Huang, X.; Sun, H.; Wang, C. Preliminary study on the suitability of black tea introduced from Taian clones. China Tea Process. 2015, 13–17. (In Chinese) [Google Scholar] [CrossRef]
- Li, D.; Han, M.; Wang, N.; Fu, C. Analysis of sensory quality and contents of black tea in different seasons. Deciduous Fruits 2016, 48, 20–22. (In Chinese) [Google Scholar]
- Liu, C.; Li, J.; Li, H.; Xue, J.; Wang, M.; Jian, G.; Zhu, C.; Zeng, L. Differences in the quality of black tea (Camellia sinensis var. Yinghong No. 9) in different seasons and the underlying factors. Food Chem. X 2023, 20, 100998. [Google Scholar] [CrossRef]
- Wang, W.; Le, T.; Wang, W.; Yu, L.; Yang, L.; Jiang, H. Effects of key components on the antioxidant activity of black tea. Foods 2023, 12, 3134. [Google Scholar] [CrossRef] [PubMed]
- Lian, X. Analysis of Quality Characteristics of Black Tea/Green Tea Scented with Honeysuckle. Master’s Thesis, Southwest University, Chongqing, China, 2020. (In Chinese). [Google Scholar]
- Wei, Z.; Dai, H.; Wang, X.; Huang, X.; E, C.; Lin, R.; Chen, Z. Study on the effect of different processing technology on the quality of Meizhan black tea. China Tea Process. 2023, 4, 36–42. (In Chinese) [Google Scholar] [CrossRef]
- Hu, Y.; Wu, X.; Chen, Q.; Zhu, H.; Wang, S. GB/T 8312–2013 High performance liquid chromatography and ultraviolet spectrophotometry Comparison of caffeine content in solid instant tea. China Tea 2019, 41, 43–48. (In Chinese) [Google Scholar]
- Qin, X.; Zhou, J.; He, C.; Qiu, L.; Zhang, D.; Yu, Z.; Wang, Y.; Ni, D.; Chen, Y. Non-targeted metabolomics characterization of flavor formation of Lichuan black tea processed from different cultivars in Enshi. Food Chem. X 2023, 19, 100809. [Google Scholar] [CrossRef]
- Xu, J.; Zhang, Y.; Yan, F.; Tang, Y.; Yu, B.; Chen, B.; Lu, L.; Yuan, L.; Wu, Z.; Chen, H. Monitoring changes in the volatile compounds of tea made from summer tea leaves by GC-IMS and HS-SPME-GC-MS. Foods 2023, 12, 146. [Google Scholar] [CrossRef]
- Tan, H.R.; Lau, H.; Liu, S.Q.; Tan, L.P.; Sakumoto, S.; Lassabliere, B.; Leong, K.-C.; Sun, J.; Yu, B. Characterisation of key odourants in Japanese green tea using gas chromatography-olfactometry and gas chromatography-mass spectrometry. LWT 2019, 108, 221–232. [Google Scholar] [CrossRef]
- Bhuyan, L.P.; Borah, P.; Sabhapondit, S.; Ramen Gogoi, R.; Pradip Bhattacharyya, P. Spatial variability of theaflavins and thearubigins fractions and their impact on black tea quality. J. Food Sci. Technol. 2015, 52, 7984–7993. [Google Scholar] [CrossRef]
- Owuor, P.O.; Obanda, M. The use of green tea (Camellia sinensis) leaf flavan-3-ol composition in predicting plain black tea quality potential. Food Chem. 2007, 100, 873–884. [Google Scholar] [CrossRef]
- Samanta, T.; Cheeni, V.; Das, S.; Roy, A.B.; Ghosh, B.C.; Mitra, A. Assessing biochemical changes during standardization of fermentation time and temperature for manufacturing quality black tea. J. Food Sci. Technol. 2015, 52, 2387–2393. [Google Scholar] [CrossRef]
- M-Maria-John, K.; Thiruvengadam, M.; Enkhtaivan, G.; Kim, D.H. Variation in major phenolic compounds and quality potential of CTC black tea elicited by Saccharomyces cercevisiae and its correlation with antioxidant potential. Ind. Crop Prod. 2014, 55, 289–294. [Google Scholar] [CrossRef]
- Nenad, N.; Alexandra, F.; D’Cunha, N.M.; Stefanos, T.; Christina, C.; Labros, S.S.; Loukianos, R.; Antonia-Leda, M.; Evangelos, P.; Christos, P.; et al. The association between green and black tea consumption on successful aging: A combined analysis of the ATTICA and MEDiterranean ISlands (MEDIS) epidemiological studies. Molecules 2019, 24, 1862. [Google Scholar]
- Someswararao, C.; Srivastav, P.P. A novel technology for production of instant tea powder from the existing black tea manufacturing process. Innov. Food Sci. Emerg. 2012, 16, 143–147. [Google Scholar] [CrossRef]
- Qu, F.; Zhu, X.; Ai, Z.; Ai, Y.; Qiu, F.; Ni, D. Effect of different drying methods on the sensory quality and chemical components of black tea. LWT 2019, 99, 112–118. [Google Scholar] [CrossRef]
- Wen, L.; Sun, L.; Chen, R.; Li, Q.; Lai, X.; Cao, J.; Lai, Z.; Zhang, Z.; Li, Q.; Song, G. Metabolome and microbiome analysis to study the flavor of summer black tea improved by stuck fermentation. Foods 2023, 12, 3414. [Google Scholar] [CrossRef]
- Xu, L.; Xia, G.; Luo, Z.; Liu, S. UHPLC analysis of major functional components in six types of Chinese teas: Constituent profile and origin consideration. LWT 2019, 102, 52–57. [Google Scholar] [CrossRef]
- Chen, Y.; Zeng, L.; Liao, Y.; Li, J.; Zhou, B.; Yang, Z.; Tang, J. Enzymatic reaction-related protein degradation and proteinaceous amino acid metabolism during the black tea (Camellia sinensis) manufacturing process. Foods 2020, 9, 66. [Google Scholar] [CrossRef]
- Wang, J.; Zhang, Y.; Liu, Y.; Zhang, S.; Yuan, L.; Zhong, Y.; Wu, X.; Yang, J.; Xu, Z. Multi-metabolomics coupled with quantitative descriptive analysis revealed key alterations in phytochemical composition and sensory qualities of decaffeinated green and black tea from the same fresh leaves. Foods 2022, 11, 3269. [Google Scholar] [CrossRef]
- Yao, H.; Su, H.; Ma, J.; Zheng, J.; He, W.; Wu, C.; Hou, Z.; Zhao, R.; Zhou, Q. Widely targeted volatileomics analysis reveals the typical aroma formation of Xinyang black tea during fermentation. Food Res. Technol. 2023, 164, 112387. [Google Scholar] [CrossRef]
- Zhang, Y.; Zhang, P.; Le, M.; Qi, Y.; Yang, Z.; Hu, F.; Ling, T.; Bao, G.-H. Improving flavor of summer Keemun black tea by solid-state fermentation using Cordyceps militaris revealed by LC/MS-based metabolomics and GC/MS analysis. Food Chem. 2023, 407, 135172. [Google Scholar] [CrossRef]
- Jiang, B.; Yang, L.; Luo, X.; Huang, R.; Jiao, W.; Zhong, X.; Li, L.; Wang, Q.; Liu, M.; Liu, K. Aroma formation and dynamic changes during Sichuan black tea processing by GC–MS-based metabolomics. Fermentation 2023, 9, 686. [Google Scholar] [CrossRef]
- Wang, Q.; Qin, D.; Jiang, X.; Fang, K.; Li, B.; Wang, Q.; Pan, C.; Ni, E.; Li, H.; Chen, D.; et al. Characterization of the aroma profiles of Guangdong black teas using non-targeted metabolomics. Foods 2023, 12, 1560. [Google Scholar] [CrossRef]
- Wang, B.; Chen, H.; Qu, F.; Song, Y.; Di, T.; Wang, P.; Zhang, X. Identification of aroma-active components in black teas produced by six Chinese tea cultivars in high-latitude region by GC-MS and GC-O analysis. Eur. Food Res. Technol. 2021, 248, 647–657. [Google Scholar] [CrossRef]
- Liu, C.; Wang, C.; Zheng, T.; Zhao, M.; Gong, W.; Wang, Q.; Yan, L.; Zhang, W. Characterization of key odor-active compounds in sun-dried black tea by sensory and instrumental-directed flavor analysis. Foods 2022, 11, 1740. [Google Scholar] [CrossRef]
- Kanani, D.M.; Nikhade, B.P.; Balakrishnan, P.; Singh, G. Recovery of valuable tea aroma components by pervaporation. Ind. Eng. Cheme. Res. 2003, 42, 6924–6932. [Google Scholar] [CrossRef]
- Fang, S.; Ning, J.; Huang, W.; Zhang, G.; Deng, W.; Zhang, Z. Identification of geographical origin of Keemun black tea based on its volatile composition coupled with multivariate statistical analyses. J. Sci. Food Agric. 2019, 99, 4344–4352. [Google Scholar] [CrossRef]
- Niu, Y.; Ma, Y.; Xiao, Z.; Zhu, J.; Xiong, W.; Chen, F. Characterization of the key aroma compounds of three kinds of Chinese representative black tea and elucidation of the perceptual interactions of methyl salicylate and floral odorants. Molecules 2022, 27, 1631. [Google Scholar] [CrossRef]
- Wu, Q.; Zhou, Z.; Zhang, Y.; Huang, H.; Ou, X.; Sun, Y. Identification of key components responsible for the aromatic quality of Jinmudan black tea by means of molecular sensory science. Foods 2023, 12, 1794. [Google Scholar] [CrossRef]
- Ye, F.; Qiao, X.; Gui, A.; Wang, S.; Liu, P.; Wang, X.; Teng, J.; Zheng, L.; Feng, L.; Han, H. Metabolomics provides a novel interpretation of the changes in main compounds during black tea processing through different drying methods. Molecules 2021, 26, 6739. [Google Scholar] [CrossRef]
- Ma, L.; Gao, M.; Zhang, L.; Qiao, Y.; Li, J.; Du, L.; Zhang, H.; Wang, H. Characterization of the key aroma-active compounds in high-grade Dianhong tea using GC-MS and GC-O combined with sensory-directed flavor analysis. Food Chem. 2022, 378, 132058. [Google Scholar] [CrossRef]
Disclaimer/Publisher’s Note: The statements, opinions and data contained in all publications are solely those of the individual author(s) and contributor(s) and not of MDPI and/or the editor(s). MDPI and/or the editor(s) disclaim responsibility for any injury to people or property resulting from any ideas, methods, instructions or products referred to in the content. |
© 2024 by the authors. Licensee MDPI, Basel, Switzerland. This article is an open access article distributed under the terms and conditions of the Creative Commons Attribution (CC BY) license (https://creativecommons.org/licenses/by/4.0/).