Article

Synchronous Retrieval of Wheat Cab and LAI from UAV Remote Sensing: Application of the Optimized Estimation Inversion Framework

1
College of Agricultural Equipment Engineering, Henan University of Science and Technology, Luoyang 471023, China
2
Longmen Laboratory, Luoyang 471003, China
3
Henan Modern Agricultural Big Data Industry Technology Research Institute Co., Ltd., Zhengzhou 450046, China
*
Author to whom correspondence should be addressed.
Agronomy 2024, 14(2), 359; https://doi.org/10.3390/agronomy14020359
Submission received: 13 December 2023 / Revised: 6 February 2024 / Accepted: 8 February 2024 / Published: 10 February 2024
(This article belongs to the Topic Advances in Crop Simulation Modelling)

Abstract

:
Chlorophyll a and b content (Cab) and leaf area index (LAI) are two key parameters of crops, and their quantitative inversions are important for growth monitoring and the field management of wheat. However, due to the close correlation between the spectral signals of these two parameters and the effects of soil and atmospheric conditions, as well as modeling errors, synchronous retrieval of LAI and Cab from remote sensing data is still a challenging task. In a previous study, we introduced the optimal estimation theory and established the inversion framework by coupling the PROSAIL (PROSPECT + SAIL) model with the unified linearized vector radiative transfer model (UNL-VRTM). The framework fully utilizes the simulated radiance spectra for synchronous retrieval of Cab and LAI at the UAV observation scale and has good convergence and self-consistency. In this study, based on this inversion framework, synchronized retrieval of Cab and LAI was carried out by real wheat UAV observation data and validated with the ground-measured data. By comparing with the empirical statistical model constructed by the PROSAIL model and coupled model, least squares support vector machine (LSSVM), and random forest (RF), the proposed method has the highest accuracy of Cab and LAI estimated from UAV multispectral data (for Cab, R2 = 0.835, RMSE = 14.357; for LAI, R2 = 0.892, RMSE = 0.564). Our proposed method enables the fast and efficient estimation of Cab and LAI in multispectral data without prior measurements and training.

1. Introduction

As one of the world’s major crops grown on a large scale, wheat plays a significant role in the global food supply [1]. Cab and LAI are two important indicators of wheat growth, which can be used to characterize the overall growth and health of the crop. Thus, their timely and accurate estimation is important for the fine management of wheat fields [2,3]. Traditional methods of obtaining Cab and LAI mainly use field sampling, which is destructive to plants and inefficient. The unmanned aerial vehicle (UAV) low-altitude remote sensing monitoring has the characteristics of non-contact, large area, high efficiency and strong adaptability. It has become an important means of realizing agricultural sensing and is widely used in crop physical and chemical parameter inversion [4,5]. Due to the coupling of spectral signals between Cab and LAI, the synchronous and accurate estimation of these two parameters from remote sensing data remains a challenging task.
There are currently two main approaches to estimate wheat Cab and LAI based on multispectral remote sensing data: the empirical modeling method and the physical modeling method. The empirical methods are developed by constructing spectral indices using linear and nonlinear regression [6,7], support vector regression [8], partial least squares regression [9] etc. These approaches usually need collect a large amount of measured data and have poor generalization. For this, current studies construct a variety of spectral indices by considering the soil background and observation mode [10]. The physical models take into account the physical transmission process between the canopy and radiation measurements, which has strong generalization and extensibility [11,12]. Inversion methods based on physical models, such as look-up tables, neural networks, simulated annealing, genetic algorithms [13,14,15] etc., have been successfully applied to estimate Cab and LAI. Among them, the coefficient of determination (R2) of estimated LAI for deciduous forest plantations reaches 0.9 through a machine learning regression algorithm, but the method is time-consuming for training and inference [16]. Inadequate information is provided by the limited spectral bands and the uncertainties in the measurements and models, so the inversion based on physical model remains hard work [17,18,19]. Some of the studies use multi-source remote sensing data to enrich the canopy information. For example, the color [20], texture features [21] and LiDAR point cloud structural parameters [22] etc. are introduced to improve the accuracy of the inversion results. However, there is still a need for improvement in feature extraction. Other methods try to optimize the structure of the inversion algorithm by eliminating the effects of unconcerned parameters. Zhu et al. [23] constructed a two-dimensional matrix by combining different vegetation indices to estimate Cab and LAI from the hyperspectral data. However, the prediction results still need to be improved.
To this end, we proposed an inversion method based on the early studies, which use a more rational model and an inversion strategy [24]. The method, based on the theory of optimal estimation [25], builds a cost function by combining the a priori information and the observation error. It can make full use of the effective information from the observed data. The self-consistency of the inversion framework has been tested under simulated data, which demonstrates that the proposed framework can be used for multi-parameter synchronous inversion in wheat. However, the study is yet to be applied to real data.
In this study, we used UAVs to acquire multispectral data of wheat at the field scale. The obtained data were processed to verify the validity of the proposed coupled model. Firstly, the simulated data from the coupled and single PROSAIL models were analyzed in comparison with the observed data. After that, simulated statistical regression methods were constructed based on the eight typical vegetation indices individually and compared with the single PROSAIL model estimation results. Finally, we investigated the performance of the optimal estimation method for synchronous retrieval of Cab and LAI. The proposed inversion framework is used for UAV multispectral data estimation and compared with empirical statistical models, LSSVM models and RF models. The main objectives include the following: (1) to verify the effectiveness of the coupled model; (2) to analyze the performance of the simulated statistical models, the LSSVM model, the RF model and the optimal estimation method; (3) to apply the proposed inversion framework for UAV multispectral data.

2. Materials and Methods
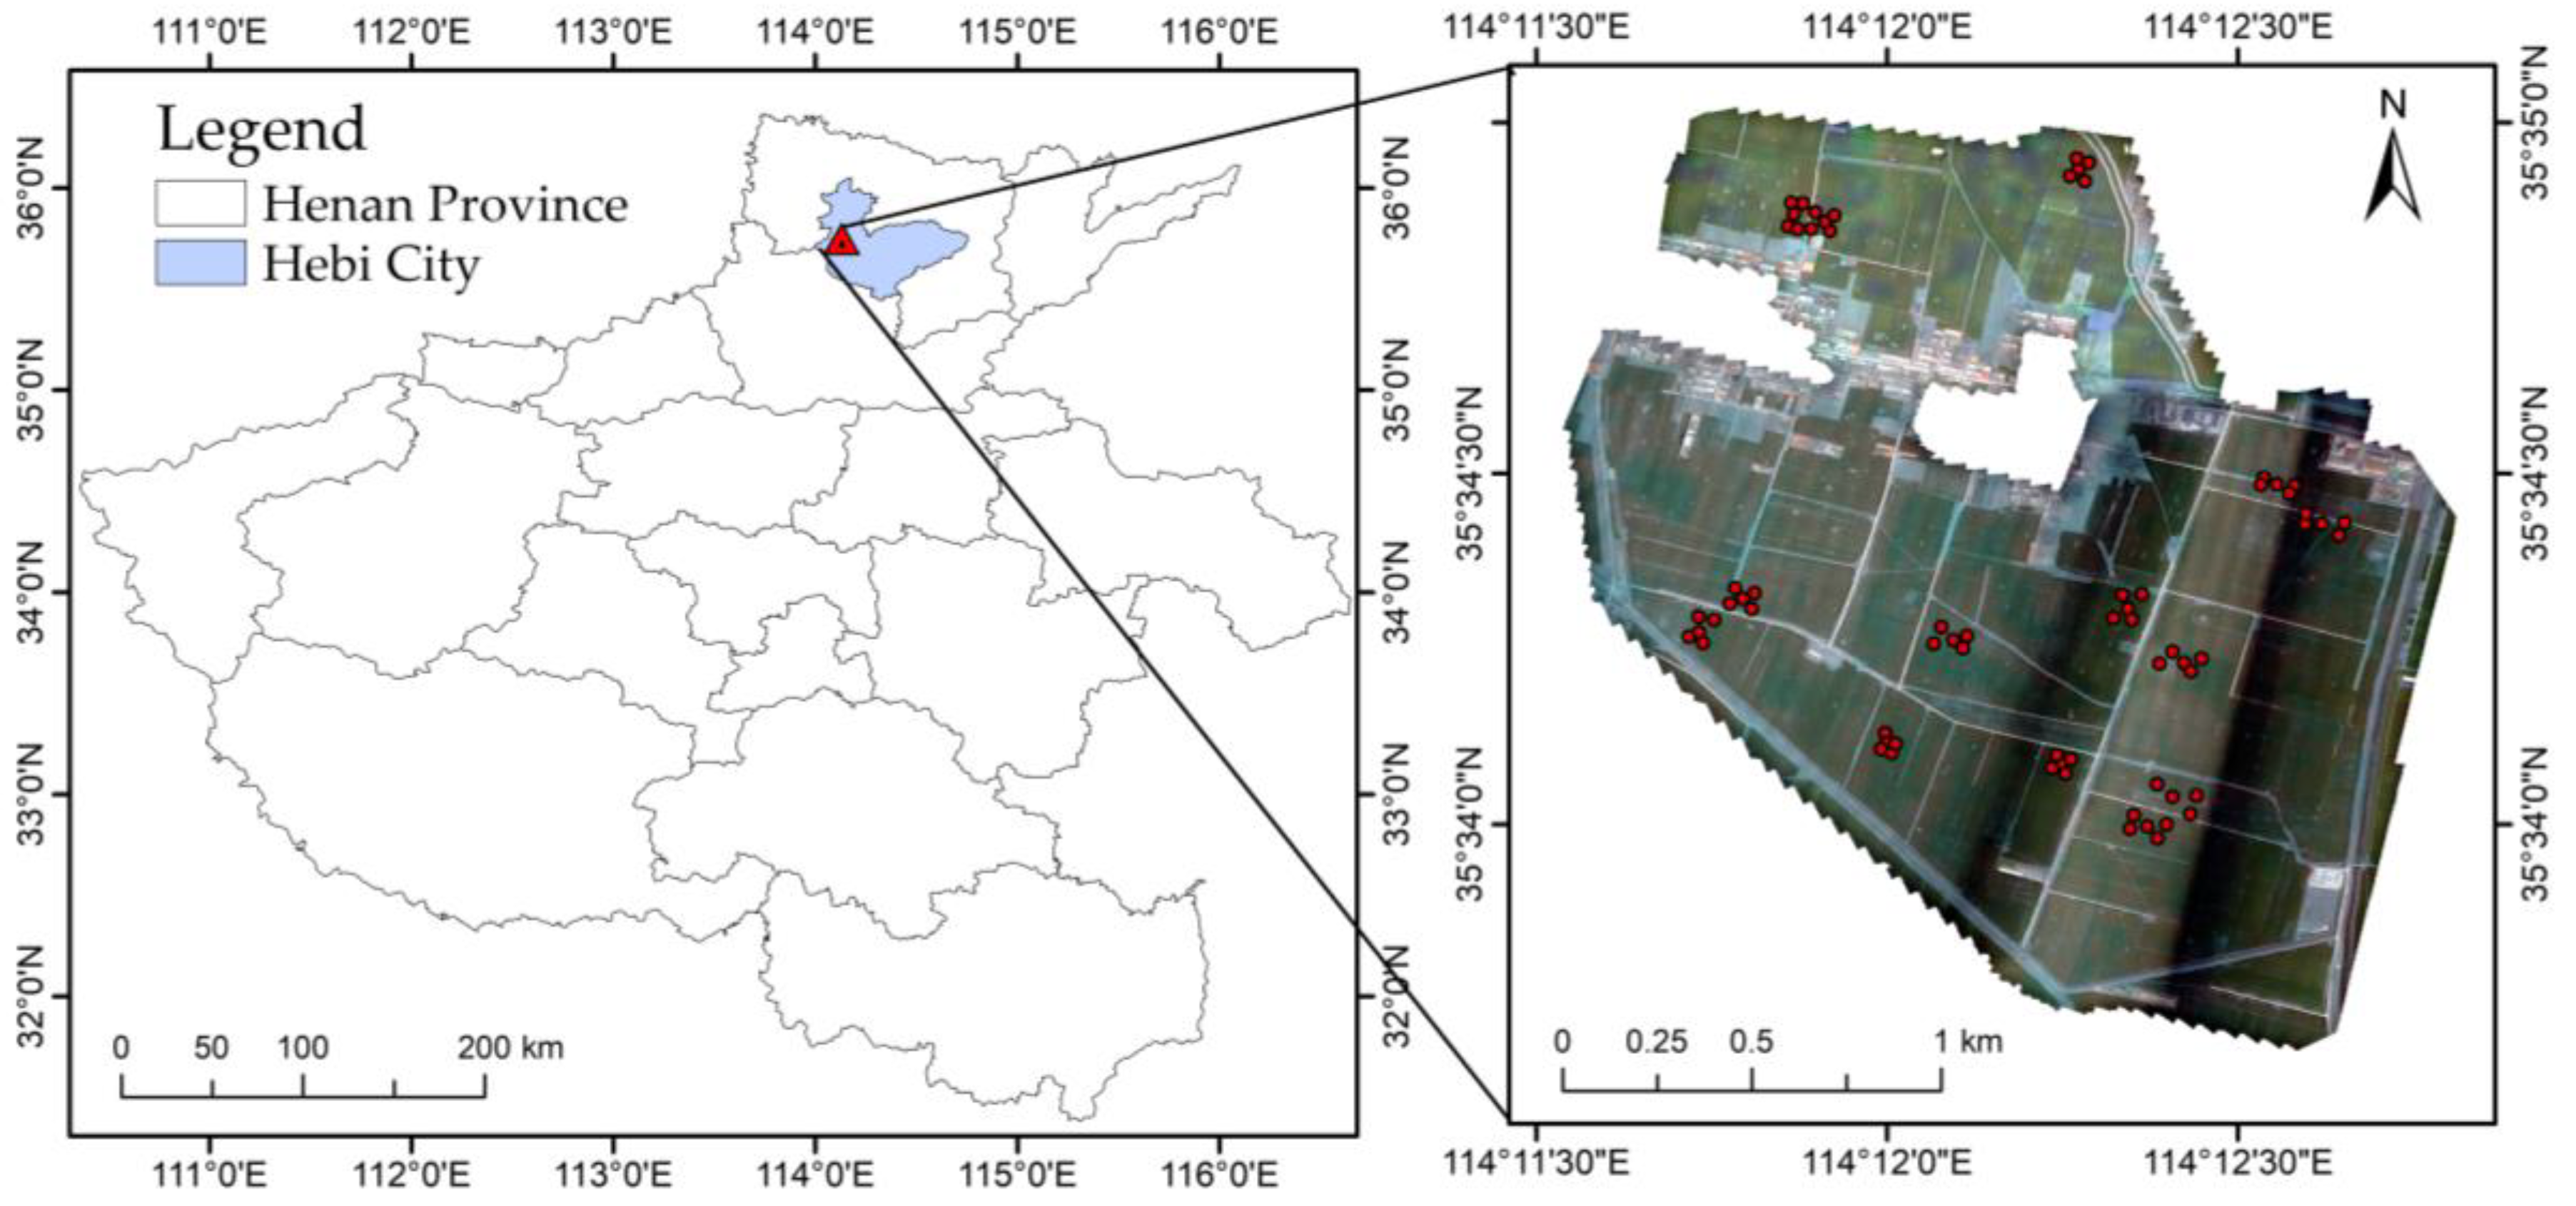
2.1. Study Regional

The study area is located in the National High-Standard Farmland Construction Pilot in Qi County, Hebi City, Henan Province, as shown in Figure 1. The farmland occupies an area of about 5000 acres, specifically located in Shiqiao Village, Miaokou Township (114.17° E, 35.6° N). The region is located in the shallow hilly area in the middle and lower reaches of the Yellow River in the North China Plain, and is situated in the north temperate zone, with obvious seasonal variation. The area features a warm temperate humid monsoon climate, characterized by high temperatures and rainy summers, as well as cold and dry winters. The average ground temperature is 16.7 °C, the average annual temperature is 13.9 °C and the average annual precipitation (including rain, snow and hail) is 605.2 mm, which can satisfy the requirement of temperature conditions for crops to be twice or thrice matured in a year. The region is mainly planted with winter wheat and summer maize, with winter wheat sown in October of the current year and harvested in early June of the following year. The data collection took place on 3 March, 10 March, 28 March, and 8 April 2021.

2.2. UAV Image Data

The multispectral image data was obtained by P4 multispectral UAV (SZ DJI Technology Co., Ltd., Shenzhen, China) with an imaging spectrometer. The UAV is equipped with six 1/2.9-inch CMOS image sensors, including one color sensor for routine visible light (RGB) imaging and five monochrome sensors for multispectral imaging centered on wavelengths of 450, 560, 650, 730, and 840 nm. We completed the acquisition of flight data and ground data from 10:00 a.m. to 2:00 p.m. on the same day when the sunlight intensity was stable, and the weather was clear and cloudless. The flight altitude was set to 25 m, corresponding to a spatial resolution of 1.3 cm. The UAV heading overlap and bypass overlap rates are 80% and 70%, and the flight path was planned using automatic takeoff. Radiometric corrections were carried out using a diffuse target plate, and radiometric calibration data were collected by manually controlling the altitude of the aircraft to seven times the length of the calibration plate. We turned the head at an angle of −90° to ensure that there was no shadow coverage on the reflector. After obtaining the original multispectral digital number values, Terra software (version 3.6.8) was used to perform radiometric correction and image stitching. We used the ground handheld GPS (ZL Electronic Technology Co., Ltd., Hefei, China) to obtain the sample point number and location information. The 3 × 3 image pixels near the sample point were extracted using the remote sensing image as the data source, and the average value was calculated as the reflectance of the wheat pixels in the sample area.

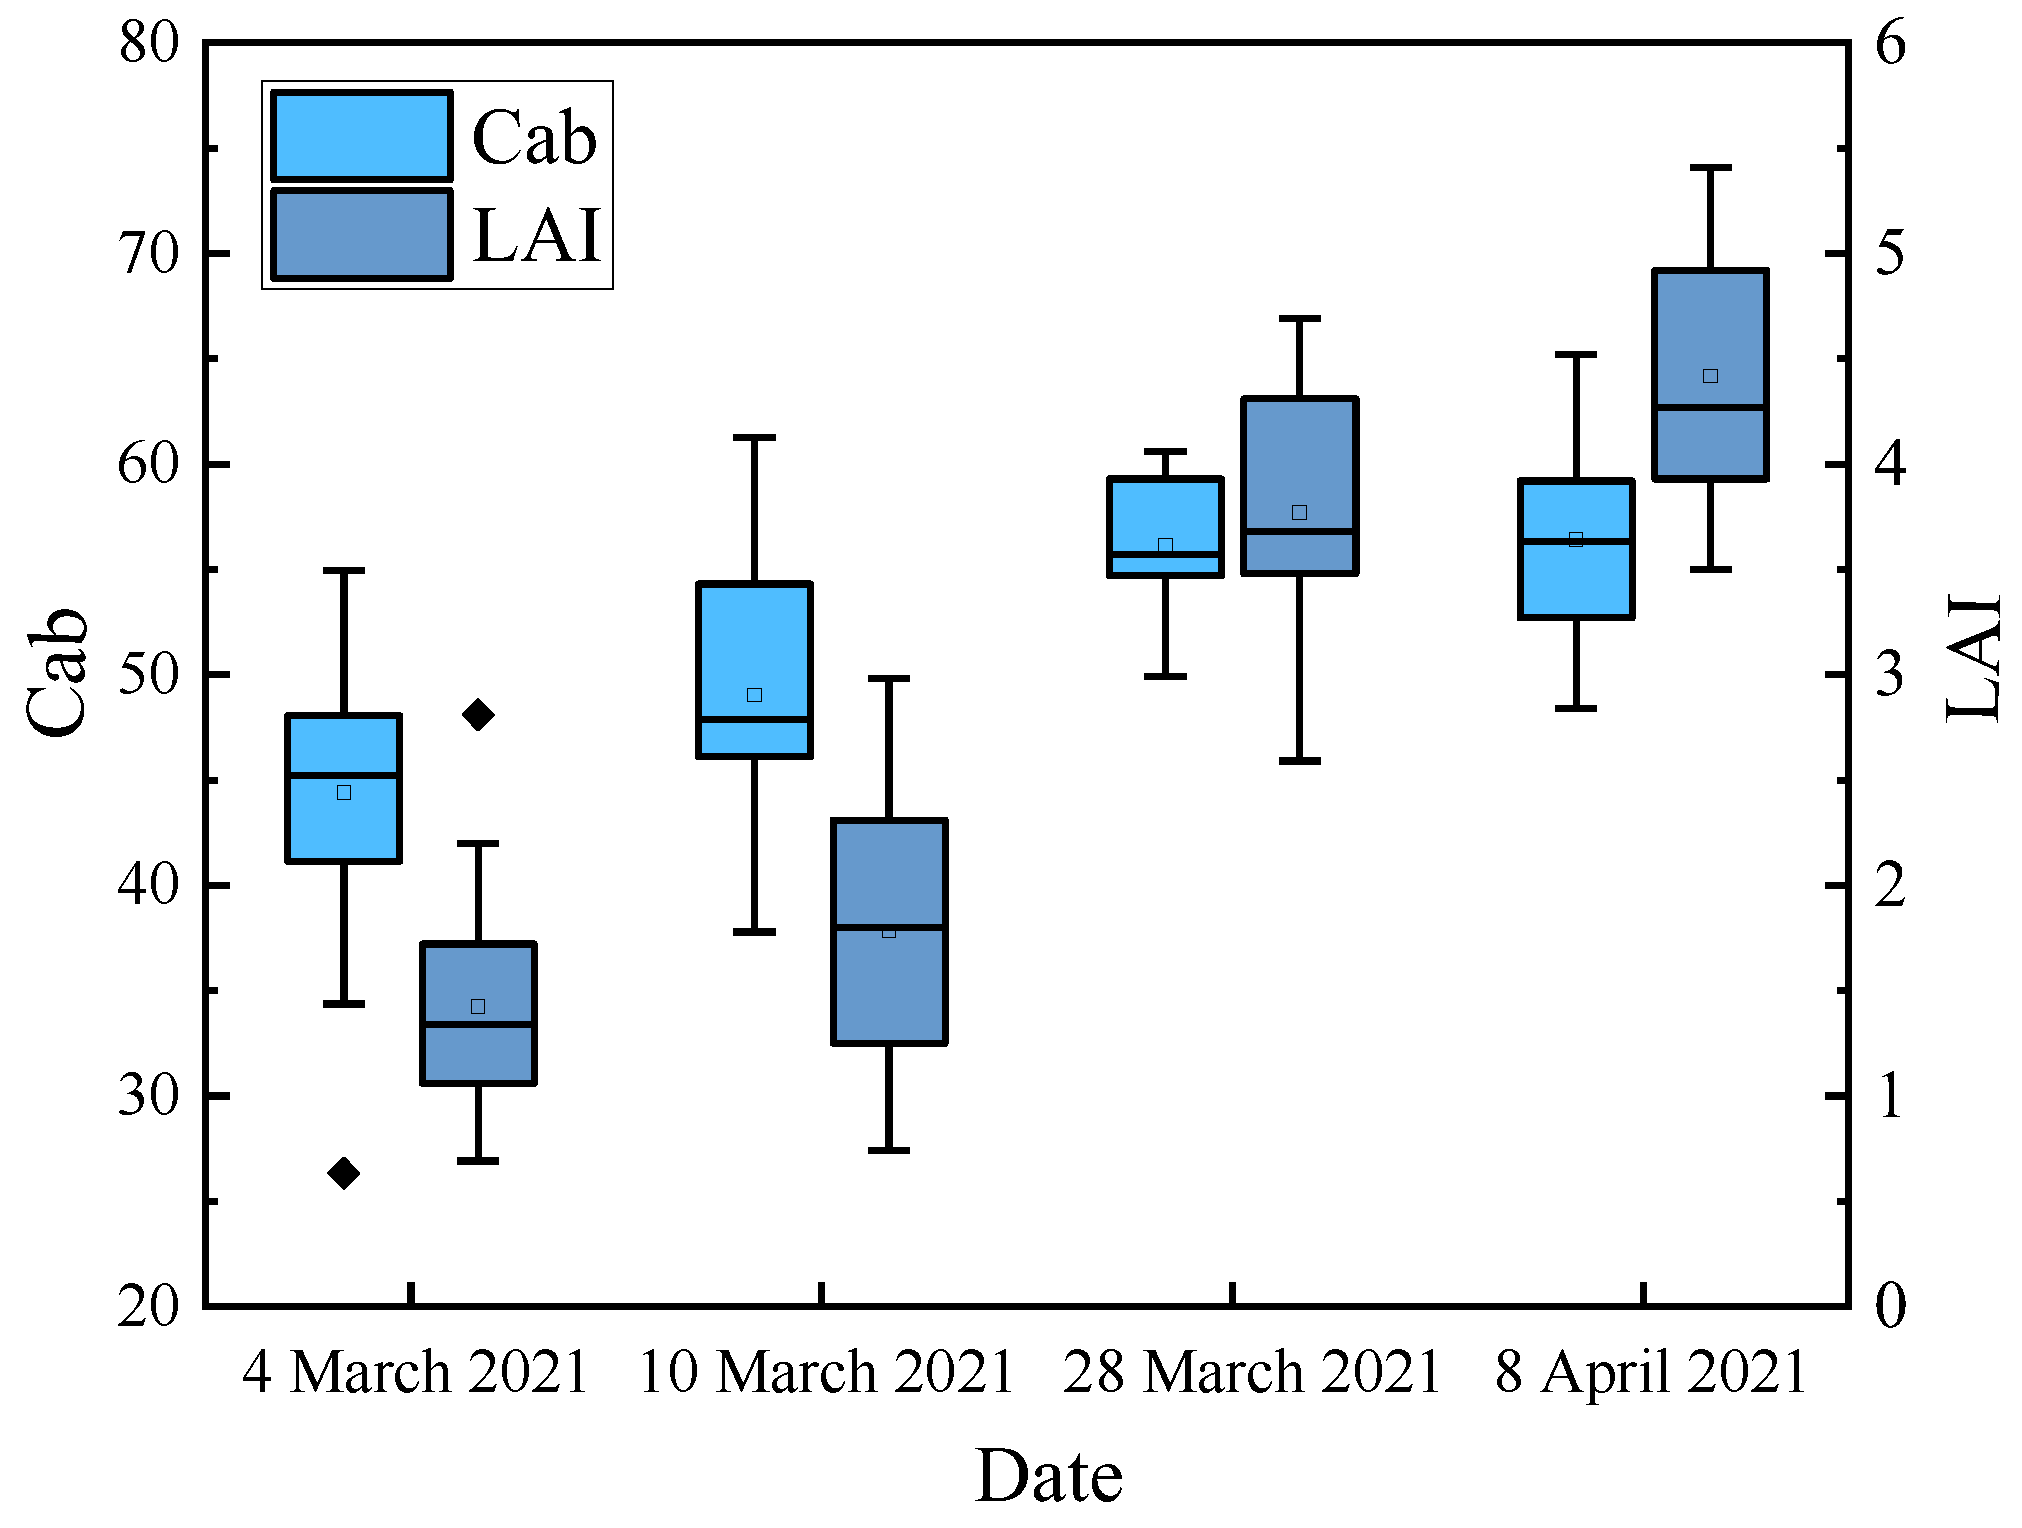
2.3. Ground Cab and LAI Measured Data

The ground LAI was measured in the study area using the LAI-2200 plant canopy analyzer from LI-COR, Lincoln, USA. The instrument is set up for one skylight value and four measurement target values, and the probe wears a lens cover with a 90° angle. The four under-leaf measurement points were located at the top of the row, 1/3 of the way between the rows, 2/3 of the way between the rows and at the top of the rows, and the measured points were evenly spaced in that order. Four sampling points were set up in each plot, and each sampling point was collected three times. The mean value of the measurements within the same plot was calculated as the LAI measured data. To avoid measurement errors caused by direct sunlight, we chose the phases 06:30–09:30 and 16:30–19:30. A portable SPAD-502 Plus chlorophyll content meter from Konica Minolta, Tokyo Metropolis, Japan was used for Cab measurements. Five plants were selected from each sample plot and the top part of each plant was taken three times. All the values within the sample plot were averaged as wheat Cab measured data.
There were 63 sample points in the experimental area in this study. Figure 2 gives the variation of winter wheat Cab and LAI measured data over time in the form of box-and-whisker plots. Each box-and-whisker diagram contains the median value (the solid line in the box), the 25% value (the bottom of the box), the 75% value (the top of the box), as well as the maximum (top of the whisker) and minimum (bottom of the whisker) values of the data. The discrete solid diamonds in the figure represent outliers, and the hollow rectangles in the boxes are the average values for the period. As can be seen in Figure 2, Cab and LAI increased from the greening stage to the jointing stage with the growth and development of winter wheat. LAI increased by 57% from 10 March to 28 March, largely due to a period of concurrent nutrient and reproductive growth. The ground measured data in this paper satisfy the practical requirements.

2.4. Forward Modeling

The PROSAIL model is obtained based on the coupling of the leaf optical characterization model PROSPECT and the canopy reflectance characterization model SAIL [26], first proposed by Jacquemoud and Baret in 1990 and refined in 1995 [27,28,29]. The model considers the physical and chemical parameters, canopy structure and scattering characteristics of the leaf, and is able to simulate the canopy spectrum with a spectral resolution of 1 nm in the 400~2500 nm band range. Based on the P4 multispectral UAV, only five bands were simulated in this study, and the input parameters included Cab, LAI, Cw (equivalent water thickness), Cm (leaf mass per unit leaf area) etc. The model output is the canopy reflectance corresponding to the five center wavelengths. The model takes into account the leaf absorption, scattering and transmission processes of vegetation, as well as the interaction between vegetation and soil, and is suitable for low-altitude remote sensing inversion.
To efficiently detect the spectral characteristics of target features over large areas, the physical transfer process based on the atmosphere–vegetation canopy-sensor needs to be further considered. Several atmospheric correction methods have been introduced [30,31], of which those based on radiative transfer models are the most widely used [32,33]. However, these methods are an independent preoperational process for spectral data optimization and cannot realize the direct coupling with PROSAIL modeling. The Unified Linearized Vector Radiative Transfer Model, UNL-VRTM, is specifically designed to simulate atmospheric remote sensing observations and to invert aerosol, gas, cloud and surface properties from these observations [34]. The model couples the molecular absorption module, MIE scattering calculations, and multiple surface reflectivity models. It provides the calculation of the observed Stokes vectors and the Jacobian matrix of Stokes vectors for aerosol and surface model parameters. The coupling of the UNL-VRTM model with the PROSAIL model not only realizes the atmospheric correction, but also obtains the Jacobian matrix of apparent to canopy reflectance, which is very beneficial to find the parameter optimal solution.
This study was based on the inversion framework, used a Linux system, a Fortran compiler, and configured the environment needed to run the PROSAIL model with the UNL-VRTM model. The PROSAIL model selected the PROSAIL_5B_Fortran version, and the UNL-VRTM model selected the 1.6.4 version. The coupling of the models was achieved by writing the PROSAIL model output surface reflectance call module, which was embedded as input to the UNL-VRTM model.

2.5. Simulation Statistical Regression Method

After defining the coupled model input parameter values (Cw = 0.004, Cm = 0.012, N = 1.3, ALA = 15, Car = 8, Ant = 0, Cbrown = 0, hspot = 0.01, psoil = 0.1, tts = 40, tto = 0.1, psi = 178), we set Cab and LAI to vary from 20–70 and 1–7, respectively. A total of 1100 simulated spectra data were generated by using the coupled model. A total of 500 simulated values in the dataset were used for Cab modeling, and the remaining simulated values were used for LAI modeling.
Previous studies show that leaf Cab and vegetation LAI have different sensitivities to different bands [23]. Vegetation indices based on the green and red edge bands are more sensitive to Cab [35], while vegetation LAI is strongly correlated with the red and near-infrared bands [3]. To reduce the influence of soil background and radiative transfer error, we adopted eight typical vegetation indices such as normalized vegetation index (NDVI) and green light chlorophyll index (CIgreen) for Cab and LAI estimation. Eight typical vegetation indices are listed in Table 1. The wavelengths used are in the bandwidth domain of the P4 multispectral visible and near-infrared range.
Based on the eight vegetation indices constructed from the simulated data, we used them as the independent variables and the Cab and LAI as the dependent variables. Then we constructed the best-fit model according to the fitting methods of linear regression, logarithmic regression, power regression and exponential regression. Finally, the performance of the regression method was assessed based on the R2 of the curve-fitting model. The performance of eight vegetation indices and four regression methods for the inversion of Cab and LAI was evaluated, and the top four vegetation indices and the corresponding regression models are presented in Table 2.
As shown in Table 2, the CIgreen, CIre, MTCI and NDRE were sensitive to Cab and the regression models all exhibit logarithmic functions with modeling R2 > 0.95. In the LAI estimation model, the regression models constructed by NDVI, BNDVI and RVI, with LAI all exhibiting exponential functions. Among them, the R2 of the NDVI and BNDVI constructed models were 0.71 and 0.73, which was mainly due to LAI gradually reaching saturation as the vegetation index continues to increase. The GNDVI with LAI regression model was a power function, corresponding to modeling R2 of 0.84, since the green light band has a major impact on deeper canopy structures under composite canopy conditions [43]. These results show that the estimation model constructed based on simulated data can exhibit high accuracy and can provide a good basis for the inversion of actual UAV observation data.

2.6. Inversion Results Evaluation Method

In this study, the R2 and root mean square error (RMSE) were used to evaluate the inversion results. The specific calculation formulas as shown in Equations (1) and (2).
R 2 = i = 1 n ( x i i n v x ¯ ) 2 i = 1 n ( x i x ¯ ) 2
R M S E = i = 1 n ( x i i n v x i ) 2 n
where x i i n v is the inverse value of wheat Cab or LAI. x i and x ¯ are the measured values of wheat Cab or LAI and their mean values for each sample point, respectively. n is the number of samples.

3. Results and Analysis

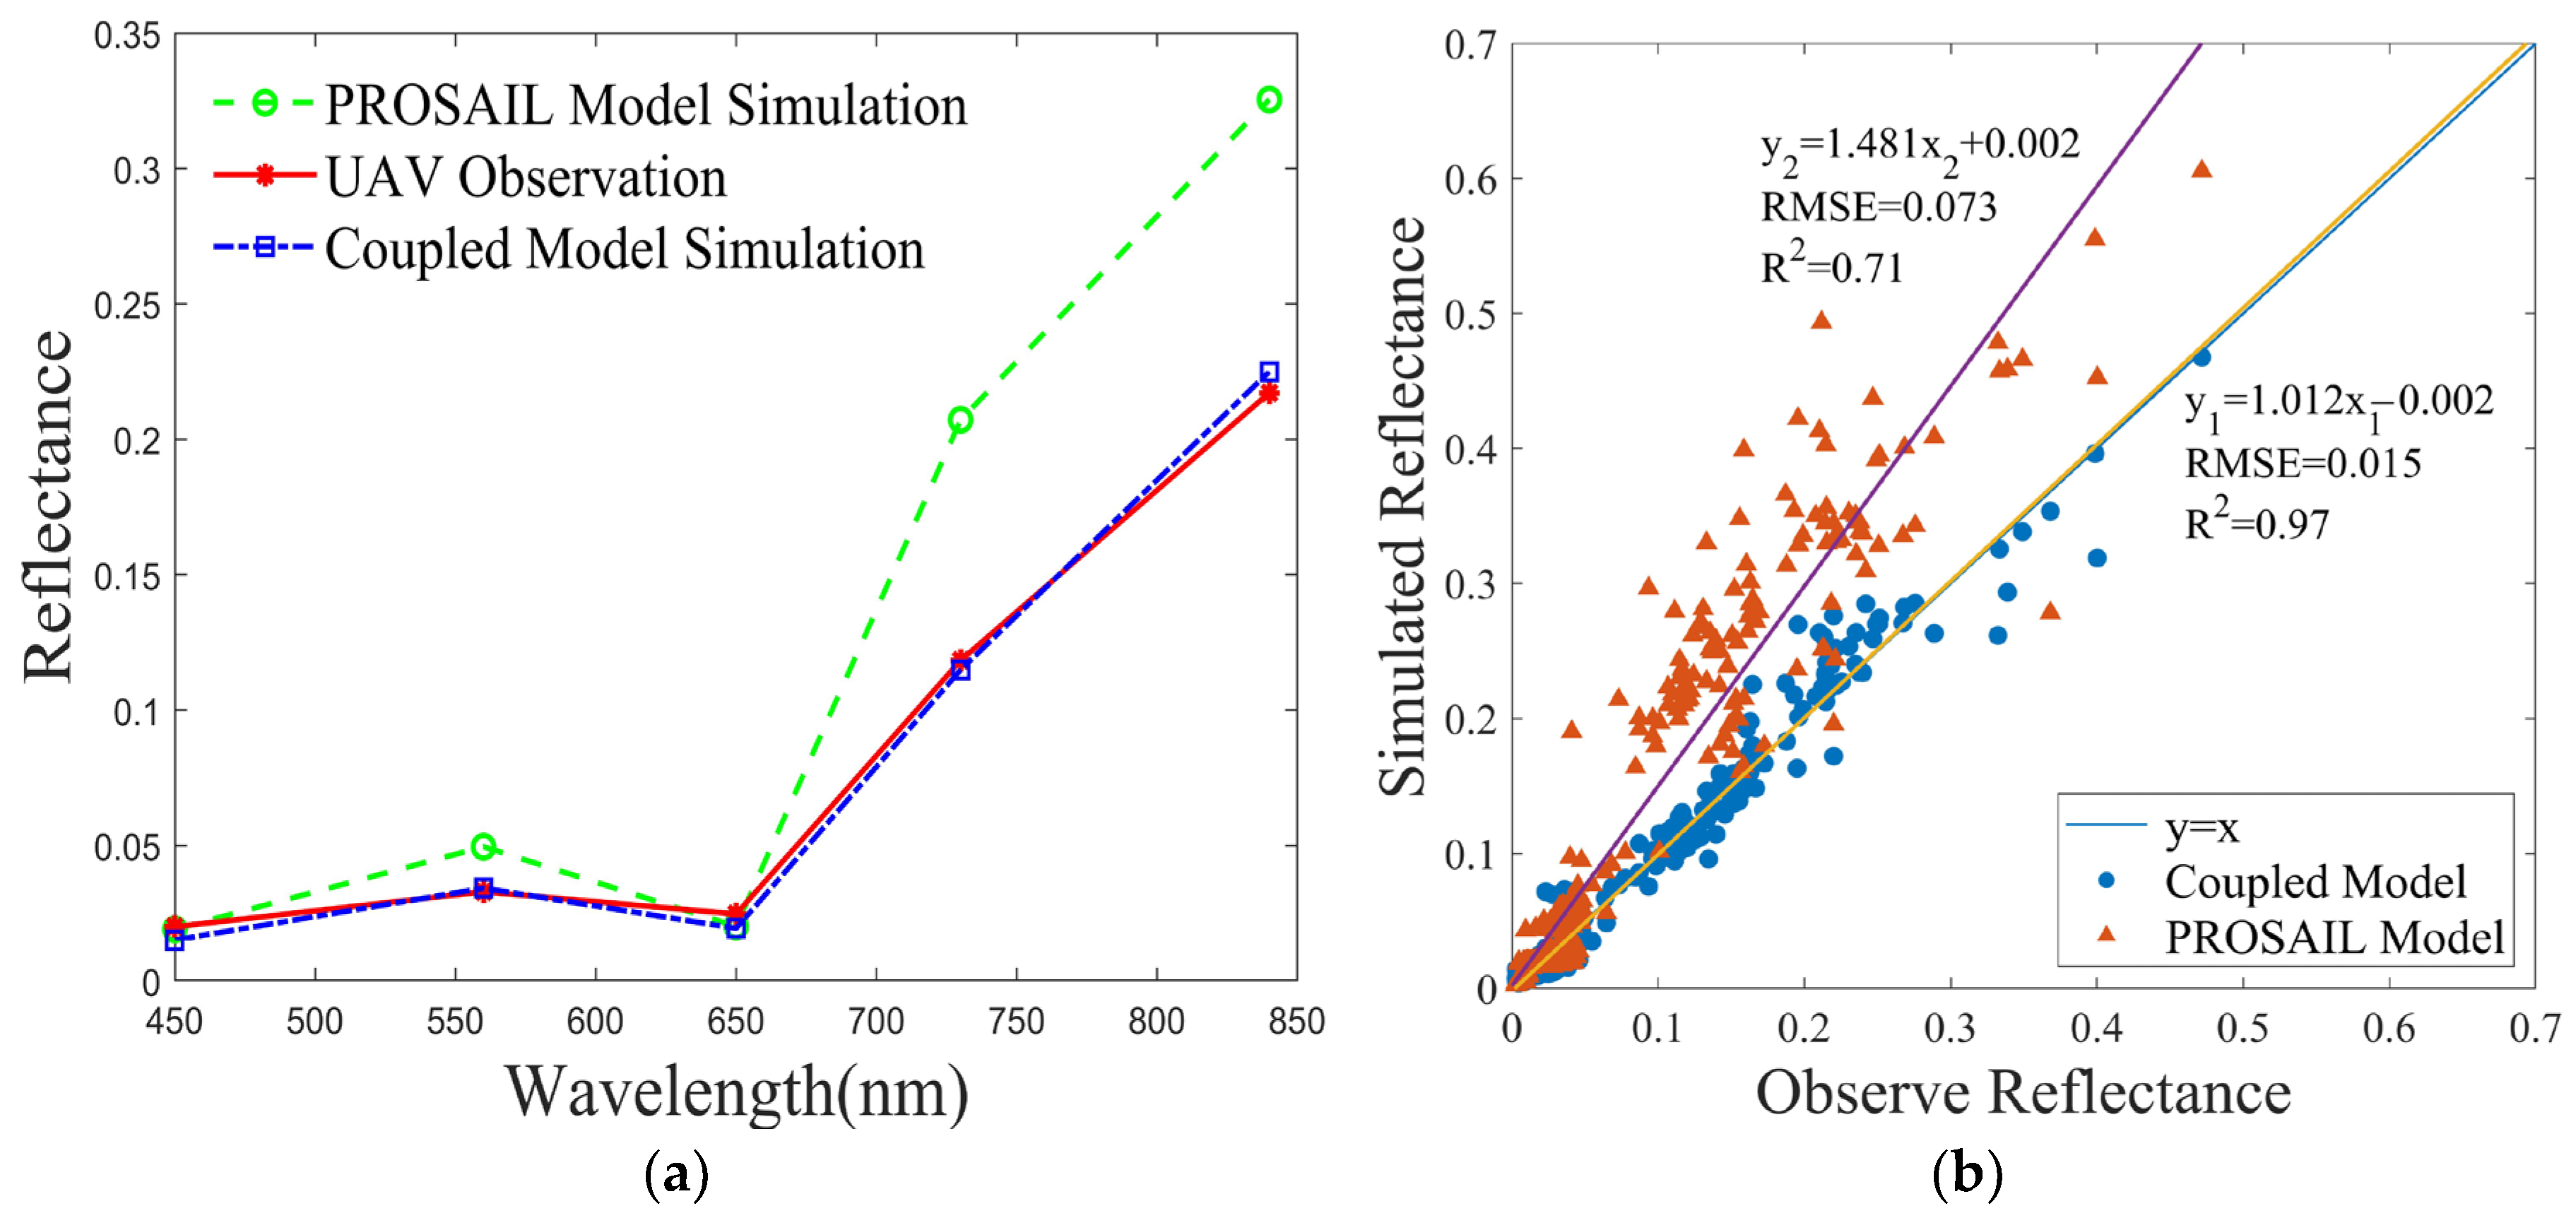
3.1. Comparison of Simulated Spectral Data and UAV Observed Spectral Data

Considering that remote sensing data are biased during acquisition and processing, we added 5% relative Gaussian noise as reflectance uncertainty to the simulated canopy spectra. Figure 3a describes the comparison of a set of simulated data with the UAV observations on 28 March 2021. A total of 63 sets of data were collected from four periods in the study area, and we performed a statistical comparative analysis of the observed data, as well as the canopy spectral data simulated by the PROSAIL model and the coupled model, as shown in Figure 3b. The horizontal coordinates represent the observed reflectance and the vertical coordinates represent the simulated reflectance, as shown in Figure 3b. The blue solid circle and yellow solid line represent the coupled model simulation data and its fitting line, respectively. The orange solid triangle and violet solid line represent the PROSAIL model simulation data and its fitting line, respectively.
As shown in Figure 3a, the coupled model simulations a slightly different from the PROSAIL simulations in the blue and red light bands, which is mainly because the relatively small effect of the atmospheric corrections on the two bands. In the green, red-edge and near-infrared bands, the coupled model simulations are significantly lower compared to the PROSAIL simulations. The most significant decrease of reflectance was in the NIR band, with a decrease of 10%, which is mainly because the coupled model removes the effects caused by atmospheric scattering and absorption, and improves the spectral resolution of the remote sensing images. As shown in Figure 3b, the correlation between the observed data and the coupled simulated data is significantly improved compared to the PROSAIL simulated data, with a 26% improvement in R2. The coupled simulations were close to the UAV observations as a whole.

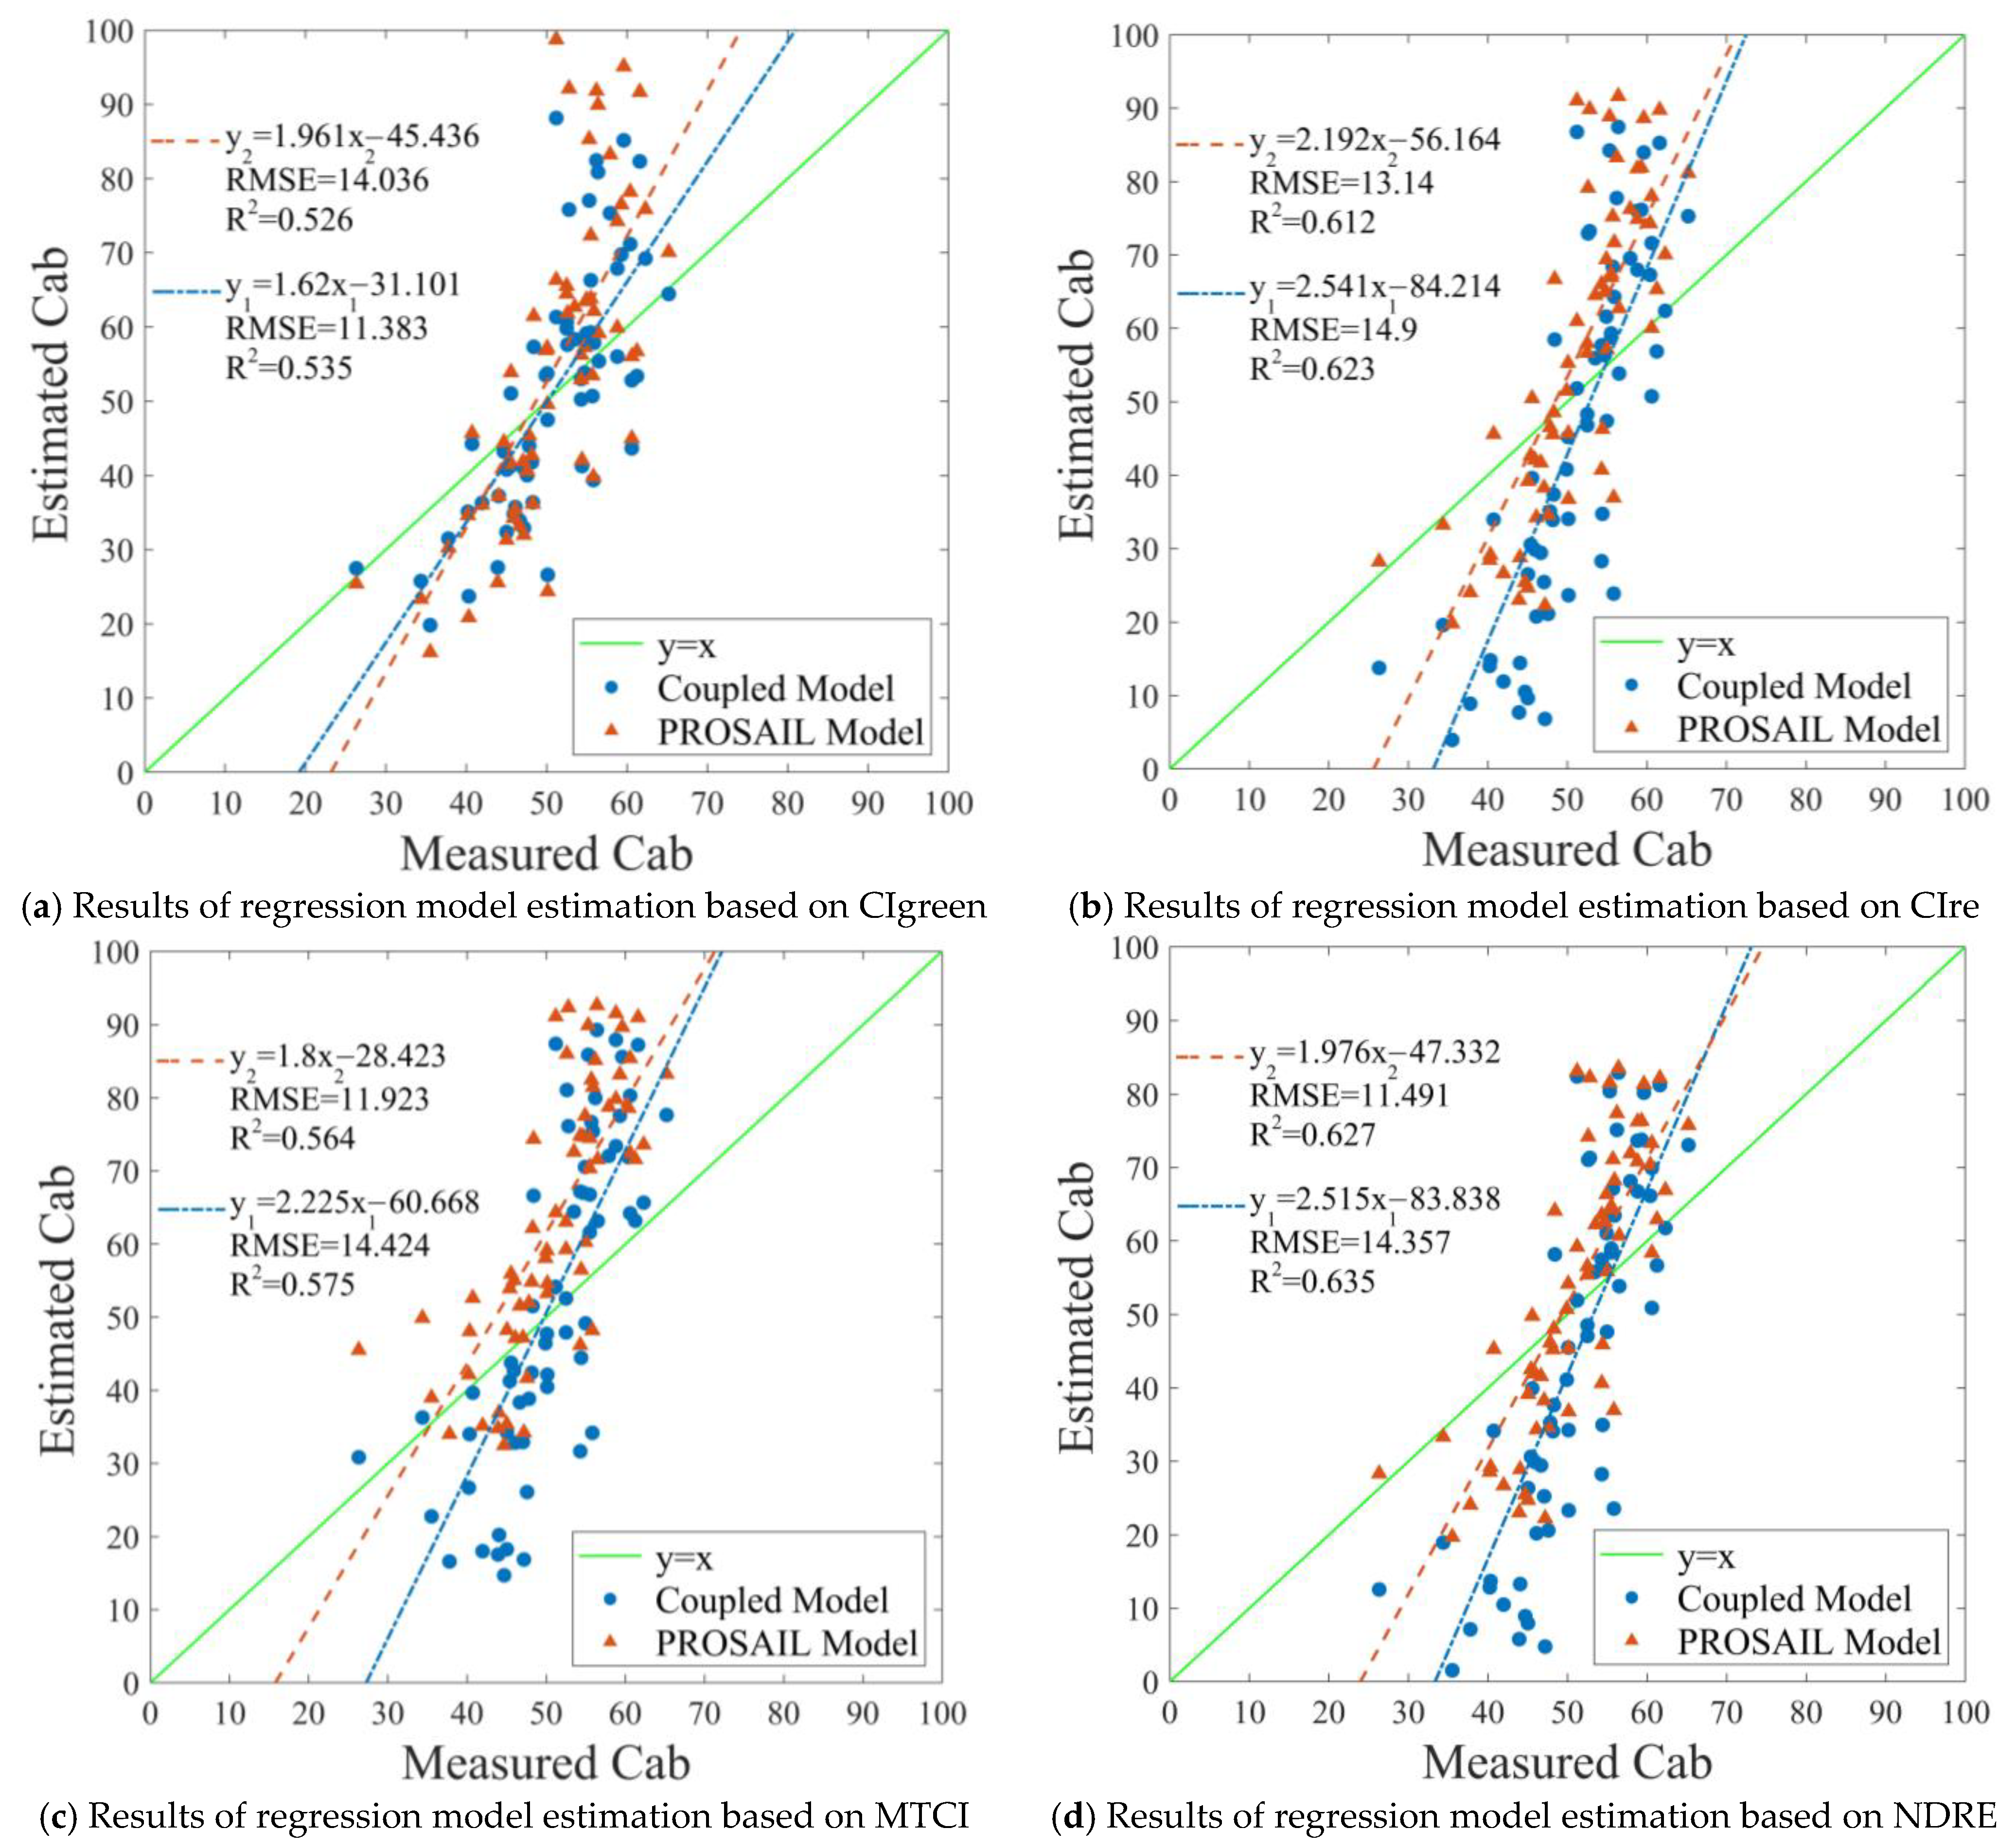
3.2. Inversion of Parameters Based on Simulation Statistical Regression Method

Based on UAV observations, Cab and LAI were estimated using a statistical regression model constructed from coupled simulation data. The inversion results were compared with the PROSAIL model as shown in Figure 4 and Figure 5. The horizontal and vertical coordinates indicate the measured and estimated values, respectively. The blue solid circle and dotted line indicate the results of the statistical regression estimation based on the coupled model and its fitting line, and y1 is the corresponding regression equation. The orange solid triangles (pentagrams) and dashed lines indicate the results of the statistical regression estimation based on the PROSALI model and its fitted line, and y2 is the corresponding regression equation. The green line is the 1:1 line.
As illustrated in Figure 4, four statistical regression models based on the coupled model exhibit superior estimation accuracy for Cab, and the fitted curves are closer to the y = x straight line compared to PROSAIL. Statistical regression models based on the PROSAIL model have a similar estimation accuracy compared with the coupled model, but the latter estimate Cab with lower uncertainty. Among these, estimated Cab and LAI based on the CIre and NDRE have the higher accuracy, which is mainly because of the stronger sensitivity of the red-edge band to Cab. For both vegetation indices, the R2 estimated based on the coupled model improved by 0.011 and 0.008 compared to PROSAIL. We can also know that for CIgreen, CIre and NDRE, both estimates based on PROSAIL and coupled models exhibit slightly lower than measured values for Cab < 50 and higher than measured values for Cab > 50. On the one hand, it is due to the inherent deviation of spectral data from measured data during modeling. On the other hand, the statistical regression modeling approach of the coupled model is similar to PROSAIL. For MTCI, the regression estimation results based on the PROSAIL model are overall high compared to the measured values, and the coupled model effectively avoids this problem.
Based on the canopy spectral data simulated by the single PROSAIL model and the coupled model, the results of LAI estimation by the regression estimation model using NDVI, BNDVI, GNDVI and RVI are shown in Figure 5. As illustrated in the figure, for the first three vegetation indices, the fitted curves of the estimation results of the coupled model do not change significantly compared to the PROSAIL. This suggests that the vegetation index is relatively insensitive to atmospheric change. However, the coupled model estimates are generally better than the PROSAIL model. For RVI, the estimation accuracy R2 of the coupled model is improved by 0.071 compared to the PROSAIL model, and the fitted curve is significantly closer to the 1:1 line. In addition, both model estimates constructed based on BNDVI had the highest accuracy, with R2 of 0.746 and 0.719, and RMSE of 0.76 and 0.788. While the scattered spatial distributions of the model estimates based on BNDVI were closest to the 1:1 line with the measured values.
By comparing the two models and the statistical regression models built with different vegetation indices, it can be concluded that the coupled model has better estimation results. The regression model based on NDRE predicted Cab with the highest accuracy, with an R2 of 0.635. BNDVI-based regression model predicted LAI with the highest accuracy, with an R2 of 0.746. The results show that our proposed coupled model is useful for atmospheric correction and its statistical regression method can support the inversion of wheat physicochemical parameters Cab and LAI.

3.3. Inversion of Parameters Based on Optimal Estimation Method

If there are some unknown parameters of a system that need to be estimated, the optimal estimation inversion method is a better solution idea. It finds the optimal parameter by minimizing a cost function, and the function is usually based on the error between the observed data and the model simulated data [24]. We transformed the nonlinear canopy radiative transfer model inversion into a cost function minimization problem. The minimum solution of the cost function is obtained through continuous optimization iterations. In this paper, the values of model parameters come from the empirical values of the fertility period. We estimated the observation geometries based on the UTC of the UAV flight during data collection and the longitude and latitude of the sampling points. The previous estimation of Cab and LAI were based on the historical data statistics of the same period of crop parameters.
Based on measured UAV multispectral data, the optimal estimation method was applied to invert wheat Cab and LAI. The inversion results were compared with the simulated statistical regression model, as shown in Figure 6. To evaluate the applicability of the optimal estimation more comprehensively, LSSVM and RF were added in this study for comparison, as shown in Table 3. LSSVM is an improved method based on standard Support Vector Machines (SVM), which map data to a high-dimensional feature space through mathematical optimization and kernel tricks, thus turning a nonlinear problem into a linear one. The model does not require much hyperparameter tuning and is widely used in regression problems. RF is a powerful machine learning algorithm that can be resistant to noise and randomness in the input data and provides better fitting to nonlinear problems. For the LSSVM and RF methods, this study is based on 63 sets of measured data, eight vegetation indices are calculated and used as inputs to the model, and Cab and LAI were used as outputs, respectively. Where 2/3 of the dataset is used for the training of the model and the rest of the data is subjected to validation. The horizontal and vertical coordinates in Figure 6 represent the measured and estimated values, respectively. The blue solid circle and dotted line represent the estimation results based on the optimal estimation method and its fitted line, and y1 is the corresponding regression equation. The orange solid triangle (pentagram) and dashed line indicate the estimation results based on the simulated statistical regression model and its fitted line, and y2 is the corresponding regression equation. The green line is a 1:1 line.
As shown in Figure 6, for the statistical regression model and the optimal estimation inversion method, the latter has the highest estimation accuracy. The R2 of Cab and LAI increased by 0.2 and 0.146, respectively, and the RMSE decreased by 9.79 and 0.196, respectively. The optimal estimation method, developed by integrating simulated and observed data, outperforms the statistical regression model. In addition, the inversion value of Cab in the statistical method is significantly lower than the measured value is effectively corrected in the optimal estimation method. This shows that the inversion strategy based on iterative optimization has a better fitting effect, while the addition of a priori constraints can effectively suppress the ill-posed problem of physical model inversion. As illustrated in Table 3, the statistical regression model estimation accuracy is lower than the LSSVM and RF models. This is primarily because the simulated statistical regression model relies on coupled model simulation data, and the model parameters are empirical values, which are less pertinent compared to the validated measured data. However, the model does not need to be trained and measured in advance due to the introduction of a more generalized physical model. In addition, the results show that our proposed method has better performance compared to LSSVM and RF models. The R2 and RMSE were 0.835 and 4.567 for Cab and 0.892 and 0.564 for LAI, respectively.

4. Discussion

Cab and LAI are crucial indicators for assessing the growth conditions and health of wheat. High chlorophyll content in the early stages of wheat growth enhances robust photosynthesis, thereby accelerating growth and energy accumulation for later development stages [44]. During the tillering and jointing phases, a higher LAI helps maximize photosynthesis, supporting rapid growth and development [45]. Variations in Cab and LAI, whether excessive or deficient, could indicate potential challenges such as nutritional imbalances, water stress or pest infestations in wheat crops [46,47]. It is critical to continuously monitor and manage these parameters throughout the wheat’s growth cycle to optimize conditions, preemptively tackle potential problems and ultimately elevate wheat yield and quality.
In this study, we found that the effectiveness of an iteratively optimal estimation inversion strategy for accurately estimating wheat Cab and LAI. Initially, the simulation data from the coupled PROSAIL and UNL-VRTM models were closer to the observed data, with a correlation of 0.97, indicating that the coupled model considers more details in the atmospheric–vegetation canopy sensor radiative transfer process compared to the pure PROSAIL model. Moreover, a comparative analysis of statistical regression models derived from both models and various vegetation indices demonstrates the enhanced estimation capabilities of the coupled model. In addition, by comparing the optimal estimation method with LSSVM and RF models, we discovered that the iterative optimal estimation inversion strategy demonstrates superior performance. This paper focuses on the application of the optimal estimation framework to actual observational data, providing a solution for synchronously monitoring key growth stages of wheat Cab and LAI.
Atmospheric radiative transfer models consider the effects of atmospheric absorption and scattering on remote sensing data. They are commonly used for atmospheric corrections to obtain accurate surface reflectance data. Combining the apparent reflectance generated by the PROSAIL model with atmospheric radiative transfer models requires additional processing [31,48] in some studies. In this study, based on the surface reflectance model interface provided by the UNL-VRTM model, the PROSAIL model is embedded to realize the direct coupling of the two models. The results show that the correlation is significantly improved by coupling simulation data with UAV observation data. By using different statistical regression models to invert Cab and LAI, we find that NDVI is sensitive to atmospheric effects, which is consistent with the studies of Hadjimitsis et al. [49] and Mannschatz et al. [50]. However, due to the lower flight altitude of UAV remote sensing, the atmospheric impact is not significant. Future studies might consider investigating the effect of atmospheric correction from different altitudes. NDRE and BNDVI have higher prediction accuracies for Cab and LAI, respectively, which aligns with the findings of Su et al. [51] and Yang et al. [35]. In recent years, Zhu et al. [23] developed a dual-layer vegetation index matrix for joint estimation of Cab and LAI with test set R2 of 0.79 and 0.73, and RMSE of 11.7 and 0.91, respectively. Chen et al. [52] developed a model to improve the estimation of wheat leaf area index using leaf chlorophyll content information, where the LCC function equation (growth equation) had the highest estimation accuracy, with an RMSE of 0.736. Zhao et al. [53] developed a mixed method of the PROSAIL-D model and the XGBoost model for the mangrove leaf area index, achieving a maximum R2 of 0.86 and an RMSE of 0.31 in the test set. In these vegetation parameter estimation studies, the highest R2 was 0.86. In this study, the optimal estimation method and machine learning method, which share similar principles, achieved the highest accuracy of 0.892 in estimating LAI, indicating that the integration of radiative transfer models and machine learning models can become a trend for future vegetation parameter estimation.
However, the UNL-VRTM model is a generic atmospheric model that requires complex input parameters. Meteorological statistics have a large impact on the accuracy of the results, and we need to obtain more accurate meteorological data (such as AOD and aerosols) for the same time of the day at a later stage. In addition, the construction of the regression model relies entirely on simulated data. In order to improve the accuracy of the inversion, the input parameters need to be dynamically adjusted to approximate the real crop growth state in practical applications.
Compared to simulated statistical regression models, LSSVM and RF models, the optimal estimation inversion method has higher accuracy in estimating the results of Cab and LAI. This is mainly because the model introduces iterative optimization and reasonable a priori information, which can reduce the number of iterations to achieve fast and efficient estimation while searching for optimal values. When the parameter changes do not satisfy the convergence conditions or the number of iterations exceeds 20, we consider the inversion to have failed. However, after inverting the statistics for the 63 sets of validation data, we obtained that the average number of iterations of the dataset when searching for the optimal solution is 12, and the speed of iterative convergence still needs to be improved. Conversely, the a priori information comes from statistics contemporaneous data, and it is important to support the accuracy of the inversion results. Thus, we need to spend more time to specify reasonable a priori information as well as other physical parameters. In addition, the optimal estimation method is based on certain statistical models and assumptions, and the optimal estimation method has a small estimation bias when these models and assumptions are consistent with the real data distribution.

5. Conclusions

In this study, the Cab and LAI of winter wheat are obtained synchronously by the previously proposed inversion framework from the UAV multispectral measured data. The inversion results were further verified by ground verification points.
In addition, the proposed inversion method is compared with the statistical regression model, LSSVM and RF model estimation results.
The results show that:
(1)
The proposed model, coupled with PROSAIL and UNL-VRTM, is more suitable for UAV low-altitude remote sensing than the PROSAIL model. By comparing the simulated data with the real UAV data, the results show that the correlation of the coupled model is significantly improved compared to the PROSAIL, with an increase of R2 by 0.26. Furthermore, the retrieval of Cab and LAI are obtained by different statistical regression model, and the results show that the coupled models are also better than those from the pure PROSAIL model. Among these statistical regression models, estimated Cab and LAI based on the NDRE and BNDVI have the higher accuracy.
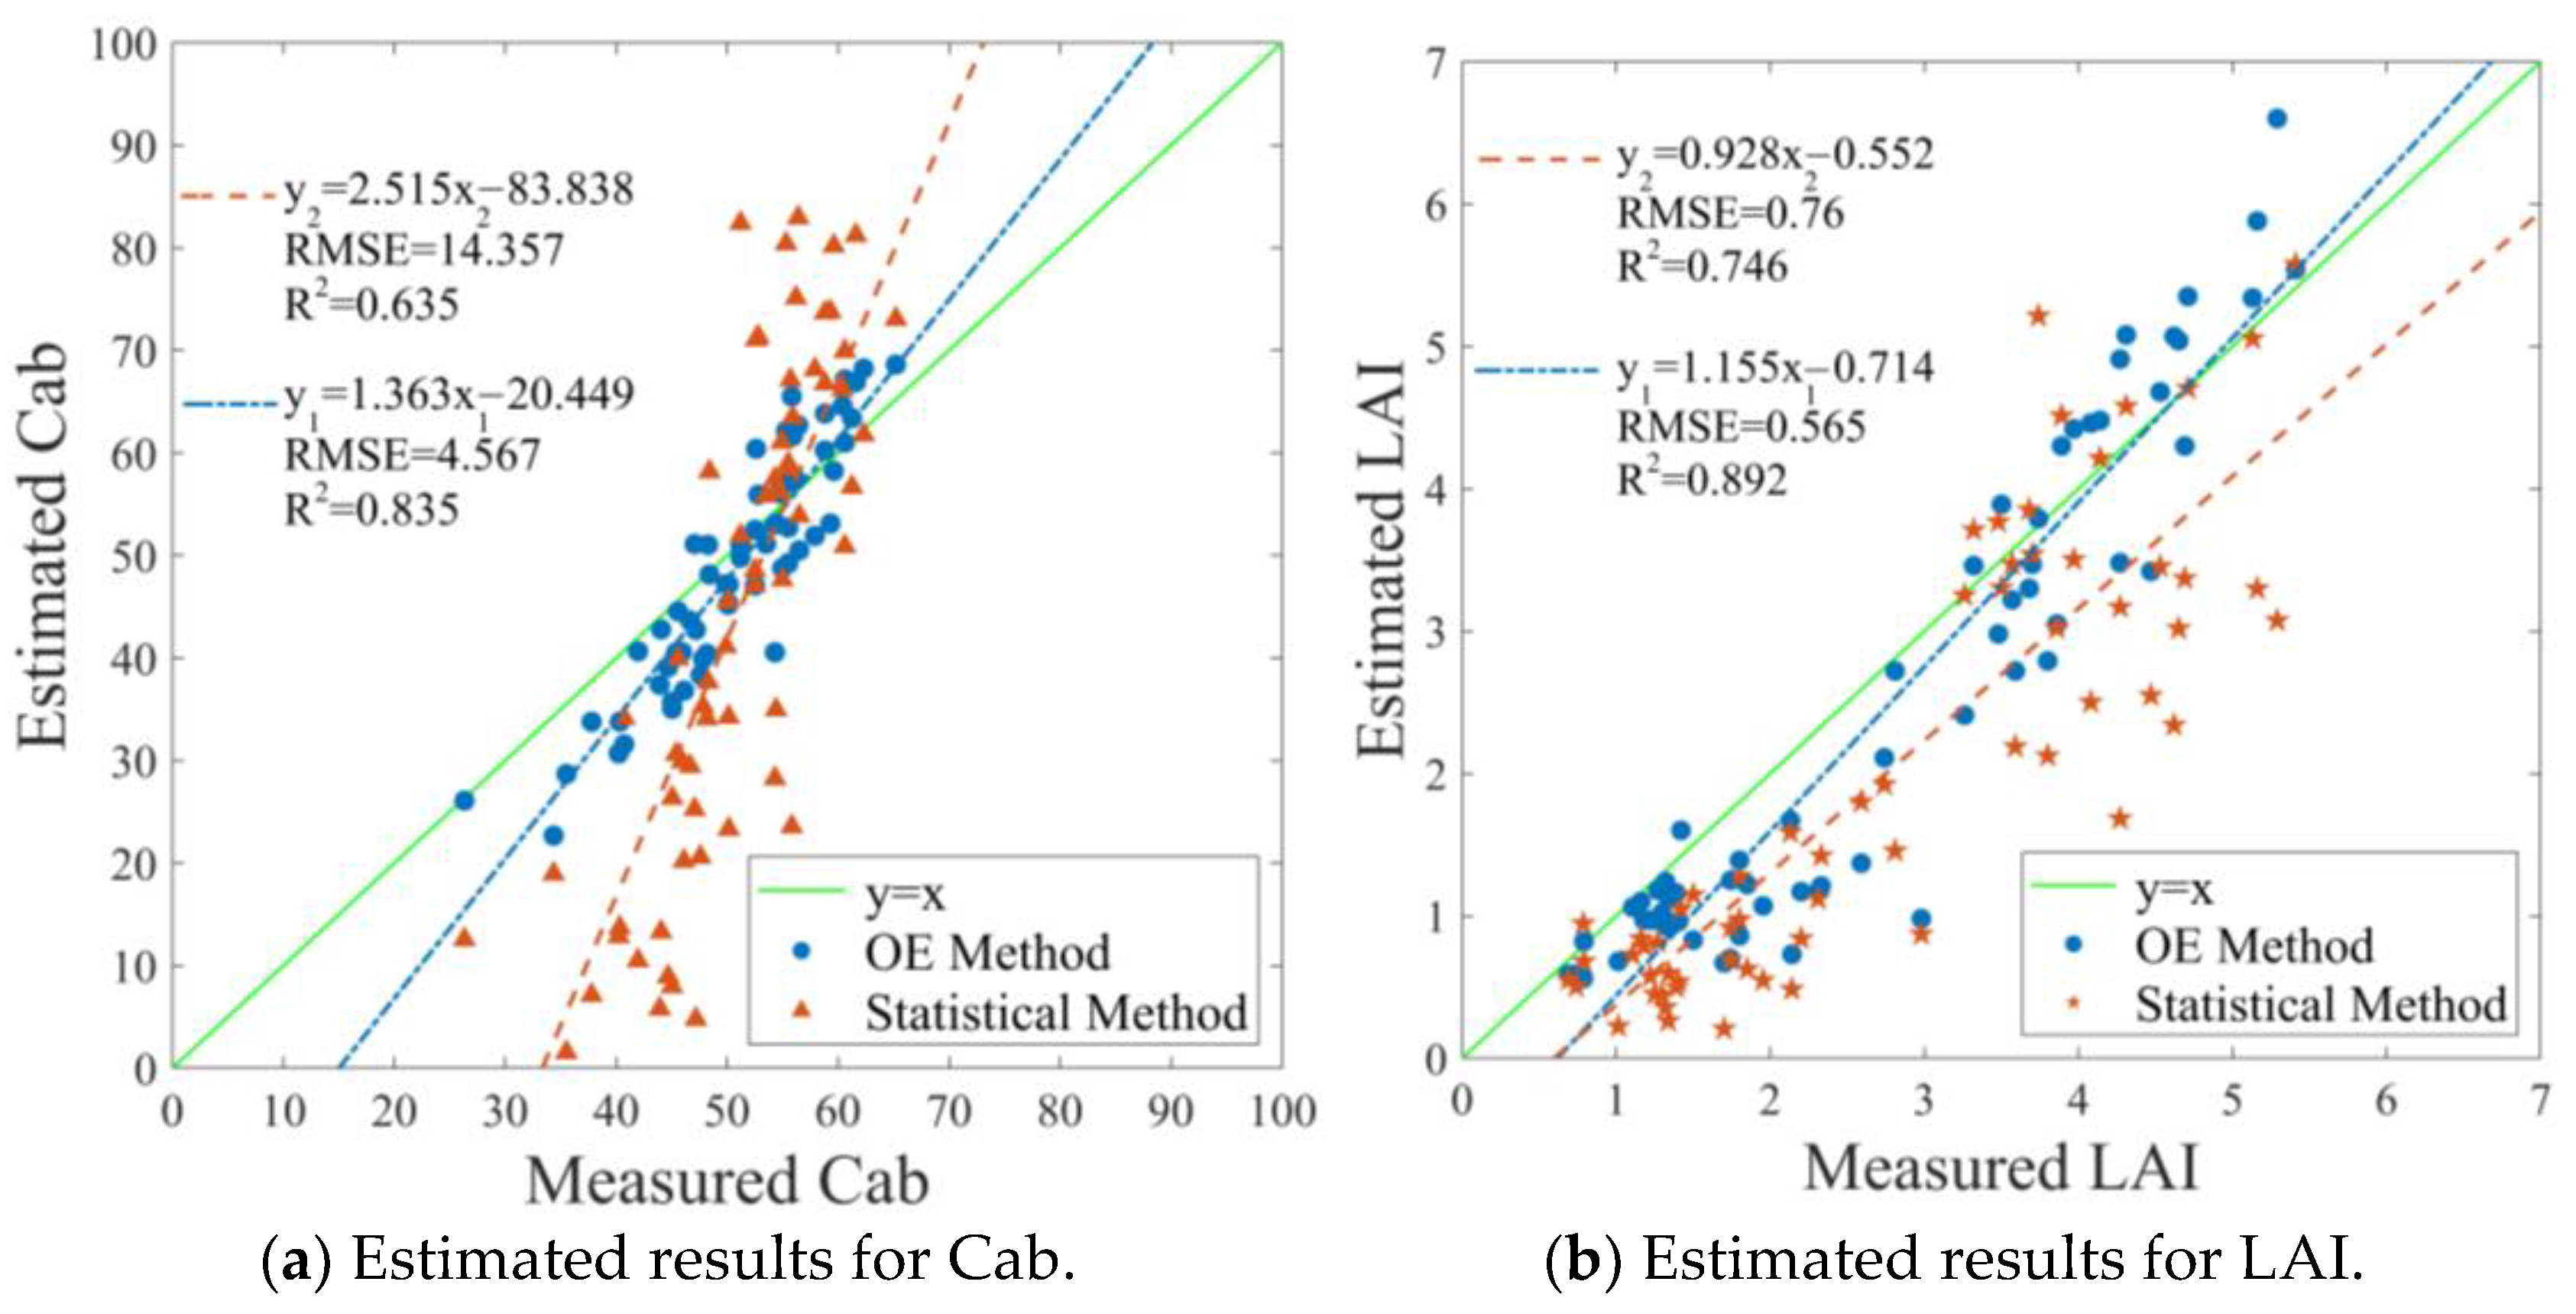
(2)
The OE inversion methods have better performance. By comparing simulated empirical statistical models, LSSVM and RF models, we conclude that the optimal estimation method has better estimation results. The R2 and RMSE were 0.835 and 4.567 for Cab and 0.892 and 0.564 for LAI. Where the simulated statistical regression model inversion of Cab is significantly lower than the measured value is effectively corrected in the optimal estimation model.
Due to the physical modeling, our proposed method does not require measurements and training in advance. The optimal estimation synchronous inversion method has better estimation potential for Cab and LAI remote sensing of wheat canopy, which can improve the application of purely physical models for the fine management of farmland.

Author Contributions

Conceptualization, J.J., F.Z. and H.M.; methodology, J.J., F.Z., H.M. and X.W.; software, F.Z., X.W. and H.M.; validation, J.J., F.Z. and X.W.; formal analysis, J.J., F.Z. and X.W.; investigation, F.Z. and X.W.; resources, J.J., F.Z., H.M. and S.Z.; data curation, J.J., F.Z. and X.W.; writing-original draft preparation, J.J., F.Z. and X.W.; writing-review and editing, J.J., X.W., Y.S. and H.C.; supervision, Y.S. and S.Z.; project administration, J.J., H.C. and Y.S.; funding acquisition, J.J., F.Z. and H.M. All authors have read and agreed to the published version of the manuscript.

Funding

The Key specialized research and development breakthrough in Henan province (No. 222102110105); Major Science and Technology Project of Henan Province (No. 221100110800), Longmen Laboratory Major Projects (No. 231100220200); National Key Research and Development Program projects (No. 2023YFD2001100); Postgraduate Education Reform Project of Henan Province (No. 2021SJGLX138Y). The present research was supported by the 2020 Training Plan for Young Backbone Teachers in Colleges and Universities of Henan Province (No. 2020GGJS075); Henan Provincial University Science and Technology Innovation Talent Support Program (No. 23HASTIT020); Henan Provincial Science and Technology Research Project (No. 222102110067).

Data Availability Statement

The data that support the findings of this study are available on request from the corresponding author.

Acknowledgments

We are very grateful to the high standard farmland in Qixian County, Henan Province for providing the experimental site.

Conflicts of Interest

Author Shaoshuai Zhao was employed by the company Henan Modern Agricultural Big Data Industry Technology Research Institute Co., Ltd. The remaining authors declare that the research was conducted in the absence of any commercial or financial relationships that could be construed as a potential conflict of interest.

References

  1. Ray, D.K.; Mueller, N.D.; West, P.C.; Foley, J.A. Yield trends are insufficient to double global crop production by 2050. PLoS ONE 2013, 8, e66428. [Google Scholar] [CrossRef] [PubMed]
  2. Xu, X.Q.; Lu, J.S.; Zhang, N.; Yang, T.C.; He, J.Y.; Yao, X.; Cheng, T.; Zhu, Y.; Cao, W.X.; Tian, Y.C. Inversion of rice canopy chlorophyll content and leaf area index based on coupling of radiative transfer and Bayesian network models. ISPRS J. Photogramm. Remote Sens. 2019, 150, 185–196. [Google Scholar] [CrossRef]
  3. Liang, L.; Geng, D.; Yan, J.; Qiu, S.Y.; Di, L.; Wang, S.G.; Xu, L.; Wang, L.J.; Kang, J.R.; Li, L. Estimation of crop LAI using hyperspectral vegetation indices and a hybrid inversion method. Remote Sens. Environ. 2015, 165, 123–134. [Google Scholar] [CrossRef]
  4. Han, S.Y.; Zhao, Y.; Cheng, J.P.; Zhao, F.; Yang, H.; Feng, H.K.; Li, Z.H.; Ma, X.M.; Zhao, C.J.; Yang, G.J. Monitoring key wheat growth variables by integrating phenology and UAV multispectral imagery data into random forest model. Remote Sens. 2022, 14, 3723. [Google Scholar] [CrossRef]
  5. Yue, J.B.; Yang, G.J.; Li, C.C.; Li, Z.H.; Wang, Y.J.; Feng, H.K.; Xu, B. Estimation of winter wheat above-ground biomass using unmanned aerial vehicle-based snapshot hyperspectral sensor and crop height improved models. Remote Sens. 2017, 9, 708. [Google Scholar] [CrossRef]
  6. Guo, X.W.; Wang, R.; Chen, J.M.; Cheng, Z.Q.; Zeng, H.D.; Miao, G.F.; Huang, Z.Q.; Guo, Z.X.; Cao, J.J.; Niu, J.H. Synergetic inversion of leaf area index and leaf chlorophyll content using multi-spectral remote sensing data. Geo-Spat. Inf. Sci. 2023, 1–14. [Google Scholar] [CrossRef]
  7. Viña, A.; Gitelson, A.A.; Nguy-Robertson, A.L.; Peng, Y. Comparison of different vegetation indices for the remote assessment of green leaf area index of crops. Remote Sens. Environ. 2011, 115, 3468–3478. [Google Scholar] [CrossRef]
  8. Nie, C.W.; Shi, L.; Li, Z.H.; Xu, X.B.; Yin, D.M.; Li, S.K.; Jin, X.L. A comparison of methods to estimate leaf area index using either crop-specific or generic proximal hyperspectral datasets. Eur. J. Agron. 2023, 142, 126664. [Google Scholar] [CrossRef]
  9. Liang, L.; Geng, D.; Yan, J.; Qiu, S.Y.; Di, L.P.; Wang, S.G.; Xu, L.; Wang, L.J.; Kang, J.R.; Li, L. Estimating crop LAI using spectral feature extraction and the hybrid inversion method. Remote Sens. 2020, 12, 3534. [Google Scholar] [CrossRef]
  10. Houborg, R.; Anderson, M.; Daughtry, C. Utility of an image-based canopy reflectance modeling tool for remote estimation of LAI and leaf chlorophyll content at the field scale. Remote Sens. Environ. 2009, 113, 259–274. [Google Scholar] [CrossRef]
  11. Laurent, V.C.; Schaepman, M.E.; Verhoef, W.; Weyermann, J.; Chávez, R.O. Bayesian object-based estimation of LAI and chlorophyll from a simulated Sentinel-2 top-of-atmosphere radiance image. Remote Sens. Environ. 2014, 140, 318–329. [Google Scholar] [CrossRef]
  12. Zarco-Tejada, P.J.; Hornero, A.; Beck, P.; Kattenborn, T.; Kempeneers, P.; Hernández-Clemente, R. Chlorophyll content estimation in an open-canopy conifer forest with Sentinel-2A and hyperspectral imagery in the context of forest decline. Remote Sens. Environ. 2019, 223, 320–335. [Google Scholar] [CrossRef] [PubMed]
  13. Zhu, X.H.; Li, C.R.; Tang, L.L. Look-up-table approach for leaf area index retrieval from remotely sensed data based on scale information. Opt. Eng. 2018, 57, 033104. [Google Scholar] [CrossRef]
  14. Sun, B.; Wang, C.F.; Yang, C.H.; Xu, B.D.; Zhou, G.S.; Li, X.Y.; Xie, J.; Xu, S.J.; Liu, B.; Xie, T.J. Retrieval of rapeseed leaf area index using the PROSAIL model with canopy coverage derived from UAV images as a correction parameter. Int. J. Appl. Earth Obs. Geoinf. 2021, 102, 102373. [Google Scholar] [CrossRef]
  15. Baret, F.; Buis, S. Estimating canopy characteristics from remote sensing observations: Review of methods and associated problems. In Advances in Land Remote Sensing: System, Modeling, Inversion and Application; Springer: Berlin/Heidelberg, Germany, 2008; pp. 173–201. [Google Scholar]
  16. Sinha, S.K.; Padalia, H.; Dasgupta, A.; Verrelst, J.; Rivera, J.P. Estimation of leaf area index using PROSAIL based LUT inversion, MLRA-GPR and empirical models: Case study of tropical deciduous forest plantation, North India. Int. J. Appl. Earth Obs. Geoinf. 2020, 86, 102027. [Google Scholar] [CrossRef] [PubMed]
  17. Yan, G.J.; Mu, X.H.; Ma, Y.C.; Li, Z.L. A strategy to integrate a priori knowledge for an improved inversion of the LAI from BRDF modelling. Int. J. Remote Sens. 2008, 29, 4927–4941. [Google Scholar] [CrossRef]
  18. Zhu, X.H.; Li, C.R.; Zhang, Z.W.; Zhou, Y.S. Multi-scale, multi-stage inversion method for retrieval of LAI. In Proceedings of the 2015 IEEE International Geoscience and Remote Sensing Symposium (IGARSS), Milan, Italy, 26–31 July 2015; pp. 3393–3396. [Google Scholar]
  19. Gao, L.; Darvishzadeh, R.; Somers, B.; Johnson, B.A.; Wang, Y.; Verrelst, J.; Wang, X.F.; Atzberger, C. Hyperspectral response of agronomic variables to background optical variability: Results of a numerical experiment. Agric. For. Meteorol. 2022, 326, 109178. [Google Scholar] [CrossRef] [PubMed]
  20. Li, S.Y.; Yuan, F.; Ata-UI-Karim, S.T.; Zheng, H.B.; Cheng, T.; Liu, X.J.; Tian, Y.C.; Zhu, Y.; Cao, W.X.; Cao, Q. Combining color indices and textures of UAV-based digital imagery for rice LAI estimation. Remote Sens. 2019, 11, 1763. [Google Scholar] [CrossRef]
  21. Duan, B.; Liu, Y.T.; Gong, Y.; Peng, Y.; Wu, X.T.; Zhu, R.S.; Fang, S.H. Remote estimation of rice LAI based on Fourier spectrum texture from UAV image. Plant Method 2019, 15, 1–12. [Google Scholar] [CrossRef]
  22. Su, W.; Zhan, J.G.; Zhang, M.Z.; Wu, D.Y.; Zhang, R. Estimation method of crop leaf area index based on airborne LiDAR data. Trans. Chin. Soc. Agric. Mach. 2016, 47, 272–277. [Google Scholar]
  23. Zhu, X.H.; Yang, Q.; Chen, X.Y.; Ding, Z.X. An Approach for Joint Estimation of Grassland Leaf Area Index and Leaf Chlorophyll Content from UAV Hyperspectral Data. Remote Sens. 2023, 15, 2525. [Google Scholar] [CrossRef]
  24. Zheng, F.X.; Wang, X.F.; Ji, J.T.; Ma, H.; Cui, H.W.; Shi, Y.; Zhao, S.S. Synchronous Retrieval of LAI and Cab from UAV Remote Sensing: Development of Optimal Estimation Inversion Framework. Agronomy 2023, 13, 1119. [Google Scholar] [CrossRef]
  25. Rodgers, C.D. Inverse Methods for Atmospheric Sounding: Theory and Practice; World Scientific: Singapore, 2000. [Google Scholar]
  26. Baret, F.; Jacquemoud, S.; Guyot, G.; Leprieur, C. Modeled analysis of the biophysical nature of spectral shifts and comparison with information content of broad bands. Remote Sens. Environ. 1992, 41, 133–142. [Google Scholar] [CrossRef]
  27. Féret, J.B.; Gitelson, A.A.; Noble, S.D.; Jacquemoud, S. PROSPECT-D: Towards modeling leaf optical properties through a complete lifecycle. Remote Sens. Environ. 2017, 193, 204–215. [Google Scholar] [CrossRef]
  28. Jacquemoud, S.; Verhoef, W.; Baret, F.; Bacour, C.; Zarco-Tejada, P.J.; Asner, G.P.; François, C.; Ustin, S.L. PROSPECT+ SAIL models: A review of use for vegetation characterization. Remote Sens. Environ. 2009, 113, S56–S66. [Google Scholar] [CrossRef]
  29. Feret, J.B.; François, C.; Asner, G.P.; Gitelson, A.A.; Martin, R.E.; Bidel, L.P.; Ustin, S.L.; Maire, C.I.; Jacquemoud, S. PROSPECT-4 and 5: Advances in the leaf optical properties model separating photosynthetic pigments. Remote Sens. Environ. 2008, 112, 3030–3043. [Google Scholar] [CrossRef]
  30. Sismanidis, P.; Karathanassi, V. Evaluation of atmospheric correction to airborne hyperspectral data relying on radiative transfer concepts. Int. J. Remote Sens. 2013, 34, 8566–8587. [Google Scholar] [CrossRef]
  31. Wang, Z.; Xia, J.S.; Wang, L.H.; Mao, Z.H.; Zeng, Q.; Tian, L.Q.; Shi, L.L. Atmospheric correction methods for GF-1 WFV1 data in hazy weather. J. Indian Soc. Remote Sens. 2018, 46, 355–366. [Google Scholar] [CrossRef]
  32. Adler-Golden, S.M.; Matthew, M.W.; Bernstein, L.S.; Levine, R.Y.; Berk, A.; Richtsmeier, S.C.; Acharya, P.K.; Anderson, G.P.; Felde, J.W.; Gardner, J. Atmospheric correction for shortwave spectral imagery based on MODTRAN4[C]//Imaging Spectrometry V. SPIE 1999, 3753, 61–69. [Google Scholar]
  33. Zoran, M.; Stefan, S. Atmospheric and spectral corrections for estimating surface albedo from satellite data. J. Optoelectron. Adv. Mater. 2006, 8, 247. [Google Scholar]
  34. Hou, W.Z.; Wang, J.; Xu, X.G.; Reid, J.S.; Han, D. An algorithm for hyperspectral remote sensing of aerosols: 1. Development of theoretical framework. J. Quant. Spectrosc. Radiat. Transf. 2016, 178, 400–415. [Google Scholar] [CrossRef]
  35. Yang, X.; Lu, X.H.; Shi, J.M.; Li, J.; Ju, W.M. Inversion of Rice Leaf Chlorophyll Content Based on Sentinel-2 Satellite Data. Spectrosc. Spectr. Anal. 2022, 42, 866–872. [Google Scholar]
  36. Xue, J.; Su, B. Significant remote sensing vegetation indices: A review of developments and applications. J. Sens. 2017. [Google Scholar] [CrossRef]
  37. Rouse, J.W.; Haas, R.H.; Schell, J.A.; Deering, D.W. Monitoring vegetation systems in the Great Plains with ERTS. NASA Spec. Publ. 1974, 351, 309. [Google Scholar]
  38. Louhaichi, M.; Borman, M.M.; Johnson, D.E. Spatially located platform and aerial photography for documentation of grazing impacts on wheat. Geocarto Int. 2001, 16, 65–70. [Google Scholar] [CrossRef]
  39. Pearson, R.L.; Miller, L.D. Remote mapping of standing crop biomass for estimation of the productivity of the shortgrass prairie. Remote Sens. Environ. VIII 1972, 1355. [Google Scholar]
  40. Gitelson, A.A.; Keydan, G.P.; Merzlyak, M.N. Three-band model for noninvasive estimation of chlorophyll, carotenoids, and anthocyanin contents in higher plant leaves. Geophys. Res. Lett. 2006, 33, 11. [Google Scholar] [CrossRef]
  41. Dash, J.; Curran, P.J. The MERIS terrestrial chlorophyll index. Int. J. Remote Sens. 2004, 25, 23. [Google Scholar] [CrossRef]
  42. Fitzgerald, G.J.; Rodriguez, D.; Christensen, L.K.; Belford, R.; Sadras, V.O.; Clarke, T.R. Spectral and thermal sensing for nitrogen and water status in rainfed and irrigated wheat environments. Precis. Agric. 2006, 7, 233–248. [Google Scholar] [CrossRef]
  43. Peng, Y.; Gitelson, A.A. Application of chlorophyll-related vegetation indices for remote estimation of maize productivity. Agric. For. Meteorol. 2011, 151, 1267–1276. [Google Scholar] [CrossRef]
  44. Houlès, V.; Mary, B.; Machet, J.M. Do crop characteristics available from remote sensing allow to determine crop nitrogen status. In 3. ECPA; ENSAM: Paris, France, 2001. [Google Scholar]
  45. Chen, J.M.; Black, T.A. Defining leaf area index for non-flat leaves. Plant Cell Environ. 1992, 15, 421–429. [Google Scholar] [CrossRef]
  46. Houles, V.; Guerif, M.; Mary, B. Elaboration of a nitrogen nutrition indicator for winter wheat based on leaf area index and chlorophyll content for making nitrogen recommendations. Eur. J. Agron. 2007, 27, 1–11. [Google Scholar] [CrossRef]
  47. Wen, W.; Timmermans, J.; Chen, Q.; van Bodegom, P.M. Evaluating crop-specific responses to salinity and drought stress from remote sensing. Int. J. Appl. Earth Obs. Geoinf. 2023, 122, 103438. [Google Scholar] [CrossRef]
  48. Wang, R.; Gamon, J.A.; Moore, R.; Zygielbaum, A.I.; Arkebauer, T.J.; Perk, R.; Leavitt, B.; Cogliati, S.; Wardlow, B.; Qi, Y. Errors associated with atmospheric correction methods for airborne imaging spectroscopy: Implications for vegetation indices and plant traits. Remote Sens. Environ. 2021, 265, 112663. [Google Scholar] [CrossRef]
  49. Hadjimitsis, D.G.; Papadavid, G.; Agapiou, A.; Themistocleous, K.; Hadjimitsis, M.; Retalis, A.; Michaelides, S.; Chrysoulakis, N.; Toulios, L.; Clayton, C. Atmospheric correction for satellite remotely sensed data intended for agricultural applications: Impact on vegetation indices. Nat. Hazards Earth Syst. Sci. 2010, 10, 89–95. [Google Scholar] [CrossRef]
  50. Mannschatz, T.; Pflug, B.; Borg, E.; Feger, K.H.; Dietrich, P. Uncertainties of LAI estimation from satellite imaging due to atmospheric correction. Remote Sens. Environ. 2014, 153, 24–39. [Google Scholar] [CrossRef]
  51. Su, W.; Wang, W.; Liu, Z.; Zhang, M.Z.; Bian, D.H.; Cui, Y.H.; Huang, J.X. Determining the retrieving parameters of corn canopy LAI and chlorophyll content computed using UAV image. Trans. Chin. Soc. Agric. Eng. 2020, 36, 58–65. [Google Scholar]
  52. Chen, Z.L.; Jia, K.; Wei, X.Q.; Liu, Y.; Zhan, Y.L.; Xia, M.; Yao, Y.J.; Zhang, X.T. Improving leaf area index estimation accuracy of wheat by involving leaf chlorophyll content information. Comput. Electron. Agric. 2022, 196, 106902. [Google Scholar] [CrossRef]
  53. Zhao, D.M.; Zhen, J.N.; Zhang, Y.H.; Miao, J.; Shen, Z.; Jiang, X.P.; Wang, J.J.; Jiang, J.C.; Tang, Y.Z.; Wu, G.F. Mapping mangrove leaf area index (LAI) by combining remote sensing images with PROSAIL-D and XGBoost methods. Remote Sens. Ecol. Conserv. 2023, 9, 370–389. [Google Scholar] [CrossRef]
Figure 1. The study area (red points in the right diagram are the ground data validation collection points).
Agronomy 14 00359 g001
Figure 2. Distribution of Cab and LAI measure data in different periods.
Agronomy 14 00359 g002
Figure 3. Comparison of simulation data with UAV observation data. (a) The comparison of a set of simulated data with the UAV observations; (b) The comparison of a total of 63 sets of simulated data with the UAV observations.
Agronomy 14 00359 g003
Figure 4. Results of Cab estimation based on four regression models: CIgreen (a), CIre (b), MTCI (c) and NDRE (d).
Agronomy 14 00359 g004
Figure 5. Results of LAI estimation based on four regression models: NDVI (a), GNDVI (b), BNDVI (c) and RVI (d).
Agronomy 14 00359 g005
Figure 6. Results of Cab and LAI estimation based on the optimal estimation method and the simulated statistical regression method.
Agronomy 14 00359 g006
Table 1. Multispectral vegetation indices and their calculation formulas.
Vegetation IndexFormulaReferences
NDVI (Normalized Difference Vegetation Index)(R840 − R650)/(R840 + R650)[36]
GNDVI (Green Normalized Difference Vegetation Index)(R840 − R560)/(R840 + R560)[37]
BNDVI (Blue Normalized Difference Vegetation Index)(R840 − R450)/(R840 + R450)[38]
RVI (Ratio vegetation index)R840/R650[39]
CIgreen (Green Chlorophyll index)R840/R560 − 1[40]
CIre (Rededge Chlorophyll Index)R840/R730 − 1[40]
MTCI (MERIS Terrestrial Chlorophyll Index)(R840 − R730)/(R730 − R650)[41]
NDRE (Normalized Difference Red Edge Vegetation Index)(R840 − R730)/(R840 + R730)[42]
Note: R450, R560, R650, R730 and R840 are blue band, green band, red band, red edge band and near infrared (NIR) band, respectively.
Table 2. Regression analysis of vegetation index with Cab and LAI.
Parameter VariableVegetation IndexModelR2
CabCIgreeny = 39.199 × ln(x) − 16.3350.9716
CIrey = 65.285 × ln(x) + 59.7770.9846
MTCIy = 70.307 × ln(x) + 51.6290.9942
NDREy = 90.016 × ln(x) + 158.270.9761
LAINDVIy = 0.0021 × e(8.2122x)0.7082
GNDVIy = 15.97 × x6.86690.8405
BNDVIy = 0.00008 × e(11.684x)0.7331
RVIy = 0.6038 × e(0.0589x)0.9656
Note: x denotes the vegetation index constructed from the simulated data and y is the corresponding parameter variable (Cab, LAI).
Table 3. Inversion of Cab and LAI from UAV multispectral data using different methods.
Retrieval MethodsRetrieval Accuracy
R2RMSE
statistical regressionCab: 0.635Cab: 14.357
LAI: 0.746LAI: 0.76
LSSVMCab: 0.689Cab: 4.513
LAI: 0.783LAI: 0.614
RFCab: 0.766Cab: 0.62
LAI: 0.827LAI: 0.565
optimal estimationCab: 0.835Cab: 4.567
LAI: 0.892LAI: 0.564
Disclaimer/Publisher’s Note: The statements, opinions and data contained in all publications are solely those of the individual author(s) and contributor(s) and not of MDPI and/or the editor(s). MDPI and/or the editor(s) disclaim responsibility for any injury to people or property resulting from any ideas, methods, instructions or products referred to in the content.

