Abstract
Crown diameter is one of the crucial indicators for evaluating the adaptability, growth quality, and ornamental value of garden chrysanthemums. To accurately obtain crown diameter, this study employed an unmanned aerial vehicle (UAV) equipped with a RGB camera to capture orthorectified canopy images of 64 varieties of garden chrysanthemums at different growth stages. Three methods, namely RGB color space, hue-saturation-value (HSV) color space, and the mask region-based convolutional neural network (Mask R-CNN), were employed to estimate the crown diameter of garden chrysanthemums. The results revealed that the Mask R-CNN exhibited the best performance in crown diameter estimation (sample number = 2409, R2 = 0.9629, RMSE = 2.2949 cm). Following closely, the HSV color space-based model exhibited strong performance (sample number = 2409, R2 = 0.9465, RMSE = 3.4073 cm). Both of the first two methods were efficient in estimating crown diameter throughout the entire growth stage. In contrast, the RGB color space-based model exhibited slightly lower performance (sample number = 1065, R2 = 0.9011, RMSE = 3.3418 cm) and was only applicable during periods when the entire plant was predominantly green. These findings provide theoretical and technical support for utilizing UAV-based imagery to estimate the crown diameter of garden chrysanthemums.
1. Introduction
The chrysanthemum (Chrysanthemum morifolium Ramat.), belonging to the Asteraceae family, is a perennial flower that can be cultivated both in pots and in open gardens. It plays a significant role in environmental beautification. Within the chrysanthemum species, garden chrysanthemums stand out as having well-organized plant clusters, dense inflorescence, diverse and vibrant colors, and orderly blooming. These characteristics make them a popular choice for urban flower terraces, ground covers, flower fields, and various landscape designs, contributing significantly to garden greening and landscape creation [1]. Crown diameter serves as a crucial indicator for evaluating the adaptability, stress resistance, and ornamental quality of garden chrysanthemums [2]. It stands as a primary parameter of interest for breeders and an essential criterion for producers to assess the effectiveness of cultivation and management practices. Therefore, the efficient and accurate measurement of crown diameter holds paramount importance in the breeding and cultivation of garden chrysanthemums.
The traditional method for determining the crown diameter of garden chrysanthemums is through manual field measurements, which are time-consuming, labor-intensive, and impractical for assessing a large population within a short timeframe. Moreover, this method fails to meet the frequent measurement requirements necessary for monitoring the growth of dynamics, and its accuracy is difficult to control due to subjective interference from the measurer. Innovative phenotypic data acquisition platforms such as ground imaging platforms, unmanned aerial vehicles (UAVs), and the combination of multiple sensors (visible light, multispectral, hyperspectral, and LiDAR) [3,4] have opened avenues for rapid, efficient, accurate, and convenient acquisition of vegetation canopy information [5]. Previous studies have successfully used tractor-towed ground imaging platforms with visible light and near-infrared sensors to depict the canopy of strawberries [6]. UAVs equipped with visible light sensors can automatically detect and segment tree canopies, extracting information such as tree crown diameter, perimeter, and canopy projection area [7,8]. Additionally, the fusion of UAV-based multispectral imagery and LiDAR data, in conjunction with Mask R-CNN and detection transformer (DETR), has proven effective in depicting tree canopies [9]. The satellite remote sensing platform possesses the advantage of acquiring plant phenotypic information on a large scale with high temporal and spatial resolution [10,11]. Currently, scholars have employed this platform to extract information related to tree crown layers [12]. Lassalle et al. demonstrated the use of satellite images combined with the multi-task encoder-decoder (MT-EDv3) neural network to delineate individual tree crowns in mangroves at four global sites, achieving an overall accuracy exceeding 0.93 [13]. In contrast, UAV platforms provide immediacy and flexibility, with UAV-based visible light sensors offering the dual advantages of high resolution and cost-effectiveness compared to multispectral, hyperspectral, and LiDAR sensors [14]. The use of UAV-mounted visible light sensors for phenotypic information collection has become a research hotspot in recent years [14,15].
The identification and segmentation of entire plants and their organs from RGB images captured by visible light sensors are key steps in extracting plant phenotype information. This information includes monitoring leaf senescence [16], estimating the number of harvested organs [17], and evaluating quality [18,19]. Some image segmentation methods rely on differences in grayscale value or color index values to extract target regions, achieving relatively optimal segmentation results in field environments through manual parameter adjustments [20,21]. In recent years, the development of deep learning algorithms, particularly convolutional neural networks (CNNs), has provided a powerful tool for detecting and extracting plant features from images [22]. CNNs can automatically learn and adapt to different scenes, demonstrating robustness and accuracy in complex environments [23]. They can perform various tasks, including object detection [24], classification [25], localization [26,27], counting [28,29], and instance segmentation [6], and have been widely applied in extracting and analyzing plant phenotype information. In a recent study, Ghosal et al. [28] proposed a RetinaNet-based weakly supervised deep learning framework using active learning to detect and count sorghum heads in UAV-based RGB images. Cong et al. [30] introduced an improved Mask R-CNN algorithm that effectively segments different-colored bell peppers in RGB images captured in the field, accommodating overlapping peppers and those with leaf occlusions. This addresses the dynamic monitoring requirements of bell pepper growth.
However, there is currently no literature addressing the effective and precise acquisition of crown diameter in the context of garden chrysanthemum variety selection and production cultivation, using a combination of UAV high-throughput phenotyping platforms and image processing techniques. This study seeks to fill this gap by capturing population images of 64 garden chrysanthemum varieties using a UAV equipped with a visible light camera. Our specific objectives were (1) to compare the performance of three methods based on the RGB color space, HSV color space, and Mask R-CNN model in estimating garden chrysanthemum crown diameter; and (2) to explore a crown diameter estimation method based on UAV images of garden chrysanthemums. Ultimately, our goal is to establish a rapid, efficient, and accurate method for estimating garden chrysanthemum crown diameter. This approach aims to assist breeders and growers in achieving precise and high-throughput acquisition of crown diameter metrics, thereby improving the efficiency of variety creation and cultivation management.
2. Materials and Methods
2.1. Experimental Overview
The experiment was conducted from May to November 2022 at the Bai Ma Research Base of Nanjing Agricultural University in Lishui District, Nanjing City, Jiangsu Province, China (119°10′ N, 31°37′ E) (Figure 1). The region experiences a subtropical monsoon climate, characterized by an average annual temperature ranging from 13 °C to 22 °C. A total of 64 garden chrysanthemum varieties, provided by the Chrysanthemum Germplasm Resources Preservation Center of Nanjing Agricultural University, were selected as experimental materials (Table S1 and Figure S1). All varieties were bred by the Chrysanthemum Genetic Breeding Team of Nanjing Agricultural University, covering various flower colors, such as white, yellow, orange, red, purple, and pink. The planting quantity for each variety ranged from 10 to 70 plants, as detailed in Table S1. Prior to the experiment, the land was meticulously prepared with thorough leveling and bed construction to ensure a flat terrain. Garden chrysanthemum was planted using the bedding cultivation method. In the experimental area, the bed width was 120 cm, with two rows planted per bed. The row spacing was 60 cm, and the spacing between plants within a row was 60 cm. Black polypropylene anti-grass cloth was laid on the bed surface, covering a total cultivation area of 15 m × 45 m for the garden chrysanthemums. Throughout the experiment, fertilization, irrigation, and plant shape management adhered to the guidelines outlined in the “DB11/T 898-2020 Technical Specifications for Pot Chrysanthemum Cultivation” [31].
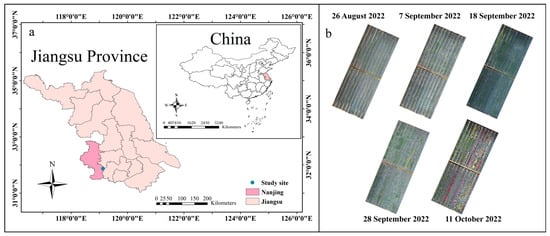
Figure 1.
Location of the experimental site. (a) Location of Nanjing City, Jiangsu Province, China; (b) UAV images from the experimental field at different growth stages in 2022.
2.2. Manual Measurement of Garden Chrysanthemum Crown Diameter
The maximum distance of the plant canopy in two perpendicular directions (parallel and perpendicular to the bed direction) was measured using a measuring tape. These two lengths were used to represent the crown diameter of garden chrysanthemums. The crown diameter measurements of garden chrysanthemums were conducted on the 72nd, 84th, 95th, 105th, and 118th days after planting, with a total of 5 measurements. As the crown of garden chrysanthemums gradually expanded, some varieties had overlapping canopies, resulting in a decrease in the availability of valid crown diameter data in the later stages. A total of 2409 valid crown diameter data were obtained, with 535, 530, 523, 446, and 375 valid data for each measurement, respectively.
2.3. UAV Image Acquisition
UAV images were captured on clear and windless days, synchronized with the manual crown diameter measurements, typically conducted between 10 am and 2 pm. A DJI Phantom 4 Pro quadcopter (SZ DJI Technology Co., Shenzhen, China) equipped with a small visible light camera was employed for image acquisition. The visible light camera featured a 1-inch CMOS sensor with an effective pixel count of 20 million, ensuring high resolution.
The UAV operated at a height of 13 m, with a flight speed of 1 m·s−1. The flight path had an 80% overlap in the flight direction and a 70% overlap in the lateral direction. During the flight, the gimbal was oriented vertically downward, and photos were taken at regular intervals. Camera parameters, including ISO sensitivity, were adjusted based on weather conditions, generally ranging from 200 to 400. All photos were saved in JPEG format. Each flight yielded approximately 96 images, with a spatial resolution of 0.36 cm. The width of a single image covered an area of 25.35 m.
2.4. UAV Image Preprocessing
To eliminate image distortion and tilt, the RGB images captured by the UAV were seamlessly stitched together using Pix4Dmapper 4.5.6 software (Pix4D SA, Lausanne, Switzerland) to generate a digital orthophoto map (DOM). The specific operational steps involved importing the RGB images into Pix4Dmapper and configuring the appropriate geodetic coordinates. Subsequently, Pix4Dmapper aligned the images, created a mesh, optimized the cameras, generated a dense point cloud, and then generated a digital surface model (DSM). Upon completion of these processing steps, DOM could be generated. The DOM was saved in TIFF format. Subsequently, the DOM generated by Pix4Dmapper was rotated to align the beds horizontally in the image. The rotated image was then clipped into 20 images according to the beds and saved in JPG format (Figure 2).
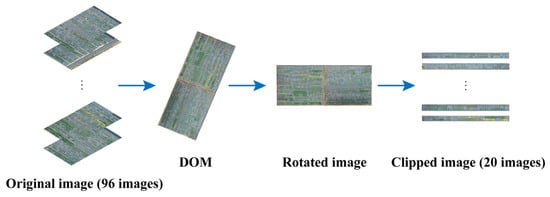
Figure 2.
Flowchart of image preprocessing.
2.5. Crown Diameter Estimation
This study attempted to follow three methods to extract garden chrysanthemum plants from the field background and estimate their crown diameters.
2.5.1. RGB Color Space Method
In RGB images, there exists a significant difference in the chromatic coordinates of plant pixels (red, green, blue) compared to those of the non-vegetative background in the field [32]. The RGB color space method described in this paper is primarily implemented by calculating the excess green index (ExG) based on the digital number (DN) values of the R, G, and B channels. Grayscale images were generated using the ExG to enhance the contrast between the plant material and the background [33]. The grayscale value for each pixel was calculated according to Formulas (1) and (2). Based on the grayscale histogram of each image, an appropriate threshold was selected. The grayscale histogram approximates a unimodal distribution, and the threshold was determined by identifying the grayscale value corresponding to the end of the peak (usually between 100 and 130). The threshold segmentation method was then applied to convert the grayscale image into a binary image. Subsequently, the contour finding function was employed to identify the plant contours in the binary image. The bounding rectangle for each plant was automatically drawn based on the plant contours using the cv2.boundingRect() function in the OpenCV (without considering the orientation angle). The actual width and height of the bounding rectangle were calculated based on the ground sample distance (GSD) and the number of pixels corresponding to the width and height of the bounding rectangle. The crown diameter of the plant was estimated based on the actual width and height of the bounding rectangle (Figure 3).
In Formula (1) [34], R, G, and B represent the DN values of the red, green, and blue channels of each pixel in the image. In Formula (2), gray represents the grayscale value of each pixel, ExGmin represents the minimum value of ExG, and ExGmax represents the maximum value of ExG. In Formula (3), W represents the actual width of the rectangle, w represents the number of pixels corresponding to the width of the rectangle in the image, and GSD represents the ground sample distance of the image in cm·pixel−1. In Formula (4), H represents the actual height of the rectangle, and h represents the number of pixels corresponding to the height of the rectangle in the image.
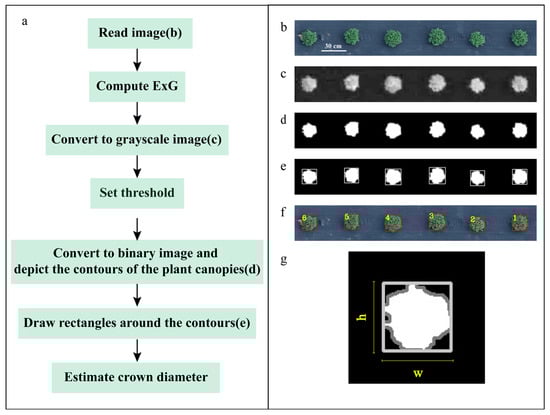
Figure 3.
Flowchart of the method based on the RGB color space. (a) Abstract flowchart; (b) original image; (c) grayscale image; (d) binary image; (e) drawing of bounding rectangles of the plant canopy contours in a binary image; (f) projection of bounding rectangles onto the original image; (g) the directions of w and h. (Note: The numbers in subfigure (f) represent the serial numbers of the bounding rectangles).
2.5.2. HSV Color Space Method
The hue-saturation-value (HSV) color space [35] is a uniform color space that reflects the human perception of color. Its components, hue (H) and saturation (S), are closely related to the way humans perceive color, while the value (V) component is independent of the color information in the image [36,37].
Before the flower buds of garden chrysanthemum show color, the plants appear green, and during the flowering period, different varieties exhibit various colors, such as white, yellow, orange, red, purple, and pink. In this study, a method based on the HSV color space was used to accurately separate the plants from the background using a color segmentation mask. Initially, the image was converted from the RGB color space to the HSV color space. Subsequently, masks were extracted based on five hue intervals corresponding to the red, yellow, cyan-green, pink purple, and white regions in the image. Specific parameters were set based on the chromatic coordinates (within the HSV color space) of different varieties of garden chrysanthemums in images collected at different times, as detailed in Table 1. During the juvenile stage, when the plants exhibit green color, only the cyan-green color region parameters were used to create the mask. After the buds were colored, masks were extracted using the parameters for all five color regions, and the masks were combined. After summing up the five masks, there might be gaps between masks of the same plant. To address this, a dilation operation with a 3 × 3 convolutional kernel was applied to merge adjacent masks of the same plant, forming a connected domain. Subsequently, small connected areas in the mask were filtered out, and the contours were filled. Finally, the bounding rectangle of the plant was drawn based on the contours of the mask (without considering the orientation angle), and the crown diameter of the plant was estimated based on the length and width of the bounding rectangle (Figure 4).

Table 1.
Detailed parameters for plant extraction in HSV color space.
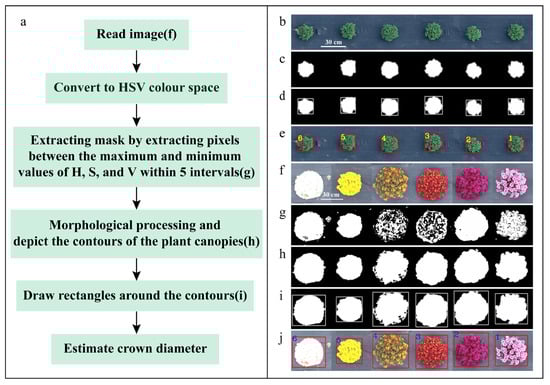
Figure 4.
Flowchart of the method based on HSV color space. (a) Abstract flowchart for estimating crown diameter during flowering period; (b) original image of garden chrysanthemums during the green stage; (c) mask extracted using cyan-green color interval; (d) drawing of bounding rectangles of the plant canopy contours in a binary image; (e) Projection of bounding rectangles onto the original image; (f) original image of garden chrysanthemums with different colors; (g) mask extracted using five intervals; (h) morphological processing; (i) drawing of bounding rectangles of the plant canopy contours in a binary image; (j) projection of the bounding rectangles onto the original image. (Note: The numbers in subfigure (e) and (j) represent the serial numbers of the bounding rectangles).
2.5.3. Mask R-CNN Method
Mask R-CNN is a deep learning-based object detection and instance segmentation algorithm that extends Faster R-CNN. It can simultaneously detect the position of the target and generate accurate pixel-level masks [38]. It consists of a region proposal network (RPN) and a semantic segmentation branch. The RPN extracts features and estimates object probabilities using sliding windows, generating candidate object boxes. The semantic segmentation branch, based on the feature maps of the candidate boxes, uses a convolutional neural network to generate binary masks for the objects [38]. Using Mask R-CNN allows for the simultaneous detection and segmentation of multiple garden chrysanthemums in an image.
The data were annotated using Labelme 3.16.7, with a total of 3014 annotated images containing 3262 instances. These images cover different growth stages of the garden chrysanthemum, including the juvenile stage, bud stage, flowering stage, and post-flowering stage. ResNet-101 was chosen as the model architecture, and a series of hyperparameters were set. The Adam optimizer was chosen for training, with an initial learning rate of 0.0001 according to a previous study [6]. The image input size was set to 256 × 256 × 3, and the batch size was set to 4 according to the GPU performance of the workstation used in this study. After approximately 150 epochs of training, the model achieved the desired level of accuracy, enabling the differentiation between plant canopies and the field environment. Finally, the image of the garden chrysanthemum to be estimated is input into the Mask R-CNN, which outputs accurate object masks. The crown diameter of the garden chrysanthemum was then estimated based on the bounding rectangle of the mask (Figure 5).
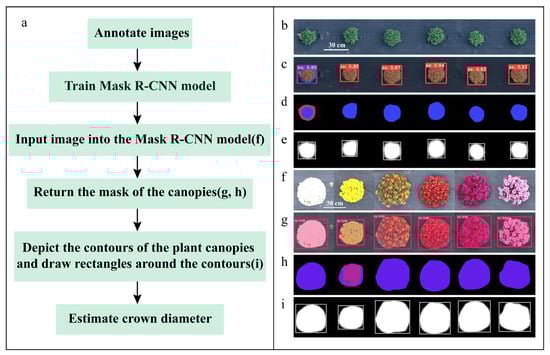
Figure 5.
Flowchart of the method based on Mask R-CNN. (a) Abstract flowchart; (b) original image of garden chrysanthemum during the green stage; (f) original images of garden chrysanthemums with different flower colors; (c,g) predicted images of Mask R-CNN; (d,h) plant canopy masks generated by Mask R-CNN; (e,i) drawing of bounding rectangles of plant canopy contours.
This study utilized a Windows 11 operating system with a computer configuration including an NVIDIA GeForce RTX 3090 graphics card (24 GB VRAM), 64 GB RAM, and an Intel(R) Xeon(R) Gold 6226R processor (2.90 GHz base frequency). The RGB and HSV color space methods were implemented using OpenCV 4.5.5 and Python 3.7.13, while the neural network model employed the TensorFlow 2.4.0 framework, written in Python 3.7.16.
2.6. Statistical Analysis
In this experiment, the crown diameter estimation was compared with manually measured crown diameter (where the width of the bounding rectangle corresponds to the crown diameter parallel to the bed direction, and the height corresponds to the crown diameter perpendicular to the bed direction) to assess the reliability of the different methods. The evaluation criteria for crown diameter estimation performance included the coefficient of determination (R2), root mean square error (RMSE), and Bias.
3. Results
3.1. Variation Trend of Crown Diameter in Garden Chrysanthemums
The distribution of manually measured crown diameters of garden chrysanthemums on the 72nd, 84th, 95th, 105th, and 118th days after planting is illustrated in Figure 6. Following planting, the crown diameter of garden chrysanthemums exhibited a gradual increase, with median values of 21.00 cm, 30.45 cm, 39.80 cm, 41.20 cm, and 43.10 cm for the five measurements, respectively. During the first, second, and third measurements, garden chrysanthemum plants were in the juvenile stage and exhibited an overall green appearance. In the fourth measurement, 16 varieties began to bud, and in the fifth measurement, 36 varieties bloomed, with the entire plant or a part thereof presenting color (Figure 7).
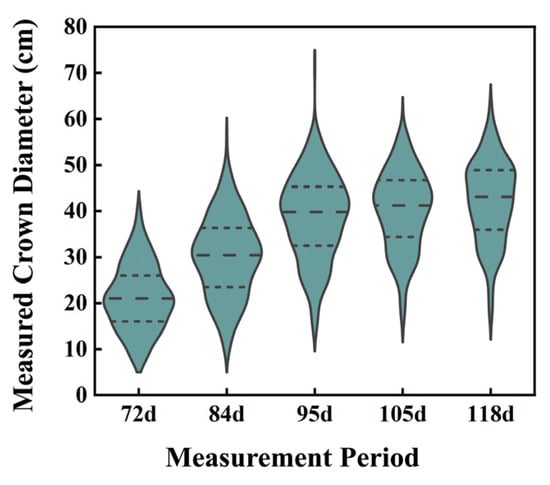
Figure 6.
Box diagram of measured crown diameter values for five measurement stages of garden chrysanthemums. (Note: The three dashed lines from top to bottom respectively represent the 25th percentile, the Median, and the 75th percentile.
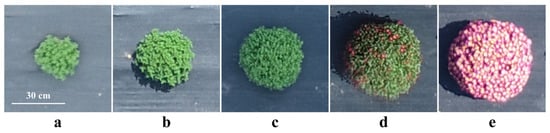
Figure 7.
Plant status of garden chrysanthemum for five measurement stages: (a) 72 days after planting; (b) 84 days after planting; (c) 95 days after planting; (d) 105 days after planting; (e) 118 days after planting.
3.2. Estimation of Crown Diameter with RGB Color Space
Figure 8 presents scatter plots illustrating the relationship between the crown diameter estimated by the ExG in the RGB color space and the manually measured crown diameter in garden chrysanthemums. The R2 for all data in the first two measurement periods was 0.9011, with an RMSE of 3.3418 cm and a Bias of −0.0950 cm. On the 72nd day after planting, the median manually measured crown diameter was 21.00 cm, the R2 was 0.7703, the RMSE was 3.8916 cm, and the Bias was −0.7260 cm. However, by the 84th day after planting, the median manually measured crown diameter was 30.45 cm, the R2 increased to 0.9422, the RMSE decreased to 2.6692 cm, and the Bias increased to 0.9237 cm. This indicates that at 84 days after planting, the overall crown diameter of the plants was larger compared to the first measurement, and the estimation accuracy improved. It is important to note that this method uses the ExG to convert RGB images into grayscale images, making it suitable only for periods when the plants exhibit a green color throughout the entire plant. Once the garden chrysanthemums start to bud and bloom, displaying white, yellow, orange, red, purple, pink, or other colors in the orthographic images, this method is no longer applicable.
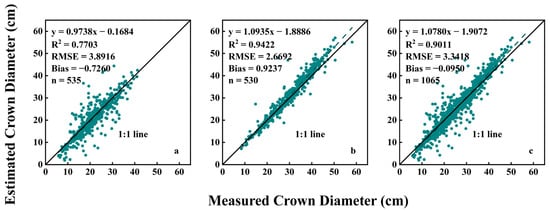
Figure 8.
Relationship between estimated crown diameter values based on RGB color space and measured crown diameter values: (a) 72 days after planting; (b) 84 days after planting; (c) data from 72 and 84 days after planting.
3.3. Estimation of Crown Diameter with HSV Color Space
This method not only effectively separates green plants from the field background but also efficiently distinguishes flowering and colored plants from the field background. Therefore, we used this method to produce multiple scatter plots to visualize the relationship between estimated crown diameter and measured crown diameter across five growth stages (Figure 9). The results showed that across the five measurement periods, the R2 value exhibited an increasing trend followed by a decreasing trend, reaching its maximum on the 95th day after planting. The RMSE value displayed a decreasing trend followed by an increasing trend, while the Bias consistently showed positive values, also following a decreasing and then increasing trend, with both reaching the minimum on the 95th day after planting. This indicates that the estimation performance was optimal on the 95th day after planting, with an R2 of 0.9609, an RMSE of 2.1175 cm, and a Bias of 0.1811 cm. In contrast, on the 72nd day after planting, the estimation performance was slightly subpar, with an R2 of 0.8619, an RMSE of 3.5487 cm, and a Bias of 1.9474 cm. This might be attributed to the fact that on the 95th day after planting, the median crown diameter of the plants was 39.80 cm, showing a significant increase compared to the first two measurement periods. Additionally, most plants were in the budding stage, with buds present but not yet displaying color, resulting in an overall green appearance that was easier to segment from the background. In the early stages of planting, when the plants were smaller, the segmentation of each pixel had a greater impact on the estimation results, resulting in poorer performance. On the 105th day after planting, as garden chrysanthemums began to bloom in different colors, the interference from background segmentation increased, leading to a decrease in crown diameter estimation accuracy.
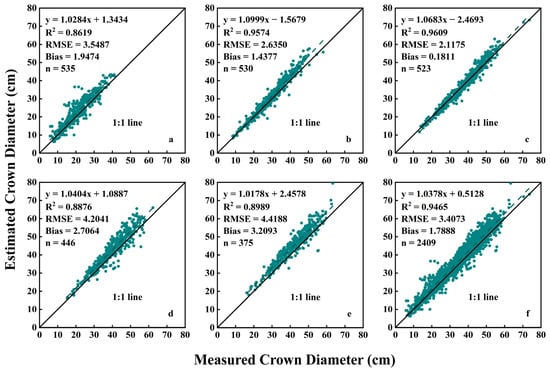
Figure 9.
Relationship between estimated crown diameter values based on HSV color space and measured crown diameter values: (a) 72 days after planting; (b) 84 days after planting; (c) 95 days after planting; (d) 105 days after planting; (e) 118 days after planting; (f) data from all five stages.
Throughout the entire growth period, the HSV color space model demonstrated favorable estimation performance (Figure 9f), with an R2 of 0.9465, an RMSE of 3.4073 cm, and a Bias of 1.7888 cm. The estimation points were distributed on both sides of the 1:1 line, but more points were situated above the line, indicating that the estimated values were slightly larger than the measured values.
3.4. Estimation of Crown Diameter with Mask R-CNN
In this study, the estimation of crown diameter throughout the entire growth period of garden chrysanthemums was accomplished by training the Mask R-CNN. After 150 training epochs, the Mask R-CNN achieved an average segmentation accuracy of 83.4% and an average recall of 87.0% (IoU = 0.50:0.95).
Figure 10 presents several scatter plots illustrating the relationship between estimated crown diameter based on the Mask R-CNN model and measured crown diameter. Across the five measurement periods, the values of R2, RMSE, and Bias exhibited a similar trend to the estimation method based on the HSV color space model. Similarly, on the 95th day after planting, the estimation performance was optimal, with an R2 of 0.9609, an RMSE of 1.9193 cm, and a Bias of 0.7081 cm. In comparison, on the 72nd day after planting, the estimation performance was slightly subpar, with an R2 value of 0.8958, an RMSE of 2.5735 cm, and a Bias of 1.6880 cm. This could be attributed to the relatively small size of the plants at this stage (median value of crown diameter was 21.00 cm), while the images in this experiment were not sufficiently clear, with a spatial resolution of 0.36 cm. Therefore, the segmentation results of each pixel were crucial for crown diameter estimation, and misclassification of a few pixels can lead to significant errors.
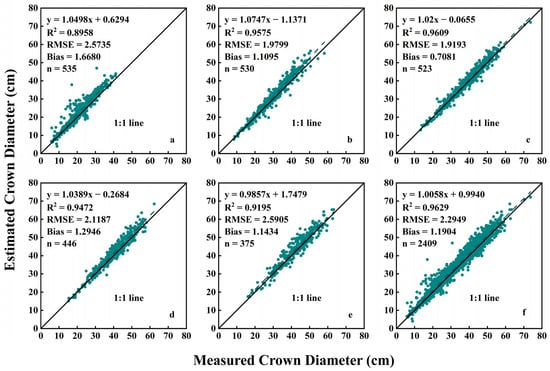
Figure 10.
Relationship between estimated crown diameter values based on Mask R-CNN and measured crown diameter values: (a) 72 days after planting; (b) 84 days after planting; (c) 95 days after planting; (d) 105 days after planting; (e) 118 days after planting; (f) data from all five stages.
Furthermore, the estimation performance based on the Mask R-CNN model throughout the entire growth period is shown in Figure 10f. The crown diameter estimation based on the Mask R-CNN model demonstrated favorable performance, with an R2 value of 0.9629, an RMSE of 2.2949 cm, and a Bias of 1.1904 cm. This indicates that this method exhibits desirable accuracy and reliability.
4. Discussion
The crown diameter of plants serves as a valuable indicator, reflecting important information regarding plant growth, biomass, spatial utilization, and ecological functions and holding significant relevance in agriculture, forestry, ecology, and related fields [12,39]. Additionally, it is also an important indicator for evaluating the ornamental characteristics of landscape flowers. Previous studies have successfully demonstrated the feasibility of efficiently and accurately depicting plant canopies from UAV-based RGB images [7]. In this study, we used RGB images captured by UAVs and employed three methods based on the RGB color space, HSV color space, and Mask R-CNN model to estimate the crown diameter of garden chrysanthemums across various growth stages. The estimation results of the three methods were compared to assess their effectiveness.
In this study, the estimation of crown diameter based on the RGB color space utilized the ExG to enhance the contrast between garden chrysanthemums and black mulch and soil. This enhancement facilitated the segmentation of plant foreground and field background. Initially, Woebbecke et al. successfully discriminated live plant material from bare soil, corn residues, and wheat straw residues using the ExG [32]. Research by Riehle et al. further demonstrated the suitability of ExG for plant–background segmentation, yielding good performance [33]. In this study, this method was employed to estimate the crown diameter during periods when the entire plants exhibited a predominantly green appearance. In the estimation based on the image captured 72 days after planting, the plants were relatively smaller, resulting in a slightly lower R2 value. However, when estimating the crown diameter from the image captured 84 days after planting, an R2 value of 0.9422 was achieved, indicating a more desirable estimation result. Nevertheless, this method exhibited lower accuracy in estimating plant crown diameter compared to the other two methods and was susceptible to disturbances such as lighting conditions, weeds, and soil disturbances. Some studies suggest that the Otsu method [40] can adaptively separate plants from the background [41]. However, in this experiment, when the plant leaves were darker and the soil color was lighter, the Otsu method tended to extract the soil as foreground (Figure 11), thereby affecting the crown diameter estimation. Therefore, this approach requires selecting the most suitable threshold based on the grayscale histogram, reducing its convenience.
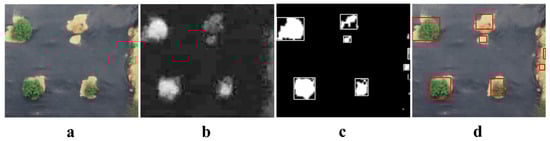
Figure 11.
Background segmentation using the Otsu method. (a) Original image; (b) grayscale image; (c) binary image obtained through background segmentation using the Otsu method; (d) projection of bounding rectangles onto the original image.
In comparison, the HSV color space exhibited more desirable estimation results throughout the entire growth stage of garden chrysanthemums. Except for the measurement taken 72 days after planting when the plants were smaller, resulting in a slightly lower R2 value, the R2 for the other growth stages exceeded 0.88, achieving the desired effect. The brightness component (V) in the HSV color space is independent of the color information in the image, making it less susceptible to environmental lighting conditions. This characteristic enables better separation of plants at different growth stages from the background, facilitating accurate estimation of the crown diameter. Similar to the findings of Yang et al. the HSV color model decision tree was found to be more adaptable to lighting variations than the Otsu method, effectively segmenting corn seedlings from complex field backgrounds [37]. Building on previous experience [42], this experiment combined the HSV color space with morphological operations to enhance the performance of plant canopy depiction. However, when applied to garden chrysanthemums entering the flowering period, this method requires manual adjustment of the limiting parameters for the H, S, and V components. These components are based on the chromatic coordinates of different varieties of garden chrysanthemums at different growth stages. This is necessary to achieve general applicability of crown diameter estimation across various varieties and growth stages. This implies that parameters need to be reconfigured when there is a change in plant variety or planting conditions. Additionally, the method based on the HSV color space discussed in this paper only incorporates color information and does not consider shape features. Consequently, it cannot accurately estimate the crown diameter for garden chrysanthemums with limited overlapping crowns. Future research could enhance the accuracy of crown diameter estimation by integrating shape features into this method.
In recent years, CNN models, such as faster region-based convolutional neural network (Faster R-CNN) and Mask R-CNN, have been widely used for segmenting plants from field backgrounds, demonstrating promising results [27,29]. In this study, we explored the use of the Mask R-CNN to depict the crown canopy of garden chrysanthemums. Compared to the HSV color space method, the Mask R-CNN model achieved higher R2 values at the 72nd, 105th, and 118th days after planting, and the RMSE values for all five measurement stages were lower than those of the HSV color space. Throughout the entire growth stage (all five stages), the R2 value reached 0.9629, and the RMSE value was 2.2949 cm, outperforming the HSV color space. This indicates the superiority of the estimation accuracy achieved by the Mask R-CNN model. The Mask R-CNN model excels in accurately segmenting plants with a small amount of overlap (Figure 12), facilitating the estimation of crown diameter for these plants. This highlights that the Mask R-CNN model can more accurately segment plants and background in complex cultivation scenarios for the estimation of garden chrysanthemum crown diameter. The integration of color and shape features enhances its capability in this regard. However, it is essential to acknowledge that training Mask R-CNN demands a considerable amount of time and requires a substantial amount of manual annotation of images, which is undoubtedly a time-consuming and tedious task.
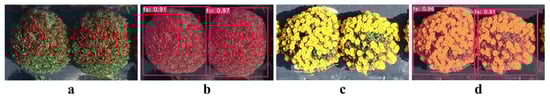
Figure 12.
Estimation of crown diameter of overlapping garden chrysanthemums: (a,c) original images; (b,d) prediction effect images of Mask R-CNN.
After completing image cropping and parameter configuration, the estimation time for crown diameters of the plants in the experimental field (approximately 1100 plants) was within 2 min for all three methods. Although the Mask R-CNN-based method had a slightly longer computation time, it demonstrated significantly higher efficiency compared to manual crown diameter measurements.
In summary, compared to the RGB color space, both the HSV color space and the Mask R-CNN model proved to be suitable for most cases. They exhibited superior performance in estimating the crown diameter of garden chrysanthemums. The Mask R-CNN model particularly excelled in scenarios with complex scenes and a small number of overlapping targets. However, the estimation accuracy of the three methods used in this study for plants with a crown diameter less than 30 cm needs further improvement. Perhaps reduction of the flight altitude could be considered in an attempt to enhance spatial resolution, thereby improving the accuracy of crown diameter estimation for juvenile plants.
Future research could involve continuous UAV imaging to monitor the growth rates of chrysanthemum crown diameters and crown projection areas. By integrating meteorological data during the imaging periods, researchers could analyze the growth trends of garden chrysanthemums under specific environmental conditions. Such analyses can offer valuable information into variety resistance, contributing to the scientific data needed for resistance breeding. Additionally, researchers may explore the application of other color indices in the RGB color space to estimate the crown diameter of garden chrysanthemums during the flowering period and explore other computer vision models to acquire the phenotypes of garden chrysanthemums.
5. Conclusions
The analysis of plant phenotypes based on high-resolution UAV imagery has become a research hotspot in the field of cultivated plants in recent years. In this study, three methods for estimating the crown diameter of garden chrysanthemums based on UAV imagery are proposed. The findings are as follows:
- (1)
- The Mask R-CNN-based model had superior performance in crown diameter estimation (R2 = 0.9629, RMSE = 2.2949 cm) and could be suitable for complex cultivation scenarios.
- (2)
- The HSV color space-based model performed well in most cases (R2 = 0.9465, RMSE = 3.4073 cm).
- (3)
- The RGB color space-based model exhibited suboptimal results (R2 = 0.9011, RMSE = 3.3418 cm) and had limited applicability.
This study demonstrated the feasibility of efficiently and accurately extracting crown diameter indicators of garden chrysanthemums using high-resolution visible light imagery from UAVs. This study offers an alternative approach to monitor the crown diameter of plants rapidly, in a cost-effective manner, and with minimal manual labor, as opposed to the conventional method of direct in-field measurements, which is labor-intensive and less accurate. Although both the Mask R-CNN-based method and the HSV color space-based method yield satisfactory estimation results and can serve as a reference for other ornamental plants requiring crown diameter measurements, they may not be directly applicable. Future research endeavors could explore the combined application of UAV imagery and deep learning for estimating crown diameter in other crops. Alternatively, researchers could explore methods for estimating other ornamental indicators on this basis.
Supplementary Materials
The following supporting information can be downloaded at: https://www.mdpi.com/article/10.3390/agronomy14020337/s1, Figure S1: Garden chrysanthemum planting map; Table S1: Sixty-four garden chrysanthemum cultivars.
Author Contributions
Conceptualization, Z.G., J.L. and J.Z.; methodology, Z.G., J.L. and J.Z.; software, J.L. and J.Z.; validation, J.L. and J.Z.; formal analysis, Z.G., J.L. and J.Z.; investigation, J.Z., Q.Z., Q.Q. and G.Z.; data curation, J.Z., Q.Z., Q.Q. and G.Z.; writing—original draft preparation, Z.G., J.L. and J.Z.; writing—review and editing, Z.G., F.C., S.C., W.F. and F.Z.; visualization, Z.G., F.C., S.C., W.F. and F.Z.; supervision, Z.G., F.C., S.C., W.F. and F.Z.; project administration, Z.G., F.C., S.C., W.F. and F.Z.; funding acquisition, Z.G. and J.L. All authors have read and agreed to the published version of the manuscript.
Funding
This research was funded by the National Key Research and Development Program of China, grant number 2023YFD2300900; the National Natural Science Foundation of China, grant number 32302593; the Jiangsu Agriculture Science and Technology Innovation Fund, grant number CX(22)2033; the Jiangsu Funding Program for Excellent Postdoctoral Talent, grant number 2022ZB339; the Fellowship of China Postdoctoral Science Foundation, grant number 2022M721638; and the “JBGS” Project of Seed Industry Revitalization in Jiangsu Province, grant number JBGS(2021)094.
Data Availability Statement
The data that support the findings of this study are available from the corresponding author (Z.G.) upon reasonable request.
Conflicts of Interest
The authors declare that they have no known competing financial interests or personal relationships that could have appeared to influence the work reported in this paper.
References
- Wang, Q.; Wang, H.; Tian, J. Evaluate the adaptability of garden chrysanthemum resources in Xining region based on principal component analysis. China J. Agric. Sci. Technol. 2021, 23, 62–72. [Google Scholar] [CrossRef]
- Zhu, D.; Han, Y.; Fang, W.; Chen, F.; Chen, S.; Deng, B.; Guan, Z. Quality evaluation and variety selection of multi flower garden chrysanthemums. J. Nanjing Agric. Univ. 2018, 41, 266–274. [Google Scholar] [CrossRef]
- Fan, J.; Zhang, Y.; Wen, W.; Gu, S.; Lu, X.; Guo, X. The future of Internet of Things in agriculture: Plant high-throughput phenotypic platform. J. Clean Prod. 2021, 280, 123651. [Google Scholar] [CrossRef]
- Hall, R.D.; D’auria, J.C.; Ferreira, A.C.S.; Gibon, Y.; Kruszka, D.; Mishra, P.; van de Zedde, R. High-throughput plant phenotyping: A role for metabolomics? Trends Plant Sci. 2022, 27, 549–563. [Google Scholar] [CrossRef] [PubMed]
- Martins, J.A.C.; Nogueira, K.; Osco, L.P.; Gomes, F.D.G.; Furuya, D.E.G.; Gonçalves, W.N.; Sant’ana, D.A.; Ramos, A.P.M.; Liesenberg, V.; dos Santos, J.A.; et al. Semantic Segmentation of Tree-Canopy in Urban Environment with Pixel-Wise Deep Learning. Remote Sens. 2021, 13, 3054. [Google Scholar] [CrossRef]
- Zheng, C.; Abd-Elrahman, A.; Whitaker, V.M.; Dalid, C. Deep Learning for Strawberry Canopy Delineation and Biomass Prediction from High-Resolution Images. Plant Phenomics 2022, 2022, 9850486. [Google Scholar] [CrossRef]
- Hu, L.; Xu, X.; Wang, J.; Xu, H. Individual tree crown width detection from unmanned aerial vehicle images using a revised local transect method. Ecol. Inform. 2023, 75, 102086. [Google Scholar] [CrossRef]
- Wu, J.; Yang, G.; Yang, H.; Zhu, Y.; Li, Z.; Lei, L.; Zhao, C. Extracting apple tree crown information from remote imagery using deep learning. Comput. Electron. Agric. 2020, 174, 105504. [Google Scholar] [CrossRef]
- Dersch, S.; Schöttl, A.; Krzystek, P.; Heurich, M. Towards complete tree crown delineation by instance segmentation with Mask R–CNN and DETR using UAV-based multispectral imagery and lidar data. ISPRS Open J. Photogramm. Remote Sens. 2023, 8, 100037. [Google Scholar] [CrossRef]
- Fernando, W.A.M.; Senanayake, I. Developing a two-decadal time-record of rice field maps using Landsat-derived multi-index image collections with a random forest classifier: A Google Earth Engine based approach. Inf. Process. Agric. 2023, S2214317323000197. [Google Scholar] [CrossRef]
- Shao, C.; Shuai, Y.; Wu, H.; Deng, X.; Zhang, X.; Xu, A. Development of a Spectral Index for the Detection of Yellow-Flowering Vegetation. Remote Sens. 2023, 15, 1725. [Google Scholar] [CrossRef]
- Qin, Y.; Wu, B.; Lei, X.; Feng, L. Prediction of tree crown width in natural mixed forests using deep learning algorithm. For. Ecosyst. 2023, 10, 100109. [Google Scholar] [CrossRef]
- Lassalle, G.; Ferreira, M.P.; La Rosa, L.E.C.; Filho, C.R.d.S. Deep learning-based individual tree crown delineation in mangrove forests using very-high-resolution satellite imagery. ISPRS J. Photogramm. Remote Sens. 2022, 189, 220–235. [Google Scholar] [CrossRef]
- Jang, G.; Kim, J.; Yu, J.-K.; Kim, H.-J.; Kim, Y.; Kim, D.-W.; Kim, K.-H.; Lee, C.W.; Chung, Y.S. Review: Cost-Effective Unmanned Aerial Vehicle (UAV) Platform for Field Plant Breeding Application. Remote Sens. 2020, 12, 998. [Google Scholar] [CrossRef]
- Yang, G.; Liu, J.; Zhao, C.; Li, Z.; Huang, Y.; Yu, H.; Xu, B.; Yang, X.; Zhu, D.; Zhang, X.; et al. Unmanned Aerial Vehicle Remote Sensing for Field-Based Crop Phenotyping: Current Status and Perspectives. Front. Plant Sci. 2017, 8, 1111. [Google Scholar] [CrossRef] [PubMed]
- da Silva, L.A.; Bressan, P.O.; Gonçalves, D.N.; Freitas, D.M.; Machado, B.B.; Gonçalves, W.N. Estimating soybean leaf defoliation using convolutional neural networks and synthetic images. Comput. Electron. Agric. 2019, 156, 360–368. [Google Scholar] [CrossRef]
- Anderson, N.T.; Walsh, K.B.; Wulfsohn, D. Technologies for Forecasting Tree Fruit Load and Harvest Timing—From Ground, Sky and Time. Agronomy 2021, 11, 1409. [Google Scholar] [CrossRef]
- Karthik, P.; Parashar, M.; Reka, S.S.; Rajamani, K.T.; Heinrich, M.P. Semantic segmentation for plant phenotyping using advanced deep learning pipelines. Multimed. Tools Appl. 2022, 81, 4535–4547. [Google Scholar] [CrossRef]
- Sonawane, S.; Mohanty, B.K. An improved image processing scheme for automatic detection of harvested soybean seeds. J. Food Meas. Charact. 2021, 15, 5607–5621. [Google Scholar] [CrossRef]
- Castillo-Martínez, M.; Gallegos-Funes, F.J.; Carvajal-Gámez, B.E.; Urriolagoitia-Sosa, G.; Rosales-Silva, A.J. Color index based thresholding method for background and foreground segmentation of plant images. Comput. Electron. Agric. 2020, 178, 105783. [Google Scholar] [CrossRef]
- Wang, Y.; Wang, D.; Zhang, G.; Wang, J. Estimating nitrogen status of rice using the image segmentation of G-R thresholding method. Field Crop. Res. 2013, 149, 33–39. [Google Scholar] [CrossRef]
- Wang, S.; Sun, G.; Zheng, B.; Du, Y. A Crop Image Segmentation and Extraction Algorithm Based on Mask RCNN. Entropy 2021, 23, 1160. [Google Scholar] [CrossRef] [PubMed]
- Toda, Y.; Okura, F. How Convolutional Neural Networks Diagnose Plant Disease. Plant Phenomics 2019, 2019, 9237136. [Google Scholar] [CrossRef] [PubMed]
- Johnson, J.; Sharma, G.; Srinivasan, S.; Masakapalli, S.K.; Sharma, S.; Sharma, J.; Dua, V.K. Enhanced Field-Based Detection of Potato Blight in Complex Backgrounds Using Deep Learning. Plant Phenomics 2021, 2021, 9835724. [Google Scholar] [CrossRef] [PubMed]
- Latif, G.; Abdelhamid, S.E.; Mallouhy, R.E.; Alghazo, J.; Kazimi, Z.A. Deep Learning Utilization in Agriculture: Detection of Rice Plant Diseases Using an Improved CNN Model. Plants 2022, 11, 2230. [Google Scholar] [CrossRef] [PubMed]
- Jubery, T.Z.; Carley, C.N.; Singh, A.; Sarkar, S.; Ganapathysubramanian, B.; Singh, A.K. Using Machine Learning to Develop a Fully Automated Soybean Nodule Acquisition Pipeline (SNAP). Plant Phenomics 2021, 2021, 9834746. [Google Scholar] [CrossRef] [PubMed]
- Sun, M.; Xu, L.; Chen, X.; Ji, Z.; Zheng, Y.; Jia, W. BFP Net: Balanced Feature Pyramid Network for Small Apple Detection in Complex Orchard Environment. Plant Phenomics 2022, 2022, 9892464. [Google Scholar] [CrossRef]
- Ghosal, S.; Zheng, B.; Chapman, S.C.; Potgieter, A.B.; Jordan, D.R.; Wang, X.; Singh, A.K.; Singh, A.; Hirafuji, M.; Ninomiya, S.; et al. A Weakly Supervised Deep Learning Framework for Sorghum Head Detection and Counting. Plant Phenomics 2019, 2019, 1525874. [Google Scholar] [CrossRef]
- Wang, P.; Meng, F.; Donaldson, P.; Horan, S.; Panchy, N.L.; Vischulis, E.; Winship, E.; Conner, J.K.; Krysan, P.J.; Shiu, S.; et al. High-throughput measurement of plant fitness traits with an object detection method using Faster R-CNN. New Phytol. 2022, 234, 1521–1533. [Google Scholar] [CrossRef]
- Cong, P.; Li, S.; Zhou, J.; Lv, K.; Feng, H. Research on Instance Segmentation Algorithm of Greenhouse Sweet Pepper Detection Based on Improved Mask RCNN. Agronomy 2023, 13, 196. [Google Scholar] [CrossRef]
- DB11/T 898-2020; Technical Regulations for Potted Chrysanthemum Cultivation. Beijing Municipal Bureau of Market Supervision and Administration: Beijing, China, 2020. Available online: http://bzh.scjgj.beijing.gov.cn/bzh/apifile/file/2021/20210325/4d123cf8-f95b-48b8-abbd-8303bc8097b6.PDF (accessed on 24 December 2020).
- Woebbecke, D.M.; Meyer, G.E.; Von Bargen, K.; Mortensen, D.A. Color Indices for Weed Identification Under Various Soil, Residue, and Lighting Conditions. Trans. ASAE 1994, 38, 259–269. [Google Scholar] [CrossRef]
- Riehle, D.; Reiser, D.; Griepentrog, H.W. Robust index-based semantic plant/background segmentation for RGB- images. Comput. Electron. Agric. 2020, 169, 105201. [Google Scholar] [CrossRef]
- Zhou, C.; Ye, H.; Yu, G.; Hu, J.; Xu, Z. Research on Rapid Extraction of Broccoli Phenotypes Based on Machine Vision and Deep Learning. Smart Agric. 2020, 2, 121–132. [Google Scholar] [CrossRef]
- Smith, A.R. Color gamut transform pairs. ACM SIGGRAPH Comput. Graph. 1978, 12, 12–19. [Google Scholar] [CrossRef]
- Schwarz, M.W.; Cowan, W.B.; Beatty, J.C. An experimental comparison of RGB, YIQ, LAB, HSV, and opponent color models. ACM Trans. Graph. 1987, 6, 123–158. [Google Scholar] [CrossRef]
- Yang, W.; Wang, S.; Zhao, X.; Zhang, J.; Feng, J. Greenness identification based on HSV decision tree. Inf. Process. Agric. 2015, 2, 149–160. [Google Scholar] [CrossRef]
- He, K.; Gkioxari, G.; Dollár, P.; Girshick, R. Mask R-CNN. IEEE Trans. Pattern Anal. Mach. Intell. 2020, 42, 386–397. [Google Scholar] [CrossRef]
- Suhardiman, A.; Tsuyuki, S.; Setiawan, Y. Estimating Mean Tree Crown Diameter of Mangrove Stands Using Aerial Photo. Procedia Environ. Sci. 2016, 33, 416–427. [Google Scholar] [CrossRef]
- Otsu, N. A threshold selection method from gray-level histograms. IEEE Trans. Syst. Man Cybern. 2007, 9, 62–66. [Google Scholar] [CrossRef]
- Sun, J. Improved two-dimensional maximum inter class variance method and its application in cucumber target segmentation. J. Agric. Eng. 2009, 25, 176–181. [Google Scholar] [CrossRef]
- Hamuda, E.; Mc Ginley, B.; Glavin, M.; Jones, E. Automatic crop detection under field conditions using the HSV colour space and morphological operations. Comput. Electron. Agric. 2017, 133, 97–107. [Google Scholar] [CrossRef]
Disclaimer/Publisher’s Note: The statements, opinions and data contained in all publications are solely those of the individual author(s) and contributor(s) and not of MDPI and/or the editor(s). MDPI and/or the editor(s) disclaim responsibility for any injury to people or property resulting from any ideas, methods, instructions or products referred to in the content. |
© 2024 by the authors. Licensee MDPI, Basel, Switzerland. This article is an open access article distributed under the terms and conditions of the Creative Commons Attribution (CC BY) license (https://creativecommons.org/licenses/by/4.0/).