Article

Study on Spray Evaluation: The Key Role of Droplet Collectors

1
College of Science, China Agricultural University, Beijing 100193, China
2
Centre for Chemicals Application Technology, China Agricultural University, Beijing 100193, China
3
College of Agricultural Unmanned System, China Agricultural University, Beijing 100193, China
*
Author to whom correspondence should be addressed.
These authors contributed equally to this work.
Agronomy 2024, 14(2), 305; https://doi.org/10.3390/agronomy14020305
Submission received: 23 December 2023 / Revised: 23 January 2024 / Accepted: 28 January 2024 / Published: 30 January 2024
(This article belongs to the Section Precision and Digital Agriculture)

Abstract

:
Droplet collectors are commonly utilized to gauge the effect of pesticide deposition on crops. However, the varying surface characteristics of these collectors can lead to disparate data outcomes. Notably, water-sensitive paper is limited in humid environments, hindering rapid droplet deposition evaluation. Consequently, the selection of appropriate droplet collectors based on the environmental conditions is imperative. This study involved the use of five typical droplet collectors to establish a method for the swift and accurate evaluation of spray effectiveness, employing various spray liquids. It was observed that the surface free energy of five widely used droplet collectors was measured as follows: 35.11 mN m−1 for semigloss paper, 33.81 mN m−1 for coated paper laminated with polyvinyl chloride, 48.38 mN m−1 for kromekote paper (KP), 33.90 mN m−1 for polyvinyl chloride cards, and 39.95 mN m−1 for water-sensitive paper. When comparing the outcomes of deposition tests across these five collectors, it was noted that the results pertaining to droplet density were minimally influenced by the surface properties of the collectors with droplet coverage following. The volume of deposition was found to be the most susceptible to the surface characteristics of the collectors. Therefore, in the context of collecting and processing droplets, prioritizing droplet density as the metric for evaluation proved to be more reliable than using the other indicators.

1. Introduction

Pesticides are indispensable for managing pests, diseases, and weeds throughout the crop growth cycle, necessitating a rational and scientific approach to their application. Precision application is commonly recognized as an important factor in the scientific use of pesticides. Precision application, alongside properties of the pesticide, using pesticide application equipment (PAE), is one of three main factors affecting control effectiveness [1].
In practical agricultural settings, a meticulous evaluation of spray quality is instrumental in enhancing both the spray techniques and the overall pesticide application technology. Key detection indicators that serve as metrics for this evaluation include droplet coverage [2], droplet density [3] and deposition [4]. The size sprayed during the application varies, influencing their distribution uniformity [5]. According to ASABE S572.1 [6], the volume median diameter (VMD) for fine droplets ranges from 145 to 235 µm, while for coarse droplets, it spans from 341 to 403 µm. Coarse droplets are noted for their good penetration and deposition within the crop canopy [7], though they are prone to aggregation [8] and potential runoff from crop surfaces. Conversely, fine droplets are characterized by their uniform distribution and high adherence to targets, potentially elevating pesticide efficiency up to 50% [9]. However, fine droplets are also more susceptible to meteorological factors, leading to issues such as evaporative drift, which can pose risks of phytotoxicity and environment harm.
The deposition results of droplets with different particle sizes directly affect the droplet density, coverage, and deposition. Therefore, the precise and accurate collection and evaluation of droplets are paramount in assessing spray quality. Employing droplet collectors to collect and analyze pesticide droplets [10] offers a rapid and straightforward method for both the qualitative and quantitative assessment of spray quality. Achieving the desired control effect is contingent upon ensuring the droplets attain the optimal droplet density, coverage, and deposition on the target [11].
The measurement of droplet deposition properties has been a focal point of extensive research. In various field and orchard environments, WSP is predominantly utilized as droplet collectors [12,13,14]. Moor et al. [14] were pioneers in using WSP for droplet collection and analysis, deriving parameters like droplet size and density through image processing. Fritz et al. [15] established a database for spray deposition rates and droplet sizes by analyzing WSP images with DropletScan, facilitating rapid screening and evaluation. Tadić et al. [16] employed WSP processed through digital image analysis and ImageJ software to assess the impact of technical spraying factors on leaf area coverage in apple orchards. Wang et al. [17] used WSP to collect droplets. They then analyzed the data with DepositScan software to determine average rates of deposition and to deduce key parameters such as the uniformity and coverage of the droplets. Qin et al. [18] replaced pesticide sprays with the dye rhodamine B and employed polyester cards as droplet collectors for their research.
Many studies have honed in on image processing and algorithm development, yet the choice of collector material has received comparatively scant attention. Roten et al. [19] discovered that KP is effective for gathering data only at lower deposition rates, absorbing merely a portion of the droplets when deposition rates escalate. Chen et al. [20] used filter paper for the collection and detection of droplets with deposition quantified through the concentration of eluted droplets. Munjanja et al. [10] reviewed various methodologies for ascertaining off-target pesticide deposition, endorsing chromatographic paper as the superior detection medium. Zheng et al. [21] identified a limitation of WSP in that it reacts to non-target water molecules, potentially skewing results. To address this issue, they designed a specialized detection card for agricultural spraying. This card can distinguish between the specific ions in the target droplets and water molecules, utilizing a color reaction that involves ions such as NH4+, PO43−, NO3, and Fe2+.
Collectors with diverse material properties are tailored for different environments. Cunha et al. [22] suggested that WSP has significant limitations in use, as it is sensitive to humid environments and can turn blue in high humidity. In southern China, where the climate is humid, WSP may change color due to air humidity after being placed for some time. Moreover, WSP also cannot be used in paddy fields. Another limitation is that droplets tend to adhere together when using WSP, potentially compromising the precision of detection. For these reasons, deposition results obtained after image processing using WSP are not accurate [23]. Chen et al. [24] summarized and compared several of the current mainstream methods in droplet size experiments: the WSP method, oil pan method and laser particle size method. The laser particle size gives the most accurate results and is simple to use, but the instrument is expensive and limited by the site [21]. The WSP method and its image processing method are the most used. The oil pan method is one of the most cumbersome to operate and has been least used to date.
In summary, although WSP is the main means of droplet detection in fields and or-chards, with the advantages of simplicity, speed, and low cost [23], its disadvantage is al-so obvious: WSP cannot be used in humid environments. Therefore, the use of various droplet collectors becomes necessary. Moreover, the choice of collectors and indicators is a critical yet often overlooked aspect in the evaluation of spray efficacy [10] with the potential to markedly influence the results. More work needs to be undertaken to standardize droplet evaluation methods, including the choice of the most appropriate collector and indicators for different situations to obtain comparable and accurate data.
The above reasons were our main motivation to undertake the subject of our study, in which we compared the test effects of different material collectors and the effects of different droplet collectors on droplet collection effects and deposition rules. In this study, the color reaction and tracer method were considered as the basis, a variety of materials were used for the droplet collector, such as WSP, KP, polyvinyl chloride card (PVCC), coated paper covered with polyvinyl chloride (CPP), and coated art paper (SP). The data on droplet density, coverage, and deposition, as well as their surface free energy, were used to assess differences in different materials. To emulate actual field operations, two commonly used pesticide adjuvants were incorporated into the spray mixture. The resultant variance in droplet collectors’ test outcomes due to different adjuvants was analyzed. This study holds significant value for farmers and initial experiment testers, enabling them to swiftly and precisely gauge pesticide spray effectiveness. This, in turn, facilitates informed adjustments in pesticide application techniques.

2. Materials and Methods

2.1. Surface Properties of Droplet Collectors

To measure the surface free energy of droplet collectors, it is imperative to utilize pure liquids with known surface tensions. The surface tension of several liquids was first determined. The pendant drop method was the chosen test procedure, utilizing the Attension Theta (Biolin Scientific, Gothenburg, Sweden) contact angle measurement instrument. The surface tension (Young-Laplace) modality was activated within the OneAttension version 4.0, enabling the instrument to autonomously measure and calculate surface tension based on the curvature of the droplet.
To broaden the applicability of droplet collectors to materials with different surface properties, five collectors were chosen after initial experiments. Reagents used in this study were deionized water, analytically pure dimethyl sulfoxide (DMSO) liquid (Sinopharm, Beijing, China), and Ponceau 4R solution (Lion Head, Shanghai, China). Additionally, solutions containing two adjuvants were selected: Maifei adjuvant (Grand AgroChem, Beijing, China) and Kendo adjuvant (Jie Kang, Tianjin, China).
To ascertain the surface free energy of five distinct droplet collectors, the sessile drop method was employed. The volume of the dispensed droplets was maintained at 6 μL. Subsequent to droplet discharge, the pipette tip was gently lowered to facilitate contact between the droplet and the collector. The device then autonomously monitored and logged the contact angle over a duration of 10 s. This procedure was repeated with analytically pure DMSO liquid, using an identical methodology to measure the contact angles of the five droplet collectors.
There were two methods of calculating the surface free energy: the Zisman model and the OWRK (formed by combining the models of Owens, Wendt, Rabel, and Kaelble) model. Zisman [25] posited that the cosine of the contact angle θ is directly proportional to the corresponding liquid’s surface tension. When cos θ equals 1 (indicating a contact angle of 0°), the surface tension aligns with the surface free energy. The OWRK [26,27,28] model divided interfacial interactions into two types: polar and dispersive. It calculated the solid’s surface free energy based on the contact angles formed by different liquids on the solid’s surface. According to the Young equation [29], the solid surface free energy can be calculated using the contact angle. Therefore, the surface free energy for various materials can be calculated using the contact angle cosine values and surface tension data for two different liquids.
The OWRK equation is expressed as follows:
γ s l = γ s g + γ lg 2 γ s g d γ lg d 2 γ s g h γ lg h
In conjunction with the Young equation:
1 + cos θ = 2 γ s g d γ lg d γ lg + 2 γ s g h γ lg h γ lg
γ s g : interfacial tension between solid and gas; γ s l : interfacial tension between solid and liquid; γ lg : interfacial tension between liquid and gas; γ d : London dispersion force; γ h : polar interaction.

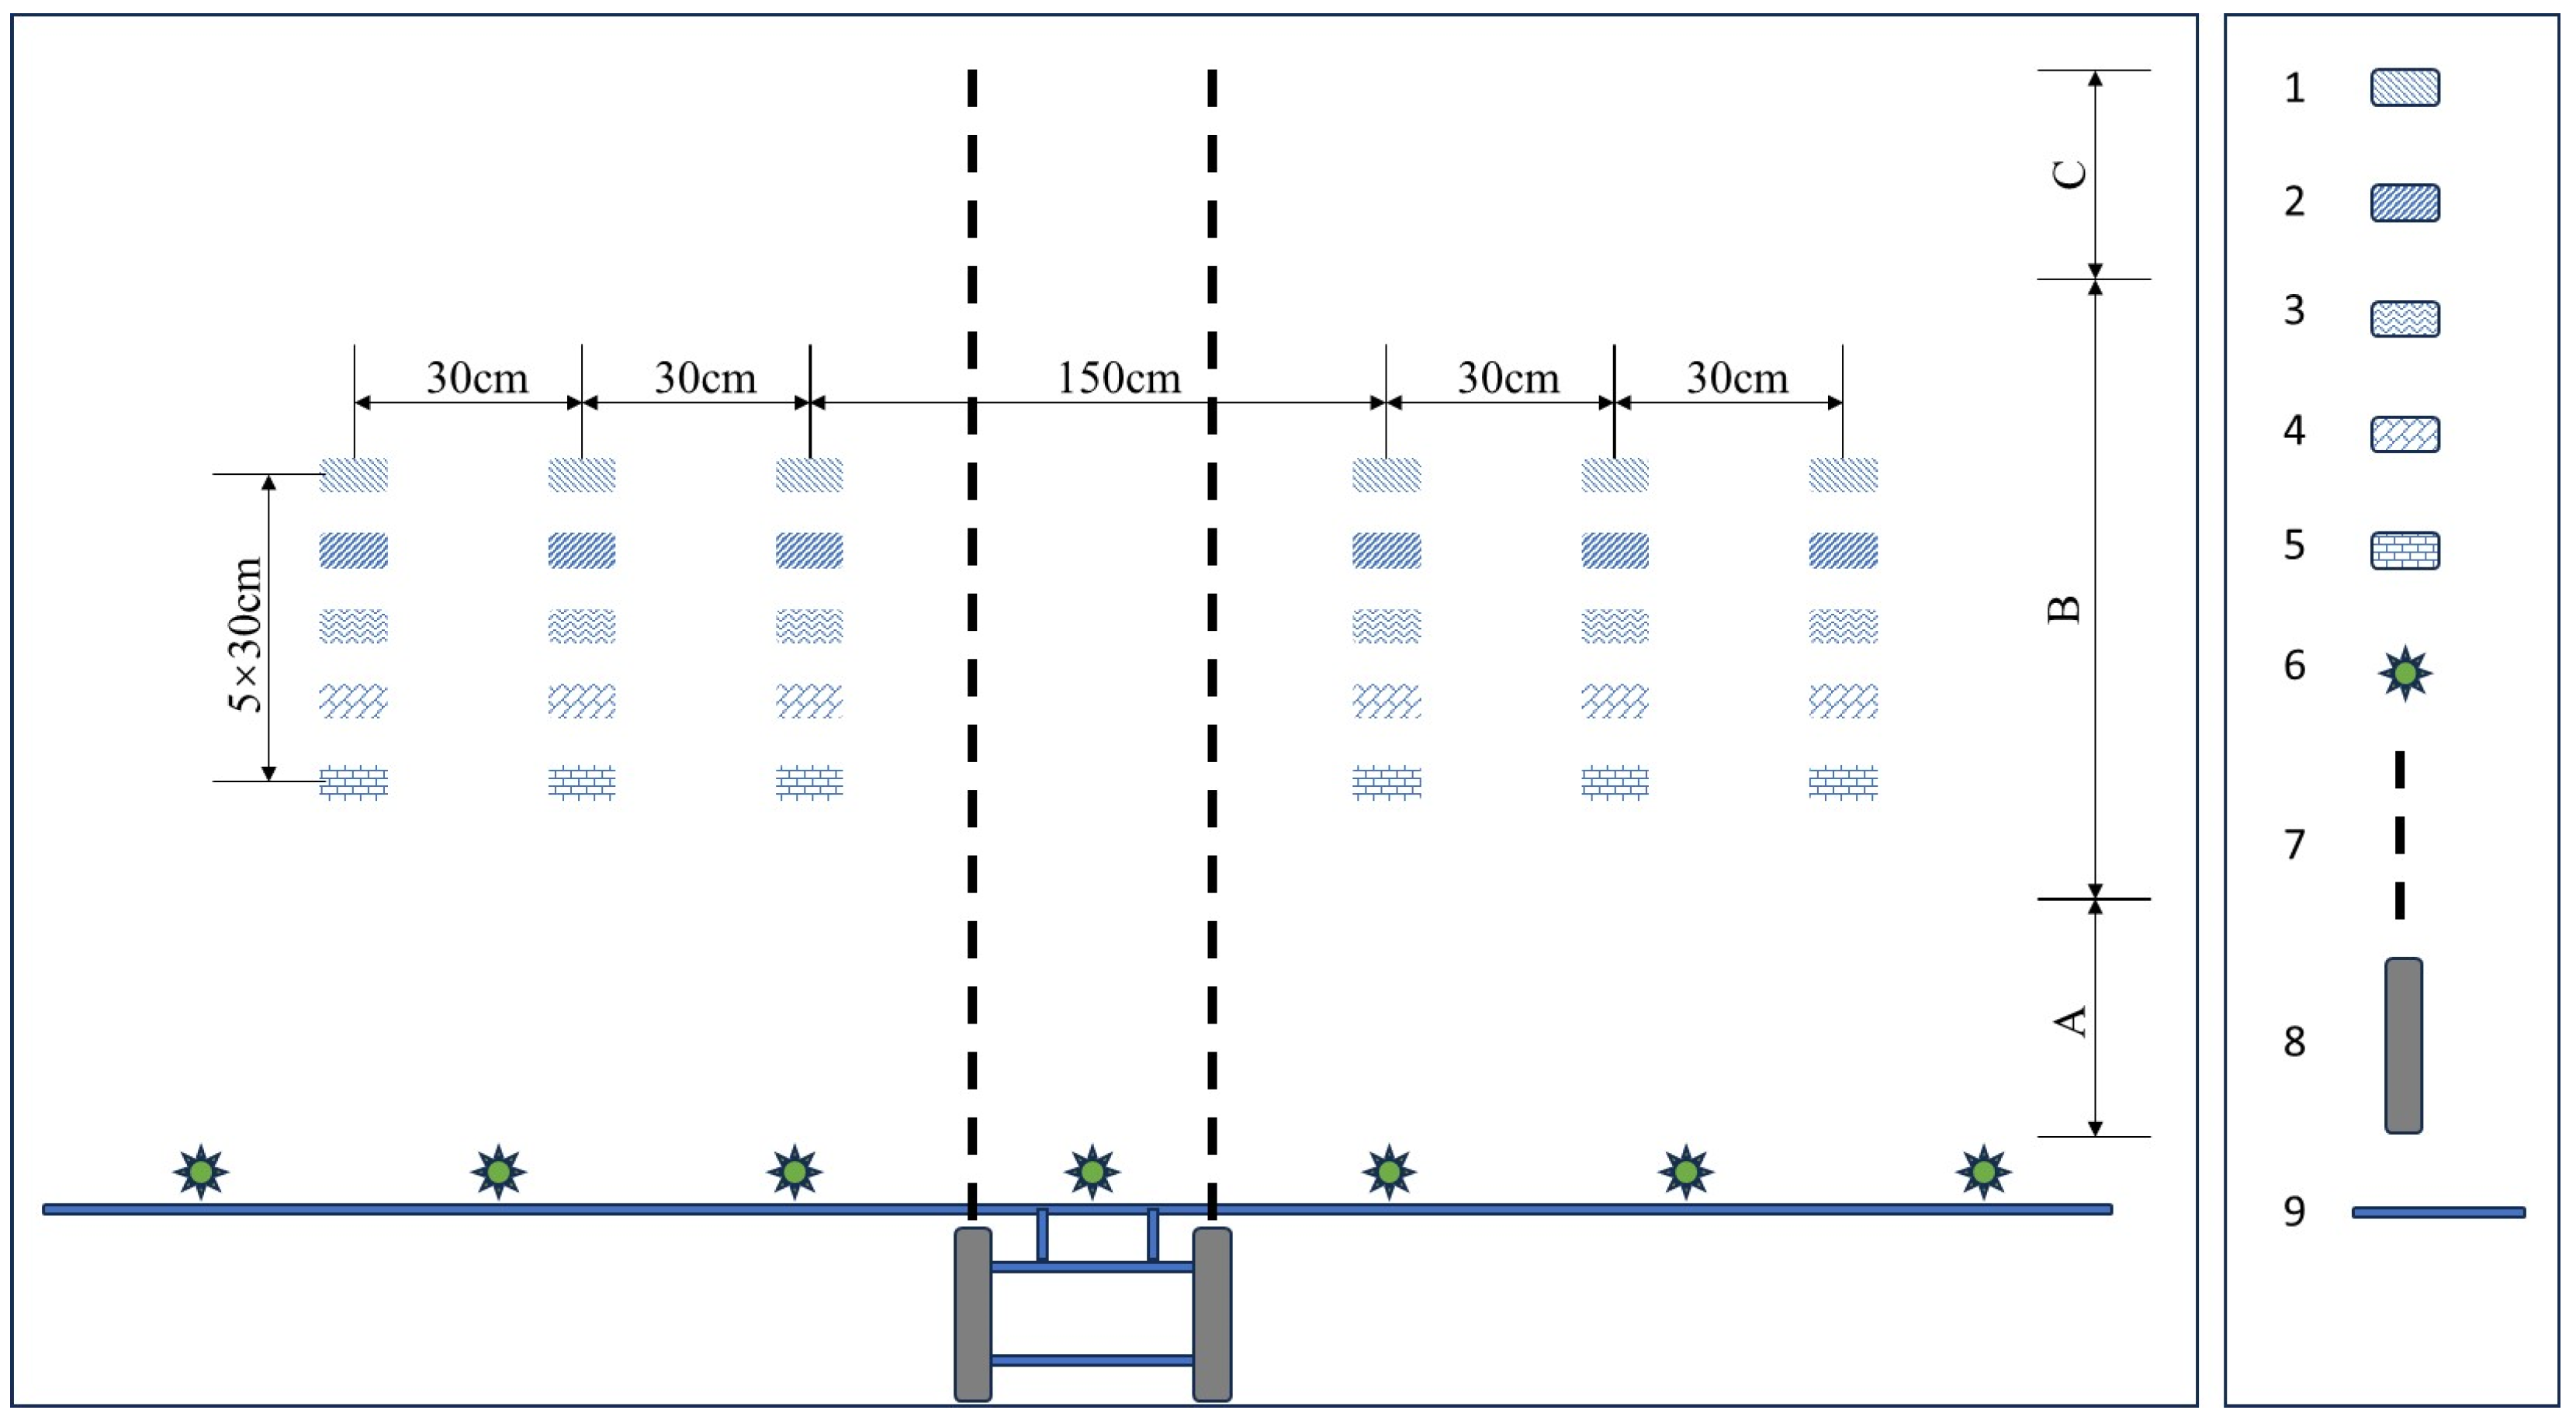
2.2. Droplet Collection Test Design and Deposition of Different Droplet Collectors

The spray tests utilized two types of nozzles: the conventional flat fan nozzle LU 12002 (Lechler, Metzingen, Germany) and the air-induction nozzle IDK 12002 (Lechler, Metzingen, Germany), representing fine and coarse droplets, respectively. Operating under a pressure of 1.5 bar and a travel speed of 2 m s−1, the spray volume was recorded at approximately 96 L ha−1. This volume falls within the low-volume spraying range of 40 to 200 L ha−1.
Ambient conditions during the tests were monitored using an anemometer (DLY-1603A, DELIXI, Shanghai, China), recording a wind speed of 0.1 m s−1, a temperature of 12.5 °C, and a relative humidity of 65%. The spraying operation employed a boom sprayer with droplet collectors mounted on an aluminum frame for droplet capture. Five types of collectors were utilized: WSP (75 × 25 mm, Syngenta, Basel, Switzerland), KP (80 × 30 mm, Deli, Zhejiang, China), PVCC (80 × 59 mm, Wewin, Chongqing, China), CPP (60 × 40 mm, Wewin, Chongqing, China), and SP (60 × 40 mm, Wewin, Chongqing, China). These collectors were arrayed linearly, spaced 30 cm apart, perpendicular to the sprayer’s trajectory. The vehicle accelerated over 500 cm to ensure that the sprayer passed through the collection area at a consistent speed, allowing a uniform droplet collection. The different collectors were arranged in parallel at an interval of 30 cm (Figure 1).
Ponceau 4R (Maximum absorption wavelength 508 nm ± 2 nm), chosen for its excellent light resistance, water solubility, and efficiency in reagent usage, thus conserving time and labor costs [30], was used as a tracer during spray application. A stock solution of Ponceau 4R was prepared at a concentration of 1.5 g L−1. The sprayer was meticulously calibrated, setting the nozzle 50 cm above the collectors. Post-spraying, the samples were allowed to dry; then, they were affixed to blue cardboard and stored away from light.

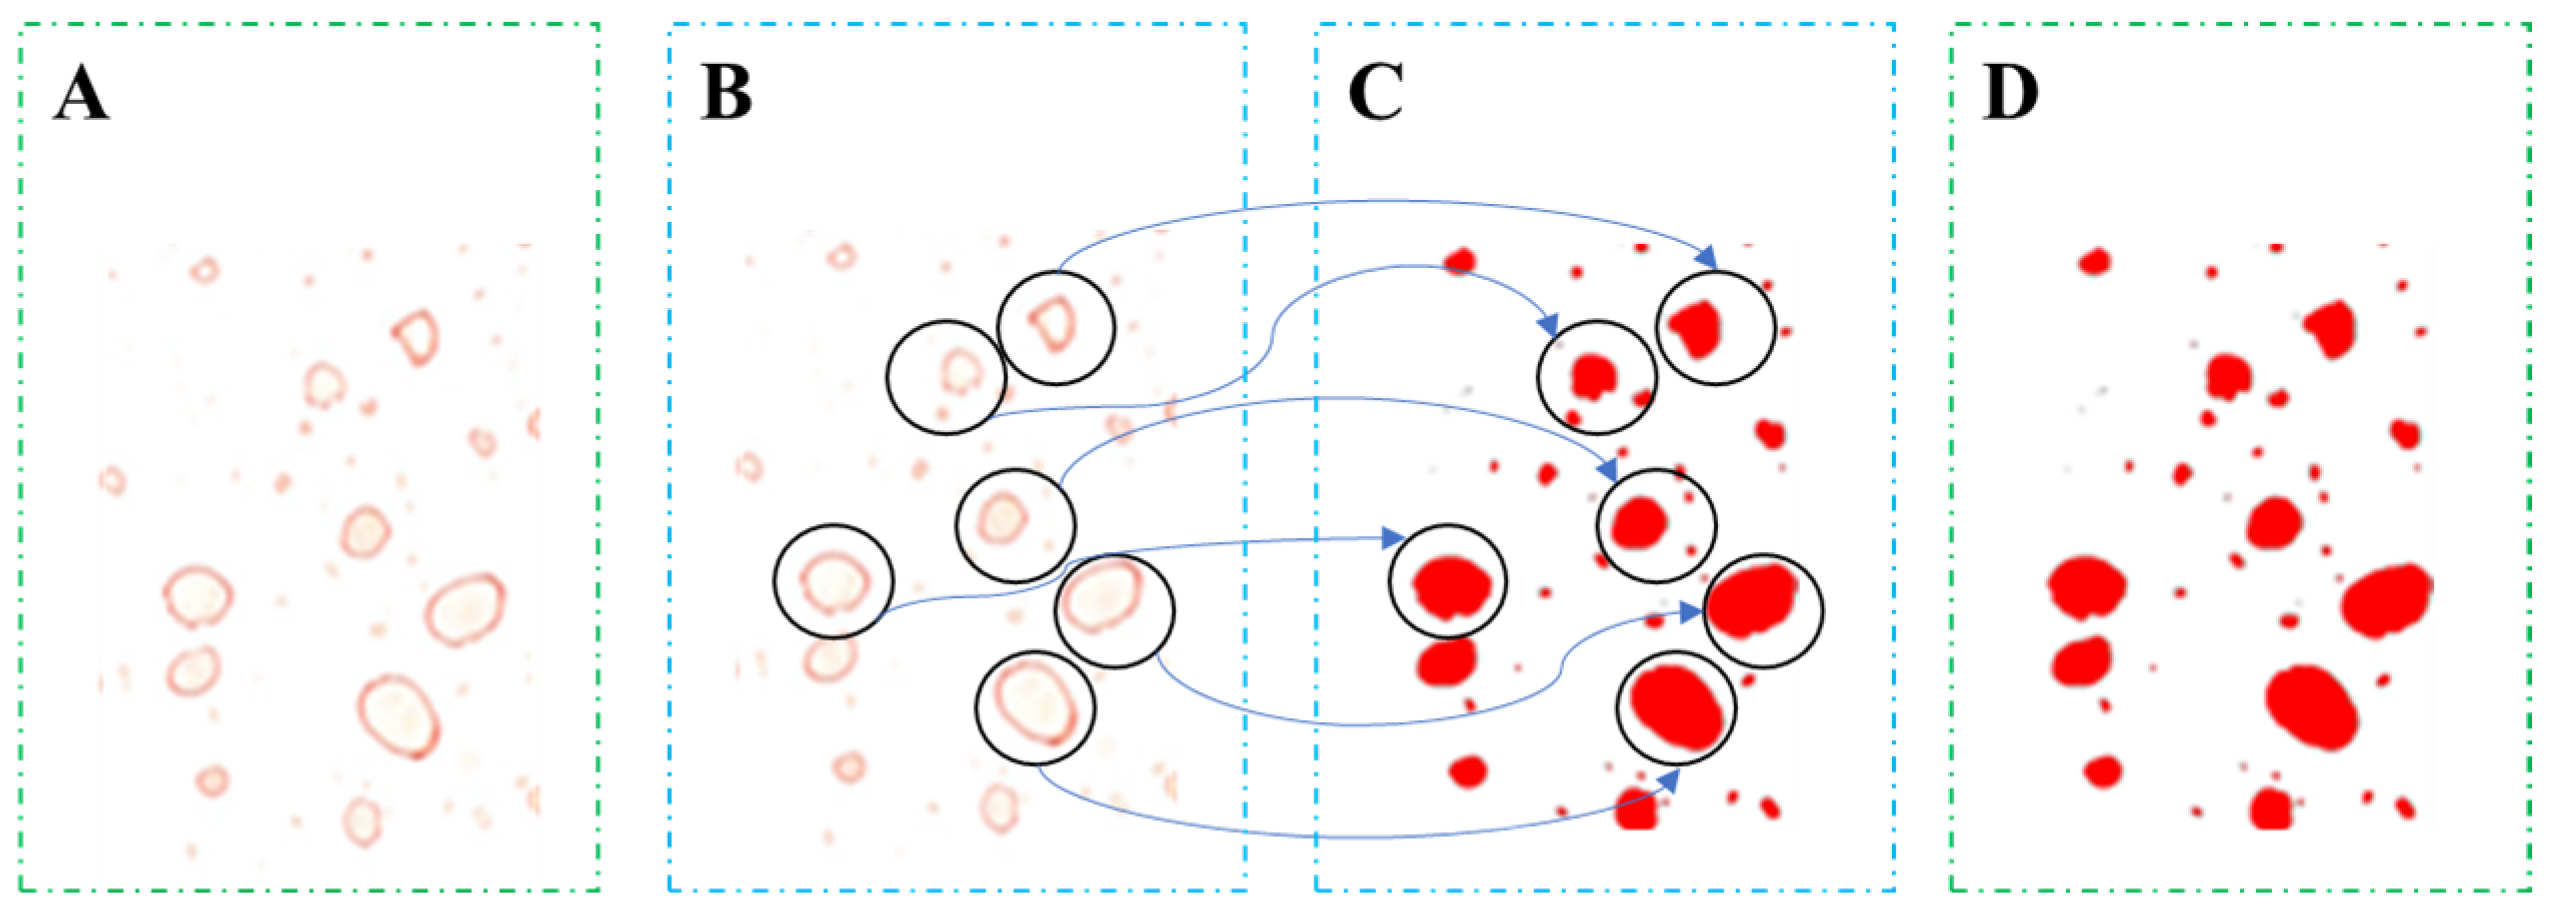
2.3. Analytical Methods

The droplet was scanned using Depositscan version 1.2 [31] with a resolution of 600 ppi. Subsequently, ImageJ version 1.6.0 [32] was employed for measuring droplet density, droplet coverage, and estimating deposition. These parameters are pivotal in the assessment of spray performance. When coffee ring effects (caused by the radial flow of suspended or dissolved solutes from the center to the edge of the droplet due to the fixed edge of the droplet) were evident in the scanned images of certain droplet collectors, the color threshold was modified to compensate for these rings, thereby enhancing the accuracy of the data (Figure 2).
Two methodologies were implemented to compute the deposition for five types of droplet collectors in this experiment. ImageJ version 1.6.0 was utilized for analyzing the collectors and estimating deposition post-image scanning. For collectors amenable to elution, deposition measurement was executed through enzyme calibration (Bio-Rad, Hercules, CA, USA) subsequent to elution.
This process involved diluting the stock solution by a factor of 100 and then employing 10 mL of deionized water to rinse off the Ponceau 4R from the filter paper. Here, 200 μL of the eluate was used to measure absorbance in a 96-well plate. Previous studies indicated that CPP and PVCC achieved a recovery rate exceeding 95%. In contrast, SP exhibited a lower recovery rate due to incomplete elution, while KP and WSP were not amenable to elution. Consequently, only for CPP and PVCC, deposition measurement was performed using both image analysis and the elution method.
The deposition calculation formula is as follows:
V C = V W × F L C C L × F L C
F L C : the fluorescence intensity of the diluted mother solution; F L : the fluorescence intensity of the diluted mother solution; C C L : the dilution factor of the mother solution; V C : the amount of liquid medication deposited on the collector; V W : the volume of eluent used for washing.

3. Result

3.1. Contact Angle and Surface Free Energy of Different Collectors

Table 1 delineates the contact angles and their cosines for five types of collectors when using deionized water and DMSO. The static surface tensions of deionized water and DMSO were determined to be 71.34 mN m−1 and 39.82 mN m−1, respectively. Moreover, the surface tension of the Ponceau 4R solution was recorded at 70.98 mN m−1. After the addition of Maifei and Kendo adjuvants, the surface tensions altered to 32.33 mN m−1 and 52.26 mN m−1, respectively.
The cosine values of contact angles for the five droplet collectors were plotted against the respective liquid’s surface tension, and curves were fitted accordingly. The surface free energy was computed when the contact angle cosine value was one. These findings are presented in Table 2, which includes values calculated using both models.
From Table 2, when the liquid was deionized water, the contact angles of the five different droplet collectors were compared, resulting in PVCC > CPP > SP > WSP > KP. The contact angles results showed that KP had the highest hydrophilicity; when KP was used, the ponceau 4R solution could spread out to the greatest extent, while PVCC displayed the poorest hydrophilicity, and the ponceau 4R solution did not spread out well on its surface.
Furthermore, the surface free energy of several types of droplet collectors was calculated using the Zisman model and the OWRK model. According to the Zisman model, the surface free energy of SP was the lowest at only 27.26 mN m−1. The higher the surface free energy, the more liquid can be wetted and spread on the surface of the material, and the better the hydrophilicity should be. However, a discrepancy was observed between the contact angle results and the inferred hydrophilicity from the surface free energy, casting doubt on the Zisman model’s accuracy.
The OWRK model’s calculations for surface free energy diverged from the Zisman model’s, yielding values of 35.11, 48.38, and 39.95 mN m−1 for SP, KP, and WSP, respectively. The OWRK model’s sequence for surface free energy values was PVCC < CPP < SP < WSP < KP, aligning perfectly with the hydrophilicity rankings deduced from contact angle measurements.

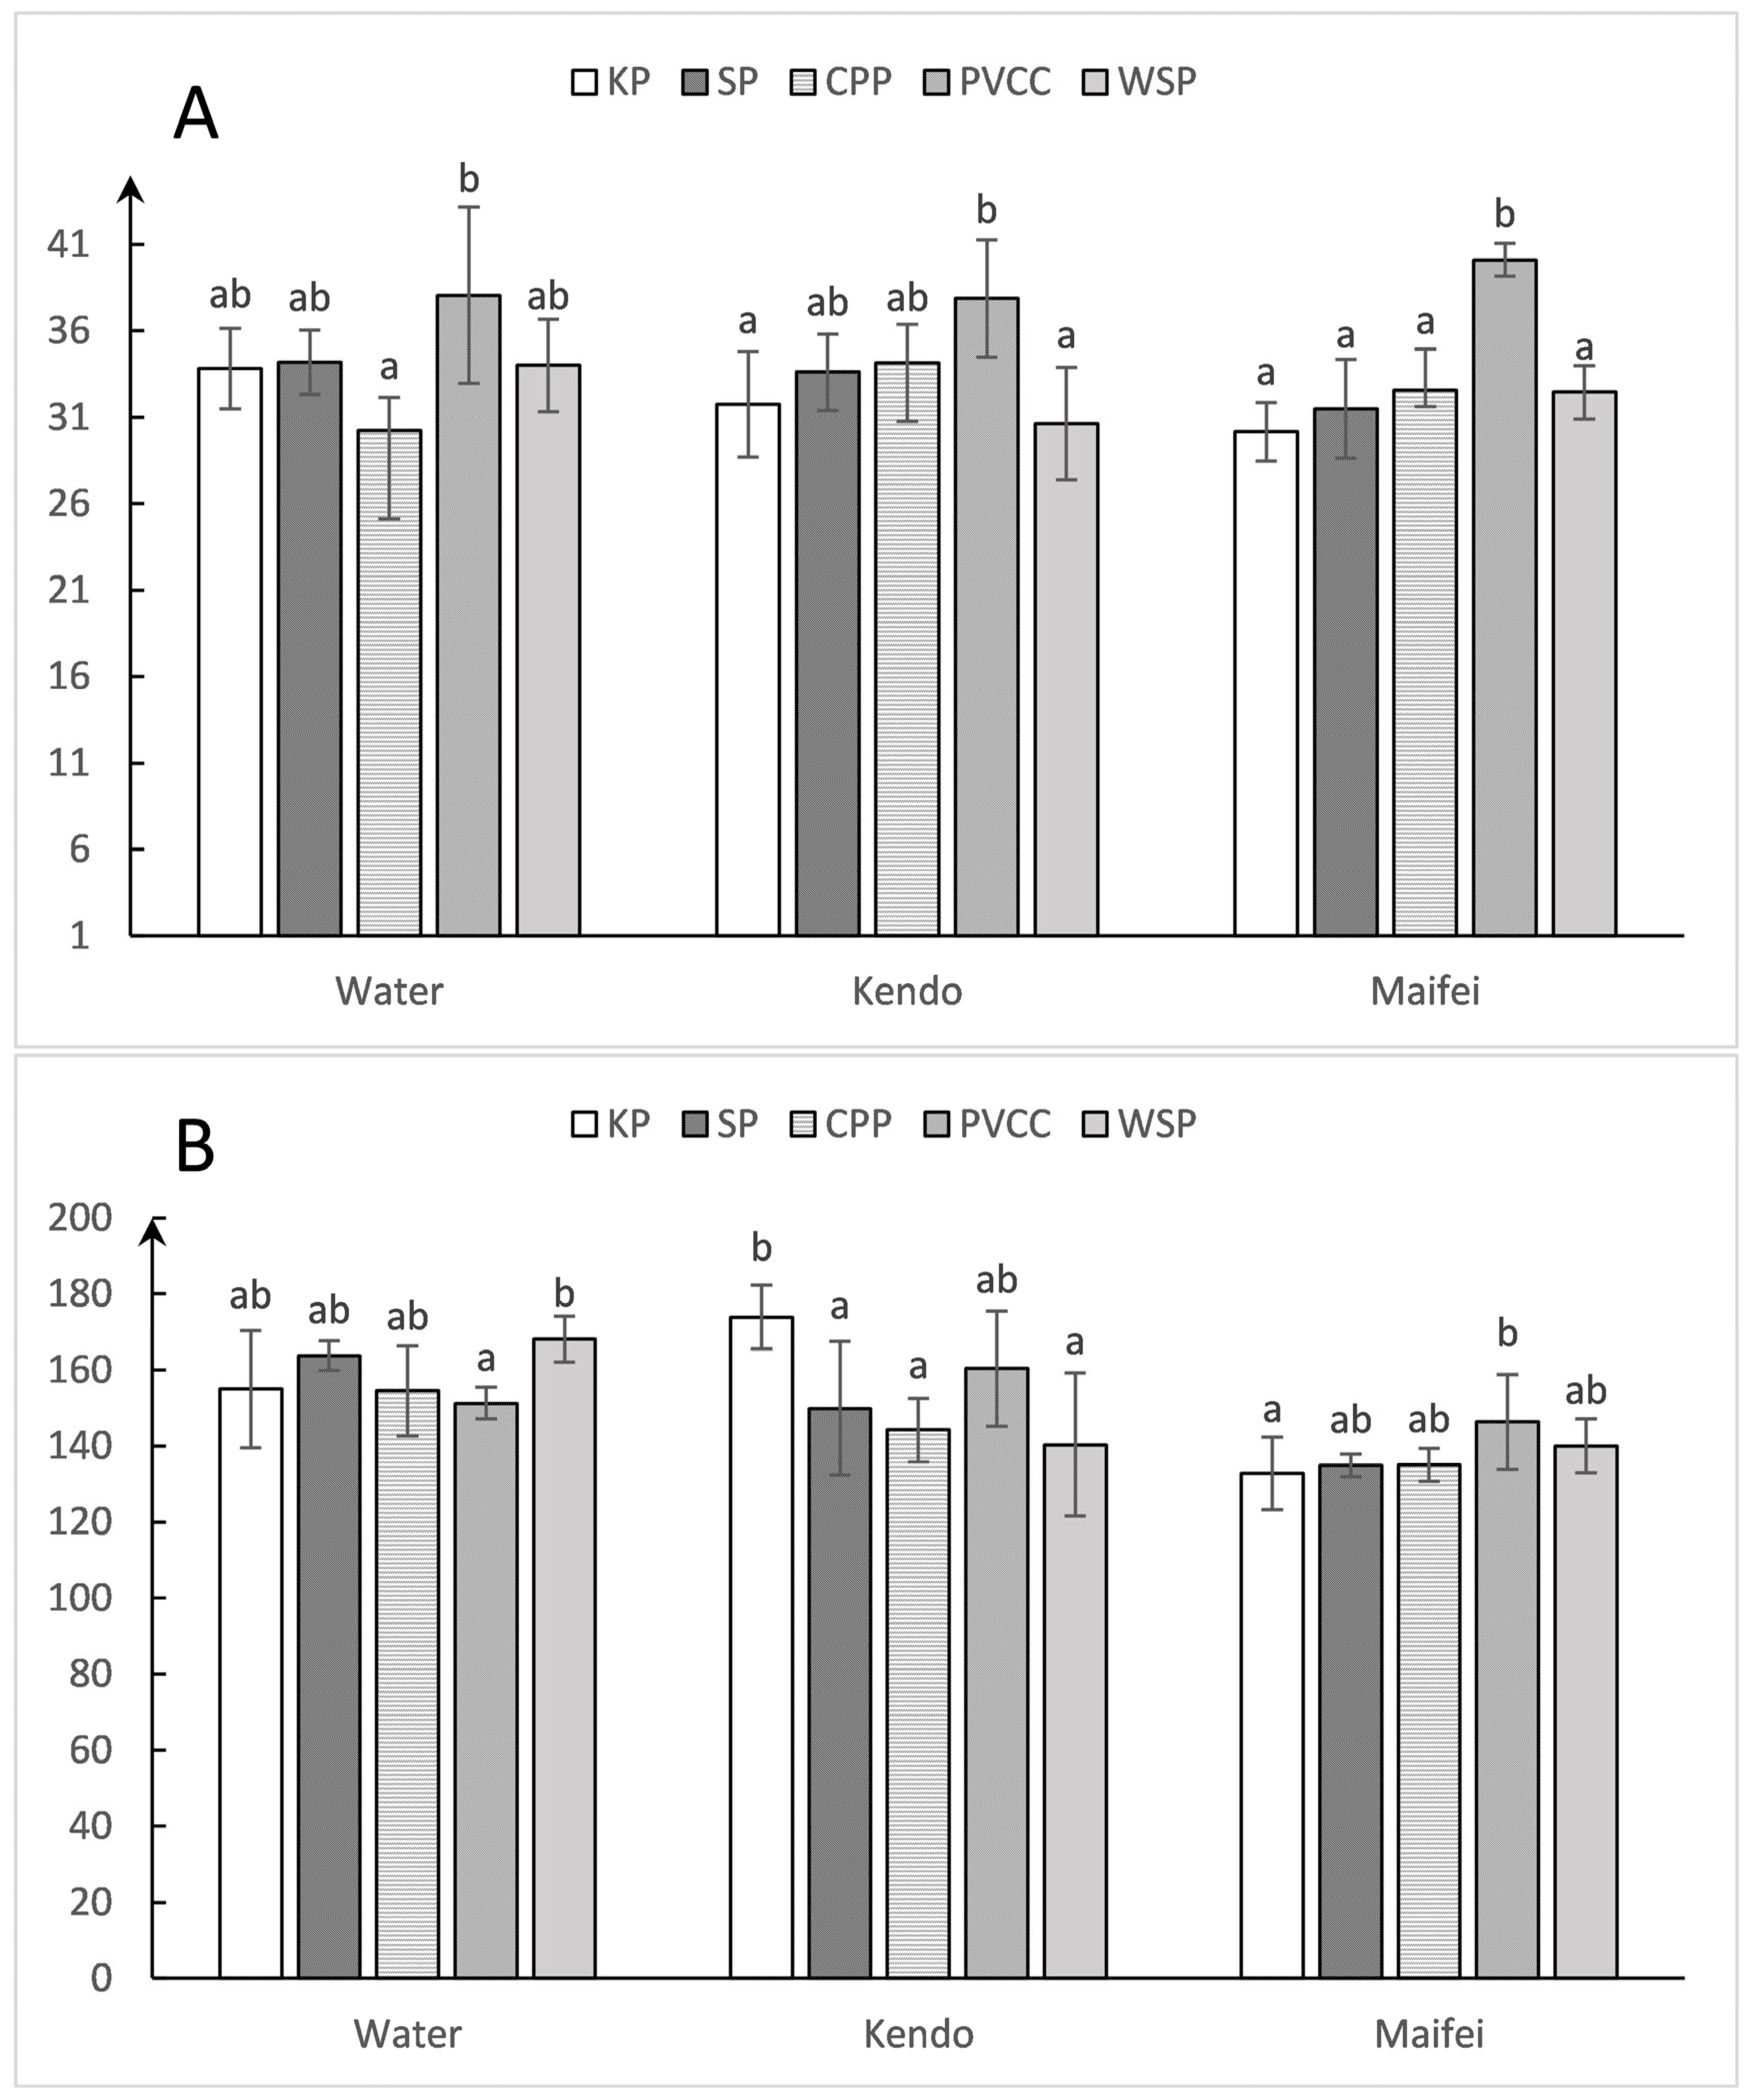
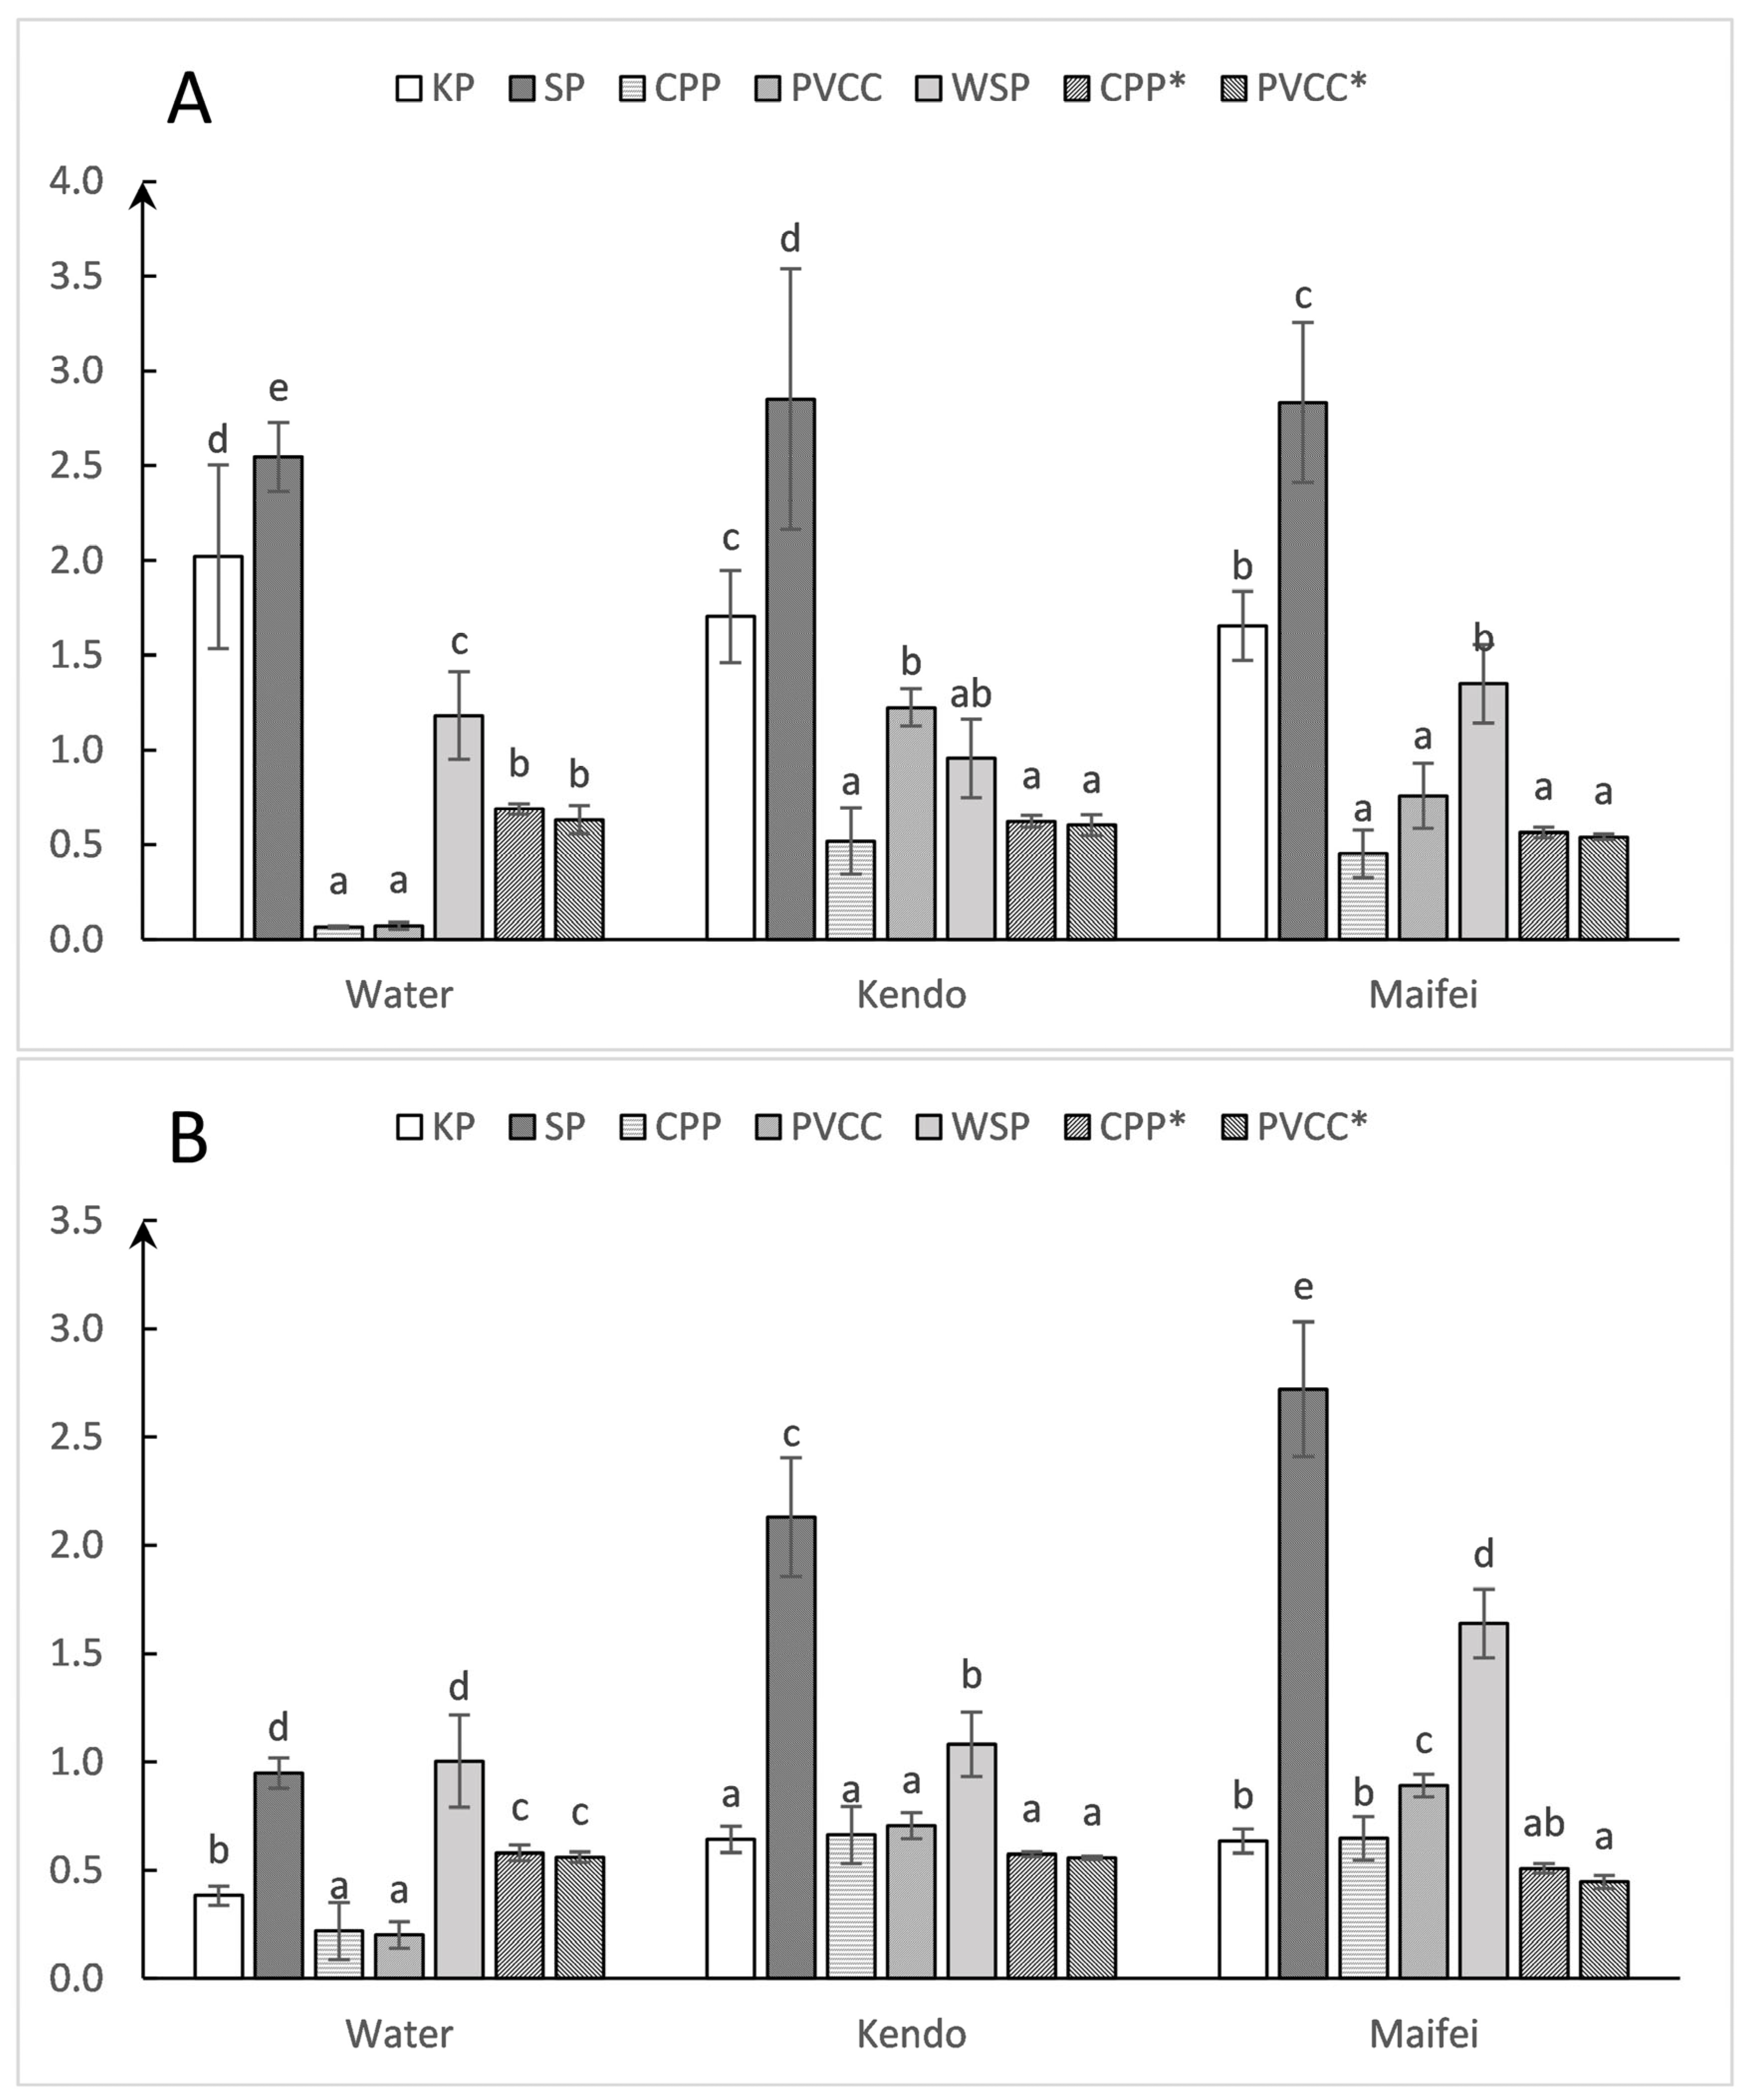
3.2. Differences in Droplet Density among Collectors

Figure 3 illustrates the droplet density outcomes for collectors composed of different materials. ANOVA was applied to the droplet density data acquired using both fine and coarse droplet nozzles.
The analysis revealed that when employing the IDK 12002 nozzle, droplet densities for water and solutions with added Kendo and Maifei adjuvants consistently ranged between 30 and 40 droplets per cm−2. Notably, all three liquids resulted in significantly elevated droplet densities on PVCC, yielding densities of 38, 38, and 40 droplets cm−2 for water, Kendo, and Maifei solutions, respectively. For water, the droplet density result of CPP was 30 cm−2. Only CPP was significantly different from PVCC, and there was no significant difference between any of the other collectors. In solutions with Kendo or Maifei adjuvants, droplet density disparities among the collectors were not substantial, except for PVCC, which consistently exhibited higher densities.
When using the LU 12002 nozzle, the droplet density of different collectors for the three spray liquids was approximately 150 cm−2. The addition of the Maifei adjuvant marginally reduced droplet density. Contrasting with the IDK 12002 results, PVCC’s heightened droplet density was no longer pronounced. Specifically, using water as the spray liquid, a significant discrepancy was only observed between WSP and PVCC. With the Kendo adjuvant, KP stood out with a notably higher droplet density of 174 cm−2, distinguishing it from other collectors significantly. With the Maifei adjuvant, the significant difference was only between PVCC and KP, with PVCC recording a droplet density of 146 cm−2.

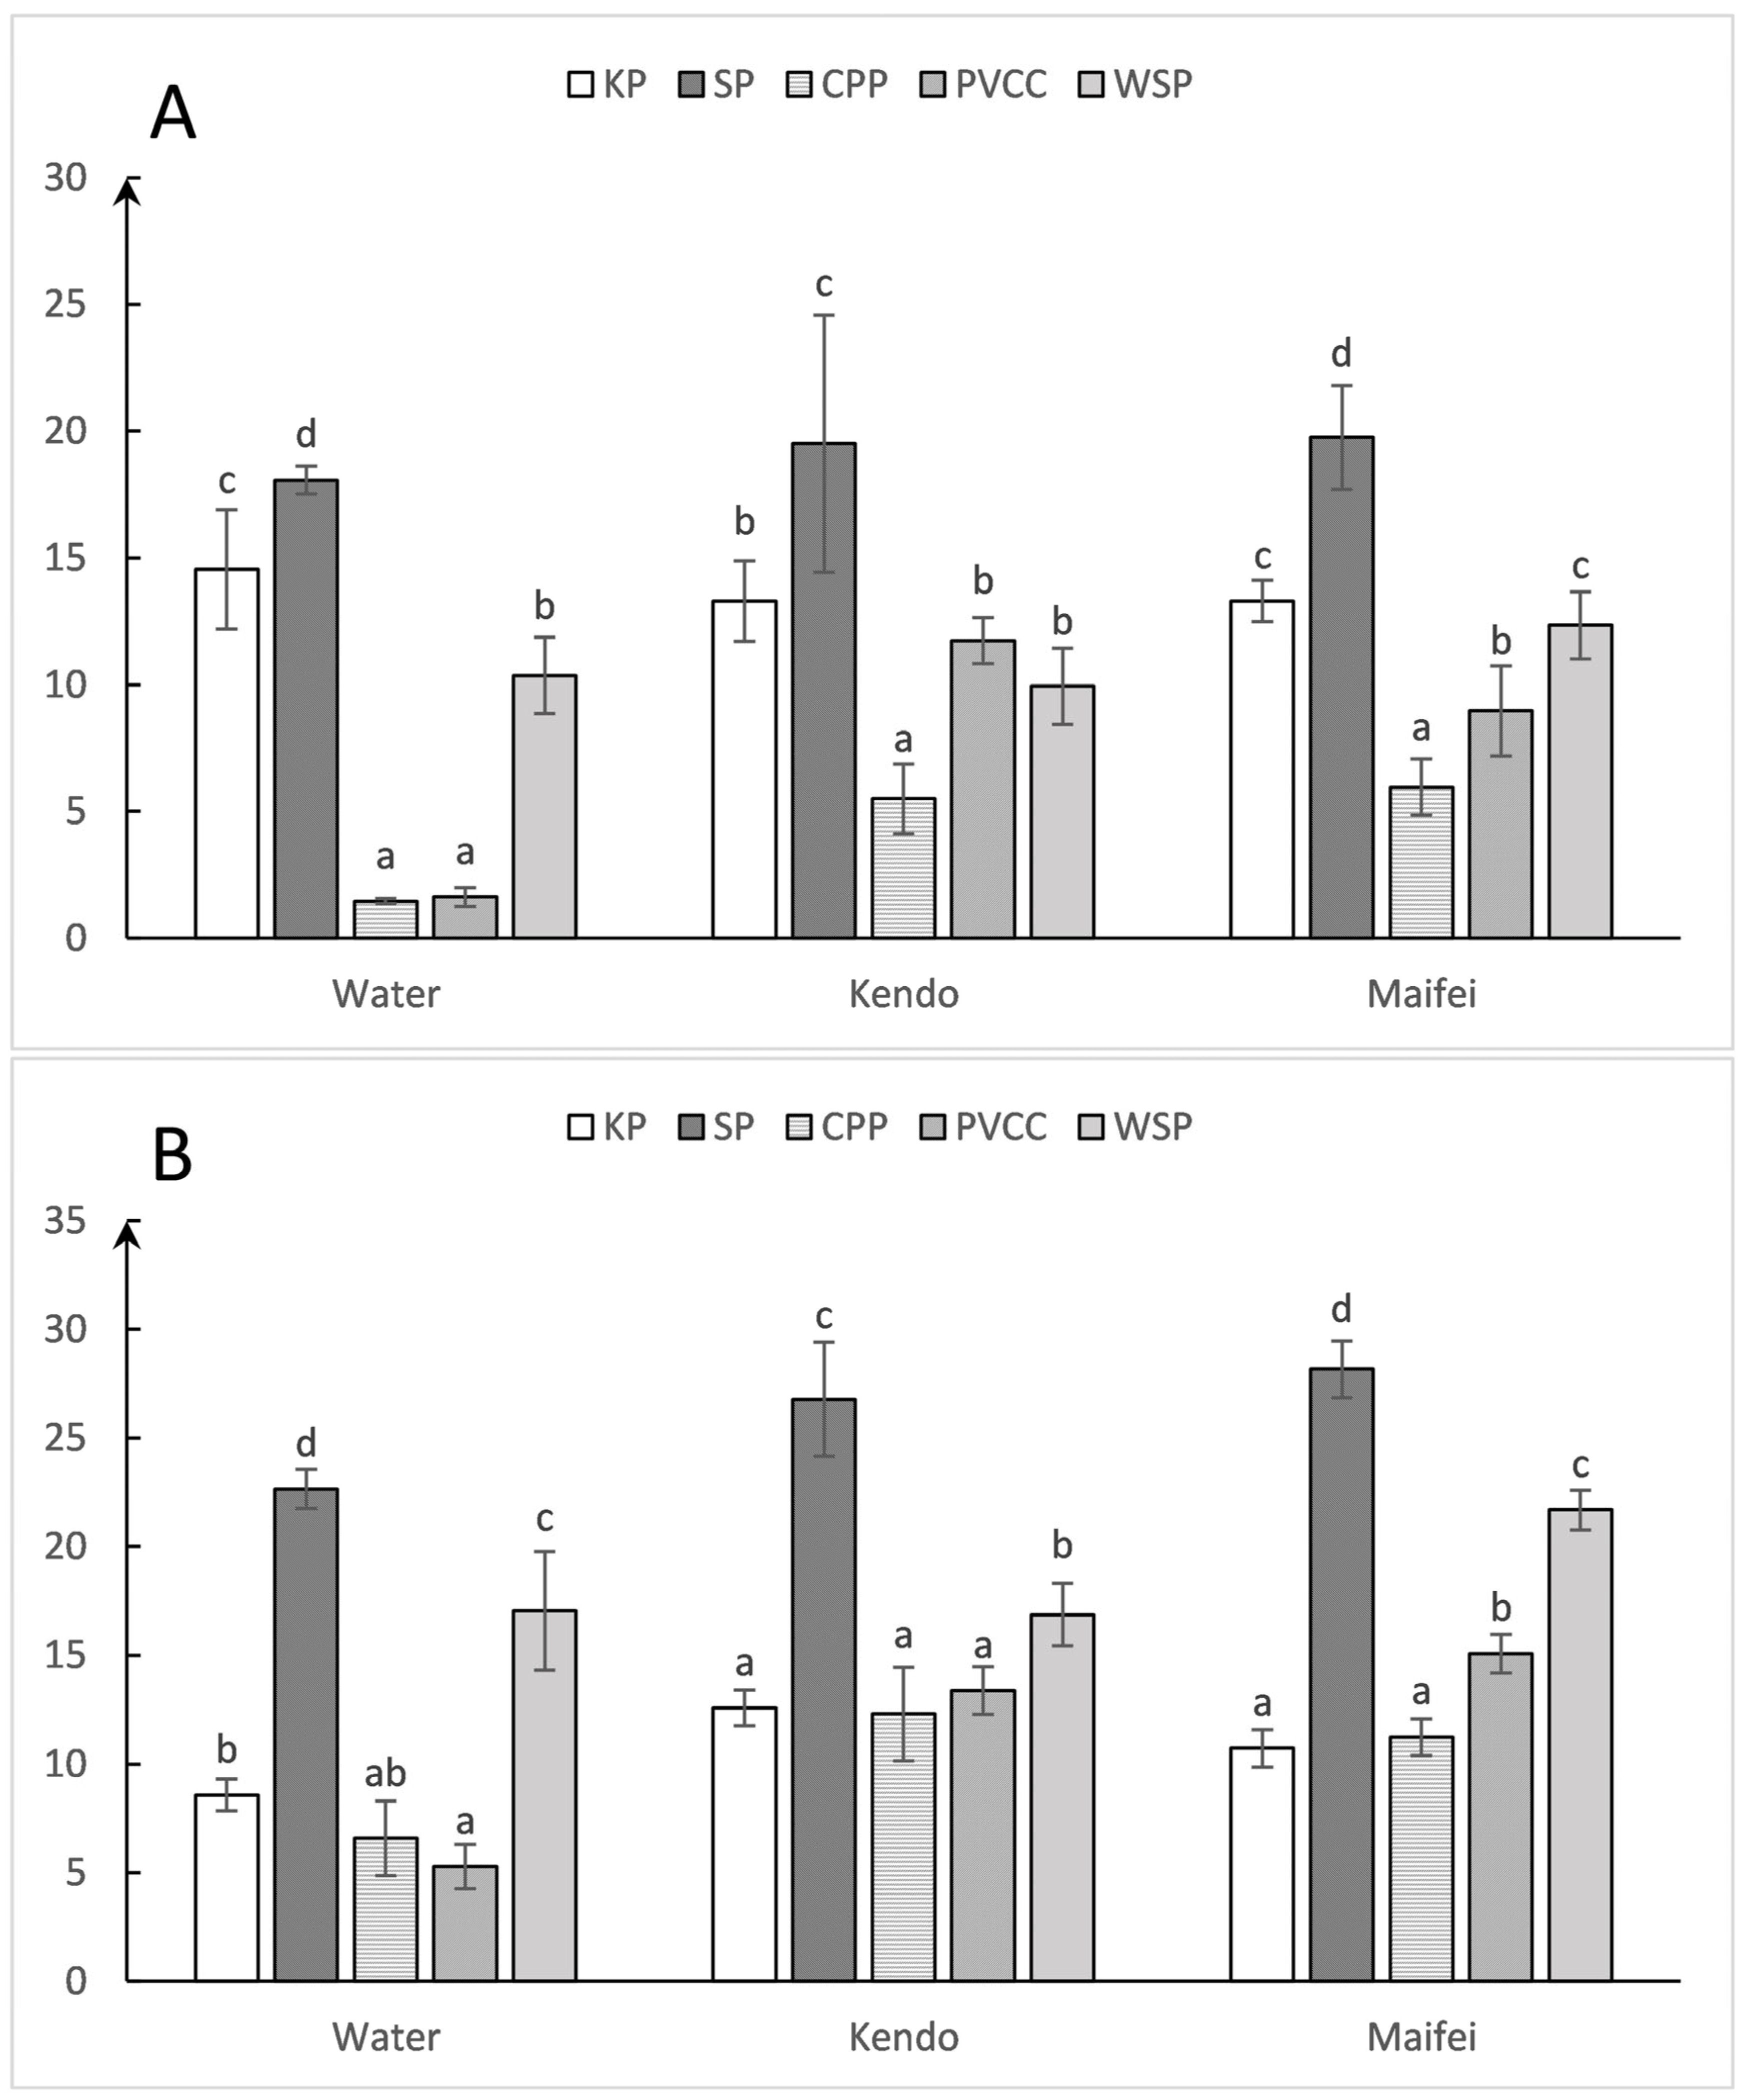
3.3. Differences in Droplet Coverage among Collectors

Figure 4 presented the coverage outcomes for the five droplet collectors.
The results in Figure 4 indicated that when using the IDK 12002 nozzle, the droplet coverage of SP was significantly higher than other collectors. When utilizing water, Kendo, and Maifei adjuvants, SP’s coverage rates were 18.1%, 19.5%, and 19.8%, respectively. For water as the spray liquid, WSP’s average coverage was 10.4%. There were no significant differences in the coverage between PVCC and CPP, but their values were considerably lower than those of other collectors. Notably, SP’s highest coverage rate of 18.1% marked a 74.0% increase over WSP. Even with the Kendo adjuvant, SP’s coverage remained significantly higher than that of other collectors. Significant variations were observed between CPP and all other collectors, while KP, WSP, and PVCC did not exhibit notable coverage differences. With the addition of the Maifei adjuvant, only KP was not significantly different from WSP, while all other collectors were significantly different from each other.
When using the LU 12002 nozzle, the coverage of SP remained significantly higher, measuring 22.7%, 26.8%, and 28.2% for the three spray liquids, respectively. When using water, WSP’s coverage of 17.0% was significantly different from that of other collectors. The addition of Kendo adjuvant resulted in KP, CPP, and PVCC displaying similar coverage rates between 12.3% and 13.4%, which are markedly lower than with WSP and SP. With the Maifei adjuvant, only KP and CPP showed no significant coverage differences, whereas significant disparities were present among the rest of the collectors.

3.4. Differences in Droplet Deposition among Collectors

The deposition of the different droplet collectors was assessed using both image-scanning and elution methods. Figure 5 showcased the deposition results for the various collectors.
An ANOVA was conducted for the five types of droplet collectors. With the IDK 12002 nozzle and water as the spray liquid, the deposition on WSP, KP, and SP was markedly higher compared to CPP and PVCC. The elution deposition for CPP and PVCC was 0.69 μL cm−2 and 0.63 μL cm−2, respectively. With the addition of the Kendo adjuvant, the elution deposition values of CPP and PVCC were 0.62 μL cm−2 and 0.60 μL cm−2, respectively. KP and SP showed significantly higher deposition rates compared to other collectors. The addition of the Maifei adjuvant did not yield significant differences between the scanning and elution deposition results for CPP and PVCC. Across all three spray solutions, SP consistently exhibited significantly higher deposition rates compared to other collectors. For both CPP and PVCC, no notable differences were observed in deposition under identical treatments. However, deposition results derived from image scanning were significantly lower than those obtained through elution.
When the LU12002 nozzle was employed, the deposition of WSP and SP was significantly greater when water was utilized as the spray liquid. There were significant differences in elution and scanning deposition between CPP and PVCC. With the incorporation of the Kendo adjuvant, there were no significant differences between the deposition of KP and elution deposition. The elution depositions of CPP and PVCC, measured at 0.57 μL cm−2 and 0.56 μL cm−2, respectively, exhibited no notable variance in scanning deposition. Conversely, the introduction of the Maifei adjuvant markedly augmented the scanning deposition of PVCC, surpassing its elution deposition. SP’s deposition markedly outstripped those of the other collectors. The elution deposition values for CPP and PVCC were recorded as 0.51 μL cm−2 and 0.45 μL cm−2, respectively. Echoing the findings with the IDK 12002 nozzle, CPP and PVCC showed no significant differences in elution deposition, while SP’s deposition consistently surpassed that of other droplet collectors.

4. Discussion

4.1. Surface Free Energy

Section 3.1 highlighted the limitations of the Zisman model, notably its disregard for intermolecular dispersion forces and polar interactions in calculating the surface free energy of solid materials [26]. In contrast, the OWRK model amends this oversight by incorporating these factors into the Zisman model’s framework [33]. Consequently, this study’s estimation of surface free energy relied on the calculations provided by the OWRK model.
Field tests revealed variations in the surface free energy across different plant leaves [34], suggesting potential inaccuracies in spray effectiveness assessment when employing uniform droplet collectors. To mitigate this, we advocate for selecting droplet collectors that closely match the surface free energy of the target crop, ensuring a more precise evaluation. Previous studies by Gu et al. [35] and Toraman [34] calculated the surface free energy of various crop leaves, as shown in Table 3.
By comparing these values with the surface free energy of the droplet collectors utilized in this study, we can select droplet collectors that are more suited to specific crops. This approach enables a more precise representation of droplet wetting and spreading on crop surfaces. For instance, the surface free energy of KP aligns closely with that of eggplants. PVCC and CPP exhibit surface free energies akin to those of crops like Chinese cabbage and wheat, while SP’s surface free energy is comparable to that of cabbage. WSP’s surface free energy parallels that of crops such as Luffa cylindrica and soybeans. Thus, in conducting spray tests on these crops, the droplet collectors employed in this study can be effectively utilized.

4.2. Droplet Density

Droplet density is a critical metric for assessing the effectiveness of droplet deposition. Boina et al. [3] suggested using droplet density as auxiliary data in evaluating operational effectiveness. Hou et al. [36] utilized droplet density as a criterion to assess the effectiveness of using drones for optimizing citrus tree management. Similarly, Meng et al. [37] also considered droplet density as a measure to evaluate the improved efficiency of using drones for wheat aphid management, particularly focusing on the effectiveness of adding adjuvants to the spray solution in unmanned aerial vehicle spraying.
The study revealed that the variance in droplet density of droplet collectors with differing surface properties was marginal when spraying fine or coarse droplets. In other words, when different droplet collectors were used for testing, the surface characteristics of the collector did not affect the results when droplet density was used as the evaluation index. Therefore, droplet density emerges as a preferred indicator for assessing droplet collection and analyzing deposition effects [38].
It was worth mentioning that the droplet density of WSP and SP was generally small and not significantly different when spraying fine and coarse droplets. This was due to the fact that both WSP and SP have small contact angles and good hydrophilicity, allowing for better wetting and spreading of droplets on their surfaces, leading to droplet adhesion in both types of collectors (Figure 6). Furthermore, the surface of WSP undergoes a color reaction [39,40]. In addition to the simple wetting and spreading behavior of droplets on WSP, chemical reactions occur over time until the reaction is complete, which results in a smaller droplet density and larger droplet size after the image scanning. Additionally, droplets overlapping during spray operation also contribute to the severe adhesion of droplets in both cases.

4.3. Coverage

Droplet coverage serves as a critical metric for assessing the quality of pesticide application. The use of various materials in droplet collectors, each with distinct surface free energy, can influence droplet wetting and spreading on the collectors. This variance significantly impacts the droplet coverage rates captured in scanned images. The droplet collector’s hydrophilicity directly correlates with the completeness of droplet wetting and spreading, consequently affecting the coverage rate obtained post-scanning.
Presently, the majority of coverage detection methodologies employ WSP [21,41], although some opt for KP [19] for image processing and the calculation of droplet coverage rates. Grella et al. [42] studied the effectiveness of using various spray volumes in vineyards with a pulse width modulation (PWM) sprayer, focusing on droplet density and coverage to evaluate the spray’s performance against the system’s duty cycle and the sprayer’s speed. In a similar vein, Shan et al. [43] investigated how the size and volume of droplets affected the success of herbicide application in wheat fields, using Unmanned Aerial Vehicles (UAVs). They used droplet coverage and density as key measures for assessment. Additionally, Qi et al. [38] emphasized the importance of droplet density and coverage in evaluating the effectiveness of spraying, particularly when studying how UAVs’ operational settings impact droplet deposition on trellised pear orchards.
In terms of coverage outcomes, PVCC and CPP demonstrated significantly reduced coverage compared to the other three droplet collectors. This discrepancy is intimately linked to the coffee ring effect [44], which is a phenomenon where suspended or dissolved solutes migrate radially from the droplet’s center to its periphery due to the fixation of the droplet’s edge [45]. The central region of droplets exhibiting the coffee ring effect appears lighter, potentially leading to inaccurate assessments of coverage and deposition in ImageJ. In this study, the color threshold of the images was meticulously adjusted using ImageJ to mitigate the influence of the coffee ring effect.
The coverage was still low for both droplet collectors even after adjusting the image thresholds, which is due to their large contact angles and suboptimal hydrophilicity. This resulted in a diminished diffusion of spray droplets on these collectors, manifesting in notably lower scanned coverage and deposition. The overestimation of SP coverage was due to its lower surface free energy, making droplets more prone to spreading and consequently leading to an inflated coverage measurement. Therefore, the experimental results implied that the use of droplet coverage as an evaluation metric may have some impact on the results due to the use of different droplet collectors. The varying hydrophilicity of droplet collector surfaces necessitates the selection of collectors with appropriate surface properties to ensure an accurate assessment of spray quality using droplet coverage. Hence, droplet coverage should be regarded as a secondary evaluative indicator alongside droplet density. For more precise droplet coverage testing, it is crucial to account for the surface free energy variations among different target crop leaves or to conduct direct scanning of the target leaves for coverage assessment.

4.4. Deposition

Yang et al. [46] assessed the spray efficacy of a self-propelled boom sprayer in rice paddies, identifying deposition as a key evaluative metric. Similarly, Wu et al. [47] focused on spray deposition in greenhouse eggplant canopies, using it as the primary evaluation parameter. Hong et al. [48] simulated the spray application of pesticides in an apple orchard using CFD and studied tree deposition and non-target loss where deposition was the only evaluation indicator for spray effectiveness.
However, the accuracy of image scanning methods for analyzing deposition test results was questionable. The deposition values obtained through the elution method significantly differed from those acquired by the scanning method regardless of whether the IDK12002 or LU12002 nozzle was used. Given the inaccuracy of measuring deposition with the scanning method, deposition is not considered a reliable indicator of droplet evaluation if evaluating the spray effect by scanning the droplet collector.
As pointed out by Zhu et al. [49], the area coverage of WSP consists of two-dimensional data, while spray deposition contains three-dimensional data. When droplet overlap is severe, WSP cannot accurately evaluate spray deposition. Munjanja et al. [10] also believed that WSP, as a paper-based droplet collector, can only qualitatively evaluate deposition.
To conclude, it was found that the results analyzed by image scanning were not accurate enough to replace the use of the elution method when testing for deposition. However, when the droplet coverage was less than 30% and there was little droplet overlap [49], WSP can be used to quantify deposition. When using a droplet collector, deposition was not a good indicator of spray effectiveness. Deposition, as three-dimensional data, was converted into a two-dimensional area coverage data by image scanning, ignoring many actual sedimentation issues such as droplet overlap. Furthermore, droplet sedimentation, greatly influenced by the surface tension of crop leaves, means that sedimentation data derived from image scanning with droplet collectors may not accurately reflect or serve as a reliable evaluation index.

5. Conclusions

This study assessed the influence of various droplet collectors on droplet evaluation metrics, employing different spray liquids. The results showed that the surface free energy was different for different droplet collectors. During spray operations, using different droplet collectors for droplet assessment results in varying impacts on droplet density, coverage, and deposition. Additionally, the incorporation of adjuvants markedly influenced the surface tension of the liquids. The study employed water and water mixed with two commonly used adjuvants, aiming to determine whether the conclusions hold true for spray liquids with different surface tensions. The results confirmed that alterations in surface tension do influence droplet test outcomes. However, the trend of these changes remained consistent across all five collectors. In other words, the conclusions drawn from the experiments hold true for different commonly used spray liquids. Notably, a decrease in surface tension led to a relatively stable droplet density and an increase in droplet coverage.
The measured surface free energy of the five droplet collectors facilitated the selection of collectors with surface energies akin to the target spray surface. This allowed for a more realistic assessment of spraying effectiveness and reflected the state of wetting and spreading of droplets on the crop surface.
Droplet density emerged as a critical metric for assessing spray effectiveness given its relative insensitivity to the surface characteristics of the collectors. Droplet coverage, influenced by the varying wetting and spreading capabilities of different collectors due to disparate contact angles, should serve as a secondary metric. For instance, utilizing PVCC and CPP as droplet collectors could yield unreliable results due to their specific surface properties.
When droplet coverage is below 30% and droplet overlap is minimal, WSP could quantify deposition. However, it is crucial to acknowledge that the area coverage determined via image scanning represents merely two-dimensional data. The complexity of estimating the depth of droplet penetration makes it challenging to accurately calculate three-dimensional deposition. Consequently, using droplet collectors for evaluating deposition metrics derived from image scanning is not advisable.

Author Contributions

Conceptualization, M.H., P.Q., L.H. and X.H.; methodology, M.H., P.Q. and L.H.; software, L.H.; validation, M.H., P.Q. and L.H.; investigation, M.H., P.Q., L.H. and X.H.; writing—original draft preparation, M.H and P.Q.; writing—review and editing, M.H., P.Q., L.H. and X.H.; supervision, X.H.; funding acquisition, X.H. All authors have read and agreed to the published version of the manuscript.

Funding

Supported by the earmarked fund for China Agriculture Research System (CARS-28), the 2115 talent development program of China Agricultural University and Sanya Institute of China Agricultural University Guiding Fund Project, Grant No. SYND-2021-06, and Deutsche Forschungsgemeinschaft (DFG, German Research Foundation)-328017493/GRK 2366 (Sino-German International Research Training Group AMAIZE-P).

Data Availability Statement

Data is contained within the article.

Acknowledgments

Many thanks to Leon Oehme from the University of Hohenheim for correcting the grammar of the manuscript.

Conflicts of Interest

The authors declare no conflicts of interest.

References

  1. He, X. Research and Development of Efficient Plant Protection Equipment and Precision Spraying Technology in China: A Review. J. Plant Prot. 2022, 49, 9. [Google Scholar]
  2. Malneršič, A.; Dular, M.; Širok, B.; Oberti, R.; Hočevar, M. Close-Range Air-Assisted Precision Spot-Spraying for Robotic Applications: Aerodynamics and Spray Coverage Analysis. Biosyst. Eng. 2016, 146, 216–226. [Google Scholar] [CrossRef]
  3. Boina, D.R.; Salyani, M.; Tiwari, S.; Pelz-Stelinski, K.; Stelinski, L.L. Spray Droplet Size Affects Efficacy of Fenpropathrin against Asian Citrus Psyllid. In Proceedings of the ASTM Special Technical Publication, Tampa, FL, USA, 1–3 November 2011; Volume 1558 STP. [Google Scholar]
  4. Sciumbato, A.S.; Senseman, S.A.; Ross, J.; Mueller, T.C.; Chandler, J.M.; Cothren, J.T.; Kirk, I.W. Effects of 2,4-D Formulation and Quinclorac on Spray Droplet Size and Deposition 1. Weed Technol. 2005, 19, 1030–1036. [Google Scholar] [CrossRef]
  5. Ferguson, J.C.; Hewitt, A.J.; O’Donnell, C.C. Pressure, Droplet Size Classification, and Nozzle Arrangement Effects on Coverage and Droplet Number Density Using Air-Inclusion Dual Fan Nozzles for Pesticide Applications. Crop Prot. 2016, 89, 231–238. [Google Scholar] [CrossRef]
  6. ASABE S572.1; Spray Nozzle Classification by Droplet Spectra. American Society of Agricultural Engineers: St. Joseph, MI, USA, 2009.
  7. Chen, S.; Lan, Y.; Zhou, Z.; Ouyang, F.; Wang, G.; Huang, X.; Deng, X.; Cheng, S. Effect of Droplet Size Parameters on Droplet Deposition and Drift of Aerial Spraying by Using Plant Protection UAV. Agronomy 2020, 10, 195. [Google Scholar] [CrossRef]
  8. Yuan, H.; Ye, J.; Hu, X.; Fu, S.; Fang, Y. Numerical Simulation of Cyclone Extraction Element Based onpopulation Balance Model. Petrochem. Technol. 2017, 46, 7. [Google Scholar]
  9. Song, M.; Ju, J.; Luo, S.; Han, Y.; Dong, Z.; Wang, Y.; Gu, Z.; Zhang, L.; Hao, R.; Jiang, L. Controlling Liquid Splash on Superhydrophobic Surfaces by a Vesicle Surfactant. Sci. Adv. 2017, 3, e1602188. [Google Scholar] [CrossRef]
  10. Munjanja, B.K.; Naudé, Y.; Forbes, P.B.C. A Review of Sampling Approaches to Off-Target Pesticide Deposition. Trends Environ. Anal. Chem. 2020, 25, e00075. [Google Scholar] [CrossRef]
  11. Qiu, B.; Shi, C.; Wu, C.; Liu, B.; Tang, B. Analysis of Droplet Characteristics in Spray Field for Plant Protection Machinery and Reconstruction. Nongye Gongcheng Xuebao/Trans. Chin. Soc. Agric. Eng. 2005, 21, 7–10. [Google Scholar]
  12. Fox, R.D.; Derksen, R.C.; Cooper, J.A.; Krause, C.R.; Ozkan, H.E. Visual and Image System Measurement of Spray Deposits Using Water–Sensitive Paper. Appl. Eng. Agric. 2003, 19, 549–552. [Google Scholar] [CrossRef]
  13. Godyn, A.; Doruchowski, G.; Holownicki, R.; Swiechowski, W. A Method for Verification of Spray Volume Adapted to Crop Structure in Orchards. In Proceedings of the VIII Workshop on Spray Application Techniques in Fruit Growing, Barcelona, Spain, 29 June–1 July 2005. [Google Scholar]
  14. Jaeken, P.; Lootens, P.; Vandecasteele, P.; de Moor, M. Image Analysis of Water Sensitive Paper as a Tool for the Evaluation of Spray Distribution of Orchard Sprayers. Asp. Appl. Biol. 2000, 57, 329–342. [Google Scholar]
  15. Fritz, B.K.; Parker, C.; López, J.D.; Hoffman, W.C.; Schleider, P. Deposition and Droplet Sizing Characterization of a Laboratory Spray Table. Appl. Eng. Agric. 2009, 25, 175–180. [Google Scholar] [CrossRef]
  16. Tadić, V.; Marković, M.; Plaščak, I.; Stošić, M.; Lukinac-Čačić, J.; Vujčić, B. Impact of Technical Spraying Factors on Leaf Area Coverage in an Apple Orchard. Teh. Vjesn. 2014, 21, 1117–1124. [Google Scholar]
  17. Wang, J.; Luo, B.; Huo, Y.; Wang, X.; Xu, W. Influence of Adjuvant on Large-Scale Plant Protection Spray Characteristics. J. Drain. Irrig. Mach. Eng. 2019, 37, 6. [Google Scholar]
  18. Qin, W.; Xue, X.; Zhou, L. Effects of Spraying Parameters of Unmanned Aerial Vehicle on Droplets Deposition Distribution of Maize Canopies. Trans. Chin. Soc. Agric. Eng. 2014, 30, 7. [Google Scholar]
  19. Roten, R.L.; Hewitt, A.J.; Ledebuhr, M.; Thistle, H.; Connell, R.J.; Wolf, T.M.; Sankar, S.; Woodward, S.J.R. Evaluation of Spray Deposition in Potatoes Using Various Spray Delivery Systems. N. Z. Plant Prot. 2013, 66, 317–323. [Google Scholar] [CrossRef]
  20. Chen, Z.; Wu, Y. The elementary study of spraying droplets with filter paper ratio—Assured methods. J. Shanxi Agric. Univ. Sci. Ed. 1996, 16, 4. [Google Scholar]
  21. Zheng, Q.; Wu, J. Humidity Resistance Test System for Spray Droplet Density and Size Based on NO2- Color Reaction. Trans. Chin. Soc. Agric. Eng. 2015, 31, 6. [Google Scholar]
  22. Cunha, M.; Carvalho, C.; Marcal, A.R.S. Assessing the Ability of Image Processing Software to Analyse Spray Quality on Water-Sensitive Papers Used as Artificial Targets. Biosyst. Eng. 2012, 111, 11–23. [Google Scholar] [CrossRef]
  23. Lipiński, A.J.; Lipiński, S. Binarizing Water Sensitive Papers—How to Assess the Coverage Area Properly? Crop Prot. 2020, 127, 104949. [Google Scholar] [CrossRef]
  24. Chen, X.; Ru, Y.; Liu, B. Analysis and Comparison of Test Methods for Droplet Size and Deposition. J. Agric. Mech. Res. 2021, 43, 5. [Google Scholar]
  25. Zisman, W.A. Relation of the Equilibrium Contact Angle to Liquid and Solid Constitution; ACS Publications: Washington, DC, USA, 1964. [Google Scholar]
  26. Owens, D.K.; Wendt, R.C. Estimation of the Surface Free Energy of Polymers. J. Appl. Polym. Sci. 1969, 13, 1741–1747. [Google Scholar] [CrossRef]
  27. Kaelble, D.H. Dispersion-Polar Surface Tension Properties of Organic Solids. J. Adhes. 1970, 2, 66–81. [Google Scholar] [CrossRef]
  28. Rabel, W. Einige Aspekte Der Benetzungstheorie Und Ihre Anwendung Auf Die Untersuchung Und Veränderung Der Oberflächeneigenschaften von Polymeren. Farbe Lack 1971, 77, 997–1005. [Google Scholar]
  29. Young, T. An Essay on the Cohesion of Fluids. Abstr. Pap. Print. Philos. Trans. R. Soc. 1832, 1, 171–172. [Google Scholar] [CrossRef]
  30. Qiu, Z.; Yuan, H.; Lou, S.; Ji, M.; Yu, J.; Song, X. The Research of Water Soluble Dyes of Allura Red and Ponceau-G as Tracers for Determing Pesticide Spray Distribution. Agrochemicals 2007, 46, 323. [Google Scholar]
  31. Zhu, H.; Salyani, M.; Fox, R.D. A Portable Scanning System for Evaluation of Spray Deposit Distribution. Comput. Electron. Agric. 2011, 76, 38–43. [Google Scholar] [CrossRef]
  32. Schneider, C.A.; Rasband, W.S.; Eliceiri, K.W. NIH Image to ImageJ: 25 Years of Image Analysis. Nat. Methods 2012, 9, 671–675. [Google Scholar] [CrossRef]
  33. Sharma, P.K.; Hanumantha Rao, K. Analysis of Different Approaches for Evaluation of Surface Energy of Microbial Cells by Contact Angle Goniometry. Adv. Colloid Interface Sci. 2002, 98, 341–463. [Google Scholar] [CrossRef] [PubMed]
  34. Toraman, M.C. Effects of Leaf Surface Energy on Pesticidal Performance. Tarim Bilim. Derg. 2019, 25, 174–180. [Google Scholar] [CrossRef]
  35. Gu, Z.; Xu, X.; Han, L. Study on the Method of Measure of the Critical Surface Tension of Plants. Mod. Agrochem. 2002, 2, 20–22. [Google Scholar]
  36. Hou, C.; Tang, Y.; Luo, S.; Lin, J.; He, Y.; Zhuang, J.; Huang, W. Optimization of Control Parameters of Droplet Density in Citrus Trees Using Uavs and the Taguchi Method. Int. J. Agric. Biol. Eng. 2019, 12, 1–9. [Google Scholar] [CrossRef]
  37. Meng, Y.; Lan, Y.; Mei, G.; Guo, Y.; Song, J.; Wang, Z. Effect of Aerial Spray Adjuvant Applying on the Efficiency of Small Unmanned Aerial Vehicle on Wheat Aphids Control. Int. J. Agric. Biol. Eng. 2018, 11, 46–53. [Google Scholar] [CrossRef]
  38. Qi, P.; Zhang, L.; Wang, Z.; Han, H.; Müller, J.; Li, T.; Wang, C.; Huang, Z.; He, M.; Liu, Y.; et al. Effect of Operational Parameters of Unmanned Aerial Vehicle (UAV) on Droplet Deposition in Trellised Pear Orchard. Drones 2023, 7, 57. [Google Scholar] [CrossRef]
  39. Cunha, J.P.A.R.; Farnese, A.C.; Olivet, J.J. Computer Programs for Analysis of Droplets Sprayed on Water Sensitive Papers. Planta Daninha 2013, 31, 715–720. [Google Scholar] [CrossRef]
  40. Turner, C.R.; Huntington, K.A. The Use of a Water Sensitive Dye for the Detection and Assessment of Small Spray Droplets. J. Agric. Eng. Res. 1970, 15, 385–387. [Google Scholar] [CrossRef]
  41. Kang, J.; Liu, G.; Guo, G. Image Preprocessing and Droplet Parameter Measurement Of-Sensitive Paper Based on ImagePy. Sci. Technol. Eng. 2021, 21, 10. [Google Scholar]
  42. Grella, M.; Gioelli, F.; Marucco, P.; Zwertvaegher, I.; Mozzanini, E.; Mylonas, N.; Nuyttens, D.; Balsari, P. Field Assessment of a Pulse Width Modulation (PWM) Spray System Applying Different Spray Volumes: Duty Cycle and Forward Speed Effects on Vines Spray Coverage. Precis. Agric. 2022, 23, 219–252. [Google Scholar] [CrossRef]
  43. Shan, C.; Wang, G.; Wang, H.; Xie, Y.; Wang, H.; Wang, S.; Chen, S.; Lan, Y. Effects of Droplet Size and Spray Volume Parameters on Droplet Deposition of Wheat Herbicide Application by Using Uav. Int. J. Agric. Biol. Eng. 2021, 14, 74–81. [Google Scholar] [CrossRef]
  44. Vermant, J. Fluid Mechanics: When Shape Matters. Nature 2011, 476, 286–287. [Google Scholar] [CrossRef]
  45. Mampallil, D.; Eral, H.B. A Review on Suppression and Utilization of the Coffee-Ring Effect. Adv. Colloid Interface Sci. 2018, 252, 38–54. [Google Scholar] [CrossRef] [PubMed]
  46. Yang, R.; Xu, X.; Wang, X.; Gong, C.; Zhang, Y.; Ruan, Y.; Yang, D.; Yang, X. Effects of Different Auxiliaries, Spray Nozzles and Spray Pressures of Self-Propelled Boom Sprayer on Spray Effect in Paddy Field. Chin. J. Pestic. Sci. 2021, 23, 587–596. [Google Scholar]
  47. Wu, Q.; Hua, D.; Zheng, X.; Zhang, K.; Zhang, Z.; Wan, Y.; Zhou, X.; Zhang, Y. Assessing Pesticide Residue and Spray Deposition in Greenhouse Eggplant Canopies to Improve Residue Analysis. J. Agric. Food Chem. 2020, 68, 11920–11927. [Google Scholar] [CrossRef]
  48. Hong, S.W.; Zhao, L.; Zhu, H. CFD Simulation of Pesticide Spray from Air-Assisted Sprayers in an Apple Orchard: Tree Deposition and off-Target Losses. Atmos. Environ. 2018, 175, 109–119. [Google Scholar] [CrossRef]
  49. Salyani, M.; Zhu, H.; Sweeb, R.D.; Pai, N. Assessment of Spray Distribution with Water-Sensitive Paper. Agric. Eng. Int. CIGR J. 2013, 15, 101–111. [Google Scholar]
Figure 1. Schematic diagram of test sample arrangement. Where A indicates the sprayer’s acceleration phase, B indicates the sprayer’s constant velocity phase, C indicates the sprayer’s deceleration phase. Numbers 1 to 9 represent, respectively, WSP, KP, SP, CPP, PVCC, the nozzle, the driving route, the sprayer tire, and the sprayer boom.
Agronomy 14 00305 g001
Figure 2. Image comparison image before and after adjusting the color threshold. Where (A) represents the original scanned image, (B) represents the circle in the center as the coffee ring, (C) represents the filled coffee ring, (D) represents the post-color threshold adjustment image.
Agronomy 14 00305 g002
Figure 3. Comparative analysis of droplet density among different collectors. Collectors labeled with different letters indicate statistically significant differences (p < 0.05). (A) Results obtained using the IDK 12002 nozzle; (B) results obtained using the LU 12002 nozzle.
Agronomy 14 00305 g003
Figure 4. Comparative analysis of droplet coverage among different collectors. Collectors labeled with different letters indicate statistically significant differences (p < 0.05). (A) Results with the IDK 12002 nozzle; (B) results with the LU 12002 nozzle.
Agronomy 14 00305 g004
Figure 5. Deposition analysis results across different collectors. PVCC* and CPP* represent the results after elution using this droplet collector. Collectors labeled with different letters indicate statistically significant differences (p < 0.05). (A) Results with the IDK 12002 nozzle; (B) results with the LU 12002 nozzle.
Agronomy 14 00305 g005
Figure 6. The droplet adhesion phenomenon is demarcated by a dotted line, while a normal-sized droplet is encircled by solid lines. (A) Phenomenon in WSP; (B) phenomenon in SP.
Agronomy 14 00305 g006
Table 1. Contact angle and contact angle cosine of 5 droplet collectors.
CollectorMaterialγ (mN m−1)Contact Angle (°)cosθ
SPDMSO39.8236.74 ± 2.340.80
Deionized Water71.3472.48 ± 2.550.30
CPPDMSO39.8232.57 ± 1.100.85
Deionized Water71.3484.97 ± 0.300.088
KPDMSO39.8214.94 ± 2.690.97
Deionized Water71.3452.13 ± 1.460.61
PVCCDMSO39.8232.30 ± 1.830.86
Deionized Water71.3485.59 ± 5.280.077
WSPDMSO39.8226.24 ± 0.190.90
Deionized Water71.3465.82 ± 1.880.41
Table 2. Surface free energy of 5 droplet collectors.
Collectorscosθ-γSurface Free Energy (mN m−1)
ZismanOWRK
SPy = −0.0159x + 1.433427.2635.11
CPPy = −0.024x + 1.796833.233.81
KPy = −0.0114x + 1.427137.4648.38
PVCCy = −0.0244x + 1.81633.4433.9
WSPy = −0.0171x + 1.598635.0139.95
Table 3. Surface free energy (mN m−1) of leaves of common crops [34,35].
Plant SpeciesMinimumMaximumAverage
Eggplant44.652.648.6
Tomato32.435.534.0
Luffa cylindrica3943.441.2
Chinese cabbage31.536.233.9
Cabbage32.836.834.8
Spinach41.346.443.9
Wheat30.633.832.3
Rice36.33937.7
Peanut29.832.631.2
Soybean38.643.841.2
Grape32.236.634.4
Peach28.633.531.1
Disclaimer/Publisher’s Note: The statements, opinions and data contained in all publications are solely those of the individual author(s) and contributor(s) and not of MDPI and/or the editor(s). MDPI and/or the editor(s) disclaim responsibility for any injury to people or property resulting from any ideas, methods, instructions or products referred to in the content.

