Article

Status of Soil Health Indicators after 18 Years of Systematic Tillage in a Long-Term Experiment

by
Hanaa Tharwat Mohamed Ibrahim
1,
Maxwell Maimela Modiba
1,2,
Igor Dekemati
2,
Györgyi Gelybó
3,
Márta Birkás
2 and
Barbara Simon
1,*
1
Department of Soil Science, Institute of Environmental Sciences, Hungarian University of Agriculture and Life Sciences, Páter K. u. 1., H-2100 Gödöllő, Hungary
2
Department of Agronomy, Institute of Crop Production Sciences, Hungarian University of Agriculture and Life Sciences, Páter K. u. 1., H-2100 Gödöllő, Hungary
3
Department of Water Management and Climate Adaptation, Institute of Environmental Sciences, Hungarian University of Agriculture and Life Sciences, Páter K. u. 1., H-2100 Gödöllő, Hungary
*
Author to whom correspondence should be addressed.
Agronomy 2024, 14(2), 278; https://doi.org/10.3390/agronomy14020278
Submission received: 29 November 2023 / Revised: 19 January 2024 / Accepted: 23 January 2024 / Published: 26 January 2024
(This article belongs to the Section Soil and Plant Nutrition)

Abstract

:
Long-term cultivation experiments are gaining more attention due to the possibility of following the changes in soil parameters (e.g., soil organic carbon (SOC), stock and soil health indicators, etc.). Our objective was to assess the status of soil in an 18-year-old tillage experiment after almost two decades of systematic tillage. In this research, soil physical (bulk density, moisture content), chemical (pH, SOC), and biological properties (soil microbial respiration, abundance, biomass, species composition of earthworms, yield) were used as indicators in three soil cultivation methods representing different degrees of disturbance (no-till—NT; shallow cultivation—SC; and ploughing—P). Based on our results, there were significant differences in bulk density (NT > SC, P) in 0–10 cm, and NT > P in deeper layers (10–20, 20–30, 30–40 cm), while the SOC content in 0–10 cm was the highest in NT (2.5%), followed by SC (2.4%) and P (2.0%). Soil microbial respiration was significantly greater in NT than in SC and P. The abundance and biomass of earthworms was the highest in NT (189 ind m−2, 41.26 g m−2), followed by SC (125 ind m−2, 36.9 g m−2) and P (48 ind m−2, 7.4 g m−2). We concluded that NT offered a beneficial habitat for earthworms and microorganisms and a high SOC storage capacity; however, bulk density was less convenient due to soil compaction in our experiment. Therefore, SC can be used as an alternative approach for sustainable soil tillage.

1. Introduction

Global soils represent the largest carbon reservoir, stored in the form of soil organic carbon (SOC) (about 1500 Pg), larger than the overall combined carbon of the biotic pool (550 Pg) and atmospheric pool (750 Pg) [1]. Consequently, soils have the potential to play a crucial role in mitigating climate change by acting as a carbon sink [2,3,4]. However, SOC is sensitive to changes in climate and management practices (e.g., tillage, fertilizer, and irrigation) in arable lands [5,6]. SOC stocks have been proven to be maintained or even increased by crop rotations, residue return [7], additional cover crops [8], and organic inputs [9]. The United States predicted a loss of about 30–50% of stored SOC pre-agriculture era [10]. This carbon loss was due to the adverse effect of ploughing on agricultural soils [11]. Carbon adsorption by agricultural soils can indeed play a crucial role in mitigating climate change. This process involves the capture and retention of carbon dioxide (CO2) from the atmosphere by soils, which helps to reduce the overall concentration of greenhouse gases [12,13].
SOC is decreasing due to intensive tillage, continuous farming, using inorganic fertilizers instead of organic-matter-rich materials, such as slurry or manure [14]. This decrease in SOC tends to reduce soil quality and increase the risk of soil degradation. To address this situation, conservation agriculture has been recommended as an alternative strategy to reverse the spiral of soil degradation in many parts of the world [14]. Soil tillage is the mechanical manipulation of soil physical conditions that can affect stored SOC due to its soil-aggressive nature; it breaks down the soil aggregates that protect carbon in the soil [15]. In addition, soil structural fragmentation promotes soil organic matter oxidation [16]. Therefore, recent research has aimed to promote farming methods that have a less negative impact on the environment. Integrated practices such as reducing tillage and no-tillage (NT) have been suggested for mitigating the negative impacts of conventional tillage on soil quality and maintain SOC [17].
No-till greatly increases SOC stock compared to conventional tillage techniques according to a lot of research [18,19,20,21,22]. Additionally, NT farming enhances soil aggregation and microbial activity, which contributes to the development of SOC [22]. Tedone [23] reported that, on average, NT resulted in a better SOC content compared to reduced and conventional tillage. The highest values were obtained under the NT treatment, with a SOC stock value of 14.4 Mg ha−1 compared to reduced (5.5 Mg ha−1) and for conventional tillage (5.0 Mg ha−1) [23]. This implies that soil tillage methods that comply with conservation agriculture principles may enhance SOC owing to less aggregate fragmentation and by also retaining crop residues. Ploughing (P), known as conventional ploughing, dates back thousands of years [24]. Its benefits have been well proven, but issues have also been identified [25,26]. Ploughing may cause large carbon losses, particularly in the topsoil, which impair soil fertility and the overall resilience of ecosystems [8,19,27,28,29]. Studies have repeatedly demonstrated that P reduces SOC stock due to increased soil aeration and the microbial breakdown of soil organic matter. Shallow cultivation (SC) has been shown by researchers to maintain or slightly raise SOC levels over time. This makes SC a potential option for long-term soil management [8]. According to a recent research study, after applying different tillage methods for 11 years, NT showed the highest SOC at soil depth 0–10 cm, followed by ploughing and no-tillage, then ploughing [30].
Evidently, the impact of tillage on the SOC content in soil is not governed by a single factor. Thus, it is imperative to study all the factors involved to generate a better understanding of the impact of tillage on SOC. Despite the high number of peer-reviewed articles on this topic, there is still a knowledge gap at the local level in Hungary. Moreover, soil health assessments typically neglect soil biological properties [31]; thus, we included earthworm investigations and soil microbial respiration as biological indicators. Our hypotheses were as follows: (a) soil organic carbon content and stock will be greater under NT than SC and P; (b) earthworm abundance, biomass, and soil microbial respiration will be enhanced under NT compared to the SC and P treatments.
Hence, the objectives of this study were to investigate (a) the effects of three different tillage methods (NT, SC, and P) on selected soil physical (bulk density, soil moisture content) and chemical properties (pH(KCl), soil organic carbon content, and stock). Moreover, we wanted to get an insight into (b) the current soil health status after 18 years of continuous systematic soil tillage by using selected biological indicators (soil microbial respiration, abundance, biomass and species of earthworms, and yield) in a long-term soil tillage experiment in Józsefmajor, Hungary.

2. Materials and Methods

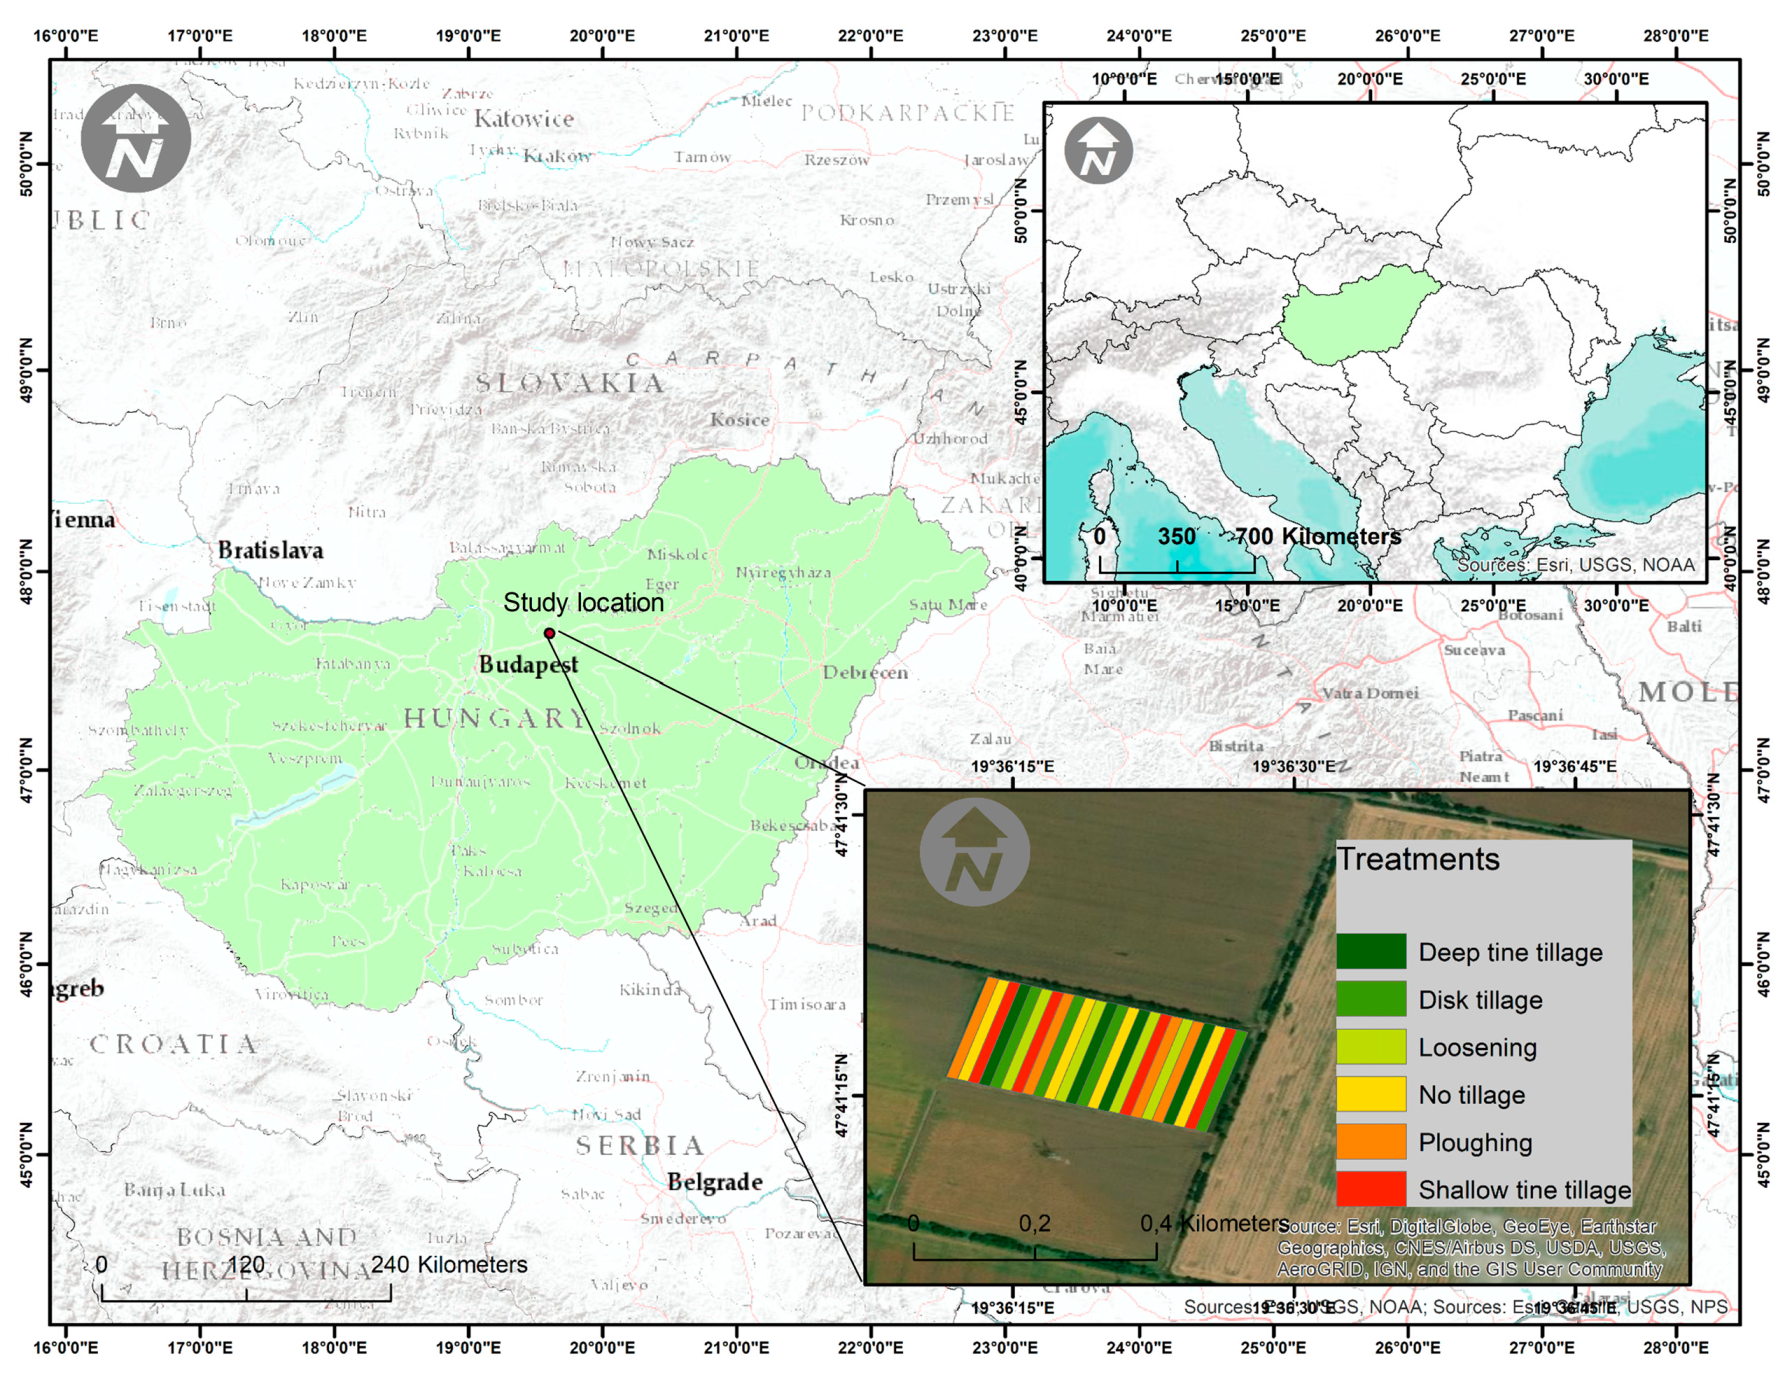
2.1. Study Site and Meteorological Data

The long-term tillage experiment was set at the Józsefmajor Experimental and Training Farm (JETF) of GAK Ltd. (Agricultural Centre Gödöllő) (47°41031.700 N, 19°36036.100 E, 110 m a.s.l.) in 2002 (Figure 1). The soil type is Endocalcic Chernozem (Loamic) according to WRB [32]. There are six treatments (mold board ploughing; deep and shallow tine cultivation; disk tillage; loosening; and no-till) arranged in a randomized block design with four replicates. The size of each plot is 13 × 180 m, while the area, including all the treatments, is 5.5 hectares. Out of these six treatments, three were selected for our research to represent an increasing degree of soil disturbance, i.e., no-till (NT), shallow cultivation (SC), and ploughing (P).
During harvest, the crop residues were chopped and spread in a single pass, and then the soil remained undisturbed until primary tillage in order to conserve soil moisture. Nitrogen (100 kg N ha−1 in two doses), phosphorus (P2O5, 100 kg ha−1), and potassium (K2O, 50 kg ha−1) fertilizers were applied uniformly over the treatments. The timetable of agricultural management is shown in Table 1.
The climate at the experimental farm is continental; the mean annual temperature is 10.3 and 15 °C during the vegetation period [34]. The annual mean precipitation (between 1961 and 1990; date originating from the climate dataset of the Climatic Research Unit) is 560 mm, of which 395 mm occurs in the vegetation period. In the JET Farm, mean multi-annual rainfall is below average in Hungary. Irrigation was not carried out on the experimental area.

2.2. Soil Physical Parameters

Soil bulk density samples were taken randomly from the three treatments in four replicates, between 0 and 40 cm, in 10 cm depth intervals using an Eijkelkamp undisturbed soil sampler. The bulk density was calculated by taking the oven-dried (105 °C) weight of the soil sample (in grams) in the cylinder divided by the volume of the cylinder (100 cm3).
The soil moisture content was measured from the bulk density samples using the gravimetric moisture determination method (105 °C, 24 h) [35] in four replicates. The moisture content was calculated by subtracting the weight of the oven-dried soil sample (oven-dried soil weight—g) from the weight of the wet soil (wet soil weight—g), and then it was divided by the oven-dried soil weight (dry soil weight—g) and multiplied by 100 [35].

2.3. Soil Chemical Parameters

Composite soil samples consisting of a minimum of 9–10 random subsamples were taken from the topsoil (0–20 cm) under the three examined treatments (NT, SC, and P) in September, 2020 for chemical analyses. The pH(KCl) of the samples was determined potentiometrically, applying a 1:2.5 soil to 1 n KCl ratio with the help of a digital pH meter (HACH-LANGE, HQ411D) (Hach Lange GmbH, Vesenaz, Switzerland) [36]. The soil organic carbon (%) (SOC) content was determined by wet oxidation with the mixture of 5% K2Cr2O7 + cc. H2SO4 with a 1:2 ratio. The color of the mixture was measured using the UNICAM Photometer (UV2 043506) (UNICAM, Montreal, Canada) [37]. SOC stock values (t ha−1) were calculated by multiplying the bulk density (expressed in kg m−3) and the relevant 10 cm layer (0.1 m) soil slice of a one-hectare (10,000 m2) area in order to obtain the weight of the soil slice. Then, the SOC stock value was calculated (in tons per hectare) by taking the percentage of the SOC content of the 0.1 m deep one-hectare soil slice [38].

2.4. Soil Biological Parameters

The soil microbial respiration measurements were carried out based on the ISO 16072:2002(E) standard [39] and Cheng et al.’s method [40] with minor modification. A total of 50 g fresh soil was put in an airtight jar, and then 10 mL deionized water was added to adjust optimal moisture content. In total, 10 mL 1.0 M NaOH in a conical was placed in the same jar, and then the samples were incubated for 10 days (in darkness; 22 °C). After the incubation, 1 mL BaCl2 was added to the NaOH solution to precipitate the trapped CO2 using a phenolphthalein indicator. Later, the solution was titrated with 0.5 M HCl until it became colorless. Titration was carried out in triplicate.
Earthworms were sampled according to the ISO Standards [41] by hand-sorting in situ (25 × 25 × 25 cm) in three treatments (NT, SC, and P) in four replicates. The sampling locations within the treatments were selected randomly. The earthworm abundance (ind m−2) and biomass (g m−2) were determined. The earthworm species were determined according to Csuzdi and Zicsi [42].
Harvest was carried out on the 15 July 2020 with a John Deere T660i harvester (John Deere Harverster Works, East Moline, Illinois, USA), and the grain yield was determined each year from each plot. The grain yield was weighed, and then the grain moisture was determined.

2.5. Statistical Analyses

Statistical significance of the differences among the treatments, and all the statistical analyses, were performed in R (4.2.2) Statistical Program (R Core Team 2021). An ANOVA was used to test the existence of significant differences, and a prior test for normality was performed using Q-Q plots. For multiple comparisons of the means in the treatments, Tukey’s post-hoc HSD test was used. Statistical significance was detected at p < 0.01.

3. Results

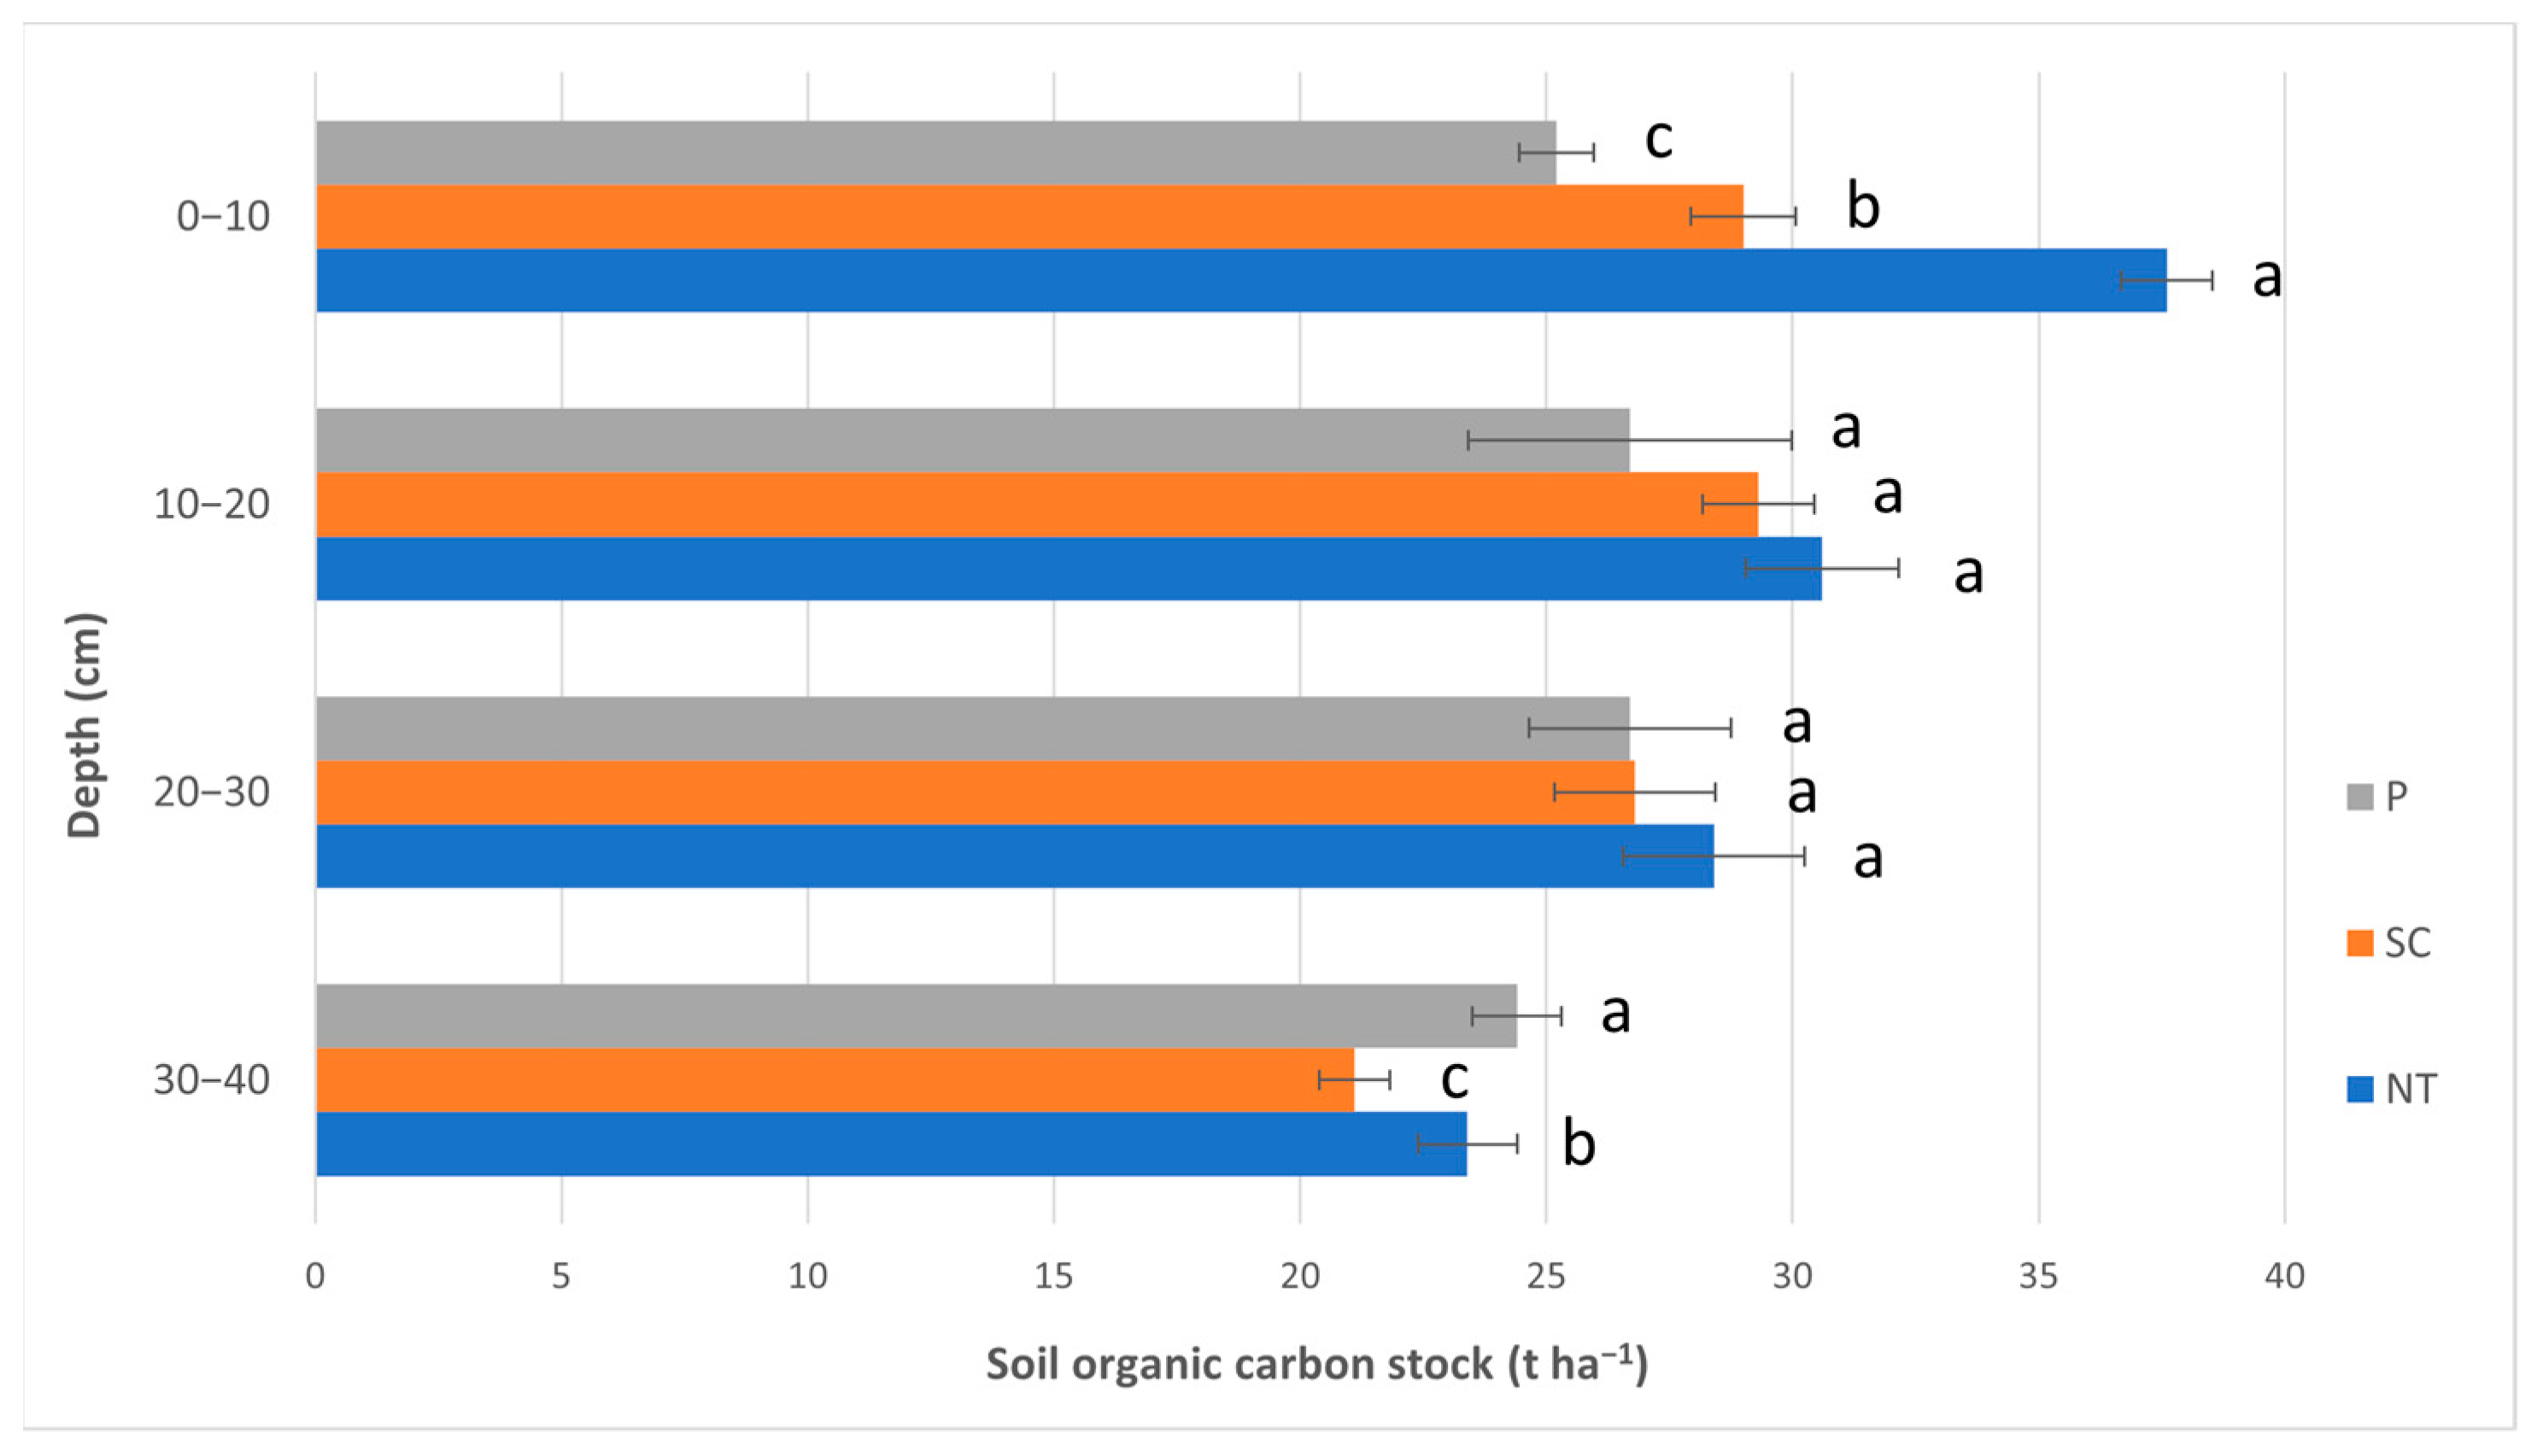
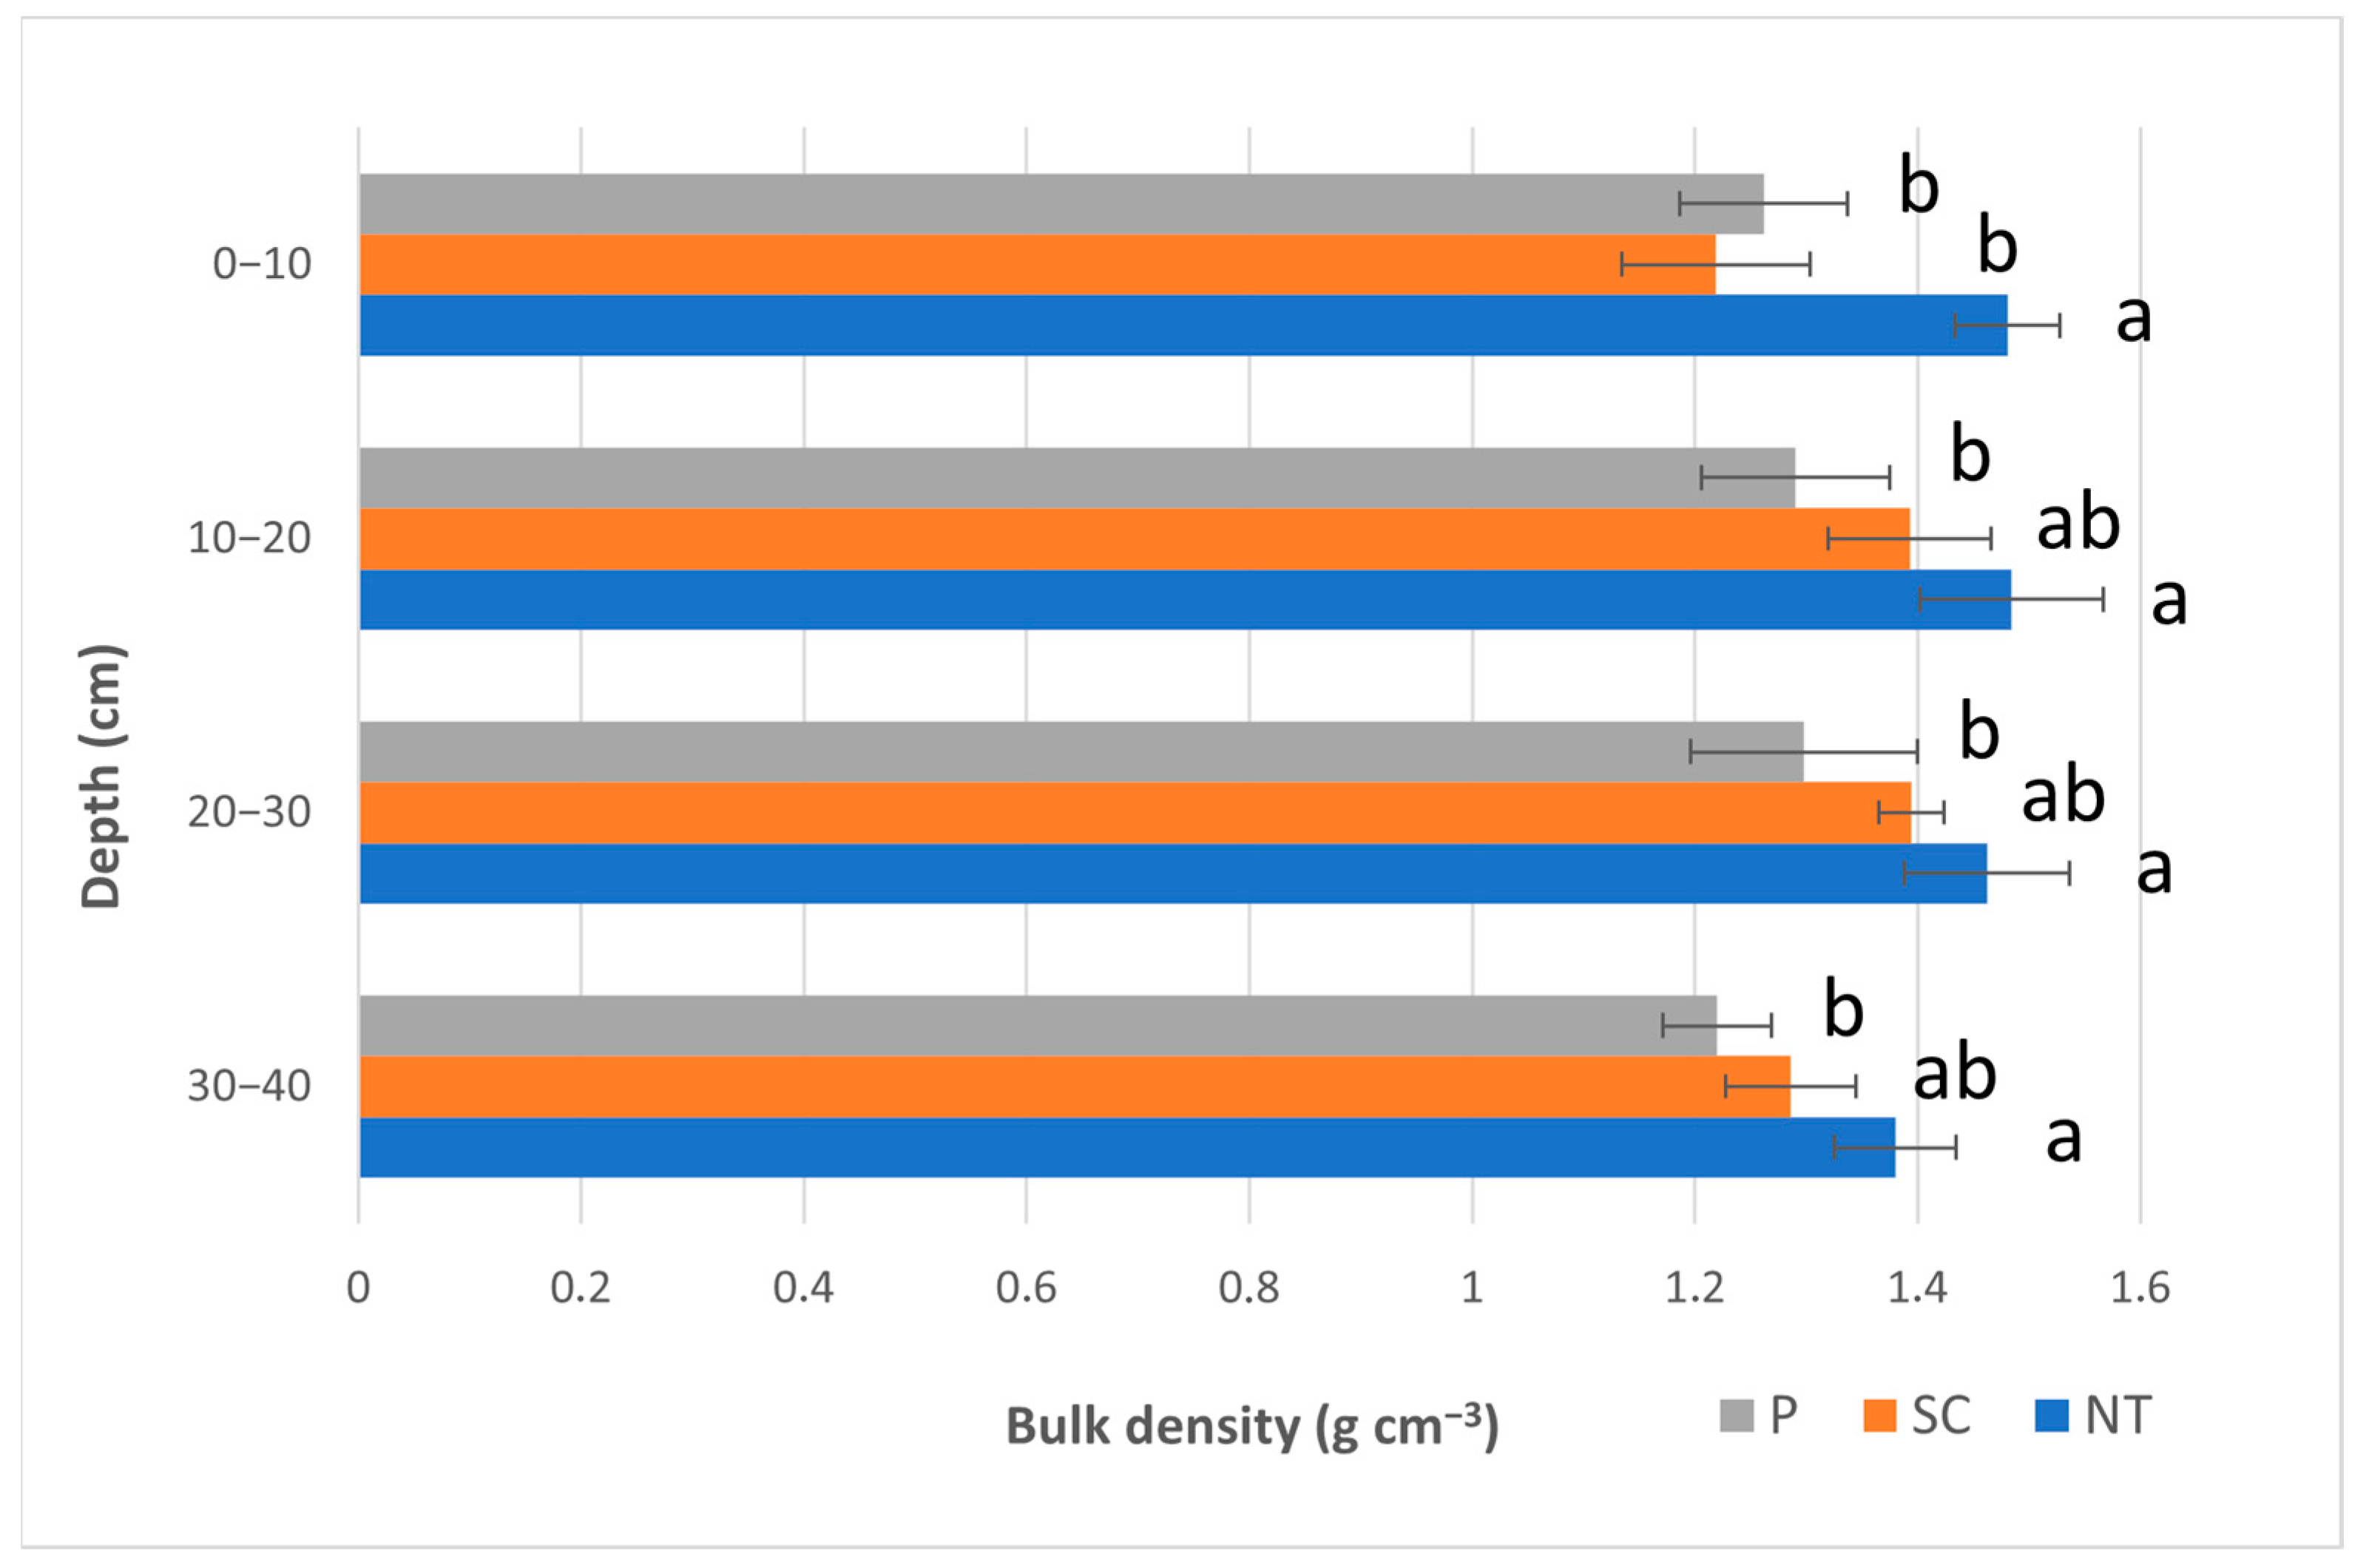
3.1. Soil Physical Parameters

The measured soil bulk density values are presented in Figure 2. In the case of the first layer (0–10 cm), no-till (NT) showed a significant difference compared to P and SC. NT (1.48 g cm−3) was significantly greater than P (1.26 g cm−3) and SC (1.22 g cm−3). Regarding the following layers (10–20; 20–30; and 30–40 cm), NT was only significantly greater than P; however, P did not differ significantly from SC.
The soil moisture content was also measured as a background parameter from the bulk density samples to see if any drastic differences among the treatments in the four different layers could be detected. The distribution of the moisture content was quite homogenous; we only measured higher moisture values in the case of the P treatment at 30–40 cm depth.

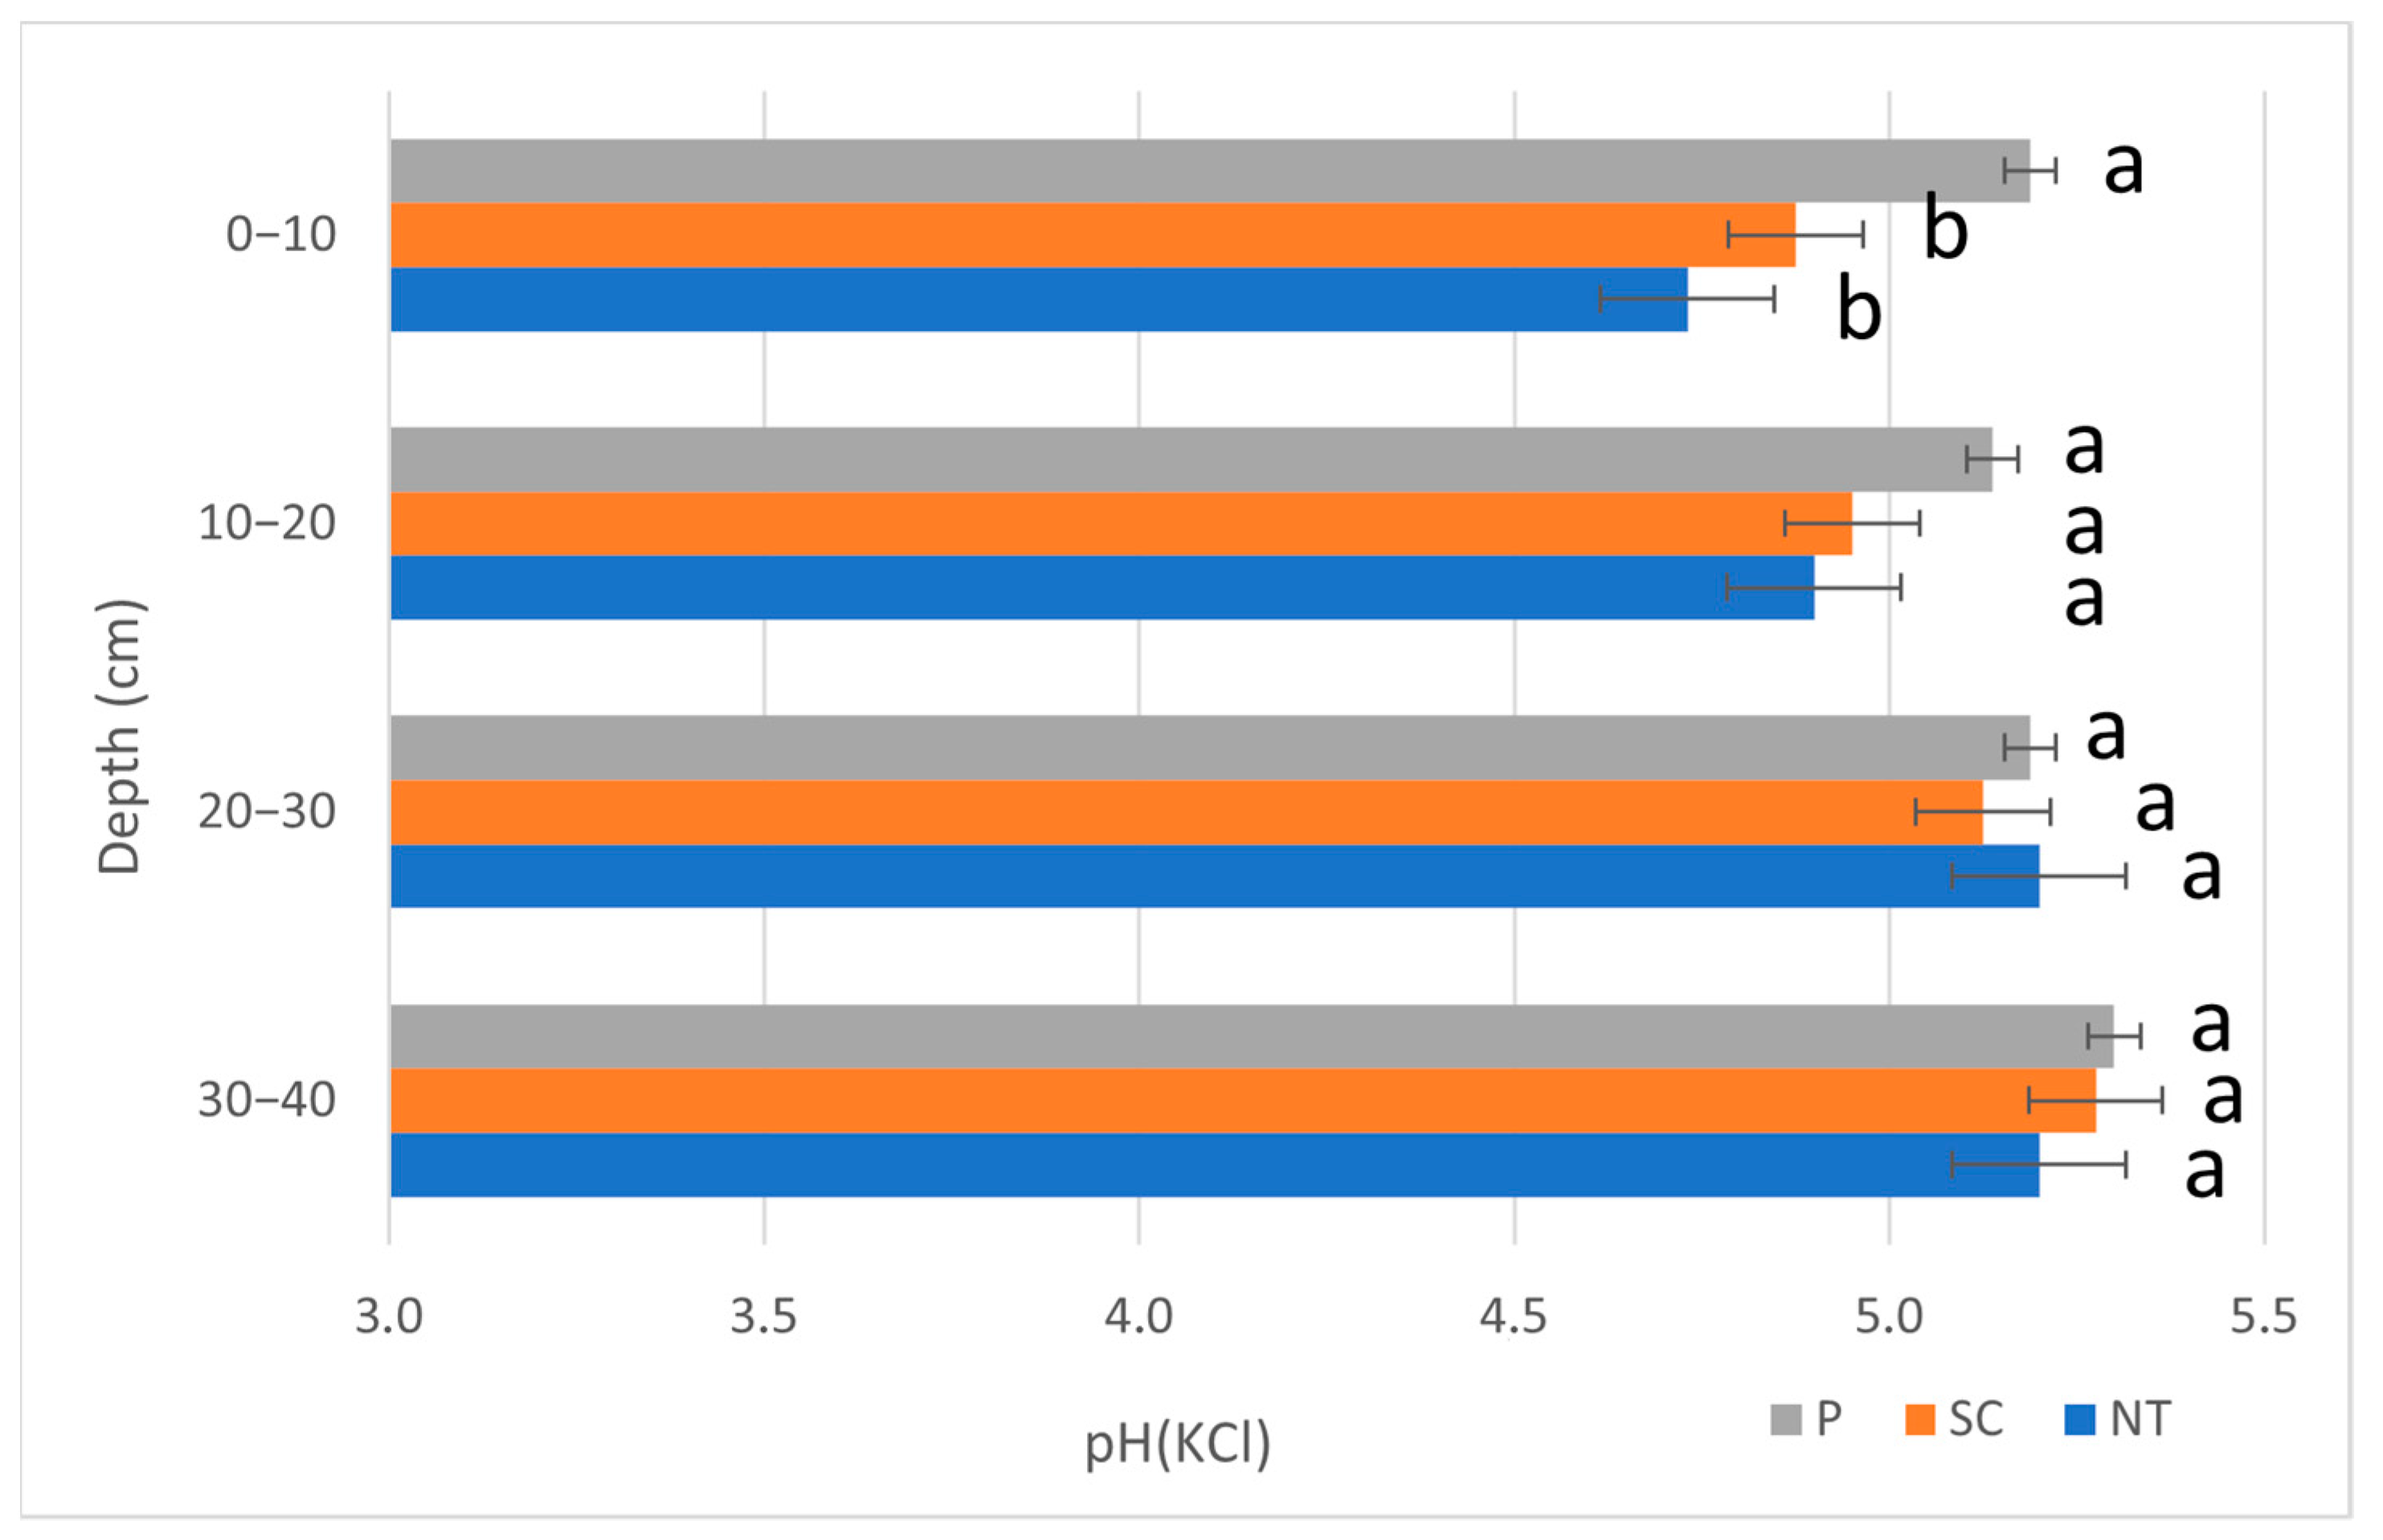
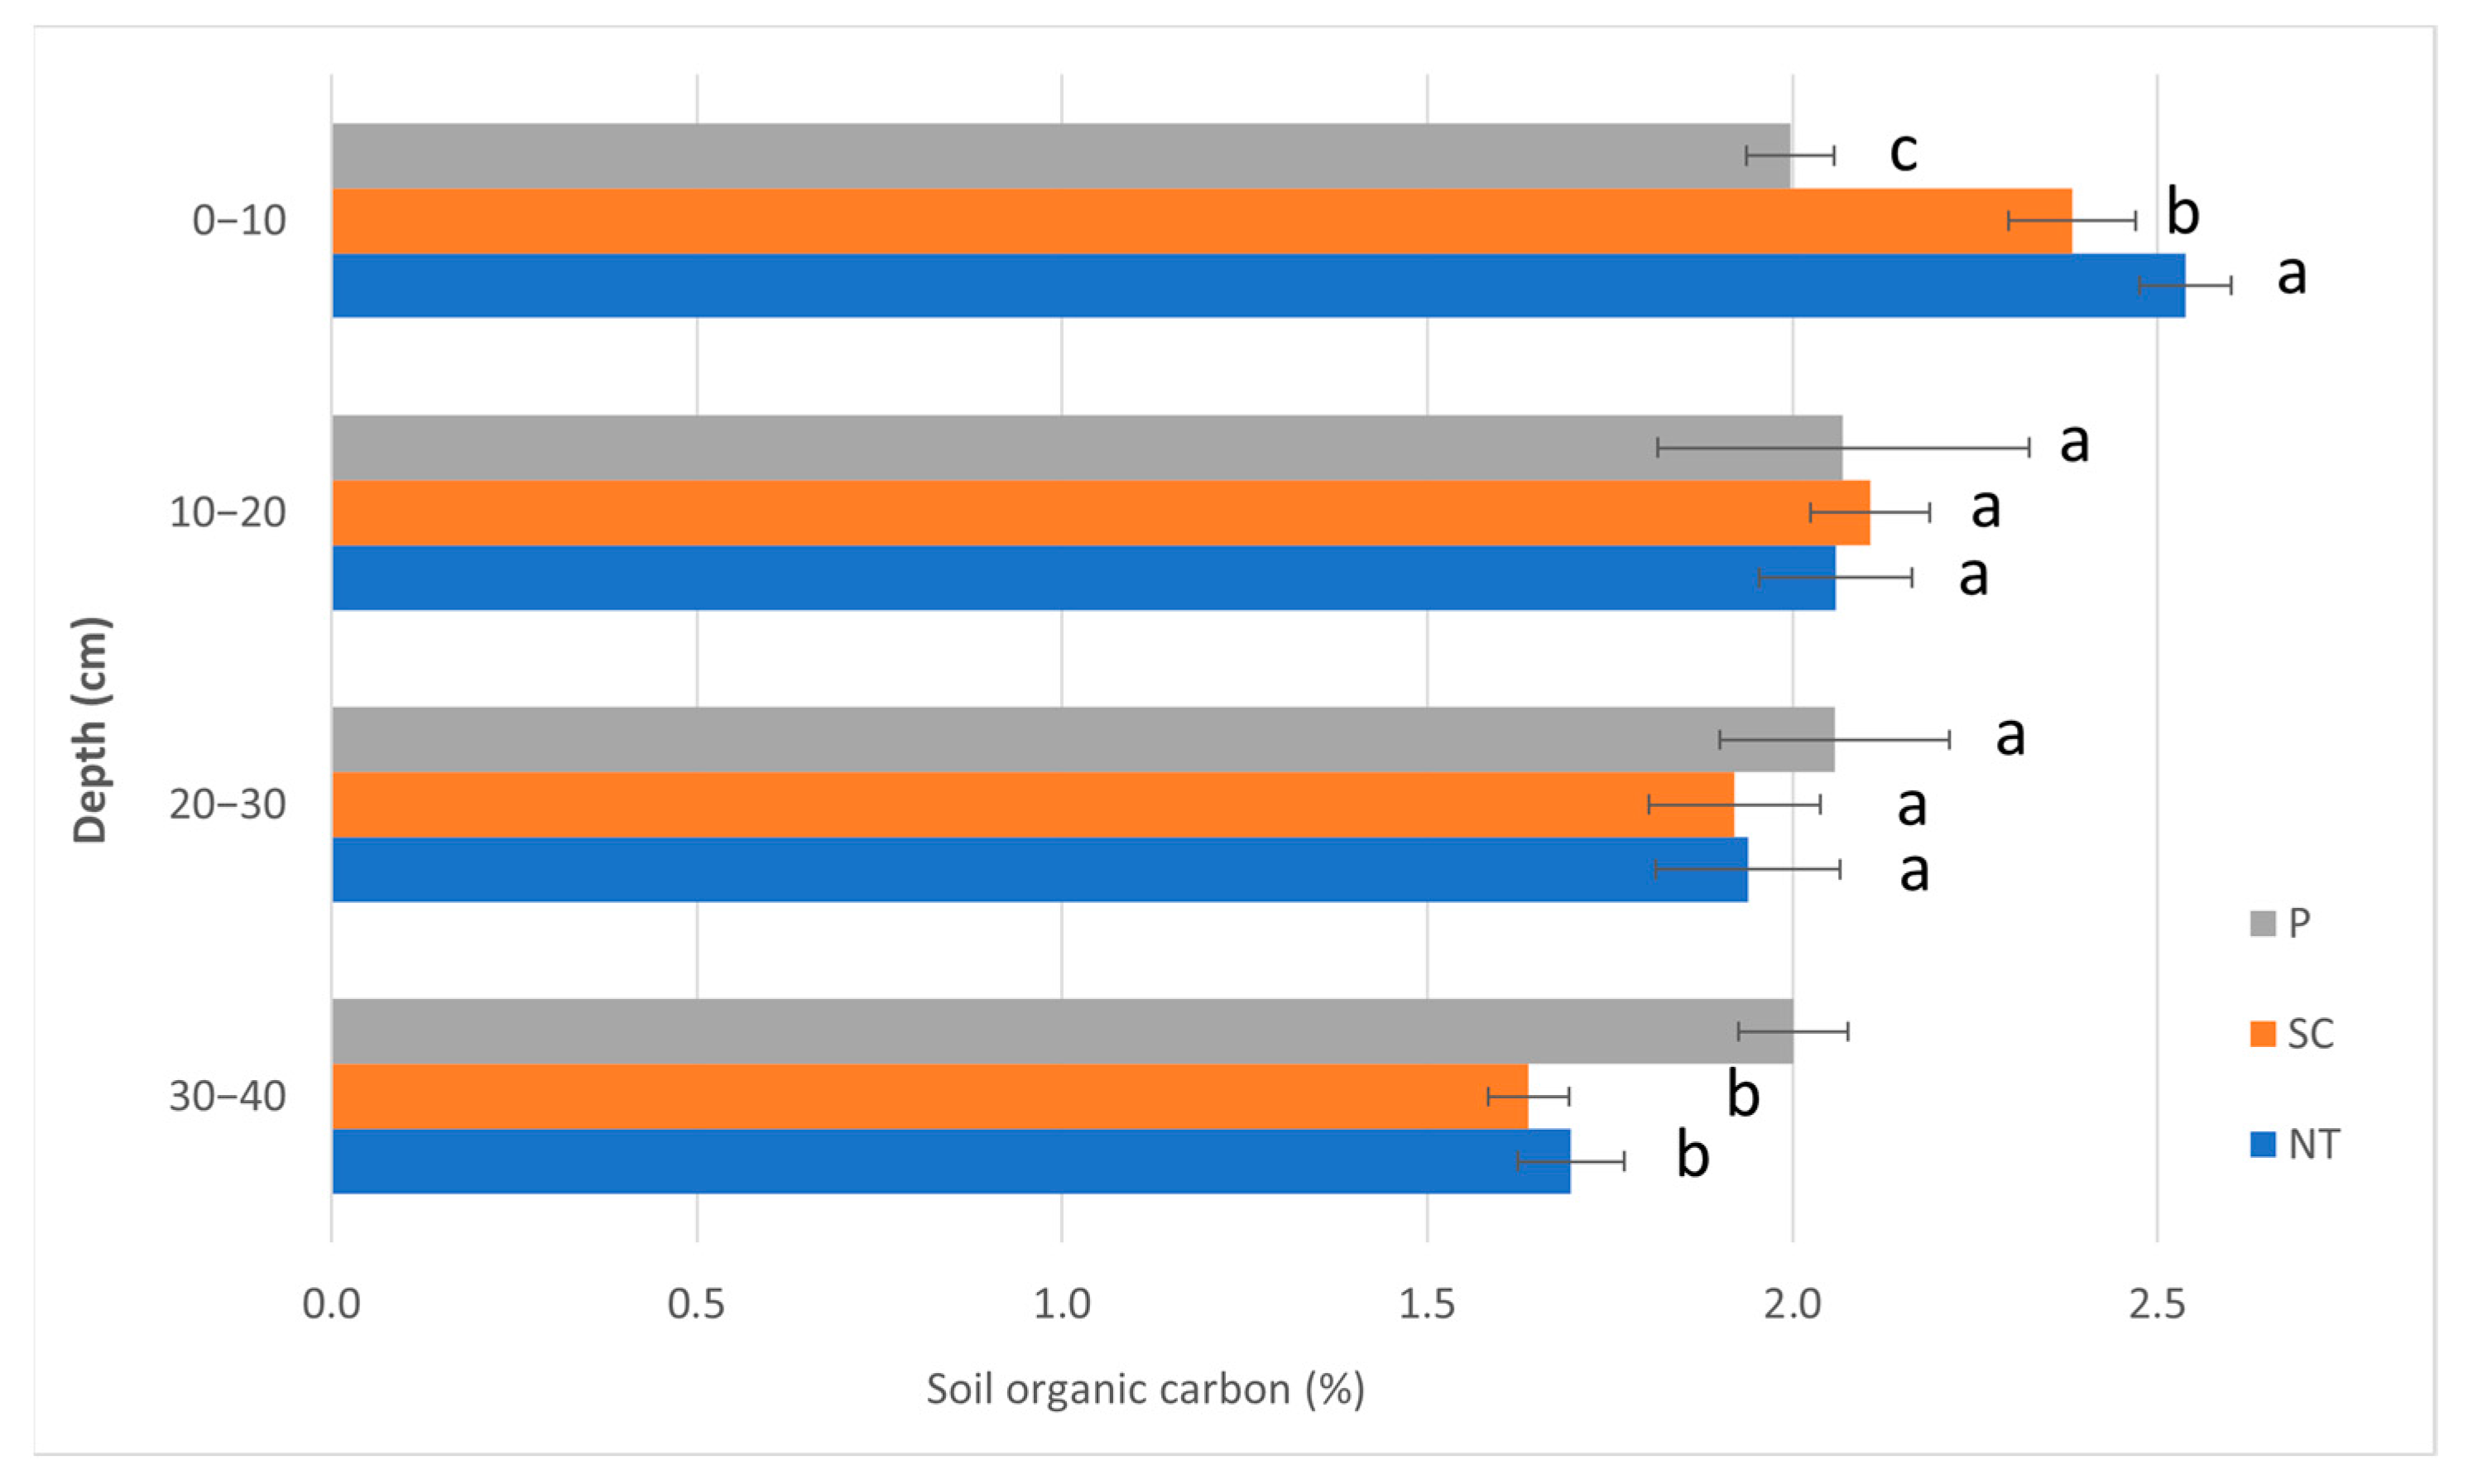
3.2. Soil Chemical Parameters

The soil pH(KCl) values can be found in Figure 3. The pH(KCl) values were between 5.1 and 5.3 in P, 4.9 and 5.3 in SC, and 4.7 and 5.2 in NT. A significant difference was only found in the case of the top layer (0–10 cm) with the highest values for P (P > SC = NT), while the other layers did not show any significant difference. The highest pH(KCl) value was measured in P (5.2), followed by SC (4.7) and then NT (4.9), in layer 0–10 cm.
The SOC values are shown in Figure 4. The values were between 1.7 and 2.5% in NT, 1.6 and 2.4% in SC, while they were only 2.0 and 2.1% in P. There were significant differences found in only two layers, i.e., in the top (0–10 cm) and the lowest layer (30–40 cm). The greatest value was measured in the case of NT (2.5%), then in SC (2.4%), and finally in the P treatment (2.0%) in the top layer. In the lowest examined layer, the P treatment (2.0%) was significantly greater than the other two treatments (NT = 1.7%; SC = 1.6%).
The SOC stock values are shown in Figure 5. The values were between 23.4 and 37.6 t ha1 in NT; 21.1 and 29.3 t ha−1 in SC; while they were 24.4 and 26.7 t ha−1 in the P treatment. A significant difference was found in the top layer (0–10 cm), i.e., the greatest values were found in NT (37.6 t ha1), followed by SC (29.0 t ha−1), and then P (25.2 t ha−1). The two middle layers (10–20, 20–30 cm) did not show significant differences, while in the lowest layer (30–40 cm), the pattern was P > NT > SC.

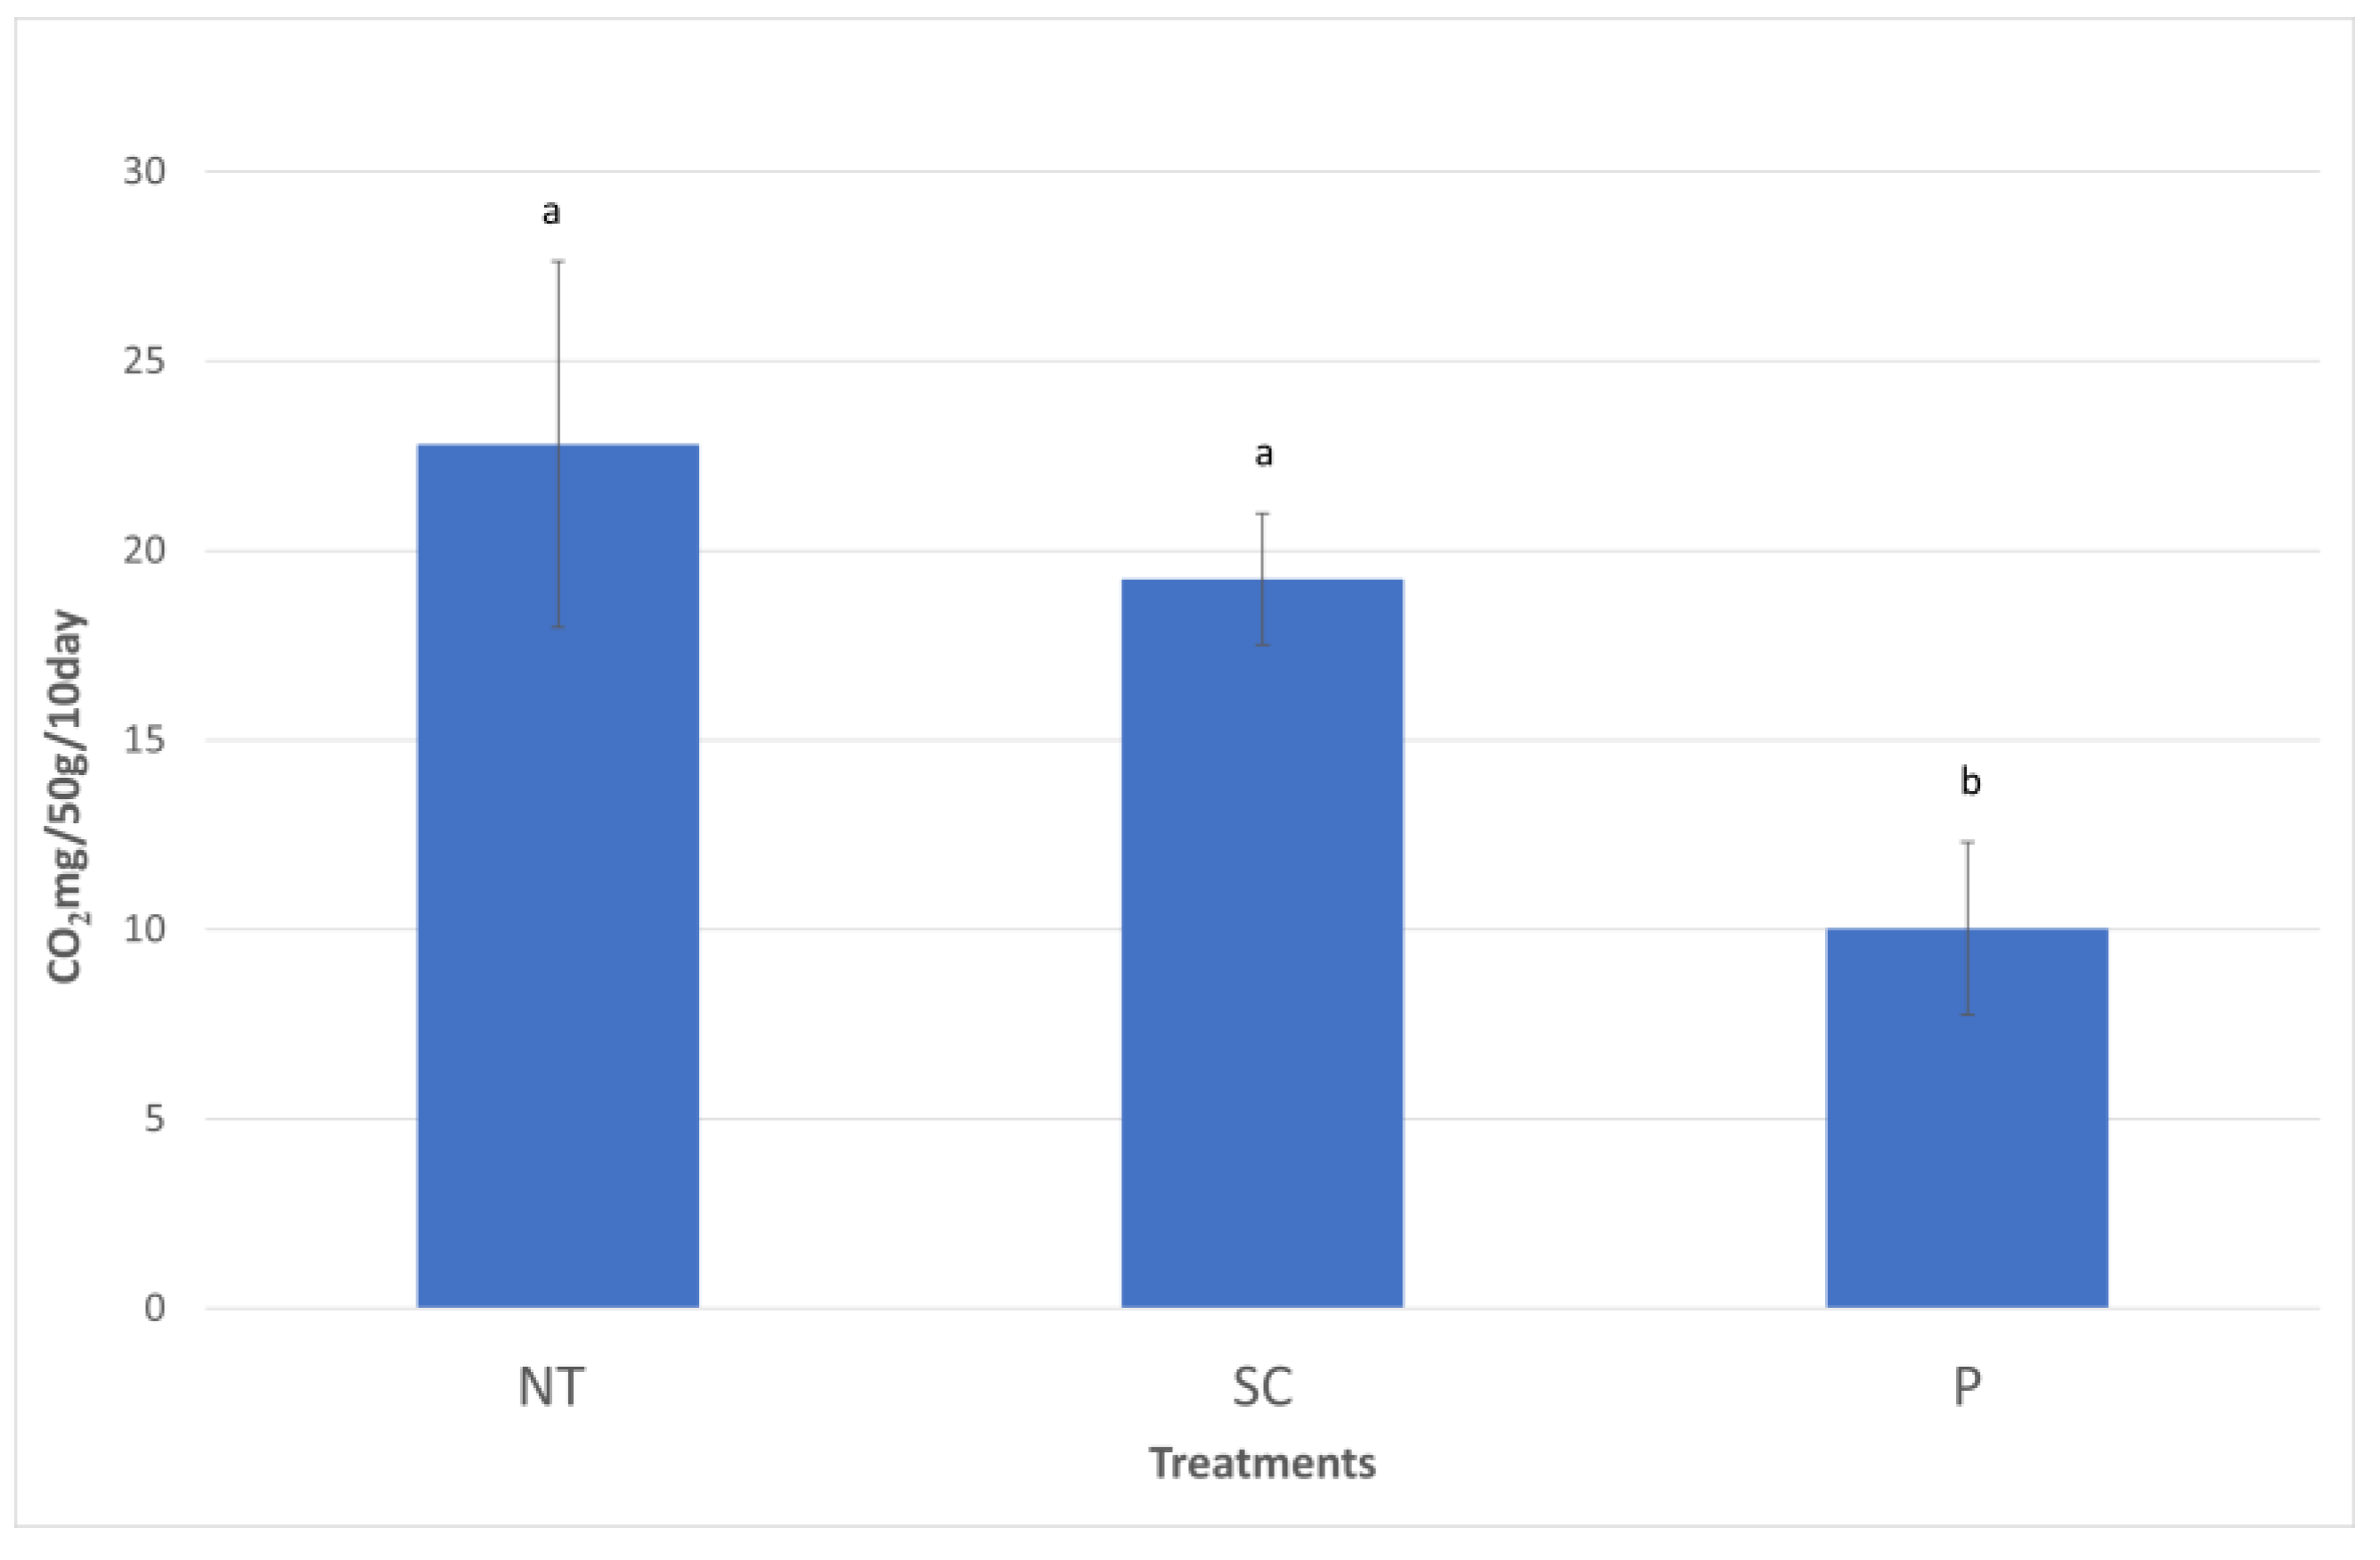
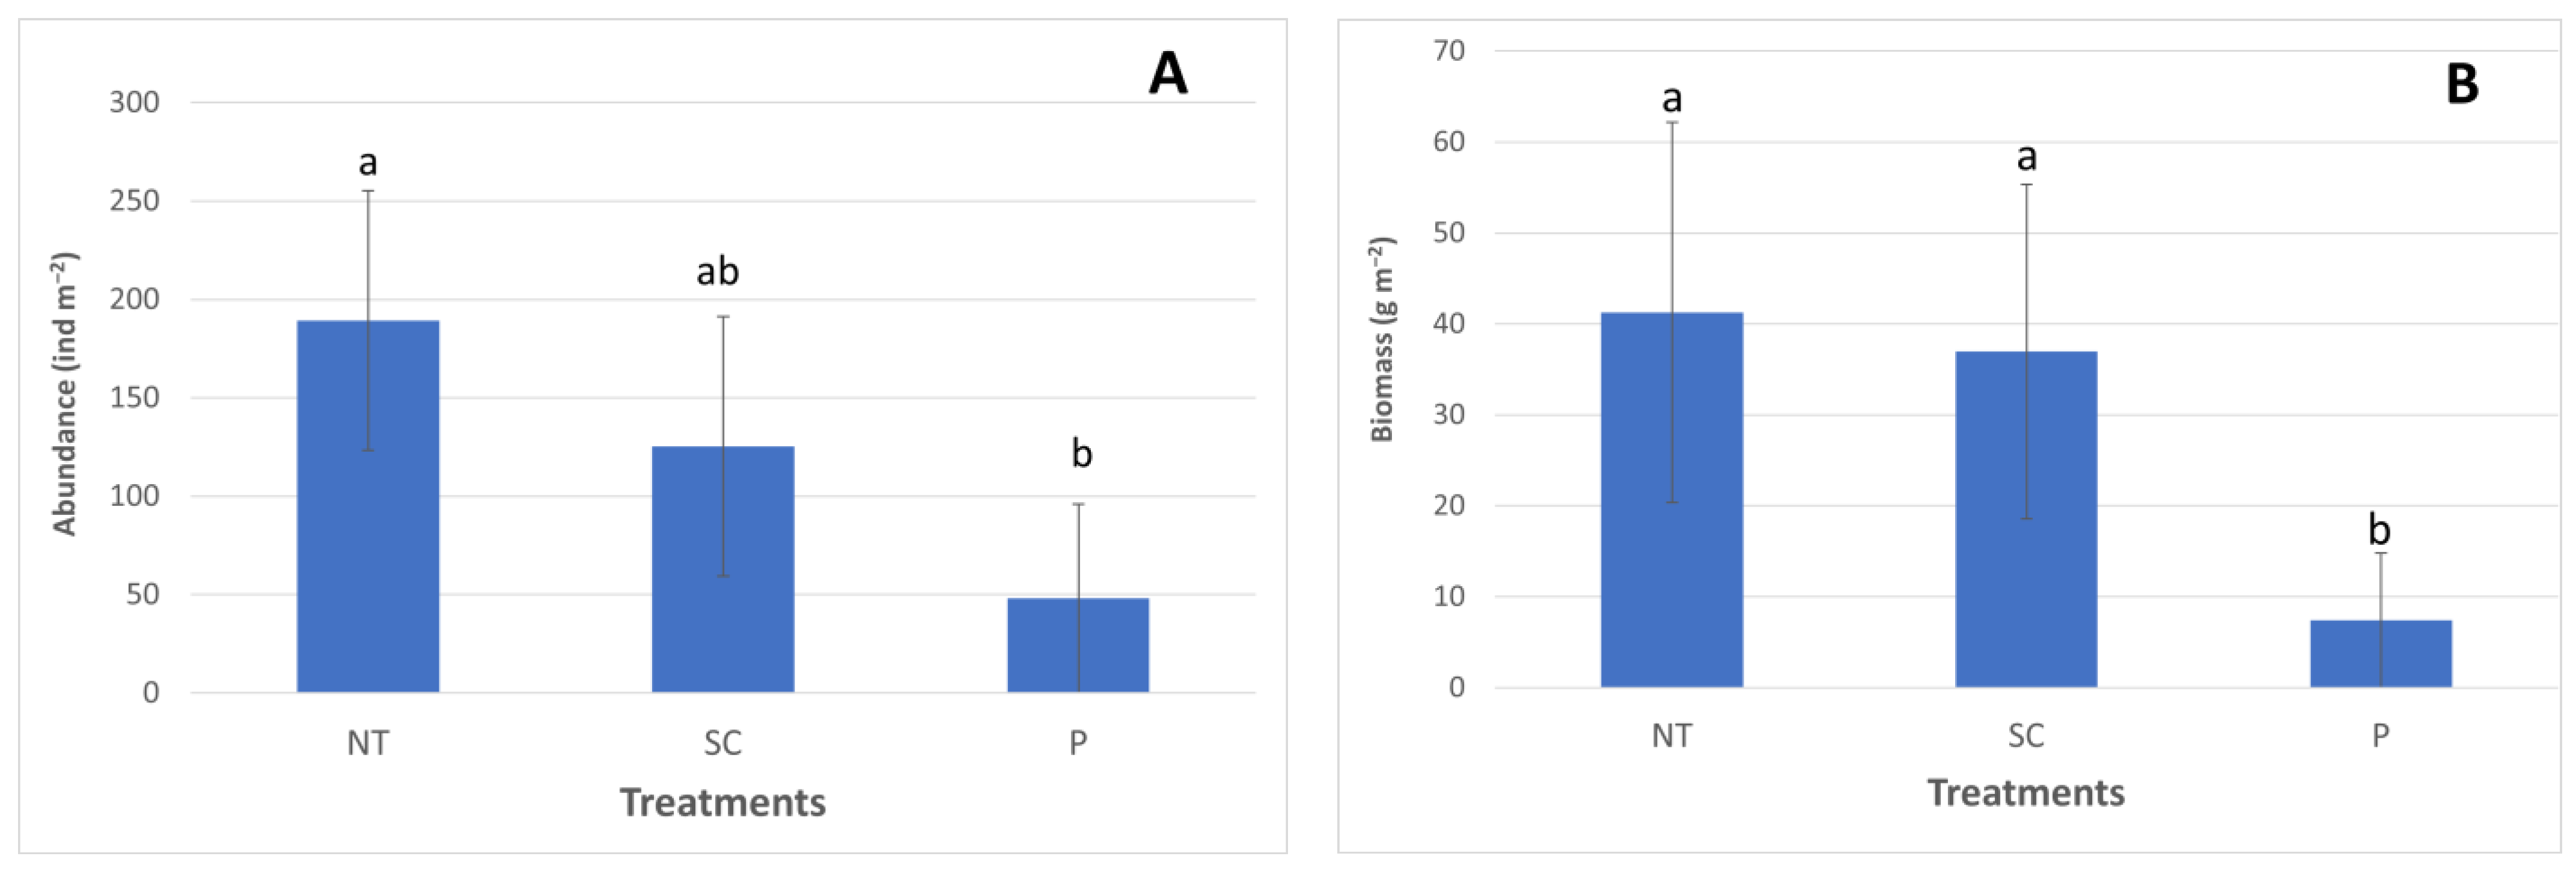
3.3. Soil Biological Parameters

The soil microbial respiration values are shown in Figure 6. The values were significantly greater in NT (22.8 CO2 mg/50 g/10 day) compared to P (10.03 CO2 mg/50 g/10 day), while SC (19.25 CO2 mg/50 g/10 day) was significantly greater than the P treatment (NT = SC > P).
The earthworm abundance values can be found in Figure 7A. The earthworm abundance values were 189.3 in NT; 125.3 in SC; and 48 ind m−2 in the P treatment. Significantly greater earthworm abundance values were found in NT compared to P.
The earthworm biomass values can be seen in Figure 7B. The biomass values were 41.26 in NT; 36.95 in SC; while the value was 7.4 g m−2 in the P treatment. Significantly greater biomass values were found in the case of NT and SC compared to the P treatment.
As for the composition of earthworm species, three species were found in the case of NT (Aporrectodea rosea, Aporrectodea georgii, Aporrectodea caliginosa), while two species were found in SC (Aporrectodea rosea, Aporrectodea caliginosa) and only one species was found in P (Aporrectodea rosea). All species belong to the endogeic morphotype. Aporrectodea rosea endogeic species was found in all treatments.
The average winter oat yield was the greatest in the case of SC (8.11 Mg ha−1), followed by NT (7.82 Mg ha−1) and then P (6.82 Mg ha−1).

4. Discussion

4.1. Physical Soil Parameters

As for our soil bulk density results, tillage methods had a significant effect on the top layer (0–10 cm) in the NT (Figure 2) treatment. It resulted in the highest bulk density value (NT = 1.48 g cm−3) compared to the other two treatments (SC = 1.22; P = 1.26 g cm−3). In the layers below, only NT differed significantly from the P treatment (NT > P). Gál et al. [43] also found significantly greater bulk density values at depth 0–30 cm for NT than for P. They found 10% greater bulk density between 0 and 5 cm; 15% in 5 and 15 cm; and 17% greater bulk density values at 15 and 30 cm depths under NT compared to the P treatment. Moussadek et al. [44] found greater bulk density values in Vertisol and Cambisol under NT compared to P. In the case of Luvisol, they also found greater bulk density for NT, except for the top layer (0–5 cm).
The soil moisture content was only measured as a background parameter based on the bulk density samples. The moisture content was quite homogenous in the top three layers in the three treatments; we only gained higher moisture values in the case of the P treatment at 30–40 cm depth.

4.2. Chemical Soil Parameters

The soil organic carbon (SOC) values in our measurements differed significantly among the three tillage treatments in the top layer (0–10 cm) (NT > SC > P) and in the lowest examined layer (30–40 cm) (P > NT = SC) (Figure 4). The SOC values showed a gradual decreasing tendency with increasing depth in the case of the NT and SC treatments, while in the P treatment, a relatively homogenous vertical SOC distribution was found throughout the examined depths (Figure 4). This was in line with the findings of Gál et al. [43], who also found a gradual decrease in SOC in their 28-year-old tillage experiment in NT (0–5 cm: 3.5; 5–15 cm: 2.6; 15–30 cm: 2.3%; 30–50 cm: 1.1%), while the SOC distribution in P within 0–30 cm was very homogenous (0–5 cm: 2.39; 5–15 cm: 2.41; and 15–30 cm: 2.45%; 30–50 cm: 1.5%). The latter might be due to the thorough mixing and turning effect of the P tillage in the topsoil and greater soil organic matter decomposition as a result of increased microbial activity in the topsoil [43,45,46].
The SOC values measured on soil samples taken in the same long-term tillage experiment, Józsefmajor, in 2015 showed slightly different tendencies in the P treatment [25]. The SOC values decreased gradually by depth, i.e., 1.8% (0–10 cm), 1.7% (10–20 cm), 1.6% (20–30 cm), and 1.5% (30–40 cm). The SOC values in NT showed a more drastic decrease by depth: 2.3; 1.8; 1.6; and 1.4%, while the tendency in SC was the following: 2.06; 2.03; 1.8; and 1.4% at the 0–10; 10–20; 20–30; and 30–40 cm depths, respectively.
As a further comparison, Ernst and Emmerling [47] found lower SOC values compared to our results in an Eutric Cambisol with silt loam (topsoil) and clay loam (subsoil) in their experimental site in Welschbillig, Southern Eifel, Germany. For P (25 cm depth), they found the following SOC values at depths 0–10; 10–20; and 20–30 cm: 1.56%; 1.52%; and 0.87%; for cultivation (15 cm depth), they found 1.79%; 1.21%; and 0.75%, while for NT, they gained 1.75; 1.14; and 0.66% SOC after ten years of tillage operation. A decreasing trend can be seen in their experiment as well.
As for the SOC stock, we found significantly greater SOC stock values under NT only in the top layer (10 cm) (37.6 t ha−1) compared to SC (29.0 t ha−1) and P (25.2 t ha−1) (Figure 5); however, the lower layers did not show significant differences, and were all lower than the SOC stock in the top layer. According to Gál et al. [43], they found similar values to our measurements at depth 5–15 cm under NT (36.4 t ha−1) and P (27.9 t ha−1) in a poorly drained Chalmers silty clay loam soil (Typic Haplaquoll). Interestingly, Ernst and Emmerling [47] found the greatest SOC stock values in P (57.8 t ha−1), in NT (54.1 t ha−1), and then in cultivation (54.1 t ha−1) within 0–30 cm; however, there was no significant difference.
Moussadek et al. [44] found similar trends for SOC stock comparing three soil types (Vertisol, Cambisol, and Luvisol) under NT (non-disturbed with 30% stubble residue) and P (ploughing at 30 cm + chisel + disc harrow for seedbed preparation; residue removal). They found significant differences in the case of Vertisol and Cambisol. The greatest total SOC stock values at 0–30 cm depth were gained in NT (Vertisol: 31.89 Mg ha−1) compared to P (28.79 Mg ha−1), followed by Cambisol NT (30.76 Mg ha−1) compared to P (28.49 Mg ha−1). The average SOC stock values for all the NT (0–30 cm) sites were 29.35 Mg ha−1, which differed significantly from P (27.35 Mg ha−1). However, it is important to bear in mind that these values were measured within a Mediterranean climate with 450 mm of annual precipitation in Merchouch Plateau, Morocco, where the measured SOC values (Vertisol: 1.22; Cambisol: 1.17; Luvisol: 0.7% at 0–15 cm depth) were also lower compared to our sites.
Other researchers have also found lower SOC stock values compared to ours. For example, Pinheiro et al. [48] found significantly greater SOC stock values in 1998 under NT (19.7 Mg ha−1 or 21.7 t ha−1) compared to conventional tillage (i.e., disk ploughing + light disk harrowing) (16.6 Mg ha−1 or 18.3 t ha−1) at 0–10 cm depth under tropical Dystrophic Red Latosol (Typic Haplortox) in Rio de Janeiro State, Brazil. The lower SOC stock values can been seen as a result of the different climate (tropical) with higher average temperature (21 °C) and higher average precipitation (1200 mm) [49].
On the contrary, Jakab et al. [49] found a lot lower SOC stock values for NT (0–10 cm: 2.89; 30–40 cm: 2.35 t ha−1) and for P (0–10 cm: 2.31; 30–40 cm: 1.91 t ha−1) in the same long-term tillage experiment in Józsefmajor, Hungary. The reason for this might be the difference in bulk density values measured in different random places and different times of year. Our measurements were carried out in September, 2020 before the actual autumn tillage operations were conducted, while their measurements were completed in June, 2019 in the stubble after harvest [49]. The plots in Józsefmajor are quite large (13 × 180 m); thus, the random sampling for bulk density could result in great differences due to the high heterogeneity of the soil.
The tendency between the SOC content (Figure 4) and SOC stock values (Figure 5) is quite similar; however, the top layer (0–10 cm) differed a lot in our research among the treatments. The reason for that is the fact that SOC stock is calculated using the bulk density and the SOC content; thus, it can expose the differences among the tillage treatments even more. Gál et al. [43] calculated the SOC stock all the way down to 100 cm and found greater statistical differences between NT and P when they calculated and expressed SOC stock on a mass (t ha−1) base compared to concentrations (SOC%). Therefore, they suggest always measuring bulk density and not only SOC% to be more precise.

4.3. Biological Parameters

Soil microbial respiration was used as an indicator of microbial activity in the soils of the three treatments. Our findings are in accordance with the literature, that soil microbial respiration is typically higher in NT when compared to reduced tillage (SC in this case) or P [50,51].
An earlier study at the same site resulted in the same conclusions regarding in situ soil respiration measurements [52]. In this study, both autotrophs and heterotrophs contributed to the measured respiration. In future research, microbial biomass, microbial diversity, and partitioning between autotrophic and heterotrophic respiration would further improve our understanding on the long-term effect of tillage. For example, Du et al. [53] found that soil autotrophic respiration is lower in P compared to NT, while heterotrophic respiration is higher in P, but this relation is affected by rainfall (soil moisture changes). All these environmental effects and the different reaction of soil microbes to temperature and moisture changes affect greenhouse gas emissions in the end, but soil microbial respiration provides information on the general activity of microbes.
Significantly greater earthworm abundance was obtained in our research under NT (189.33 ind m−2) and SC (125.33 ind m−2) compared to the P treatment (48.1 ind m−2) (Figure 7A). Similar trends, but lower values, were found in 2016 and 2017 in the same tillage experiment in Józsefmajor [25]. Significantly greater earthworm abundance was found in NT (117.3 ind m−2) compared to SC (37.3 ind m−2) and P (21.3 ind m−2) in September, 2016. In September, 2017, the greatest earthworm abundance was obtained in NT (90.67 ind m−2), then SC (74.67 ind m−2), followed by P (42.67 ind m−2) without a significant difference.
Ernst and Emmerling [47] found the following tendency for earthworm abundance, i.e., the greatest in NT (157.3 ind m−2), then P (119.3 ind m−2), followed by cultivation (113.13 ind m−2); however, for earthworm biomass, they found that cultivation gave the greatest value (109.8 g m−2), then NT (103.7 g m−2), and P (66.7 g m−2) without significant differences.
Peigné et al. [54] found statistically greater earthworm abundance and biomass in NT than in P in an irrigated cropping management (spring crops + legumes) (Southeast France); however, in their other two sites (Central France cropping system, legumes; Western France cropping system), only the earthworm biomass values were significantly greater in NT compared to P.
In our research, in September, 2020, we found only three earthworm species in total, which all belonged to the endogeic morphotype, and most of them were juveniles (NT: 71.8; SC: 78.7; P: 94.4%). Ernst and Emmerling [47] found nine species belonging to all three morphotypes (epigeic, endogeic, and anecic) with different ratios among them. In P, only six species, and significantly greater amount of endogeic (26.7 ind m−2), were found compared to NT (nine species, only 2.7 ind m−2 endogeic). Cultivation was in the middle (eight species, mostly anecic: 25.3 ind m−2), which was significantly greater than the abundance of anecic species in P. Regarding Wyss et al. [55], in their study, due to ploughing operations, the bulk density decreased, and more organic matter was transported down into deeper soil layers; thus, the abundance of endogeic earthworms could increase. Furthermore, the accessibility of soil organic matter in the root zone might be also increased by ploughing, and these endogeic earthworms are usually of a small size; thus, the risk of mechanical damage by the tillage operation is smaller. Furthermore, some endogeic earthworm species (A. rosea and A. caiginosa) are quite tolerant to mechanical soil tillage disturbances according to Ivask et al. [56]. The reason why we did not detect anecic species in this examination period (Autumn 2020) might be that we used the hand-sorting method for earthworm extraction. The anecic species make deep, permanent burrows and are more difficult to sample; thus, formalin or mustard solution extraction are more advised, just like example [48,55,57,58] carried out.
The reason for the relatively low earthworm species number in our research might be due to low soil pH values. In our case, the pH(KCl) value in NT was 4.7 (0–10 cm), which increased with depth to 5.2 (30–40 cm); SC was between 4.9 (0–10 cm) and 5.3 (30–40 cm), while P gave slightly higher values: between 5.2 (0–10 cm) and 5.3 (30–40 cm) (Figure 3). Edwards and Lofty [59] found in Rothamsted Park Grass Plots that certain earthworm species have a pH range of 5.0 to 6.0; however, their numbers decrease below or above these pH ranges. These species are Aporrectodea caliginosa, Aporrectodea rosea, and Aporrectodea nocturna. Among these species, we had two, A. caliginosa and A. rosea, which are very common species in all kinds of land uses, especially arable lands. These species probably adapted very well to these slightly acidic pH ranges.
This study indicates that tillage methods affect grain yield. However, except tillage, the climate anomalies in Hungary are characteristic and dominant in crop production. Bogunovic and Kisic [60] reported that in summer, the amount of precipitation decreases, but its distribution becomes extreme. The highest amount of grain yield obtained in SC might be due to reduced soil compaction (the lowest bulk density) and increased soil moisture storage. Among the three treatments, P reached the lowest yield. NT provides a slightly higher yield compared to P, which can be attributed to a higher amount of mulch, enhancing soil biological activity, and the better availability of moisture. Kuhn et al. [61] highlighted the advantages of NT in these years with average and below-average precipitation, where yields were increased by up to 20%.

5. Conclusions

Based on our results, we concluded that our first hypothesis (SOC content and stock will be greater under NT than SC and P) was partially proven. Under NT, the soil is left undisturbed, and the surface plant residues can provide an important source of humus formation. As we assumed, SOC values and SOC stock were the greatest in NT, providing a potential carbon storage medium for climate change mitigation in the topsoil. The SOC content of SC was lower, but it was still higher than in the P treatment. In P, the complete turn of the soil slice results in the breaking and intensive aeration of the soil aggregates, which results in SOC loss in the top soil through time. As for lower layers (30–40 cm), the SOC values and SOC stock were greater for P compared to NT and SC. This might be the result of turning the soil slice down to this depth and the accumulation of surface stubble, which provides raw organic residue for humification at this depth. Thus, we cannot generalize about SOC stock; we always need to take into account the particular soil depth.
Our second hypothesis, that earthworm abundance, biomass, and soil microbial respiration will be significantly enhanced under NT compared to the SC and P treatments, was proven. Earthworms prefer an undisturbed habitat with a high moisture content and high raw organic matter and humus content. This is provided under the NT treatments, even though bulk density is relatively high due to the low soil physical (anthropogenic) disturbance. This bulk density value can be compensated by the burrowing, mixing, and aerating activity of the earthworms to a certain extent. However, we measured greater bulk density values in the top soil under NT compared to SC and P. As for the P treatment, significantly lower earthworm abundance and biomass were found due to the high physical disturbance and turn of the whole soil slice, which ruin the burrows of the inhabiting earthworms. Regarding SC, this offers a potential alternative in terms of the degree of soil physical disturbance that gave a medium value (<1.4 g cm−3) between NT and P treatments, and the availability of the raw organic matter is also quite high, providing a pleasant habitat for earthworms with the high availability of food sources and a medium level of bulk density.
Thus, based on our research, we concluded that among these three tillage treatments (NT, SC, P), the SC offers a good alternative for providing a good soil habitat for soil biota, but it can still preserve enough SOC and SOC stock with relatively good soil bulk density values, and it can be used to replace P as a traditional tillage operation.

Author Contributions

Conceptualization, B.S. and G.G.; methodology, B.S.; statistical analysis, G.G.; formal analysis, G.G., B.S. and H.T.M.I.; laboratory analysis, H.T.M.I. and M.M.M.; writing—original draft preparation, B.S., G.G., H.T.M.I. and I.D.; writing—review and editing, B.S., G.G. and M.B.; visualization, B.S.; funding acquisition, M.B. All authors have read and agreed to the published version of the manuscript.

Funding

This research was funded by Stipendium Hungaricum Scholarship (SHE-04417-004/2019) (194689) (Hanaa Tharwat) (Hungarian University of Agriculture and Life Sciences).

Data Availability Statement

The data presented in this study are available on request from the corresponding authors.

Acknowledgments

On behalf of all the authors, I express my many thanks to the four Reviewers and the Editor for their insightful and thorough comments and constructive suggestions. We also express our deep appreciations to Benjamin Bukombe (Discovery Center Nonprofit Ltd.) for the English language corrections in the manuscript.

Conflicts of Interest

The authors declare no conflicts of interest.

References

  1. Lal, R. Managing soils and ecosystems for mitigating anthropogenic carbon emission and advancing global food security. BioScience 2010, 60, 708–721. [Google Scholar] [CrossRef]
  2. Follett, R. Soil management concepts and carbon sequestration in crop-land soils. Soil Tillage Res. 2001, 61, 77–92. [Google Scholar] [CrossRef]
  3. Kimble, J.M.; Follett, R.F.; Cole, C.V. The potential of US cropland to sequester carbon and mitigate the greenhouse effect. Am. J. Food Technol. 1998, 16, 47. [Google Scholar] [CrossRef]
  4. Sauerbeck, D. CO2 emissions and C sequestration by agriculture perspectives and limitations. Nutr. Cycl. Agroecosyst. 2001, 60, 253–266. [Google Scholar] [CrossRef]
  5. Smith, P. How long before a change in soil organic carbon can be detected? Glob. Chang. Biol. 2004, 10, 1878–1883. [Google Scholar] [CrossRef]
  6. Kan, Z.R.; Ma, S.T.; Liu, Q.Y.; Liu, B.Y.; Virk, A.L.; Qi, J.Y.; Zhao, X.; Lal, R.; Zhang, H.L. Carbon sequestration and mineralization in soil aggregates under long-term conservation tillage in the North China Plain. Catena 2020, 188, 104428. [Google Scholar] [CrossRef]
  7. Govaerts, B.; Verhulst, N.; Castellanos-Navarrete, A.; Sayre, K.D.; Dixon, J.; Dendooven, L. Conservation agriculture and soil carbon sequestration: Between myth and farmer reality. Crit. Rev. Plant Sci. 2009, 28, 97–122. [Google Scholar] [CrossRef]
  8. Poeplau, C.; Don, A. Carbon sequestration in agricultural soils via cultivation of cover crops—A meta-analysis. Agric. Ecosyst. Environ. 2015, 200, 33–41. [Google Scholar] [CrossRef]
  9. VandenBygaart, B.; Gregorich, E.; Angers, D. Influence of agricultural management on soil organic carbon: A compendium and assessment of Canadian Studies. Can. J. Soil Sci. 2003, 83, 363–380. [Google Scholar] [CrossRef]
  10. Kucharik, C.J.; Brye, K.R.; Norman, J.M.; Foley, J.A.; Gower, S.T.; Bundy, L.G. Measurements and modeling of carbon and nitrogen cycling in agroecosystems of southern Wisconsin: Potential for SOC sequestration during the next 50 years. Ecosystems 2001, 4, 237–258. [Google Scholar] [CrossRef]
  11. Reicosky, D.C. Tillage-induced CO2 emissions and carbon sequestration: Effect of secondary tillage and compaction. In Conservation Agriculture; García-Torres, L., Benites, J., Martínez-Vilela, A., Holgado-Cabrera, A., Eds.; Springer: Dordrecht, The Netherlands, 2003; pp. 291–300. [Google Scholar] [CrossRef]
  12. González-Sánchez, E.J.; Ordóñez-Fernández, R.; Carbonell-Bojollo, R.; Veroz-González, O.; Gil-Ribes, J.A. Meta-analysis on atmospheric carbon capture in Spain through the use of conservation agriculture. Soil Tillage Res. 2012, 122, 52–60. [Google Scholar] [CrossRef]
  13. Lal, R.; Delgado, J.A.; Groffman, P.M.; Millar, N.; Dell, C.; Rotz, A. Management to mitigate and adapt to climate change. J. Soil Water Conserv. 2011, 66, 276–285. [Google Scholar] [CrossRef]
  14. Hobbs, P.R.; Sayre, K.; Gupta, R.K. The role of conservation agriculture in sustainable agriculture. Phil. Trans. R. Soc. B. 2007, 363, 543–555. [Google Scholar] [CrossRef] [PubMed]
  15. Mondal, S.; Naik, S.K.; Haris, A.A.; Mishra, J.S.; Mukherjee, J.; Rao, K.K.; Bhatt, B.P. Effect of conservation tillage and rice-based cropping systems on soil aggregation characteristics and carbon dynamics in Eastern Indo-Gangetic Plain. Paddy Water Environ. 2020, 18, 573–586. [Google Scholar] [CrossRef]
  16. Zhao, Z.; Gao, S.; Lu, C.; Xiaoyu, L.I.; Li, F.; Wang, T. Effects of different tillage and fertilization management practices on soil organic carbon and aggregates under the rice–wheat rotation system. Soil Tillage Res. 2021, 212, 105071. [Google Scholar] [CrossRef]
  17. Haddaway, N.R.; Hedlund, K.; Jackson, L.E.; Kätterer, T.; Lugato, E.; Thomsen, I.K.; Jorgensen, H.B.; Isberg, P.E. How does tillage intensity affect soil organic carbon? A systematic review. Environ Evid. 2017, 6, 30. [Google Scholar] [CrossRef]
  18. Pimentel, D.; Hepperly, P.; Hanson, J.; Douds, D.; Seidel, R. Environmental, energetic, and economic comparisons of organic and conventional farming systems. BioScience 2005, 55, 573–582. [Google Scholar] [CrossRef]
  19. West, T.O.; Post, W.M. Soil organic carbon sequestration rates by tillage and crop rotation: A global data analysis. Soil Sci. Soc. Am J. 2002, 66, 1930–1946. [Google Scholar] [CrossRef]
  20. Six, J.; Elliott, E.T.; Paustian, K. Soil macroaggregate turnover and microaggregate formation: A mechanism for C sequestration under no-tillage agriculture. Soil Biol. Biochem. 2000, 32, 2099–2103. [Google Scholar] [CrossRef]
  21. Franzluebbers, A.J. Soil organic carbon sequestration and agricultural greenhouse gas emissions in the Southeastern USA. Soil Tillage Res. 2005, 83, 120–147. [Google Scholar] [CrossRef]
  22. Blanco-Cangui, H.; Lal, R. No-tillage and soil-profile carbon sequestration: An on-farm assessment. Soil Sci. Soc. Am J. 2008, 72, 693–701. [Google Scholar] [CrossRef]
  23. Tedone, L.; Verdini, L.; De Mastro, G. Effects of different types of soil management on organic carbon and nitrogen contents and the stability index of a durum wheat–faba bean rotation under a Mediterranean climate. Agronomy 2023, 13, 1298. [Google Scholar] [CrossRef]
  24. Szostek, M.; Szpunar-Krok, E.; Pawlak, R.; Stanek-Tarkowska, J.; Ilek, A. Effect of different tillage systems on soil organic carbon and enzymatic activity. Agronomy 2022, 12, 208. [Google Scholar] [CrossRef]
  25. Dekemati, I.; Simon, B.; Vinogradov, S.; Birkás, M. The effects of various tillage treatments on soil physical properties, earthworm abundance and crop yield in Hungary. Soil Tillage Res. 2019, 194, 104334. [Google Scholar] [CrossRef]
  26. Kader, M.A.; Senge, M.; Mojid, M.A.; Nakamura, K. Mulching type-induced soil moisture and temperature regimes and water use efficiency of soybean under rain-fed condition in central Japan. Int. Soil Water Conserv. Res. 2017, 5, 302–308. [Google Scholar] [CrossRef]
  27. Lal, R. Soil carbon sequestration to mitigate climate change. Geoderma 2004, 123, 1–22. [Google Scholar] [CrossRef]
  28. Six, J.; Conant, R.T.; Paul, E.; Paustian, K. Stabilization mechanisms of soil organic matter: Implications for C-saturation of soils. Plant Soil 2002, 241, 155–176. [Google Scholar] [CrossRef]
  29. Smith, P.; Martino, D.; Cai, Z.; Gwary, D.; Janzen, H.; Kumar, P.; McCarl, B.; Ogle, S.; O’Mara, F.; Rice, C.; et al. Greenhouse gas mitigation in agriculture. Philos. Trans. R. Soc. B Biol. Sci. 2008, 363, 789–813. [Google Scholar] [CrossRef]
  30. Smith, J. Soil organic carbon stocks in shallow-cultivated agroecosystems: A meta-analysis. Agric. Ecosyst. Environ. 2015, 200, 132–139. [Google Scholar]
  31. Wang, H.; Wang, S.; Yu, Q.; Zhang, Y.; Wang, R.; Li, J.; Wang, X. Ploughing/zero-tillage rotation regulates soil physicochemical properties and improves productivity of erodible soil in a residue return farming system. Land Degrad. Dev. 2021, 32, 1833–1843. [Google Scholar] [CrossRef]
  32. Lehmann, J.; Bossio, D.A.; Kogel-Knabner, I.; Rillig, M.C. The concept and future prospects of soil health. Nat. Rev. Earth Environ. 2020, 1, 544–553. [Google Scholar] [CrossRef]
  33. IUSS Working Group WRB. World Reference Base for Soil Resources 2014, Update 2015. International Soil Classification System for Naming Soils and Creating Legends for Soil Maps; World Soil Resources Reports No. 106; FAO: Rome, Italy, 2015. [Google Scholar]
  34. Dekemati, I.; Simon, B.; Bogunovic, I.; Kisic, I.; Kassai, K.; Kende, Z.; Birkás, M. Long term effects of ploughing and conservation tillage methods on earthworm abundance and crumb ratio. Agronomy 2020, 10, 1552. [Google Scholar] [CrossRef]
  35. New, M.G.; Lister, D.; Hulme, M.; Makin, I.W. A high-resolution data set of surface climate over global land areas. Clim. Res. 2002, 21, 1–25. [Google Scholar] [CrossRef]
  36. Buzás, I. (Ed.) Talaj-Talaj-És Agrokémiai Vizsgálati Módszerkönyv; Physico-Chemical and Chemical Test Methods of Soils; INDA 4231 Kiadó: Budapest, Hungary, 1993. (In Hungarian) [Google Scholar]
  37. Buzás, I. (Ed.) Talaj-És Agrokémiai Vizsgálati Módszerkönyv; Method Book for Soil and Agrochemical Analyses; Mezőgazdasági Kiadó: Budapest, Hungary, 1988. (In Hungarian) [Google Scholar]
  38. MSZ-08-0452; Use of High-Capacity Analyser Systems for Soils Analyses. Quantitative Determination of the Organic Carbon Content of the Soil on Contiflo Analyzer System. Official Hungarian Standard: Budapest, Hungary, 1980.
  39. Ellert, B.H.; Bettany, J.R. Calculation of organic matter and nutrients stored in soils under contrasting management regimes. Can. J. Soil Sci. 1995, 75, 529–538. [Google Scholar] [CrossRef]
  40. Cheng, F.; Peng, X.; Zhao, P.; Yuan, J.; Zhong, C.; Cheng, Y.; Cui, C.; Zhang, S. Soil microbial biomass, basal respiration and enzyme activity of main forest types in the Qinling Mountains. PLoS ONE 2013, 8, e67353. [Google Scholar] [CrossRef] [PubMed]
  41. ISO23611-1; Soil Quality—Sampling of Soil Invertebrates—Part 1: Hand-Sorting and Formalin Extraction of Earthworms. ISO: Geneva, Switzerland, 2006.
  42. Csuzdi, C.; Zicsi, A. Earthworms of Hungary (Annelida: Oligochaeta); Hungarian Natural History Museum: Budapest, Hungary, 2003. [Google Scholar] [CrossRef]
  43. Gál, A.; Vyn, T.J.; Michéli, E.; Kladivko, E.J.; McFee, W.W. Soil carbon and nitrogen accumulation with long-term no-till versus moldboard plowing overestimated with tilled-zone sampling depths. Soil Tillage Res. 2007, 96, 42–51. [Google Scholar] [CrossRef]
  44. Moussadek, P.; Mrabet, R.; Dahan, R.; Zouahri, A.; El Mourid, M.; Van Ranst, E. Tillage system affects soil organic carbon storage and quality in Central Morocco. Appl. Environ. Soil Sci. 2014, 2014, 654796. [Google Scholar] [CrossRef]
  45. Karlen, D.L.; Wollenhaupt, N.C.; Erbach, D.C.; Berry, E.C.; Swan, J.B.; Eash, N.S.; Jordahl, J.L. Crop residue effects on soil quality following 10-years of no-till corn. Soil Tillage Res. 1994, 31, 149–167. [Google Scholar] [CrossRef]
  46. Drijber, R.A.; Doran, J.W.; Parkhurst, A.M.; Lyon, D.J. Changes in soil microbial community structure with tillage under long-term wheat-fallow management. Soil Biol. Biochem. 2000, 32, 1419–1430. [Google Scholar] [CrossRef]
  47. Ernst, G.; Emmerling, C. Impact of five different tillage systems on soil organic carbon content and the density, biomass, and community composition of earthworms after a ten years period. Eur. J. Soil Biol. 2009, 45, 247–251. [Google Scholar] [CrossRef]
  48. Pinheiro, É.F.M.; De Campos, D.V.B.; Balieiro, F.C.; Dos Anjos, L.H.C.; Pereira, M.G. Tillage systems effects on soil carbon stocks and physical fractions of soil organic matter. Agric. Syst. 2015, 132, 35–39. [Google Scholar] [CrossRef]
  49. Jakab, G.; Madarász, B.; Masoudi, M.; Karlik, M.; Király, C.; Zacháry, D.; Filep, T.; Dekemati, I.; Centeri, C.; Al-Graiti, T.; et al. Soil organic matter gain by reduced tillage intensity: Storage, pools, and chemical composition. Soil Tillage Res. 2023, 226, 105584. [Google Scholar] [CrossRef]
  50. Jha, P.; Hati, K.M.; Dalal, R.C.; Dang, Y.P.; Kopittke, P.M.; McKenna, B.A.; Menzies, N.W. Effect of 50 Years of no-tillage, stubble retention, and nitrogen fertilization on soil respiration, easily extractable glomalin, and nitrogen mineralization. Agronomy 2022, 12, 151. [Google Scholar] [CrossRef]
  51. Mirzavand, J.; Rahmani, H.A.; Moradi-Talebbeigi, R. Biological indicators of soil quality under conventional, reduced, and no-tillage systems. Arch. Agron. Soil Sci. 2022, 68, 311–324. [Google Scholar] [CrossRef]
  52. Gelybó, G.; Barcza, Z.; Dencső, M.; Potyó, I.; Kása, I.; Horel, Á.; Pokovai, K.; Birkás, M.; Kern, A.; Hollós, R.; et al. Effect of tillage and crop type on soil respiration in a long-term field experiment on chernozem soil under temperate climate. Soil Tillage Res. 2022, 216, 105239. [Google Scholar] [CrossRef]
  53. Du, K.; Li, F.; Leng, P.; Li, Z.; Tian, C.; Qiao, Y.; Li, Z. Differential influence of no-tillage and precipitation pulses on soil heterotrophic and autotrophic respiration of summer maize in the North China Plain. Agronomy 2020, 10, 2004. [Google Scholar] [CrossRef]
  54. Peigné, J.; Cannavaciuolo, M.; Gautronneau, Y.; Aveline, A.; Giteau, J.L.; Cluzeau, D. Earthworm populations under different tillage systems in organic farming. Soil Till Res. 2009, 104, 207–214. [Google Scholar] [CrossRef]
  55. Wyss, E.; Glasstetter, M.; Kretzschmar, A. Tillage treatments and earthworm distribution in a Swiss experimental corn field. Soil Biol. Biochem. 1992, 24, 1635–1639. [Google Scholar] [CrossRef]
  56. Ivask, M.; Kuu, A.; Sizov, E. Abundance of earthworm species in Estonian arable soils. Eur. J. Soil Biol. 2007, 43, S39–S42. [Google Scholar] [CrossRef]
  57. Eisenhauer, N.; Straube, D.; Scheu, S. Efficiency of two widespread non-destructive extraction methods under dry soil conditions for different ecological earthworm groups. Eur. J. Soil Biol. 2008, 44, 141–145. [Google Scholar] [CrossRef]
  58. Gutiérrez-López, M.; Moreno, G.; Trigo, D.; Juárez, E.; Jesús, J.B.; Díaz Cosín, D.J. The efficiency of earthworm extraction methods is determined by species and soil properties in the Mediterranean communities of Central-Western Spain. Eur. J. Soil Biol. 2016, 73, 59–68. [Google Scholar] [CrossRef]
  59. Edwards, C.A.; Lofty, J.R. The invertebrate fauna of the Park Grass plots I. In Report Rothamsted Experimental Station for 1974; Rothamsted Research: Harpenden, UK, 1975; Volume 2, pp. 133–154. [Google Scholar] [CrossRef]
  60. Bogunovic, I.; Kisic, I. Soil water content in tillage induced system. In Conference: Soil and Crop Management: Adaptation and Mitigation of Climate Change; Vukadinović, V., Đurđević, B., Eds.; Croatia Soil Tillage Research Organization: Osijek, Croatia, 2013; pp. 99–107. [Google Scholar]
  61. Kuhn, N.J.; Hu, Y.; Bloemertz, L.; He, J.; Li, H.; Greenwood, P. Conservation tillage and sustainable intensification of agriculture: Regional vs. global benefit analysis. Agric. Ecosyst. Environ. 2016, 216, 155–165. [Google Scholar] [CrossRef]
Figure 1. Location of the long-term experimental farm (Józsefmajor-Hatvan, Central Hungary). (Source: [33]).
Agronomy 14 00278 g001
Figure 2. Soil bulk density values (Autumn, 2020) (P—ploughing, SC—shallow cultivation, NT—no-till). The same letters beside the bars designate no statistical difference.
Agronomy 14 00278 g002
Figure 3. The soil pH(KCl) values (Autumn, 2020). (P—ploughing, SC—shallow cultivation, NT—no-till). The same letters beside the bars designate no statistical difference.
Agronomy 14 00278 g003
Figure 4. The soil organic carbon values (Autumn, 2020). (P—ploughing, SC—shallow cultivation, NT—no-till). The same letters beside the bars designate no statistical difference.
Agronomy 14 00278 g004
Figure 5. The soil organic carbon stock values (Autumn, 2020). (P—ploughing, SC—shallow cultivation, NT—no-till). The same letters beside the bars designate no statistical difference.
Agronomy 14 00278 g005
Figure 6. The soil microbial respiration values (Autumn, 2020). (P—ploughing, SC—shallow cultivation, NT—no-till). The same letters above the bars designate no statistical difference.
Agronomy 14 00278 g006
Figure 7. (A) The earthworm abundance values (Autumn, 2020). (B) The earthworm biomass values (Autumn, 2020). (P—ploughing, SC—shallow cultivation, NT—no-till). The same letters above the bars designate no statistical difference.
Agronomy 14 00278 g007
Table 1. The timetable of agricultural management at Józsefmajor Experimental and Training Farm.
Vegetation2019/2020 winter oat
Tillage2 October 2019
Seedbed preparation3 October 2019
Seeding9 October 2019
VarietyMv Hópehely
Seeding rate175 kg ha−1
FertilizersTop dressing, 60 kg ha−1 CAN, N:27 (20 February 2020)
Crop protectionSekator OD 0.15 L ha−1 (10 April 2020)
Tango Star 1 L ha−1 (10 April 2020)
Decis Mega 0.15 L ha−1 (16 May 2020)
Harvesting15 July 2020
Growing period (day)279
Disclaimer/Publisher’s Note: The statements, opinions and data contained in all publications are solely those of the individual author(s) and contributor(s) and not of MDPI and/or the editor(s). MDPI and/or the editor(s) disclaim responsibility for any injury to people or property resulting from any ideas, methods, instructions or products referred to in the content.

