Abstract
This study delves into the detection of the mycotoxin zearalenone (ZEA) in popcorn, aligning with the broader goal of ensuring food safety and security. Employing fast, non-destructive near-infrared spectroscopy, the research analyzes 88 samples collected in France. In order to emphasize the dedication to robust methodologies, an essential element of sustainable practices, the assessment of various validation methods becomes significant. Six CART classification tree models, with a threshold of 68 µg/kg, are meticulously assessed. The study not only scrutinizes various validation strategies but also explores the concrete impact of the detection process, emphasizing sustainable practices. Model F (Kennard and Stone) is chosen for its commendable ability to generalize and its balanced performance, boasting 91% precision and 57% recall. Notably, this model excels in specificity, minimizing false positives and contributing to food safety. The identification of key wavelengths, such as 1007 nm, 1025 nm, and 1031 nm, highlights the potential for targeted interventions in crop management. In conclusion, this research showcases near-infrared spectroscopy as a sustainable approach to fortifying the food safety of popcorn, paving the way for advancements in ZEA risk detection and prevention, while minimizing environmental impact.
1. Introduction
Popcorn, Zea mays var. everta, differs from conventional corn in several ways, including a hard endosperm and an impermeable shell. The endosperm becomes expandable when subjected to heat. Popcorn also has a higher water content. The combination of these characteristics creates high internal pressure during heating, resulting in the characteristic popcorn-like bursting of the kernel [1,2]. Popcorn varieties are different from conventional corn varieties.
Mycotoxins are secondary metabolites secreted by certain phytopathogenic fungi, including Fusarium. These fungi thrive on corn, in particular [3]. For some mycotoxins, the maximum permitted content in foodstuffs is regulated by the European authorities via EC Regulation no. 1881/2006, as amended [4,5,6,7].
Ensuring compliance with the established maximum permitted content in foodstuffs is imperative to safeguard public health and prevent potential adverse effects associated with mycotoxin contamination.
Popcorn is just as susceptible to this problem as conventional maize (Zea mays L.). This work focuses on a mycotoxin, zearalenone (ZEA), synthesized under field conditions by fungal species of the genus Fusarium, mainly F. culmorum, F. graminearum, and F. crookwellense [8]. Regulatory ZEA levels are set at 100 μg/kg for maize intended for direct human consumption, maize snacks, and maize-based breakfast cereals, and 20 µg/kg for “processed corn-based foods for infants and young children”.
The main effects of ZEA include estrogenic properties that can lead to reproductive problems, particularly in animals, but also in humans [9,10,11]. The monitoring of ZEA in cereals, and popcorn in particular, is therefore of great importance. Traditional methods for detecting mycotoxins are chromatographic or immunological [8,12,13]. They are tedious, require the use of solvents, and destroy the sample. New approaches must therefore be proposed to detect risk and ensure the absence of contaminants in production.
Fast, non-destructive near-infrared spectroscopy is already widely used in the agri-food and agricultural sectors, offering the advantage of promoting sustainable agriculture by eliminating the need for chemical reagents, minimizing environmental impact, and ensuring resource-efficient farming practices [14]. It is a vibrational spectroscopy that studies the interaction between electromagnetic radiation and chemical bonds in matter [15]. Its use goes hand in hand with chemometrics, which is used to extract useful information [16]. Among the mathematical tools available, classification approaches are commonly used [17].
A few articles deal with the detection of mycotoxins by near-infrared spectroscopy, but few deal with the detection of ZEA in conventional maize (Zea mays L.) [3,13]. Tyska et al. quantified the ZEA content from 440 maize samples with an RPD (residual prediction deviation) of 2.71; however, an RPD in the 2.4–3.0 range indicates a model useful only for very rough quality screening [18,19]. The authors have identified the following spectral zones: between 400 and 500, 1200 and 1900 nm, and 2100 and 2400 nm, which is in line with the findings of previous studies [20]. In the work by Tyska et al., ZEA levels ranged from 20.0 to 834.8 μg/kg; the mean value and standard deviation were 123.5 μg/kg and 189.1 μg/kg.
To our knowledge, no study deals with infrared spectroscopy applied to popcorn to detect zearalenon. Indeed, distinct from conventional corn, popcorn (Zea mays var. everta) poses unique challenges in its hard endosperm and impermeable shell. Both popcorn and traditional maize face mycotoxin concerns, particularly zearalenone (ZEA). This study employs non-destructive near-infrared spectroscopy, focusing on sustainable methodologies to enhance food safety, specifically aiming to detect ZEA in popcorn.
2. Materials and Methods
2.1. Popcorn Samples
Eighty-eight samples of naturally contaminated popcorn weighing approximately 1 kg each were collected in 2019 in southwest France. ZEA content was determined by LC–MS/MS by a private accredited institution (Phytocontrol®, Nimes, France—http://www.phytocontrol.com/ accessed on 17 January 2024), using accredited methods. This institution is specialized in pesticide and contaminant residue detection with accreditation ISO 17025 [21] delivered by French Council for Accreditation, Audit, and Control (COFRAC) [22].
2.2. Collecting Near-Infrared Spectra
A MicroNIR OnSite spectrometer (Viavi Solutions Inc., San Jose, CA, USA) was used in reflectance mode to acquire NIR spectra from whole grains over the spectral range 908–1676 nm (125 variables). Each spectrum is the average of 100 scans taken with an integration time of 10 ms and a spectral resolution of 6 nm. The averaged reflectance spectra were converted into absorbance spectra by using the Viavi spectrometer software MicroNIRTM Pro v2.5. The use of a portable spectrometer, combined with whole-grain scanning, was chosen for the purpose of a potential future direct on-field application.
2.3. Statistical Approach and Data Mining
2.3.1. Transformation and Discretization of Zearalenone Levels
A neperian logarithmic transformation was performed on the corn zearalenone levels to make the distribution more consistent with a normal structure. A fixed constant was added to all observations after the transformation to ensure positive values. The data were then discretized into two classes of equal size (where possible). The neperian logarithmic transformation and discretization were performed with Xlstat statistical software (version 2023.2.0) [23].
We opted for a discretization with equal numbers, leading to the establishment of a threshold of 68 µg/kg zearalenone (ZEA). It should be noted that European regulations set this threshold at 100 µg/kg. By choosing a stricter discretization than the regulatory standard, we position ourselves on a more drastic threshold. This approach offers the advantage of considering a margin of error around the chosen threshold, which allows us to consider the uncertainty associated with model accuracy. By setting a threshold slightly below the regulatory standard, we build in a safety margin to absorb possible model inaccuracies. This added prudence contributes to more cautious risk management and strengthens the reliability of the results obtained.
2.3.2. Pre-Processing of Near-Infrared Spectra
When analyzing infrared spectra, various mathematical pre-processing techniques are applied to improve the quality of the spectral data and facilitate their interpretation. Some of these pre-processing techniques are performed on individual spectra, while others exploit the power of averaging to enhance common features [24].
Classical pre-processing techniques are mainly Savistky–Golay derivatives, MSC or SNV, with or without detrend. The derivative operation is performed spectrum by spectrum, so that changes in spectral intensities are evaluated for each point in the spectrum, and therefore for each wavelength. This approach accentuates local variations and highlights the specific characteristics of each infrared spectrum. The MSC (multiplicative scatter correction) and SNV (standard normal variate) ± detrend operations are performed considering all the spectra in the dataset. These pre-processing techniques aim to correct systematic variations and dispersion effects due to factors such as sample thickness or surface roughness. By applying these corrections to the entire dataset, we aim to normalize the overall spectral information [24].
In the preliminary phase of our study, we explored these various mathematical pre-processing techniques. The most promising results in terms of CART tree construction performance were obtained when applying a first-order Savitzky–Golay derivative. The particularity of applying the derivative individually to each spectrum also offers the possibility of comparing the performance of validation methods without introducing bias. As a result, this specific mathematical pre-treatment was chosen for the correction of the spectra.
2.3.3. CART Classification Tree and Confusion Matrix
Post-derivative absorbances, measured at different wavelengths between 914 and 1670 nm, will be used as input variables in the model (123 variables). Membership of category 1 or 2, representing low or high ZEA content in maize, will be used as the variable to be explained. The supervised learning method chosen to model class 1 or 2 membership is a classification and regression tree (CART). The CART classification tree is widely used for data classification. It uses an iterative approach to binary partitioning of data through the nodes of a tree, seeking to maximize the purity of classes in each partition. The Gini index is used as a dividing criterion to measure node impurity [25]. A very important element in the CART algorithm is the minimum number of cases required to divide an internal node. This regulates the complexity of the tree and avoids overfitting to the training set data. This threshold was set at 10 for all models. Similarly, a threshold was specified for the minimum number of cases required to create a terminal node, so that the leaves of the tree represent sufficiently significant groups. This threshold was set at 3 for all models. The a priori probabilities of the classes are equal at the outset; indeed, with 45 and 43 popcorn samples per class, this choice is consistent. In this case, the algorithm takes a neutral approach right from the start of the tree-building process [25].
The model is run on the 273 unaveraged spectra. The performance of a discrimination model, such as CART, applied to a binary variable to be explained makes it possible to compile the performance in a confusion matrix [26]. The target class, referred to as the positive class or class of interest, is class 2, corresponding to samples with high levels of zearalenone. The confusion matrix is a two-entry table that compares model predictions with actual class labels. The confusion matrix is made up of four elements: true positives (VP), false positives (FP), true negatives (VN), and false negatives (FN). The definitions are as follows:
- True Positive (TP): Number of samples correctly predicted as belonging to class 2. This would mean correctly classifying a corn sample as having mycotoxin levels above the regulatory threshold. This is a desirable classification as it identifies samples that need to be treated or disposed of to meet standards.
- False Positive (FP): Number of samples incorrectly predicted as belonging to class 2 (when they belong to class 1). This would mean incorrectly classifying a corn sample as having mycotoxin levels above the threshold when it is below the threshold. This could lead to unnecessary costs, such as rejecting healthy corn.
- True Negative (TN): Number of samples correctly predicted as not belonging to class 2. This means correctly classifying a corn sample as having mycotoxin levels below the regulatory threshold, which is a desired classification.
- False Negative (FN): Number of samples incorrectly predicted as not belonging to class 2 (when, in fact, they do belong to class 2). This means incorrectly classifying a corn sample as having mycotoxin levels below the threshold when it is above the threshold. This could result in contaminated corn being harvested and distributed.
The confusion matrix is shown in Table 1.

Table 1.
Binary confusion matrix presentation.
To choose the best CART classification model, the question arises as to which classification error has a higher cost. In this case, the cost of the False Negative (FN) could be higher, as failing to detect a contaminated corn sample could have more serious consequences, including animal and human health risks and regulatory sanctions. TP, FP, TN, and FN are used to calculate various evaluation metrics such as precision, recall, false positive rate, specificity, and F-score, which are crucial for assessing the robustness and efficiency of the CART binary prediction model [27]. Accuracy is the ratio of correct positive predictions to total positive predictions. This provides a ratio of the number of true positive predictions out of the number of all positive predictions.
Accuracy = (TP)/(TP + FP)
Recall or Sensitivity (or TPR (True Positive Rate)) indicates, out of all positive spectra, how many are predicted correctly.
Recall = (TP)/(TP + FN)
The F-score combines precision and recall, balancing them while favoring high performance in both. A high F-score is generally desirable, as it indicates a balanced performance between precision and recall. An F-score of 1 represents perfect performance, where both precision and recall are at their maximum.
F-score = (2 × Precision × Recall)/(Precision + Recall)
The area under the ROC curve (receiver operating characteristic) is a curve representing the relationship between the rate of true positives (sensitivity) and the rate of false positives (1—specificity) for different classification thresholds.
2.3.4. Presentation of the Six Validation Strategies to Predict Contamination of Popcorn by Zearalenon
Different validation strategies were evaluated to challenge the CART model. Firstly, scenario A is without separate validation. The entire dataset was used to train the model without reserving a validation set. Secondly, scenario B involves cross-validation, partitioning the dataset into learning and validation subsets. A 10-subset validation was chosen. In parallel, an external validation approach was based on two distinct sets: a training set (train) and a test set. In this case, 80% of the data was allocated to the training set and the remaining 20% to the test set, chosen at random (scenarios C and D). In addition, an alternative validation method using Kennard and Stone’s technique was also tested to create the training set and the test set (scenarios E and F).
In the process of dividing the data into learning and test sets, two distinct approaches were explored to assess the impact of the mean of the repetitions on the constitution of these sets. The first approach was carried out without averaging the x repetitions of the same spectrum. As a result, it is possible that the different repetitions of a spectrum of a maize sample are split between the training set and the test set. The aim of this method is to assess the model’s ability to generalize to spectra, even if they are distributed between the two sets. The second approach involved averaging the n spectral replicates of a single sample. In this way, all the repetitions of a maize sample are included in the same set, whether for learning or testing. This method was adopted to check whether the overall coherence of a spectrum, obtained by averaging, can significantly influence model performance. The use of these two approaches, random and Kennard and Stone, made it possible to study the impact of the mean of spectral repetitions on the robustness of the model in terms of generalization, taking into account both the variability between repetitions of the same sample and the overall representation of the latter’s spectrum in the data set.
These different validation approaches enabled us to assess the robustness of the CART model under different validation conditions. Table 2 summarizes the validation criteria.
Table 2.
Comparative Analysis of Training Set Configurations.
The performance of the different validation methods will be compared across the validation set to give a realistic assessment of the models’ ability to generalize to new data.
3. Results and Discussion
3.1. Zearalenone Levels in Popcorn Samples
The histogram of the 88 ZEA levels shows a peculiar distribution, characterized by an abundance of low levels, to the detriment of high levels. The distribution of ZEA levels ranges from 0 to 6021 µg/kg. Most values are low, with a first quartile at 22.5 µg/kg and a median at 58.5 µg/kg. Higher values are rare, as shown by the third quartile at 395.5 µg/kg. The mean is 501.3 µg/kg, but the range between values is quite wide, with a standard deviation of 1076.4 µg/kg. ZEA levels are concentrated around the smaller values, although a few larger values tend to raise the average. After applying the natural logarithm and discretization, the samples are grouped into two classes. A statistical analysis of the zearalenone levels in the two popcorn classes reveals significant differences. In category 1, comprising 45 observations, the distribution appears concentrated, ranging from 0 to 61 µg/kg for minimum and maximum values, indicating some variability. The average amount of zearalenone in this category is around 24.2 µg, and the individual values seem to cluster around this average without deviating significantly. In category 2, on the other hand, which contains 43 samples, the distribution is more spread out, ranging from 68 to 6021 µg/kg. The quartiles and median show a wide dispersion of values, with a standard deviation of 1378.6 µg/kg, indicating significant variability. The high mean of 1000.5 µg/kg is particularly influenced by the high values. The detection of ZEA levels exceeding European regulatory thresholds raises concerns about food safety. High levels, noticeable in the second category by widespread variability, suggest possible increased contamination. This highlights the importance of adopting monitoring and prevention measures to ensure compliance with regulatory standards, thus contributing to the protection of public health and the sustainability of agricultural practices.
3.2. Near-Infrared Spectra
Figure 1 shows the average spectra of the first Savitzky–Golay derivative, obtained from the 88 samples. It shows the most differentiating wavelength ranges between the corn samples.
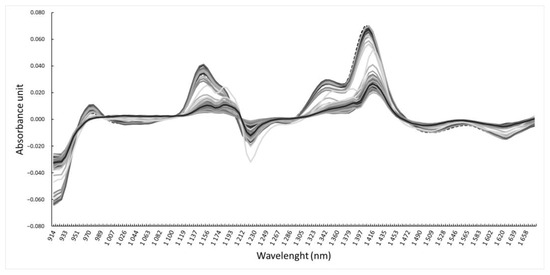
Figure 1.
Spectral Analysis: Average Savitzky–Golay First Derivative Spectra from 88 Corn Samples.
3.3. CART Model Performance
Table 3 and Figure 2 summarize the performance of the CART models, grouping together the various metrics.
Table 3.
Performance Metrics of CART Models with Different Validation Methods and Selected Variables.
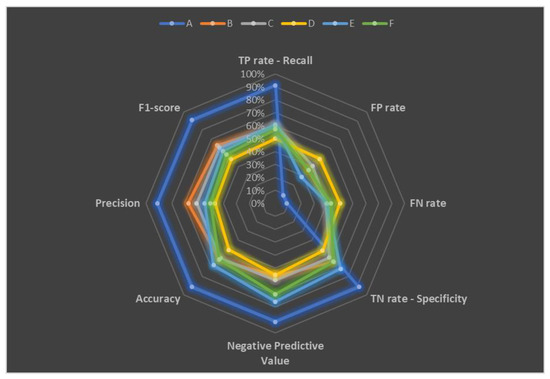
Figure 2.
Comparative Radar Chart of Performance Metrics for CART Models with Various Validation Methods.
The number of significant variables (wavelengths) varies among the models, with Model A using virtually all variables (121 out of 123), closely followed by Model B with 118 significant variables out of 123. Models C, D, and E present significant variable numbers of 74, 66, and 100, respectively, while Model F stands out with only 11 significant variables out of 123. Model A uses almost all available variables, which may indicate a risk of overfitting, especially if these variables are not all truly informative in predicting zearalenone risk. Models C, D, and E have smaller numbers of important variables, which may indicate a better ability to extract essential information from the CART model while reducing its complexity. Model F stands out with just 11 significant variables, which may indicate a more parsimonious and potentially more generalizable approach. This could potentially lead to the development of a low-cost spectrometer using only 11 wavelengths, suggesting a more efficient and economical approach, which can reduce costs for farmers and grain collection organizations.
To emphasize the commitment to robust methodologies, an essential element of sustainable practices, the evaluation of various validation methods becomes important. The detailed model performances are presented here. A detailed analysis of performance in terms of the ROC curve (receiver operating characteristic) and true positive (sensitivity) and false positive (1—specificity) rates at different classification thresholds reveals differences. Model A stands out with a remarkably high area under the ROC curve (AUC) of 0.9658, indicating a unique ability to discriminate between positive and negative classes. In contrast, Models B, C, D, and F display the lowest AUC around 0.6; this suggests a less robust separation between classes. Model E shows intermediate performance, with an AUC of 0.71. Evaluating the true positive (recall) rates in each model offers significant insight into their ability to correctly identify positive cases from the pool of true positives. Model A stands out with an exceptionally high recall of 91%, underlining its remarkable ability to detect positive cases. In contrast, Model D has the lowest recall at 50%, indicating a poorer ability to identify these cases compared to the other models. Models B, C, and E show relatively similar recalls, hovering around 60–61%, demonstrating similar performance in detecting positive cases. Model F, with a recall of 57%, is positioned between models B, C, and E. An analysis of the false positive rates (FP rate) indicates their ability to avoid misclassifying negative samples as positive, which is of great importance in the context where the positive case is defined by the presence of a high level of zearalenone. Model A stands out with the lowest FP rate at 9%, suggesting an excellent ability to minimize false positives. In contrast, Models B, E, and F show relatively similar FP rates, but Model B stands out with the highest FP rate at 36%, indicating a tendency to incorrectly classify a significant number of negative samples as positive. Model D has the highest FP rate at 48%, underlining a lesser ability to avoid these misclassifications. An evaluation of the false negative rate (FN rate) indicates the ability of the CART model to avoid the misclassification of positive samples as negative. Model A stands out with the lowest FN rate at 9%, making it the most effective at minimizing false negatives and correctly identifying positive cases. Conversely, Model D has the highest FN rate at 50%, suggesting that it can easily miss some positive cases. Models C and E show relatively similar FN rates, varying around 39–40%, demonstrating comparable performance in detecting positive cases. An evaluation of the true negative rates (TN rate) indicates their ability to correctly classify negative samples. Model A stands out with the highest TN rate at 91%. Models B, E, and F have relatively similar TN rates, around 64–71%. Model D, on the other hand, has the lowest TN rate at 52%, indicating a lower ability to avoid false positives than the other models. The evaluation of negative predictive values (NPV) offers a very important insight into their ability to accurately predict negative cases among all negative predictions. Model A stands out with the highest NPV at 91%. Conversely, Model B has the lowest NPV at 56%. Models C and D are relatively close in NPV, with Model D at 55%. On the other hand, Models E and F stand out with higher NPVs, reaching 76% and 70%, respectively.
Accuracy, precision, and F-score give us a more global view of performance. Model A has the best overall accuracy, with an accuracy of 91%, indicating robust performance in classifying maize samples, although caution is advised due to the risk of overfitting since the training set is also used for validation. Models B, C, and F show relatively close accuracies, varying around 61–62%. Model D, on the other hand, shows a relatively low accuracy of 51%, indicating a lower performance than the other models. An evaluation of the accuracies of the six CART models indicates their ability to correctly classify positive samples among all positive predictions. Model A shows the best accuracy at 91%, while Models B, C, E, and F show relatively close accuracies around 60–67%. Model D has the lowest accuracy at 48% and will tend to generate more false positives. F-score analysis provides a comprehensive performance analysis, considering both precision and recall. Model A again stands out with the highest F-score at 91%. This reflects an optimal balance between minimizing false positives and maximizing the detection of true positives. Models B, C, E, and F perform equally well in terms of the balance between precision and recall. Model D, on the other hand, has the lowest F-score at 48%.
More globally, Model A, which uses all the data for training, has a balanced performance with true positives (TP) and true negatives (TN) at 91%. However, it has a higher recall than specificity, indicating a tendency to detect more positive cases. Models C, D, E, and F, which use random or Kennard-Stone separation, show variable performance. Model C appears to have a balance between recall and specificity, while Model D has higher specificity but lower recall. Models E and F used Kennard and Stone for sampling. Although Model E shows higher specificity, Model F has higher recall. This may indicate that the Kennard and Stone method is better suited to capturing the variability of positive cases. Regarding the use of an external validation set (training and test set—models C, D, E, F) or cross-validation (model B), model A, which is not challenged with a validation method, shows overall high performance, and is a victim of overfitting.
After a thorough analysis of the performance of the six CART models, it is difficult to declare one model as the absolute best, as the choice depends on the user’s specific priorities. However, certain observations can guide model selection according to objectives. If the main priority is to minimize errors linked to positive cases, i.e., not to err on the side of samples with mycotoxin content above the threshold, models C and F stand out by showing balanced performance between recall and specificity. Model C, with random sample selection, shows a balance between recall and specificity. This approach could be preferred if the balance between detecting positive cases and minimizing false positives is a priority. Model F, using Kennard and Stone, has a higher recall. Although its specificity is slightly lower, it offers an interesting alternative for capturing the variability of positive cases. It seems that random selection with a balance between recall and specificity (model C) or the use of Kennard and Stone with higher recall (model F) could be promising approaches. Model F was chosen for the rest of the study. The choice of the F model in the context of mycotoxin risk detection is justified by its ability to offer a higher level of recall, meaning that it is more effective at identifying positive cases, i.e., samples with a mycotoxin content exceeding the regulatory threshold. This feature is crucial in food safety, as it minimizes the risk of potentially dangerous samples going undetected. Comparing our study to the ones conducted by Ning et al. and Tyska et al. [3,13] highlights the advantages and limitations of our approach. The three studies focus on the detection of zearalenone (ZEA) in cereal crops but differ in several crucial aspects of their methodology and results. Zearalenone content ranges differ from one study to another. Ning et al. observed variations between 15 and 65 µg.g−1 and Tyska et al. worked with contents ranging from 20 to 884 µg.kg−1, while our study examined a wider range from 0 to 6021 µg.kg−1. In terms of spectral range, Ning et al. worked with a range of 900–1600 nm and Tyska et al. extended theirs to 400–2500 nm, while our study covered a range almost similar to that of Tyska et al. (908–1676 nm). Variations in these spectral ranges can influence the model’s ability to detect subtle variations in ZEA content. Unlike the other two studies, Ning et al. used variable selection algorithms. While the other authors chose a quantification approach, our study proposes a threshold-based classification approach. In terms of model performance, Ning et al. obtained a prediction correlation coefficient of 0.99, a root-mean-square error of prediction (RMSEP) of 2.1 μg.kg−1, and a RPD of 6.0. Tyska et al. reported a coefficient of determination (r2) of 0.984, a standard error of prediction (SDEP) of 69.8 µg.kg−1, and a prediction performance factor (RPD) of 2.71. Our study showed that the F model, designed for classification, achieved 91% accuracy and 57% recall with a threshold of 68 µg.kg−1. In conclusion, although these studies share a common objective of ZEA detection in cereal crops, differences in methodologies, spectral ranges, variable selection algorithms, and model performance highlight the diversity of approaches in this area of research, each with its own advantages and considerations.
3.4. The Most Significative Wavelengths for Discriminating Zearalenone-Contaminated Popcorn Samples
Table 4 illustrates the relative importance of the variables in the construction of the CART tree for Model F. Each of the 11 most influential wavelengths (nm) is associated with its respective percentage contribution to the construction of the tree.
Table 4.
Relative Importance of Key Wavelengths in the Construction of Spectral Trees.
The wavelength at 1007 nm occupies the predominant position with a relative importance of 100%, underlining its central role in tree decision-making. Wavelengths at 1025 nm, 1031 nm, and 1001 nm follow in terms of importance, contributing significantly to tree construction with respective percentages of 32%, 29.1%, and 28.8%. Other notable wavelengths are those at 1062 nm, 1013 nm, 1657 nm, 1670 nm, 1465 nm, 1459 nm, and 1663 nm. Wavelengths between 1001 and 1062 nm correspond to the second harmonic region of the R-NH2 bond, which may be linked to the presence of compounds containing a primary amine (NH2). Wavelengths between 1657 and 1670 nm correspond to the first harmonic region of the C-H bond. C-H bonds are common in organic compounds. The presence of these vibrations may be linked to the overall chemical composition of the sample, which varies in the presence of Fusarium, the fungi responsible for mycotoxin production. Finally, those around 1459–1465 nm tend to indicate the region of the first O-H harmonic. The O-H bond is characteristic of hydroxyl groups often present in compounds containing water or alcohol functional groups. This may be associated with the presence of molds, as these organisms can produce water as they grow [28]. In comparison, Tyska et al. identified broader spectral zones (between 400 and 500, 1200 and 1900 nm, and 2100 and 2400 nm). The decomposition of the most influential wavelengths for this model highlighted the three spectral regions associated with zearalenone risk. This has the potential to result in the creation of an affordable spectrometer utilizing merely 11 wavelengths, indicating a more effective and cost-efficient method that may lower expenses for both farmers and grain collection organizations. So, although the use of a field spectrometer has its limitations, which include limited precision and spectral resolution, as well as reduced autonomy in the field (computer battery), this trial enabled us to target around ten wavelengths of interest.
Another application of our work could be to use another spectrometer to target the wavelengths selected in this work. The applicability depends on several factors: (1) the spectrometer we wish to use must have a spectral range that covers the selected wavelengths, (2) we must ensure that the spectral resolution of the new instrument is sufficient to capture the fine features present in the selected wavelengths, (3) the two infrared spectrometers must be calibrated, and (4) we must make a model transfer developed on the first spectrometer to the other to ensure its robustness and accuracy. Adjustments and validations can be necessary to adapt the model to the new instrument and ensure that predictions remain accurate.
4. Conclusions
In conclusion, this study has several significant merits, highlighting its importance in the context of detecting the mycotoxin zearalenone (ZEA) in popcorn, and contributing to the wider aims of ensuring food safety. The adoption of near-infrared spectroscopy offers a rapid, non-destructive approach to ZEA detection. This innovative method enables popcorn samples to be analyzed efficiently while minimizing sample disturbance. The central objective of the study is food safety, highlighting the importance of guaranteeing the quality of food products by identifying the presence of the mycotoxin ZEA, which may have implications for human health. The study has the merit of using a rigorous evaluation of validation methodologies. The study explores six CART classification tree models, with a specific threshold of 68 µg/kg. This approach offers a detailed methodology for sample classification, with particular attention to precision and recall, thus enhancing the reliability of the results. The selection of the F model based on the Kennard and Stone method is justified by its excellent generalization capabilities, 91% accuracy, and a notable balance between precision and recall. Its high specificity minimizes false positives, contributing to enhanced food safety. The identification of key wavelengths, notably at 1007 nm, 1025 nm, and 1031 nm, offers valuable information for targeted interventions in crop management, demonstrating the practical applicability of the results with a sustainable perspective. However, precautions must be taken to avoid overfitting, and the choice of the validation method must be guided by the user’s specific priorities. Near-infrared spectroscopy treats popcorn in the same way as conventional maize. Variability between classification models is significant. Model A, with a single training set, is overfitting. A detailed analysis of the various performance metrics provides a nuanced view of the strengths and weaknesses of each model. Model F (Kennard and Stone), with associated spectral repetitions in the same set, and combined with external validation, was preferred for further study, as it offers a better capacity for generalization.
Limitations of the study include the following: (1) a limited sample size, (2) a specific sample geography, (3) the temporal variability of samples, and (4) a dependence of the infrared tool on specific instrumentation and calibration conditions, which could pose challenges when applied in other environments or with different equipment.
The main avenues for improvement are (1) data enrichment with samples collected in other years. This will increase inter-annual and regional variability [29]; (2) adjusting the hyperparameters of CART models could improve their performance—fine-tuning could be envisaged for this purpose [30]; and (3) the quantification of Fusarium through ergosterol content, for example [3]. Another avenue of exploration could be to work on masked forms of zearalenone [31,32] and its metabolites [10,33]. Another area for improvement could be the use of a variable selection method, which could be an essential level for maximizing model efficiency [34]. The SIMCA method or support vector machines algorithm could also be tested. The SIMCA (soft independent modeling of class analogy) method is based on the principle of principal component analysis (PCA) applied to each individual class. Support vector machines (SVMs) are machine learning models that seek to construct an optimal hyperplane to separate data of different classes in a multidimensional space, maximizing the margin between these classes [35,36].
As mentioned in previous studies, the NIR spectrum does not directly indicate the presence of mycotoxins, but is the fingerprint of the impact of fungal contamination and mycotoxin secretion on and in maize (the loss of important nutrients such as proteins, fats, and vitamins) [3,37].
Author Contributions
Conceptualization, P.S., C.L.-G. and D.K.; methodology, P.S., C.L.-G. and D.K.; software, P.S. and C.L.-G.; validation, P.S. and C.L.-G.; formal analysis, P.S. and C.L.-G.; investigation, C.L.-G.; resources, C.L.-G. and D.K.; data curation, C.L.-G. and D.K.; writing—original draft preparation, P.S. and C.L.-G.; writing—review and editing, P.S., C.L.-G. and D.K.; visualization, P.S. and C.L.-G.; supervision, C.L.-G. and D.K.; project administration, C.L.-G. and D.K.; funding acquisition, C.L.-G. and D.K. All authors have read and agreed to the published version of the manuscript.
Funding
This work was financed by ANRT (Association Nationale de la Recherche et de la Technologie) France (grant n° 2018/1851). Our thanks go to the Nataïs company (Bézéril, France) for supplying the popcorn samples and ZEA levels.
Institutional Review Board Statement
Not applicable.
Informed Consent Statement
Not applicable.
Data Availability Statement
Data is unavailable due to privacy considerations.
Conflicts of Interest
Author P. Schambri was employed by the company Nataïs. The remaining authors declare that the research was conducted in the absence of any commercial or financial relationships that could be construed as a potential conflict of interest.
References
- Virot, E.; Ponomarenko, A. Popcorn: Critical temperature, jump and sound. J. R. Soc. Interface 2015, 12, 20141247. [Google Scholar] [CrossRef]
- Swarnakar, A.K.; Mohapatra, M.; Das, S.K. A review on processes, mechanisms, and quality influencing parameters for puffing and popping of grains. J. Food Process. Preserv. 2022, 46, e16891. [Google Scholar] [CrossRef]
- Tyska, D.; Mallmann, A.O.; Vidal, J.K.; Almeida, C.A.A.d.; Gressler, L.T.; Mallmann, C.A. Multivariate method for prediction of fumonisins B1 and B2 and zearalenone in Brazilian maize using Near Infrared Spectroscopy (NIR). PLoS ONE 2021, 16, e0244957. [Google Scholar] [CrossRef]
- European Commission. Commission Regulation (EC) No. 1881/2006 setting maximum levels for certain contaminants in foodstuffs. Off. J. Eur. Union 2006, 364, 5–24. [Google Scholar]
- Commission des Communautés Européennes. Commission du 28 septembre 2007 modifiant le réglement (CE) n°1881/2006 portant fixation de teneurs maximales pour certains contaminants dans les denrées alimentaires en ce qui concerne les toxines de Fusarium dans le maïs et les produits à base de maïs. J. Off. L’Union Eur. 2007, 1126/2007, 14–17. [Google Scholar]
- European Commission. Commission Regulation (EC) No 1126/2007 of 28 September 2007 amending Regulation (EC) No 1881/2006 setting maximum levels for certain contaminants in foodstuffs as regards Fusarium toxins in maize and maize products. Off. J. Eur. Union 2007, L255, 14–16. [Google Scholar]
- European Commission. Commission Recommendation of 17 August 2006 on the Presence of Deoxynivalenol, Zearalenone, Ochratoxin A, T-2 and HT-2 and Fumonisins in Products Intended for Animal Nutrition (2006/576/EC as Amended) (OJ. L./229/7). Off. J. Eur. Union. 2006, 229, 7–9. [Google Scholar]
- Ji, F.; He, D.; Olaniran, A.; Mokoena, M.; Xu, J.; Shi, J. Occurrence, toxicity, production and detection of Fusarium mycotoxin: A review. Food Prod. Process. Nutr. 2019, 1, 1–14. [Google Scholar] [CrossRef]
- Braun, M.S.; Wink, M. Exposure, occurrence, and chemistry of fumonisins and their cryptic derivatives. Compr. Rev. Food Sci. Food Saf. 2018, 17, 769–791. [Google Scholar] [CrossRef]
- Ropejko, K.; Twarużek, M. Zearalenone and Its Metabolites—General Overview, Occurrence, and Toxicity. Toxins 2021, 13, 35. [Google Scholar] [CrossRef]
- Mahato, D.K.; Devi, S.; Pandhi, S.; Sharma, B.; Maurya, K.K.; Mishra, S.; Dhawan, K.; Selvakumar, R.; Kamle, M.; Mishra, A.K.; et al. Occurrence, Impact on Agriculture, Human Health, and Management Strategies of Zearalenone in Food and Feed: A Review. Toxins 2021, 13, 92. [Google Scholar] [CrossRef]
- Caglayan, M.O.; Şahin, S.; Üstündağ, Z. Detection strategies of zearalenone for food safety: A review. Crit. Rev. Anal. Chem. 2022, 52, 294–313. [Google Scholar] [CrossRef]
- Ning, H.; Wang, J.; Jiang, H.; Chen, Q. Quantitative detection of zearalenone in wheat grains based on near-infrared spectroscopy. Spectrochim. Acta Part A Mol. Biomol. Spectrosc. 2022, 280, 121545. [Google Scholar] [CrossRef]
- Basile, T.; Mallardi, D.; Cardone, M.F. Spectroscopy, a Tool for the Non-Destructive Sensory Analysis of Plant-Based Foods and Beverages: A Comprehensive Review. Chemosensors 2023, 11, 579. [Google Scholar] [CrossRef]
- Beć, K.B.; Grabska, J.; Huck, C.W. Near-Infrared Spectroscopy in Bio-Applications. Molecules 2020, 25, 2948. [Google Scholar] [CrossRef] [PubMed]
- Brereton, R.G.; Jansen, J.; Lopes, J.; Marini, F.; Pomerantsev, A.; Rodionova, O.; Roger, J.M.; Walczak, B.; Tauler, R. Chemometrics in analytical chemistry—Part II: Modeling, validation, and applications. Anal. Bioanal. Chem. 2018, 410, 6691–6704. [Google Scholar] [CrossRef]
- Morais, C.L.; Lima, K.M.; Singh, M.; Martin, F.L. Tutorial: Multivariate classification for vibrational spectroscopy in biological samples. Nat. Protoc. 2020, 15, 2143–2162. [Google Scholar] [CrossRef]
- Cuq, S.; Lemetter, V.; Kleiber, D.; Levasseur-Garcia, C. Assessing macro-(P, K, Ca, Mg) and micronutrient (Mn, Fe, Cu, Zn, B) concentration in vine leaves and grape berries of vitis vinifera by using near-infrared spectroscopy and chemometrics. Comput. Electron. Agric. 2020, 179, 105841. [Google Scholar] [CrossRef]
- Williams, P. The RPD statistic: A tutorial note. NIR News 2014, 25, 22–23. [Google Scholar] [CrossRef]
- Levasseur-Garcia, C.; Bailly, S.; Kleiber, D.; Bailly, J.D. Assessing Risk of Fumonisin Contamination in Maize Using Near-Infrared Spectroscopy. J. Chem. 2015, 2015, 485864. [Google Scholar] [CrossRef]
- ISO/IEC 17025:2017; General Requirements for the Competence of Testing and Calibration Laboratories. International Organization for Standardization: Vernier, Switzerland, 2017.
- Schambri, P.; Brunet, S.; Bailly, J.-D.; Kleiber, D.; Levasseur-Garcia, C. Effect of Popcorn (Zea mays var. everta) Popping Mode (Microwave, Hot Oil and Hot Air) on Fumonisins and Deoxynivalenol Contamination Levels. Toxins 2021, 13, 486. [Google Scholar] [CrossRef]
- Lumivero. XLSTAT Statistical and Data Analysis Solution. Available online: https://www.xlstat.com/fr (accessed on 17 January 2024).
- Pasquini, C. Near infrared spectroscopy: A mature analytical technique with new perspectives—A review. Anal. Chim. Acta 2018, 1026, 8–36. [Google Scholar] [CrossRef]
- Tangirala, S. Evaluating the impact of GINI index and information gain on classification using decision tree classifier algorithm. Int. J. Adv. Comput. Sci. Appl. 2020, 11, 612–619. [Google Scholar] [CrossRef]
- Rajabi-Sarkhani, M.; Abbaspour-Gilandeh, Y.; Moinfar, A.; Tahmasebi, M.; Martínez-Arroyo, M.; Hernández-Hernández, M.; Hernández-Hernández, J.L. Identifying Optimal Wavelengths from Visible–Near-Infrared Spectroscopy Using Metaheuristic Algorithms to Assess Peanut Seed Viability. Agronomy 2023, 13, 2939. [Google Scholar] [CrossRef]
- Salmon, B.P.; Kleynhans, W.; Schwegmann, C.P.; Olivier, J.C. Proper comparison among methods using a confusion matrix. In Proceedings of the 2015 IEEE International Geoscience and Remote Sensing Symposium (IGARSS), Milan, Italy, 26–31 July 2015; pp. 3057–3060. [Google Scholar]
- Okparanma, R.; Araka, P.; Ayotamuno, J.; Mouazen, A. Towards enhancing sustainable reuse of pre-treated drill cuttings for construction purposes by near-infrared analysis: A review. J. Civ. Eng. Constr. Technol. 2018, 9, 19–39. [Google Scholar] [CrossRef]
- Eskola, M.; Kos, G.; Elliott, C.T.; Hajšlová, J.; Mayar, S.; Krska, R. Worldwide contamination of food-crops with mycotoxins: Validity of the widely cited ‘FAO estimate’of 25%. Crit. Rev. Food Sci. Nutr. 2020, 60, 2773–2789. [Google Scholar] [CrossRef]
- Too, E.C.; Yujian, L.; Njuki, S.; Yingchun, L. A comparative study of fine-tuning deep learning models for plant disease identification. Comput. Electron. Agric. 2019, 161, 272–279. [Google Scholar] [CrossRef]
- Tan, H.; Zhou, H.; Guo, T.; Zhang, Y.; Ma, L. Integrated multi-spectroscopic and molecular modeling techniques to study the formation mechanism of hidden zearalenone in maize. Food Chem. 2021, 351, 129286. [Google Scholar] [CrossRef]
- Yu, H.; Zhang, J.; Chen, Y.; Zhu, J. Zearalenone and Its Masked Forms in Cereals and Cereal-Derived Products: A Review of the Characteristics, Incidence, and Fate in Food Processing. J. Fungi 2022, 8, 976. [Google Scholar] [CrossRef]
- Rogowska, A.; Pomastowski, P.; Sagandykova, G.; Buszewski, B. Zearalenone and its metabolites: Effect on human health, metabolism and neutralisation methods. Toxicon 2019, 162, 46–56. [Google Scholar] [CrossRef]
- Jang, S.; Han, J.; Cho, J.; Jung, J.; Lee, S.; Lee, D.; Kim, J. Estimation of Apple Leaf Nitrogen Concentration Using Hyperspectral Imaging-Based Wavelength Selection and Machine Learning. Horticulturae 2023, 10, 35. [Google Scholar] [CrossRef]
- Rady, A.; Fischer, J.; Reeves, S.; Logan, B.; James Watson, N. The effect of light intensity, sensor height, and spectral pre-processing methods when using NIR spectroscopy to identify different allergen-containing powdered foods. Sensors 2019, 20, 230. [Google Scholar] [CrossRef] [PubMed]
- Sohn, S.-I.; Pandian, S.; Oh, Y.-J.; Zaukuu, J.-L.Z.; Na, C.-S.; Lee, Y.-H.; Shin, E.-K.; Kang, H.-J.; Ryu, T.-H.; Cho, W.-S. Vis-NIR spectroscopy and machine learning methods for the discrimination of transgenic Brassica napus L. and their hybrids with B. juncea. Processes 2022, 10, 240. [Google Scholar] [CrossRef]
- Levasseur-Garcia, C.; Kleiber, D. A method for the allotment of maize contaminated by toxins. J. Near Infrared Spectrosc. 2015, 23, 255–265. [Google Scholar] [CrossRef]
Disclaimer/Publisher’s Note: The statements, opinions and data contained in all publications are solely those of the individual author(s) and contributor(s) and not of MDPI and/or the editor(s). MDPI and/or the editor(s) disclaim responsibility for any injury to people or property resulting from any ideas, methods, instructions or products referred to in the content. |
© 2024 by the authors. Licensee MDPI, Basel, Switzerland. This article is an open access article distributed under the terms and conditions of the Creative Commons Attribution (CC BY) license (https://creativecommons.org/licenses/by/4.0/).