Article

Metabolomics and Physiological Methods Revealed the Effects of Drought Stress on the Quality of Broomcorn Millet during the Flowering Stage

1
Center for Agricultural Genetic Resources Research, Shanxi Agricultural University, Taiyuan 030031, China
2
College of Agriculture, Shanxi Agricultural University, Jinzhong 030801, China
3
Key Laboratory of Crop Genetic Resources and Germplasm Development in Loess Plateau, Ministry of Agriculture and Rural Affairs, Taiyuan 030031, China
*
Author to whom correspondence should be addressed.
Agronomy 2024, 14(2), 236; https://doi.org/10.3390/agronomy14020236
Submission received: 10 January 2024 / Revised: 17 January 2024 / Accepted: 19 January 2024 / Published: 23 January 2024

Abstract

:
The flowering stage is a critical period for water sensitivity and quality formation of broomcorn millets. However, the effects and mechanisms of drought stress on the quality formation of broomcorn millets are not clear. We used the drought-resistant variety Hequ red millet (H) and the drought-sensitive variety Yanshu No. 10 (Y) were used as materials for drought stress treatment during the flowering stage, metabolomics and physiological methods were used to study the differences in protein, starch, amino acids, medium and medium-long chain fatty acids, and their response characteristics to drought in broomcorn millet. The results showed that different genotypes of broomcorn millets exhibited different response mechanisms in the face of drought stress. In Hequ red millet, drought stress significantly increased the contents of amylopectin (2.57%), pyridoxine (31.89%), and anthocyanin, and significantly decreased the contents of water-soluble protein (5.82%), glutelin (10.07%), thiamine (14.95%) and nicotinamide (23.01%). In Yanshu No. 10, drought significantly decreased amylose by 6.05%, and significantly increased riboflavin and nicotinamide contents by 21.11% and 32.59%. Correlation analysis showed that total starch and amylose were highly significantly positively correlated with methyl palmitate; negatively correlated with amylopectin, vitamins, proteins, free amino acids, and medium-long chain fatty acids; and amylopectin was significantly positively correlated with water-soluble protein, riboflavin, and pyridoxine. Water-soluble protein and glutelin were significantly positively correlated with most free amino acids, medium-long chain fatty acids, and nicotinamide. Thiamine showed significant positive correlation with nicotinamide and significant negative correlation with pyridoxine. Riboflavin was significantly positively correlated with nicotinamide, pyridoxine, and water-soluble protein, and pyridoxine was significantly positively correlated with water-soluble protein. Hequ red millet transforms into amylopectin by consuming water-soluble protein and glutelin, and improves drought resistance by accumulating pyridoxine, and changes its physicochemical properties by decreasing the content of amylose and protein and elevating the content of amylopectin. Yanshu No. 10 resisted drought by catabolizing lipids to produce fatty acids and by consuming amylose for conversion into other metabolites. The present study helps to understand the response of the nutritional quality of millets to drought stress at the flowering stage and provides a theoretical basis for the selection and breeding of superior varieties of millets and drought resistance research.

1. Introduction

Broomcorn millet (Panicum miliaceum L.) is an ancient small cereal crop in China. Broomcorn millet boasts several distinctive traits, including a short growth period, resilience to drought, tolerance to saline-alkaline soils [1], adaptability to impoverished soils [2], and robust environmental adaptability [3]. Cultivation occurs in arid and semi-arid regions of China [4]. As a C4 crop, broomcorn millet efficiently utilizes limited water resources available [5] and requires relatively low levels of nitrogen fertilizer [6]. It is an ideal candidate for drought tolerance research.
When plants are subjected to drought stress, it triggers physical or chemical changes in the biomolecules within their cells, thus initiating a cellular stress response. Plants respond to drought stress by sensing alterations in osmotic pressure [7]. Drought stress induces the synthesis of abscisic acid (ABA), which, in turn, enhances the drought resistance of crops [8]. It also influences various physiological and metabolic processes in plants [9], including photosynthesis, respiration, enzyme activity, and the storage, accumulation, and transport of nutrients [10,11]. Prolonged drought can have detrimental effects on protein synthesis in plants and compromise the activity of cell membranes [12]. This results in reduced levels of chlorophyll and carotenoids, leading to decreased photosynthetic activity and impairing various plant functions [10]. Consequently, it reduces the biomass of crops and causes irreversible damage to the development and yield of grains, ultimately imposing a negative impact on crop yield and quality [10]. Drought stress can increase protein content of wheat and further influence its gluten strength [13], and can also reduce the oleic acid content of legumes and increase their protein content [14]. In addition, it can also increase the content of olein in Foxtail Millet (Setaria italica (L.) Beau) from 0.97% to 1.61% and reduce the content of gliadin from 1.56% to 1.26% [15]. Post-spinning drought stress affected the grain filling process of maize (JKN2000). Severe drought stress increased the protein content by 37.56% and decreased the starch content by 25.11% [16]. After 13 days of drought treatment in the reproductive growth period, the anthocyanin index of the two genotypes of maize increased significantly by 8% and 14%, respectively [17]. Drought stress can reduce the β-glucan content in barleys during the filling period [18]. In the booting stage, flowering stage and filling stage, mild drought increased the starch content of rice (NJ9108) by 1.11%, 2.52% and 3.54%, while severe drought decreased the starch content by 12.49%, 8.87% and 5.86% [19]. Severe drought at the jointing stage reduced the amylose content of rice (SJ6) by 15.61% and increased amylopectin content by 7.21% [20]. Moderate drought stress increased the accumulation of Arabidopsis proline by 6.4 times, anthocyanin by 2.9 times and soluble sugar by 1.7 times [21].
Metabolomics is a comprehensive approach based on qualitative and quantitative analysis of metabolites, it is used for analyzing metabolic pathways, networks, and related gene functions [22]. It is widely used in quality formation [10], related regulatory networks and key genes [23], differential metabolites [24] and other physiological and molecular response mechanisms to drought stress [25]. Research on the quality of broomcorn millet mainly focuses on fertilizer use [26], different ecological regions [27], and cover methods [28]. Drought is one of the important factors that affect the quality and yield formation of broomcorn millet. It can increase the contents of total free amino acids, betaine and proline of broomcorn millet [29], affecting the antioxidant response system [30] and altering quality. The flowering period is a sensitive period of broomcorn millet to drought stress [31], but the mechanism of drought affecting the quality formation of broomcorn millet is not clear. This study aims to explore the physiological, metabolic, and quality differences in the response to drought of drought-resistant broomcorn millet with different genotypes to understand the effects of drought stress during flowering on quality formation.

2. Materials and Methods

2.1. Experimental Design

The experiment was carried out at the Dingxiang Experimental Base of the Agricultural Gene Resources Research Center of Shanxi Agricultural University in 2022. The broomcorn millet varieties with different drought resistance were used as experimental materials. The drought-resistant variety Hequ red millet (H) and the drought-sensitive variety Yanshu No. 10 (Y) were used as experimental materials [32,33]. In the experiment, potted plants were used for treatment, and normal watering treatment (CK) and drought treatment (D) were adopted in complete random unit design. Each treatment was repeated 5 times for 6 POTS each time. Each pot contained 10 kg of air-dried soil, and the soil mineral nutrient composition was N (0.082%), P (12.3 mg kg−1), K (117 mg kg−1), organic matter (13.69 g kg−1), and soil pH was 8.10. Sterilize the seeds before sowing, bleach them for 5 min, and rinse them with sterile water at least 3 times. After the seeds were germinated, 5 plants were kept in each pot, and the plants grew normally until heading and began to control water. In order to avoid rainfall interference, the experiment was carried out in a dry shed. Drought treatment (D) plants were kept without watering for 4 days and weighed to ensure that the soil moisture was reduced to 15% (severe drought), then weighed every other day for 15 days to maintain the water content at 15%. Control treatment (CK) was watered normally and weighed every two days from flowering until before sampling to ensure that the potting soil moisture was maintained at 55%. After the broomcorn millet is mature, the seeds are collected and shelled, dried in the oven at 75 °C to constant weight, then weighed, crushed, screened, and stored in the refrigerator at 4 °C to prevent sample deterioration.

2.2. Determination of Agronomic Traits

After the last sampling, all the remaining plants in the pot were collected to quantify the plant height of the broomcorn millet, and the collected spikes were placed in an oven at 60 °C to dry to constant weight. The grain weight, 1000-grain weight, area, diameter and length-width ratio of single spike after drying were measured by automatic seed test and 1000-grain weight analyzer, and the color of broomcorn millet grain after shelling was measured by it. The color of broomcorn millet grain after shelling was described by RGB color mode and Lab color mode.

2.3. Determination of Starch Content

2.3.1. Extraction and Determination of Total Starch

Referring to the method of Deng et al. [34] the enzyme-direct method was used to extract starch. After removing lipids and soluble sugars from a 50 g dry sample, 2 mL 2 M KOH was added to mix, shaken on ice for 20 min, and 8 mL 1.2 M sodium acetate buffer solution (pH = 3.8) was added to mix evenly. Digestible starch was hydrolyzed by α-amylase at 37 °C to convert it into glucose, and then 0.1 mL of starch glucosidase was added and heated in a water bath at 50 °C for 30 min. The 0.1 mL sample was diluted to 1 mL with distilled water, and 0.05 mL of the above liquid was added with 1.5 mL Glucose oxidase/peroxidase reagent (GOPOD) and incubated at 50 °C for 20 min. The 0.05 mL glucose standard solution was added with 1.5 mL GOPOD reagent and reacted at 50 °C for 20 min. Their absorbance was measured at 510 nm, and the total starch content was calculated according to the glucose standard curve. The total starch content in the sample can be calculated according to the following formula:
starch   content   ( % ) = Δ A × F × 90 M
F = 100   ( μ g   of   D - glucose ) absorbance   for   100   μ g   of   glucose
Among them, ΔA: the sample OD value minus the blank OD value; F: OD value per μg glucose; M: Sample quality; 90: Conversion factor.

2.3.2. Determination of Amylose Content

According to the different affinity of amylose and amylopectin to iodine, absorbance values of the samples were determined spectrophotometrically at 620 nm. Different proportions of amylose standard solution were prepared, to the method of Fan et al. [35] to prepare standard curve. The content of amylose was calculated by the external standard method. The content of amylose in the sample can be calculated according to the standard curve:
amylose   starch   content   ( % ) = C M 10
Among them, C: the results calculated according to the standard curve; M: actual weighing mass (about 10 mg); 10: correction coefficient.
The calculation of amylopectin content: The amylopectin content can be obtained by using the total starch content minus the amylose content.

2.4. Determination of Protein Components

According to the method of Wieser et al. [36], the protein components in the sample were separated according to the difference of solubility of the protein components in different solvents. Coomassie brilliant blue G-250 (China Pharmaceutical Group Co., Ltd., Beijing, China) binds to protein in blue, and the color depth is proportional to the protein content. The absorbance of the sample was measured at 595 nm using an ultraviolet spectrophotometer (T1910, General, Beijing, China). The standard curve of different concentrations was fitted, and the content of each protein component was calculated according to the formula: protein content (mg/g) = C × V/M. C is the result calculated according to the standard curve; M is the actual weighing quality; V is the total volume of the extract.

2.5. Determination of Amino Acid Content

After sampling, it was sent to Shanghai Sanshu Biotechnology Co., Ltd. (Shanghai, China) for determination. The extraction and determination of each free amino acid was carried out using the method of Kovács et al. [37] The data acquisition instrumentation systems were mainly ultra-high performance liquid chromatography (Vanquish, UPLC, Thermo Fisher Scientific, Waltham, MA, USA) and high-resolution mass spectrometry (Q Exactive, Thermo Fisher Scientific, Waltham, MA, USA). Liquid chromatography parameters: chromatographic column: Waters BEH C18 (50 × 2.1 mm, 1.7 μm); mobile phase: phase A was ultrapure water (containing 0.1% formic acid), phase B was acetonitrile (containing 0.1% formic acid); the flow rate was 0.5 mL/min. The column temperature was 55 °C. The injection volume was 1 μL. The external standard method was used to quantify the experiment. The fitting curve was prepared by standard substances with different concentrations. The data were processed according to the data derived from the instrument. The molar content of the sample (nmol/mg) = (C × V × F)/M. C is the sample concentration read by the instrument, unit nmol/mL; V is the final volume of the sample, unit mL; F is the dilution multiple of the sample; m is the weight of the sample, unit mg. Amino acid content in the sample (µg/g) = (C × V × F × Mw)/M. Mw is the molecular weight of the corresponding amino acid.

2.6. Determination of Medium-Long Chain Fatty Acid Content

Referring to the method of Li et al. [38] for extraction and determination of medium-long chain fatty acids, GC-MS (7820A-5977B; Agilent Technologies Inc., Santa Clara, CA, USA) was utilized. The mass spectrometry data were processed by Quant-My-Way (B.09.00) software, and the external standard method was used for quantification.
Gas chromatographic parameters: The gas chromatographic column was CP-Sil 88 (100 m × 0.25 mm × 0.25 µm, Agilent Technologies, Inc., Santa Clara, CA, USA). The sample size was 1 µL. The shunt ratio is 10:1; The carrier gas is high purity helium; The flow rate is 1.0 mL/min.
Mass spectrum parameters: the inlet temperature was 260 °C, the four-stage rod temperature was 150 °C; The scanning mode is single channel scanning (SIM), and the quality scanning range is (m/z): 30–550.
The fitting curve was prepared by using different concentrations of standard substance. The content of each component in the sample can be obtained according to the formula (µg/mg) = (C × V × F)/M, where C is the instrument reading concentration, unit µg/mL; V is the volume of sample extract, unit mL; M is the total amount of the sample, unit mg; F is the dilution factor.

2.7. Determination of B Vitamins Content

The B vitamins were extracted according to the method of Cellar et al. [39] with a slight modification, and the B vitamins were determined using ultra-high performance liquid chromatography (Vanquish, UPLC, Thermo Fisher Scientific, Waltham, MA, USA) and high-resolution mass spectrometry (Q Exactive, Thermo, Waltham, MA, USA).
Liquid chromatography parameters: chromatographic column: Waters HSS T3 (50 × 2.1 mm, 1.8 μm); mobile phase: phase A was ultrapure water (containing 0.1% acetic acid), phase B was acetonitrile (containing 0.1% acetic acid); the flow rate was 0.3 mL/min. Column temperature 40 °C; the injection volume is 2 µL.
QE mass spectrometry conditions: Electrospray ionization (ESI): sheath gas 40 arb; auxiliary gas 10 arb; ion spray voltage 3000 V; temperature 350 °C; the temperature of ion transport tube is 320 °C. The scanning mode was single ion detection (SIM) mode. The scanning mode was positive ion. Primary scan range (scan m/z range): 80–450.
The software TraceFinder (4.1) was used to process the mass spectrometry data, and the external standard method was used for quantification. The fitting curves were prepared by different concentrations of standard substances. The content of each component in the sample can be obtained by the formula (ng/100 mg) = (C × V × F)/M × 100, where C is the instrument reading concentration, unit ng/mL; V is the volume of sample extract, unit mL; M is the total amount of the sample, unit mg; F is the dilution factor.

2.8. Determination of Anthocyanin Content

A slightly modified version of Barnes et al.’s [40] approach uses the UPLC-OrbitRAP-MS system (UPLC, Vanquish; MS, QE; Thermo Fisher Scientific, Waltham, MA, USA) to detect anthocyanin content. The analytical conditions were as follows. UPLC: column, Waters ACQUITY UPLC BEH C18 (1.8 μm, 2.1 mm × 50 mm); column temperature, 40 °C; flow rate, 0.3 mL/min; injection volume, 2 μL; solvent system, water (0.1% Fomic acid): acetonitrile (0.1% Fomic acid).

2.9. Statistical Analysis

The data provided by the experiment were the average of at least three independent experiments. SPSS 25.0 and Microsoft Excel 2021 (16.0.) software were used to analyze the experimental data by using one-way analysis of variance (ANOVA), principal component analysis, correlation analysis and other related statistical analysis. The least significant difference (LSD) method was used to test the significance of the difference between the treatments at the p < 0.05 level. Pearson correlation analysis was used to analyze the correlation, and OriginPro 2021 9.8.0.200 software was used for mapping.

3. Results

3.1. Impact on Agronomic Traits

It can be seen from Table 1 that drought significantly reduced the plant height, grain weight per panicle and 1000-grain weight of the two genotypes of broomcorn millet, and significantly increased the average length-width ratio. Under drought stress, the plant height, grain weight per spike and 1000-grain weight of Hequ red millet decreased by 22.86%, 39.53% and 11.32%, respectively, and those of Yanshu No. 10 decreased by 16.19%, 44.30% and 10.39%, respectively. Drought stress increased the length-width ratio of Hequ red millet and Yanshu No. 10 by 3.71% and 2.68%.

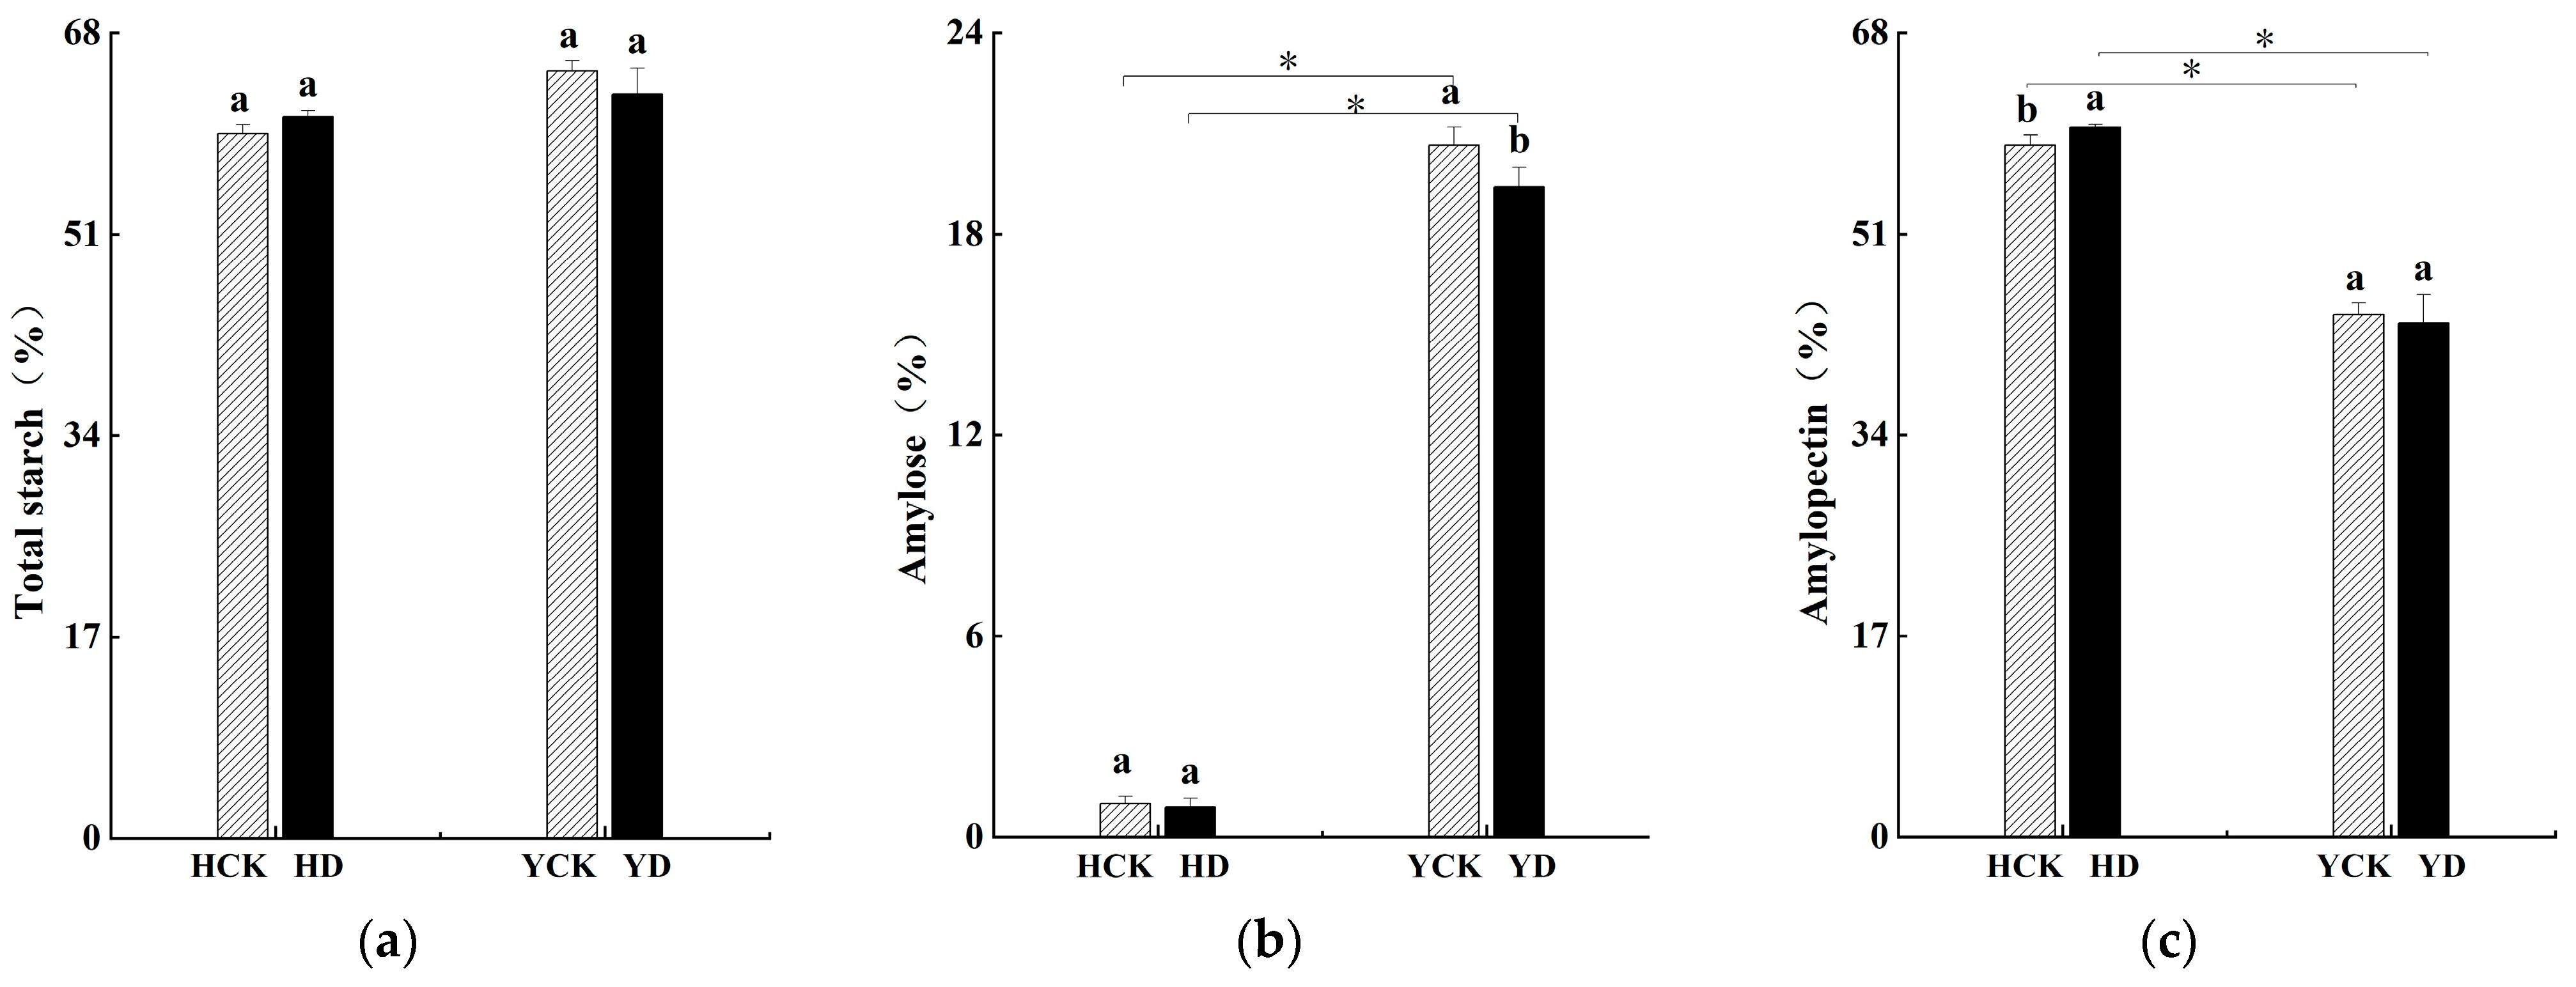
3.2. Impact on Starch Content

Drought stress can significantly influence the starch content and composition in broomcorn millet with different genotypes (Figure 1). Various varieties exhibit contrasting trends in total starch and amylopectin content. Drought stress decreases the amylose content in broomcorn millet’s (Figure 1b). For instance, in the drought-sensitive Yanshu No. 10, the amylose content decreases significantly from 20.66% to 19.41%; the decrease rate was 6.05%. Conversely, no significant change is observed in the Hequ red millet. At the same time, drought stress notably increases the amylopectin content in the Hequ red millet (Figure 1c).

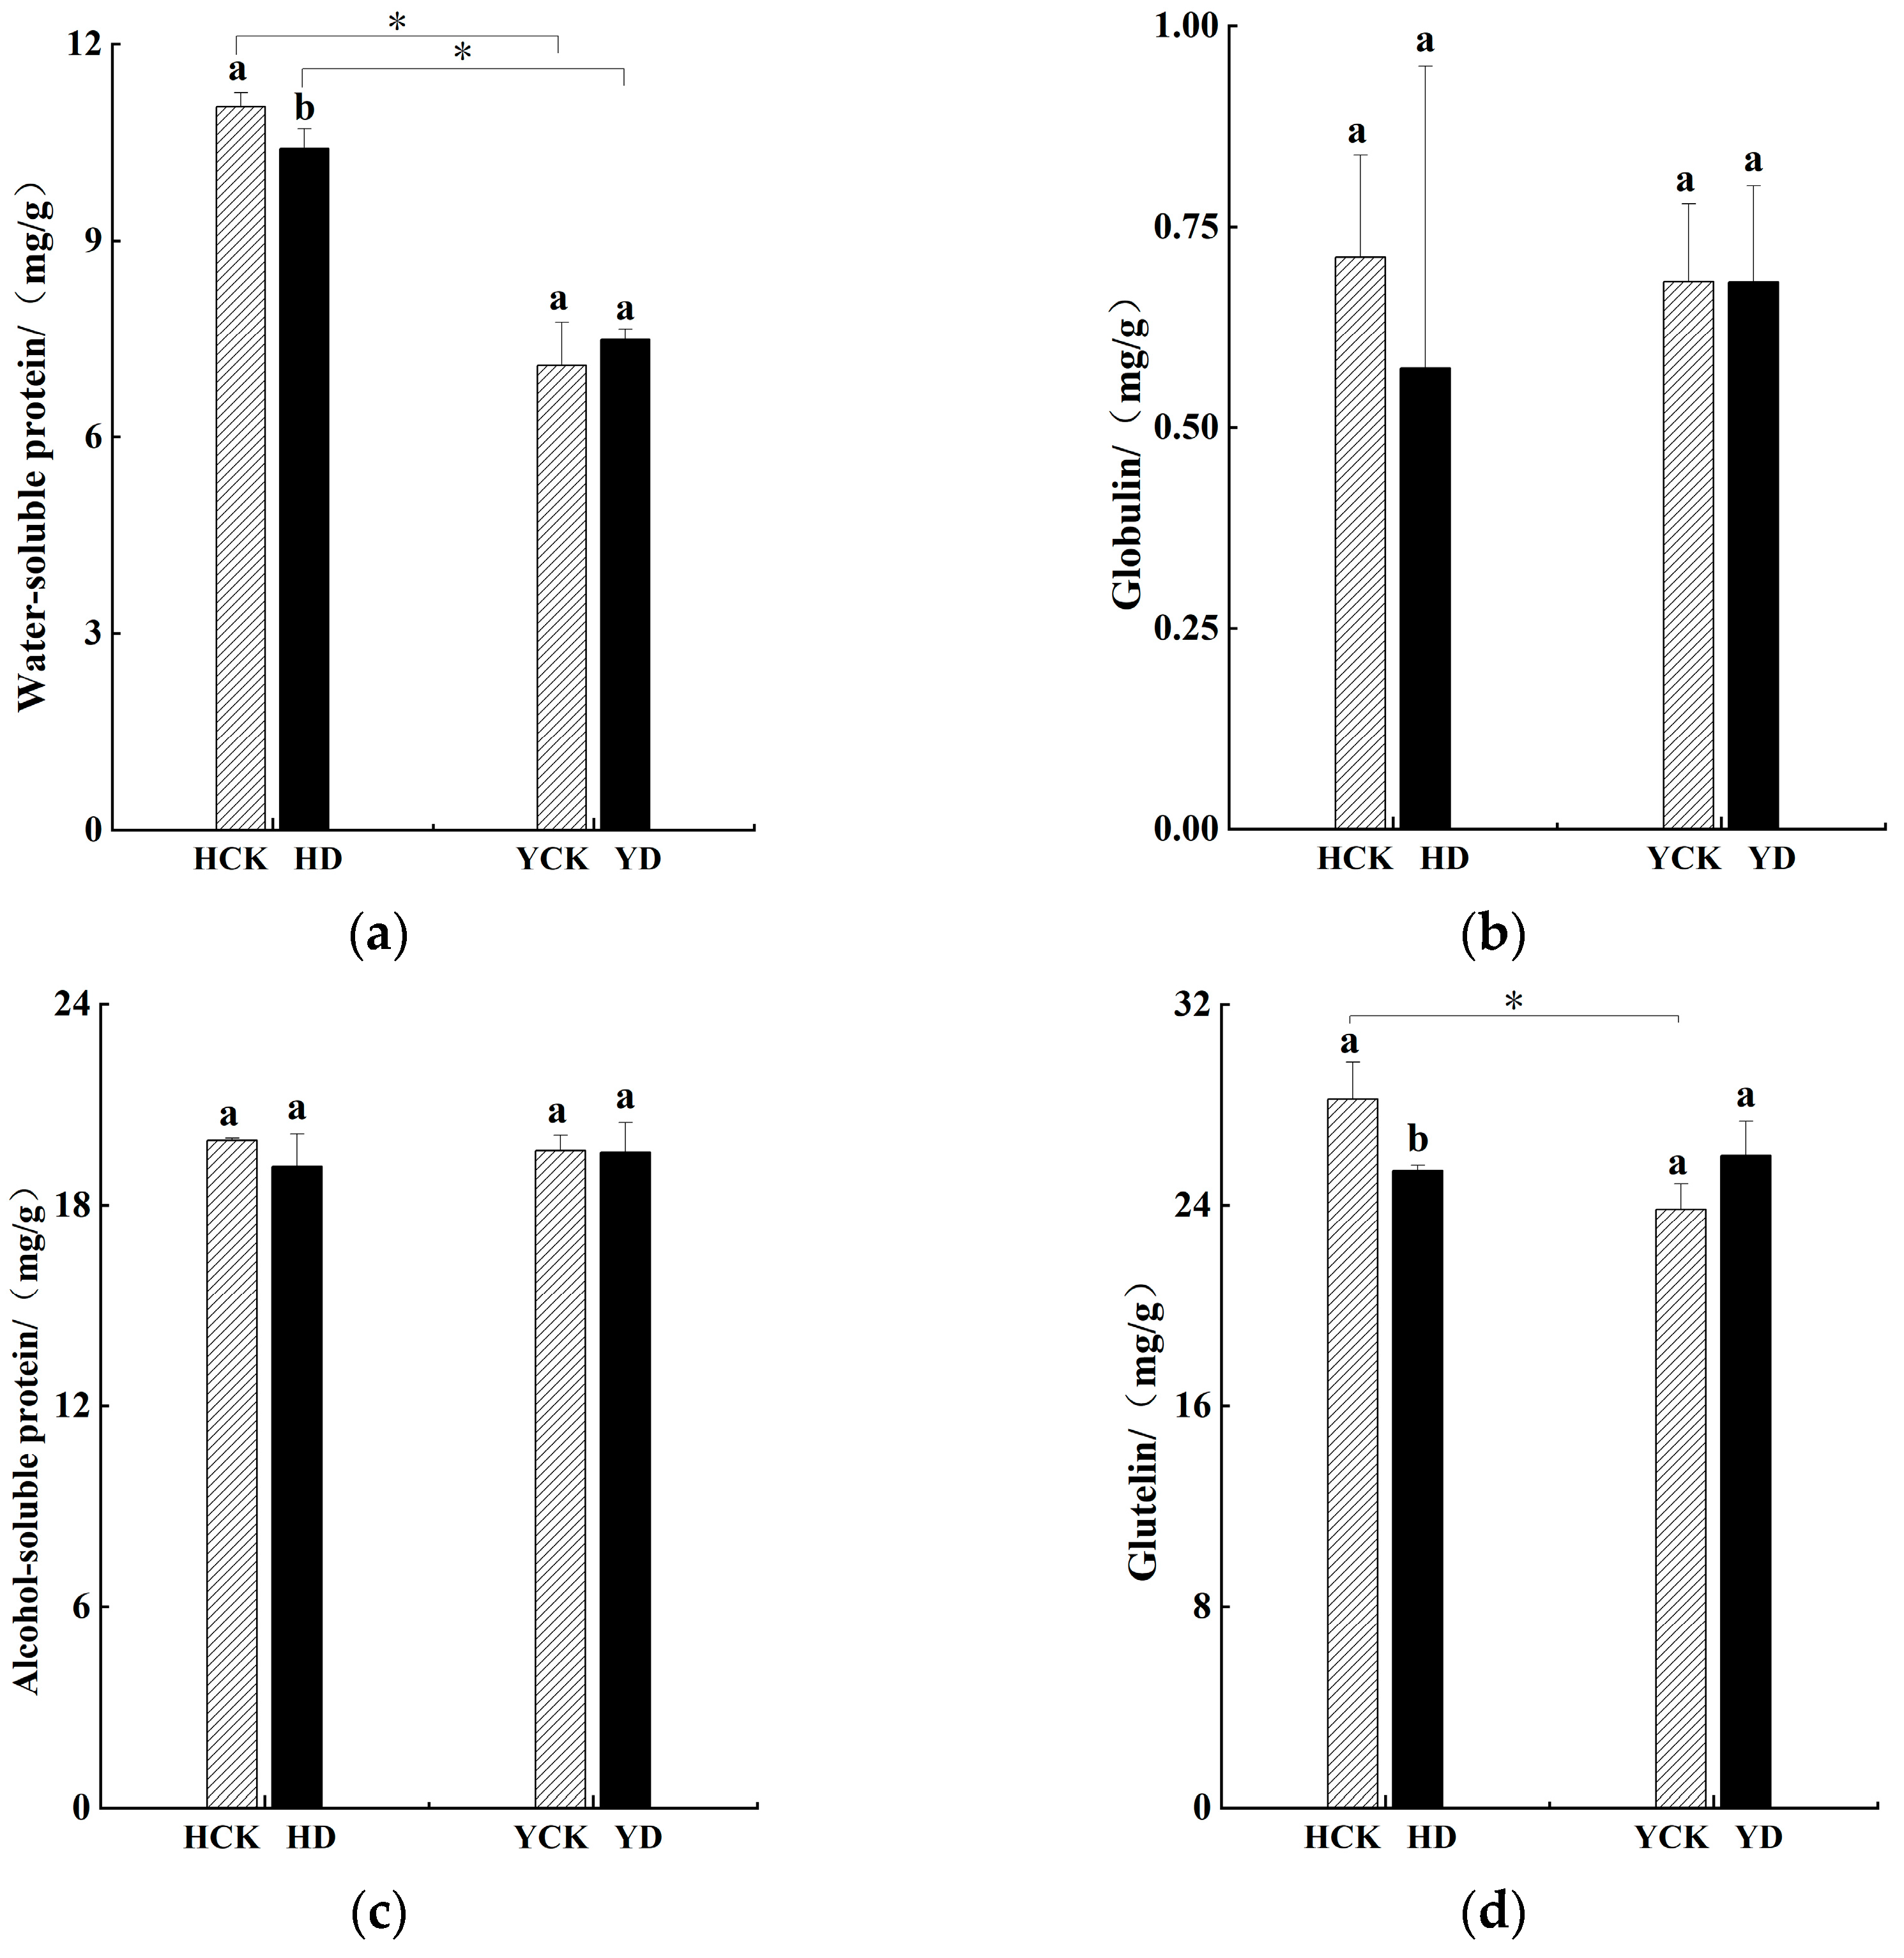
3.3. Impact on Protein Composition

Drought stress can significantly affect the protein composition of broomcorn millet, but the extent of this impact varies among different varieties. As shown in Figure 2, drought stress leads to varying degrees of decrease in water-soluble protein, globulin, alcohol-soluble protein, and glutelin content in Hequ red millet. The water-soluble protein and glutelin content show a significant reduction of 5.82% and 10.07%, respectively, under drought stress. In contrast, the water-soluble protein and glutelin content in Yanshu No. 10 exhibit a moderate increase, while the globulin and alcohol-soluble protein content decrease. But these protein changes are not statistically significant. Among the four treatment groups, the glutelin content is higher than the other three types of proteins. There is a significant difference in water-soluble protein content between the two treatments, with contents of 11.05 and 7.09 mg/g under normal conditions and 10.40 and 7.48 mg/g under drought stress, respectively. Glutelin content also shows significant variation between varieties under normal conditions, with contents of 28.22 and 23.83 mg/g. Globulin and alcohol-soluble protein content do not exhibit statistically significant differences between treatments or varieties.

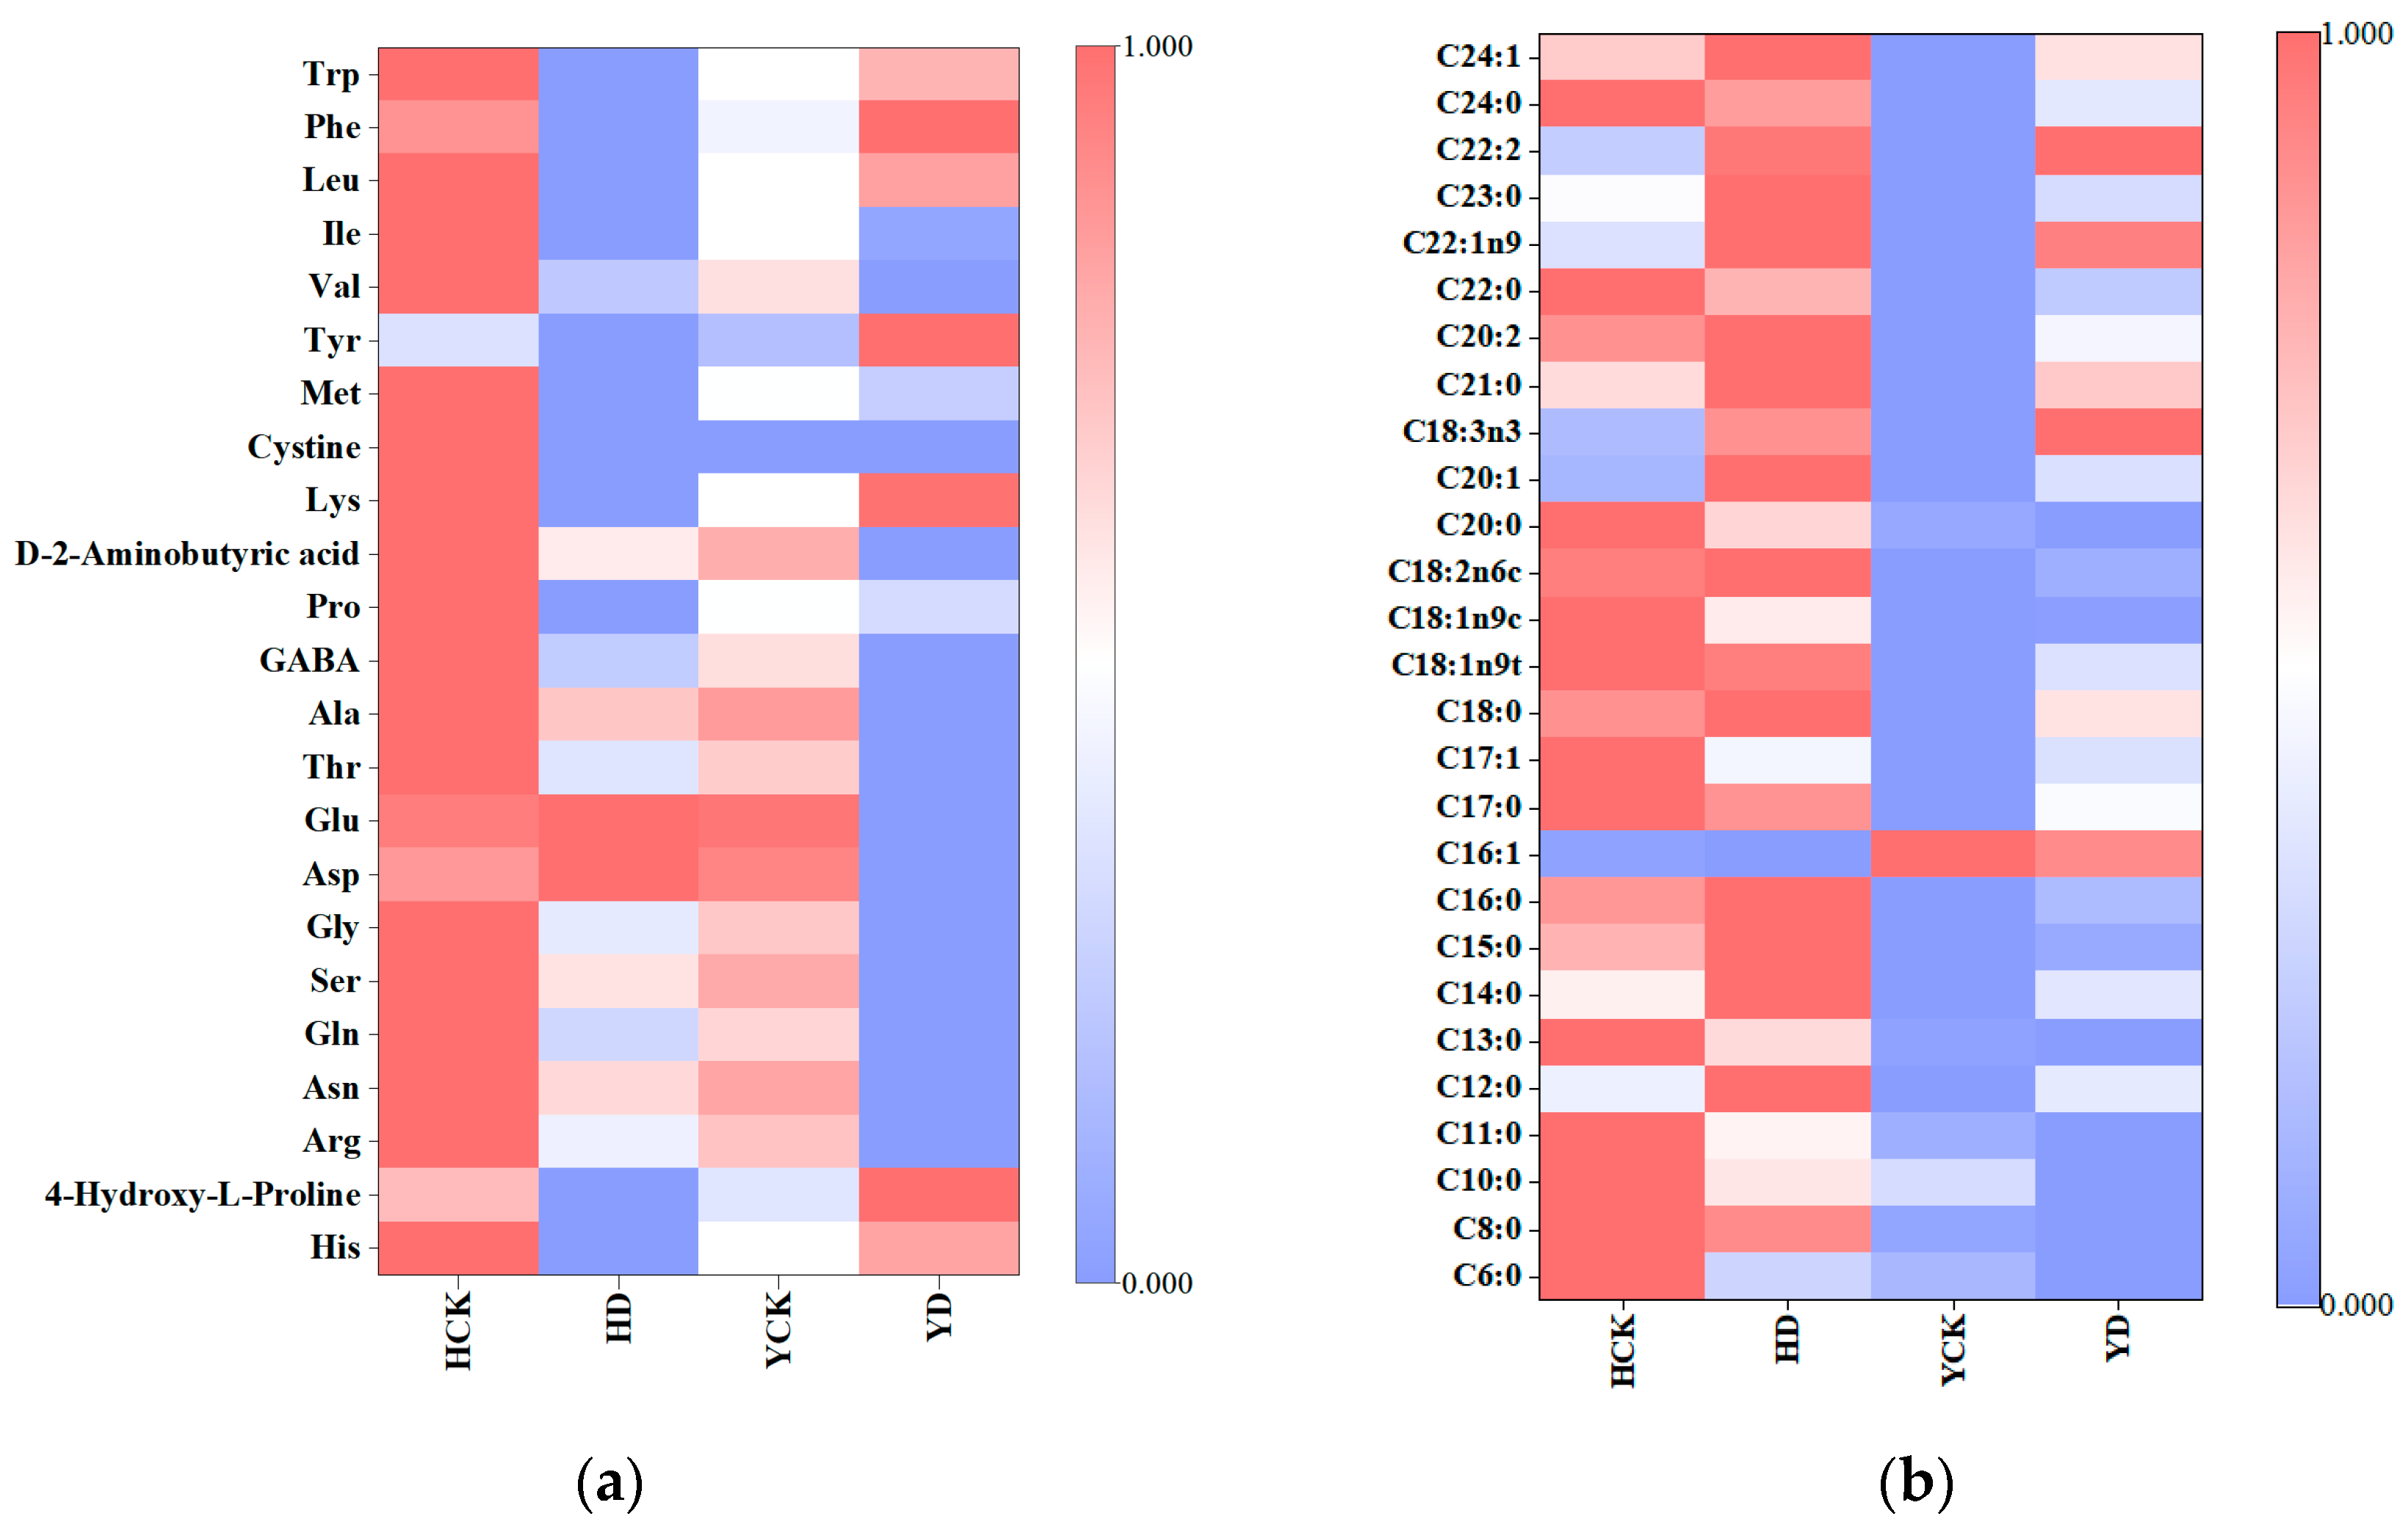
3.4. Impact on Amino Acid Composition

Drought stress during the flowering period significantly affects the composition and content of amino acid composition in broomcorn millet (Table 2). When compared to the control treatment, drought stress led to a marked decrease in Hequ red millet in histidine, 4-Hydroxy-L-Proline, glutamine, glycine, γ-Aminobutyric acid, proline, lysine, methionine, valine, tryptophan content by 39.06%, 19.15%, 24.78%, 15.05%, 35.24%, 42.78%, 38.80%, 44.97%, 20.17%, and 38.71%, respectively. Conversely, when subjected to drought stress, the content of methionine in Yanshu No. 10 decreased by 0.25%. However, other free amino acids displayed varying degrees of increase (Figure 3). Notably, histidine, glutamine, serine, lysine, tyrosine, valine, isoleucine, leucine, and phenylalanine content increased significantly by 28.94%, 37.29%, 36.87%, 27.16%, 27.13%, 37.80%, 52.84%, 53.86%, and 45.62%, respectively. Cystine was only detected in the control treatment of Hequ red millet and was absent in all other conditions. After normalizing the content of each free amino acid, a heatmap was generated (Figure 3a). The heatmap clearly illustrates that drought stress led to a decrease in the content of free amino acids in Hequ red millet while significantly increasing amino acid content in Yanshu No. 10. Specifically, histidine, glutamine, lysine, and valine exhibited a significant decrease in Hequ red millet but a significant increase in Yanshu No. 10.

3.5. Impact on Medium-Longchain Fatty Acid Content

In this study, a total of 27 fatty acids were analyzed, comprising one short-chain fatty acid (methyl hexanoate) and 26 medium-long chain fatty acids. Table 3 reveals that drought stress significantly influenced the levels of certain medium-long chain fatty acids in broomcorn millet. Drought stress caused a notable reduction of 7.12% and 9.17% in decanoic methyl ester and arachidic methyl ester, respectively, in Hequ red millet. Simultaneously, it led to significant increases in the content of lauric methyl ester, myristic methyl ester, pentadecanoic methyl ester, 11-eicosenoic methyl ester, erucic methyl ester, and tricosanoic methyl ester by 12.19%, 10.07%, 14.90%, 19.42%, 13.23%, and 13.89%, respectively. In the case of Yanshu No. 10, drought stress significantly raised the levels of tricosanoic methyl ester, heneicosanoic methyl ester, erucic methyl ester, docosadienoic methyl ester, lignoceric methyl ester, tetracosenoic methyl ester, and linolenic methyl ester by 9.93%, 15.62%, 20.59%, 19.61%, 17.93%, 16.62%, and 11.95%, respectively.

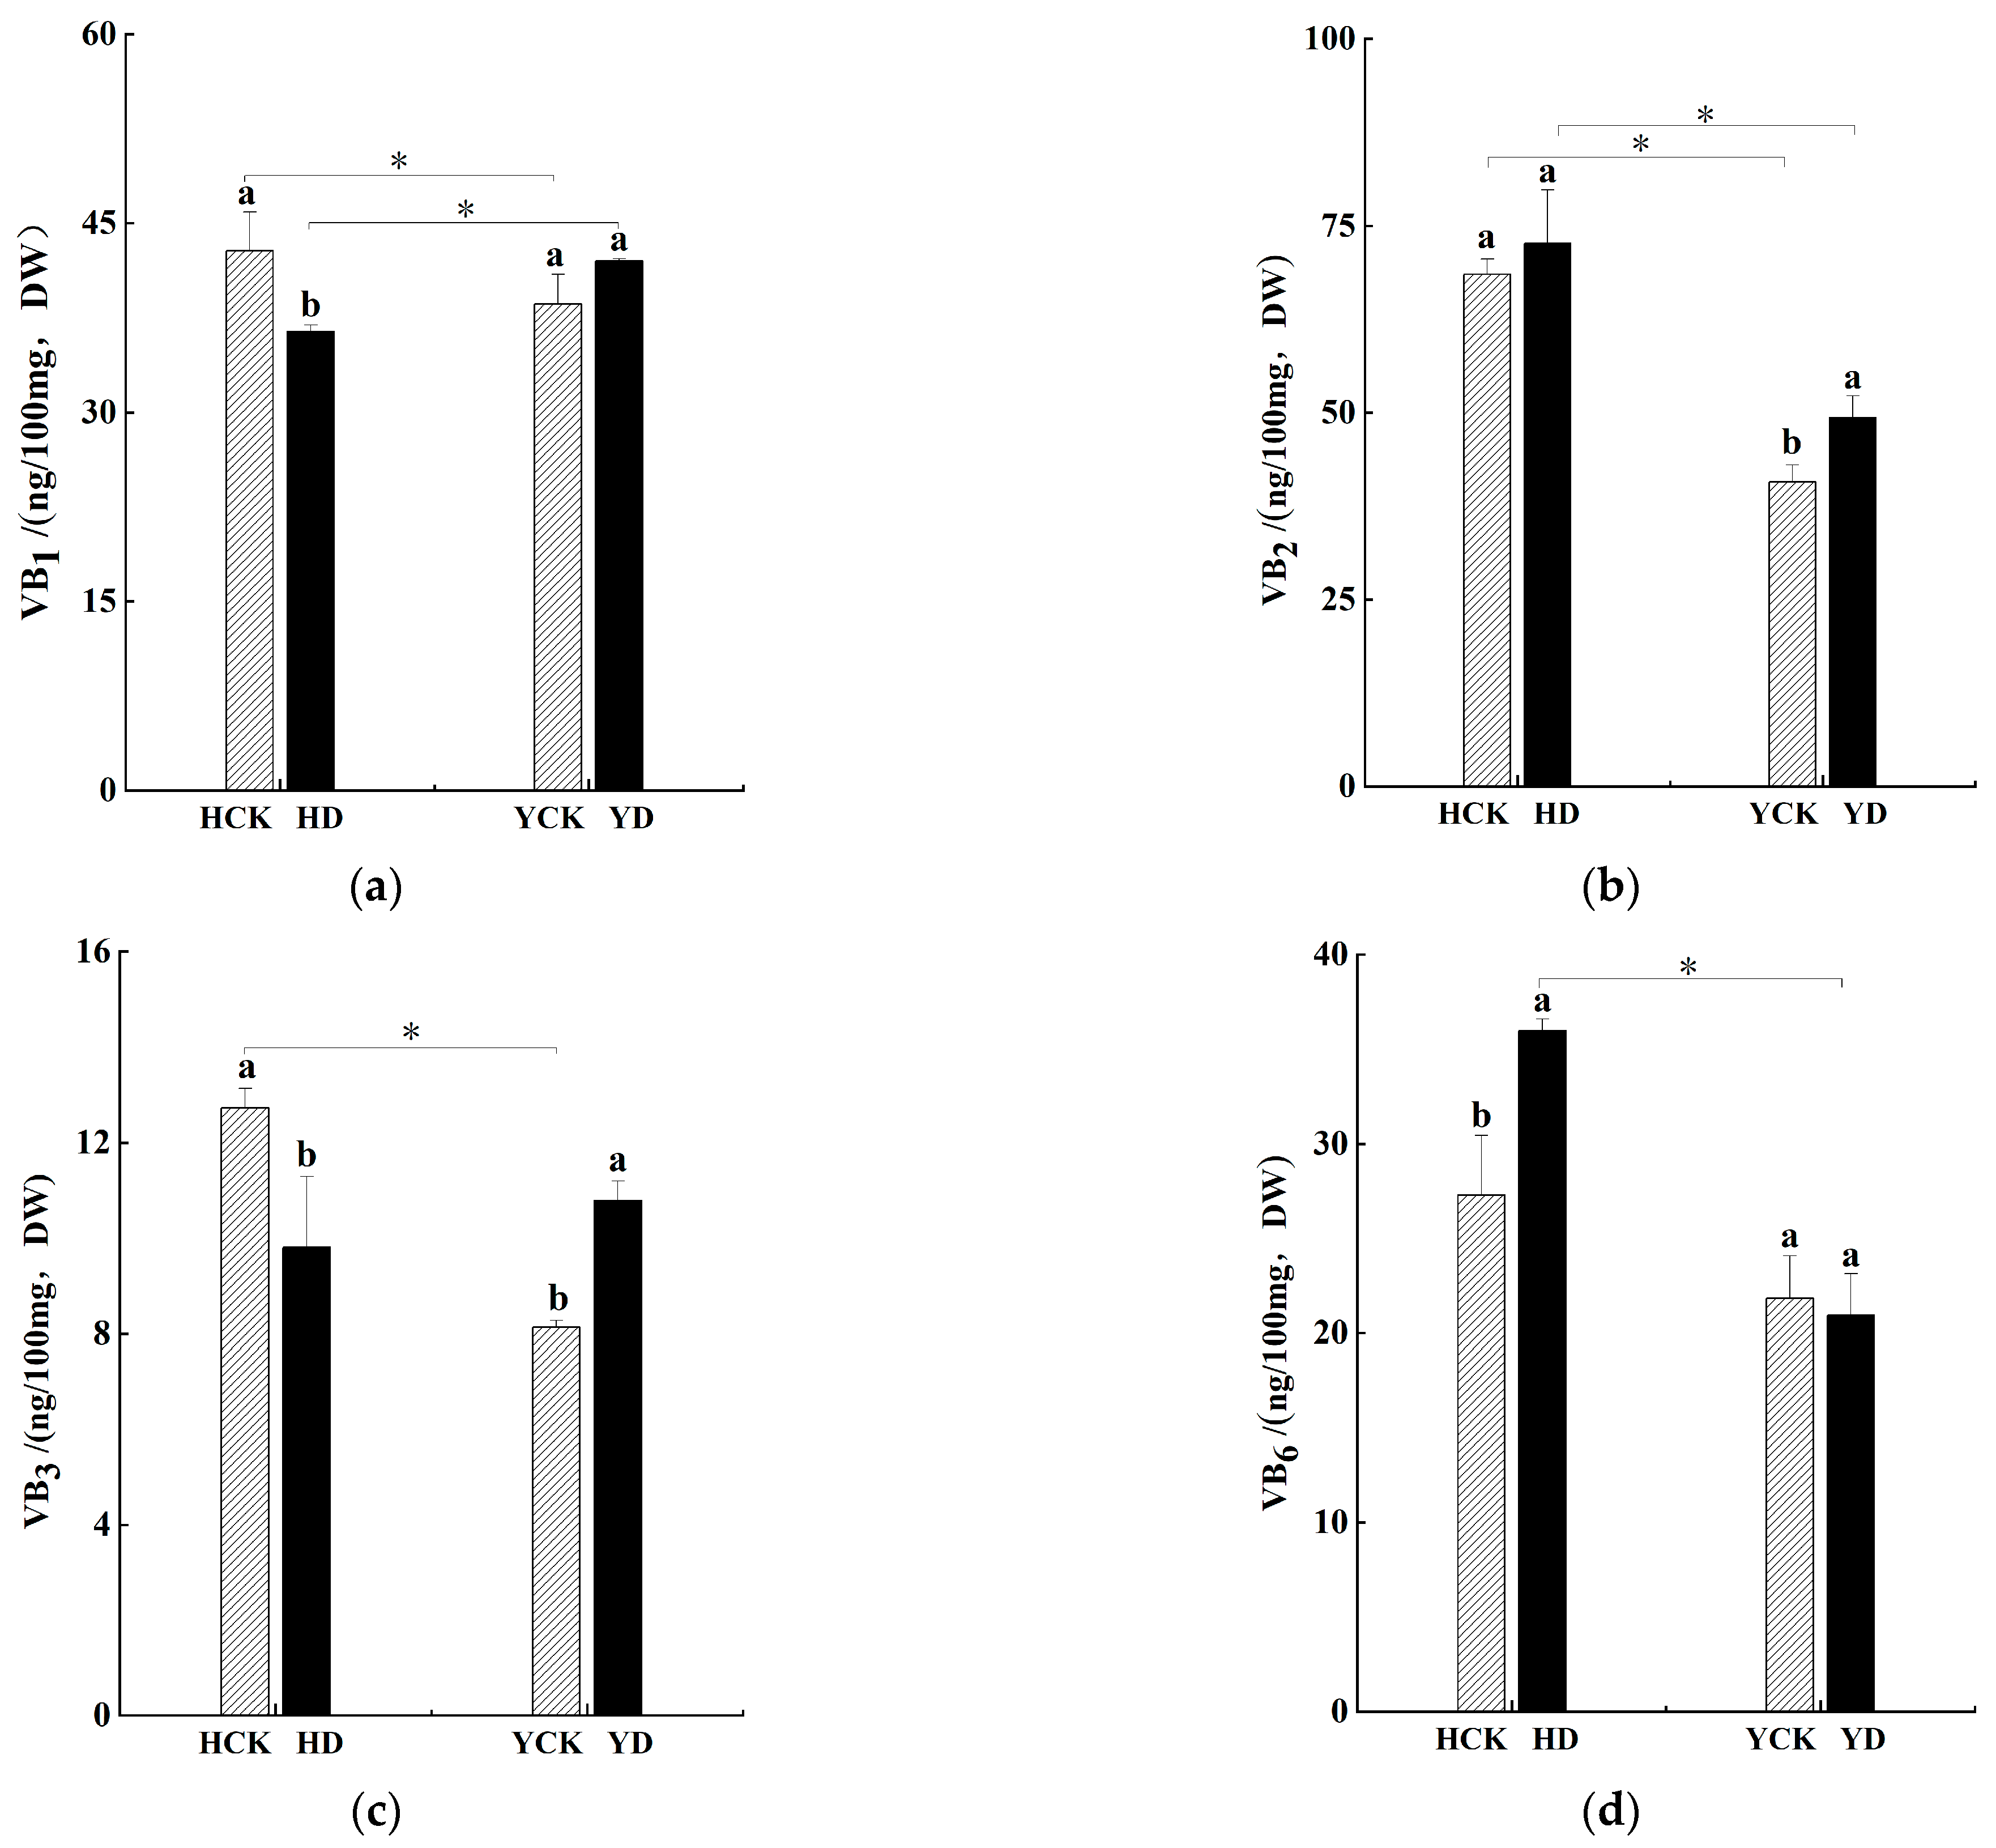
3.6. Impact on B Vitamin Content

Using ultra-high-performance liquid chromatography, we determined the presence of four major B vitamins in broomcorn millet: thiamine (VB1), riboflavin (VB2), nicotinamide (VB3), and pyridoxine (VB6). As depicted in Figure 4, the B vitamin content in broomcorn millet follows this order: riboflavin > thiamine > pyridoxine > nicotinamide. Drought stress significantly reduced thiamine content in Hequ red millet from 42.81 ng/100 mg to 36.41 ng/100 mg, a decrease of 14.95%, while nicotinamide content decreased from 12.73 ng/100 mg to 9.80 ng/100 mg, a reduction of 23.01%. Pyridoxine’s average content significantly increased from 27.28 ng/100 mg to 35.98 ng/100 mg, an increase of 31.89%. Although drought stress caused an increase in riboflavin content, the change was not significant. Drought stress increased the contents of thiamine, riboflavin and nicotinamide in Yanshu No. 10 by 8.84%, 21.11% and 32.59%, respectively, and decreased the content of pyridoxine by 4.06%.

3.7. Impact on Anthocyanin Content

Six anthocyanins were detected in two genotypes of broomcorn millet, namely peonidin, rutin, luteolin, quercetin, isorhamnetin and kaempferol. It can be seen from Table 4 that under drought stress, the contents of isornin and kauniol of two genotypes of broomcorn millet increased significantly, Hequ red millet increased by 45.62% and 49.54%, and that of Yanshu No. 10 increased by 80.61% and 31.33%, respectively. In addition, under drought stress, the contents of peonidin, rutin, luteolin and quercetin increased significantly in Hequ red millet, and decreased to different degrees in Yanshu No. 10, and all reached significant levels except quercetin. Drought stress significantly changed the content of paeoniflorin in Hequ red millet, which was 5.59 times that of the control.

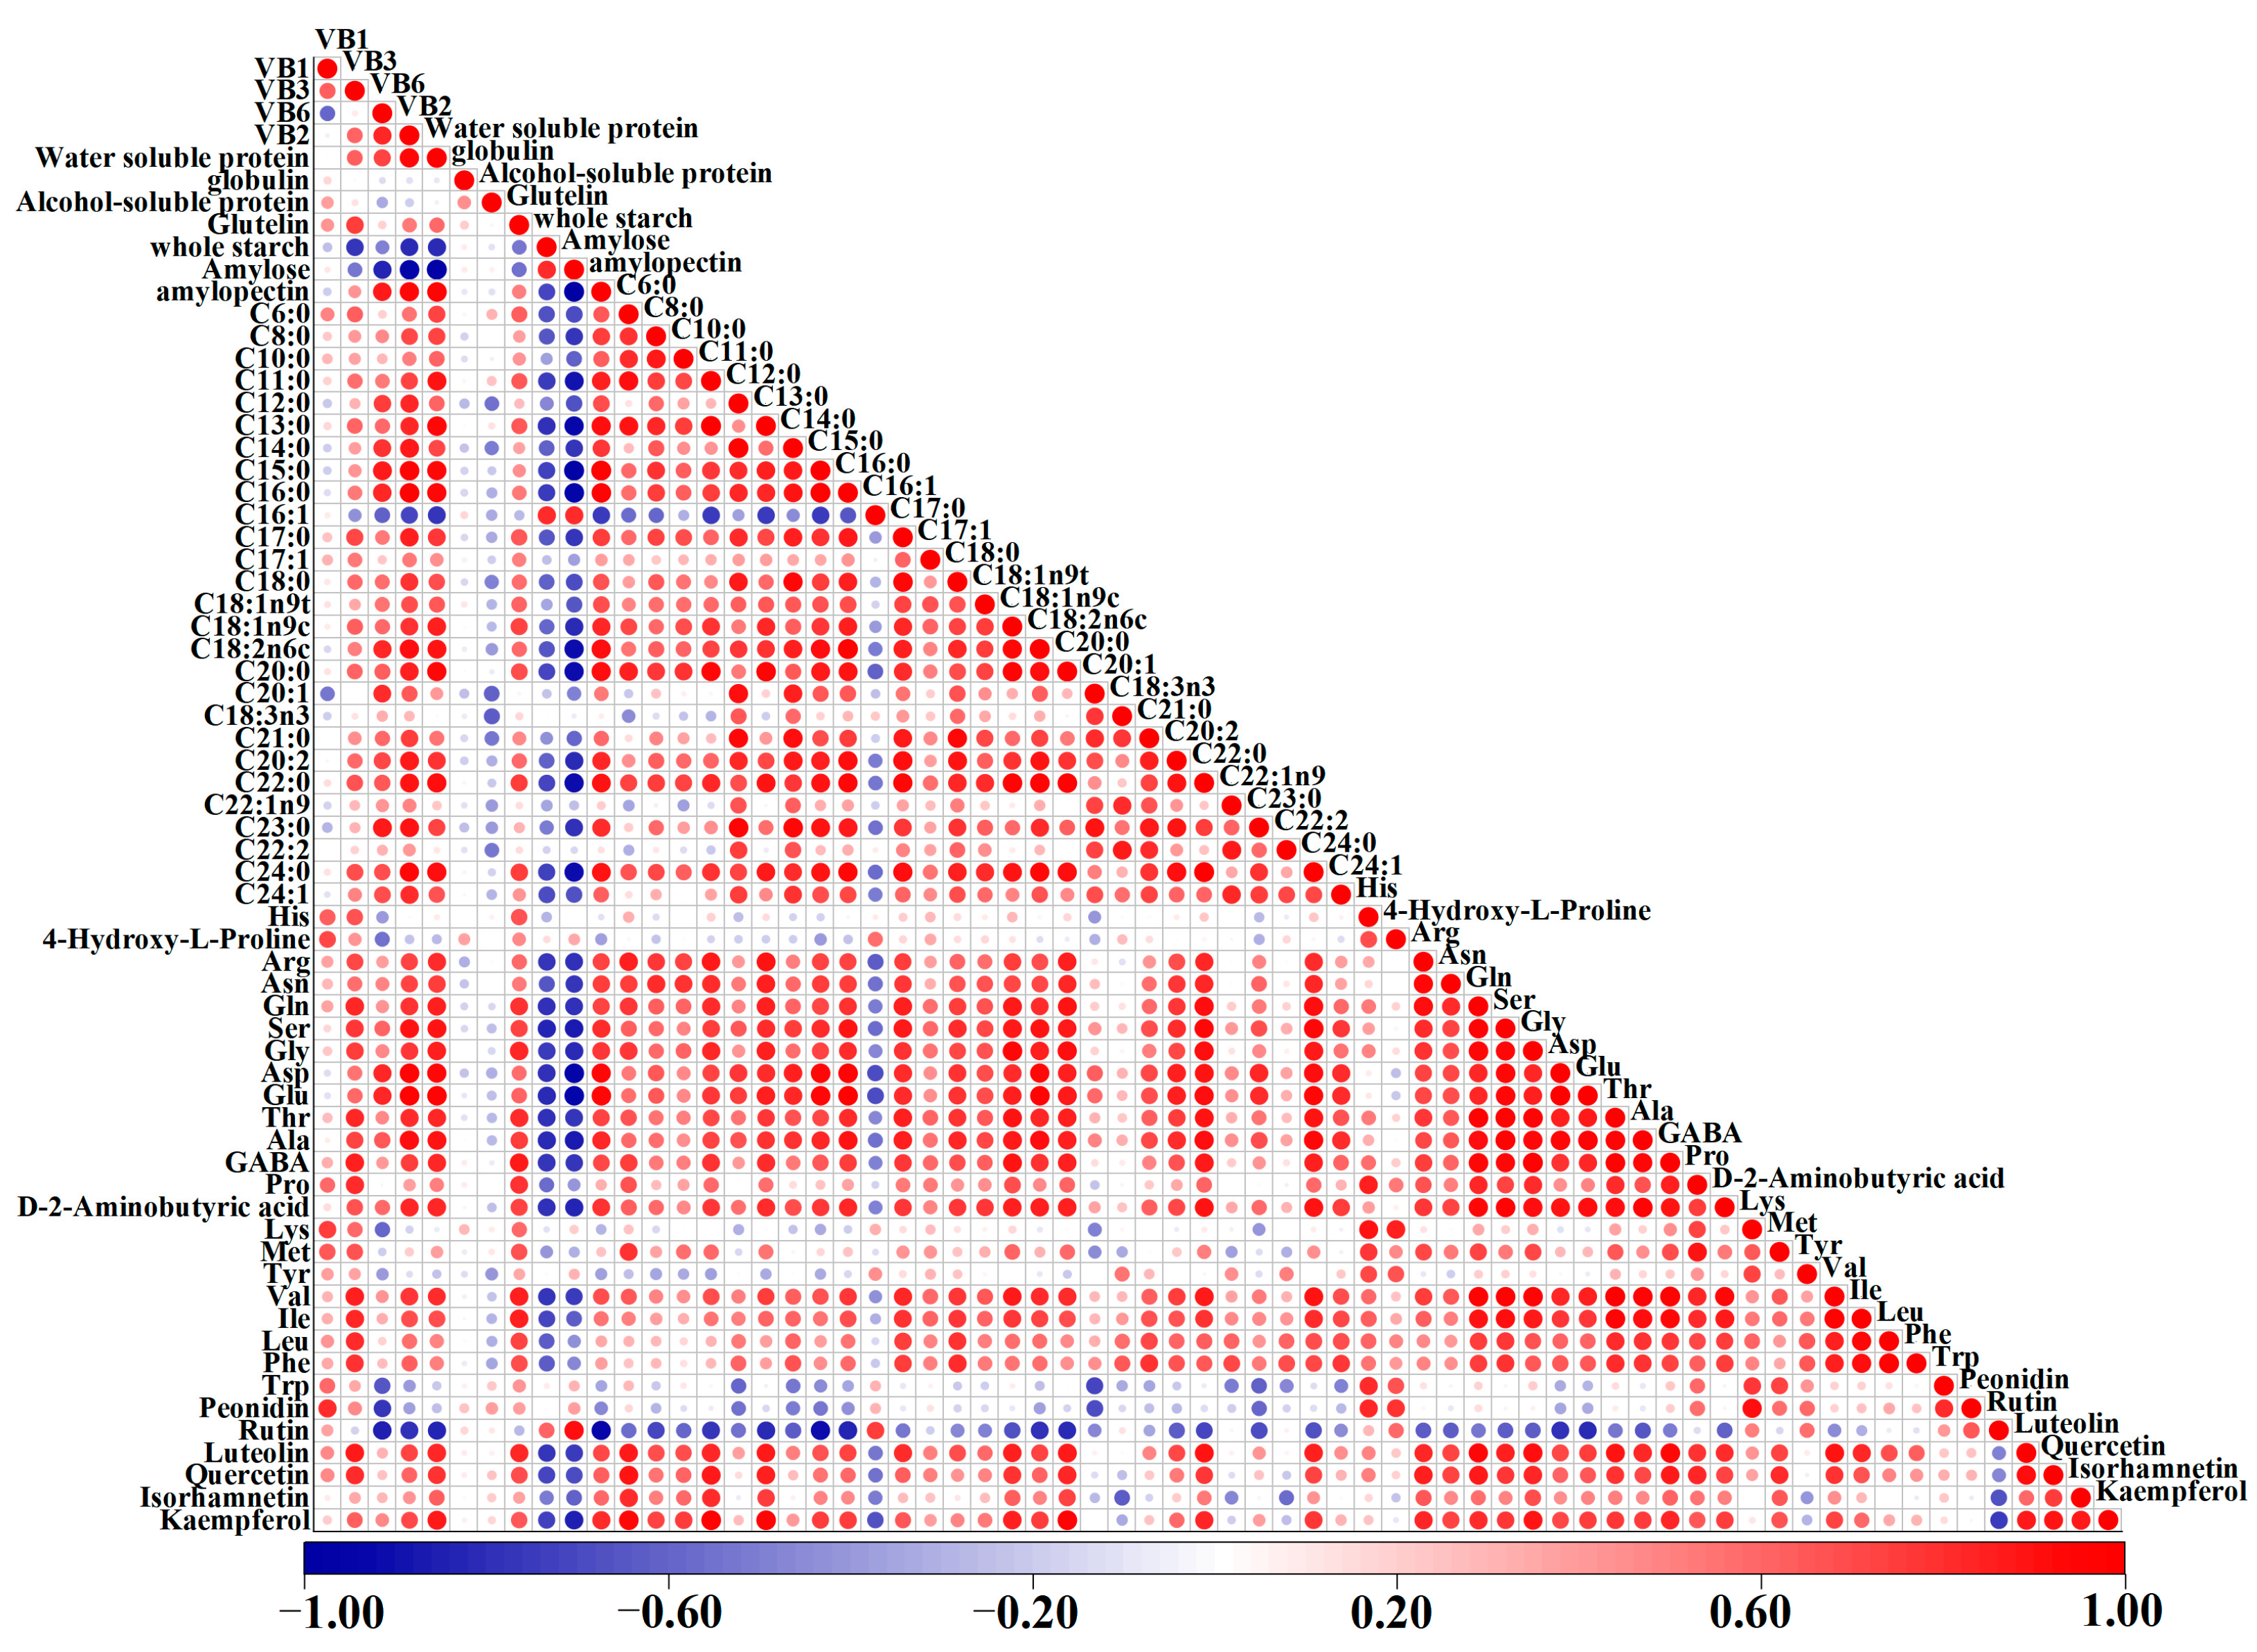
3.8. Correlation Analysis

We conducted a correlation analysis of each indicator to explore their relationship with each other. The correlation analysis results (Figure 5) indicated a highly significant positive correlation between total starch content and amylose, peonidin, rutin, as well as palmitic methyl ester, and a highly significant negative correlation with amylopectin, water-soluble proteins, riboflavin, and nicotinamide. The correlation coefficients were 0.81, 0.81, −0.70, −0.81, −0.80, and −0.76, respectively. Amylose exhibited a highly significant positive correlation with palmitic methyl ester and a highly significant negative correlation with amylopectin, water-soluble proteins, riboflavin, and pyridoxine, with correlation coefficients of 0.80, −0.99, −0.97, −0.95, and −0.82, respectively. Amylopectin showed significant positive correlations with water-soluble proteins, riboflavin, and pyridoxine, and significant negative correlations with total starch and amylose, with correlation coefficients of 0.95, 0.93, 0.86, −0.70, and −0.99, respectively.
The correlation analysis of the four protein types revealed that globulin showed no significant correlations with other parameters. Alcohol-soluble protein exhibited significant negative correlations only with 11-eicosenoic methyl ester and linolenic methyl ester. Water-soluble protein displayed a significant positive correlation with glutelin and amylopectin, with correlation coefficients of 0.60 and 0.95, while it was negatively correlated with total starch, amylose, and palmitic methyl ester. Glutelin had a significant positive correlation with nicotinamide, with a correlation coefficient of 0.75, and, in addition, it exhibited positive correlations with various free amino acids and medium-long chain fatty acids.
Among the measured free amino acids, except for histidine, L-4-hydroxyproline, lysine, tyrosine, and methionine, which showed relatively low correlations with other substances, most amino acids exhibited significant positive correlations with each other. These amino acids also demonstrated significant positive correlations with riboflavin, nicotinamide, water-soluble protein, glutelin, and most medium-long chain fatty acids. However, they displayed negative correlations with total starch, amylose, and palmitic methyl ester.
11-eicosenoic methyl ester, linolenic methyl ester, erucic methyl ester, and lignoceric methyl ester exhibited relatively low correlations with other substances. Palmitic methyl ester showed a highly significant positive correlation with total starch and amylose, while it displayed negative correlations or no significant correlations with other substances. Additionally, most other medium-long chain fatty acids displayed significant positive correlations with riboflavin, nicotinamide, pyridoxine, water-soluble protein, glutelin, the majority of free amino acids, and with each other.
Thiamine displayed a strong positive correlation with nicotinamide (0.63) but a significant negative correlation with pyridoxine (−0.58). There were no significant correlations between thiamine and starch, protein, or medium-long chain fatty acids. Thiamine exhibited positive correlations with various free amino acids, including histidine, proline, lysine, methionine, tryptophan, and 4-hydroxyproline, with correlation coefficients of 0.64, 0.60, 0.76, 0.66, 0.60, and 0.71, respectively. Riboflavin showed significant positive correlations with nicotinamide, pyridoxine, and water-soluble protein, with correlation coefficients of 0.60, 0.82, and 0.93, respectively. Nicotinamide displayed a strong positive correlation with water-soluble protein and glutelin, with correlation coefficients of 0.75 and 0.62. Pyridoxine exhibited a significant positive correlation with water-soluble protein, with a correlation coefficient of 0.74. Luteolin, quercetin, isorhamnetin and kaempferol were negatively correlated with rutin, thiamine, histidine, 4-Hydroxy-L-Proline, lysine, methionine, tyrosine and tryptophan methionine. Peonidin and rutin were positively correlated with total starch, amylose and palmitic methyl ester, and negatively correlated with other metabolites.

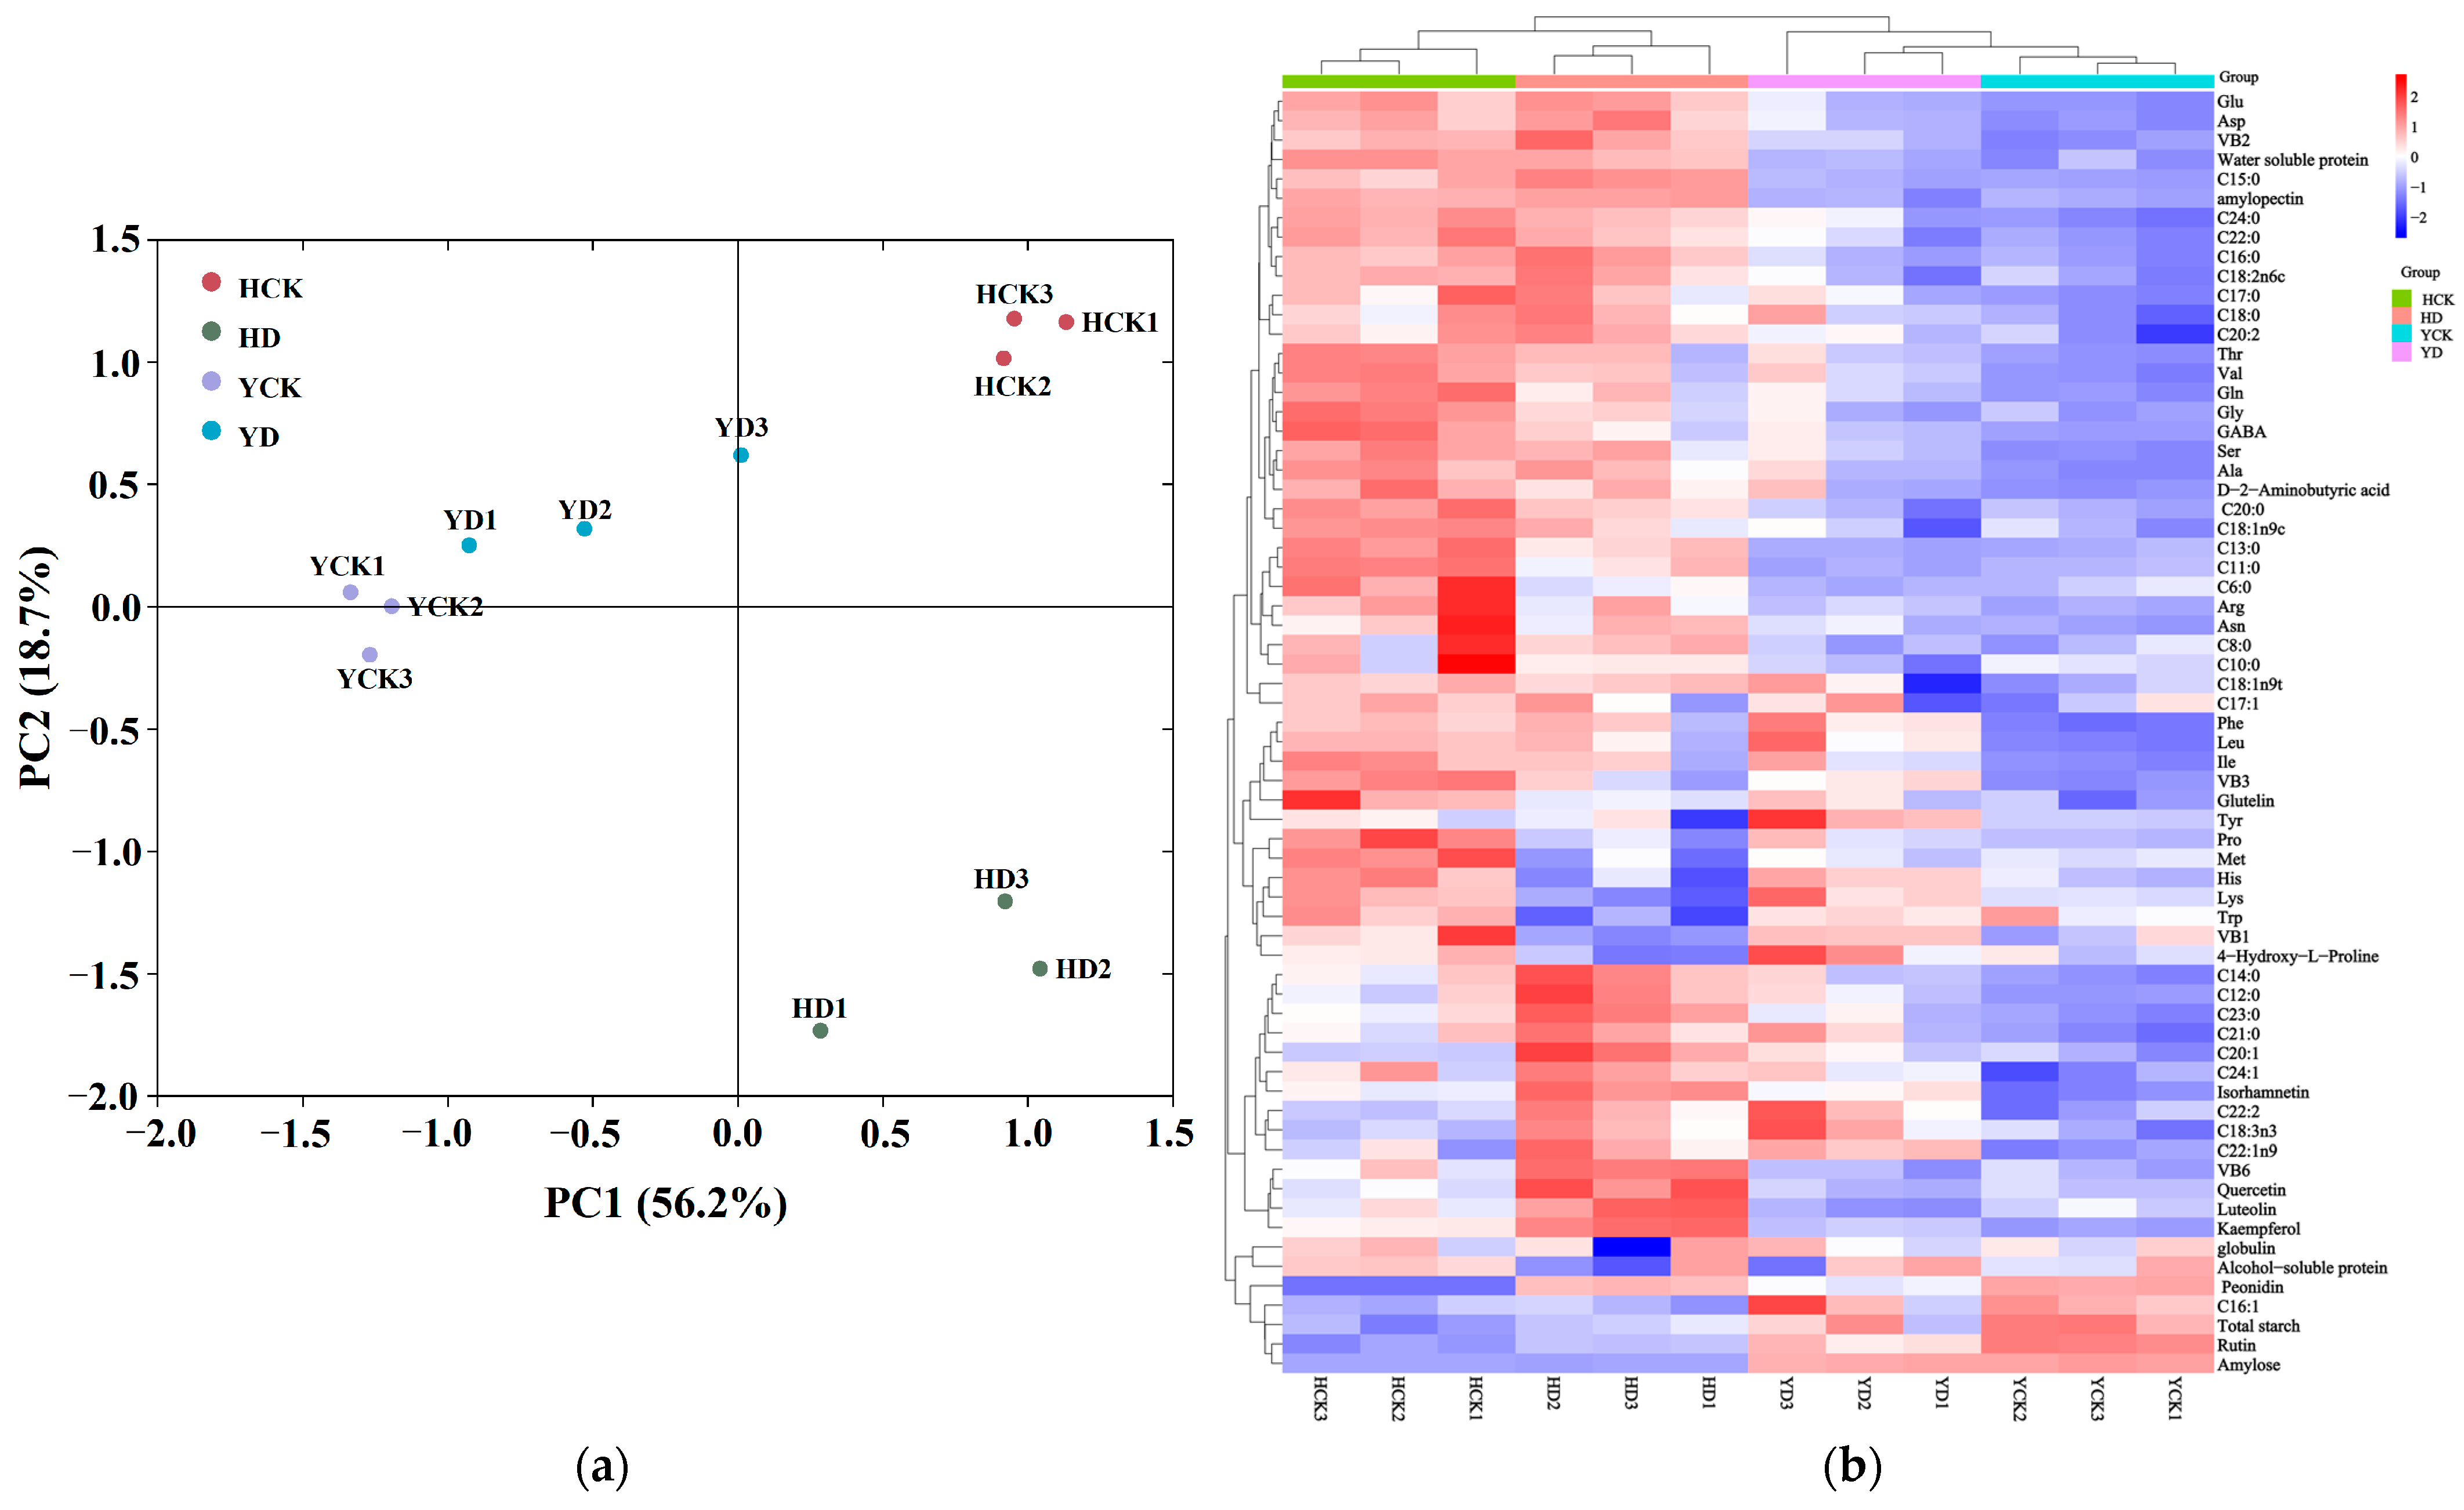
3.9. Principal Component Analysis and Hierarchical Cluster Analysis

To visually observe and further analyze the impact of drought stress on the grain quality of broomcorn millet across different genotypes, we conducted normalization, Principal Component Analysis (PCA), and Hierarchical Cluster Analysis (HCA) on the samples.
The plot of PCA analysis (Figure 6a) reveals that PC1 contributes to 56.2% of the variance, PC2 to 18.7%, and the cumulative contribution of PC1 and PC2 is 74.9%. With the exception of YD3, all samples from Yanshu No. 10 are aligned along the positive axis of PC1, while samples from Hequ red millet are situated along the negative axis of PC1. Samples HCK1, HCK2, and HCK3 cluster together closely. There are significant differences among all four groups, but the control and drought-treated groups of Yanshu No. 10 are the closest, indicating a relatively high level of similarity between these two groups. In contrast, the control and drought-treated groups of Hequ red millet are more distant, signifying a greater difference between the two groups.
After normalizing the content of all the indicators, a hierarchical clustering heatmap of relative abundance was created, as depicted in Figure 6b. The color gradient reflects variations in expression levels, with a redder shade indicating higher content and a bluer hue indicating lower content. The figure reveals that amylose exhibits lower expression levels in Hequ red millet but is highly expressed in Yanshu No. 10. The clustering analysis distinctly groups the two varieties, with different treatment groups of each variety forming separate clusters. This indicates substantial differences between the two varieties with relatively low similarity. Within the same variety, different treatments display both disparities and similarities.

4. Discussion

Drought places limitations on the worldwide use of arable land. While plants can adapt to short-term drought stress through physiological changes, in the long term, these alterations can have an adverse impact on crop quality and yield [10].
Amylose possesses exceptional molding, gelling, and stretching capabilities, whereas amylopectin exhibits notable resistance to aging, freeze-thaw stability, thickening effects, high expansibility, and water absorption [41]. According to Yang et al. [42] varieties of broomcorn millet with high amylose content demonstrated significantly lower whole-powder water absorption and oil absorption compared to those with low amylose content. Furthermore, the whole-powder viscosity, final viscosity, setback viscosity, gelatinization time, and gelatinization temperature were markedly higher in varieties with low amylose content. The intermolecular binding force in amylose is stronger than that in amylopectin, making starch less prone to gelatinization and, consequently, raising the gelatinization temperature as the amylose content increases.
During the grain-filling process, grains utilize sugars from the photosynthetic organs to synthesize starch, proteins, and lipids through metabolic activities, and these substances determine crop quality. Huang et al. [43] demonstrated that rice formed starch in the chloroplasts through photosynthesis and transported it in the form of sucrose to the organs for “metabolic sink.” Upon entering grain cells, sucrose is converted into ADP-glucose (ADPG) through sucrose hydrolysis. Subsequently, under the action of granule-bound starch synthase (GBSS), it forms amylose. With the combined action of soluble starch synthase (SSS), starch branching enzyme (SBE), and starch debranching enzyme (DBE), sucrose forms pectin [44]. However, drought stress obstructs organic compound synthesis and transport pathways [10], affecting starch enzyme activity and leading to insufficient biomass accumulation in crops, ultimately altering the composition of amylose and amylopectin, which aligns with the results obtained in this study. Starch is the most prominent component in grains of broomcorn millet, and its content, amylose-to-amylopectin ratio, and physicochemical properties significantly impact the taste and processing quality [42]. Broomcorn millet with high amylose exhibits greater hardness and chewiness after cooking [42]. Those with high amylopectin are stickier, more stable, and require less cooking time. In this study, drought stress resulted in a decrease in amylose content and the amylose-to-amylopectin ratio in both varieties. It significantly increased the amylopectin content in Hequ red millet. Drought stress enhances stickiness, flavor, and processing quality by lowering amylose content and the amylose-to-amylopectin ratio while significantly increasing the amylopectin content in Hequ red millet, ultimately improving its culinary and processing quality.
Under drought stress, crops gradually dehydrate, leading to changes in the arrangement of lipid molecules in cell membranes, subsequently altering the positioning and configuration of proteins on the membrane [7]. This, in turn, disrupts the stability of proteins and the activity of enzymes. Under drought stress, the activity of ROS scavenging enzymes decreases, which in turn weakens crop photosynthesis [10] and carbohydrate transport is blocked [45]. When carbohydrate stores are depleted, plants induce the degradation of lipids and proteins as a substitute for respiratory substrates [44], intensifying breakdown processes [43]. As a result, the synthesis and metabolic rate of proteins in plants decrease [44], ultimately leading to a reduction in protein content. Within plant cells, acetyl-CoA regulates carbon metabolism by influencing protein acetylation [46]. Acetyl-CoA plays a role in the synthesis of fatty acids, amino acids, flavonoids, phenols, alkaloids, and other substances [47]. Therefore, drought stress can affect the content of amino acids, fatty acids, and carbohydrates in plants by influencing proteins. In this study, drought stress significantly reduced the water-soluble protein and glutelin content in Hequ red millet. Correlation analysis revealed that water-soluble protein exhibited a significant positive correlation with glutelin, amylopectin, riboflavin, niacinamide, pyridoxine, and most free amino acids and medium-long chain fatty acids. Glutelin exhibited a significant positive correlation with riboflavin and most free amino acids. Alcohol-soluble protein only exhibited a significant negative correlation with two amino acids, while there was no correlation between globulin and other substances. This suggests that drought primarily affects other nutrient components by altering the water-soluble protein and glutelin content in broomcorn millet. Additionally, drought stress may trigger the synthesis of drought-resistant proteins and gene expression, such as MBY, bZIP, SnRKs and so on [48]. Protein content in broomcorn millet varies significantly in different studies. Wang et al. [26] reported that protein content in broomcorn millet ranges from 9% to 17%, with albumin, alcohol-soluble protein, glutelin, and globulin making up approximately 1.4%, 4.0%, 0.3%, and 2.4%, respectively. The results of this study show that both varieties of broomcorn millet have a protein composition of glutelin > alcohol-soluble protein > water-soluble protein > globulin, which differs from previous findings. This variation could be due to significant differences in protein content between varieties.
Amino acids are intricately associated with carbon metabolism, as they are primarily synthesized from intermediates within the photosynthetic carbon cycle and can be further degraded into intermediates of the TCA (Tricarboxylic Acid) cycle or their precursors [49]. Amino acids can be used as precursors for the synthesis of plant hormones [50], facilitate source-to-sink transport for nitrogen [51], participate in resistance to external abiotic stressors [52]. Chemical protection as a commonly used agricultural measure can affect the amino acid content of crops [53,54]. When facing non-biological (abiotic) stress, amino acids can either originate from de novo synthesis or result from the degradation of proteins [45]. Hildebrandt et al. [55] revealed that some highly abundant amino acids, such as proline, arginine, asparagine, glutamine, and GABA, are synthesized during non-biological stress events. Drought stress hinders organic compound synthesis and transport pathways [10]. The relative water content of plants decreases and leads to protein degradation [44]. These factors result in increased soluble sugar and amino acid content in some crops [56] and increased osmotic pressure within plant cells, subsequently inducing high osmotic stress within the plant cells [7]. Proline plays a critical role in regulating osmotic pressure, it can enhance the water retention of plant cells by controlling stomatal closure and promote normal growth under drought stress [57]. The increase in proline concentration under drought stress suggests its role in overcoming prolonged drought through osmotic adjustments [58]. Amino acids can be transformed into organic acids, carbohydrates, and proteins through the photosynthetic pathway [49]. The concentrations of lysine, histidine, glutamine, and valine significantly decreased in Hequ red millet but increased in Yanshu No. 10. As per Paul’s findings [29], the total free amino acid concentration increases with the intensification of drought stress treatments. In this study, Yanshu No. 10 exhibited a similar response to drought stress, while Hequ red millet yielded the opposite result. This variation may be attributed to the different drought resistance mechanisms of the two varieties. Among the measured free amino acids, several of them exhibited a significant negative correlation with total starch and amylopectin content and a significant positive correlation with amylopectin, water-soluble protein, glutelin, riboflavin, niacinamide, and various medium-long chain fatty acids. Drought stress reduced the total free amino acid in Hequ red millet and increased it in Yanshu No. 10. This suggests that, in Hequ red millet, drought primarily reduces the total free amino acid by decreasing the water-soluble protein, glutelin, niacinamide, as well as increasing the total starch content. In Yanshu No. 10, drought primarily increases the total free amino acid by reducing total starch and amylose content while increasing the medium-long chain fatty acids, riboflavin, and niacinamide.
Fatty acids (FAs) play crucial roles as integral components of cell membranes and lipid storage. They are also precursors of various plant metabolites [59] and signaling molecules [60]. FAs in plants are synthesized exclusively within plastids and are catalyzed by enzymes such as acetyl CoA carboxylase (ACC) and fatty acid synthase (FAS) [61]. These enzymatic processes lead to the formation of C16 and C18 FAs [62], which are further converted into triacylglycerols (TAGs) and stored in oil bodies [63] within plant cells under the influence of a series of enzymes, including diacylglycerol acyltransferases. The most common unsaturated fatty acids (UFAs) are three 18-carbon (C18) fatty acids. In plants, C18 UFAs are raw materials for the synthesis of aliphatic compounds including membrane glycerolipids, TAGs, methyl jasmonate, and nitroalkenes [64]. These products, as well as C18 unsaturated fatty acids themselves, are involved in plant defense against various biotic and abiotic stresses [61]. The photosynthetic capacity of plants is reduced under the stress environment [10], and reduced membrane fluidity restricts the lateral movement of proteins and lipids involved in the photosynthetic process [65]. Most of the neutral membrane lipids found in photosynthetic membranes are comprised of unsaturated linolenic acids [61]. Higher unsaturation levels lead to increased membrane fluidity [66], necessitating the induction of membrane stability through UFAs to support photosynthesis and enhance a plant’s resistance to environmental stress. Regarding the measured medium-long chain fatty acids, there’s a negative correlation with palmitic methyl ester and other components. Most medium-long chain fatty acids show a significant negative correlation with total starch and amylose, but they exhibit significant positive correlations with other components. However, these FAs do not demonstrate any significant correlations with certain components, such as thiamine, globulin, tyrosine, lysine, histidine, histamine, and 4-hydroxyproline. These findings suggest that drought can affect the content of medium-long chain fatty acids by regulating the levels of other components.
Miret et al. [67] conducted research indicating a close relationship between vitamin synthesis and nitrogen metabolism in plants. Most vitamins in plants are synthesized using amino acids as precursors. Amino acids are integrated into the structural framework of vitamins during the biosynthesis and metabolism of vitamins, and they can also be used as donors for amino, sulfur, or single-carbon groups. Mild abiotic stress can increase the vitamin content in crops, even indirectly providing limited protection against pathogens. Under drought stress, Kausar [68] sprayed thiamine on peas (Pisum sativum L.), which acted as a growth promoter and significantly improved photosynthetic properties, soluble sugars, proline, antioxidants, and mineral absorption. This suggests that thiamine mitigates the harm caused by drought stress to peas by regulating these physiological and biochemical mechanisms. Zhang et al. [69] showed that under drought stress, Chinese wingnut (Pterocarya stenoptera) significantly increased the level of thiamine by up-regulating the expression of thiamine synthesis genes, and then significantly increased the expression of eight chlorophyll synthesis-related genes such as HemA and HemE, and enhanced photosynthesis. In addition, the Chinese wingnut treated with thiamine stimulated the expression of genes related to the growth hormone signaling pathway and upregulated the expression of growth hormone response factor (ARFs), thus alleviating the negative effects of drought on Chinese wingnut. In this study, the drought-sensitive variety Yanshu No. 10 maintained higher thiamine levels under drought stress, while the drought-resistant variety, Hequ red millet, displayed the opposite trend with a significant decrease in thiamine content. Deng et al. [70] found that low and medium concentration of riboflavin treatment improved drought tolerance and antioxidant enzyme activity of tobacco plants, while high concentration of riboflavin decreased drought tolerance of tobacco plants, and speculated that riboflavin-mediated ROS production may determine the effect of riboflavin on drought tolerance of tobacco plants. Drought can activate the degradation of nicotinamide adenine dinucleotide (NAD) by poly (ADP-ribose) polymerase (PARP), releasing niacinamide and increasing ATP consumption, depleting energy resources, and ultimately causing cell death [67]. In this study, riboflavin content in Hequ red millet significantly decreased under drought stress, while in the drought-sensitive variety Yanshu No. 10, riboflavin content significantly increased, aligning with the findings of the study. Pyridoxine is an effective antioxidant that can be rapidly oxidized and plays a role in photosensitizer resistance by quenching 1O2 [71]. Pyridoxal phosphate (PLP) is the active form of pyridoxine. Huang et al. showed that abiotic stress could increase the PLP level of tobacco plants by up to 2.5 times [72]. The content of pyridoxine in red broomcorn millet was significantly increased under drought stress, which may be due to the metabolic regulation of broomcorn millet to promote its synthesis to cope with drought.
Anthocyanins have the functions of improving photosynthesis rate, membrane permeability, optimizing nutrient absorption [73], scavenging free radicals, anti-oxidation and regulating signal cascade reaction [74]. Abiotic stress can cause cell homeostasis disorder and induce excessive production of reactive oxygen species (ROS), and ROS, as a signaling molecule that activates the plant stress mechanism [75], can induce anthocyanin production in large quantities when subjected to abiotic stress, which can reduce the accumulation of H2O2 in plants [76]. ROS is cleared into vacuoles, thus playing a role in water homeostasis [77]. Therefore, the resistance of plants to abiotic stress is improved. Under drought stress, kaempferol and quercetin, as flavonoid compounds, make rice have strong non-enzymatic antioxidant activity through their functions of absorbing ultraviolet light and neutralizing free radicals [78], alleviate DNA damage, photosystem damage and cell death caused by stress, and enhance the stress resistance of rice [79]. Cao et al. [33] found that the genes for anthocyanin biosynthesis in broomcorn millet were significantly up-regulated under drought stress. In the study of Sperdouli et al. [21] moderate drought stress increased anthocyanin in Arabidopsis thaliana leaves by 2.9 times. Oksana et al. [80] observed that in buckwheat (Fagopyrum esculentum L) the effect of drought stress on quercetin varied with different varieties. In this study, drought stress significantly increased the contents of six anthocyanins in drought-resistant variety Hequ red millet, increased the contents of isorhamnetin and kaempferol in drought-sensitive variety Yanshu No. 10, and decreased the contents of peonidin, rutin, luteolin and quercetin.
In this study, the impact of flowering-stage drought stress on grain quality in grains of broomcorn millet with different genotypes was analyzed using ultra-high-performance liquid chromatography. This study found that flowering-stage drought stress led to varying changes in broomcorn millet’s quality, and these changes significantly differed among varieties. This indicates that varieties with varying drought resistance capabilities exhibit distinct response mechanisms when faced with drought stress [69]. Comparing the results with the control treatment, it was observed that drought stress caused a reduction in amylopectin content, four types of protein content, and the amylose/amylopectin ratio in the drought-resistant variety Hequ red millet. In contrast, total starch and amylopectin content increased. On the other hand, the drought-sensitive variety Yanshu No. 10 exhibited a decrease in amylose, amylopectin, and the amylose/amylopectin ratio under drought stress while showing an increase in total starch and the total content of the four proteins. This suggests that under drought stress, Hequ red millet enhances its quality by reducing amylose, protein content, and the amylose/amylopectin ratio, whereas Yanshu No. 10 improves its quality by decreasing amylose and the amylose/amylopectin ratio. In this study, metabolomics was used to elucidate the response mechanism of different genotypes of broomcorn millet to drought stress at flowering stage, which laid a theoretical foundation for improving the yield of broomcorn millet, improving the quality of grain nutrition, and breeding high-quality drought-resistant broomcorn millet varieties. However, the mechanisms of interaction between various quality indicators under drought stress and the degree to which they are affected are not yet fully understood. A comprehensive study encompassing physiological and metabolic aspects is needed to reveal these transport patterns and regulatory mechanisms, thus mitigating the adverse effects of drought on broomcorn millet.

5. Conclusions

In this study, two kinds of broomcorn millet with different drought resistance were used as materials. Using non-targeted metabolomics and physiological techniques, it was found that drought stress at flowering stage reduced the contents of protein, free amino acid, thiamine hydrochloride and nicotinamide in Hequ red millet, and significantly increased the contents of amylopectin, pyridoxine and anthocyanin. However, in Yanshu No.10, drought stress at flowering stage significantly increased the content of riboflavin and nicotinamide, and significantly decreased the content of amylose. These results provide a theoretical basis for improving the nutritional quality of broomcorn millet grains and breeding high-quality drought-tolerant varieties.

Author Contributions

Conceptualization, X.C. and Z.Q.; methodology, X.C. and S.L.; software, J.R., Y.L., Y.H. and Y.X.; validation, J.R., Y.L. and S.W.; formal analysis, J.R., J.M., Y.L., Y.X. and X.C.; investigation, J.R., Y.L., J.M., M.W., S.W. and Y.H.; resources, X.C.; data curation, J.R. and Y.L.; writing—original draft preparation, J.R., S.L. and X.C.; writing—review and editing, X.C.; visualization, J.R., Y.L. and X.C.; supervision, X.C. and Z.Q.; project administration, X.C., S.L. and Z.Q.; funding acquisition, X.C. and Z.Q. All authors have read and agreed to the published version of the manuscript.

Funding

This research was funded by the Shanxi Provincial Key Research and Development Program (Program No. 2022ZDYF110), the Central Guided Local Science and Technology Development Funds (YDZJSX2022A044), the earmarked fund for CARS (CARS-06-14.5-A16), the earmarked fund for Modern Agro-industry Technology Research System (2024CYJSTX03-23), and the Graduate Student Practice and Innovation Program of Shanxi Agricultural University (2023YCX52).

Data Availability Statement

All data generated or analyzed in the course of this study are provided in this article.

Conflicts of Interest

The authors declare no conflicts of interest.

References

  1. Yuan, Y.H.; Li, J.; Ma, H.C.; Yang, Q.H.; Liu, C.J.; Feng, B.L. Salt-tolerant Broomcorn Millet (Panicum miliaceum L.) Resists Salt Stress via Modulation of Cell Wall Biosynthesis and Na+ Balance. Land Degrad. Dev. 2021, 32, 518–532. [Google Scholar] [CrossRef]
  2. Chen, S.; Peng, W.; Ansah, E.O.; Xiong, F.; Wu, Y. Encoded C4 Homologue Enzymes Genes Function under Abiotic Stresses in C3 Plant. Plant Signal. Behav. 2022, 17, 2115634. [Google Scholar] [CrossRef] [PubMed]
  3. Shen, R.; Ma, Y.; Jiang, L.; Dong, J.; Zhu, Y.; Ren, G. Chemical Composition, Antioxidant, and Antiproliferative Activities of Nine Chinese Proso Millet Varieties. Food Agric. Immunol. 2018, 29, 625–637. [Google Scholar] [CrossRef]
  4. Na, X.; Cao, X.; Ma, C.; Ma, S.; Xu, P.; Liu, S.; Wang, J.; Wang, H.; Chen, L.; Qiao, Z. Plant Stage, Not Drought Stress, Determines the Effect of Cultivars on Bacterial Community Diversity in the Rhizosphere of Broomcorn Millet (Panicum miliaceum L.). Front. Microbiol. 2019, 10, 828. [Google Scholar] [CrossRef] [PubMed]
  5. Nielsen, D.C.; Vigil, M.F. Water Use and Environmental Parameters Influence Proso Millet Yield. Field Crops Res. 2017, 212, 34–44. [Google Scholar] [CrossRef]
  6. Luo, Y.; Liu, C.; Dang, K.; Gong, X.; Feng, B. Cultivar Sensitivity of Broomcorn Millet (Panicum miliaceum L.) to Nitrogen Availability Is Associated with Differences in Photosynthetic Physiology and Nitrogen Uptake. Plant Physiol. Biochem. PPB 2022, 182, 90–103. [Google Scholar] [CrossRef] [PubMed]
  7. Zhang, H.; Zhu, J.; Gong, Z.; Zhu, J.-K. Abiotic Stress Responses in Plants. Nat. Rev. Genet. 2022, 23, 104–119. [Google Scholar] [CrossRef]
  8. Chang, Y.-N.; Zhu, C.; Jiang, J.; Zhang, H.; Zhu, J.-K.; Duan, C.-G. Epigenetic Regulation in Plant Abiotic Stress Responses. J. Integr. Plant Biol. 2020, 62, 563–580. [Google Scholar] [CrossRef]
  9. Shanker, A.K.; Maheswari, M.; Yadav, S.K.; Desai, S.; Bhanu, D.; Attal, N.B.; Venkateswarlu, B. Drought Stress Responses in Crops. Funct. Integr. Genom. 2014, 14, 11–22. [Google Scholar] [CrossRef]
  10. Yang, Z.; Qin, F. The Battle of Crops against Drought: Genetic Dissection and Improvement. J. Integr. Plant Biol. 2023, 65, 496–525. [Google Scholar] [CrossRef]
  11. Liu, S.; Wang, H.; Qin, F. Genetic Dissection of Drought Resistance for Trait Improvement in Crops. Crop J. 2023, 11, 975–985. [Google Scholar] [CrossRef]
  12. Kooyers, N.J. The Evolution of Drought Escape and Avoidance in Natural Herbaceous Populations. Plant Sci. Int. J. Exp. Plant Biol. 2015, 234, 155–162. [Google Scholar] [CrossRef] [PubMed]
  13. Magallanes-López, A.M.; Ammar, K.; Morales-Dorantes, A.; González-Santoyo, H.; Crossa, J.; Guzmán, C. Grain Quality Traits of Commercial Durum Wheat Varieties and Their Relationships with Drought Stress and Glutenins Composition. J. Cereal Sci. 2017, 75, 1–9. [Google Scholar] [CrossRef]
  14. Farooq, M.; Hussain, M.; Usman, M.; Farooq, S.; Alghamdi, S.S.; Siddique, K.H.M. Impact of Abiotic Stresses on Grain Composition and Quality in Food Legumes. J. Agric. Food Chem. 2018, 66, 8887–8897. [Google Scholar] [CrossRef] [PubMed]
  15. Li, J.; Li, X.; Yang, Q.; Luo, Y.; Gong, X.; Zhang, W.; Hu, Y.; Yang, T.; Dong, K.; Feng, B. Proteomic Changes in the Grains of Foxtail Millet (Setaria italica (L.) Beau) under Drought Stress. Span. J. Agric. Res. 2019, 17, e0802. [Google Scholar] [CrossRef]
  16. Guo, J.; Qu, L.; Wang, L.; Lu, W.; Lu, D. Effects of Post-Silking Drought Stress Degree on Grain Yield and Quality of Waxy Maize. J. Sci. Food Agric. 2023, 103, 1530–1540. [Google Scholar] [CrossRef] [PubMed]
  17. Bheemanahalli, R.; Ramamoorthy, P.; Poudel, S.; Samiappan, S.; Wijewardane, N.; Reddy, K.R. Effects of Drought and Heat Stresses during Reproductive Stage on Pollen Germination, Yield, and Leaf Reflectance Properties in Maize (Zea mays L.). Plant Direct 2022, 6, e434. [Google Scholar] [CrossRef] [PubMed]
  18. Hong, Y.; Zhang, G. The Influence of Drought Stress on Malt Quality Traits of the Wild and Cultivated Barleys. J. Integr. Agric. 2020, 19, 2009–2015. [Google Scholar] [CrossRef]
  19. Chen, G.; Peng, L.; Gong, J.; Wang, J.; Wu, C.; Sui, X.; Tian, Y.; Hu, M.; Li, C.; He, X.; et al. Effects of Water Stress on Starch Synthesis and Accumulation of Two Rice Cultivars at Different Growth Stages. Front. Plant Sci. 2023, 14, 1133524. [Google Scholar] [CrossRef]
  20. Wang, X.; Fu, J.; Min, Z.; Zou, D.; Liu, H.; Wang, J.; Zheng, H.; Jia, Y.; Yang, L.; Xin, W.; et al. Response of Rice with Overlapping Growth Stages to Water Stress by Assimilates Accumulation and Transport and Starch Synthesis of Superior and Inferior Grains. Int. J. Mol. Sci. 2022, 23, 11157. [Google Scholar] [CrossRef]
  21. Sperdouli, I.; Moustakas, M. Interaction of Proline, Sugars, and Anthocyanins during Photosynthetic Acclimation of Arabidopsis thaliana to Drought Stress. J. Plant Physiol. 2012, 169, 577–585. [Google Scholar] [CrossRef] [PubMed]
  22. Hong, J.; Yang, L.; Zhang, D.; Shi, J. Plant Metabolomics: An Indispensable System Biology Tool for Plant Science. Int. J. Mol. Sci. 2016, 17, 767. [Google Scholar] [CrossRef] [PubMed]
  23. Hong, Y.; Ni, S.-J.; Zhang, G.-P. Transcriptome and Metabolome Analysis Reveals Regulatory Networks and Key Genes Controlling Barley Malting Quality in Responses to Drought Stress. Plant Physiol. Biochem. PPB 2020, 152, 1–11. [Google Scholar] [CrossRef] [PubMed]
  24. Tiedge, K.; Li, X.; Merrill, A.T.; Davisson, D.; Chen, Y.; Yu, P.; Tantillo, D.J.; Last, R.L.; Zerbe, P. Comparative Transcriptomics and Metabolomics Reveal Specialized Metabolite Drought Stress Responses in Switchgrass (Panicum virgatum). New Phytol. 2022, 236, 1393–1408. [Google Scholar] [CrossRef]
  25. Ullah, S.; Khan, M.N.; Lodhi, S.S.; Ahmed, I.; Tayyab, M.; Mehmood, T.; Din, I.U.; Khan, M.; Sohail, Q.; Akram, M. Targeted Metabolomics Reveals Fatty Acid Abundance Adjustments as Playing a Crucial Role in Drought-Stress Response and Post-Drought Recovery in Wheat. Front. Genet. 2022, 13, 972696. [Google Scholar] [CrossRef]
  26. Wang, H.; Li, D.; Wan, C.; Luo, Y.; Yang, Q.; Gao, X.; Feng, B. Improving the Functionality of Proso Millet Protein and Its Potential as a Functional Food Ingredient by Applying Nitrogen Fertiliser. Foods 2021, 10, 1332. [Google Scholar] [CrossRef]
  27. Wang, H.; Wu, E.; Ma, Q.; Zhang, H.; Feng, Y.; Yang, P.; Gao, J.; Feng, B. Comparison of the Fine Structure and Physicochemical Properties of Proso Millet (Panicum miliaceum L.) Starch from Different Ecological Regions. Int. J. Biol. Macromol. 2023, 249, 126115. [Google Scholar] [CrossRef]
  28. Tian, L.; Yu, S.; Zhang, L.; Yang, J.; Feng, B.; Song, Y. Effects of Mulching Types on the Yield and Water Utilization by Broomcorn Millet (Panicum miliaceum): Results of a Study in the Loess Plateau, China. J. Environ. Manag. 2023, 345, 118856. [Google Scholar] [CrossRef]
  29. Paul Ajithkumar, I. Influences of Natural Antioxidants, Reactive Oxygen Species and Compatible Solutes of Panicum miliaceum L. Towards Drought Stress. Cell Biochem. Biophys. 2023, 81, 141–149. [Google Scholar] [CrossRef]
  30. Zhang, Y.; Gao, X.; Li, J.; Gong, X.; Yang, P.; Gao, J.; Wang, P.; Feng, B. Comparative Analysis of Proso Millet (Panicum miliaceum L.) Leaf Transcriptomes for Insight into Drought Tolerance Mechanisms. BMC Plant Biol. 2019, 19, 397. [Google Scholar] [CrossRef]
  31. Barnabás, B.; Jäger, K.; Fehér, A. The Effect of Drought and Heat Stress on Reproductive Processes in Cereals. Plant Cell Environ. 2008, 31, 11–38. [Google Scholar] [CrossRef] [PubMed]
  32. Liu, Y.; Ren, J.; Hu, Y.; Wang, S.; Mao, J.; Xu, Y.; Wang, M.; Liu, S.; Qiao, Z.; Cao, X. Effects of Drought Stress during the Flowering Period on the Rhizosphere Fungal Diversity of Broomcorn Millet (Panicum miliaceum L.). Agronomy 2023, 13, 2896. [Google Scholar] [CrossRef]
  33. Cao, X.; Hu, Y.; Song, J.; Feng, H.; Wang, J.; Chen, L.; Wang, L.; Diao, X.; Wan, Y.; Liu, S.; et al. Transcriptome Sequencing and Metabolome Analysis Reveals the Molecular Mechanism of Drought Stress in Millet. Int. J. Mol. Sci. 2022, 23, 10792. [Google Scholar] [CrossRef]
  34. Deng, F.; Li, Q.; Chen, H.; Zeng, Y.; Li, B.; Zhong, X.; Wang, L.; Ren, W. Relationship between Chalkiness and the Structural and Thermal Properties of Rice Starch after Shading during Grain-Filling Stage. Carbohydr. Polym. 2021, 252, 117212. [Google Scholar] [CrossRef] [PubMed]
  35. Fan, W.; Zhang, Y.; Wu, Y.; Zhou, W.; Yang, J.; Yuan, L.; Zhang, P.; Wang, H. The H+-Pyrophosphatase IbVP1 Regulates Carbon Flux to Influence the Starch Metabolism and Yield of Sweet Potato. Hortic. Res. 2021, 8, 20. [Google Scholar] [CrossRef] [PubMed]
  36. Wieser, H.; Antes, S.; Seilmeier, W. Quantitative Determination of Gluten Protein Types in Wheat Flour by Reversed-Phase High-Performance Liquid Chromatography. Cereal Chem. 1998, 75, 644–650. [Google Scholar] [CrossRef]
  37. Kovács, Z.; Simon-Sarkadi, L.; Sovány, C.; Kirsch, K.; Galiba, G.; Kocsy, G. Differential Effects of Cold Acclimation and Abscisic Acid on Free Amino Acid Composition in Wheat. Plant Sci. Int. J. Exp. Plant Biol. 2011, 180, 61–68. [Google Scholar] [CrossRef]
  38. Li, S.-S.; Yuan, R.-Y.; Chen, L.-G.; Wang, L.-S.; Hao, X.-H.; Wang, L.-J.; Zheng, X.-C.; Du, H. Systematic Qualitative and Quantitative Assessment of Fatty Acids in the Seeds of 60 Tree Peony (Paeonia Section Moutan DC.) Cultivars by GC-MS. Food Chem. 2015, 173, 133–140. [Google Scholar] [CrossRef]
  39. Cellar, N.A.; McClure, S.C.; Salvati, L.M.; Reddy, T.M. A New Sample Preparation and Separation Combination for Precise, Accurate, Rapid, and Simultaneous Determination of Vitamins B1, B2, B3, B5, B6, B7, and B9 in Infant Formula and Related Nutritionals by LC-MS/MS. Anal. Chim. Acta 2016, 934, 180–185. [Google Scholar] [CrossRef]
  40. Barnes, J.S.; Nguyen, H.P.; Shen, S.; Schug, K.A. General Method for Extraction of Blueberry Anthocyanins and Identification Using High Performance Liquid Chromatography-Electrospray Ionization-Ion Trap-Time of Flight-Mass Spectrometry. J. Chromatogr. A 2009, 1216, 4728–4735. [Google Scholar] [CrossRef]
  41. Syahariza, Z.A.; Sar, S.; Hasjim, J.; Tizzotti, M.J.; Gilbert, R.G. The Importance of Amylose and Amylopectin Fine Structures for Starch Digestibility in Cooked Rice Grains. Food Chem. 2013, 136, 742–749. [Google Scholar] [CrossRef] [PubMed]
  42. Yang, Q.; Zhang, P.; Qu, Y.; Gao, X.; Liang, J.; Yang, P.; Feng, B. Comparison of Physicochemical Properties and Cooking Edibility of Waxy and Non-Waxy Proso Millet (Panicum miliaceum L.). Food Chem. 2018, 257, 271–278. [Google Scholar] [CrossRef] [PubMed]
  43. Huang, L.; Tan, H.; Zhang, C.; Li, Q.; Liu, Q. Starch Biosynthesis in Cereal Endosperms: An Updated Review over the Last Decade. Plant Commun. 2021, 2, 100237. [Google Scholar] [CrossRef] [PubMed]
  44. Prathap, V.; Tyagi, A. Correlation between Expression and Activity of ADP Glucose Pyrophosphorylase and Starch Synthase and Their Role in Starch Accumulation during Grain Filling under Drought Stress in Rice. Plant Physiol. Biochem. PPB 2020, 157, 239–243. [Google Scholar] [CrossRef]
  45. Zhang, M.; He, S.; Qin, B.; Jin, X.; Wang, M.; Ren, C.; Cao, L.; Zhang, Y. Exogenous Melatonin Reduces the Inhibitory Effect of Osmotic Stress on Antioxidant Properties and Cell Ultrastructure at Germination Stage of Soybean. PLoS ONE 2020, 15, e0243537. [Google Scholar] [CrossRef] [PubMed]
  46. Xing, S.; Poirier, Y. The Protein Acetylome and the Regulation of Metabolism. Trends Plant Sci. 2012, 17, 423–430. [Google Scholar] [CrossRef] [PubMed]
  47. Oliver, D.J.; Nikolau, B.J.; Wurtele, E.S. Acetyl-CoA—Life at the Metabolic Nexus. Plant Sci. 2009, 176, 597–601. [Google Scholar] [CrossRef]
  48. Saharan, B.S.; Brar, B.; Duhan, J.S.; Kumar, R.; Marwaha, S.; Rajput, V.D.; Minkina, T. Molecular and Physiological Mechanisms to Mitigate Abiotic Stress Conditions in Plants. Life 2022, 12, 1634. [Google Scholar] [CrossRef]
  49. Pratelli, R.; Pilot, G. Regulation of Amino Acid Metabolic Enzymes and Transporters in Plants. J. Exp. Bot. 2014, 65, 5535–5556. [Google Scholar] [CrossRef]
  50. Tegeder, M. Transporters for Amino Acids in Plant Cells: Some Functions and Many Unknowns. Curr. Opin. Plant Biol. 2012, 15, 315–321. [Google Scholar] [CrossRef]
  51. Rentsch, D.; Schmidt, S.; Tegeder, M. Transporters for Uptake and Allocation of Organic Nitrogen Compounds in Plants. FEBS Lett. 2007, 581, 2281–2289. [Google Scholar] [CrossRef] [PubMed]
  52. Sharma, S.S.; Dietz, K.-J. The Significance of Amino Acids and Amino Acid-Derived Molecules in Plant Responses and Adaptation to Heavy Metal Stress. J. Exp. Bot. 2006, 57, 711–726. [Google Scholar] [CrossRef] [PubMed]
  53. Wang, C.; Amon, B.; Schulz, K.; Mehdi, B. Factors That Influence Nitrous Oxide Emissions from Agricultural Soils as Well as Their Representation in Simulation Models: A Review. Agronomy 2021, 11, 770. [Google Scholar] [CrossRef]
  54. Iwaniuk, P.; Łuniewski, S.; Kaczyński, P.; Łozowicka, B. The Influence of Humic Acids and Nitrophenols on Metabolic Compounds and Pesticide Behavior in Wheat under Biotic Stress. Agronomy 2023, 13, 1378. [Google Scholar] [CrossRef]
  55. Hildebrandt, T.M. Synthesis versus Degradation: Directions of Amino Acid Metabolism during Arabidopsis Abiotic Stress Response. Plant Mol. Biol. 2018, 98, 121–135. [Google Scholar] [CrossRef]
  56. Sehgal, A.; Sita, K.; Siddique, K.H.M.; Kumar, R.; Bhogireddy, S.; Varshney, R.K.; HanumanthaRao, B.; Nair, R.M.; Prasad, P.V.V.; Nayyar, H. Drought or/and Heat-Stress Effects on Seed Filling in Food Crops: Impacts on Functional Biochemistry, Seed Yields, and Nutritional Quality. Front. Plant Sci. 2018, 9, 1705. [Google Scholar] [CrossRef] [PubMed]
  57. Szabados, L.; Savouré, A. Proline: A Multifunctional Amino Acid. Trends Plant Sci. 2010, 15, 89–97. [Google Scholar] [CrossRef]
  58. Ashraf, M.; Foolad, M.R. Roles of Glycine Betaine and Proline in Improving Plant Abiotic Stress Resistance. Environ. Exp. Bot. 2007, 59, 206–216. [Google Scholar] [CrossRef]
  59. Xiao, R.; Zou, Y.; Guo, X.; Li, H.; Lu, H. Fatty Acid Desaturases (FADs) Modulate Multiple Lipid Metabolism Pathways to Improve Plant Resistance. Mol. Biol. Rep. 2022, 49, 9997–10011. [Google Scholar] [CrossRef]
  60. Hou, Q.; Ufer, G.; Bartels, D. Lipid Signalling in Plant Responses to Abiotic Stress. Plant Cell Environ. 2016, 39, 1029–1048. [Google Scholar] [CrossRef]
  61. Lim, G.-H.; Singhal, R.; Kachroo, A.; Kachroo, P. Fatty Acid- and Lipid-Mediated Signaling in Plant Defense. Annu. Rev. Phytopathol. 2017, 55, 505–536. [Google Scholar] [CrossRef] [PubMed]
  62. Ohlrogge, J.; Browse, J. Lipid Biosynthesis. Plant Cell 1995, 7, 957–970. [Google Scholar] [PubMed]
  63. Halford, N.G.; Curtis, T.Y.; Chen, Z.; Huang, J. Effects of Abiotic Stress and Crop Management on Cereal Grain Composition: Implications for Food Quality and Safety. J. Exp. Bot. 2015, 66, 1145–1156. [Google Scholar] [CrossRef] [PubMed]
  64. He, M.; Ding, N.-Z. Plant Unsaturated Fatty Acids: Multiple Roles in Stress Response. Front. Plant Sci. 2020, 11, 562785. [Google Scholar] [CrossRef]
  65. Bargmann, B.O.; Munnik, T. The Role of Phospholipase D in Plant Stress Responses. Curr. Opin. Plant Biol. 2006, 9, 515–522. [Google Scholar] [CrossRef] [PubMed]
  66. Babiychuk, E.; Müller, F.; Eubel, H.; Braun, H.-P.; Frentzen, M.; Kushnir, S. Arabidopsis Phosphatidylglycerophosphate Synthase 1 Is Essential for Chloroplast Differentiation, but Is Dispensable for Mitochondrial Function. Plant J. Cell Mol. Biol. 2003, 33, 899–909. [Google Scholar] [CrossRef] [PubMed]
  67. Miret, J.A.; Munné-Bosch, S. Plant Amino Acid-Derived Vitamins: Biosynthesis and Function. Amino Acids 2014, 46, 809–824. [Google Scholar] [CrossRef]
  68. Kausar, A.; Zahra, N.; Zahra, H.; Hafeez, M.B.; Zafer, S.; Shahzadi, A.; Raza, A.; Djalovic, I.; Prasad, P.V. Alleviation of Drought Stress through Foliar Application of Thiamine in Two Varieties of Pea (Pisum sativum L.). Plant Signal. Behav. 2023, 18, 2186045. [Google Scholar] [CrossRef]
  69. Zhang, W.; Wang, S.-C.; Li, Y. Molecular Mechanism of Thiamine in Mitigating Drought Stress in Chinese Wingnut (Pterocarya Stenoptera): Insights from Transcriptomics. Ecotoxicol. Environ. Saf. 2023, 263, 115307. [Google Scholar] [CrossRef]
  70. Deng, B.; Jin, X.; Yang, Y.; Lin, Z.; Zhang, Y. The Regulatory Role of Riboflavin in the Drought Tolerance of Tobacco Plants Depends on ROS Production. Plant Growth Regul. 2014, 72, 269–277. [Google Scholar] [CrossRef]
  71. Bilski, P.; Li, M.Y.; Ehrenshaft, M.; Daub, M.E.; Chignell, C.F. Vitamin B6 (Pyridoxine) and Its Derivatives Are Efficient Singlet Oxygen Quenchers and Potential Fungal Antioxidants. Photochem. Photobiol. 2000, 71, 129–134. [Google Scholar] [CrossRef] [PubMed]
  72. Huang, S.; Zhang, J.; Wang, L.; Huang, L. Effect of Abiotic Stress on the Abundance of Different Vitamin B6 Vitamers in Tobacco Plants. Plant Physiol. Biochem. PPB 2013, 66, 63–67. [Google Scholar] [CrossRef] [PubMed]
  73. Kaur, S.; Tiwari, V.; Kumari, A.; Chaudhary, E.; Sharma, A.; Ali, U.; Garg, M. Protective and Defensive Role of Anthocyanins under Plant Abiotic and Biotic Stresses: An Emerging Application in Sustainable Agriculture. J. Biotechnol. 2023, 361, 12–29. [Google Scholar] [CrossRef] [PubMed]
  74. Alappat, B.; Alappat, J. Anthocyanin Pigments: Beyond Aesthetics. Molecules 2020, 25, 5500. [Google Scholar] [CrossRef]
  75. Naing, A.H.; Kim, C.K. Abiotic Stress-Induced Anthocyanins in Plants: Their Role in Tolerance to Abiotic Stresses. Physiol. Plant. 2021, 172, 1711–1723. [Google Scholar] [CrossRef] [PubMed]
  76. Thordal-Christensen, H.; Zhang, Z.; Wei, Y.; Collinge, D.B. Subcellular Localization of H2O2 in Plants. H2O2 Accumulation in Papillae and Hypersensitive Response during the Barley—Powdery Mildew Interaction. Plant J. 1997, 11, 1187–1194. [Google Scholar] [CrossRef]
  77. Nakabayashi, R.; Yonekura-Sakakibara, K.; Urano, K.; Suzuki, M.; Yamada, Y.; Nishizawa, T.; Matsuda, F.; Kojima, M.; Sakakibara, H.; Shinozaki, K.; et al. Enhancement of Oxidative and Drought Tolerance in Arabidopsis by Overaccumulation of Antioxidant Flavonoids. Plant J. Cell Mol. Biol. 2014, 77, 367–379. [Google Scholar] [CrossRef]
  78. Pollastri, S.; Tattini, M. Flavonols: Old Compounds for Old Roles. Ann. Bot. 2011, 108, 1225–1233. [Google Scholar] [CrossRef]
  79. Jan, R.; Khan, M.-A.; Asaf, S.; Lubna; Waqas, M.; Park, J.-R.; Asif, S.; Kim, N.; Lee, I.-J.; Kim, K.-M. Drought and UV Radiation Stress Tolerance in Rice Is Improved by Overaccumulation of Non-Enzymatic Antioxidant Flavonoids. Antioxidants 2022, 11, 917. [Google Scholar] [CrossRef]
  80. Oksana, S.; Marek, K.; Marian, B.; Marek, Z. Cultivar-Dependent and Drought-Induced Modulation of Secondary Metabolites, Adaptative Defense in Fagopyrum esculentum L. Physiol. Mol. Biol. Plants 2023, 29, 1605–1618. [Google Scholar] [CrossRef]
Figure 1. Effect of drought stress on starch content of broomcorn millet: (a) Total starch content; (b) Amylose content; (c) Amylopectin content. H: Hequ red millet; Y: Yanshu No. 10; CK: Control treatment; D: drought treatment, different lowercase letters indicated that the difference was significant at the p < 0.05 level; * The difference was significant at the p < 0.05 level.
Agronomy 14 00236 g001
Figure 2. Effects of drought stress on protein composition of broomcorn millet: (a) Water-soluble protein content. (b) Globulin content. (c) Alcohol-soluble protein content. (d) Glutelin content. H: Hequ red millet; Y: Yanshu No. 10; CK: Control treatment; D: drought treatment, different lowercase letters indicated that the difference was significant at the p < 0.05 level; * The difference was significant at the p < 0.05 level.
Agronomy 14 00236 g002
Figure 3. Effects of drought stress on contents of free amino acids and medium-long chain fatty acids in broomcorn millet: (a) Free amino acid content and (b) Medium-long chain fatty acid content. H: Hequ red millet; Y: Yanshu No. 10; CK: Control treatment; D: Drought treatment.
Agronomy 14 00236 g003
Figure 4. Effects of drought stress on vitamin content of broomcorn millet: (a) Thiamine content. (b) Riboflavin content, (c) Nicotinamide content, and (d) Pyridoxine content. H: Hequ red millet; Y: Yanshu No. 10; CK: Control treatment; D: Drought treatment, different lowercase letters indicated that the difference was significant at the p < 0.05 level; * The difference was significant at the p < 0.05 level.
Agronomy 14 00236 g004
Figure 5. Correlation heat map of broomcorn millet quality. Red indicates positive correlation, blue indicates negative correlation, color from deep to light and dot from large to small indicates correlation from strong to weak.
Agronomy 14 00236 g005
Figure 6. (a) Principal component analysis (PCA) score plot. Different colors represent different treatments. The abscissa and ordinate represent the scores of PC1 and PC2, respectively, H: Hequ red millet; Y: Yanshu No. 10; CK: Control treatment; D: Drought treatment. (b) Hierarchical clustering heat map of relative abundance of two broomcorn millet quality. Different colors indicate that the abundance of quality accumulation in different samples is different. The abscissa represents the sample name, and the ordinate represents the quality index. H: Hequ red millet; Y: Yanshu No. 10; CK: Control treatment; D: Drought treatment.
Agronomy 14 00236 g006
Table 1. Effects of drought stress on agronomic traits of broomcorn millet.
TreatmentPlant Height (cm)1000-Grain Weight (g)Grain Weight per Plant (g)Grain Area (mm2)Grain Length-Width RatioGrain Diameter (mm)
HCK91.17 ± 9.28 a7.16 ± 0.05 a2.53 ± 0.24 a6.18 ± 1.40 a1.39 ± 0.02 b2.77 ± 0.41 a
HD70.33 ± 4.37 b6.35 ± 0.16 c1.53 ± 0.17 b6.12 ± 0.97 a1.44 ± 0.01 a2.77 ± 0.29 a
YCK89.17 ± 6.01 a6.69 ± 0.13 b2.37 ± 0.42 a4.84 ± 1.79 b1.27 ± 0.02 d2.42 ± 0.57 b
YD74.73 ± 5.01 b6.00 ± 0.26 d1.32 ± 0.18 b4.30 ± 2.06 b1.30 ± 0.03 c2.24 ± 0.64 b
Mean81.356.551.945.361.352.55
SD10.870.460.591.780.070.54
CV (%)13.367.0230.4533.215.1921.18
MS6698.5343.094.0329.391.836.55
Peers with different lowercase letters indicate significant differences at the p < 0.05 level.
Table 2. Effect of drought stress on the content of free amino acids in broomcorn millet (µg/mg).
TreatmentHis4HLPArgAsnGlnSerGlyAspGluThrAlaGABAProD2ALysCysMetTyrValIleLeuPheTrp
HCK26.88 ± 1.97 a0.71 ± 0.03 a156.49 ± 24.28 a439.08 ± 66.9 a604.95 ± 27.98 a100.06 ± 5.77 a28.51 ± 0.83 a203.83 ± 15.24 a201.05 ± 16.54 a23.44 ± 0.72 a62.66 ± 5.48 a33.43 ± 3.42 a80.35 ± 6.99 a0.84 ± 0.08 a18.54 ± 0.95 a0.18 ± 0.09 a11.22 ± 0.79 a12.85 ± 0.81 ab23.07 ± 1.09 a12.42 ± 0.97 a11.28 ± 0.19 a10.73 ± 0.19 a45.59 ± 2.64 a
HD16.92 ± 3.78 b0.57 ± 0.04 b125.35 ± 19.66 ab407.53 ± 32.95 ab455.03 ± 82.43 b87.69 ± 14.19 ab24.22 ± 1.91 b219.01 ± 34.48 a204.79 ± 16.51 a19.45 ± 3.7 ab56.18 ± 8.98 a21.65 ± 4.82 b45.97 ± 9.08 b0.72 ± 0.08 ab11.35 ± 1.4 c0 ± 0 b6.17 ± 1.7 b11.65 ± 2.35 b18.42 ± 3.25 b9.95 ± 2.19 a9.88 ± 1.61 a10.12 ± 1.37 a27.94 ± 4.5 b
YCK19.48 ± 1.62 b0.65 ± 0.04 ab91.42 ± 2.4 c322.68 ± 8.63 c285.2 ± 15.89 c50.5 ± 1.1 c20.38 ± 1.03 c70.84 ± 8.55 b97.45 ± 5.49 b13.79 ± 0.39 c28.15 ± 1.48 b12.23 ± 0.47 c45.54 ± 1.04 b0.41 ± 0.01 c14.53 ± 0.27 b0 ± 0 b7.45 ± 0.2 b11.89 ± 0.06 b12.41 ± 0.61 c6.58 ± 0.19 b7.18 ± 0.18 b7.43 ± 0.17 b41.17 ± 5.34 a
YD25.11 ± 1.14 a0.76 ± 0.09 a102.09 ± 3.74 bc352.84 ± 22.77 bc391.56 ± 54.23 b69.12 ± 10.44 b21.45 ± 2.4 bc110.53 ± 25.66 b124.52 ± 20.37 b17.17 ± 2.33 bc40.98 ± 10.34 b18.01 ± 4.52 bc56.86 ± 10.62 b0.56 ± 0.18 bc18.48 ± 2.41 a0 ± 0 b7.43 ± 0.76 b15.12 ± 1.46 a17.1 ± 2.68 b10.05 ± 2.02 a11.05 ± 1.71 a10.81 ± 1.09 a41.5 ± 0.85 a
Mean22.100.67118.84380.53434.1876.8423.64151.05156.9518.4646.9921.3357.180.6315.730.058.0712.8817.759.759.859.7739.05
SD4.680.0929.3458.09128.7621.153.5867.9250.874.1215.388.7016.190.193.380.092.161.894.392.551.981.637.64
CV(%)21.1912.8424.6915.2729.6627.5215.1344.9632.4122.3432.7440.7828.3229.9221.50198.13 26.7414.6424.7326.1920.0716.6519.58
MS504.790.457714745.28146873.67201918.476257.28568.6426686.7626841.16353.152388.56515.033469.060.43256.330.008268.62167.72329.4999.4599.6497.411569.06
Peers with different lowercase letters indicate significant differences at the p < 0.05 level. His: Histidine; 4HLP: 4-Hydroxy-L-Proline; Arg: Arginine; Asn: Asparagine; Gln: Glutamine; Ser: Serine; Gly: Glycine; Asp: Aspartic acid; Glu: Glutamic acid; Thr: Threonine; Ala: Alanine; GABA: Gamma-Aminobutyric acid; Pro: Proline; D2A: D-2-Aminobutyric acid; Lys: Lysine; Cys: Cystine; Met: Methionine; Tyr: Tyrosine; Val: Valine; Ile: Isoleucine; Leu: Leucine; Phe: Phenylalanine; Trp: Tryptophan.
Table 3. Effects of drought stress on the content of long-chain fatty acids in broomcorn millet (µg/g, DW).
TreatmentC6:0C8:0C10:0C11:0C12:0C13:0C14:0C15:0C16:0C16:1C17:0C17:1C18:0C18:1n9tC18:1n9cC18:2n6cC20:0C20:1C18:3n3C21:0C20:2C22:0C22:1n9C23:0C22:2C24:0C24:1
HCK0.0001 ± 0 a0.00023 ± 0.00006 a0.00027 ± 0.00006 a0.00010 ± 0.000002 a0.0022 ± 0.0001 b0.0001 ± 0 a0.01387 ± 0.0006 b0.00383 ± 0.00025 b2.62653 ± 0.05089 a0.02543 ± 0.00042 b0.00623 ± 0.00035 a0.00433 ± 0.00006 a0.74153 ± 0.0299 a0.00333 ± 0.00006 a3.29387 ± 0.01375 a9.69 ± 0.03932 a0.0879 ± 0.00292 a0.0515 ± 0.0002 b0.17607 ± 0.00235 bc0.0047 ± 0.0002 a0.00653 ± 0.00035 ab0.0447 ± 0.00161 a0.1584 ± 0.01131 b0.00543 ± 0.00015 b0.00113 ± 0.00006 ab0.0217 ± 0.00056 a0.00103 ± 0.00006 a
HD0.00007 ± 0.00006 a0.0002 ± 0 a0.0002 ± 0 b0.00007 ± 0.000015 b0.00243 ± 0.00015 a0.0001 ± 0 a0.01527 ± 0.00075 a0.0044 ± 0.0002 a2.6963 ± 0.11583 a0.02533 ± 0.0006 b0.00613 ± 0.00035 a0.00423 ± 0.00021 a0.75173 ± 0.03069 a0.00327 ± 0.00006 a3.1148 ± 0.12231 ab9.7377 ± 0.29777 a0.0798 ± 0.00171 b0.06153 ± 0.00275 a0.19117 ± 0.00726 ab0.00503 ± 0.00025 a0.0067 ± 0.0003 a0.0421 ± 0.00155 a0.17933 ± 0.01171 a0.0062 ± 0.0002 a0.0013 ± 0.0001 a0.02063 ± 0.0006 a0.00113 ± 0.00006 a
HCK0.00003 ± 0.00006 b0.0002 ± 0 a0.0002 ± 0 b0.00011 ± 0.000002 c0.002 ± 0 b0.00003 ± 0.00006 b0.0121 ± 0.0002 c0.00193 ± 0.00006 c2.1879 ± 0.0619 b0.0282 ± 0.0005 a0.00543 ± 0.00006 b0.00413 ± 0.00015 a0.66367 ± 0.0183 b0.003 ± 0.0001 a2.8734 ± 0.10135 b8.77 ± 0.2488 b0.06613 ± 0.00185 c0.05007 ± 0.00215 b0.17287 ± 0.00675c0.0041 ± 0.0001 b0.0053 ± 0.0005 c0.03373 ± 0.00115 b0.14727 ± 0.0036 b0.0047 ± 0.0001 c0.00107 ± 0.00006 b0.0148 ± 0.0006 c0.00087 ± 0.00006 b
HD0 ± 0 b0.0002 ± 0 a0.0002 ± 0 b0.00003 ± 0.000003 c0.0021 ± 0.0001 b0 ± 0 b0.01327 ± 0.00081 bc0.00207 ± 0.00015 c2.2647 ± 0.09188 b0.02797 ± 0.00215 a0.0058 ± 0.00026 ab0.0042 ± 0.00026 a0.7171 ± 0.0401 ab0.0031 ± 0.00036 a2.87643 ± 0.19585 b8.85627 ± 0.38993 b0.0649 ± 0.00536 c0.05397 ± 0.00265 b0.19353 ± 0.01118 a0.00473 ± 0.0004 a0.00593 ± 0.00031 bc0.0362 ± 0.00361 b0.17757 ± 0.00305 a0.00517 ± 0.00025 b0.0013 ± 0.0001 a0.01743 ± 0.00197 b0.00103 ± 0.00006 a
Mean0.0001 0.0002 0.0002 0.0001 0.0022 0.0001 0.0136 0.0031 2.4439 0.0267 0.0059 0.0042 0.7185 0.0032 3.0396 9.2635 0.0747 0.0543 0.1834 0.0046 0.0061 0.0392 0.1656 0.0054 0.0012 0.0186 0.0010
SD3.9 × 10−52.13 × 10−52.38 × 10−53.05 × 10−50.0002 3.43 × 10−50.0013 0.0011 0.2413 0.0017 0.0004 0.0002 0.0442 0.0002 0.2135 0.5271 0.0104 0.0050 0.0114 0.0004 0.0007 0.0050 0.0158 0.0006 0.0001 0.0030 0.0001
CV(%)56.7717 9.8470 10.1683 50.1538 8.8026 45.5362 9.5474 37.1328 9.8755 6.3884 6.8631 3.9569 6.1476 6.6552 7.0231 5.6905 13.9513 9.1746 6.2362 9.0647 11.1081 12.6505 9.5213 10.7867 9.5092 16.1188 10.2804
MS9.05 × 10−91.28 × 10−71.58 × 10−77.42 × 10−91.25 × 10−51.08 × 10−80.0004821.79 × 10−515.594840.0023079.34 × 10−55.24 × 10−51.3984122.79 × 10−525.78318239.8430.0144160.0079780.0934935.51 × 10−59.38 × 10−50.003830.0709867.36 × 10−53.78 × 10−60.0007912.54 × 10−6
Peers with different lowercase letters indicate significant differences at the p < 0.05. C6:0: Methyl Hexanoate; C8:0: Methyl Octanoate; C10:0: Methyl Decanoate; C11:0: Methyl Undecenoate; C12:0: Methyl Laurate; C13:0: Methyl Tridecanoate; C14:0: Methyl Myristate; C15:0: Methyl Pentadecanoate: C16:0: Methyl Palmitate; C16:1: Methyl Palmitoleate; C17:0: Methyl Heptadecanoate; C17:1: Methyl Heptadecanoate; C18:0: Methyl Stearate; C18:1n9t: Methyl Elaidate; C18:1n9c: Methyl Oleate; C18:2n6c: Methyl Linoleate; C20:0: Methyl Arachidate; C20:1: Methyl 11-Eicosenoate; C18:3n3: Methyl Linolenate; C21:0: Methyl Heneicosanoate; C20:2: Methyl 11,14- Eicosenoate; C22:0: Methyl Behenate; C22:1n9: Methyl Erucate; C23:0: Methyl Tricosanoate; C22:2: Methyl Docosadienoate; C24:0: Methyl Ligncerate; C24:1: Methyl Nervonate.
Table 4. Effects of drought stress on anthocyanin content of broomcorn millet.
TreatmentPeonidin (ng/mL)Rutin (ng/mL)Luteolin (ng/mL)Quercetin (ng/mL)Isorhamnetin (ng/mL)Kaempferol (ng/mL)
HCK0.11 ± 0.004 d3.42 ± 0.157 d0.98 ± 0.081 b0.75 ± 0.038 b0.81 ± 0.048 b1.06 ± 0.036 b
HD0.63 ± 0.012 b3.87 ± 0.026 c1.31 ± 0.086 a1.13 ± 0.088 a1.18 ± 0.074 a1.59 ± 0.065 a
YCK0.69 ± 0.011 a5.69 ± 0.070 a0.91 ± 0.059 b0.68 ± 0.041 b0.48 ± 0.050 c0.58 ± 0.040 d
YD0.43 ± 0.035 c4.88 ± 0.275 b0.76 ± 0.053 c0.64 ± 0.046 b0.87 ± 0.062 b0.76 ± 0.029 c
Mean0.474.460.990.800.831.00
SD0.240.930.220.210.260.40
CV(%)50.6320.9021.8826.1431.6740.37
MS0.2720.681.020.680.761.14
Peers with different lowercase letters indicate significant differences at the p < 0.05.
Disclaimer/Publisher’s Note: The statements, opinions and data contained in all publications are solely those of the individual author(s) and contributor(s) and not of MDPI and/or the editor(s). MDPI and/or the editor(s) disclaim responsibility for any injury to people or property resulting from any ideas, methods, instructions or products referred to in the content.

