Article

Yield Responses to Total Water Input from Irrigation and Rainfall in Six Wheat Cultivars Under Different Climatic Zones in Egypt

by
Ahmed Fawzy Elkot
1,*,
Yasser Shabana
2,3,
Maha L. Elsayed
4,5,
Samir Mahmoud Saleh
4,
Maha A. M. Gadallah
1,
Bruce D. L. Fitt
5,
Benjamin Richard
6 and
Aiming Qi
5,*
1
Wheat Research Department, Field Crops Research Institute, Agricultural Research Center, Giza 12619, Egypt
2
Faculty of Agriculture, Mansoura University, Mansoura 35516, Egypt
3
National Council of Agricultural and Food Research, Academy of Scientific Research and Technology, Cairo 11516, Egypt
4
Central Laboratory for Agricultural Climate (CLAC), Agricultural Research Center, Giza 12411, Egypt
5
Centre for Agriculture, Food and Environmental Management Research, School of Life and Medical Sciences, University of Hertfordshire, Hatfield AL10 9AB, UK
6
Agroecology and Environment Research Unit, ISARA, 69007 Lyon, France
*
Authors to whom correspondence should be addressed.
Agronomy 2024, 14(12), 3057; https://doi.org/10.3390/agronomy14123057
Submission received: 18 November 2024 / Revised: 17 December 2024 / Accepted: 18 December 2024 / Published: 21 December 2024
(This article belongs to the Section Water Use and Irrigation)

Abstract

:
In Egypt, wheat is the most consumed cereal grain, and its availability and affordability are important for social stability. Irrigation plays a vital role in wheat cultivation, despite intense competition for water resources from the River Nile across various societal sectors. To explore how grain and above-ground biomass yields respond to total seasonal water input from sowing to maturity in six bread wheat cultivars, eight field irrigation experiments were performed at four locations representative of three agro-climatic zones in two consecutive cropping seasons. A three-replicate strip-plot design was used with cultivars nested within the main plots featuring five irrigation treatments, ranging from six to two applications. Overall, irrigation treatment significantly affected nine agronomic traits. Compared with the six irrigation applications treatment (T1), the two irrigation applications treatment (T5) decreased the times to heading and maturity by 6.6 (7.3%) and 8.6 (6.3%) days, respectively. Similarly, T5 reduced the plant height by 14.9 cm (14.3%), flag leaf area by 12.0 cm2 (27.2%), number of spikes per square metre by 77.7 (20.1%), number of kernels per spike by 13.9 (25.2%) and thousand grain weight by 10.0 g (19.6%). T5 also decreased the overall mean grain yield and above-ground biomass yield by 2834.9 (32.0%) and 7910.4 (32.86%) kg/ha, respectively. The grain yield and above-ground biomass production were consistently greater for all six cultivars at Al Mataenah and Sids than at Nubaria and Ismailia in the two cropping seasons. All six cultivars showed significantly greater responses to total seasonal water input for the grain yield and above-ground biomass at Al Mataenah and Ismailia. These results emphasise the necessity for choosing regions with favourable soil and climatic conditions to grow wheat cultivars that respond better to irrigation to enhance the large-scale production of wheat in Egypt. The grain and above-ground biomass yields were mostly linearly and positively associated with the total seasonal water input for all six cultivars at all four locations. This suggests that maintaining the current irrigation schedule of six irrigations is valid and should be practised to maximise productivity, particularly in areas similar to the three representative agro-climatic zones in Egypt.

1. Introduction

Wheat (Triticum aestivum L.) is one of the most vital cereal crops worldwide [1]. Wheat bread is the most important staple food in Egypt. Indeed, Egypt is the world’s largest wheat-importing country to fill the deficit of more than 50% in consumption left by domestic wheat production [2]. In 2022, 1.43 million hectares of land in Egypt were used for growing wheat, producing a total yield of 9.7 million tonnes. This wheat area accounted for 35.6% and 46.7% of the total agricultural land and arable land areas, respectively (https://www.fao.org/faostat, accessed on 25 July 2024). Wheat yield and production are limited by many biotic and abiotic factors. They include weeds, pests, diseases, supra-optimal temperatures and soil water stress. However, availability of water is the single most important factor that can determine not only the total wheat yield but also whether the crop can yield at all in Egypt. The River Nile is the main freshwater source for all sectors of Egyptian society. The agricultural sector is the largest water consumer. Optimising irrigation in wheat production is necessary for sustainable water management and for satisfying the developmental needs of other sectors [3]. Optimal and efficient use of irrigation water to maximise wheat productivity is always a research priority in Egypt [4,5].
Egypt is mostly in the subtropical area, but the southern part is tropical. In general, it has an arid to semi-arid desertic climate and is located in the driest region of the Middle East and North Africa. Thus, water shortage is a constant challenge in Egypt due to the lack of sufficient rain, with rainfall contributing about 1.2% of annual water resources [6]. For instance, in many southern desert areas, it may rain once in many years. Typically, the annual average rainfall across the country ranges from 20 to 200 mm and decreases gradually from Lower (north) to Upper (south) Egypt [7]. Therefore, the Egyptian water supply is very dependent on the Nile River, which provides c. 97% of Egyptian water needs, while the remaining 3% comes from other sources such as rainfall and fossil groundwater. Since the annual supply is limited to 55.5 billion cubic metres (m3) from the Nile River, this is not enough to meet the water demands of all economic activities [8]. As the agricultural sector consumes >80% of the national water supply, water management is critical to rationalise and optimise the use of irrigation water through maximising crop productivity and water-use efficiency [9].
Due to the hot dry summers and mild winters in Egypt, the wheat cropping season normally starts from sowing the crop in November/December and finishes with harvesting the crop in April/May the next year [10,11]. Wheat crop production is with spring wheat cultivars and primarily concentrated in the agricultural lands in the Nile Delta. Rainfall occurs during the winter as scattered showers, which are irregular and unpredictable. This erratic source of water contributes little to the wheat crop evapotranspiration required for stable, high grain yields. By contrast with basin irrigation which made use of the annual flooding of the Nile River in ancient times, after construction of the Aswan High Dam in 1964, controlled water flow in the river is now used to irrigate the wheat crop [12]. It is necessary to make the dependence on the Nile River for water more sustainable and to continue to enhance the efficiency of water use in irrigation for wheat production. However, producing enough food to feed Egypt’s large, rapidly growing population remains a challenge, especially in the face of climate change [13,14,15,16,17].
In Egypt, food production is concentrated in three important agro-climate zones, based on mean annual temperature and potential reference evapotranspiration (ETo) [18,19]. They are Lower Egypt (the Nile Delta) in the north (30–31° N), Middle Egypt (28–30° N) and Upper Egypt in the south (24–28° N) [20]. The Nile Delta includes c. 50% of Egyptian agricultural lands while Middle and Upper Egypt account for the other 50% [21]. Most wheat cultivation area is in the Nile Delta region, followed by Middle Egypt and the smallest wheat cultivation area is in Upper Egypt. Under all climate change scenarios, the temperature is projected to increase and, in consequence, potential evapotranspiration will increase in all agro-climate zones [20,22,23,24,25]. The construction of the Grand Ethiopian Renaissance Dam on the Blue Nile tributary in Ethiopia’s northern–western highlands will probably decrease the supply of water to Egypt from the Nile River. It is estimated that a 2% reduction in water from the Nile River could result in a loss of about 81,000 ha of irrigated land. These changes will put more emphasis on sustainable water management and the introduction of water-saving irrigation techniques in crop production [26,27,28,29,30,31].
In principle, different bread wheat cultivars have different responses to reducing the number of irrigation applications and yield decreases with decreasing number of irrigations. However, several cultivars (e.g., Sids 1 and Sids 14) performed better for yield and other traits with one less irrigation than the current six irrigation applications. In our field experiments, Sids 14 performed well under soil salinity conditions (unpublished data). Furthermore, cultivars Sakha 95, Sids 1 and Sids 14 were taller and had more kernels per spike, a higher seed index and greater grain yield under reduced irrigations and showed the best drought tolerance index. Flood irrigation is currently the most popular irrigation method in old lands while drip and sprinkler irrigation are preferred methods on new lands in Egypt. In large-scale wheat fields, a pivot irrigation system with fertigation is the most efficient irrigation method for the new lands.
This study aimed to determine the effects of decreasing the total water input by reducing the number of irrigation applications on the grain yield and other agronomic traits for six wheat cultivars. It sought to quantify their responses in the grain and above-ground biomass yields to the total seasonal water input and to provide guidelines for soil and climatic conditions and suitable cultivars for large-scale irrigated wheat production in Egypt.

2. Materials and Methods

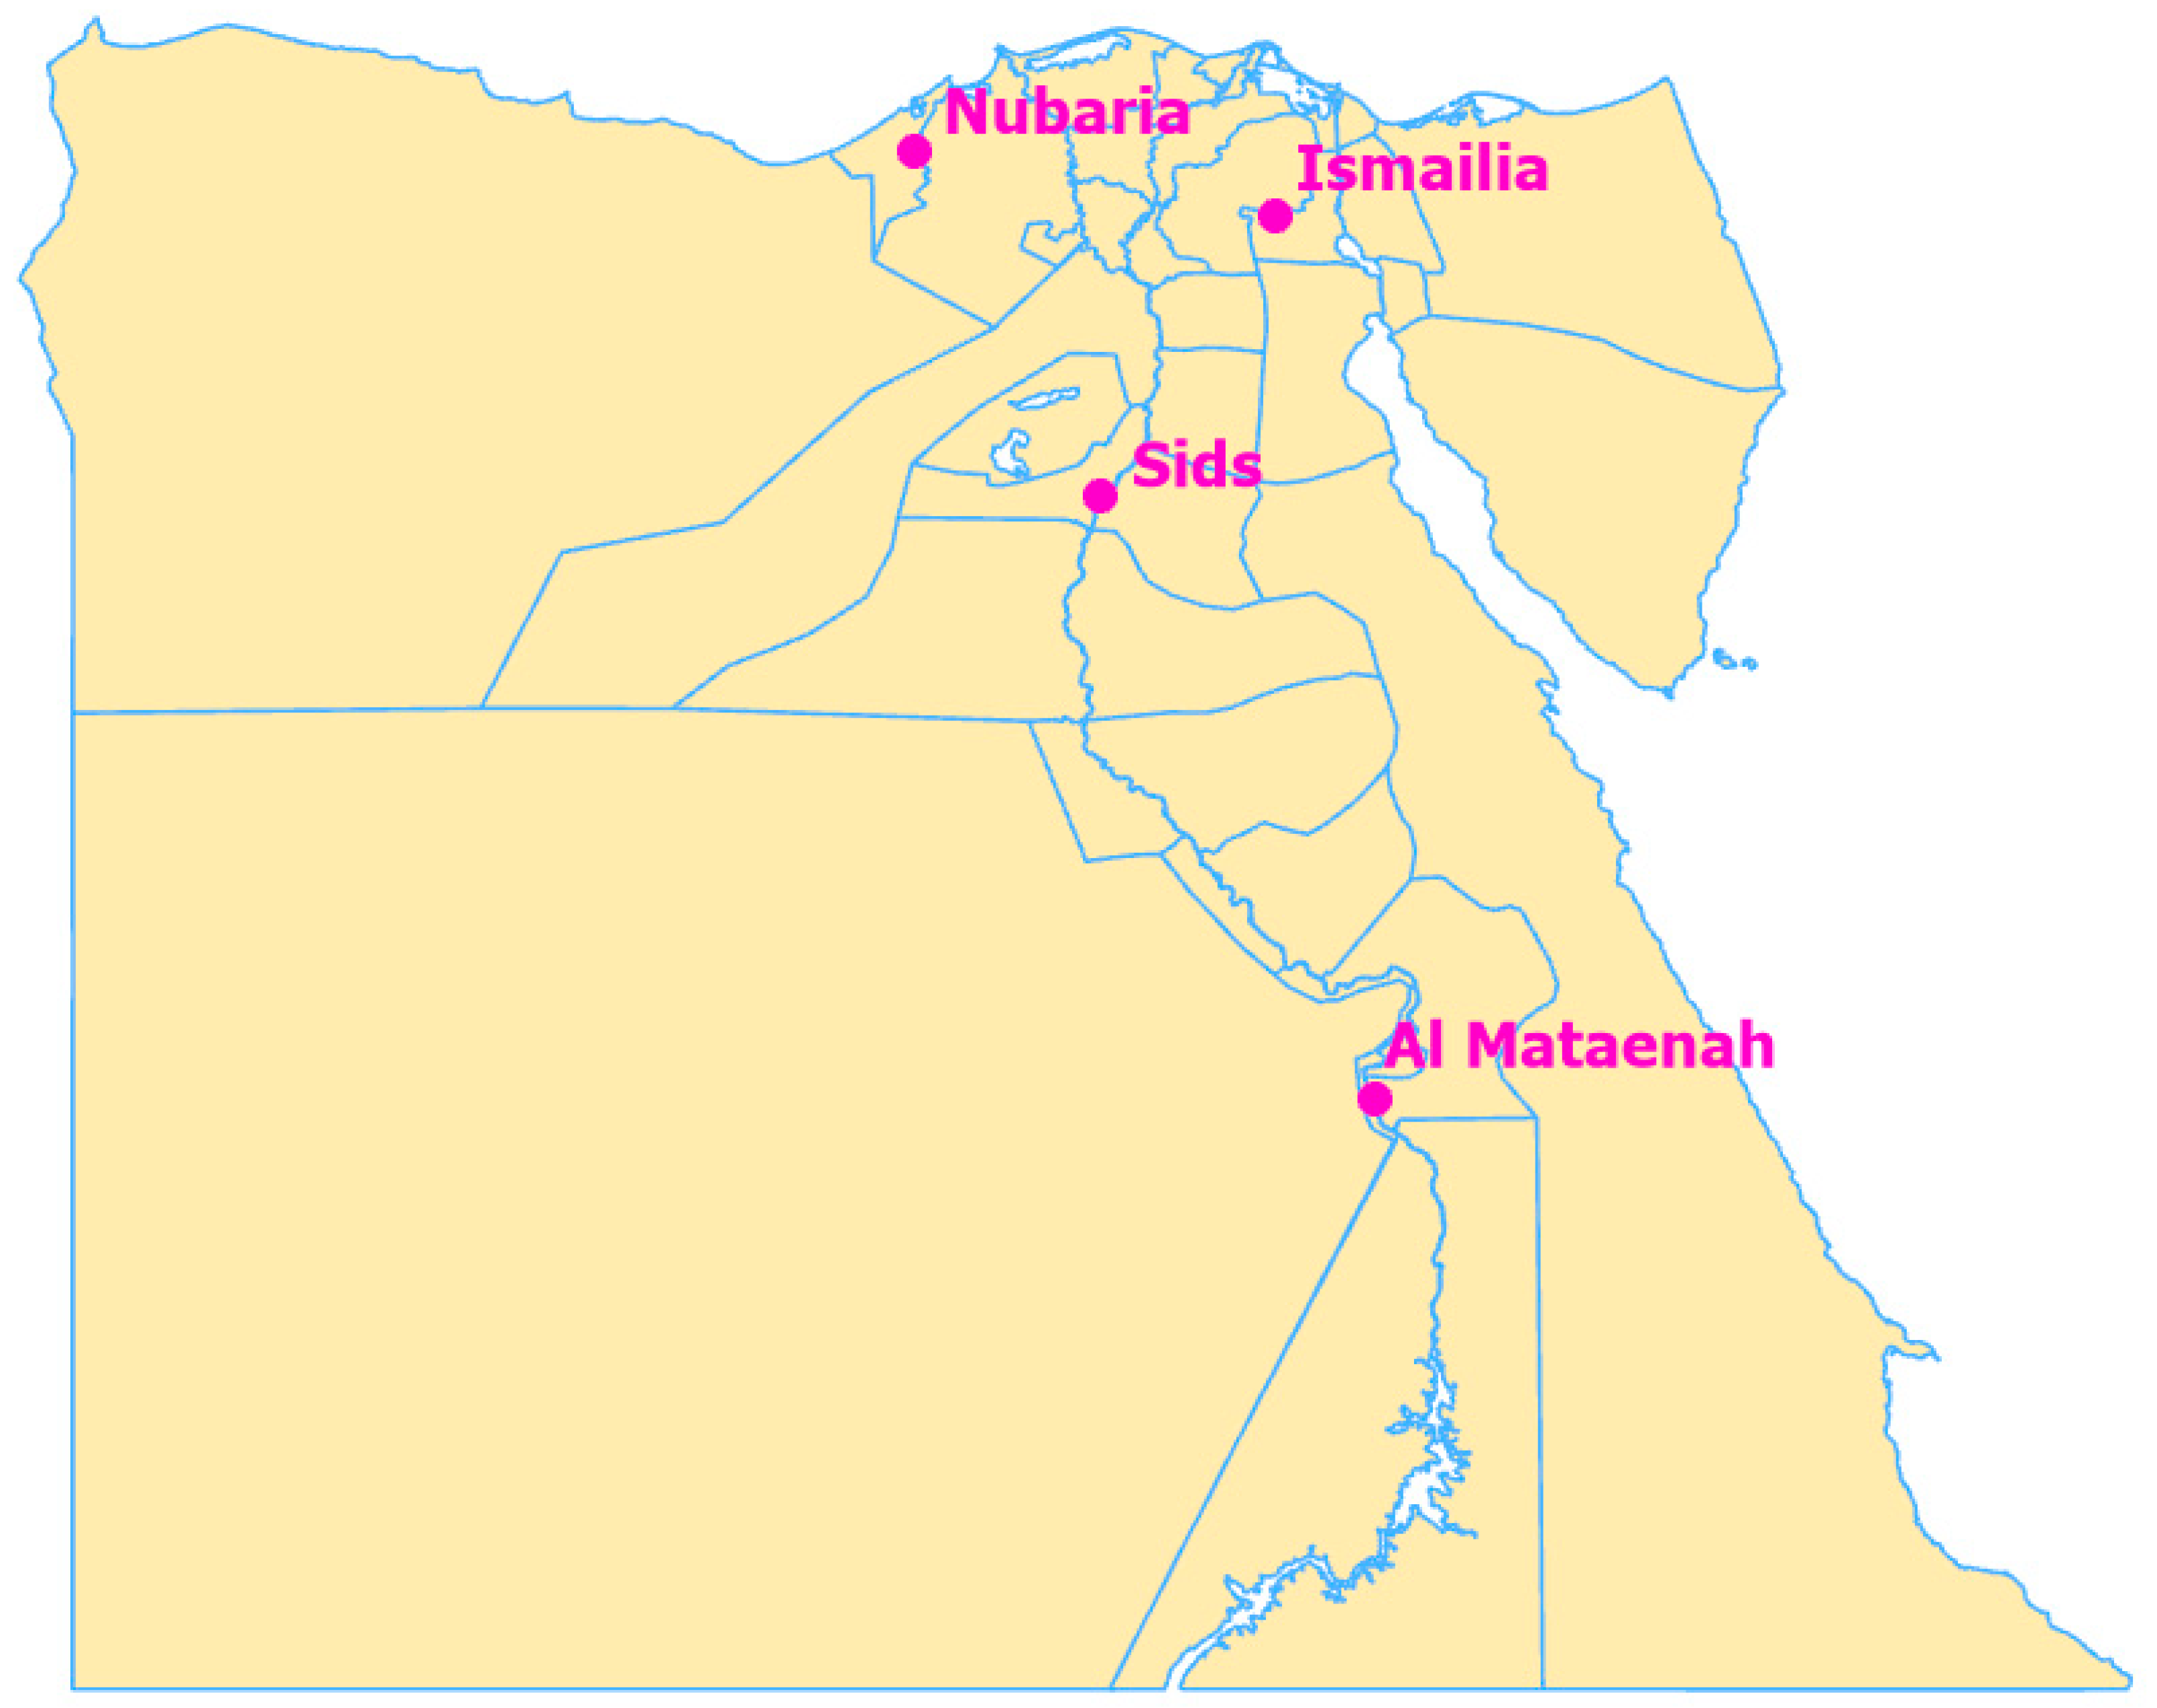
2.1. Study Sites, Experimental Set-Up, Cultivars and Measurements of Agronomic/Morphological Traits

Eight experiments were performed in a strip-plot design with a randomised complete block design with three replications at four locations in two consecutive cropping seasons in Egypt (Table 1, Figure 1). These experiments were performed by Sids Agricultural Research Station in Bani Suef governorate (about 150 km south of Cairo), which is characterised by high-yielding growing conditions; Nubaria Agricultural Research Station in Al-Behera governorate in the west Nile Delta to represent the newly reclaimed lands under surface irrigation; Ismailia Agricultural Research Station in Al-Ismailia governorate in the east Nile Delta; and Al Mataenah Agricultural Research Station in Luxor governorate, which is characterised by high-yielding soil and climatic conditions. Nubaria and Ismailia sites represent the agro-climate zone in the Nile Delta in the north, Sids represents the agro-climate zone in Middle Egypt and Al Mataenah represents the agro-climate zone in Upper Egypt in the south. This agro-climate zone is characterised by hot temperature, high solar radiation, dry atmosphere and rare rains [21].
At each site, six bread wheat cultivars were grown (Table 2) under five irrigation treatments with pre-determined irrigation timings (Table 3). The six wheat cultivars were selected to represent different genetic backgrounds. Sids 1 is a bread wheat cultivar with high tillering capacity and good tolerance to different abiotic stresses. Sakha 95 and Sids 14, respectively, accounted for c. 18.5% and 15% of the total wheat cultivated area in Egypt in the 2023–2024 cropping season. The five irrigation treatments were coded as T1 (six irrigation times), T2 (five irrigation times), T3 (four irrigation times), T4 (three irrigation times) and T5 (two irrigation times). The six-irrigation times treatment (T1) is the recommended irrigation schedule in practice for Egyptian wheat production. Each successive reduction cut-off from six to two irrigation times resulted in no additional water being applied afterwards. The main plots were the number of irrigation times, and the six cultivars (sub-plots) were randomly assigned to each of the five irrigation treatments. The border width between the main irrigation plots was 12 metres (m) to avoid effects due to the potential above- and below-ground water movement from one plot to another. At Nubaria and Sids, experiments were performed in 2019/2020 and 2020/2021, while at Ismailia and Al Mataenah, they were performed in 2020/2021 and 2021/2022 (Table 2). Wheat seeds were planted at a rate of 50 g per sub-plot (3.5 × 1.2 m with six rows of wheat 0.2 m apart). Thus, the plot area was 4.2 m2. However, the harvested plot area was 3.5 × 0.8 m (i.e., 2.8 m2) with the inner four rows of wheat at the end of the experiment used to determine the above-ground dry biomass yield and grain yields adjusted to 14% moisture content. In all experiments, recommended agronomic practices (e.g., control of weeds, pests and diseases) were applied to the crop. Surface (i.e., flooding) irrigation was used at all four locations. Phosphorus fertiliser was applied at 35 kg P ha−1, while nitrogen fertiliser was applied at 180 kg N ha−1 split between the sowing time and the tillering stage.

2.2. Measurements of Agronomic and Morphological Traits

As well as the above-ground biomass yield and grain yield, seven other morphological and yield component traits were measured in each experiment. These included days from sowing to heading date (DH), which was recorded when the spike emerged for a quarter of its length in 50% of the plants at developmental stage Zadoks DGS 53 [32], days from sowing to maturity date (DM), plant height (cm) (PH) measured from the soil surface to spike top, flag leaf area (cm2) measured with an LAM-A Portable Leaf Area Meter (Biobase, Nanjing, Jiangsu, China), number of spikes per square metre (NS m−2), number of kernels per spike (NK S−1) and one thousand grain weight (1000 GWT) (g).

2.3. Daily Weather Records

Daily weather records from 1 November in the sowing year to 31 May the following year of the mean, maximum and minimum air temperature (°C), rainfall (mm), global radiation (MJ m−2), relative humidity (%) and wind speed (m s−1) were obtained from the nearby weather stations at each experimental site by the Central Laboratory for Agricultural Climate (CLAC) at the Agricultural Research Centre (ARC) and are shown in Supplementary Figures S1–S5. The daily potential reference evapotranspiration (ET0, mm) was calculated using the method developed by Hargreaves [33]. The equation to calculate ET0 is as follows: ET0 = 0.0135 × Rs × (Tave + 17.8), where Rs is the daily global solar radiation in equivalent water evaporation (i.e., mm per day) and Tave is the daily mean air temperature (°C).

2.4. Data Analysis

2.4.1. Analysis of Variance for Agronomic and Morphologic Traits

Analysis of variance (ANOVA) was performed at each location to determine the effects of irrigation treatment, cultivar, cropping season and their interactions on nine agronomic/morphologic traits. The grain yield and above-ground dry biomass yield were based on measurements per harvested experimental plot area when ANOVA was performed.

2.4.2. Determination of Relationships Between Grain/Above-Ground Biomass Yield and Total Seasonal Water Input

Regressions were performed to determine the relationships describing the responses of the grain yield and above-ground biomass yield to the total seasonal water input. The total seasonal water input included all applied irrigation and the rainfall from sowing to maturity dates. Determination of relationships describing the responses of the yield to the total water input used the grain yield and biomass yield scaled up from kg per harvested plot area to kg per hectare. Firstly, a simple linear relation was fitted to describe the response of the grain yield or biomass yield to the total seasonal water input. Then, a quadratic term was added in addition to the linear relationship to test whether it significantly reduced the residual variance using the F-test at a probability threshold of p ≤ 0.10, rather than p = 0.05 or p = 0.01. This was performed to determine whether the yield response curve deviated from being a straight line at this 10% probability level. For those cultivars for which only the linear relationship was sufficient, analyses of position (i.e., intercept) and parallelism (i.e., slope) were performed to investigate whether the relationships of the grain yield and biomass yield with the total water input were affected by the experiment location.

2.4.3. Grain Yield Stability Analysis

Following Eberhart and Russell [34], the grain yield stability parameters were calculated for six cultivars using the following regression model:
Yij = µi + βiIj + δij
where Yij is the mean grain yield of the ith cultivar at the jth environment, µi is the mean grain yield of the ith cultivar over all environments, βi is the regression coefficient that measures the response of the ith cultivar to varying environments measured as environmental indexes, Ij is the environmental index obtained as the mean grain yield of all six cultivars in the jth environment minus the overall mean grain yield of all cultivars over all environments and δij is the residual square deviation from the regression line of the ith cultivar in the jth environment. In this study, each irrigation treatment was considered to be a separate environment under which each cultivar was grown. Thus, there were forty environments for each cultivar at four locations over two cropping seasons.
Regression coefficients and regression residual mean squares for each cultivar were taken as measures of the grain yield response to increasing the environmental index and the specificity of stability, respectively. The stability of a cultivar can be defined by jointly considering its mean grain yield over all irrigation environments and its regression coefficient (βi) [34,35]. When the overall yield of a cultivar is large and its regression coefficient is unity (i.e., βi = 1), its stability is average, and it is well suited to all irrigation levels at all four locations. However, when its overall yield is small and its stability is average, it is poorly suited to all irrigation levels. When the overall yield of a cultivar is large and its regression coefficient is greater than unity (i.e., βi > 1), its stability is below average and it is specifically suited to large irrigation amounts at all four locations. When its overall yield is large and its regression coefficient is less than unity (i.e., βi < 1), its stability is above average and it is specifically suited to relatively small irrigation amounts. All ANOVA and regressions were performed using Genstat 24, a statistical software (https://vsni.co.uk/software/genstat, accessed on 1 September 2024).

3. Results

3.1. Aggregated Weather and Total Seasonal Water Input in Each Irrigation Treatment

Weather records during the growing seasons are shown in Table 4. The mean maximum air temperature from sowing to the end of May the following year was greatest at Al Mataenah and smallest at Nubaria in the two cropping seasons (Table 4). For the mean minimum air temperature, there were only small differences between the four sites. Nubaria received the largest total rainfall from sowing to the end of May the next year (264.1, 288.0 mm) but Al Mataenah received negligible amounts of total rainfall (0.8, 5.6 mm) in the two cropping seasons (Table 4). The air was the driest at Al Mataenah (30.8, 33.8% r.h.) but contained most moisture (68.8, 65.7% r.h.) at Nubaria. The accumulated potential evapotranspiration from 1 November to 31 May the next year was greatest (916.4) at Al Mataenah in the 2020/2022 cropping season. Nubaria and Ismailia had relatively lower temperatures, smaller reference potential evapotranspiration, more rainfall and more humid atmosphere in the two cropping seasons. The experimental site of Al Mataenah had the highest temperatures, driest atmosphere, least rainfall and greatest reference potential evapotranspiration in the two cropping seasons.
The total amounts of irrigation for the five irrigation treatments are shown in Table 5. The total amount of irrigation decreased from six to two irrigation times. Among the eight treatments with six irrigation applications (i.e., T1), the largest irrigation amount was 640 mm at Sids in the 2021/2022 cropping season. In contrast, of the eight treatments with two irrigation applications (i.e., T5), the smallest irrigation amount was 184 mm at Nubaria in the 2019/2020 cropping season. The total seasonal water inputs were obtained by adding the accumulated rainfall from sowing to maturity date to the total amount of irrigation under each irrigation treatment (Table 5). These were the total water inputs with which the response relationships of the grain yield and above-ground biomass yield were analysed. After adding the accumulated rainfall to the treatment with six irrigation applications, the largest total water input was 838.1 mm at Nubaria in 2020/2021. Conversely, of the two irrigation applications treatments, the smallest total water input was 214.8 mm at Al Mataenah in 2021/2022. Although the total rainfall was smallest at Al Mataenah and intermediate at Sids, the grain yields were much greater at Al Mataenah and Sids than at Nubaria and Ismailia. This was because Sids Agricultural Research station has high-yielding conditions in the Nile Valley, while Al Mataenah Agricultural Research station has high-yielding conditions in Upper Egypt.

3.2. Effect of Cropping Season, Irrigation Times and Cultivar on Agronomic/Morphological Traits

The Nubaria location represents the newly reclaimed lands. The soil texture type was sandy or loamy sand at Ismailia and Nubaria, while it was clay or clay loam at Sids and Al Mataenah. At Al Mataenah and Sids, all six wheat cultivars showed consistently greater grain yield (Table 6) and above-ground biomass yield than at Nubaria and Ismailia. Thus, analysis of variance was performed at each location to test the effects of the cropping season (Season), irrigation times (Irrigation), cultivar and their respective two-way and three-way interactions. The results of significance tests for the nine observed agronomic and morphological traits are shown in Supplementary Tables S1–S4 at Nubaria, Al Mataenah, Sids and Ismailia, respectively.

3.2.1. Days to Heading and Maturity

Differences between cropping seasons resulted in different heading dates and thus led to different maturity dates at all four sites (Supplementary Tables S1-2a, S1-2b, S1-2c and S1-2d). Overall, the days from sowing to both the heading and maturity dates were significantly reduced by decreasing the irrigation times. Cultivars differed significantly in both heading and maturity dates at Nubaria, Al Mataenah and Ismailia but did not differ at Sids. There were significant two-way and three-way interactions among the cropping season, irrigation treatment and cultivar. These interactions were more of magnitude rather than changes in direction for the effects caused by different irrigation times. Regression analysis showed significant correlations (p < 0.01) for the six cultivars between days to heading/days to maturity and the total seasonal water input (Table 7) over the four locations. Compared with the six irrigation applications (T1) in the two cropping seasons, the two irrigation applications (T5) advanced the heading date by 2.7, 9.3, 8.8 and 5.6 days and maturity date by 2.9, 18.4, 1.0 and 12.1 days at Nubaria, Al Mataenah, Sids and Ismailia, respectively.

3.2.2. Plant Height (cm)

Overall, plants were significantly taller in one of the two cropping seasons at all four sites (Supplementary Tables S3a–d). The plant height decreased with the reduced irrigation times and the shortest plant height was with the fewest irrigation times (i.e., T5). Cultivars differed significantly in plant height at Nubaria and Ismailia but did not differ at Al Mataenah and Sids. For those significant interactions involving irrigation treatment, these interactions were of magnitude rather than change in direction for the effects caused by different irrigation times. Regression analysis showed significant correlations (p < 0.01) for the six cultivars between the plant height and total seasonal water input (Table 7) over the four locations. Compared with the six irrigation applications (T1) in the two cropping seasons, the two irrigation applications (T5) reduced the plant height by 11.1, 17.7, 11.1 and 5.7 cm at Nubaria, Al Mataenah, Sids and Ismailia, respectively.

3.2.3. Flag Leaf Area (cm2)

Overall, the flag leaf area was significantly larger in one of the two cropping seasons at all four sites (Supplementary Tables S4a–d). The flag leaf area was significantly reduced with fewer irrigation applications, such as three (T4) or two irrigation times (T5). Overall, the flag leaf area differed significantly between cultivars. When the interaction between the irrigation times and cultivar was significant, the effect of the irrigation times was not only of magnitude but also changed the direction. For example, for cultivar Sid 1, the flag leaf area was 54.9 cm2 with four irrigation applications (T3) but was 63.8 cm2 with two irrigation applications (T5) in the 2019/2020 cropping season. Regression analysis showed significant correlations (p < 0.01) for the six cultivars between the flag leaf area and total seasonal water input (Table 7) over the four locations. Compared with the six irrigation applications (T1) in the two cropping seasons, the two irrigation applications (T5) reduced the flag leaf area by 5.6, 24.7, 9.5 and 8.21 cm2 at Nubaria, Al Mataenah, Sids and Ismailia, respectively.

3.2.4. Spikes per Square Metre

Overall, the number of spikes per square metre was significantly affected by the cropping season at Nubaria and Sids but not at Al Mataenah and Ismailia (Supplementary Tables S5a–d). Overall, the number of spikes per square metre decreased with fewer irrigation times at all four locations. However, the effect of the irrigation times depended on the cropping season at Nubaria and Sids but was independent of the cropping season at Al Mataenah and Ismaila. Overall, the six cultivars significantly differed in the number of spikes per square metre at Nubaria, Al Mataenah and Ismailia but not at Sids. The two-way interactions between the cultivar and irrigation times were significant at Nubaria and Ismailia but were not at Al Mataenah and Sids. Regression analysis did not show a significant correlation for any of the six cultivars between the number of spikes per m2 and total seasonal water input (Table 7) over the four locations. Nevertheless, the two irrigation applications (T5) decreased the number of spikes per m2 by 87.8, 56.4, 87.8 and 151.1 at Nubaria, Al Mataenah, Sids and Ismailia, respectively, compared with the six irrigation applications (T1) in the two cropping seasons.

3.2.5. Number of Kernels per Spike

Overall, the number of kernels per spike was significantly affected by the cropping season at Nubaria, Sids and Ismailia but not at Al Mataenah (Supplementary Tables S6a–d). The number of kernels per spike was significantly reduced with the fewest irrigation times (i.e., T5) at Al Mataenah, Sids and Ismailia but not at Nubaria. The six cultivars differed significantly in the number of kernels per spike at Nubaria, Al Mataenah and Ismailia but not at Sids. The effects of the two-way interactions between the irrigation times and cultivar were significant at Nubaria, Al Mataenah and Ismailia but not at Sids. Regression analysis showed significant correlations (p < 0.05) for all the cultivars except Sakha 95 between the number of kernels per spike and total seasonal water input (Table 7) over the four locations. Compared with the six irrigation applications (T1) in the two cropping seasons, the two irrigation applications (T5) reduced the number of kernels per spike by 0.5, 27.7, 10.0 and 17.5 at Nubaria, Al Mataenah, Sids and Ismailia, respectively.

3.2.6. Thousand Grain Weight (1000 GWT, g)

Overall, the 1000 GWT was significantly greater in one of the two cropping seasons at Al Mataenah and Ismailia but was not significantly different between the two cropping seasons at Nubaria and Sids (Supplementary Tables S7a–d). In general, the 1000 GWT decreased significantly with fewer irrigation times at Nubaria, Al Mataenah and Ismailia but the five different irrigation treatments did not differ significantly in the 1000 GWT at Sids. Overall, the six cultivars differed significantly in the 1000 GWT at Nubaria, Al Mataenah and Ismailia but not at Sids. The two-way interaction between the irrigation times and cultivar was significant only at Ismailia but not at the three other locations (Nubaria, Al Mataenah and Sids). Regression analysis showed significant (p < 0.01) correlations for the six cultivars between the 1000 GWT and total seasonal water input (Table 7) over the four locations. Compared with the six irrigation applications (T1) in the two cropping seasons, the two irrigation applications (T5) reduced the 1000 GWT by 2.1, 22.3, 2.0 and 13.6 g at Nubaria, Al Mataenah, Sids and Ismailia, respectively.

3.2.7. Grain Yield per Harvested Plot Area (kg/2.8 m2)

Overall, the plot grain yield (kg) was significantly greater in one of the two cropping seasons at Nubaria and Ismailia but was not significantly different between the two cropping seasons at Al Mataenah and Sids (Supplementary Tables S8a–d). The main effect of the cultivar was significant at Nubaria, Al Mataenah and Ismailia but not at Sids. Overall, the plot grain yield was greatest in the treatment with six irrigation applications (T1) and smallest in the treatment with two irrigation applications (T5) at all four sites. Regression analysis showed significant correlations (p < 0.05) between the harvested plot grain yield and total seasonal water input for all the cultivars except Sids 1 (Table 7) over the four locations. Compared with T1 in the two cropping seasons, T5 decreased per harvested plot grain yield by 14.2, 40.8, 24.9 and 47.9% at Nubaria, Al Mataenah, Sids and Ismailia, respectively.

3.2.8. Above-Ground Biomass Yield per Harvested Plot Area (kg/2.8 m2)

Overall, the above-ground biomass production per harvested plot area (kg) was significantly larger in one of the two cropping seasons at Nubaria and Ismailia but was not statistically different between the two cropping seasons at Al Mataenah and Sids (Supplementary Tables S9a–d). The main effect of the cultivar was significant at Nubaria and Ismailia but not at Al Mataenah and Sids. Overall, the above-ground biomass yield was greatest in the treatment with six irrigation applications (i.e., T1) and smallest in the treatment with two irrigation applications (i.e., T5) at all four sites. Regression analysis showed significant correlations (p < 0.05) between the harvested plot above-ground biomass yield and total seasonal water input for all cultivars except Sids 1 (Table 7) over the four locations. Compared with T1 in the two cropping seasons, T5 decreased per plot harvested biomass yield by 7.6, 38.6, 20.1 and 62.2% at Nubaria, Al Mataenah, Sids and Ismailia, respectively.

3.2.9. Correlation of Grain Yield with Other Agronomic and Morphological Traits

The simple linear correlation coefficients of the grain yield against eight agronomic or morphological traits for the six cultivars are presented in Table 8. The grain yield was weakly correlated with the days from sowing to the heading date and maturity date for these six cultivars except Gemmiza 12 for which the grain yield was positively correlated with the days from sowing to maturity (p < 0.05). However, the grain yield was strongly correlated (p < 0.01) with the plant height, flag leaf area, number of spikes per square metre, number of kernels per spike, 1000 GWT and above-ground biomass productivity for all six cultivars except Gemmiza 12 for which the grain yield was weakly correlated with the flag leaf area and 1000 GWT. Gemmiza12 was shown to be a wheat cultivar that was very sensitive to irrigation application. The grain yield also showed a positive but weak correlation with the flag leaf area for Sakha 94, Shandaweel 1, Sids 1 and Sids 14.

3.3. Grain Yield Response to Total Water Input

Firstly, the grain yield in kg per plot was scaled up from the harvested plot area at 2.8 m2 to a per hectare area of 10,000 m2 (ha) for each cultivar under each irrigation treatment at each location in each cropping season. Then, the responses of the grain yield to the total seasonal water input between the sowing and maturity date were analysed using regression procedures in Genstat 24.
There were mostly positive linear relationships between the grain yield and the total seasonal water input for all six cultivars at all four locations. At Nubaria, there were no significant reductions in the residual variance by including the quadratic term to describe the relationships between the grain yield and total seasonal water input for Gemmiza 12 (p > 0.71), Sakha 94 (p > 0.84), Sakha 95 (p > 0.97), Shandaweel 1 (p > 0.50), Sids 1 (p > 0.97) and Sids 14 (p > 0.29). At Al Mataenah, there were also no significant reductions in the residual variance by including the quadratic term to describe the relationships between the grain yield and total seasonal water input for Gemmiza 12 (p > 0.88), Sakha 94 (p > 0.38), Sakha 95 (p > 0.71), Shandaweel 1 (p > 0.91), Sids 1 (p > 0.43) and Sids 14 (p > 0.81). At Ismailia, there were again no significant reductions in the residual variance by including the quadratic term to describe the relationships between the grain yield and total seasonal water input for Gemmiza 12 (p > 0.79), Sakha 94 (p > 0.79), Sakha 95 (p > 0.58), Shandaweel 1 (p > 0.33), Sids 1 (p > 0.74) and Sids 14 (p > 0.66). At Sids, there were no significant reductions in the residual variance by including the quadratic term to describe the relationships between the grain yield and total seasonal water input for Sakha 94 (p > 0.57), Sakha 95 (p > 0.94), Shandaweel 1 (p > 0.21) and Sids 14 (p > 0.13). However, the additional quadratic term significantly reduced the residual variance for Gemmiza 12 (p < 0.02) and Sids 1 (p < 0.08). Therefore, simple linear relationships between the grain yield and total seasonal water input were chosen and fitted for all six cultivars at Nubaria, Al Mataenah and Ismailia but only for four cultivars (Sakha 94, Sakha 95, Shandaweel 1 and Sids 14) at Sids (Table 9). The significant probabilities for the selected and estimated relationships between the grain yield and the total seasonal water input are given in Table 9 for each cultivar.
The best fitted lines for each cultivar at each location are shown in Figure 2. For the best fitted quadratic equation for Gemmiza 12 and Sids 1 at Sids, the probable optimal total water input to achieve the apparent greatest grain yield can be calculated. The optimal total water input at Sids was estimated at 562.2 and 545.7 mm for Gemmiza 12 and Sids 1, respectively. Comparisons of the intercept and slope of the best fitted linear equations showed significant differences between locations for a given cultivar (p < 0.01). Thus, the response of the grain yield to the total seasonal water input varied between locations within a cultivar. For example, Gemmiza 12 not only had a greater grain yield with a smaller total seasonal water input but also had larger increases in the grain yield with increasing water input at Al Mataenah than at Nubaria. However, it had greater grain yields with smaller total seasonal water inputs but had similar grain yield increases with increasing water input at Al Mataenah compared with Ismailia. Shandaweel 1 shared both similar grain yields with the same total water input and similar increases in the grain yield with increasing water input at Al Mataenah and Sids but had a significantly greater grain yield and larger increases in the grain yield than at Nubaria.

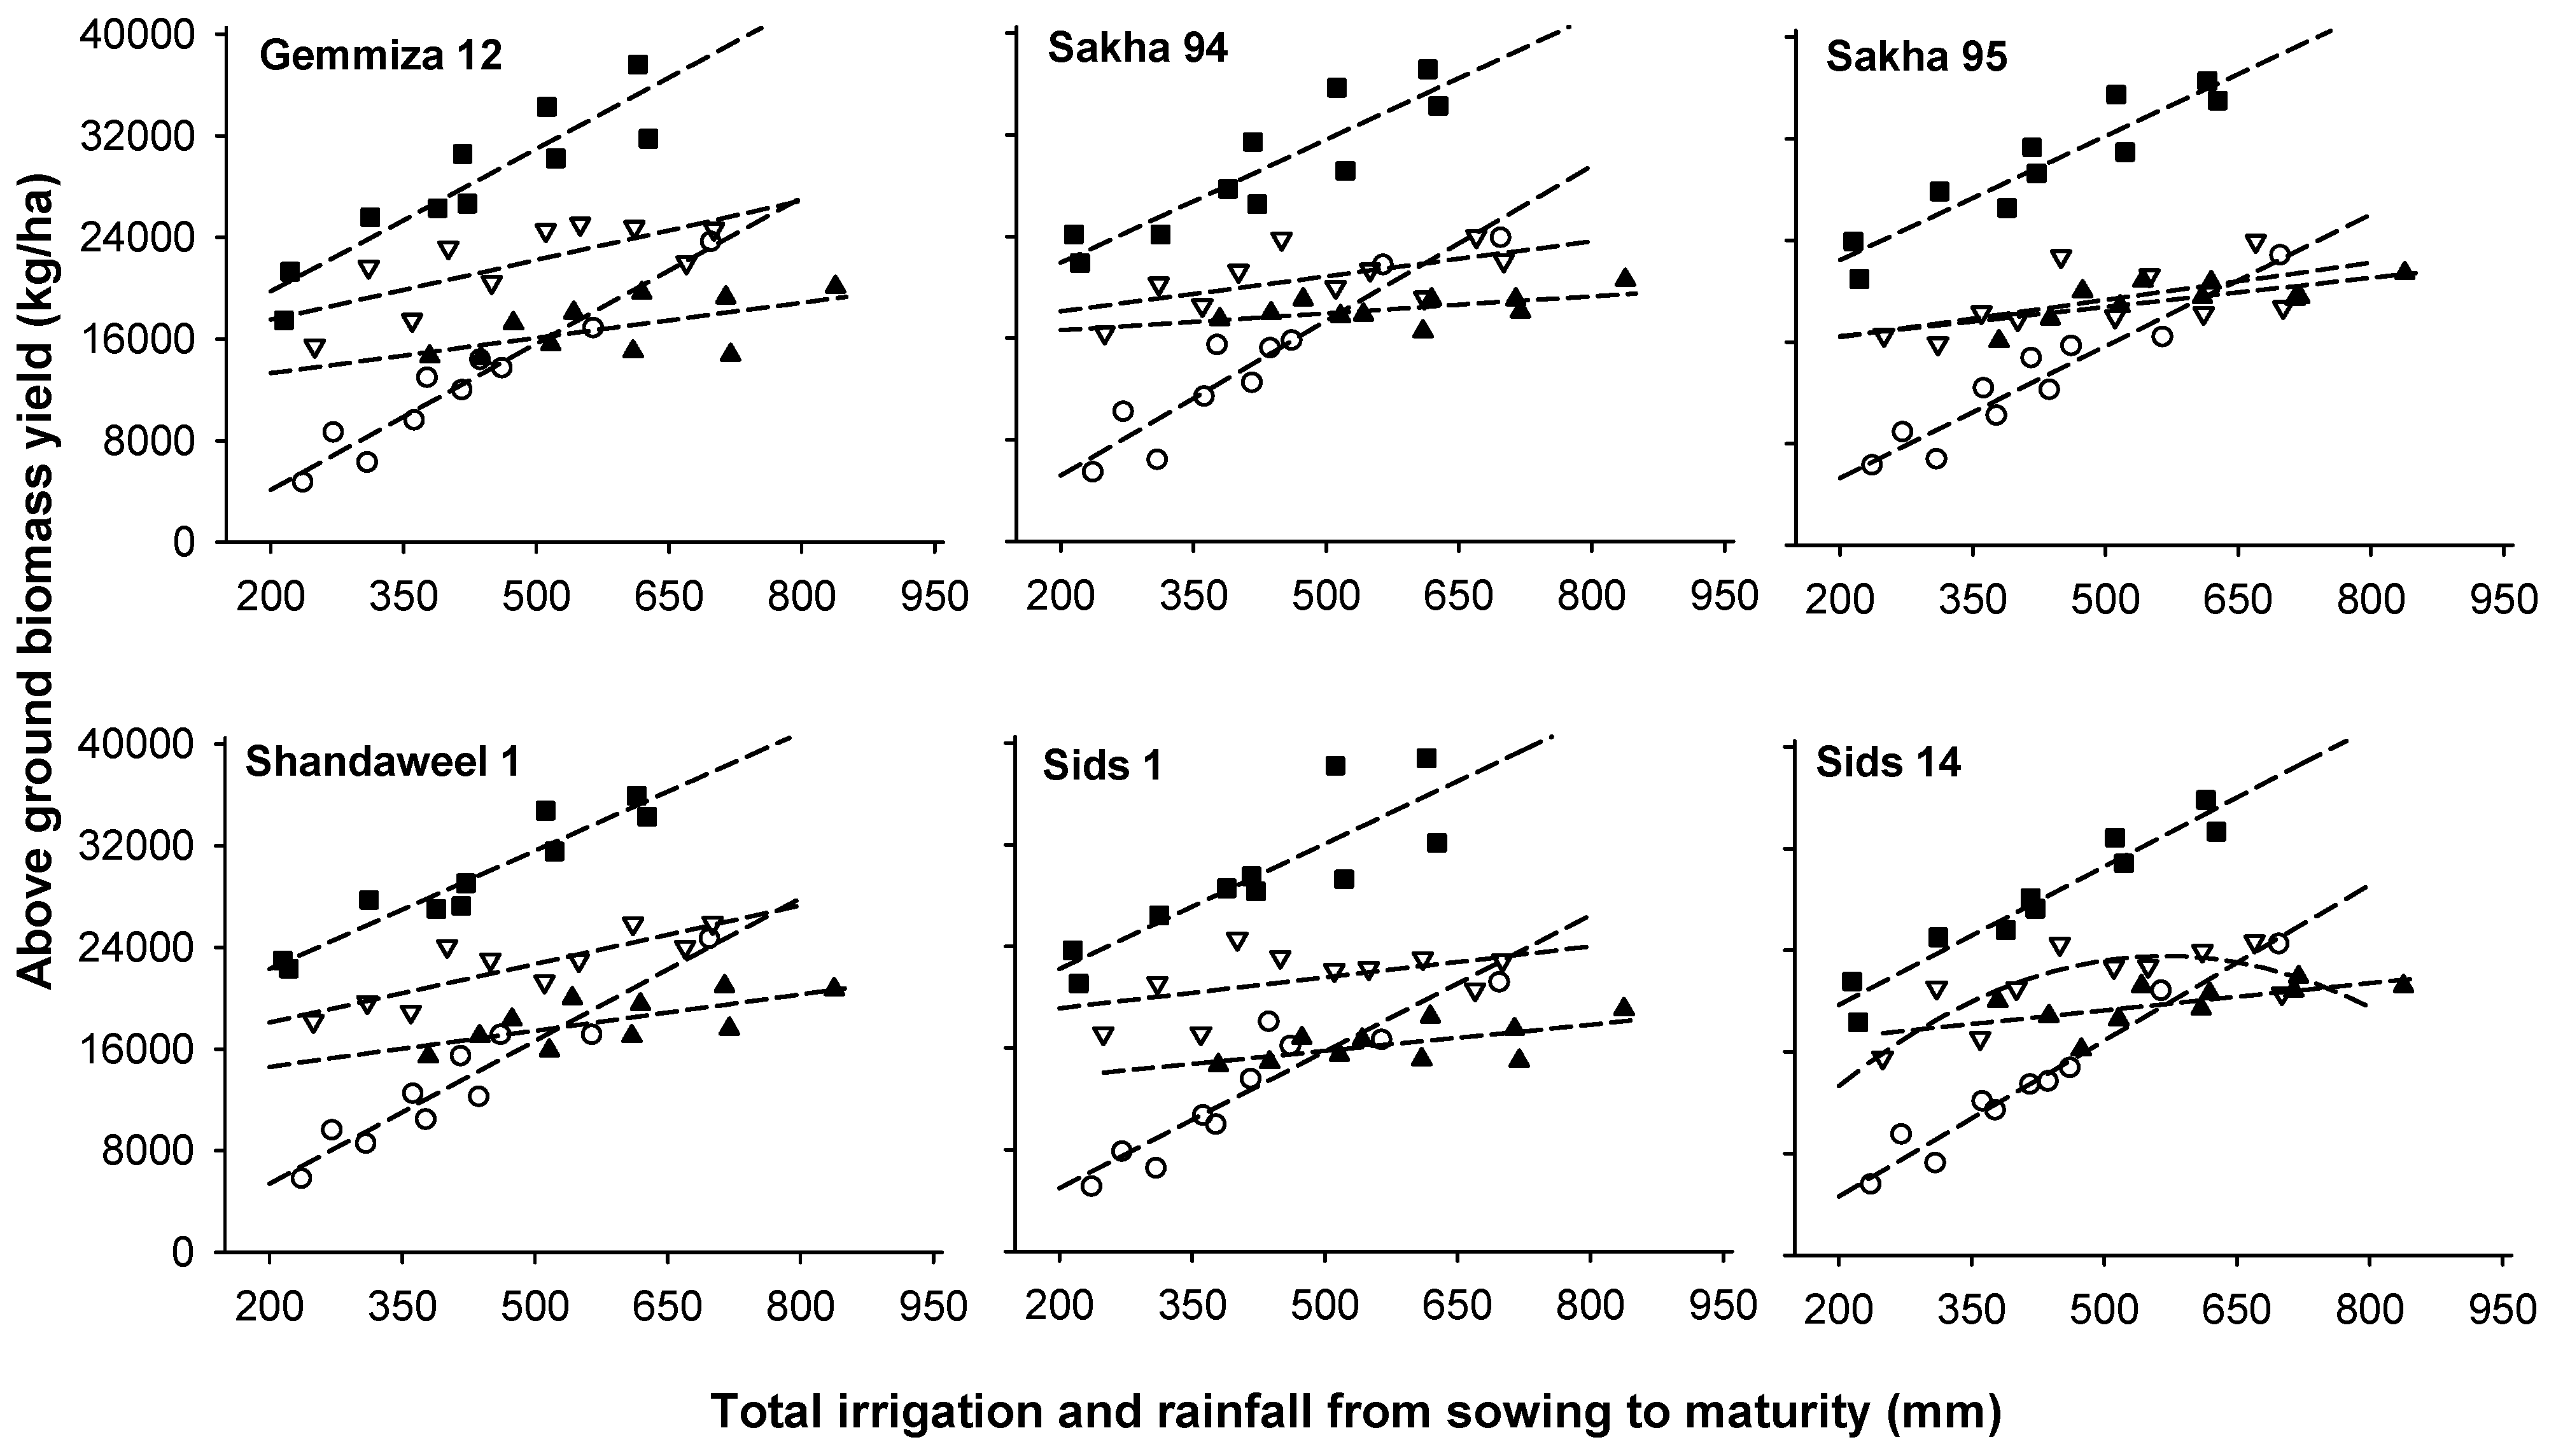
3.4. Abov-Ground Biomass Yield Response to Total Water Input

The above-soil surface biomass production in kg per plot was first scaled up from the harvested area at 2.8 m2 to a per hectare area of 10,000 m2 (ha). Then, the responses of the above-ground biomass yield to the total seasonal water input between the sowing and maturity date were analysed using regression procedures in Genstat 24.
The relationships between the above-ground biomass yield and the total seasonal water input were mostly positively linear rather than curvilinear for all six cultivars at all four locations. At Nubaria, there were no significant reductions in the residual variance by including the quadratic term to describe these relationships between the above-ground biomass yield and total seasonal water input for Gemmiza 12 (p > 0.98), Sakha 94 (p > 0.18), Sakha 95 (p > 0.21), Shandaweel 1 (p > 0.76), Sids 1 (p > 0.84) and Sids 14 (p > 0.83). At Al Mataenah, there were no significant reductions in the residual variance by including the quadratic term to describe these relationships for Gemmiza 12 (p > 0.34), Sakha 94 (p > 0.83), Sakha 95 (p > 0.62), Shandaweel 1 (p > 0.96), Sids 1 (p > 0.69) and Sids 14 (p > 0.62). At Ismailia, there were again no significant reductions in the residual variance by including the quadratic term to describe these relationships for Gemmiza 12 (p > 0.98), Sakha 94 (p > 0.48), Sakha 95 (p > 0.94), Shandaweel 1 (p > 0.93), Sids 1 (p > 0.14) and Sids 14 (p > 0.97). At Sids, there were no significant reductions in the residual variance by including the quadratic term to describe these relationships for Gemmiza 12 (p > 0.12), Sakha 94 (p > 0.39), Sakha 95 (p > 0.46), Shandaweel 1 (p > 0.56) and Sids 1 (p > 0.13). However, the inclusion of an additional quadratic term significantly reduced the residual variance for Sids 14 (p < 0.07) at Sids. Therefore, simple linear relations were chosen and fitted for all six cultivars at Nubaria, Al Mataenah and Ismailia but only for five cultivars (Gemmiza 12, Sakha 94, Sakha 95, Shandaweel 1 and Sids 14) at Sids (Table 10).
The best fitted lines for each cultivar at each location are shown in Figure 3. For the best fitted quadratic equation for Sids 14 at Sids, the probable optimal total water input to achieve the apparent maximum above-ground biomass yield was calculated and the optimal total water input was estimated at 568.3 mm. Comparisons for the intercept and slope of the best fitted linear equations showed significant differences between locations for each of the six cultivars (p < 0.01). Thus, the response of the above-ground biomass yield to the total seasonal water input varied with the location within a cultivar. For example, Gemmiza 12 not only had a greater above-ground biomass yield with a relatively smaller total seasonal water input but also had larger increases in the above-ground biomass yield with the increasing water input at Al Mataenah than at Nubaria. However, Gemmiza 12 had a greater above-ground biomass yield with a smaller total seasonal water input but had similar increases in the above-ground biomass yield with the increasing water input at Al Mataenah compared with Ismailia. Sakha 95 had similar increases in the above-ground biomass yields with the increasing water input at both Al Mataenah and Ismailia but had a significantly greater above-ground biomass yield at Al Mataenah than at Ismailia at any given level of total seasonal water input.

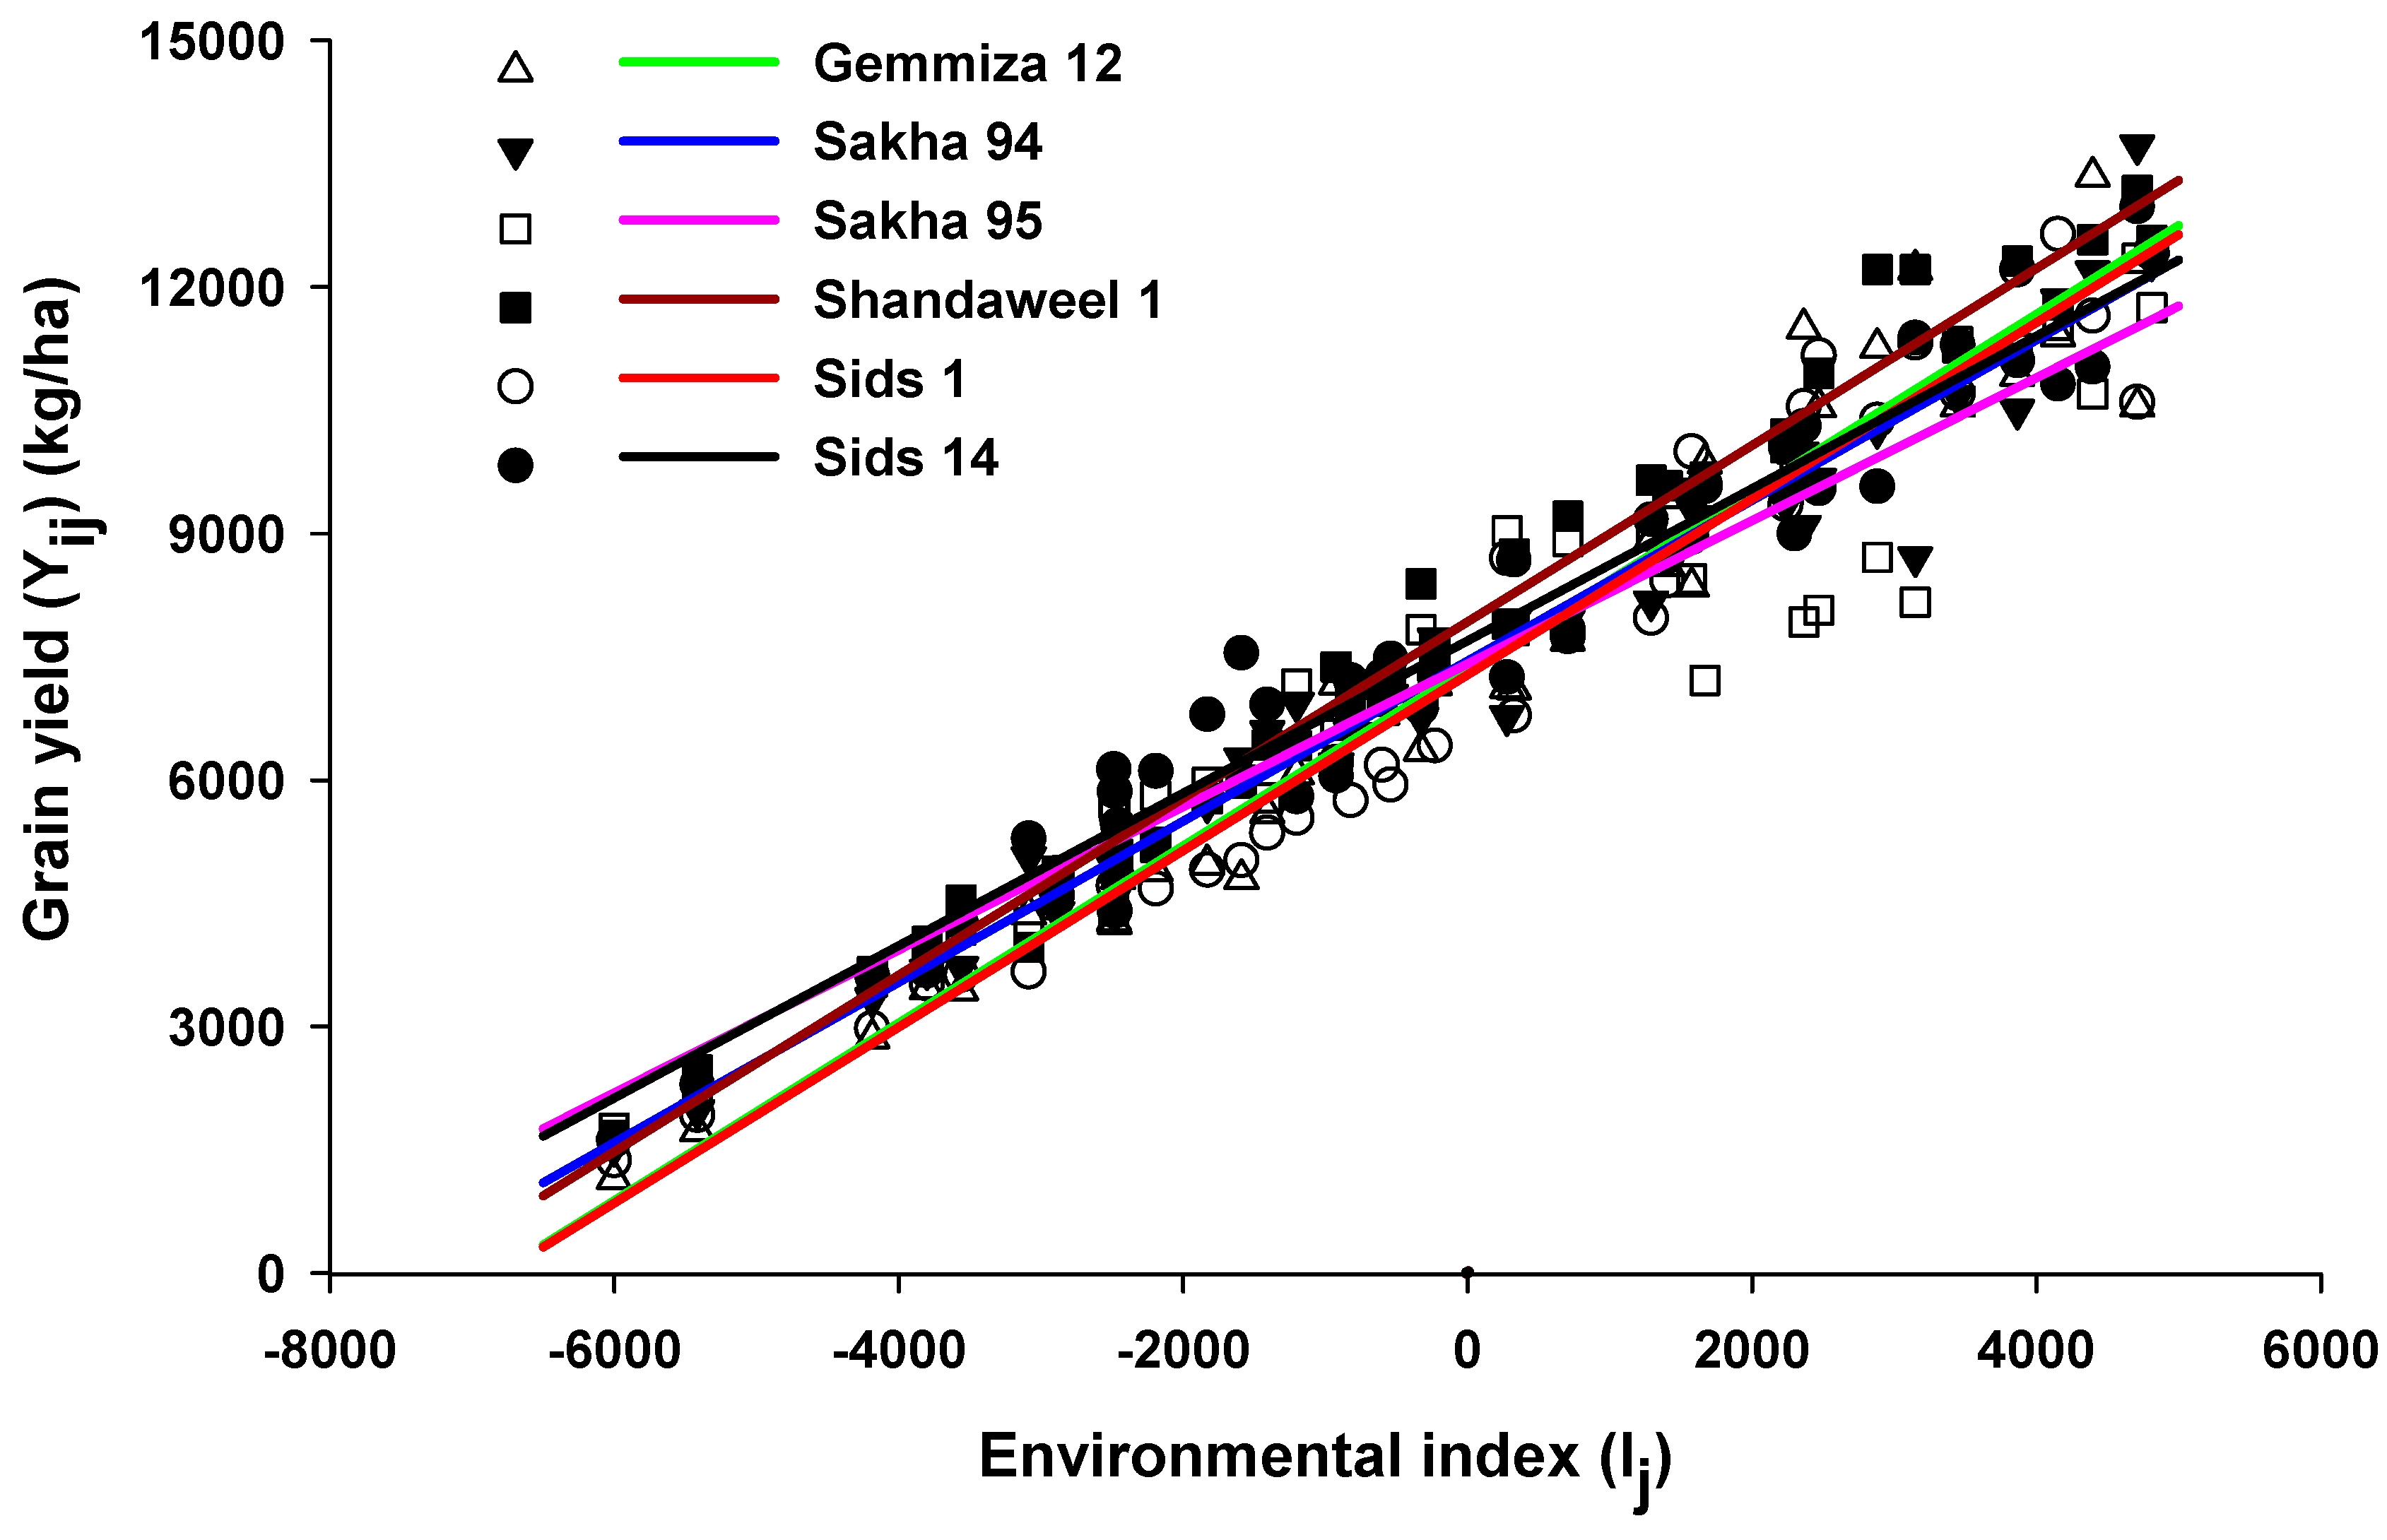
3.5. Grain Yield Stability

The stability parameters for the six cultivars are presented in Table 11 and the grain yield response of each cultivar to the varying environmental index is shown in Figure 4. Shandaweel 1 had the greatest mean grain yield (7926.5 kg/ha) and Sids 1 had the smallest mean grain yield (7281.8 kg/ha). The overall mean grain yield over all the irrigation treatments at the four locations in the two cropping seasons was 7520.9 kg/ha. The regression coefficient of Shandaweel 1 was greater than one and its mean grain yield was greater than the overall mean grain yield. It should be specifically suited to large irrigation applications in favourable environments. The regression coefficient of Sakha 95 was less than one and its mean grain yield was similar to the overall mean grain yield, suggesting that it was less responsive to the total water input and should specifically be suited to conditions with moderate irrigation application levels. The regression coefficients of Gemmiza 12 and Sids 1 were greater than one and their mean grain yields were smaller than the overall mean grain yield, suggesting that they reacted favourably to large total water inputs and are probably better suited to conditions in which large irrigation applications are available. The regression coefficients of Sakha 94 and Sids 14 were close to one and their mean grain yields were similar to the overall mean grain yield. These two cultivars should be suited to a wide range of irrigation water input conditions for achieving the overall mean grain yield (Figure 4).

4. Discussion

Our results suggest that it is inadvisable to save irrigation water by reducing the number of times of irrigation in the current wheat production system in Egypt. This is because the optimal wheat growth, above-ground biological yield and grain yield were achieved under the six irrigation application treatments for all six cultivars at all four locations in two cropping seasons. Wheat is grown as a winter crop that depends mainly on irrigation water in Egypt, where rainfall is very limited during the cropping season. Often, this small amount of rain is unreliable within the cropping season and between cropping seasons. As demand on freshwater for irrigation is projected to increase in future, improving agricultural water management is becoming more urgent than ever. Therefore, we need to find cultivation methods, ways to irrigate and the correct/optimal timing of irrigation application to use the available water more efficiently to sustainably improve food production [36,37]. In addition, breeding, screening and cultivation of climate-smart wheat cultivars, which are water-efficient and drought- and/or heat-tolerant, should be explored [38,39,40,41,42,43].
Our results showed that reduced water input through fewer irrigation applications decreased the times from sowing to heading and to maturity, resulting in shorter plant heights, decreased flag leaf area and reduced grain yield components, such as spikes per square metre, number of kernels per spike and the thousand grain weight (1000 GWT). Overall, irrigation treatment resulted in significant effects on nine agronomic traits. Compared with the six irrigation applications (T1), the two irrigation applications (T5) decreased the times to heading and maturity by 6.6 and 8.6 days, respectively. T5 reduced the plant height by 14.9 cm, flag leaf area by 12.0 cm2, number of spikes per square metre by 77.7, number of kernels per spike by 13.9 and 1000 GWT by 10.0 g. T5 also decreased the overall mean grain yield and biomass yield by 2834.9 and 7910.4 kg/ha, respectively. Consequently, both the grain yield and above-ground biomass were significantly less with the smallest total water input from the two irrigation applications than with the largest total water input from the six irrigation applications. The responses of the grain and above-ground biomass yields, agronomic and morphologic traits to reduced irrigation levels were consistent with those in other reports [26,44,45,46,47,48,49,50,51,52].
The reduction in days to heading under different water stress conditions varied from 5 to 10% at Sids and Nubaria. However, the days to heading is an important agronomic trait to determine the ability of a wheat genotype to withstand unfavourable conditions [51]. The grain yield was only weakly correlated with days from sowing to heading or maturity dates but had a strong positive correlation with six other agronomic and morphological traits across all six cultivars (Table 8). This implies that any adverse effects on any of these six traits due to reduced total seasonal water input by reducing irrigation applications will reduce the grain yields. The plant height under water stress conditions varied between different agro-climatic zones, with the wheat cultivars Sids 14 and Sakha 94 being shorter at Sids and Nubaria, respectively, while Sids 1 showed the smallest reduction in plant height under the same stress conditions in both locations. The number of kernels per spike is another crucial agronomic trait that significantly influences the overall grain yield in wheat crops. The severe water stress condition reduced the number of kernels per spike. However, genotypic differences among cultivars were evident, as Sakha 95 and Sids 1 showed the least reduction in number of kernels per spike under water stress in different locations. Consequently, both the grain yield and above-ground biomass yield were significantly less with the least total water input and fewest irrigation applications compared to the highest total water input and most irrigation applications.
Irrigation plays a pivotal role in wheat crop production. However, its great reliance on a fixed supply of freshwater from the Nile River poses challenges for the rational use of water for irrigation. The River Nile is not only the backbone of the national economy but also the primary source of drinking water for the population. As the global temperature is increasing under climate change, improved water management through irrigation will become more challenging. It will be more important to save water while maintaining high, stable wheat productivity [11,53]. From 2009 to 2019, wheat crop water requirements increased by c. 12% in Lower Egypt, c. 15% in Middle and Upper Egypt and c. 18% outside the Nile valley compared to 1987–1997 under the best farming conditions [54]. Another study indicated that irrigation amounts are expected to increase by 14.9% and 18.0%, while water productivity is expected to decline by 25.3% and 33.0% under two climate change scenarios (RCP4.5 and RCP8.5, respectively) for 2100 for wheat [55]. The wheat water footprint was estimated at 4348, 4825 and 5774 m3/ha in the Nile Delta, Middle and Upper Egypt agro-climate zones, respectively [21]. These are equivalent to 434.8, 482.5 and 577.4 mm in total water requirements per hectare, respectively. The correspondingly estimated averaged wheat grain yields from 2015 to 2019 were 6.72, 6.69 and 6.60 t/ha on the old lands while they were 5.91, 6.07 and 6.07 t/ha on the new lands in Upper Egypt, Middle Egypt and the Nile Delta, respectively.
The irrigation schedule in these experiments was implemented in such a way that, to save water, subsequent irrigation was stopped completely after the last designated irrigation in a treatment. We found that the greatest grain yields across all six cultivars and four locations occurred with the irrigation schedule that included six applications (i.e., T1). However, there are other water-saving cultivation methods and techniques that can help increase/maintain wheat production while reducing water usage [8,9,56,57,58,59]. For example, dry planting, laser levelling and alternate furrow irrigation have been tested and recommended as part of integrated irrigation management strategies [9]. Deficit irrigation has also been shown to be a significant water-saving approach while maintaining wheat crop yield [31,60,61,62]. Additionally, adopting raised-bed cultivation methods can reduce irrigation water requirements by 15.1% while increasing wheat yields by 12.8% [19,63]. In Egypt, efficient use of precipitation is limited, despite an abundance of sunshine, and there is a significant reliance on irrigation for wheat growth and development. Under these semi-arid and arid conditions, the focus should be on optimising the use of irrigation water and improving irrigation technology and efficiency [64]. To improve water-use efficiency, application of irrigation should include optimised scheduling based on the evapotranspiration needs of the wheat crop, calculated using the reference potential evapotranspiration in relation to the phenological stages and crop canopy cover [19,65,66,67,68,69]. Future research should also address the trade-offs between achieving high agronomic yields and considering the associated economic and environmental impacts [70].
Egypt is a country with an arid to semi-arid climate. Annual precipitation decreases from the north to south of the country. Even though there is more frequent rainfall along the Mediterranean coast, rain-fed wheat production has not been practised in Egypt as it is in the geographically neighbouring countries, such as Algeria, Morocco, Tunisia, Syria, Iraq and Turkey. In those countries, wheat crop production can be rain-fed or with significantly less water input. Egypt is blessed with the River Nile, which supplies freshwater for all sectors of society. The present quota of water from the River Nile (at about 55.5 billion cubic metres per annum) allows wheat production under irrigation conditions and as a result, the wheat grain yield is much greater in Egypt than under rain-fed conditions in other neighbouring countries. The wheat crop is currently scheduled to have five irrigations in the north and six irrigations in the south with irrigation intervals of 20–25 days because potential evapotranspiration in the south is greater than that in the north. Our estimated relationships between the grain yield and total water input showed that the grain yield continued to increase up to the irrigation treatment with a maximum of six applications. This schedule of six applications proved good for heathy wheat growth and high grain yield but is difficult to implement in countries such as Algeria, Morocco, Tunisia, Syria, Iraq and Turkey where the wheat crop is rain-fed in practice or with low available water input.
In recent years, crop growth models have become essential for decision making in managing crop production and have served as valuable research tools in assessing the impacts of climate change and providing adaptation strategies for agriculture [54,55,71,72,73,74]. The daily weather records, agronomic and wheat growth data collected in these irrigation experiments involving six cultivars will contribute to calibrating and validating useful wheat growth models to address climate change challenges and decision-making purposes [4,60]. Efficient supporting methods to link real-time weather with the wheat crop growth simulation models can be developed and applied for scheduling irrigation times in practice [75].

5. Conclusions

The highest grain yields were recorded with six irrigation applications while the lowest were associated with two applications. Compared with the six irrigation applications (T1) in relative terms, the two irrigation applications (T5) accelerated the times to heading and maturity by 7.3% and 6.3%, respectively. T5 reduced the plant height by 14.3%, flag leaf area by 27.2%, number of spikes per square metre by 20.1%, number of kernels per spike by 25.2% and thousand grain weight by 19.6%. T5 reduced the overall mean grain yield and above-ground biomass yield by 32.0% and 32.9%, respectively. These findings on the relationships between the wheat growth/yield parameters and water inputs support the current irrigation schedule recommendation to irrigate wheat crops six times to achieve a high, stable grain yield in Egypt. However, the greater grain yields observed at Al Mataenah and Sids compared to Ismailia and Nubaria were probably due to the lower fertility and poor water retention of the sandy soils at Ismailia and the newly reclaimed lands at Nubaria. Both the grain and above-ground biomass yields showed a strong linear relationship with the total seasonal water input, being more sensitive to water availability at Al Mataenah and Ismailia than at Nubaria and Sids. The greatest average grain yield and good yield stability of cultivar Shandaweel 1 achieved in these experiments indicated its suitability for growth in favourable soil and climatic conditions with large irrigation inputs. The average grain yields comparable to the overall mean grain yield and yield stability of cultivars Sakha 94 and Sids 14 suggested they can be grown to a broader range of total water inputs in all three major agro-climatic zones. Future research focused on wheat cultivation methods and irrigation practices aimed at conserving water should prioritise identifying and addressing the specific actual evapotranspiration needs of each cultivar. These evapotranspiration demands should be determined using real-time daily weather records, accounting for dynamic development in wheat growth stages and crop canopy sizes.

Supplementary Materials

The following supporting information can be downloaded at: https://www.mdpi.com/article/10.3390/agronomy14123057/s1, Figure S1:Daily mean air temperature (°C) from 1 November to 31 May in 2019/2020 and 2020/2021 at Nubaria and Sids and from 1 November to 31 May in 2020/2021 and 2021/2022 at Al Mataenah and Ismailia in Egypt. Figure S2: Daily precipitation (mm) from 1 November to 31 May in 2019/2020 and 2020/2021 at Nubaria and Sids and from 1 November to 31 May in 2020/2021 and 2021/2022 at Al Mataenah and Ismailia in Egypt. Figure S3: Daily global radiation (MJ d−1) from 1 November to 31 May in 2019/2020 and 2020/2021 at Nubaria and Sids and from 1 November to 31 May in 2020/2021 and 2021/2022 at Al Mataenah and Ismailia in Egypt. Figure S4: Daily wind speed (m s−1) from 1 November to 31 May in 2019/2020 and 2020/2021 at Nubaria and Sids and from 1 November to 31 May in 2020/2021 and 2021/2022 at Al Mataenah and Ismailia in Egypt. Figure S5: Daily potential reference evapotranspiration (ETo) from 1 November to 31 May in 2019/2020 and 2020/2021 at Nubaria and Sids and from 1 November to 31 May in 2020/2021 and 2021/2022 at Al Mataenah and Ismailia in Egypt. ETo is calculated using the method developed by Hargreaves (1975). Table S1: Results for significance tests for the respective source of variation in the analysis of variance for the nine traits measured on six wheat cultivars with five irrigation treatments in two cropping seasons at Nubaria. Grain and above ground biomass yields in kg were based on harvested plot area of 2.8 m2. Table S2: Results for significance tests for the respective source of variation in the analysis of variance for the nine traits measured on six wheat cultivars with five irrigation treatments in two cropping seasons at Al Mataenah. Grain and above ground biomass yields in kg were based on harvested plot area of 2.8 m2. Table S3: Results for significance tests for the respective source of variation in the analysis of variance for the nine traits measured on six wheat cultivars with five irrigation treatments in two cropping seasons at Sids. Grain and above ground biomass yields in kg were based on harvested plot area of 2.8 m2. Table S4: Results for significance tests for the respective source of variation in the analysis of variance for the nine traits measured on six wheat cultivars with five irrigation treatments in two cropping seasons at Ismailia. Grain and above ground biomass yields in kg were based on harvested plot area of 2.8 m2. Table S1a: Number of days from sowing to heading date for six wheat cultivars under five irrigation treatments in two cropping seasons at Nubaria. Table S2a:Number of days from sowing to maturing date for six wheat cultivars under five irrigation treatments in two cropping seasons at Nubaria. Table S3a: Plant height (cm) for six wheat cultivars under five irrigation treatments in two cropping seasons at Nubaria. Table S4a: Flag Leaf area (cm2) for six wheat cultivars under five irrigation treatments in two cropping seasons at Nubaria. Table S5a: Number of spikes per square metre for six wheat cultivars under five irrigation treatments in two cropping seasons at Nubaria. Table S6a: Number of kernels per spike for six wheat cultivars under five irrigation treatments in two cropping seasons at Nubaria. Table S7a: Thousand grain weight (g) for six wheat cultivars under five irrigation treatments in two cropping seasons at Nubaria. Table S8a: Mean grain yield (kg) per harvested plot area of 2.8 m2 for six wheat cultivars under five irrigation treatments in two cropping seasons at Nubaria. Table S9a: Mean above ground biomass yield (kg) per harvested plot area of 2.8 m2 for six wheat cultivars under five irrigation treatments in two cropping seasons at Nubaria. Table S1b: Number of days from sowing to heading date for six wheat cultivars under five irrigation treatments in two cropping seasons at Al Mataenah. Table S2b: Number of days from sowing to maturing date for six wheat cultivars under five irrigation treatments in two cropping seasons at Al Mataenah. Table S3b: Plant height (cm) for six wheat cultivars under five irrigation treatments in two cropping seasons at Al Mataenah. Table S4b: Flag Leaf area (cm2) for six wheat cultivars under five irrigation treatments in two cropping seasons at Al Mataenah. Table S5b: Number of spikes per square metre for six wheat cultivars under five irrigation treatments in two cropping seasons at Al Mataenah. Table S6b: Number of kernels per spike for six wheat cultivars under five irrigation treatments in two cropping seasons at Al Mataenah. Table S7b: Thousand grain weight (g) for six wheat cultivars under five irrigation treatments in two cropping seasons at Al Mataenah. Table S8b: Mean grain yield (kg) per harvested plot area of 2.8 m2 for six wheat cultivars under five irrigation treatments in two cropping seasons at Al Mataenah. Table S9b: Mean above ground biomass yield (kg) per harvested plot area of 2.8 m2 for six wheat cultivars under five irrigation treatments in two cropping seasons at Al Mataenah.

Author Contributions

Conceptualisation, A.F.E. and A.Q; data collection and curation, S.M.S. and M.A.M.G.; data analyses, A.Q.; data interpretation, A.F.E., Y.S., A.Q. and B.D.L.F.; writing the manuscript, A.Q.; reviewing and editing the manuscript, A.F.E., Y.S., M.L.E., B.R. and B.D.L.F.; all authors discussing the results. All authors have read and agreed to the published version of the manuscript.

Funding

This research was supported by research grants from the Egyptian Science, Technology and Innovation Funding Authority (STDF) (grant number [42687” EG–US cycle 19] and Newton Fund Impact Scheme funds managed by the UK British Council and STDF (Project ID: 43937).

Data Availability Statement

Those data presented in the paper are included in the Supplementary Material. Further inquiries for availability of full datasets collected in the experiments can be directed to the corresponding authors.

Acknowledgments

We gratefully acknowledge helps in running the irrigation experiments from the Wheat Research Department, Field Crops Institute, Agricultural Research Center and Agricultural Research Stations at Nubaria, Ismailia, Sids and Kiman Al Mataenah and advice from A Hamwieh and W Rabie.

Conflicts of Interest

The authors declare no conflicts of interest.

References

  1. Sewore, B.M.; Abe, A.; Nigussie, M. Evaluation of bread wheat genotypes for drought tolerance using morpho-physiological traits under drought stressed and well-watered conditions. PLoS ONE 2023, 18, e0283347. [Google Scholar] [CrossRef] [PubMed]
  2. Asseng, S.; Kheir, A.M.; Kassie, B.T.; Hoogenboom, G.; Abdelaal, A.I.; Haman, D.Z.; Ruane, A.C. Can Egypt become self-sufficient in wheat? Environ. Res. Lett. 2018, 13, 094012. [Google Scholar] [CrossRef]
  3. Daher, R. Beyond scarcity: An assessment of water management in Egypt from a political ecology perspective. Hung. J. Afr. Stud. 2022, 16, 21–27. [Google Scholar] [CrossRef]
  4. Kheir, A.M.; Hoogenboom, G.; Ammar, K.A.; Ahmed, M.; Feike, T.; Elnashar, A.; Liu, B.; Ding, Z.; Asseng, S. Minimizing trade-offs between wheat yield and resource-use efficiency in the Nile Delta—A multi-model analysis. Field Crops Res. 2022, 287, 108638. [Google Scholar] [CrossRef]
  5. Nikiel, C.A.; Eltahir, E.A.B. Past and future trends of Egypt’s water consumption and its sources. Nat. Commun. 2021, 12, 4508. [Google Scholar] [CrossRef] [PubMed]
  6. Mohamed, A.; Abuaraba, M.E.; Mehawed, H.S.; Kasem, M.A. Water footprint as a tool of water resources management—Review. Egypt. J. Chem. 2021, 64, 7331–7338. [Google Scholar] [CrossRef]
  7. Hamed, M.M.; Nashwan, M.S.; Shahid, S. Climatic zonation of Egypt based on high-resolution dataset using image clustering technique. Prog. Earth Planet. Sci. 2022, 9, 35. [Google Scholar] [CrossRef]
  8. Satoh, M.; Aboulroos, S.A. Irrigated Agriculture in Egypt: Past, Present and Future; Satoh, M., Aboulroos, S.A., Eds.; Springer Nature: Cham, Switzerland, 2017. [Google Scholar]
  9. Saleh, E.M.A. Can irrigation water saving options cope with water scarcity in Egypt? Environ. Sci. Agric. Food Sci. 2020, 6, 167–176. [Google Scholar]
  10. El-Bendary, N.; Elhariri, E.; Hazman, M.; Saleh, S.M.; Hassanien, A.E. Cultivation time recommender system based on climatic conditions for newly reclaimed lands in Egypt. Procedia Comput. Sci. 2016, 96, 110–119. [Google Scholar] [CrossRef]
  11. Gamal, R.; Abou-Hadid, A.F.; Omar, M.E.D.; Elbana, M. Does climate change affect wheat productivity and water demand in arid regions? Case study of Egypt. J. Agric. Food Res. 2024, 16, 101181. [Google Scholar] [CrossRef]
  12. Satoh, M.; Gamal, T.E.; Taniguchi, T.; Yuan, X.; Ishii, A.; Hassan, W.H.A.E. Chapter 8. Water Management in the Nile Delta. In Irrigated Agriculture in Egypt: Past, Present and Future; Satoh, M., Aboulroos, S.A., Eds.; Springer Nature: Cham, Switzerland, 2017; pp. 188–224. [Google Scholar]
  13. Abdalla, A.; Stellmacher, T.; Becker, M. Trends and prospects of change in wheat self-sufficiency in Egypt. Agriculture 2023, 13, 7. [Google Scholar] [CrossRef]
  14. Abdelmageed, K.; Chang, X.H.; Wang, D.M.; Wang, Y.J.; Yang, Y.S.; Zhao, G.C.; Tao, Z.Q. Evolution of varieties and development of production technology in Egypt wheat: A review. J. Integr. Agric. 2019, 18, 483–495. [Google Scholar] [CrossRef]
  15. Almas, L.K.; Usman, M. Determinants of wheat consumption, irrigated agriculture, and food security challenges in Egypt. WSEAS Trans. Environ. Dev. 2021, 17, 696–712. [Google Scholar] [CrossRef]
  16. Hussien, A.I.A. An economic study of the most important problems of Egyptian agriculture. Int. J. Mod. Agric. Environ. 2022, 2, 73–95. [Google Scholar]
  17. Tellioglu, I.; Konandreas, P. Agricultural Policies, Trade and Sustainable Development in Egypt; International Centre for Trade and Sustainable Development, United Nations Food Agric Organ (FAO): Rome, Italy, 2017. [Google Scholar]
  18. El Afandi, G.; Abdrabbo, M.A.A. Evaluation of reference evapotranspiration equations under current climate conditions of Egypt. Turkish J. Agric.—Food Sci. Technol. 2015, 3, 819–825. [Google Scholar] [CrossRef]
  19. Ouda, S.A.H.; Noreldin, T.A. Evapotranspiration data to determine agro-climatic zones in Egypt. J. Water Land Dev. 2017, 32, 79–86. [Google Scholar] [CrossRef]
  20. Farag, A.A.; Abdrabbo, M.A.A.; El Sharkawi, H.M.; Abou-Hadid, A.F. Comparison between SERE and RCP scenarios in temperature and evapotranspiration under different climate zone in Egypt. IOSR J. Environ. Sci. Toxicol. Food Technol. 2016, 10, 54–64. [Google Scholar]
  21. Swelam, A.; Farag, A.; Ramasamy, S.; Ghandour, A. Effect of climate variability on water footprint of some grain crops under different agro-climatic regions of Egypt. Atmosphere 2022, 13, 1180. [Google Scholar] [CrossRef]
  22. Abdrabbo, M.A.; Farag, A.A.; El-Desokey, W.M.S. Implementing of RCPs scenarios for the prediction of evapotranspiration in Egypt. Int. J. Plant Soil Sci. 2015, 6, 50–63. [Google Scholar] [CrossRef] [PubMed]
  23. Farag, A.A.; Abdrabbo, M.A.A.; Ahmed, M.S.M. GIS tool for distribution reference evapotranspiration under climate change in Egypt. Int. J. Plant Soil Sci. 2014, 3, 575–588. [Google Scholar] [CrossRef] [PubMed]
  24. Khalil, A.A. Effect of climate change on evapotranspiration in Egypt. Researcher 2013, 5, 7–12. [Google Scholar]
  25. Khalil, A.A.; Essa, Y.H.; Hashem, F.A.; Refaie, K.M. Water consumption variability for major crops in Egypt under climate change conditions. Int. J. Adv. Res. 2016, 4, 1157–1168. [Google Scholar]
  26. Abdel-Latif, I.S.M.; EL-Kader, M.N.T.; Gebreel, M. Effect of irrigation level and seed rate on wheat productivity. Egypt. J. Plant Breed. 2023, 27, 419–442. [Google Scholar]
  27. Abdrabbo, M.A.; Saleh, S.M.; Farag, A.A. Water requirements for maize under climate change. J. Appl. Sci. Res. 2016, 12, 19–28. [Google Scholar]
  28. Abdrabbo, M.A.; Ouda, S.; Noreldin, T. Modeling the irrigation schedule on wheat under climate change conditions. Nat. Sci. 2013, 11, 10–18. [Google Scholar]
  29. Ouda, S.A.H.; Zohry, A.E.-H.; Alkitkat, H.; Morsy, M.; Tarek, S.; Kamel, A. Obstacles and Opportunities. In Future of Food Gaps in Egypt; Springer Nature: Cham, Switzerland, 2017. [Google Scholar] [CrossRef]
  30. Ouda, S.; Noreldin, T.; Zohry, A.H. Chapter 4. Field Crops and Deficit Irrigation in Egypt. In Deficit Irrigation: A Remedy for Water Scarcity; Ouda, S., Zohry, A.E.-H., Noreldin, T., Eds.; Springer Nature: Cham, Switzerland, 2020; pp. 59–84. [Google Scholar]
  31. Ouda, S.; Noreldin, T. Chapter 2. Deficit Irrigation and Water Conservation. In Deficit Irrigation: A Remedy for Water Scarcity; Ouda, S., Zohry, A.E.-H., Noreldin, T., Eds.; Springer Nature: Cham, Switzerland, 2020; pp. 15–28. [Google Scholar]
  32. Zadoks, J.C.; Chang, T.T.; Konzak, C.F. A decimal code for the growth stages of cereals. Weed Res. 1974, 14, 415–421. [Google Scholar] [CrossRef]
  33. Hargreaves, G.H. Moisture availability and crop production. Trans. ASAE 1975, 18, 980–984. [Google Scholar] [CrossRef]
  34. Eberhart, S.A.; Russell, W.A. Stability parameters for comparing varieties. Crop Sci. 1966, 6, 36–40. [Google Scholar] [CrossRef]
  35. Finlay, K.W.; Wilkinson, G.N. The analysis of adaptation in a plant breeding programme. Aust. J. Agric. Res. 1963, 14, 742–754. [Google Scholar] [CrossRef]
  36. El-Marsafawy, S.M.; Mohamed, A.I. Water footprint of Egyptian crops and its economics. Alex. Eng. J. 2021, 60, 4711–4721. [Google Scholar] [CrossRef]
  37. El-Fetyany, M.; Farag, H.; Abd El Ghany, S.H. Assessment of national water footprint versus water availability—Case study for Egypt. Alex. Eng. J. 2021, 60, 3577–3585. [Google Scholar] [CrossRef]
  38. Al-Otayk, S.M.; AL-Soqeer, A.A.; Menshawy, A.E.M.; Motawei, M.I. Evaluation of some bread wheat genotypes popular in Saudi Arabia under drought stress. Aust. J. Crop Sci. 2019, 13, 1892–1900. [Google Scholar] [CrossRef]
  39. Darwish, M.A.; Elkot, A.F.; Elfanah, A.M.S.; Selim, A.I.; Yassin, M.M.M.; Abomarzoka, E.A.; El-Maghraby, M.A.; Rebouh, N.Y.; Ali, A.M. Evaluation of wheat genotypes under water regimes using hyperspectral reflectance and agro-physiological parameters via genotype by yield*trait approaches in Sakha station, Delta, Egypt. Agriculture 2023, 13, 1338. [Google Scholar] [CrossRef]
  40. Emam, M.A.; Abd EL-Mageed, A.M.; Niedbała, G.; Sabrey, S.A.; Fouad, A.S.; Kapiel, T.; Piekutowska, M.; Mahmoud, S.A. Genetic characterization and agronomic evaluation of drought tolerance in ten Egyptian wheat (Triticum aestivum L.) cultivars. Agronomy 2022, 12, 1217. [Google Scholar] [CrossRef]
  41. Hamada, A.; Said, M.T.; Ibrahim, K.M.; Saber, M.; Sayed, M.A. A predictive study of the redistribution of some bread wheat genotypes in response to climate change in Egypt. Agronomy 2022, 12, 113. [Google Scholar] [CrossRef]
  42. Hernandez-Ochoa, I.M.; Luz Pequeno, D.N.; Reynolds, M.; Babar, M.A.; Sonder, K.; Milan, A.M.; Hoogenboom, G.; Robertson, R.; Gerber, S.; Rowland, D.L.; et al. Adapting irrigated and rainfed wheat to climate change in semi-arid environments: Management, breeding options and land use change. Eur. J. Agron. 2019, 109, 125915. [Google Scholar] [CrossRef]
  43. Ober, E.S.; Alahmad, S.; Cockram, J.; Forestan, C.; Hickey, L.T.; Kant, J.; Maccaferri, M.; Marr, E.; Milner, M.; Pinto, F.; et al. Wheat root systems as a breeding target for climate resilience. Theor. Appl. Genet. 2021, 134, 1645–1662. [Google Scholar] [CrossRef]
  44. Elhag, D.A.A. Effect of irrigations number on yield and yield components of some bread wheat cultivars in North Nile Delta of Egypt. Egypt. J. Agron. 2017, 39, 137–148. [Google Scholar] [CrossRef]
  45. Elkot, A.F.; Ibrahim, S.D.; Hamada, A.; Ahmed, E.G.; Ibrahim, A.R.; El-Maghraby, M.A.; Gill, K. Molecular characterization and evaluation of different irrigation regimens on yield and other agronomic traits of some Egyptian wheat cultivars. J. Crop Improv. 2024, 38, 488–512. [Google Scholar] [CrossRef]
  46. Eser, C.; Soylu, S.; Ozkan, H. Drought responses of traditional and modern wheats in different phenological stages. Field Crops Res. 2024, 305, 109201. [Google Scholar] [CrossRef]
  47. Farhat, W.Z.E. Response of 21 spring bread wheat genotypes to normal and reduced irrigation in North Delta. J. Plant Prod. Mansoura Univ. 2015, 6, 943–963. [Google Scholar] [CrossRef]
  48. Gab Alla, M.M.M.; Abdelkhalek, A.A.; Neiven, L.E.; Sahar, A.F. Response of some bread wheat genotypes to less irrigation water. J. Plant Prod. 2019, 10, 917–927. [Google Scholar] [CrossRef]
  49. Mohiy, M.M.; Mohamed, M.; Alla, M.M.M.G. Effect of reduced irrigation on productivity and behavior of twenty bread wheat genotypes under Upper Egypt conditions. Egypt. J. Plant Breed. 2022, 25, 277–297. [Google Scholar]
  50. Maqbool, M.M.; Ali, A.; Haq, T.; Majeed, M.N.; Lee, D.J. Response of spring wheat (Triticum aestivum L.) to induced water stress at critical growth stages. Sarhad J. Agric. 2015, 31, 53–58. [Google Scholar]
  51. Poudel, M.R.; Ghimire, S.; Pandy, M.P.; Dhakal, K.; Thapa, D.B.; Poudel, H.K. Evaluation of wheat genotypes under irrigated, heat stress and drought conditions. J. Biol. Today’s World 2020, 9, 001–003. [Google Scholar]
  52. Ramunaidu, P.V.S.; Sekhar, D.; Sowjanya, A.; Srinivas, D.; Pavankumar, P.; Babu, P. Yield attributes and yield of wheat affected by irrigation schedules and varieties under HAT zone conditions of Andhra Pradesh, India. Int. J. Environ. Clim. Change 2023, 13, 2819–2828. [Google Scholar] [CrossRef]
  53. Ainsworth, E.A.; Long, S.P. 30 years of free-air carbon enrichment (FACE): What have we learned about future crop productivity and its potential for adaptation? Glob. Change Biol. 2021, 27, 27–49. [Google Scholar] [CrossRef]
  54. Gamal, G.; Samak, M.; Shahba, M. The possible impacts of different global warming levels on major crops in Egypt. Atmosphere 2021, 12, 1589. [Google Scholar] [CrossRef]
  55. Chauhdary, J.N.; Li, H.; Ragab, R.; Rakibuzzaman, M.; Khan, A.I.; Zhao, J.; Akbar, N. Climate change impacts on future wheat (Triticum aestivum) yield, growth periods and irrigation requirements: A SALTMED model simulations analysis. Agronomy 2024, 14, 1484. [Google Scholar] [CrossRef]
  56. Karrou, M.; Oweis, T.; Abou El Enein, R.; Sherif, M. Yield and water productivity of maize and wheat under deficit and raised bed irrigation practices in Egypt. African J. Agric. Res. 2012, 7, 1755–1760. [Google Scholar]
  57. Si, Z.; Qin, A.; Liang, Y.; Duan, A.; Gao, Y. A review on regulation of irrigation management on wheat physiology, grain yield, and quality. Plants 2023, 12, 692. [Google Scholar] [CrossRef]
  58. Singh, S.; Singh, V.; Pal, R.; Trivedi, H.; Narayan, A.; Gautam, M. Effect of sowing methods and irrigation levels on wheat (Triticum aestivum L.). Ecol. Environ. Conserv. 2023, 29, S170–S176. [Google Scholar] [CrossRef]
  59. Sugita, M.; Matsuno, A.; El-Kilanic, R.M.M.; Abdel-Fattahe, A.; Mahmoud, M.A. Crop evapotranspiration in the Nile Delta under different irrigation methods. Hydrol. Sci. J. 2017, 62, 1618–1635. [Google Scholar] [CrossRef]
  60. Kheir, A.M.; Alrajhi, A.A.; Ghoneim, A.M.; Ali, E.F.; Magrashi, A.; Zoghdan, M.G.; Abdelkhalik, S.A.; Fahmy, A.E.; Elnashar, A. Modeling deficit irrigation-based evapotranspiration optimizes wheat yield and water productivity in arid regions. Agric. Water Manag. 2021, 256, 107122. [Google Scholar] [CrossRef]
  61. Ouda, S.; Noreldin, T.; Alarcón, J.J.; Ragab, R.; Caruso, G.; Sekara, A.; Abdelhamid, M.T. Response of spring wheat (Triticum aestivum) to deficit irrigation management under the semi-arid environment of Egypt: Field and modeling study. Agriculture 2021, 11, 90. [Google Scholar] [CrossRef]
  62. Zaman, E.; Karim, M.A.; Bari, M.N.; Akter, N.; Ahmed, J.U. Growth and yield performance of selected wheat varieties under water deficit conditions. Bangladesh J. Sci. Res. 2016, 29, 163–172. [Google Scholar] [CrossRef]
  63. Yigezu, Y.A.; Abbas, E.; Swelam, A.; Sabry, S.R.S.; Moustafa, M.A.; Halila, H. Socioeconomic, biophysical, and environmental impacts of raised beds in irrigated wheat—A case study from Egypt. Agric. Water Manag. 2021, 249, 10680. [Google Scholar] [CrossRef]
  64. Zhang, Y.; Long, A.; Zhang, P.; Deng, X.; Gu, X. Are water use efficiency and effectiveness relatively lower in arid zones? Comparative analyses of the water productivity of typical crops. Agronomy 2024, 14, 2153. [Google Scholar] [CrossRef]
  65. Feng, T.; Shen, H.; Yang, X.; Nianga, J.-M.; Wang, Z. Integration of large language models with IoT in smart agriculture to improve efficiency, yield, and quality. Ind. Sci. Eng. 2024, 1, 15–35. [Google Scholar] [CrossRef]
  66. Hachisuca, A.M.M.; Abdala, M.C.; de Souza, E.G.; Rodrigues, M.; Ganascini, D.; Bazzi, C.L. Growing degree-hours and degree-days in two management zones for each phenological stage of wheat (Triticum aestivum L.). Int. J. Biometeorol. 2023, 67, 1169–1183. [Google Scholar] [CrossRef]
  67. Ober, E.S.; Howell, P.; Thomelin, P.; Kouidri, A. The importance of accurate developmental staging. J. Exp. Bot. 2020, 71, 3375–3379. [Google Scholar] [CrossRef]
  68. Ouda, S.A.E.-F.; Khalil, F.A.; Elenin, R.A.; Shreif, M.A.K.; Benli, B.; Qadir, M. Using yield-stress model in irrigation management for wheat grown in Egypt. J. Appl. Biol. Sci. 2008, 2, 57–65. [Google Scholar]
  69. You, Y.; Song, P.; Yang, X.; Zheng, Y.; Dong, L.; Chen, J. Optimizing irrigation for winter wheat to maximize yield and maintain high-efficient water use in a semi-arid environment. Agric. Water Manag. 2022, 273, 107901. [Google Scholar] [CrossRef]
  70. Darouich, H.; Cameira, M.R.; Gonçalves, J.M.; Paredes, P.; Pereira, L.S. Comparing sprinkler and surface irrigation for wheat using multi-criteria analysis: Water saving vs. economic returns. Water 2017, 9, 50. [Google Scholar] [CrossRef]
  71. Davarpanah, R.; Ahmadi, S.H. Modeling the effects of irrigation management scenarios on winter wheat yield and water use indicators in response to climate variations and water delivery systems. J. Hydrol. 2021, 598, 126269. [Google Scholar] [CrossRef]
  72. Hassanein, M.K.; Elsayed, M.; Khalil, A.A. Impacts of sowing date, cultivar, irrigation regimes and location on bread wheat production in Egypt under climate change conditions. Nat. Sci. 2012, 10, 141–150. [Google Scholar]
  73. Lal, D.; Niwas, R. Yield predication by DSSAT model of wheat crop: A review. Int. J. Environ. Clim. Change 2024, 14, 519–524. [Google Scholar] [CrossRef]
  74. Toumi, J.; Er-Raki, S.; Ezzahar, J.; Khabba, S.; Jarlan, L.; Chehbouni, A. Performance assessment of AquaCrop model for estimating evapotranspiration, soil water content and grain yield of winter wheat in Tensift Al Haouz (Morocco): Application to irrigation management. Agric. Water Manag. 2016, 163, 219–235. [Google Scholar] [CrossRef]
  75. Mohamed, N.S.; Sathyamoorthy, N.K.; Dheebakaran, G.; Pazhanivelan, S.; Vadivel, N. Coupled weather and crop simulation modeling for smart irrigation planning: A review. Water Supply 2024, 24, 2844–2865. [Google Scholar]
Figure 1. Sites of irrigation experiments run by agricultural research stations and located, respectively, in Nubaria, Ismailia, Sids and Al Mataenah across Egypt. Nubaria and Ismailia sites represent the agro-climate zone in the Nile Delta in the north, Sids represents the agro-climate zone in Middle Egypt and Al Mataenah represents the agro-climate zone in Upper Egypt in the south.
Agronomy 14 03057 g001
Figure 2. Grain yield in relation to total seasonal water input from both irrigation and rainfall from sowing to maturity for six wheat cultivars at Nubaria (▲), Al Mataenah (◼), Sids (▽) and Ismailia (○). The dashed lines are drawn from the estimated equations in Table 9.
Agronomy 14 03057 g002
Figure 3. Above-ground biomass yield in relation to the total seasonal water input from both irrigation and rainfall from sowing to maturity for six wheat cultivars at Nubaria (▲), Al Mataenah (◼), Sids (▽) and Ismailia (○). The dashed lines are drawn from the estimated equations in Table 10.
Agronomy 14 03057 g003
Figure 4. The grain yield response of six wheat cultivars to varying environmental index. The environmental index (Ij) was calculated as the mean grain yield of all six cultivars in the jth environment minus the mean grain yield of all cultivars over all environments. Here, each irrigation treatment was considered to be a separate environment in which each cultivar was grown.
Agronomy 14 03057 g004
Table 1. Experimental locations with latitude (°), longitude (°), altitude (m), soil texture type and soil available water content (SAWC) (%) at field capacity and sowing dates.
Location *LatitudeLongitudeAltitudeSoil TypeSAWCSowing Date
Nubaria30.69 N30.66 E54Loamy sand1205-Dec-2019
Loamy sand1325-Nov-2020
Sids29.07 N31.09 E18Clay1901-Dec-2019
Clay1825-Nov-2020
Al Mataenah25.30 N32.55 E82Clay loam1825-Nov-2020
Clay loam1827-Nov-2021
Ismailia30.61 N32.28 E5Sandy soil1213-Dec-2020
Sandy soil1221-Nov-2021
* Nubaria—Nubaria Agricultural Research Station in Al-Behera governorate, Sids—Sids Agricultural Research Station in Bani Suef governorate, Al Mataenah—Kiman Al Mataenah Agricultural Research Station in Luxor governorate, Ismailia—Ismailia Agricultural Research Station in Al-Ismailia governorate (see Figure 1).
Table 2. Name, pedigree and selection of the six bread wheat cultivars in the experiments.
CultivarCross/Pedigree and Selection HistoryRelease Year
Sids 1 HD2172/Pavon “S”//1158.57/Maya 74 “S” Sd46-4Sd-2Sd-1Sd-0Sd1996
Sids 14BOW “S”/VEE “S”//BOW “S”/TSI/3/BANI SEWEF 1 SD293-1SD-2SD-4SD-0SD2015
Sakha 94Opata/Rayon//Kauz CMBW90Y3180-0TOPM-3Y-010M-010M-010Y-10M-015Y-0Y-0AP-0S2004
Sakha 95PASTOR//SITE/MO/3/CHEN/AEGILOPS SQUARROSA (TAUS)//BCN/4/WBLL1 CMA01Y00158S-040POY-040M-030ZTM-040SY-26M-0Y-0SY-0S2019
Gemmiza 12Bow “s”/Kvz “s”//7C/Seri 82/3/Giza 168/Sakha61 GM 7892-2GM-1GM-2GM-1GM-0GM2011
Shandaweel 1Site/Mo/4/Nac/Th.Ac//3* Pvn/3/Mirlo/Buc CMSS93B00567S-72Y-010M-010Y-010M-3Y-0M-0THY-0SH2011
Table 3. Five irrigation input treatments with decreasing irrigation application times from six in treatment 1 (T1) to two in treatment 5 (T5) at different times after sowing. Irrigation application immediately after sowing was to aid seedling emergence and crop establishment.
Days After SowingIrrigation Timing
T1T2T3T4T5
01st1st1st1st1st
202nd2nd
403rd3rd2nd2nd2nd
604th
805th4th3rd3rd
1106th5th4th
Table 4. Mean maximum (Tmax), minimum (Tmin), average (Tave) air temperature, average relative humidity, wind speed in metres per second, total rainfall, global radiation and potential evapotranspiration (ETo) from sowing date (November/December) to end of May next year in each cropping season at four locations.
LocationSowing DateTmax
(°C)
Tmin
(°C)
Tave
(°C)
Radiation
(MJ)
Rainfall
(mm)
Humidity
(%)
Wind Speed
(m s−1)
ETo
(mm)
Nubaria05-Dec-201922.112.717.43535.8288.068.83.5700.6
25-Nov-202023.613.318.43717.9264.165.73.1757.3
Sids01-Dec-201924.410.217.33731.0100.854.42.9746.3
25-Nov-202026.711.419.13910.129.945.72.9817.2
Al Mataenah25-Nov-202029.812.421.14169.60.830.82.8916.4
27-Nov-202128.011.619.83915.95.633.83.0836.3
Ismailia13-Dec-202027.011.519.33351.781.657.52.5706.9
21-Nov-202124.910.717.83288.922.056.42.7670.6
Table 5. Accumulated rainfall, irrigation and total water input for five irrigation treatments from sowing date to maturity date in two cropping seasons at four locations.
SiteSowing DateRainfall
(mm)
Irrigation
Treatment
Irrigation
(mm)
Total Water Input
(mm)
Nubaria05-Dec-2019195.4T1524.0719.4
T2414.0609.4
T3321.0516.4
T4242.0437.4
T5184.0379.4
25-Nov-2020264.1T1574.0838.1
T2450.0714.1
T3355.0619.1
T4278.0542.1
T5210.0474.1
Sids01-Dec-2019100.7T1600.0700.7
T2510.0610.7
T3410.0510.7
T4300.0400.7
T5210.0310.7
25-Nov-202029.6T1640.0669.6
T2520.0549.6
T3420.0449.6
T4330.0359.6
T5220.0249.6
Al Mataenah25-Nov-20200.8T1614.0614.8
T2511.0511.8
T3416.0416.8
T4388.0388.8
T5221.0221.8
27-Nov-20215.6T1621.1626.7
T2516.4522.0
T3416.4422.0
T4306.8312.4
T5209.2214.8
Ismailia13-Dec-202081.6T1615.5697.1
T2482.6564.2
T3354.8436.4
T4295.0376.6
T5189.0270.6
21-Nov-202122.0T1439.0461.0
T2394.0416.0
T3340.0362.0
T4287.0309.0
T5214.0236.0
Table 6. Average grain yield (kg/ha) across all irrigation treatments over two cropping seasons for six cultivars at four locations.
LocationCultivarLocation Mean
Gemmiza 12Sakha 94Sakha 95Shandaweel 1Sids 1Sids 14
Al Mataenah9211.99341.79579.89950.09467.99204.89459.3
Ismailia3893.24359.64324.04534.03889.44637.74273.0
Nubaria5692.96263.16525.06160.15354.86744.06123.3
Sids10,624.89833.79240.811,061.810,415.010,191.810,228.0
Cultivar mean7355.77449.57417.47926.57281.87694.6
Table 7. Simple linear correlation coefficients (r) between total seasonal water input and nine agronomic or morphological traits for six wheat cultivars. To reach statistical significance level at 5% and 1%, the critical thresholds for values of correlation coefficients are 0.312 and 0.403 at 5% and 1%, respectively.
TraitCultivar
Gemmiza 12Sakha 94Sakha 95Shandaweel 1Sids 1Sids 14
Days to heading0.510.520.480.530.550.52
Days to maturity0.440.470.450.430.470.44
Plant height (cm)0.580.630.630.610.640.67
Flag leaf area (cm2)0.570.460.610.530.560.54
Spikes per m20.190.050.090.130.110.15
Kernels per spike0.350.490.250.390.340.36
1000 GWT (g)0.610.670.660.730.600.70
Grain yield (kg/2.8 m2)0.340.420.350.360.260.46
Above-ground biomass yield (kg/2.8 m2)0.380.330.350.370.260.46
Table 8. Simple linear correlation coefficients (r) between grain yield per harvested plot area (kg/2.8 m2) and eight agronomic or morphological traits for six wheat cultivars. To reach statistical significance level at 5% and 1%, the critical thresholds for absolute values of correlation coefficients are 0.312 and 0.403 at 5% and 1%, respectively.
TraitCultivar
Gemmiza 12Sakha 94Sakha 95Shandaweel 1Sids 1Sids 14
Days to heading0.19−0.01−0.070.10−0.060.14
Days to maturity0.400.220.110.260.200.27
Plant height (cm)0.740.720.710.690.480.63
Flag leaf area (cm2)0.230.320.630.210.010.31
Spikes per m20.750.620.640.690.760.63
Kernels per spike0.790.810.640.730.790.77
1000 GWT (g)0.280.590.420.440.560.46
Above-ground biomass yield (kg/2.8 m2)0.870.830.840.850.840.85
Table 9. The estimated values for intercept and slope, the calculated percentage of variance accounted for (R2) and the significant probability level for the best fitted linear relations for cultivars at each site in describing the grain yield response to total seasonal water input from sowing to maturity.
LocationCultivarInterceptSlopeR2 (%)Significant Probability
NubariaGemmiza 1227445.0430.1p < 0.06
Sakha 9433275.0247.9p < 0.02
Sakha 9548622.8419.6p < 0.11
Shandaweel 128575.6552.9p < 0.01
Sids 134473.2637.2p < 0.04
Sids 1444004.0162.9p < 0.01
Al MataenahGemmiza 12409712.0380.6p < 0.01
Sakha 94409812.3378.1p < 0.01
Sakha 95501510.7484.7p < 0.01
Shandaweel 157689.8482.8p < 0.01
Sids 1409712.6369.7p < 0.01
Sids 14358013.2393.7p < 0.01
IsmailiaGemmiza 12−50010.6465.4p < 0.01
Sakha 94−69912.2571.3p < 0.01
Sakha 95−20110.9674.7p < 0.01
Shandaweel 1−78612.8878.7p < 0.01
Sids 1−1419.6766.4p < 0.01
Sids 14−86713.3375.3p < 0.01
Sids *Sakha 9456558.6837.7p < 0.04
Sakha 9573074.023.1p < 0.28
Shandaweel 165529.3767.2p < 0.01
Sids 1466877.2845.8p < 0.02
* At Sids, the quadratic term was significant at p < 0.1 for the cultivars Gemmiza 12 and Sids 1. The estimated equation was y = −3559 + 55.2x − 0.049x2 for Gemmiza 12 and y = 884 + 38.2x − 0.035x2 for Sids 1.
Table 10. The estimated values for intercept and slope, the calculated percentage of variance accounted for (R2) and the significant probability level for the best fitted linear relations for cultivars at each site in describing the above-ground biomass yield response to total seasonal water input from sowing to maturity.
LocationCultivarInterceptSlopeR2 (%)Significant Probability
NubariaGemmiza 1211,4889.2526.3p < 0.07
Sakha 9415,7324.4724.1p < 0.08
Sakha 9514,9437.6542.1p < 0.03
Shandaweel 112,6999.4940.6p < 0.03
Sids 112,3486.8530.6p < 0.06
Sids 1415,6747.1728.2p < 0.07
Al MataenahGemmiza 1212,27137.4481.8p < 0.01
Sakha 9415,48032.3378.6p < 0.01
Sakha 9515,93732.5785.3p < 0.01
Shandaweel 116,12230.9789.4p < 0.01
Sids 115,62632.8869.7p < 0.01
Sids 1412,44836.2792.7p < 0.01
IsmailiaGemmiza 12−353438.3993.3p < 0.01
Sakha 94−294140.6388.1p < 0.01
Sakha 95−162134.6090.2p < 0.01
Shandaweel 1−207437.4290.1p < 0.01
Sids 1−217035.7683.2p < 0.01
Sids 14−355940.8895.8p < 0.01
Sids *Gemmiza 1214,42115.6347.1p < 0.02
Sakha 9416,2859.1828.2p < 0.07
Sakha 9514,4419.7623.7p < 0.09
Shandaweel 115,01615.3568.6p < 0.01
Sids 117,5038.1015.2p < 0.15
* At Sids, the quadratic term was found to be significant at p < 0.1 for the cultivar Sids 14. The estimated equation for cultivar Sids 14 was y = −789 + 85.6x − 0.0753x2.
Table 11. Estimated regression coefficient (βi) and the residual sum of squared deviations from regression (S2di) for six cultivars in grain yield stability analysis. The grain yield for each cultivar was the mean yield over all irrigation treatments across two cropping seasons and the coefficient of determination was the percentage of variance accounted for (R2).
CultivarGrain Yield (kg/ha)βiS2diR2(%)
Gemmiza 127355.71.0788429,41595.7
Sakha 947449.50.9768296,95796.4
Sakha 957417.40.8705594,01891.5
Shandaweel 17926.51.0749210,91897.9
Sids 17281.81.0717400,65195.9
Sids 147694.60.9273331,07095.5
Overall mean7520.9---
Disclaimer/Publisher’s Note: The statements, opinions and data contained in all publications are solely those of the individual author(s) and contributor(s) and not of MDPI and/or the editor(s). MDPI and/or the editor(s) disclaim responsibility for any injury to people or property resulting from any ideas, methods, instructions or products referred to in the content.

