Article

Black Soil Quality After 19 Years of Continuous Conservation Tillage

1
College of Resources and Environment, Northeast Agricultural University, Harbin 150030, China
2
State Key Laboratory of Black Soils Conservation and Utilization, Northeast Institute of Geography and Agroecology, Chinese Academy of Sciences, Harbin 150081, China
3
Estación Experimental Agroindustrial Obispo Colombres, W. Cross 3150, Las Talitas, San Miguel de Tucumán T4101XAC, Argentina
4
College of Geographical Science, Harbin Normal University, Harbin 150080, China
*
Authors to whom correspondence should be addressed.
Agronomy 2024, 14(12), 2859; https://doi.org/10.3390/agronomy14122859
Submission received: 28 September 2024 / Revised: 10 November 2024 / Accepted: 27 November 2024 / Published: 29 November 2024
(This article belongs to the Section Farming Sustainability)

Abstract

:
Conservation tillage is a practice adopted worldwide to prevent soil degradation. Although there have been many studies on the impact of conservation tillage on soil quality, most studies on cultivated land in the black soil region of Northeast China are based on the physical and chemical indicators of soil. In addition, the experiment time is generally short, so there is a lack of information about long-term conservation tillage from the perspective of the physical, chemical, and biological integration of soil. A comparative analysis of the physical, chemical, and biological characteristics of soil was conducted under no-till (NT) with straw mulching and conventional tillage (CT) treatments after 19 years of field experiments. By using membership functions to normalize and render all the indicators dimensionless, and calculating the weight of each indicator through principal component analysis, the comprehensive index of soil quality can be calculated as a weighted summation. The results indicate that NT had no significant effect on soil bulk density at a soil depth of 0–20 cm. NT increased the field water-holding capacity of the 0–5 cm layer, reduced the total porosity of the 5–10 cm soil layer, and decreased the non-capillary porosity of the 0–20 cm soil layer. Compared to CT, NT significantly increased the organic carbon content of the soil in the 0–5 cm layer, comprehensively improved the total nutrient content of the soil, and significantly increased the contents of ammonium nitrogen, nitrate-nitrogen, and available phosphorus in the soil. It also significantly improved the total phosphorus content in the 5–20 cm soil layer. NT improved the microbial carbon and nitrogen content of the soil, significantly enhanced the microbial nitrogen content in the 0–5 and 5–10 cm soil layers, and reduced the bacterial species diversity in the 5–10 cm soil layer. However, the soil enzyme activities showed no significant differences between different treatments. Under the NT treatment, the evaluation of soil quality indicators, such as mean weight diameter, field water-holding capacity, non-capillary porosity, microbial biomass nitrogen, total nutrients, and available nutrients, was relatively successful. Based on the weight calculation, the organic carbon, catalase activity, fungal richness, and bacterial diversity indicators are the most important of the 22 soil quality indicators. In terms of the comprehensive index of soil fertility quality, NT increased the soil quality comprehensive index by 34.2% compared to CT. Long-term conservation tillage improved the physical, chemical, and biological properties of the soil, which significantly enhanced the quality of the black soil.

1. Introduction

The unique topography of the Northeast Black Soil Region, which is characterized by its gently undulating hills and ridges, coupled with the traditional practice of contour farming, has led to severe soil erosion in the sloping arable lands. The area affected by soil erosion amounts to 218,700 square kilometers, with the black soil layer thinning at an annual rate of 2.0 to 3.0 mm [1]. However, the extensive cultivation regime that has been in place since the soil’s reclamation has led to significant disturbances in the soil’s natural structure [2]. These practices have caused a substantial decline in soil fertility and organic matter content, resulting in the degradation of black soil, a reduction in its depth, and a deterioration of its structural integrity. Such changes have posed a serious threat to the sustainable management and conservation of this precious resource [3]. In light of these challenges, the implementation of conservation tillage practices has become increasingly important for ensuring the sustainable development of the black soil ecosystem in Northeast China.
Soil quality is a critical determinant of agricultural sustainability, environmental stability, and the overall health of the ecosystem’s flora and fauna [4]. Since the 1950s, China has begun to explore conservation tillage methods, increased straw mulching, and reduced plowing and crop rotation [5]. In the last few years, researchers have explored the impact of conservation tillage on soil quality, focusing on its effects on the physical, chemical, and biological properties of the soil. For instance, a 14-year-long study in Guangrong Village, Hailun City, Heilongjiang Province, revealed that NT did not significantly increase soil bulk density compared to CT. However, NT led to an increase in soil capillary porosity and water-stable macroaggregate (WR0.25) content in the 0–20 cm soil layer, with significant differences observed in terms of water-stable macroaggregate content and mean weight diameter (MWD) (p < 0.05) [6]. Through a long-term positioning experiment, the effects of traditional tillage measures and conservation tillage on the quality of soil fertility in the tillage layer of the western Loess Plateau’s dry farming area were studied. Compared to traditional tillage, NT increased total nitrogen by 11.58% to 12.95%, total phosphorus by 13.79% to 18.29%, total potassium by 8.78% to 9.15%, and quick-acting phosphorus by 16.29% to 20.99%. Moreover, quick-acting potassium increased by 31.62% to 44.22%, improving soil fertility [7]. Another study based on a wheat–maize rotational field experiment in Dezhou, Shandong, found that NT significantly boosted the microbial carbon and nitrogen content of the soil, as well as the diversity index of the soil’s bacterial community, compared to CT [8]. In general, soil enzyme activity is an important factor in soil quality [9]. A nine-year positioning experiment was conducted in a wheat–bean rotation in the drylands of the western Henan Province. The results showed that, in the 0–5 cm soil layer, NT (compared to CT) increased the soil organic matter, total nitrogen, effective phosphorus content, and soil urease, protease, invertase, and alkaline phosphatase activities by 16.7%, 53.2%, 15.9%, 23.6%, 18.0%, 34.7%, and 29.0%, respectively [10].
Most previous studies in the Northeast Black Soil Region have concentrated on physicochemical indicators and were of relatively short duration. As for biological characteristics, few results were shown after long-term conservation tillage. There is a noticeable gap in the research regarding the long-term and integrated effects of NT, including the soil’s physical, chemical, and biological properties. We hypothesize that long-term NT will increase the soil quality compared to CT. To test this, we selected 22 soil quality indicators and employed affiliation functions and the principal component analysis to calculate the values and weights of these indicators after 19 years of no-till with straw mulching and conventional tillage. This will provide a scientific foundation for the wider adoption and application of no-till with straw mulching practices, which can promote the development of sustainable agriculture.

2. Materials and Methods

2.1. Overview of the Study Area

This study selected the Hailun Agricultural Ecosystem (47°26′ N, 126°38′ E), established in Hailun City, Heilongjiang Province, as the platform for long-term field experiments. Table 1 shows the soil properties at the beginning of the test year. Included among these, soil texture was measured using the pipette method, the pipette method is based on Stokes’ law, which states that there is a quantitative relationship between the diameter of soil particles and factors such as settling time, by which soil particles with different diameters can be separated [11]. Nestled in the quintessential black soil region of Northeast China and perched at an elevation of 240 m, this experimental station boasts a characteristically temperate continental monsoon climate. The soil is a typical black, zonal soil developed on a loess-like parent material formed in the Quaternary period [12]. According to the WRB 2022 classification, the soil type in the area is Phaeozems. The area experiences warm and wet summers, in stark contrast to the cold and arid winters. The annual temperature fluctuates between 1.5 and 2.9 degrees Celsius, with annual precipitation ranging from 500 to 600 mm, concentrated between May and September. The annual average effective accumulated temperature is between 2400 and 2500 degrees Celsius, and the average sunshine per year is 2600 to 2800 h, with a frost-free growing period of 120 to 130 days [13].

2.2. Experimental Design

This study was conducted in 2022 based on a long-term experiment initiated in 2004. The CT and NT treatments were arranged in a completely randomized design with three replications in a maize/soybean rotation, planted once a year; the planting pattern remained consistent. The size of each plot was 8.4 × 40 m. In NT, after the autumn harvest, all the straw is pulverized and spread evenly over the soil surface. The following spring, a no-till seeder is used for planting and fertilizing. Chemical weed control is carried out by manually applying herbicides, with no tillage operations or autumn land leveling taking place. In CT, the above-ground biomass was cleared after harvest in October. Subsequently, the soil was prepared for the next planting season by rotary plowing to a depth of 20 cm, with an initial blade setting of 15 cm. Crops were then planted in early May using traditional methods. Post-planting, the soil was turned twice at approximately 15-day intervals to ensure proper aeration and moisture distribution. Except for the plowing differences, all other agronomic practices were standardized across both tillage treatments. The fertilization regimen involved an annual application of 138 kg of nitrogen, 51.75 kg of phosphorus (as P2O5), and 15 kg of potassium (as K2O) for corn; and 20.25 kg of nitrogen, 51.75 kg of phosphorus (as P2O5), and 15 kg of potassium (as K2O) for soybeans. In 2022, the experimental crop was soybeans.

2.3. Sample Collection and Measurement

The soil properties evaluated were bulk density (BD), field water-holding capacity (FC), total porosity (TSP), non-capillary porosity (NCP), water-stable macroaggregate content (WASC), mean weight diameter (MWD), soil organic carbon (TOC), total nitrogen (TN), total phosphorus (TP), total potassium (TK), and available nutrients including ammonium nitrogen (NH4+-N), nitrate-nitrogen (NO3-N), and available phosphorus (AVP). Additionally, enzymatic activities such as catalase (CAT), alkaline phosphatase (AP), sucrase (SUC), and urease (UE) were assessed, along with the microbial biomass carbon (MBC), microbial biomass nitrogen (MBN), and the richness and diversity indices of fungi (FCI, FSI) and bacteria (BCI, BSI).
Soil sampling was conducted during the growing months of June, July, August, and September in 2022. For TOC, TN, TP, TK, NH4+-N, NO3-N, AVP, CAT, AP, SUC, UE, MBC, MBN, FCI, FSI, BCI, and BSI, samples were collected from the following three soil layers: 0–5 cm, 5–10 cm, and 10–20 cm. Each sample was carefully freed from plant-withered material, roots, and other debris before being sealed in plastic bags. A portion of each sample was refrigerated at 4 °C before enzyme and microbial analysis. The rest were air-dried and sieved.
The quantification of BD, FC, NCP, and TSP was performed using the ring knife technique. A sampling spade was used to extract soil samples for the evaluation of water-stable aggregates within the undisturbed soil matrix.

2.3.1. Soil Capacity, Field Water-Holding Capacity, Total Porosity, and Non-Capillary Porosity

The soil bulk density, field water-holding capacity, total porosity, and non-capillary porosity were ascertained by utilizing the ring knife method [14], providing a comprehensive assessment of the soil’s structural integrity and water retention capabilities.
The calculation formula for BD is as follows:
BD = M3/V × 100%.
The calculation formula for NCP is as follows:
NCP = (M1 − M2)/V × 100%.
The calculation formula for TSP is as follows:
TSP = (M1 − M3)/V × 100%.
The calculation formula for FC is as follows:
FC = (M2 − M3)/M3 × 100%.
In the above equations, M1 is the saturated mass of the original soil with water absorption; M2 is the mass of M1 after removing gravity water; M3 is the mass of the soil after drying to a constant mass (unit = grams); and V is the volume of the ring blade in cm3.

2.3.2. Water-Stable Macroaggregate Content and Mean Weight Diameter

The contents of water-stable macroaggregates and the mean weight diameter were determined through the wet sieve method, by employing a soil aggregate analyzer (DIK-2001, Daiki Rika Kogyo Co., Ltd., Saitama, Japan).
The water-stable macroaggregate content (WR0.25) was calculated as follows [15]:
W R 0.25 = i = 1 n w i
The mean weight diameter (MWD) was calculated as follows [15]:
M W D = i = 1 N x i · w i
In the above equations,   x i is the average diameter of agglomerates at level i in mm; w i is the mass percentage of agglomerates at level i; n is the number of total particle size classes; and n is the number of ≥0.25 mm particle size classes.

2.3.3. Soil Organic Carbon and Soil Nutrients

Soil organic carbon levels were quantified using a fully automatic elemental analyzer (EA3000, Euro Vector, Milan, Italy.) after the samples were air-dried and ground through a 0.25 mm sieve. Total nitrogen was measured via the Kjeldahl method, while total phosphorus was assessed using the NaOH melting-molybdenum antimony colorimetric method. Total potassium was determined via NaOH melting-flame photometry. Ammonium and nitrate-nitrogen concentrations were extracted with a 2 mol L−1 KCl solution and analyzed using a SKALAR flow analyzer (Skalar Analytical B.V., Breda, The Netherlands). Available phosphorus was evaluated by the molybdenum antimony resist colorimetric method, shedding light on the nutrient availability in the soil [16].

2.3.4. Soil Enzymes and Soil Microbial Biomass Carbon and Nitrogen

The activities of key soil enzymes, including catalase, sucrase, urease, and phosphatase, were measured using respective volumetric and colorimetric methods. Microbial carbon and nitrogen in the soil were assessed through chloroform fumigation followed by potassium sulfate leaching, and analyzed with a TOC auto analyzer (Toray Engineering D Solutions Co., Ltd., Tokyo, Japan), providing a window into the soil’s biological activity and nutrient cycling processes [17].

2.3.5. High-Throughput Sequencing Analysis

DNA extraction from 0.5 g of frozen soil was performed using a Power Soil DNA Isolation Kit (MoBio Laboratories, Carlsbad, CA, USA). The extracted DNA’s purity and quality were verified using a 1% agarose gel and a NanoDrop spectrophotometer (Thermo Scientific, Waltham, MA, USA). The DNA was then subjected to quantitative analysis and sequencing of 16S and ITS gene amplicons. PCR amplification was conducted on a Mastercycler Gradient (Eppendorf, Hamburg, Germany) with a reaction volume of 25 µL, utilizing 30 ng of template DNA, 12.5 µL of 2x Taq Plus Master Mix, 1 µL of each forward and reverse primer (5 µM), 3 µL of BSA (2 ng/µL), and 7.5 µL of ddH2O. The V3–V4 variable region of the bacterial 16S rRNA gene was amplified with primers 338 F and 806 R, while the ITS region of the fungal 18S rRNA gene was amplified with ITS1F/ITS2R primers. Sequencing was carried out by Beijing Aowegen Technology Co., Ltd. (Beijing, China) using the MiSeq sequencing platform (Illumina, Inc., San Diego, CA, USA), revealing the microbial diversity and community structure within the soil samples [18].

2.4. Composite Index of Soil Fertility Quality

This study employed an affiliation function to normalize and render the soil quality indicators dimensionless, thereby facilitating a standardized comparison across various parameters. The relative significance of each indicator was then determined through principal component analysis (PCA) [19], a statistical procedure that allocates weights based on the common variance among the indicators. With these weights, a composite index of soil fertility quality was calculated through the weighted summation approach. This method provides a holistic measure of soil quality, integrating the diverse attributes of physical, chemical, and biological properties into a single, comprehensive score.

2.4.1. Affiliation Function and Affiliation Value

To conduct a holistic assessment of soil quality, it is essential to standardize the disparate scales of various soil quality indicators. In this study, we utilized the principles of fuzzy mathematics to address this challenge. Specifically, we employed an affiliation function to calculate the degree of membership for each indicator. This function generates a value ranging from 0 to 1, where a value closer to 1 signifies superior soil quality under that particular indicator. This approach effectively normalizes the diverse soil quality indicators, allowing for a more equitable comparison [20]. The mathematical expression of this concept is articulated by the following equation:
F x = x m 1 m 2 m 1   m 1 < x < m 2
where F(x) represents the affiliation value; x represents the measured value of the indicator; and m1 and m2 represent the lower and upper thresholds, respectively.

2.4.2. Establishment of Weights

Principal component analysis (PCA) was used to determine the weights of soil quality indicators and extract their common factor variance (CFV). In this paper, the ratio of the common factor variance of each indicator to the sum of the common factor variances of all indicators was applied as the weight of each soil indicator by the following equation:
W i = a i i n a I ,
where ai represents the variance of the common factor for a single evaluation indicator.

2.4.3. Soil Quality Composite Index

The composite soil quality index SQI was calculated using Equation [21]:
S Q I = i n q i w i
where qi represents the affiliation value of the ith soil quality evaluation indicator and wi represents the weight value of the ith soil quality evaluation indicator. The soil quality index (SQI) ranges between 0 and 1, with higher values indicating higher soil quality.

2.5. Data Calculation and Analysis

Data processing was carried out using Excel 2021. Some graphs were plotted with Origin 2022 software. The p-value was obtained by analyzing the differences between the means with the independent t-test. A clustering operation was performed on the sample sequences via the UPARSE platform, OTU division was performed on all sequences, and Alpha diversity analysis was performed on OTUs at the 97% similarity level. Principal component analysis was performed on the data by using IBM SPSS Statistics 26.0.

3. Results

3.1. Effects of Long-Term Conservation Tillage on Soil Physical Properties

Table 2 shows the content and mean weight diameter of water-stable aggregates between NT and CT. In the 0–20 cm soil layer, there were no significant differences in the contents and mean weight diameters of water-stable aggregates across the two tillage methods. In the 0–5 cm soil layer, the WR0.25 content under NT treatment was 62.1%, an increase of 0.5% compared to CT, and the mean weight diameter increased by 20%. In the 5–10 cm soil layer, the WR0.25 content of NT decreased by 1.7% compared to CT, but the mean weight diameter increased by 5%. In the 10–20 cm soil layer, the WR0.25 content of NT decreased by 4.5% and the mean weight diameter decreased by 7.3% compared to CT.
Figure 1a indicates that the mean soil bulk density for the 0–20 cm layer under NT was consistently higher than that of CT, although the difference was not statistically significant. Moreover, soil bulk density increased with depth, with NT enhancing the soil bulk density by 3%, 8.1%, and 1.2% relative to CT in the 0–5 cm, 5–10 cm, and 10–20 cm layers, respectively. Figure 1b shows that, compared to CT, long-term NT significantly increased the field water-holding capacity in the top 0–5 cm of the soil, with no significant differences observed between the two tillage methods in the 5–20 cm soil layer. At the 0–5 cm depth, NT led to a significant increase of 18.9% in field water-holding capacity compared to CT (p < 0.05). In the 5–10 cm layer, NT increased the field water-holding capacity by 2% compared to CT, and in the 10–20 cm layer, NT decreased the field water-holding capacity by 0.2% compared to CT. Figure 1c reveals that the difference in total soil porosity between NT and CT was minimal at the 0–5 cm and 10–20 cm depths, but a significant difference emerged at the 5–10 cm depth. At the 0–5 cm depth, NT slightly increased the total porosity by 0.6% compared to CT—a minor difference. In contrast, at the 5–10 cm depth, NT significantly reduced the total porosity by 7.6% relative to CT (p < 0.05). At the 10–20 cm depth, NT decreased the total soil porosity by 2.6%. NT significantly decreased the total soil porosity at the 5–10 cm depth, while no significant differences were found between the two tillage practices for the 0–5 cm and 10–20 cm depths. Figure 1d demonstrates that NT comprehensively reduced the non-capillary porosity of the 0–20 cm soil layer compared to CT, with significant reductions in the 0–5 cm and 5–10 cm soil horizons. In the 0–5 cm soil horizon, NT significantly decreased the non-capillary porosity by 41.2% (p < 0.05), and in the 5–10 cm soil horizon, NT significantly decreased it by 34.8% (p < 0.05). In the 10–20 cm soil layer, NT reduced the non-capillary porosity by 12.5%.

3.2. Effects of Long-Term Conservation Tillage on Soil Chemical Properties

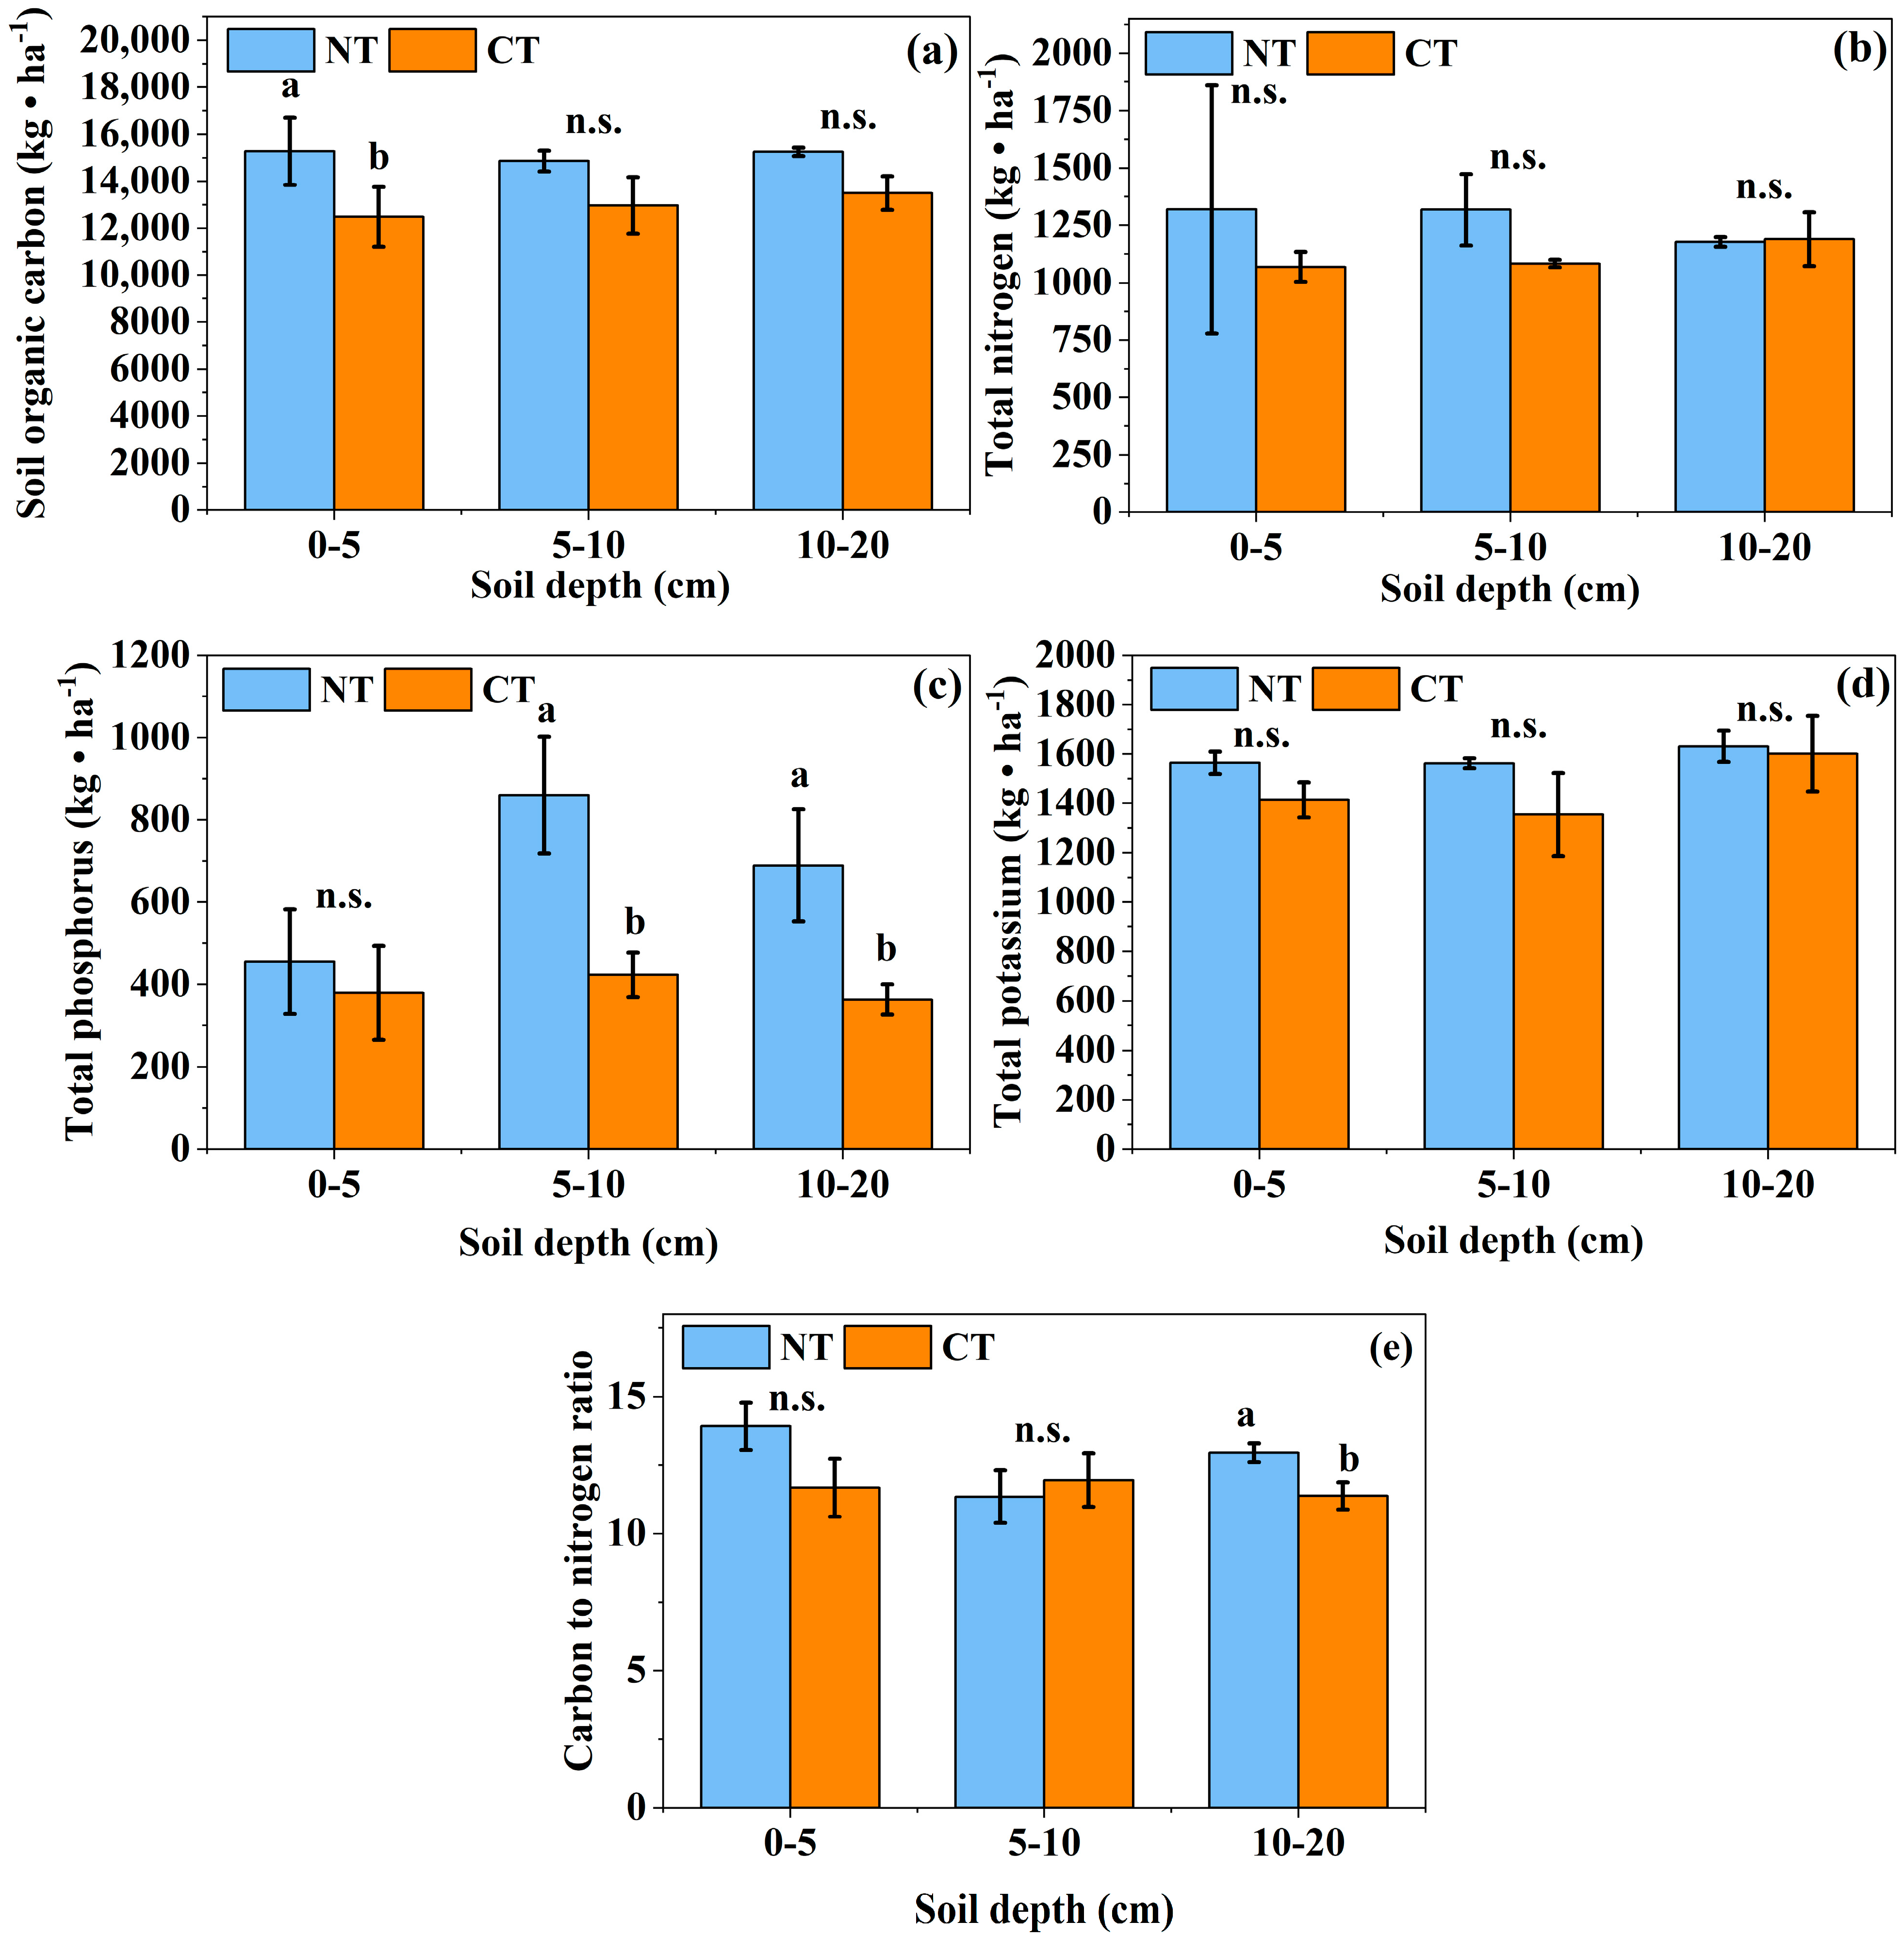
Figure 2a shows that in the 0–20 cm soil layer, NT had a higher organic carbon content than CT, and in the top 0–5 cm layer, the organic carbon contents of the two tillage methods showed a significant difference, with NT significantly increasing the organic carbon content of the soil by 22.3% compared to CT (p < 0.05). In the 5–10 cm soil layer, NT increased the organic carbon content of the soil by 14.6% compared to CT. In the 10–20 cm soil layer, NT increased the organic carbon content of the soil by 13% compared to CT.
Figure 2b–d show that NT improved the soil’s total nutrient content in general compared to CT, with a significant improvement in total phosphorus content in 5–20 cm soil. NT increased the total nitrogen content by 23.4% compared to CT at a 0–5 cm soil depth and by 21.6% in the 5–10 cm layer; but decreased it by 1% in the 10–20 cm layer. The total phosphorus content in the soil did not differ significantly between the two tillage practices at 0–5 cm, although NT increased by 19.8% compared to CT; at 5–10 cm, NT treatments led to a significant (p < 0.05) increase in total phosphorus content by 103.2% (p < 0.05) compared to CT, and a significant (p < 0.05) increase of 89.9% (p < 0.05) at 10–20 cm. The difference in the total potassium content in the soil between the two tillage methods was small, with NT increasing it by 10.7% in the 0–5 cm soil layer, 15.3% in the 5–10 cm soil layer, and 1.8% in the 10–20 cm soil layer, compared to CT.
Figure 2e shows the difference in carbon and nitrogen ratios between NT and CT. It can be seen that, in the 0–5 cm soil layer, the carbon and nitrogen ratios of NT increased by 19.2% in comparison to CT, which was not a significant difference. In the 5–10 cm soil layer, the carbon-to-nitrogen ratio of NT decreased by 5.1% compared to CT—an insignificant difference. In the 10–20 cm soil layer, the NT carbon and nitrogen ratios increased significantly, by 13.8% compared to CT (p < 0.05).
Figure 3a–c show that the quick nutrient contents in the soil were generally higher under NT; the three quick nutrient contents in the soil reached significant differences in the top 0–5 cm of the soil, while the differences in nutrient contents throughout the rest of the soil depths were not significant. Compared with CT, NT significantly increased the soil’s ammonium nitrogen content by 29.1% (p < 0.05) in the 0–5 cm soil layer, by 16.4% in the 5–10 cm layer, and by 7.4% in the 10–20 cm soil layer. NT significantly increased the soil’s nitrate-nitrogen content by 147.5% (p < 0.05) compared to CT in the 0–5 cm soil layer and by 58.5% in the 5–10 cm soil layer; for the 10–20 cm soil layer, however, NT reduced the nitrate-nitrogen content by 15.6% compared to CT. NT also significantly elevated the quick phosphorus contents in the soil by 85% (p < 0.05) in the 0–5 cm soil layer and by 20.6% in the 5–10 cm soil layer, but reduced the quick phosphorus content by 9.8% in the 10–20 cm soil layer.

3.3. Effects of Long-Term Conservation Tillage on the Biological Properties of Soil

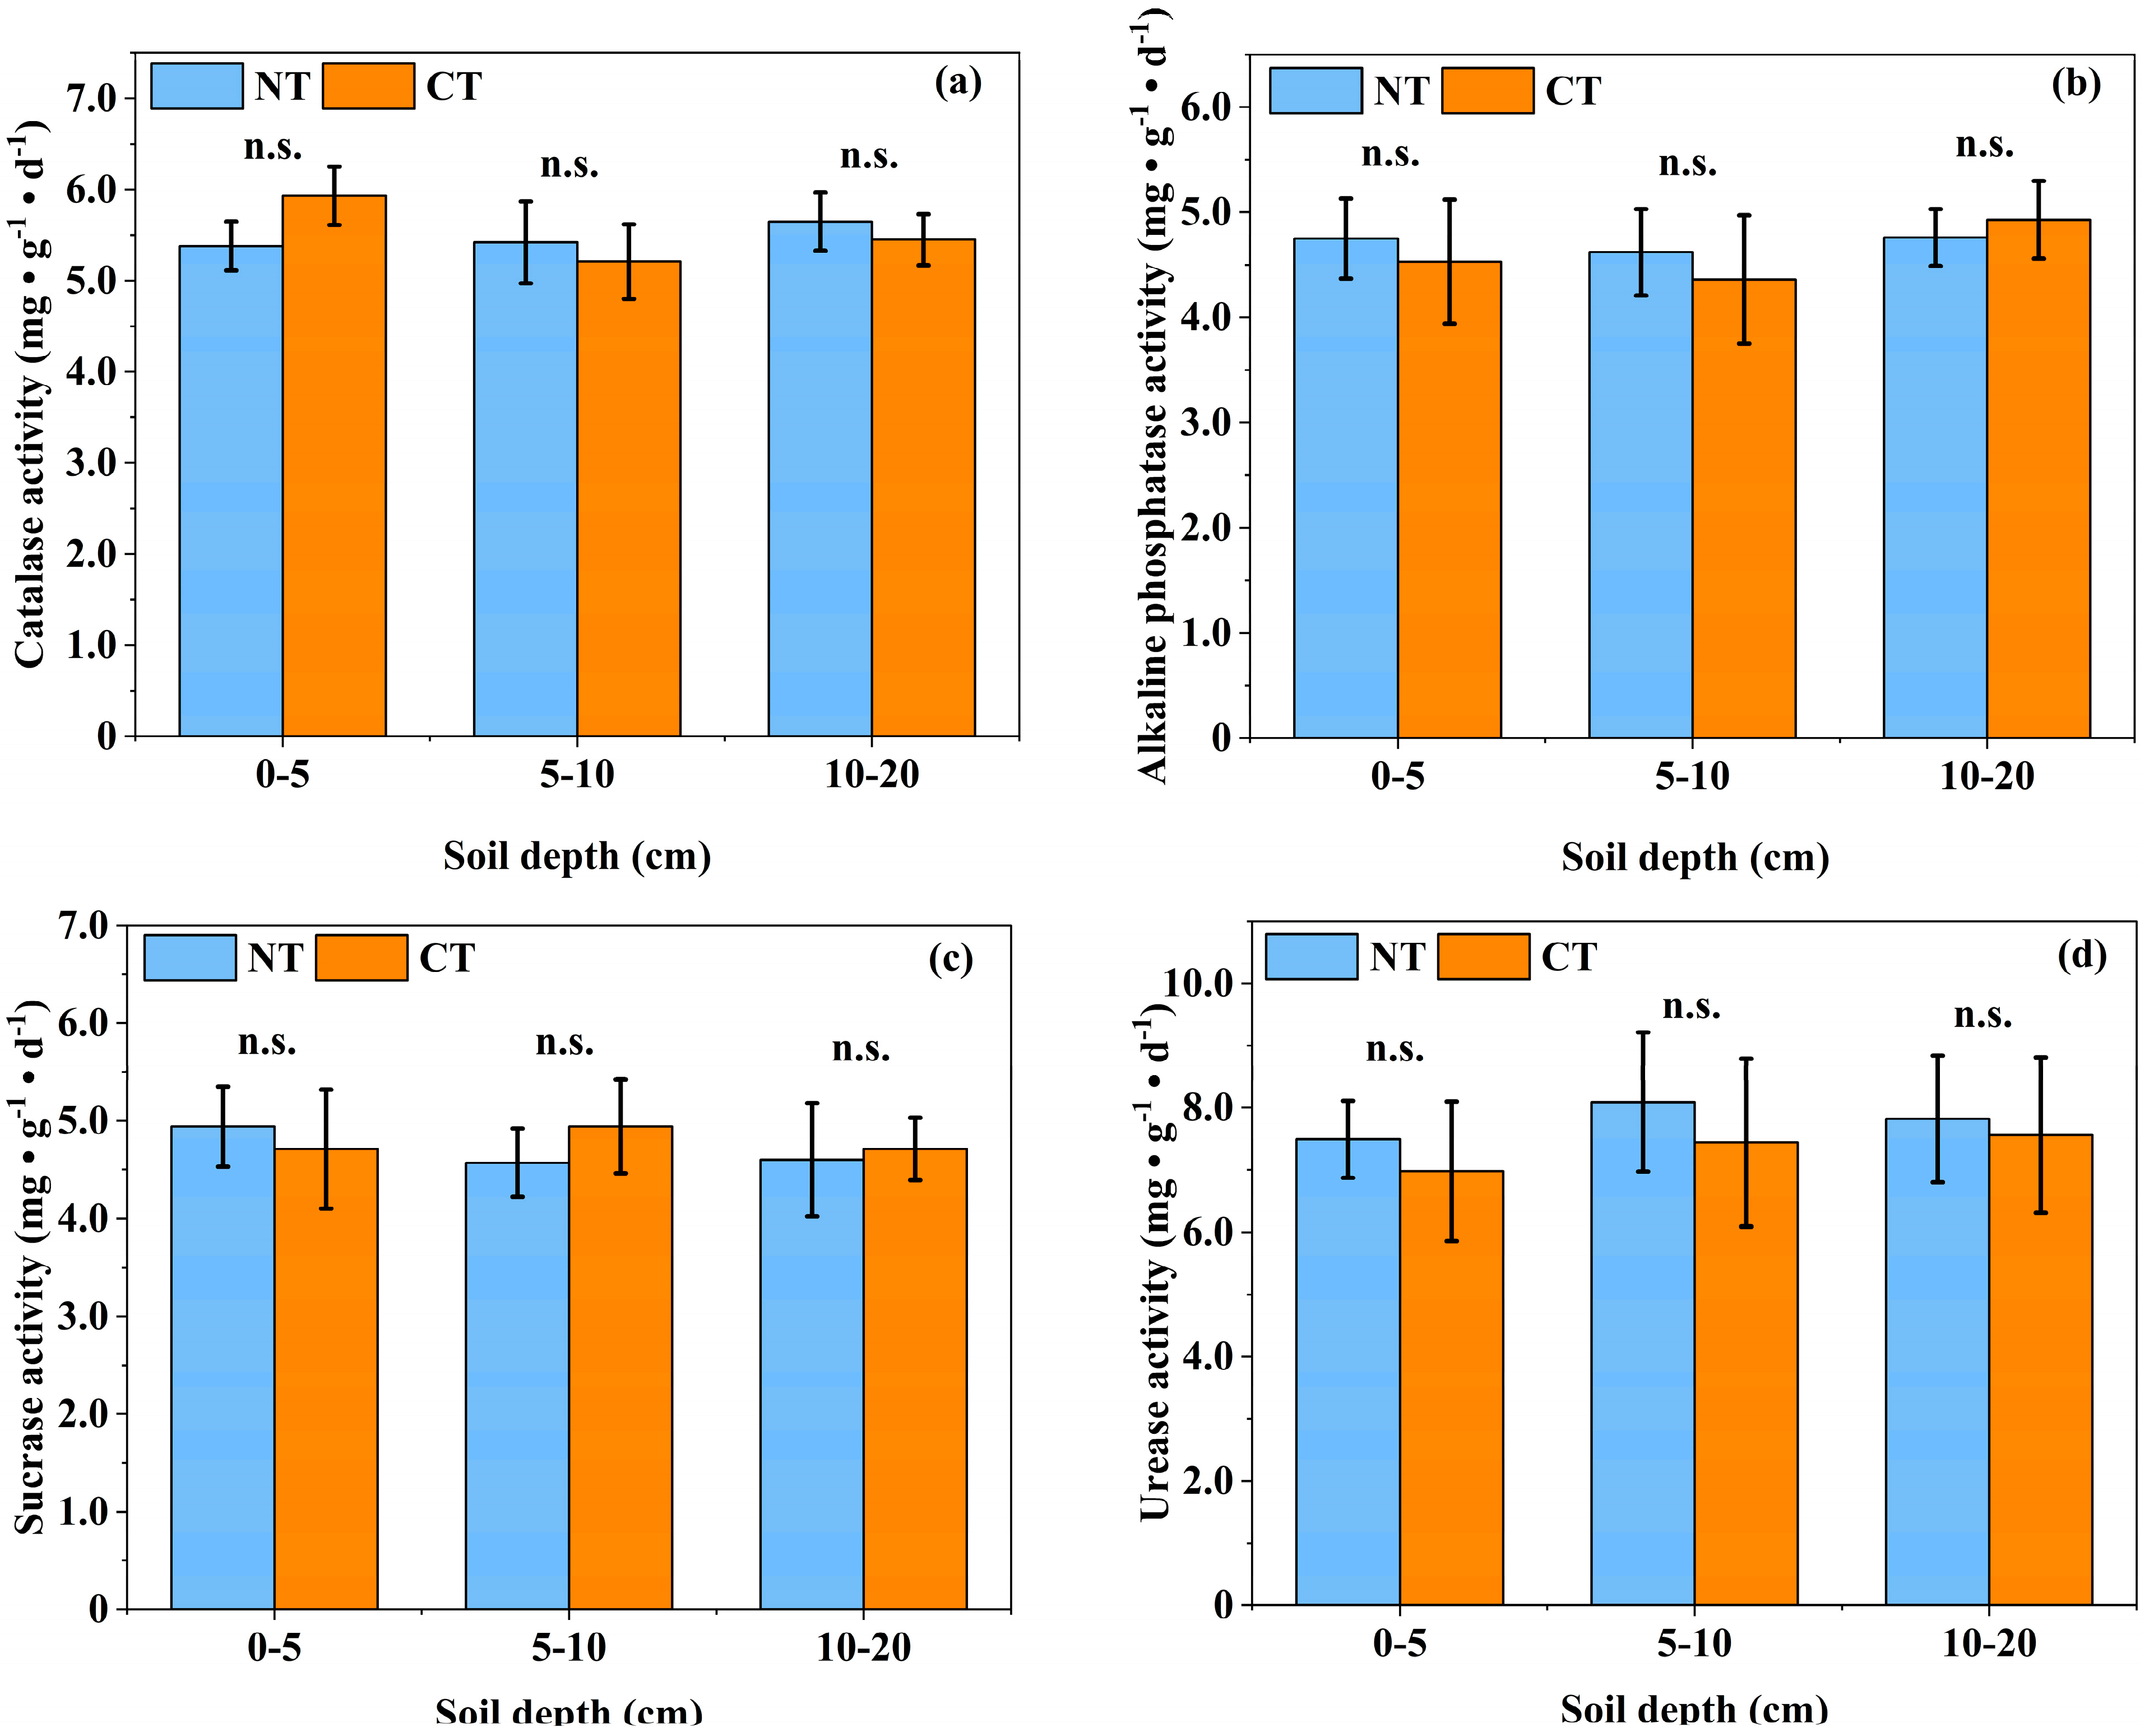
Figure 4 presents a comparative analysis of the enzyme activities in the soil between long-term NT and CT practices. Overall, the differences in enzyme activities were not statistically significant, with NT having a slight edge over CT. As depicted in Figure 4a, the soil catalase activities varied marginally between the two tillage methods, with no significant distinctions across all soil depths. Specifically, in the 0–5 cm layer, NT modestly reduced the catalase activity by 9.3% relative to CT. In contrast, NT slightly elevated the catalase activity by 4% in the 5–10 cm layer and by 3.7% in the 10–20 cm layer, yet these increases did not achieve statistical significance. Figure 4b illustrates that the alkaline phosphatase activity remained largely unaffected by tillage practices across the 0–20 cm soil layer. NT modestly heightened the alkaline phosphatase activity by 4.9% in the 0–5 cm layer and by 6% in the 5–10 cm layer, both without reaching statistical significance. Conversely, in the 10–20 cm layer, NT led to a minor (3.5%) decrease in alkaline phosphatase activity compared to CT, which was also not statistically significant. Figure 4c indicates that the soil sucrase activity did not significantly differ between NT and CT. NT slightly increased the sucrase activity by 4.9% in the 0–5 cm layer, while causing a slight decrease in the 5–10 cm and 10–20 cm layers of 7.5% and 2.3%, respectively, in comparison to CT, but these changes were not statistically significant. Lastly, Figure 4d demonstrates that urease activity was generally consistent between the two tillage practices, with NT causing slight increases of 7.3%, 8.7%, and 3.4% in the 0–5 cm, 5–10 cm, and 10–20 cm layers, respectively, over CT. These variations, however, did not attain statistical significance.
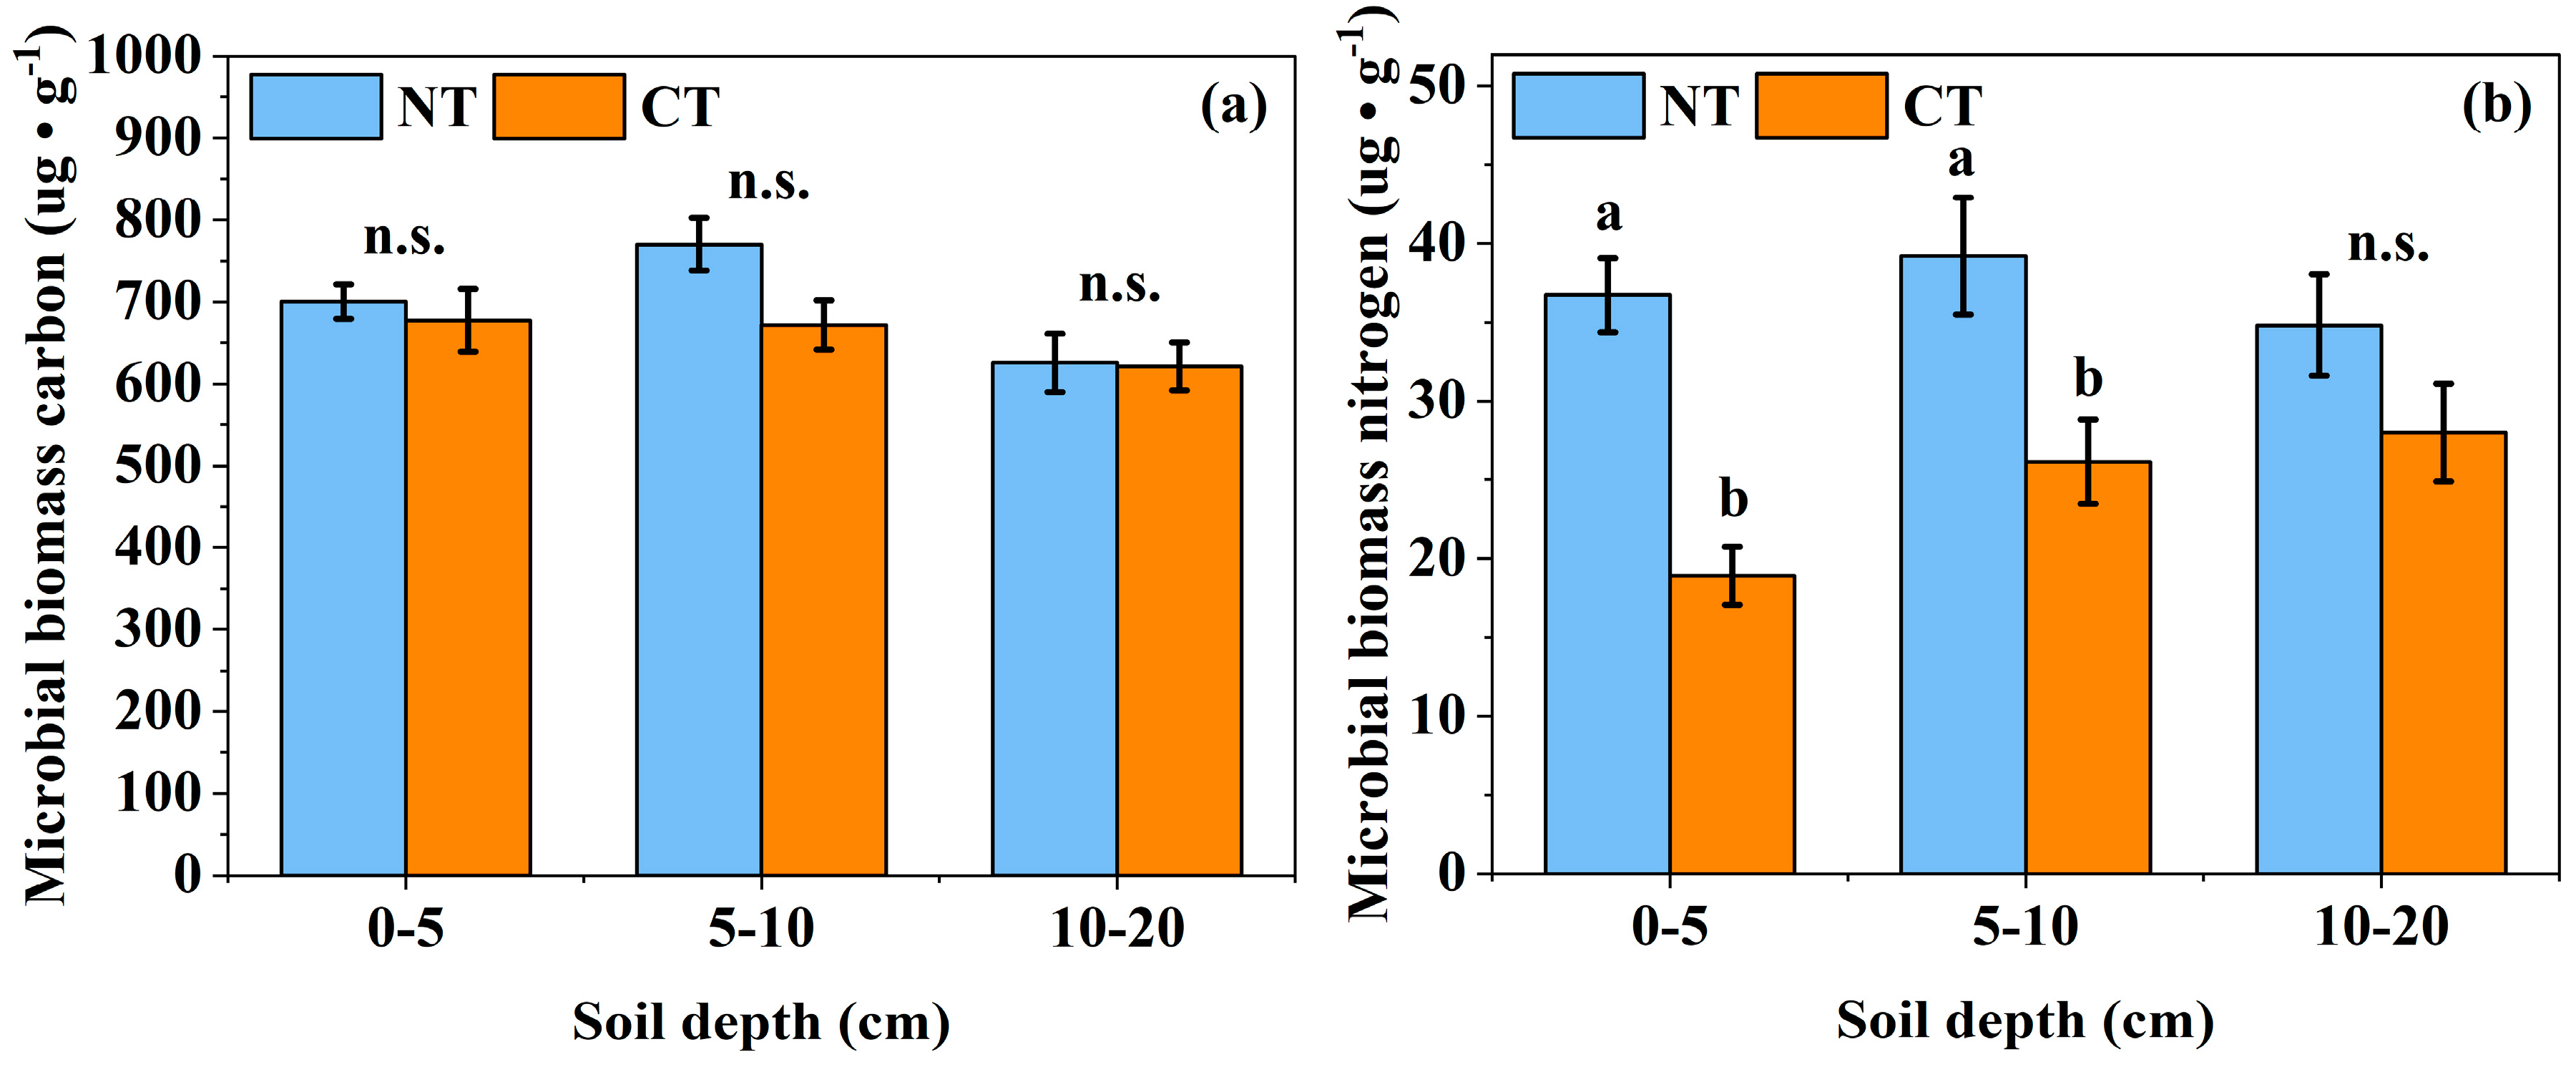
Figure 5 presents a comparative analysis of the microbial biomass carbon and nitrogen contents in soil between long-term NT and CT practices. Notably, long-term NT was beneficial in enhancing both soil microbial biomass carbon and nitrogen, with particularly pronounced effects in the upper 0–10 cm soil layer, where NT led to significantly higher microbial biomass nitrogen compared to CT. As illustrated in Figure 5a, no significant differences were observed in the microbial biomass carbon content in soil between the two tillage methods. However, NT slightly increased the microbial biomass carbon contents by 3.4%, 14.7%, and 0.8% in the 0–5 cm, 5–10 cm, and 10–20 cm soil layers, respectively, albeit not reaching statistical significance. Figure 5b more distinctly shows the impact of NT on the microbial nitrogen content. NT significantly elevated the microbial biomass nitrogen content by 94.2% in the 0–5 cm soil layer (p < 0.05) and by 50% in the 5–10 cm soil layer (p < 0.05), both compared to CT. Additionally, in the deeper 10–20 cm layer, NT increased the microbial biomass nitrogen content by 24.4%, although this increase was not statistically significant.
As seen in Table 3, there were no significant differences in the fungal Chao1 index and the Shannon index between NT and CT across all soil layers. For bacteria, there were no significant differences in the Chao1 index across the soil layers, but in the 5–10 cm soil layer, the Shannon index of NT was significantly lower than that of CT (p < 0.05).

3.4. Evaluation of Soil Quality

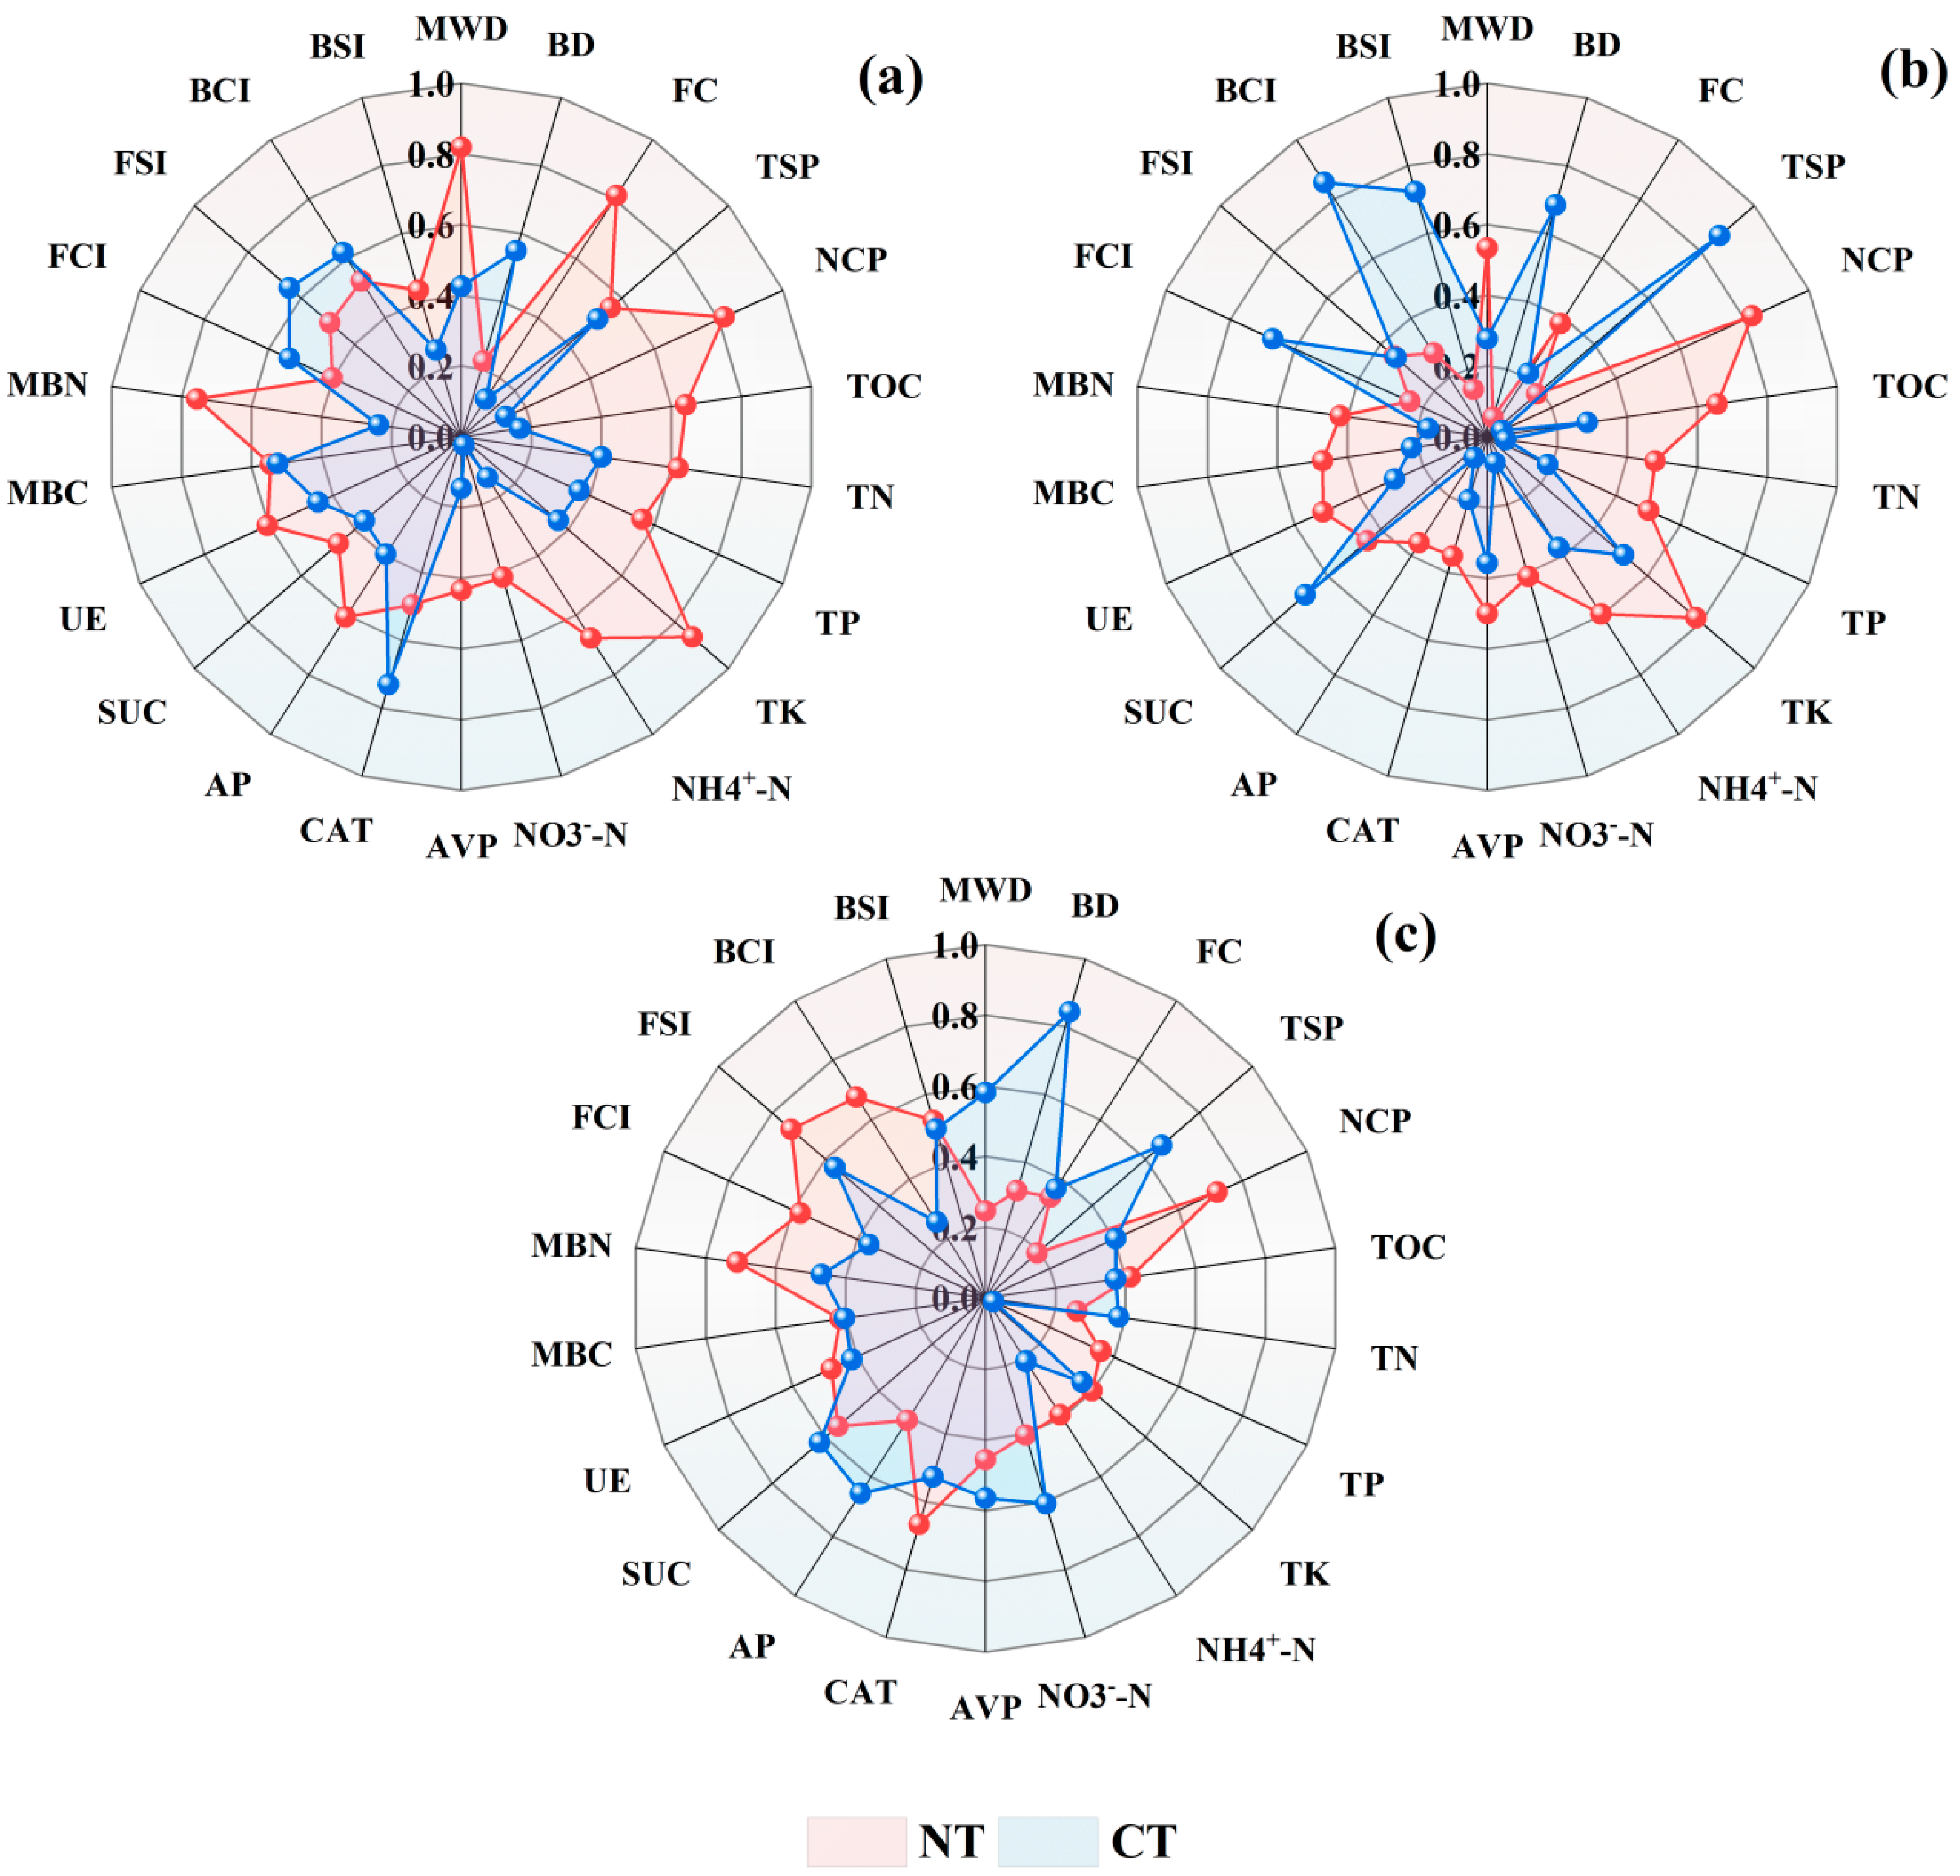
The soil quality assessment, as depicted in Figure 6, utilizes the affiliation function values of various soil indicators under different long-term tillage practices for distinct soil layers. Figure 6a illustrates that, in the 0–5 cm soil layer, NT outperformed CT in nearly all physical property indicators, except for the bulk density index, where NT showed a slightly lower affiliation value. In terms of chemical properties, NT demonstrated superior affiliation values across all measured indices. Regarding biological properties, enzyme activity indices, except for catalase, were more favorable in NT, and bacterial diversity indices also indicated better performance in NT compared to CT. Figure 6b reveals that, within the 5–10 cm soil layer, physical property indicators, such as bulk density, total porosity, and non-capillary porosity, showed lower affiliation values for CT. Conversely, chemical property indicators and microbial biomass carbon and nitrogen indices were more positively affiliated with NT. Enzyme activities, particularly sucrase, showed a higher affiliation with CT, while microbial diversity indices were slightly more favorable in CT. Figure 6c demonstrates that, in the deeper 10–20 cm soil layer, all physical property indicators exhibited higher affiliation values for CT. In terms of chemical properties, indices like organic carbon, total nutrients, and ammonium nitrogen showed affiliation values closer to the baseline, suggesting a less favorable state. However, nitrate-nitrogen and available phosphorus indices indicated a better affiliation with CT. In biological properties, enzyme activity indices, except for catalase and urease, which showed a higher affiliation with NT, were generally higher for CT. Microbial biomass carbon and nitrogen, as well as microbial alpha diversity, showed a stronger affiliation with NT.
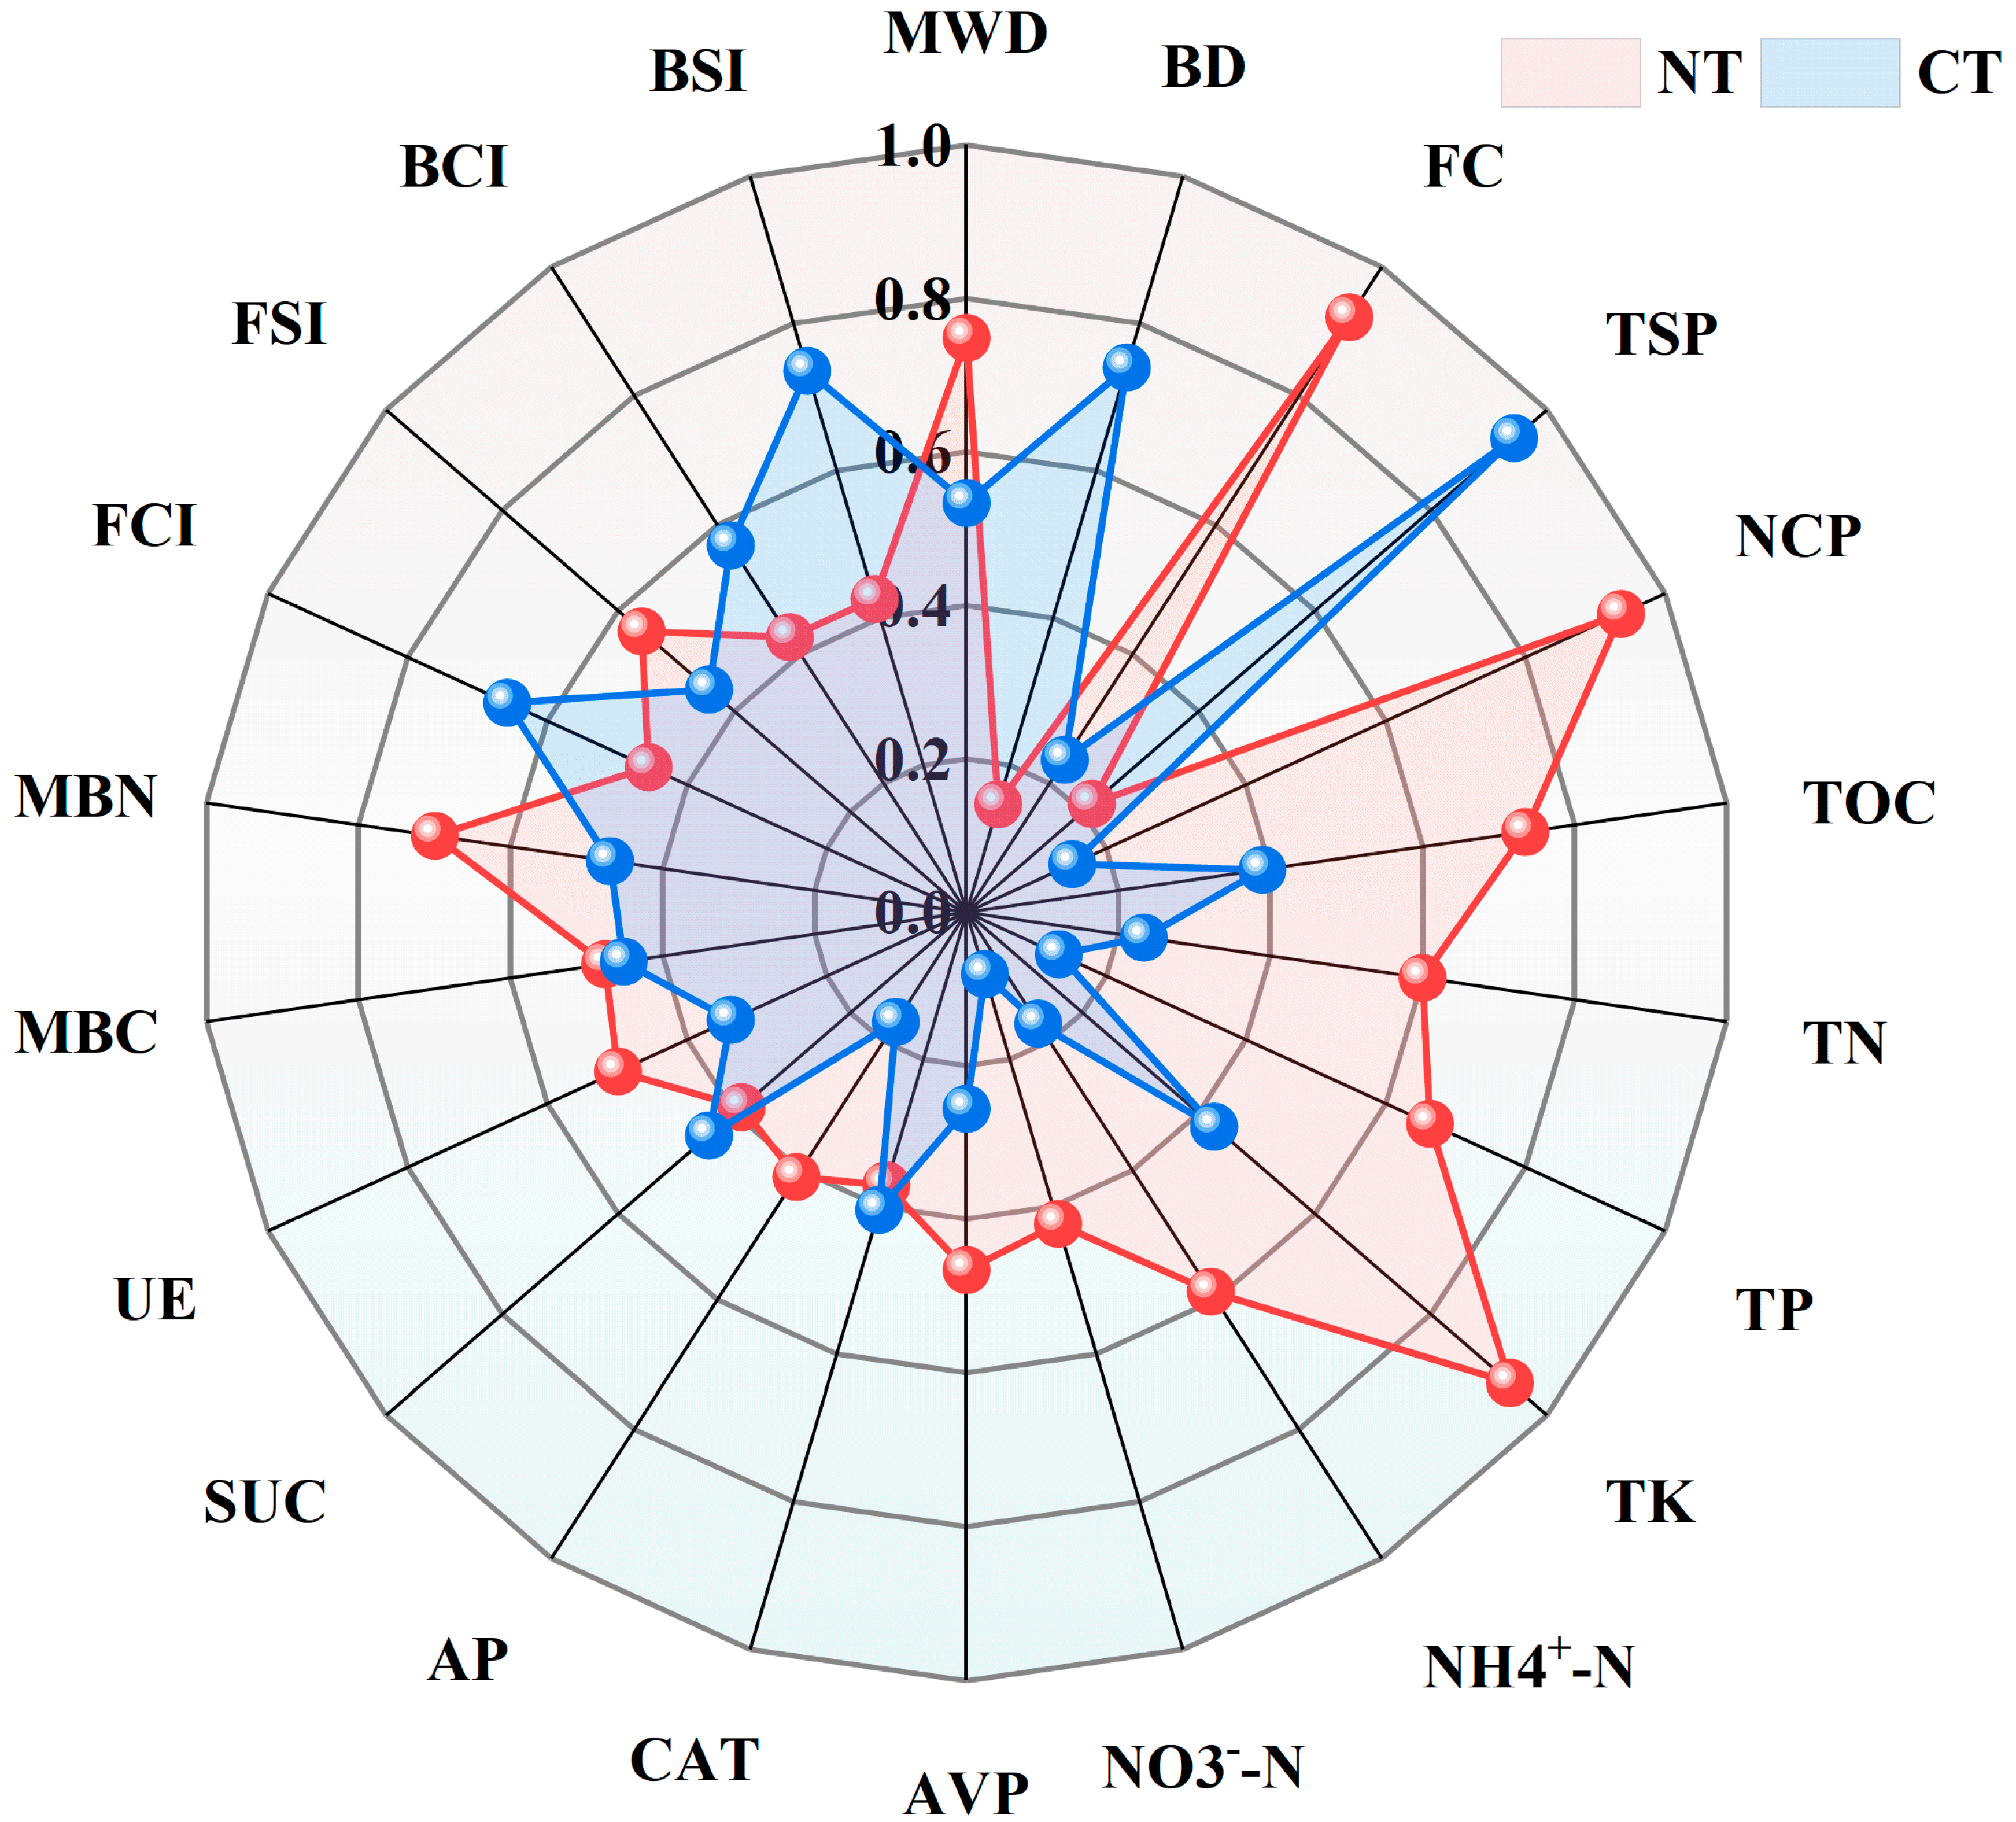
Figure 7 presents a comprehensive view of the affiliation function values for soil quality indicators within the 0–20 cm soil layer under various long-term tillage practices. In terms of soil physical properties, the data indicate that NT practices resulted in lower affiliation values for bulk density, total porosity, and non-capillary porosity compared to conventional tillage CT. However, NT demonstrated superior performance for the remaining physical property indicators. In terms of soil chemical properties, NT practices yielded higher affiliation values for organic carbon, total nutrients, and available nutrients, suggesting a more favorable chemical environment for soil health and fertility. Regarding the biological properties of soil, the overall difference in enzyme activity affiliation values between NT and CT was not statistically significant. Notably, the microbial biomass nitrogen content under NT showed a higher affiliation value, indicating a richer microbial biomass under NT conditions. In terms of microbial alpha diversity, except for fungal diversity, where CT exhibited greater values than NT, the other biological indicators favored NT.
In practice, however, the indicators have different degrees of influence on the soil quality, so different weights need to be assigned to each indicator in order to achieve a comprehensive assessment of the soil quality.

3.5. Soil Quality Index

In order to compare the soil quality status under different tillage measures, 22 soil fertility indicators were selected in this paper. The affiliation function was used to calculate the affiliation value of individual indicators, a principal component analysis was used to determine the weights of the indicators, and finally, summation and multiplication in fuzzy mathematics were used to calculate the comprehensive index of soil quality. A total of five principal components with eigenvalues greater than 1 were extracted from the 22 evaluation indexes, and the cumulative contribution rate reached 100%, which met the requirements of information extraction (Table 4). The weights of the indicators were then obtained by calculating the ratio of the variance of the common factor to the total variance (Table 4).
A composite soil quality index was calculated by substituting Equation (5) based on the affiliation values (Figure 7) and weights (Table 4) of each indicator. (SQINT = 0.55, SQICT = 0.41). NT improved the soil quality composite index by 34.2% compared to CT, and NT had better soil quality than CT at the 0–20 cm soil depth.

4. Discussion

4.1. Effect of Long-Term Conservation Tillage on the Physical Properties of Soil

Conservation tillage practiced over an extended period has been instrumental in enhancing the soil’s structural integrity. Specifically, 18 years of continuous conservation tillage have led to a marked improvement in the content of WR0.25 within the 0–5 cm surface layer, as well as an increase in the mean weight diameter of the black soil farmland. These changes have bolstered the stability of soil aggregates, particularly hydromorphic ones, surpassing the effects achieved with CT. One significant factor contributing to these improvements is the reduction in human-induced disturbances through NT straw mulching practices. This approach minimizes the disruption of soil aggregates typically caused by mechanical operations [22]. Additionally, the NT method facilitates the transportation and accumulation of organic matter in the soil surface layer [23], which, in turn, positively influences the formation and stability of water-stable macroaggregates [24]. Soil bulk density, a critical physical property, provides insights into the soil’s pore space, looseness, and fertility—key indicators of soil’s physical health [25]. While initial studies [26] suggested that NT straw mulching might lead to increased soil bulk density, more recent research [27] indicates a declining trend in density with prolonged implementation of NT. Notably, after seven years of NT, the soil bulk density has decreased to levels not significantly different from those of CT. Consistent with these findings, our study’s 18-year analysis reveals no significant differences in soil bulk density between NT and CT. This suggests that the continuous application of straw mulching in NT can gradually reduce soil bulk density, fostering the development of a stable and robust soil structure. Consequently, continuous straw mulching with NT is pivotal for enhancing soil bulkiness and preventing soil compaction. The field water-holding capacity of soil is a crucial measure of its maximum water retention potential. Research has demonstrated that the combination of NT with straw mulching effectively prevents soil exposure, thereby minimizing surface water evaporation and enhancing the soil’s water and moisture retention capabilities [28]. This treatment also enriches the soil surface layer with large-grained, water-stable aggregates, which further boosts the soil’s water-holding capacity. In our study, NT significantly increased the field water-holding capacity of the top soil layer by 18.8% (p < 0.05) compared to CT, with no significant impact observed below 5 cm. This result aligns with previous studies, indicating that NT straw mulching effectively amplifies the water-holding capacity of the soil surface layer. Soil porosity, a vital indicator of soil structure, was also examined. Conventional tillage can increase soil porosity due to the disruption of the native soil structure, leading to the creation of numerous fragmented pores [29]. Additionally, it has been illustrated that returning straw to the field can significantly increase soil porosity by 8.6% to 15.7% [30]. After 18 years of NT straw mulching in this study, no significant differences in total soil porosity were detected between NT and CT at the 0–5 cm depth. This can be attributed to the straw mulch on the NT plots, which improved the top soil layer’s porosity, offsetting the increased pore formation due to CT’s disruptive effects. However, at the 5–10 cm depth, NT led to significantly lower soil porosity compared to CT, a result of the natural settling of soil under NT leading to a denser particle arrangement and reduced porosity. Regarding non-capillary porosity, this study found that NT reduced it across the 0–20 cm soil layer compared to CT, with significant reductions in the 0–10 cm layer. This reduction is attributed to the barrier effect of the straw mulch on the soil surface under NT, which limits air penetration and thus non-capillary porosity formation. In contrast, CT practices, particularly rotary plowing, loosen the soil and enhance air circulation, promoting the formation of additional non-capillary pores.

4.2. Effects of Long-Term Conservation Tillage on the Chemical Properties of Soil

The practice of long-term conservation tillage significantly bolsters the levels of soil organic carbon and the overall nutrient content. Soil organic carbon serves as a pivotal indicator of soil quality, influencing the availability of other essential nutrients within the soil. Tillage practices, particularly conservation tillage, have been shown to markedly affect soil organic carbon levels [31]. This study revealed that NT notably increased the organic carbon content in the 0–5 cm surface layer compared to CT, aligning with previous research findings [32,33]. The straw mulch applied under NT conditions decomposes, enriching the soil surface with organic carbon through the activity of soil microorganisms [34]. In contrast, CT practices often remove the straw post-harvest, diminishing the soil’s organic carbon input. Soil total nutrient content is a key indicator of soil’s fertility and capacity to supply necessary nutrients. Studies have indicated that NT consistently delivers higher total nitrogen content across all soil depths compared to rotary tillage [35,36], with the soil’s total nitrogen, phosphorus, and potassium content increasing over the years with continued NT implementation. Our findings echo these observations, with NT plots exhibiting higher total nitrogen, phosphorus, and potassium levels than CT. Notably, the total potassium content at the 5–20 cm depth under NT showed a significant difference, attributed to the long-term application of straw mulch and its return to the field, which enriches the soil’s nutrient pools [37,38]. Xiao et al. [39] demonstrated that, after a decade of NT, soil fertility showed considerable improvement compared to pre-conservation tillage conditions, with higher levels of total nitrogen, phosphorus, potassium, and readily available nitrogen and phosphorus in NT-treated soils. This study also found that NT increased the levels of ammonium nitrogen, nitrate-nitrogen, and available phosphorus in the 0–10 cm soil layer compared to CT, with particularly significant enhancements in the 0–5 cm layer’s nutrient availability, corroborating earlier studies [40,41]. This may be due to the fact that organic matter can adsorb soil phosphorus and nitrogen, and conservation tillage, while increasing soil organic carbon, can adsorb more phosphorus and nitrogen, and thus enhance the availability of phosphorus and nitrogen. The carbon-to-nitrogen ratio is a very important parameter in soil quality assessment; it reflects the quality and health of the soil by revealing soil fertility, microbial activity, physical properties, and many other aspects [42]. A study to investigate the differences in carbon and nitrogen ratios under conventional and conservation tillage in the Loess Plateau region of Longzhong, China, using a combination of outdoor positional field experiments and indoor indicator measurements, showed that conservation tillage significantly increased carbon and nitrogen ratios compared to conventional tillage [43]. This is similar to the results of the 10–20 cm soil layer in this study; however, there were no significant differences in the carbon-to-nitrogen ratio at 0–10 cm between the two tillage practices in this study. This may be due to the fact that no-tillage straw mulching alters the soil porosity, and changes in soil porosity affect the oxygen supply, water retention, and microbial habitat in the soil, which in turn affects the processes of carbon and nitrogen transformations in the soil [44]. In the shallower 0–10 cm soil layer, this change in porosity may not be sufficient to cause a significant difference in the carbon and nitrogen ratios, but in the 10–20 cm soil layer, as the change in porosity accumulates, it may have a significant effect on the carbon and nitrogen ratios.

4.3. Effects of Long-Term Conservation Tillage on the Biological Properties of Soil

Long-term conservation tillage increased microbial nitrogen. Soil enzyme activity serves as a key indicator of soil quality, reflecting the diverse impacts of various tillage practices on the soil ecosystem [45,46]. Specifically, soil catalase is a crucial measure of biological activity and the metabolic vigor of crops, while alkaline phosphatase is integral to the mineralization of organic phosphates, driving the cycle of soil phosphorus and its transformation into bioavailable forms. Sucrose activity is closely linked to the turnover of soil organic carbon, and urease activity is essential for the decomposition of urea and other nitrogen-rich organic compounds in the soil [47]. After 19 years of NT straw mulching, the results showed that there were no significant differences in the activity of four soil enzymes between the two tillage methods. Initially, the minimal human intervention associated with NT could lead to increased soil bulk density, soil compaction, and reduced oxygen content, all of which could potentially hinder the proliferation of soil microorganisms and, by extension, affect soil enzyme activities. However, the extended duration of NT in our experiment resulted in a gradual annual decrease in soil bulk density, accompanied by a resurgence in soil microbial populations. This rebound in microbial activity appears to have counterbalanced the initial negative effects on enzyme activities, leading to no significant disparity in enzyme activities between the two tillage systems. Soil microbial biomass carbon represents the most dynamic and active component of the soil carbon profile, serving as a vital bioindicator of soil’s biological characteristics [48]. Microbial biomass nitrogen, constituting 1% to 5% of the total soil nitrogen [49], acts as a critical reservoir of active nitrogen, essential for various soil functions. The content of these microbial components is highly susceptible to environmental changes and human-induced disturbances, making them key indicators of soil quality. Our findings echo a previous study [50] that demonstrated that conservation tillage practices, such as NT, significantly increased the levels of microbial carbon and nitrogen in the soils of the Black River Basin’s irrigated fields. Similar results were observed in another study [51], which reported higher microbial carbon and nitrogen contents in the 0–30 cm soil layer under NT with straw return compared to CT. Consistent with these studies, our research also found that the soil microbial biomass carbon and nitrogen content was greater under NT than CT across all soil depths, with a particularly significant increase in the 0–10 cm layer. This enhancement can be attributed to the nutrient-rich environment created by the straw mulch in NT, which provides an ideal habitat for the growth and proliferation of soil microorganisms. The practice of returning straw to the field not only fosters root growth but also boosts the soil’s microbial population and hastens the soil nutrient cycle. The active role of microorganisms in farmland ecosystems is well documented, and their diversity and function are reflective of the ecosystem’s health. By maintaining a high microbial biomass, NT practices contribute to a more vibrant and efficient soil ecosystem, underscoring the importance of conservation tillage in sustainable agriculture. Microorganisms are integral to the health and functionality of farmland ecosystems, with their structural and functional diversity indicating the condition of these ecosystems. A previous study [52] highlighted that, in the black clay soil regions of northwest China, the application of conservation tillage practices, particularly NT following straw return, can lead to a significant increase in soil organic matter. This practice not only optimizes the soil’s physicochemical properties but also reduces soil evaporation accelerates crop growth and metabolic processes, and enhances root exudation, thereby fostering a more diverse microbial community. Consistent with these findings, other studies [53,54] have demonstrated that NT practices can significantly elevate the soil microbial richness index, Simpson index, and Shannon index compared to CT. These indices are critical metrics for assessing the richness and evenness of microbial populations, indicating a more robust and balanced ecosystem under NT. However, our study diverges slightly from these previous findings. While the overall soil microbial richness after 18 years of NT practice was not significantly different from CT, a notable reduction in bacterial species diversity was observed in the 5–10 cm soil layer under NT. This suggests that long-term NT could potentially exert adverse effects on soil bacterial diversity. The reduced porosity at the 5–10 cm depth under NT could limit oxygen availability, thereby impacting the respiration and metabolic activities of soil bacteria. Such conditions may not be conducive to bacterial reproduction, leading to a marked decrease in bacterial diversity at this depth compared to CT.

4.4. Effects of Different Tillage Practices on Soil Quality Index

The effects of different managements on soil quality can be assessed using a composite index. Wang et al. [55] applied factor analysis to categorize 9 soil quality factors into three key dimensions, determining that a combined strategy of tillage and mulching was most effective for soil quality enhancement. Miao et al. [56] leveraged a cluster analysis to separate a comprehensive dataset, evaluating the impact of tillage integrated with organic fertilizers on soil strata in a holistic manner. While various techniques are available for an exhaustive soil quality assessment, a universally accepted standard is lacking. This is primarily due to the challenge of achieving both precision and ease of use with the same method [57]. The affiliation function addresses this by standardizing the measurement scale of soil quality indicators, enabling comparative analysis [58]. Radar charts provide a visual representation that clearly delineates the status of multiple indicators. An indicator’s radial distance from the chart’s origin on any axis indicates its condition, with greater distances signifying better status. Consequently, a larger polygonal area on the chart corresponds to higher overall quality [59,60]. Figure 6 illustrates that, at the 0–5 cm depth, the radar chart area encompassing NT treatments is substantially larger than that for CT. This indicates that the aggregate condition of soil indicators in the topsoil layer is superior under NT compared to CT. Except for soil density, physical and chemical soil indicators also favor NT over CT. With increasing soil depth, the disparity in radar chart areas between the two tillage methods narrows at the 5–10 cm and 10–20 cm depths. The convergence of soil quality index levels at these depths under both tillage methods suggests the diminishing influence of tillage practices on soil quality with depth. However, it is apparent that NT is particularly adept at improving the quality of the top 0–5 cm soil layer, which is crucial for optimal soil health and, by extension, the growth of crops. Figure 7 provides a clear comparison between NT and CT practices, revealing that the soil chemical property indexes under NT are not only favorable but also superior to those under CT across the entire 0–20 cm soil layer. This suggests that the nutrient status of the soil is enhanced under NT, potentially offering more substantial benefits for crop growth. The elevated affiliation values for indicators such as mean weight diameter, field water-holding capacity, non-capillary porosity, microbial nitrogen, total nutrients, and available nutrients under NT, as opposed to CT, underscore the improved condition of these soil qualities with NT. Conversely, the lower affiliation values for bulk density and total porosity under NT indicate that these factors may act as limiting agents for soil quality in the study area. The multifaceted nature of soil quality is influenced by numerous factors, making it crucial to identify those that significantly affect soil health to conduct a scientifically rigorous and efficient comprehensive evaluation. In this study, principal component analysis was employed to calculate the weights of various soil indexes, revealing that organic carbon, catalase activity, fungal abundance, and bacterial diversity indexes carry substantial weight. This suggests that the soil is highly responsive to these particular indicators and that tillage practices can induce changes in the soil’s physicochemical and biological characteristics by influencing these sensitive indexes, thereby enhancing the overall soil quality. The findings from the soil quality composite index corroborate previous research [61,62], demonstrating that the consistent application of conservation tillage, such as NT, has a markedly positive impact on the quality of black soil in Northeast China. These results underscore the importance of sustainable agricultural practices in maintaining and enhancing soil health.

5. Conclusions

In this experiment, NT compared to CT did not significantly change the soil bulk density, but it did significantly increase the field water-holding capacity of the soil surface and reduced the total porosity and non-capillary porosity of the soil. NT had a more noticeable positive effect on soil nutrients, significantly increasing the organic carbon content in the soil surface and comprehensively improving the total and available nutrients in the soil. NT also improved the microbial carbon and nitrogen content of the soil but significantly reduced the bacterial species diversity in the 5–10 cm soil layer. The impact of NT on soil enzyme activity was minimal. According to the calculations of the membership degrees of various indicators, compared with CT, the membership degrees of the mean weight diameter, field water-holding capacity, non-capillary porosity, microbial biomass nitrogen, total nutrients, and available nutrients indicators were higher under NT treatment, indicating that the soil quality conditions of these indicators were better. The weight calculation indicated that organic carbon, catalase activity, fungal richness, and bacterial diversity indicators accounted for a larger proportion and were important factors affecting soil fertility quality. In terms of the comprehensive index of soil fertility quality, NT increased the soil quality comprehensive index by 34.2% compared to CT, and the soil quality under NT was superior to CT at a depth of 0–20 cm. To date, most studies on conservation tillage patterns for black soil have been characterized by short duration and intermittent implementation. This study has a longer and continuous duration, so can more objectively and comprehensively reflect the impact of conservation tillage on soil quality.

Author Contributions

Writing—original draft, C.Z.; Methodology, C.Z.; Software, C.Z. and Q.C.; Funding acquisition, J.L. and X.Z.; Resources, J.L. and X.Z.; Writing—review & editing, J.L., F.A.S., and X.Z.; Supervision, F.A.S.; Investigation, F.A.S.; Formal analysis, Q.C.; Validation, Q.C. All authors have read and agreed to the published version of the manuscript.

Funding

This work was financially supported by the International Partnership Program of Chinese Academy of Sciences (Grant No. 131323KYSB20210004), the National Natural Science Foundation of China (Grant No. 42007058), the Young Scientist Group Project of Northeast Institute of Geography and Agroecology, and the Chinese Academy of Sciences (Grant No. 2023QNXZ03).

Data Availability Statement

The data presented in this study are available upon request from the first author.

Conflicts of Interest

The authors declare that they have no known competing financial interests or personal relationships that might impact the research presented in this article.

References

  1. Yu, H.; Chen, P.; Sun, Y. Analysis of the coupling and coordination between soil erosion and land use in the Northeastern black soil region of China: A case study of Lishu County. Sci. Rep. 2024, 14, 21955. [Google Scholar] [CrossRef] [PubMed]
  2. Liu, Z.; Cao, S.; Sun, Z.; Wang, H.; Qu, S.; Lei, N.; He, J.; Dong, Q. Tillage effects on soil properties and crop yield after land reclamation. Sci. Rep. 2021, 11, 4611. [Google Scholar] [CrossRef] [PubMed]
  3. Ma, C.; Nie, R.; Du, G. Responses of soil collembolans to land degradation in a black soil region in China. Int. J. Environ. Res. Public Health 2023, 20, 4820. [Google Scholar] [CrossRef]
  4. Toor, G.S.; Yang, Y.Y.; Das, S.; Dorsey, S.; Felton, G. Soil health in agricultural ecosystems: Current status and future perspectives. Adv. Agron. 2021, 168, 157–201. [Google Scholar]
  5. Duan, J.; Liu, H.; Zhang, X.; Ren, C.; Wang, C.; Cheng, L.; Xu, J.; Gu, B. Agricultural management practices in China enhance nitrogen sustainability and benefit human health. Nat. Food 2024, 5, 378–389. [Google Scholar] [CrossRef] [PubMed]
  6. Liu, X.; Zang, J.; Fu, Y.; Pan, X.; Meng, D.; Zhu, Y.; Sun, T. Influences of conservation tillage on soil macrofaunal biodiversity and trophic structure in the Mollisol region of Northeast China. Catena 2024, 236, 107750. [Google Scholar] [CrossRef]
  7. Cui, Y.; Zhang, W.; Zhang, Y.; Liu, X.; Zhang, Y.; Zheng, X.; Luo, J.; Zou, J. Effects of no-till on upland crop yield and soil organic carbon: A global meta-analysis. Plant Soil 2024, 499, 363–377. [Google Scholar] [CrossRef]
  8. Li, Y.; Song, D.; Liang, S.; Dang, P.; Qin, X.; Liao, Y.; Siddique, K.H.M. Effect of no-tillage on soil bacterial and fungal community diversity: A meta-analysis. Soil Tillage Res. 2020, 204, 104721. [Google Scholar] [CrossRef]
  9. Attademo, A.M.; Sanchez-Hernandez, J.C.; Lajmanovich, R.C.; Repetti, M.R.; Peltzer, P.M. Enzyme activities as indicators of soil quality: Response to intensive soybean and rice crops. Water Air Soil Pollut. 2021, 232, 295. [Google Scholar] [CrossRef]
  10. Si, P.; Liu, E.; He, W.; Sun, Z.; Dong, W.; Yan, C.; Zhang, Y. Effect of no-tillage with straw mulch and conventional tillage on soil organic carbon pools in Northern China. Arch. Agron. Soil Sci. 2018, 64, 398–408. [Google Scholar] [CrossRef]
  11. Makó, A.; Szabó, B.; Rajkai, K.; Szabó, J.; Bakacsi, Z.; Labancz, V.; Hernádi, H.; Barna, G. Evaluation of soil texture determination using soil fraction data resulting from laser diffraction method. Int. Agrophysics 2019, 33, 445–454. [Google Scholar] [CrossRef]
  12. Cui, J.; Guo, L.; Xiong, S.; Yang, S.; Wang, Y.; Zhang, S.; Sun, H. Soil organic carbon induces a decrease in erodibility of black soil with loess parent materials in northeast China. Quat. Res. 2024, 120, 83–92. [Google Scholar] [CrossRef]
  13. Chen, Y.; Liu, S.; Li, H.; Li, X.F.; Song, C.Y.; Cruse, R.M.; Zhang, X.Y. Effects of conservation tillage on corn and soybean yield in the humid continental climate region of Northeast China. Soil Tillage Res. 2011, 115, 56–61. [Google Scholar] [CrossRef]
  14. Pranagal, J.; Kraska, P. 10-years studies of the soil physical condition after one-time biochar application. Agronomy 2020, 10, 1589. [Google Scholar] [CrossRef]
  15. Zhang, Z.; Du, L.; Xiao, Z.; Li, C.; Wang, Z.; Zhou, P.; Sun, G.; Ye, Y.; Hu, T.; Wang, H. Rice-crayfish farming increases soil organic carbon. Agric. Ecosyst. Environ. 2022, 329, 107857. [Google Scholar] [CrossRef]
  16. Francis, A.; Kevin, R.; Gopi, G.; Baby, R. Soil Organic Carbon Estimation Using Remote Sensing Technique. In Green Buildings and Sustainable Engineering: Proceedings of GBSE 2019; Springer: Singapore, 2020; pp. 405–412. [Google Scholar]
  17. Neemisha; Sharma, S. Soil enzymes and their role in nutrient cycling. In Structure and Functions of Pedosphere; Springer Nature: Singapore, 2022; pp. 173–188. [Google Scholar]
  18. Guo, Z.; Wan, S.; Hua, K.; Yin, Y.; Chu, H.; Wang, D.; Guo, X. Fertilization regime has a greater effect on soil microbial community structure than crop rotation and growth stage in an agroecosystem. Appl. Soil Ecol. 2020, 149, 103510. [Google Scholar] [CrossRef]
  19. Chaudhry, H.; Vasava, H.B.; Chen, S.; Saurette, D.; Beri, A.; Gillespie, A.; Biswas, A. Evaluating the Soil Quality Index Using Three Methods to Assess Soil Fertility. Sensors 2024, 24, 864. [Google Scholar] [CrossRef]
  20. Yan, X.; Luo, X. Assessment of the soil quality by fuzzy mathematics in farmland around a uranium mill tailing repository in China. Radioprotection 2016, 51, 37–41. [Google Scholar] [CrossRef]
  21. Ye, Y.; Sun, X.; Zhao, J.; Wang, M.; Guan, Q. Establishing a soil quality index to assess the effect of thinning on soil quality in a Chinese fir plantation. Eur. J. For. Res. 2022, 141, 999–1009. [Google Scholar] [CrossRef]
  22. Fu, X.; Wang, J.; Sainju, U.M.; Liu, W. Aggregate size distribution and associated carbon and nitrogen in mulched winter wheat and spring corn. Can. J. Soil Sci. 2019, 99, 367–379. [Google Scholar] [CrossRef]
  23. Awale, R.; Emeson, M.A.; Machado, S. Soil organic carbon pools as early indicators for soil organic matter stock changes under different tillage practices in Inland Pacific Northwest. Front. Ecol. Evol. 2017, 5, 96. [Google Scholar] [CrossRef]
  24. Mohammed, Y.A.; Desta, K.G. Nutrient sources and harvest frequencies impact water stable soil macro-aggregates. Commun. Soil Sci. Plant Anal. 2017, 48, 2359–2367. [Google Scholar] [CrossRef]
  25. Obidike-Ugwu, E.O.; Ogunwole, J.O.; Eze, P.N. Derivation and validation of a pedotransfer function for estimating the bulk density of tropical forest soils. Model. Earth Syst. Environ. 2023, 9, 801–809. [Google Scholar] [CrossRef]
  26. Wang, Q.J.; Zhang, J.T.; Gai, Z.J.; Cai, L.J.; Liu, J.Q.; Zhao, G.F.; Du, J.X.; Jiao, F. Effect of long-term straw mulching and no-tillage on physical properties of meadow soil in cold region. J. Appl. Ecol. 2018, 29, 2943–2948. [Google Scholar]
  27. Stošić, M.; Brozović, B.; Vinković, T.; Ravnjak, B.; Kluz, M.; Zebec, V. Soil resistance and bulk density under different tillage system. Poljoprivreda 2020, 26, 17–24. [Google Scholar] [CrossRef]
  28. Yin, W.; Chen, G.; Feng, F.; Guo, Y.; Hu, F.; Chen, G.; Zhao, C.; Yu, A.; Chai, Q. Straw retention combined with plastic mulching improves compensation of intercropped maize in arid environment. Field Crops Res. 2017, 204, 42–51. [Google Scholar] [CrossRef]
  29. Mateo-Marín, N.; Bosch-Serra, À.D.; Molina, M.G.; Poch, R.M. Impacts of tillage and nutrient management on soil porosity trends in dryland agriculture. Eur. J. Soil Sci. 2022, 73, e13139. [Google Scholar] [CrossRef]
  30. Cui, Y.; Shi, H.; Guo, A.; Sun, G.; Wang, G.; Wang, J.; Huang, W.; Lu, T. Effects of straw and biochar returned to the soil on soil physical properties and pH value in cold rice region. Asian Agric. Res. 2021, 13, 27–32. [Google Scholar]
  31. Zhao, S.; Li, K.; Zhou, W.; Qiu, S.; Huang, S.; He, P. Changes in soil microbial community, enzyme activities and organic matter fractions under long-term straw return in north-central China. Agric. Ecosyst. Environ. 2016, 216, 82–88. [Google Scholar] [CrossRef]
  32. Nicoloso, R.S.; Rice, C.W.; Amado, T.J.C.; Costa, C.N.; Akley, E.K. Carbon saturation and translocation in a no-till soil under organic amendments. Agric. Ecosyst. Environ. 2018, 264, 73–84. [Google Scholar] [CrossRef]
  33. Huang, M.; Zhou, X.; Cao, F.; Zou, Y. Long-term effect of no-tillage on soil organic carbon and nitrogen in an irrigated rice-based cropping system. Paddy Water Environ. 2016, 14, 367–371. [Google Scholar] [CrossRef]
  34. Liu, B.; Dai, Y.; Cheng, X.; He, X.; Bei, Q.; Wang, Y.; Zhou, Y.; Zhu, B.; Zhang, K.; Tian, X.; et al. Straw mulch improves soil carbon and nitrogen cycle by mediating microbial community structure and function in the maize field. Front. Microbiol. 2023, 14, 1217966. [Google Scholar] [CrossRef] [PubMed]
  35. He, J.; Du, L.; Zhai, C.; Guan, Y.; Wu, S.; Zhang, Z.; Ogundeji, A.O.; Gu, S. Influence of tillage practices on phosphorus forms in aggregates of Mollisols from northeast China. J. Sci. Food Agric. 2021, 101, 4523–4531. [Google Scholar] [CrossRef] [PubMed]
  36. Tang, H.; Li, C.; Cheng, K.; Shi, L.; Wen, L.; Xiao, X.; Xu, Y.; Li, W.; Wang, K. Effects of short-term soil tillage management on activity and community structure of denitrifiers under double-cropping rice field. J. Microbiol. Biotechnol. 2020, 30, 1688. [Google Scholar] [CrossRef] [PubMed]
  37. Kara, Z.; Yürürdurmaz, C.; Cokkızgın, A.; Keles, H.; Gonen, E. The effects of wheat straw used as mulch on some chemical properties of the soil and grain yield in durum wheat. Elixir Agric. 2021, 154, 55382–55386. [Google Scholar]
  38. Liu, G.-Y.; Yang, Y.; Zhang, Q.; Yang, L.-L.; Liang, L.-Y.; Ma, Q.; Tong, Y.-A. Effects of three mulching modes on winter wheat productivity and soil fertility in dryland of Weibei Rainfed Area. J. Plant Nutr. Fertil. 2018, 24, 857–868. [Google Scholar]
  39. Xiao, J.; Lei, Z.; Deti, X.; Chaofu, W. Study on the relationship between soil microbes and soil fertility in paddy fields of long-tern no-tillage and ridge culture. Xi Nan Nong Ye Da Xue Xue Bao J. Southwest Agric. Univ. 2002, 24, 82–85. [Google Scholar]
  40. Singh, D.; Lenka, S.; Lenka, N.K.; Trivedi, S.K.; Bhattacharjya, S.; Sahoo, S.; Saha, J.K.; Patra, A.K. Effect of reversal of conservation tillage on soil nutrient availability and crop nutrient uptake in soybean in the vertisols of central India. Sustainability 2020, 12, 6608. [Google Scholar] [CrossRef]
  41. Lv, L.; Gao, Z.; Liao, K.; Zhu, Q.; Zhu, J. Impact of conservation tillage on the distribution of soil nutrients with depth. Soil Tillage Res. 2023, 225, 105527. [Google Scholar] [CrossRef]
  42. Pérez, W.A.; Torres-Bazurto, J. Carbon-nitrogen ratio in soils with fertilizer applications and nutrient absorption in banana (Musa spp.) cv. Williams. Agron. Colomb. 2020, 38, 253–260. [Google Scholar] [CrossRef]
  43. Yuan, J.; Liang, Y.; Zhuo, M.; Sadiq, M.; Liu, L.; Wu, J.; Xu, G.; Liu, S.; Li, G.; Yan, L. Soil nitrogen and carbon storages and carbon pool management index under sustainable conservation tillage strategy. Front. Ecol. Evol. 2023, 10, 1082624. [Google Scholar] [CrossRef]
  44. Yan, F.; Zhou, W.; Sun, Y.; Guo, C.; Xiang, K.; Li, N.; Yang, Z.; Wu, Y.; Zhang, Q.; Wang, X.; et al. No-tillage with straw mulching promotes the utilization of soil nitrogen by rice under wheat–rice and oilseed rape–rice cropping systems. Front. Plant Sci. 2023, 14, 1170739. [Google Scholar] [CrossRef]
  45. Ghosh, A.; Singh, A.B.; Kumar, R.V.; Manna, M.C.; Bhattacharyya, R.; Rahman, M.M.; Sharma, P.; Rajput, P.S.; Misra, S. Soil enzymes and microbial elemental stoichiometry as bio-indicators of soil quality in diverse cropping systems and nutrient management practices of Indian Vertisols. Appl. Soil Ecol. 2020, 145, 103304. [Google Scholar] [CrossRef]
  46. Wang, W.; Hou, Y.; Pan, W.; Vinay, N.; Mo, F.; Liao, Y.; Wen, X. Continuous application of conservation tillage affects in situ N2O emissions and nitrogen cycling gene abundances following nitrogen fertilization. Soil Biol. Biochem. 2021, 157, 108239. [Google Scholar] [CrossRef]
  47. Adongo, J.O.; Osumba, S.; Misoi, S.; Kibet, J. Spectroscopic and Kinetic Study of Sucrose Oxidation by Cr (VI) and Its Application in the Quantitative Analysis of Soil Organic Carbon. Int. Res. J. Pure Appl. Chem. 2022, 1–15. [Google Scholar] [CrossRef]
  48. Zhu, Z.; Bai, Y.; Lv, M.; Tian, G.; Zhang, X.; Li, L.; Jiang, Y.; Ge, S. Soil Fertility, Microbial Biomass, and Microbial Functional Diversity Responses to Four Years Fertilization in an Apple Orchard in North China. Hortic. Plant J. 2020, 6, 223–230. [Google Scholar] [CrossRef]
  49. Anderson, T.H.; Domsch, K.H. Soil microbial biomass: The eco-physiological approach. Soil Biol. Biochem. 2010, 42, 2039–2043. [Google Scholar] [CrossRef]
  50. Li, S.; Su, P.; Zhang, H.; Zhou, Z.; Xie, T.; Shi, R.; Gou, W. Distribution patterns of desert plant diversity and relationship to soil properties in the Heihe River Basin, China. Ecosphere 2018, 9, e02355. [Google Scholar] [CrossRef]
  51. Guo, L.; Shi, J.; Lin, W.; Liang, J.; Lu, Z.; Tang, X.; Liu, Y.; Wu, P.; Li, C. Soil bacteria mediate soil organic carbon sequestration under different tillage and straw management in rice-wheat cropping systems. Agriculture 2022, 12, 1552. [Google Scholar] [CrossRef]
  52. Dan, L.; Xia, Z.; Jun, L.; Xu-Dong, W. Effects of different tillage patterns on soil properties, maize yield and water use efficiency in Weibei Highland, China. J. Appl. Ecol. 2018, 29, 573. [Google Scholar]
  53. Tyler, H.L. Bacterial community composition under long-term reduced tillage and no till management. J. Appl. Microbiol. 2019, 126, 1797–1807. [Google Scholar] [CrossRef] [PubMed]
  54. Luo, Y.; Iqbal, A.; He, L.; Zhao, Q.; Wei, S.; Ali, I.; Ullah, S.; Yan, B.; Jiang, L. Long-term no-tillage and straw retention management enhances soil bacterial community diversity and soil properties in southern China. Agronomy 2020, 10, 1233. [Google Scholar] [CrossRef]
  55. Wang, Y.; Liu, L.; Luo, Y.; Awasthi, M.K.; Yang, J.; Duan, Y.; Li, H.; Zhao, Z. Mulching practices alter the bacterial-fungal community and network in favor of soil quality in a semiarid orchard system. Sci. Total Environ. 2020, 725, 138527. [Google Scholar] [CrossRef]
  56. Miao, S.; Zhao, H.; Qiao, Y.; Lu, X.; Li, Q. Evaluation of the Effects of Tillage Measures on the Topsoil Quality of Aeolian Sandy Soils in Northeast China Based on Tillage Index. Soil Fertil. Sci. China 2019, 9–15. [Google Scholar] [CrossRef]
  57. Toth, D.; Janků, J.; Marhoul, A.; Kozák, J.; Maitah, M.; Jehlička, J.; Řeháček, L.; Přikryl, R.; Herza, T.; Vopravil, J.; et al. Soil quality assessment using SAS (Soil Assessment System). Soil Water Res. 2023, 18, 1–15. [Google Scholar] [CrossRef]
  58. Martín-Sanz, J.P.; de Santiago-Martín, A.; Valverde-Asenjo, I.; Quintana-Nieto, J.; González-Huecas, C.; L. López-Lafuente, A. Comparison of soil quality indexes calculated by network and principal component analysis for carbonated soils under different uses. Ecol. Indic. 2022, 143, 109374. [Google Scholar] [CrossRef]
  59. Reid, M.J. On the Accuracy of Three-dimensional Kinematic Distances. Astron. J. 2022, 164, 133. [Google Scholar] [CrossRef]
  60. Ahn, S.; Kim, D.E. Radial distance estimation with tapered whisker sensors. Sensors 2017, 17, 1659. [Google Scholar] [CrossRef]
  61. Zhang, S.; Li, Q.; Lü, Y.; Sun, X.; Jia, S.; Zhang, X.; Liang, W. Conservation tillage positively influences the microflora and microfauna in the black soil of Northeast China. Soil Tillage Res. 2015, 149, 46–52. [Google Scholar] [CrossRef]
  62. Liang, A.Z.; Yang, X.M.; Zhang, X.P.; Chen, X.W.; Mclaughlin, N.B.; Wei, S.C.; Zhang, Y.; Jia, S.X.; Zhang, S.X. Changes in soil organic carbon stocks under 10-year conservation tillage on a Black soil in Northeast China. J. Agric. Sci. 2016, 154, 1425–1436. [Google Scholar] [CrossRef]
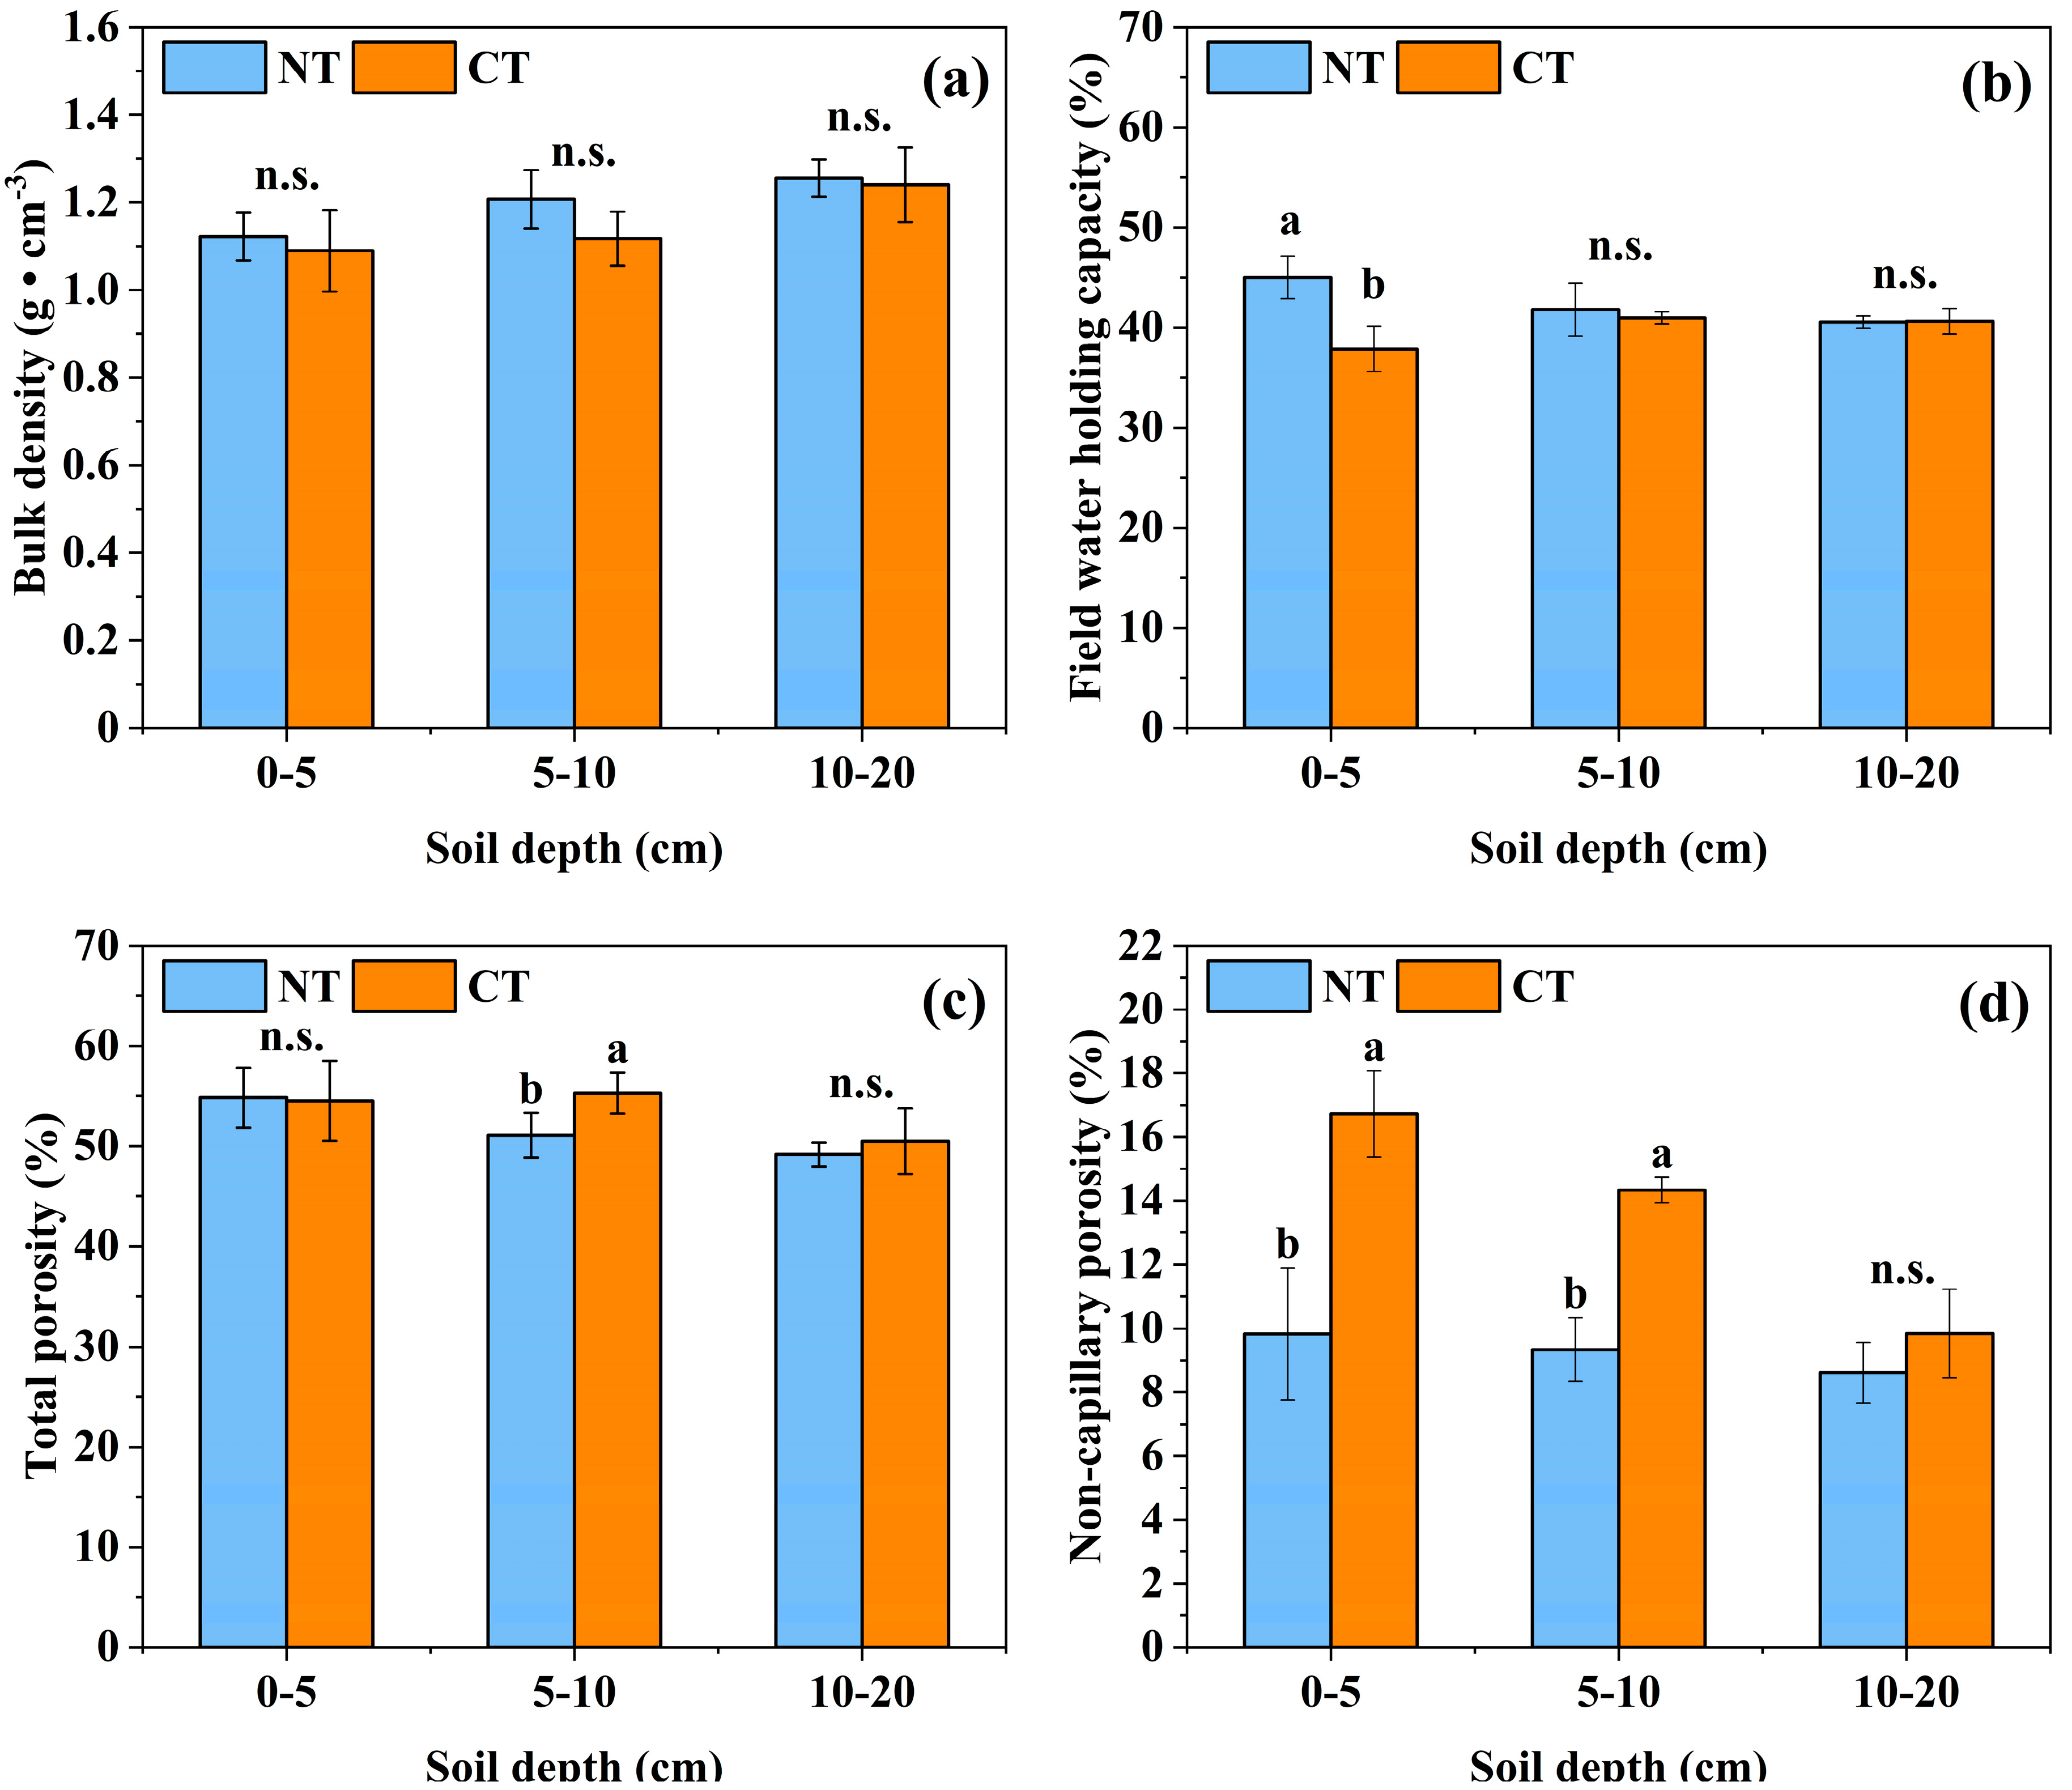
Figure 1. Differences in soil bulk density (a), field water-holding capacity (b), total porosity (c), and non-capillary porosity (d) between NT and CT. Different lowercase letters indicate a significant difference between the same soil layer under different tillage treatments (p < 0.05). n.s., no significant differences (p > 0.05); CT, conventional tillage; NT, no-till with straw mulching.
Agronomy 14 02859 g001
Figure 2. Differences in soil organic carbon (a), total nitrogen (b), total phosphorus (c), and total potassium (d) carbon and nitrogen ratios (e) between long-term NT and CT. Different lowercase letters indicate a significant difference between the same soil layer under different tillage methods (p < 0.05). n.s., no significant differences (p > 0.05); CT, conventional tillage; NT, no-till with straw mulching.
Agronomy 14 02859 g002
Figure 3. Differences in the soil’s ammonium nitrogen (a), nitrate-nitrogen (b), and available phosphorus (c) between long-term NT and CT. Different lowercase letters indicate a significant difference between the same soil layer under different tillage methods (p < 0.05). n.s., no significant differences (p > 0.05); CT, conventional tillage; NT, no-till with straw mulching.
Agronomy 14 02859 g003
Figure 4. Differences in soil catalase (a), alkaline phosphatase (b), sucrase (c), and urease (d) activities between long-term NT and CT. n.s., no significant differences (p > 0.05); CT, conventional tillage; NT, no-till with straw mulching.
Agronomy 14 02859 g004
Figure 5. Differences in the soil’s microbial biomass carbon (a) and microbial biomass nitrogen (b) between long-term NT and CT. Different lowercase letters indicate a significant difference between the same soil layer under different tillage methods (p < 0.05). n.s., no significant differences (p > 0.05); CT, conventional tillage; NT, no-till with straw mulching.
Agronomy 14 02859 g005
Figure 6. Radar charts of 0–5 cm (a), 5–10 cm (b), and 10–20 cm (c) membership values of each soil index. CT, conventional tillage; NT, no-till with straw mulching.
Agronomy 14 02859 g006
Figure 7. Radar charts of 0–20 cm membership values of each soil index. CT, conventional tillage; NT, no-till with straw mulching.
Agronomy 14 02859 g007
Table 1. Soil properties in the study area in 2004.
Soil Layer
(cm)
Bulk Density
(g‧cm−3)
Field Capacity
(%)
Sand
(%)
Silt
(%)
Clay
(%)
0–201.1334.931.630.837.6
Table 2. Contents and average weight diameters of water-stable aggregates between long-term NT and CT.
Soil Depth (cm)TreatmentsAggregate Size Distribution (%)Mean Weight Diameter (mm)
>2 mm0.25–2 mm0.053–0.25 mm<0.053 mm
0–5NT1.47 a60.63 a18.31 a19.59 a0.48 a
CT0.53 b61.24 a19.35 a18.88 a0.40 a
5–10NT0.88 a57.95 a19.56 a21.61 a0.42 a
CT0.55 a59.30 a16.55 a23.60 a0.40 a
10–20NT0.54 a57.03 a19.69 a22.74 a0.38 a
CT0.61 a59.69 a19.31 a20.40 a0.41 a
Note: Different lowercase letters indicate a significant difference between the same soil layer under different tillage methods (p < 0.05). CT, conventional tillage; NT, no-till with straw mulching.
Table 3. Differences in soil microbial diversity between long-term NT and CT.
Soil Depth (cm)TreatmentsFungiBacteria
Chao1 IndexShannon IndexChao1 IndexShannon Index
0–5NT766.97 ± 110.41 a3.19 ± 0.38 a2439.87 ± 373.56 a6.08 ± 0.29 a
CT794.88 ± 52.35 a3.31 ± 0.08 a2511.66 ± 56.16 a5.98 ± 0.16 a
5–10NT534.00 ± 129.39 a3.14 ± 0.79 a2218.48 ± 345.23 a5.60 ± 0.19 b
CT791.82 ± 197.99 a3.13 ± 0.22 a2758.26 ± 123.65 a6.09 ± 0.23 a
10–20NT566.38 ± 114.40 a3.26 ± 0.44 a2779.74 ± 155.97 a6.00 ± 0.11 a
CT499.85 ± 121.47 a2.95 ± 0.90 a2556.11 ± 118.72 a6.00 ± 0.11 a
Note: Different lowercase letters indicate a significant difference between the same soil layer under different tillage methods (p < 0.05). CT, conventional tillage; NT, no-till with straw mulching.
Table 4. Principal component analysis of soil quality indexes.
Sports EventPrincipal ComponentWeights
12345
Characteristic root7.4076.9173.5572.5781.54
Variance explained rate33.67%31.44%16.17%11.72%7.00%
Cumulative contribution rate33.67%65.11%81.28%93.00%100.00%
Factor loading
MWD0.14790.07180.06790.54520.11293.93%
BD0.09060.28290.24250.25470.07774.91%
FC0.22750.27630.08520.03580.19694.94%
TSP0.00560.35110.13620.04270.22273.92%
NCP0.12150.32080.10340.0950.27594.78%
TOC0.19080.17210.33060.21710.0995.17%
TN0.23760.07130.36240.10740.18034.71%
TP0.07490.35680.12260.09580.02214.30%
TK0.1160.3070.02980.12960.36214.58%
NH4+-N0.05650.33140.00890.09190.35534.06%
NO3-N0.30530.04310.20020.24430.01374.51%
AVP0.30880.0050.26270.05550.16154.20%
CAT0.28760.15220.22250.11580.10255.10%
AP0.35140.00350.14850.02540.05863.81%
SUC0.29550.20210.07640.13920.00564.86%
UE0.34210.02390.08330.09120.23184.13%
MBC0.24690.05150.33050.12670.25494.69%
MBN0.22130.02750.12070.460.15034.23%
FCI0.23570.22430.19270.05010.25755.19%
FSI0.07650.24450.1730.27930.39124.83%
BCI0.0750.13360.46650.15070.0374.12%
BSI0.11070.21980.20380.31210.33825.05%
Disclaimer/Publisher’s Note: The statements, opinions and data contained in all publications are solely those of the individual author(s) and contributor(s) and not of MDPI and/or the editor(s). MDPI and/or the editor(s) disclaim responsibility for any injury to people or property resulting from any ideas, methods, instructions or products referred to in the content.