Article

Unravelling Yield and Yield-Related Traits in Soybean Using GGE Biplot and Path Analysis

1
School of Agricultural Sciences, College of Agricultural and Environmental Sciences, Makerere University, Kampala P.O. Box 7062, Uganda
2
National Agricultural Research Organization, National Livestock Resources Research Institute, Kampala P.O. Box 5704, Uganda
3
IITA Southern Africa Research and Administrative Hub (SARAH) Campus, Chelston Lusaka P.O. Box 310142, Zambia
*
Author to whom correspondence should be addressed.
Agronomy 2024, 14(12), 2826; https://doi.org/10.3390/agronomy14122826
Submission received: 23 September 2024 / Revised: 24 November 2024 / Accepted: 25 November 2024 / Published: 27 November 2024
(This article belongs to the Section Precision and Digital Agriculture)

Abstract

:
Soybean (Glycine max) is a vital crop for food, animal feed, and industrial products. However, its yield performance is significantly affected by genotype-by-environment interaction (GEI), which complicates the selection of high-yielding, stable varieties. This study aimed to evaluate the yield performance and stability of 12 elite soybean varieties across five major production areas in Uganda using GGE biplot and path analysis. The varieties were planted in a randomized complete block design with three replications over two consecutive seasons. Results revealed significant differences in grain yield among the varieties, locations, and their interactions (p < 0.001). The highest-yielding varieties were Maksoy 5N (979 kg ha−1), Maksoy 4N (978 kg ha−1), Maksoy 3N (930 kg ha−1), and Signal (930 kg ha−1). GGE biplot analysis grouped the locations into two mega-environments, with the Maksoy varieties exhibiting greater yield stability compared to Seed Co. varieties. Path analysis showed that traits such as the number of lower internodes, central internode length, and filled pods had the highest positive direct effects on grain yield. This study provides insights into soybean breeding in tropical environments, highlighting traits that can be targeted to improve yield and stability. The findings offer a framework for breeding programs in Uganda and similar agro-ecological regions, promoting more resilient and productive soybean varieties. This study also illustrated the potential advantages of employing more complex mathematical techniques like path analysis to uncover yield and yield-related traits in soybean breeding programs.

1. Introduction

Soybean (Glycine max) is one of the most widely grown and used oilseeds [1]. Soybean uses range from human food (19.2%) to animal feed (77%) and industrial products (3.8%) [2]. Soybean production has expanded significantly over the last two decades [3]. The greatest soybean production increase occurred in the latter half of the 20th century, when it increased tenfold, from 27 million tons (MT) in 1962 to 349 MT in 2022 [4]. The rapid increase in production is because of the ever-increasing demand for soybeans as a fundamental source of protein in animal feed, especially in developing and emerging countries [5,6]. Furthermore, it is anticipated that 2030 global soybean production will reach 371 MT, an annual growth of 2.2% [7]. Nutritionally, soybean grain has 40% protein, 20% oil, high-calorie content, and several vital amino acids [8]. Soybeans form root symbioses with rhizobia that fix atmospheric nitrogen in the soil, thereby improving soil fertility [9]. In tropical Africa, characterized by infertile soils and limited fertilizer use, soybean is a suitable crop for sustainable agricultural production systems due to their capacity to fix atmospheric nitrogen into the soil [10]. Therefore, there is minimum need for nitrogen fertilizers in such production systems [9]. Soybean is grown as both a food and a cash crop [11]. Therefore, in tropical Africa, it is necessary to promote soybean as a cash crop.
Several outstanding soybean varieties that are widely cultivated throughout Africa have been developed for more than 20 years by Seed Co. (Sandton, South Africa) and Makerere University (Kampala, Uganda). However, little is known about the agronomic traits, yield components, and relationships between the yield components of these soybean varieties. Additionally, contrasting information has been reported on the most important yield component that contributes to the total grain yield [12,13,14,15,16,17]. The complex trait of soybean grain yield is largely affected by genotype-by-environment interaction (GEI) [14]. A crossover form of GEI for grain yield was found at four locations in Ethiopia during a multi-environment study comprising 32 genotypes. At four locations in Ethiopia, a crossover form of GEI for grain yield was found during a multi-environment study comprising 32 genotypes. The same study found three genotypes that showed excellent grain yield and stability in performance across the test settings [18]. Similarly, W9837 x Cikuray-66 was the most stable and high-yielding genotype in another multi-environment study that tested 10 black-seeded soybean genotypes at sixteen locations [19]. Another study in Zambia identified TGX 1988-22F as the best genotype for general adaptability because of its great adaptability across all locations [20].
Additionally, yield results from the association of different yield-related traits may directly or indirectly affect yield [14,21]. Designing an effective plant breeding program requires an accurate estimation of the relationship between yield-related traits and their effects on the total yield. Several studies have reported a correlation between the yield of soybeans and phenotypic characteristics, including the number of branches, length of internode, days to 50% flowering, days to physiological maturity, and plant height [22,23]. Additionally, several studies have shown a correlation between yield-related characteristics, including the quantity of seeds per plant, the number of pods per plant, the number of seeds per pod, and the weight of 100 seeds [24,25]. A simple correlation analysis between two traits is commonly performed using a linear correlation coefficient. However, a simple correlation analysis might not accurately depict the cause-and-effect relationship between yield and associated traits, which could lead to inefficiencies in the selection process [26]. To assess whether there is a cause-and-effect relationship between two variables, path analysis partitions the correlation coefficients between the variables, making it more accurate than correlation analysis [22,27].
As far as we are aware, no comprehensive study has been conducted to estimate GEI for yield and relationships among different yield-related traits on the two sets of soybean varieties developed by Makerere University and Seed Co. This study seeks to establish and quantify genotype × environment interactions and relationships to identify indirect criteria for grain yield selection in soybeans. Therefore, the purpose of this study was to evaluate the yield performance and stability of 12 elite soybean varieties in Uganda’s major soybean-growing areas and to determine the relationship between related traits and grain yield.

2. Materials and Methods

2.1. Experimental Materials

There were 12 soybean genotypes in all; five were developed by the Makerere University Centre for Soybean Improvement and Development (MAKCSID), while the remaining seven were developed by Seed Co. (Table 1). Every experimental material used in this study is a released soybean variety that is widely cultivated in several African countries. All the experimental materials were evaluated in Uganda in a multi-environment trial.

2.2. Description of the Study Locations

Five locations that represent the main soybean-growing regions in Uganda were used for the soybean grain yield trial (Table 2). Three locations are found in Lake Victoria Crescent: Namulonge, Kabanyolo, and Nakabango; Ngetta is in the north-western savannah grasslands; and Mubuku in the western medium-high farmland. The varying climatic conditions in these locations have a significant effect on the grain yield of soybean (Table 2). In this study, the Mubuku irrigation scheme was selected to evaluate the adaptability of soybean genotypes to irrigated field conditions.

2.3. Experimental Design

The soybean genotypes were planted using a randomized complete block design (RCBD) with three replications. Three 5 m long rows, with 60 cm between rows and 5 cm between plants within a row, were used to represent each soybean genotype. Two seasons were used in this trial: the first rainfall season of 2016 (2016 A) and the second rainfall season of 2016 (2016 B). Three weedings were performed each season to keep the trials free of weeds. In these trials, no agrochemicals were used to manage the pests.

2.4. Data Collection

Several yield-related traits were collected from the soybean varieties during the growing season. These included the number of branches, plant height, pod clearance, internode length, number of internodes, days to 50% flowering, and days to physiological maturity. Additional yield-related traits were recorded at harvest, such as yield, 100-seed weight, and the number of full pods per plant.

2.4.1. Days to Flowering (DTF) and Days to Maturity (DTM)

Days to flowering was determined by counting the number of days from the date of planting until 50% of the plants in a plot flowered. Days to maturity was determined by counting the number of days between the planting date and the day that the plants in each plot reached physiological maturity.

2.4.2. Plant Height, Pod Clearance, and Number of Branches

At 85 days after planting, the number of primary (NPB) and secondary branches (NSB), plant height (PH), and pod clearance were recorded. Using a ruler, the height of the plant was measured from the ground to the top of the main stem axis, and the pod clearance was measured from the ground to the first pods. The number of branches per plant was counted. Ten randomly chosen plants in each plot were examined for these characteristics, and the mean was determined.

2.4.3. Length and Number of Internodes

Each sampled individual plant was divided into three sections: lower, center, and upper. A meter ruler was used to measure the length of each section, and the number of internodes was counted for all ten randomly selected plants.

2.4.4. Yield and Yield-Related Traits

During harvesting, the number of mature-filled pods per plant was counted to determine the number of pods per plant. The number of seeds per pod was counted from the ten randomly selected soybean plants, and a mean was calculated for every plot. The number of seeds per pod, 100-seed weight, and plot yield were determined for each plot. To calculate the pod yield per plot, the harvested soybean plants were threshed, and the seeds were sun-dried to about 10% moisture content and weighed. The plot yields were then converted to yield in Kg Ha−1.

2.5. Data Analysis

2.5.1. Multi-Locational Yield Data

The agricolae R package was used to conduct analysis of variance (ANOVA) for grain yield independently for each location and combined across locations [28]. Genotypes were treated as fixed effects, and replications and blocks within them as random effects. To test genotype variations and the presence of GEI, variances were separated into pertinent sources of variation for the combined analysis. To dissect the GEI of each variable and evaluate genotype stability in performance in different conditions, GGE biplot analysis was applied to the adjusted grain yield obtained via ANOVA [29]. Soybean grain yield in each test location was assessed using the ggplot function in tidyverse package in R software, Version 4.4.1 [30]. Mean separation was performed using the Least Significant Difference (LSD) test using the LSD.test function from agricolae package in R software, Version 4.4.1 [30].

2.5.2. Correlation Analysis

Correlation analysis was carried out for the different yield-related traits among both the Seed Co. and Maksoy varieties. The Pearson technique and the corrplot package version 0.88 of the R software were used to conduct the correlation analysis [31]. The correlation coefficients were categorized as follows: weak (0.0–0.3), moderate (0.3–0.6), strong (0.6–0.9), and very strong (0.9–1) [14].

2.5.3. Path Analysis

The direct and indirect effects of yield-related traits on the grain yield of the 12 soybean genotypes were determined by path analysis.
The path analysis considered grain yield as a response/dependent variable and all the studied traits as predictive/independent variables. Estimation and fractionation of the effects of yield-related traits were performed with agricolae package version 1.3-5 in R software [28]. The direct and indirect effects of the yield-related traits were classified as negligible (0.00–0.09), low (0.1–0.19), moderate (0.2–0.29), and high (0.3–0.99) as described by [32].

3. Results

3.1. Grain Yield Performance of Genotypes Across Locations

The grain yield performance varied significantly across the 12 soybean genotypes, locations, and their interactions (p < 0.001) (Table 3). Among the tested varieties, the top performers were the Maksoy lines, with Maksoy 5N achieving the highest grain yield of 979 kg ha−1, followed by Maksoy 4N (978 kg ha−1) and Maksoy 3N (930 kg ha−1). The best Seed Co. variety, Signal, produced 930 kg ha−1, but other Seed Co. varieties like Sentinel had considerably lower yields (656 kg ha−1) (Table 4). Location-wise, Ngetta showed the highest mean grain yield of 1256 kg ha−1, followed by Mubuku (1107 kg ha−1). Namulonge recorded the lowest grain yield among the five locations, averaging 406 kg ha−1 (Table 4).

3.2. Genotype Yield Stability Using GGE Biplot Analysis

The GGE biplot analysis (Figure 1) explained 74.01% of the total GEI variation, identifying Maksoy 5N as the highest-yielding genotype across all environments and showing some instability. Maksoy 3N was the most stable variety, consistently performing well across environments, making it ideal for broad adaptation. On the other hand, Sequel and Sentinel had low yields and were unstable across the test environments.
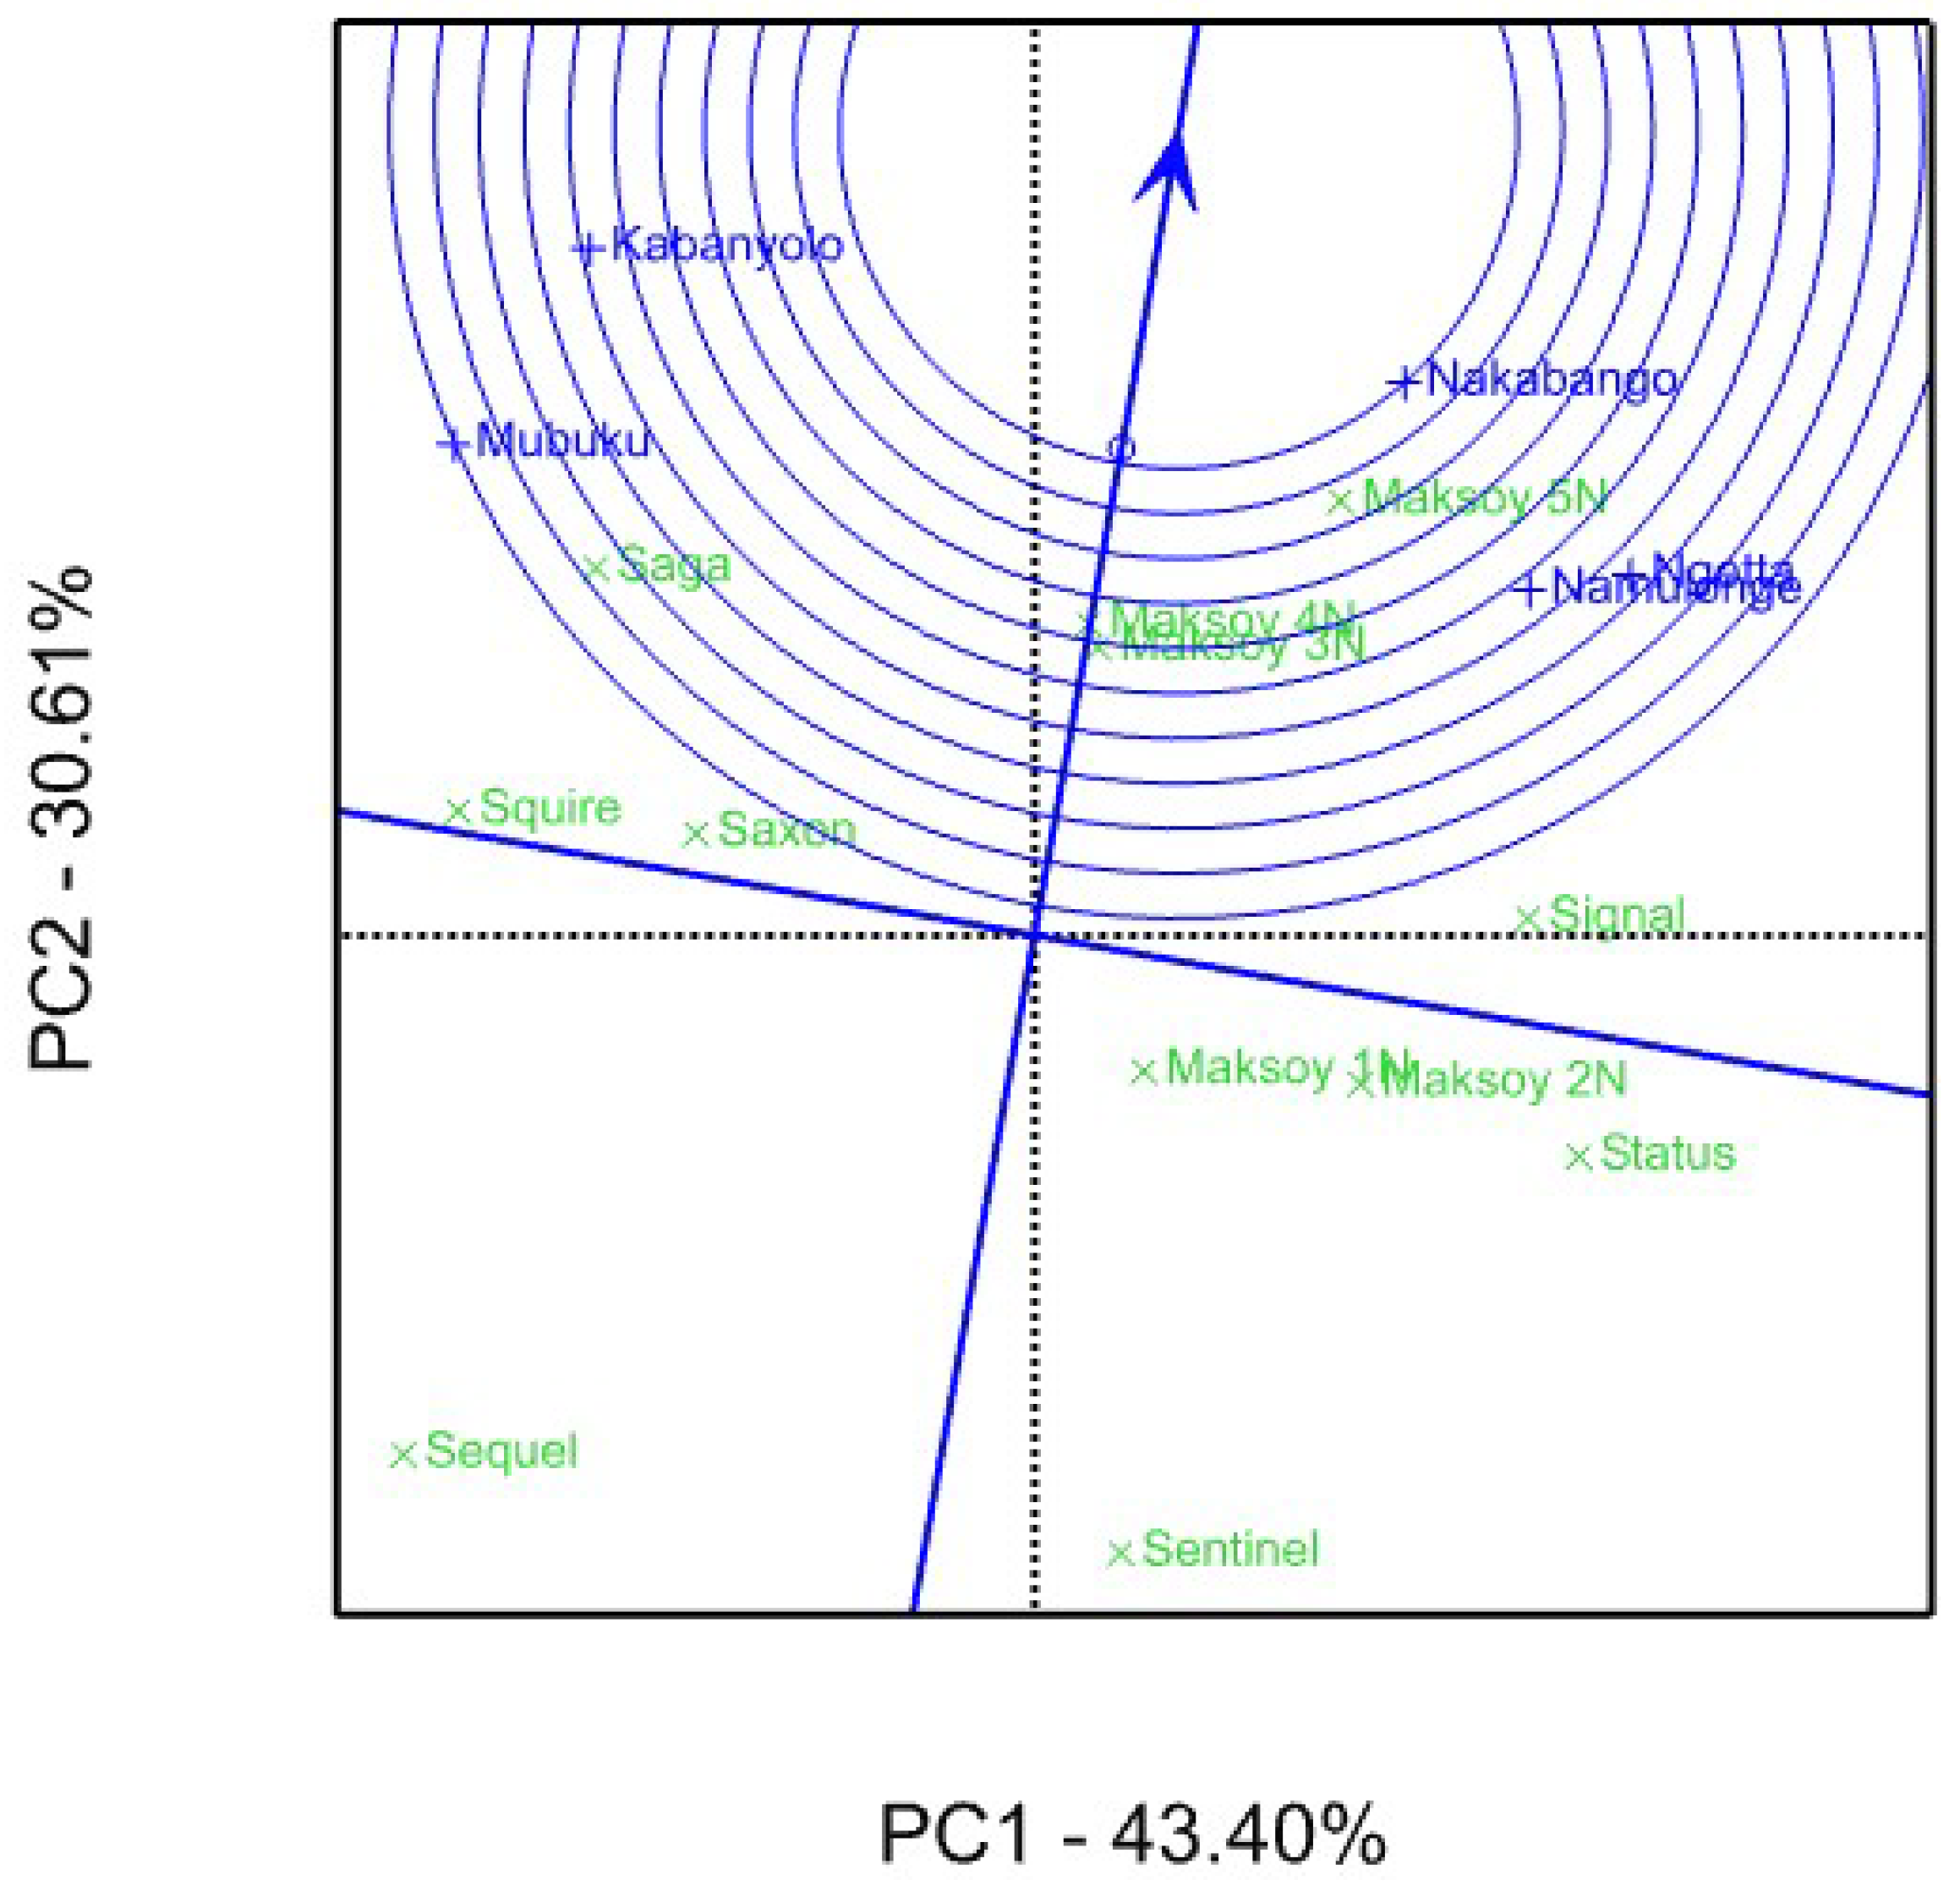
For broad adaptation in the target locations, the ideal genotype should have high mean performance and stability. In the biplot, an ideal genotype is closer to the origin. Thus, in the current study, the GGE biplot illustrated that Maksoy 5N was the most ideal genotype, followed by Maksoy 4N and Maksoy 3N (Figure 2). Conversely, less stable genotypes and low yield are undesirable since they are located distant from the ideal genotypes. The most undesirable variety was Sequel, followed by Sentinel (Figure 2).
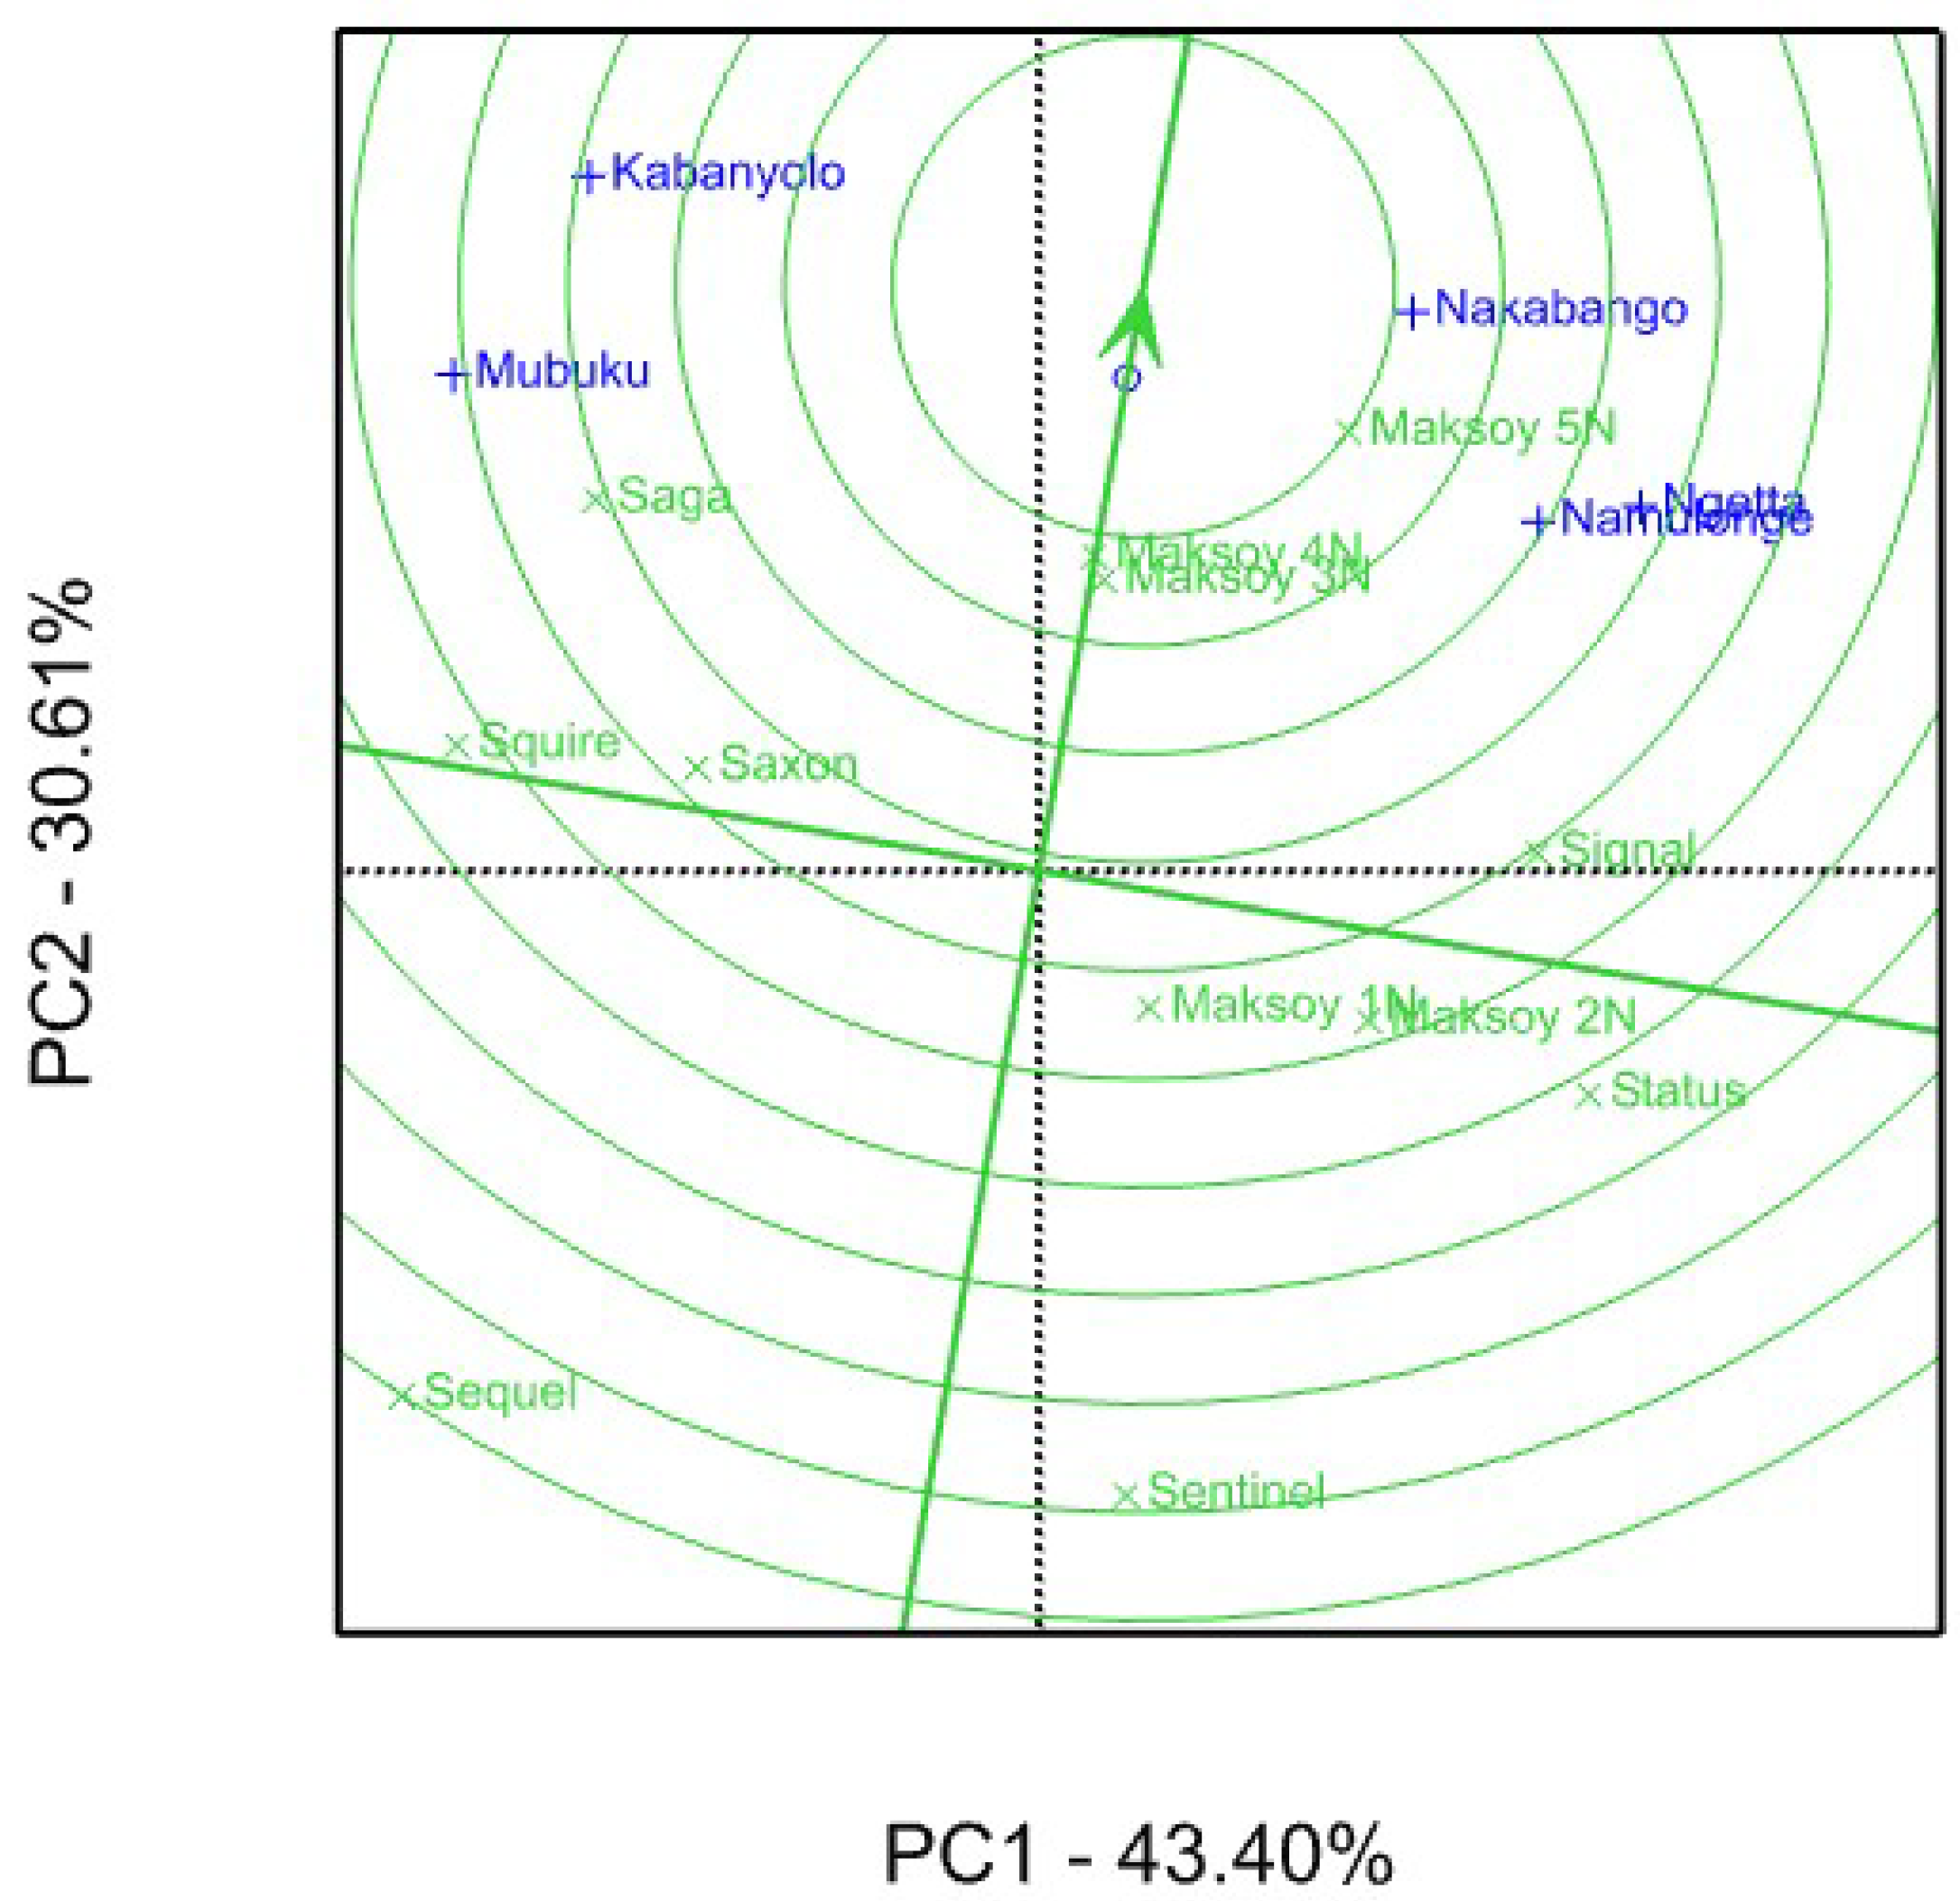
The biplot analysis also grouped the locations into two mega-environments. Saga performed best in Kabanyolo and Mubuku, while Maksoy 5N was superior in Ngetta and Nakabango and Namulonge (Figure 3).
The use of GGE biplot analysis to determine the ideal locations for multi-environmental trials (METs) is an intriguing application. An ideal testing environment should be representative and discriminating. Since Nakabango was closest to the center, it was identified as the ideal test location (Figure 4). Mubuku was not an ideal location because it was far away from the center (Figure 4).

3.3. Correlations Between Grain Yield and Yield-Related Traits

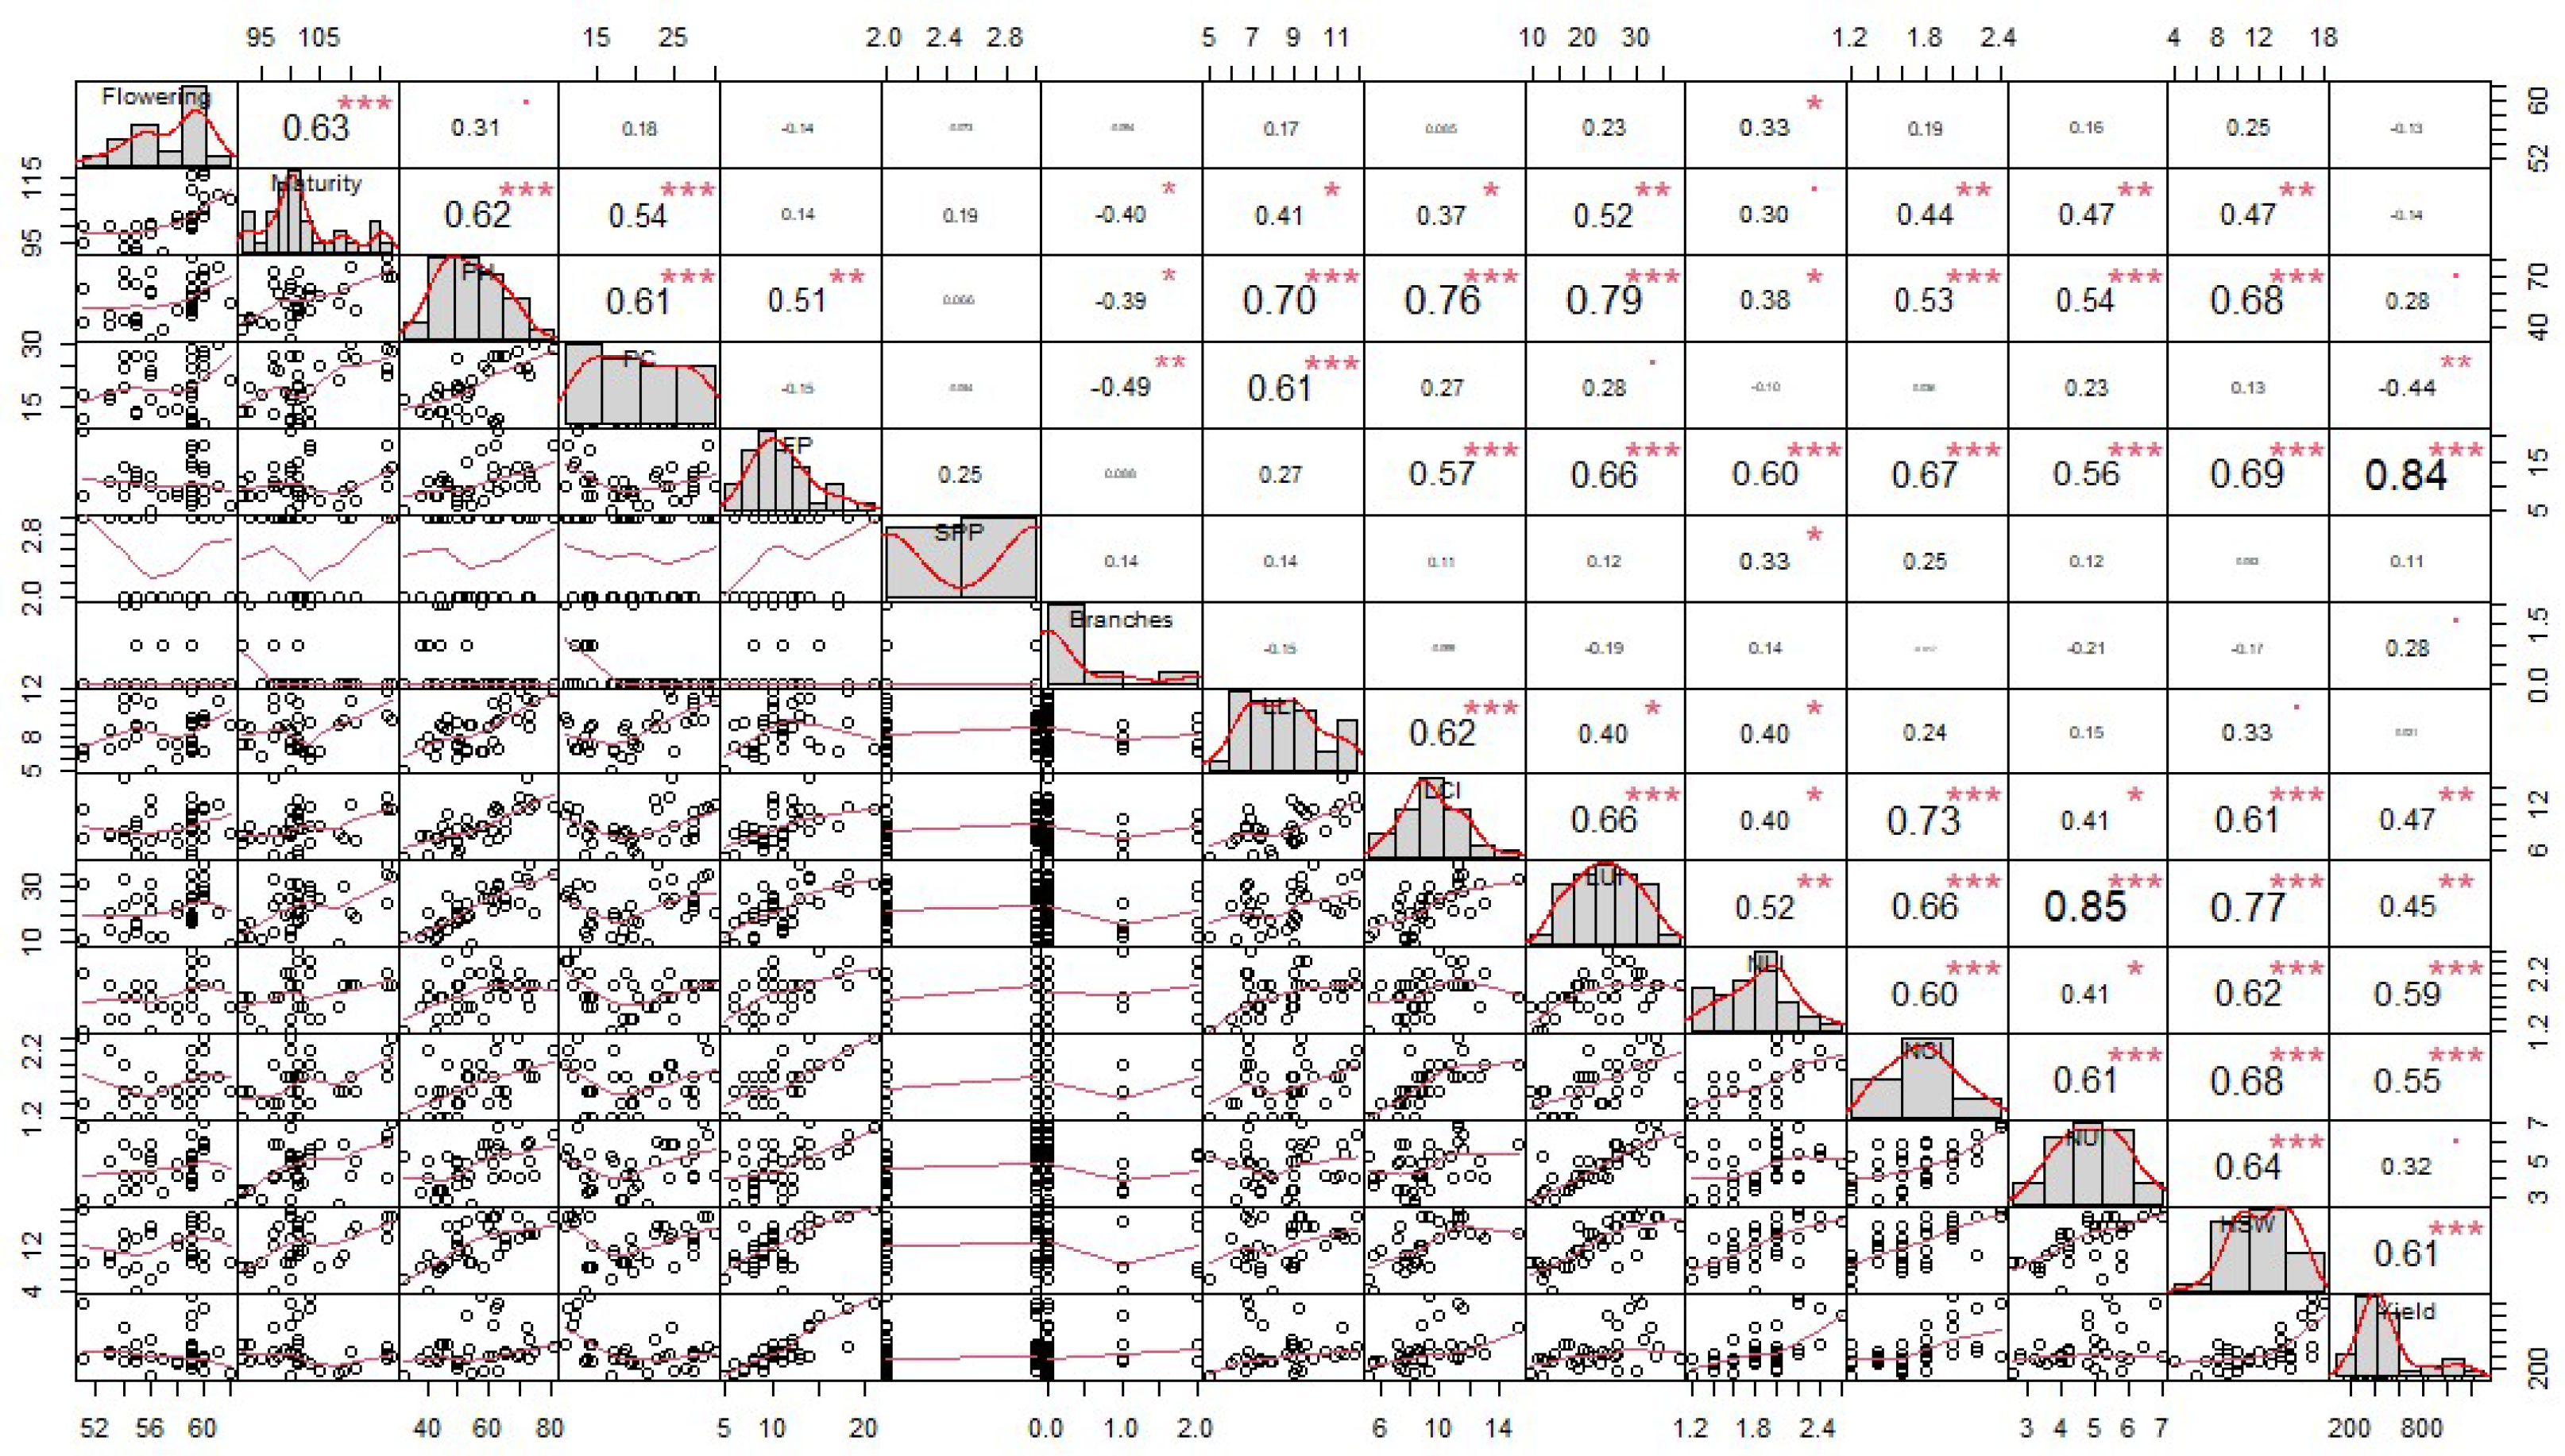
Correlation analysis revealed significant positive associations between grain yield and several yield-related traits (Figure 5). The number of filled pods per plant (r = 0.84), the number of lower internodes (r = 0.59), and the hundred-seed weight (r = 0.61) had the strongest positive correlations with yield (p < 0.001). Traits like plant height (r = 0.28) and the number of branches (r = 0.28) also showed positive associations with grain yield, though to a lesser degree. Conversely, grain yield had a negative correlation with pod clearance (r = −0.44), indicating that higher pod clearance reduced yield (p < 0.01).

3.4. Path Analysis of Yield-Related Traits

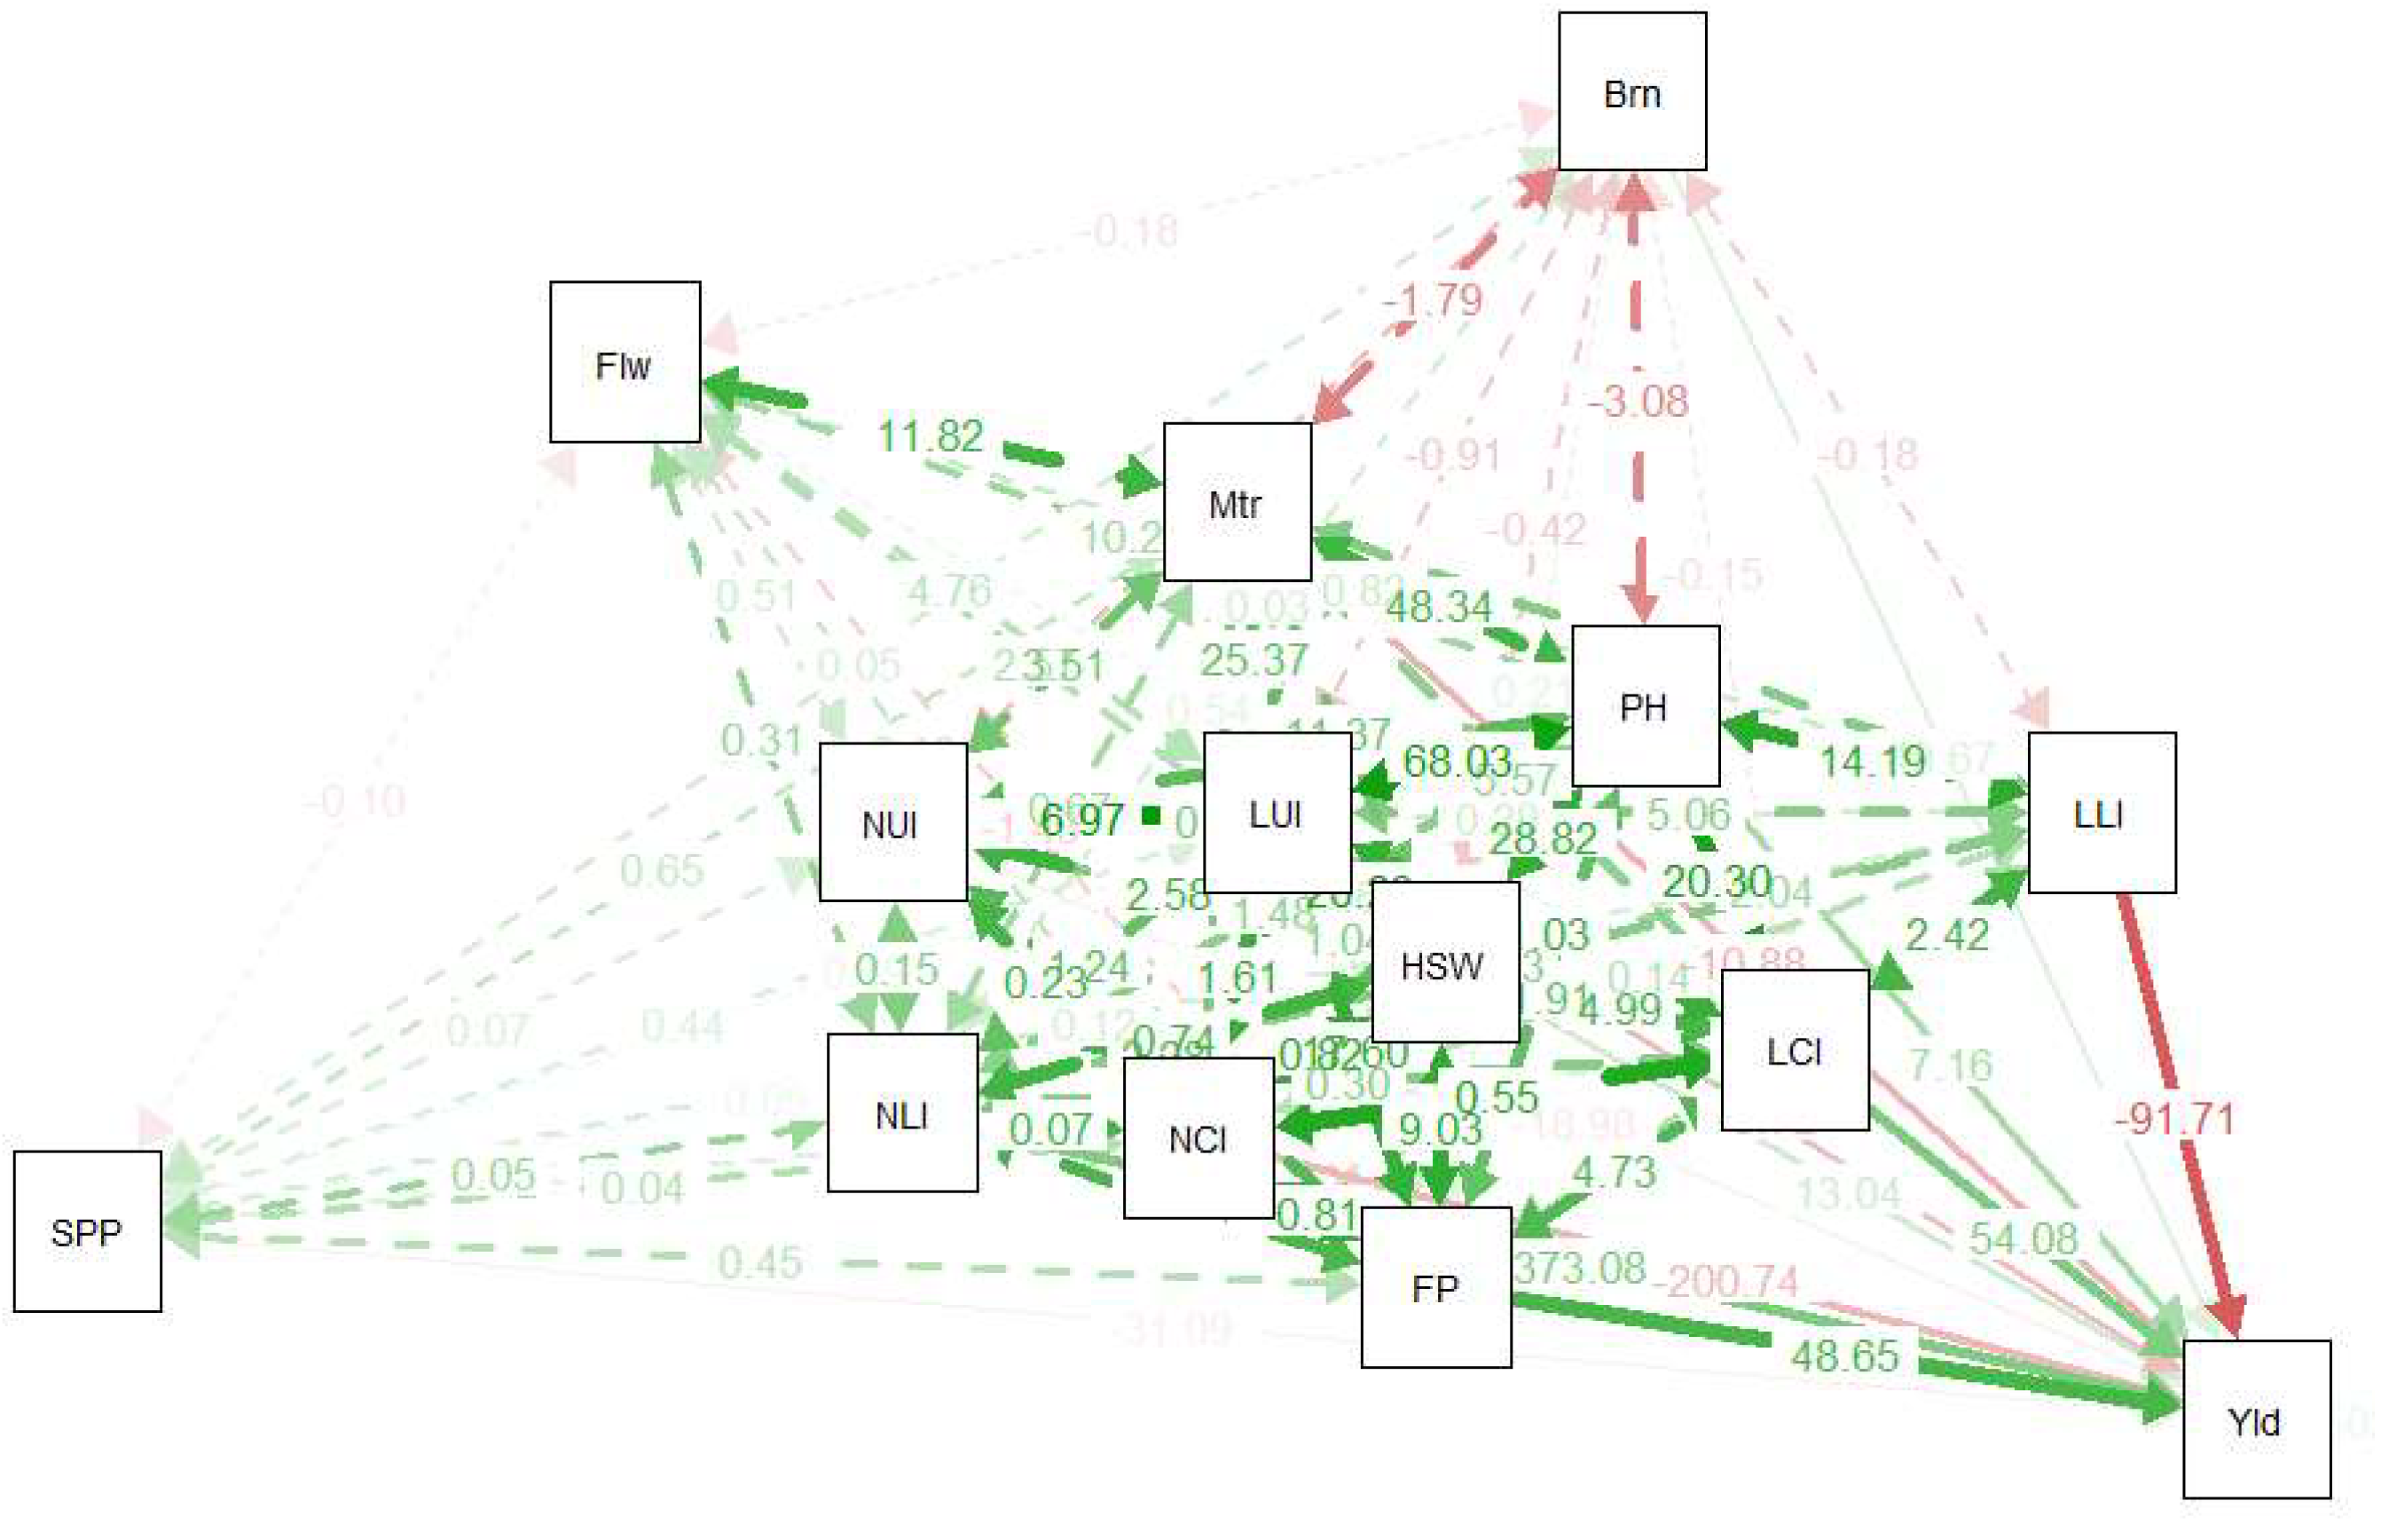
Path analysis (Table 5 and Figure 6) identified the number of lower internodes as having the highest positive direct effect on grain yield (373.08), followed by the length of the central internodes (54.08) and the number of filled pods per plant (48.65). These traits represent the most critical factors for direct selection in breeding programs aimed at increasing soybean grain yields. Negative direct effects on yield were observed for the number of central internodes (−200.74) and the length of lower internodes (−91.71), suggesting that excessive internode growth may reduce yield. The number of days to physiological maturity also had a small negative direct effect on yield (−10.88), indicating that earlier maturing varieties may offer yield advantages.

4. Discussion

4.1. Grain Yield Performance of Genotypes Across Locations

This study demonstrated significant genotype-by-environment interactions (GEIs) among the 12 soybean genotypes tested across five locations in Uganda, underscoring the importance of selecting varieties that are well-adapted to specific environments. The top-performing genotypes, Maksoy 5N, 4N, and 3N, consistently outyielded their counterparts, with Maksoy 5N exhibiting the highest grain yield (902 kg ha−1) across all environments. This superior performance reflects their local adaptation to the Ugandan climate, which includes periods of erratic rainfall, high temperatures, and varying soil fertility.
In contrast, Seed Co varieties, which are bred primarily for Southern African climates, showed less stability and lower yields in most Ugandan environments. Sentinel, for example, had the lowest yield among all genotypes (656 kg ha−1), likely due to its reduced adaptability to warmer, more variable conditions. These findings support previous research showing that genotypes bred for specific regions tend to perform better under local environmental stresses [18,19]. As climate change intensifies, resulting in greater temperature fluctuations and unpredictable rainfall, locally bred varieties like the Maksoy lines may become even more critical for sustaining soybean production in Uganda.
The differences in performance across locations can also be attributed to local environmental conditions. For instance, Ngetta and Mubuku, which showed the highest mean yields, benefitted from irrigation and relatively stable water availability, minimizing the impact of drought stress. Similar results have been observed in other multi-environment trials, where stable water supply or irrigation significantly improved yields under otherwise challenging conditions [20,33]. As climate change alters rainfall patterns, the integration of irrigation or water management practices may be crucial for maintaining high soybean yields in Uganda.

4.2. Genotype Yield Stability Using GGE Biplot Analysis

GGE biplot analysis provided valuable insights into both the yield performance and stability of the tested genotypes. While Maksoy 5N exhibited the highest overall yield, Maksoy 3N was the most stable genotype across all environments, making it a prime candidate for broad adaptability under varying environmental conditions. This stability is particularly important in the face of climate change, which is expected to increase environmental variability in tropical regions like Uganda [34].
The identification of three distinct mega-environments further emphasizes the need for targeted breeding strategies. For example, Saga, which performed best in Kabanyolo and Mubuku, may be specifically recommended for regions with similar environmental conditions, while Maksoy 4N, which excelled in Ngetta and Nakabango, should be prioritized in areas with similar agro-climatic profiles. These findings align with previous studies in Ethiopia and Zambia, where multiple mega-environments were identified due to the increasing unpredictability of rainfall and temperature [18,20].
The clustering of locations into different mega-environments suggests that Uganda’s agricultural landscape is becoming more segmented due to climate-driven changes. Such segmentation could guide breeding programs to develop varieties tailored to specific regions, particularly those most vulnerable to the adverse effects of climate change, such as drought-prone areas or regions experiencing increased temperature extremes.
The three mega-environments identified in this study indicate that at least one of the mega-environments chosen must be used for successful soybean breeding and selection. This agrees with a study by [33], who identified three mega-environments in a MET that was conducted in eight locations in Uganda. This result, however, is contrary to findings by [35], who demonstrated that Uganda possessed two mega-environments for the yields of soybean grain. The observations from METs in Uganda in the last 10 years illustrate that initially one of two mega-environments were identified for soybean grain yield. However, this has significantly changed in the five years where more mega-environments have been identified in recent studies. This could be evidence of climate change that has affected the grain yield of soybean in Uganda. A study by [35] had Maksoy 3N as the winning cultivar in the major mega-environments; however, this observation was not the same in the current study. This could also be attributed to the effects of climate change, like different rainfall patterns during the two studies. Additionally, in the current study, the soybean varieties studied have been recently released and are superior to Maksoy 3N in terms of grain yield. In the current study, Saga is the winning cultivar in Mubuku and Kabanyolo. Therefore, this variety can be recommended for these two locations and the surrounding areas.

4.3. Correlations Between Grain Yield and Yield-Related Traits

Understanding the primary factors affecting soybean grain yield can offer important insights for choosing breeding and management strategies to increase productivity. The elements of the correlation analysis results show if there is a positive or negative relationship among studied traits. If this produces a positive correlation value, increasing the first component will also increase the second component. Nevertheless, raising the first component will result in a drop in the second component if the correlation coefficient is negative [16,36].
This study revealed several important correlations between grain yield and yield-related traits, which can serve as indirect selection criteria for improving soybean productivity. The strong positive correlations between grain yield and traits such as the number of filled pods per plant (r = 0.84) and hundred-seed weight (r = 0.61) suggest that breeding programs focusing on these traits are likely to enhance yield stability and performance. These results are consistent with previous studies, which have similarly found strong correlations between these traits and soybean yield [12,17]. In addition, several studies have found a significant relationship between soybean grain yield and the number of pods per plant [16,23]. Hundred-seed weight has also been reported in previous studies to be positively correlated with grain yield [16]. The following traits have also been reported to be positively correlated to grain yield in soybean: number of branches [16] and plant height [13]. Notably, the negative correlation between grain yield and pod clearance (r = −0.44) highlights a key factor for breeding programs in tropical regions. Lower pod clearance may help protect soybean plants from the adverse effects of drought, heavy rainfall, or high winds, which are expected to become more frequent due to climate change. In environments where moisture stress is common, selecting for traits that minimize pod exposure to environmental extremes could help mitigate yield losses. These findings emphasize the need for breeding strategies that prioritize stress tolerance, particularly in regions increasingly affected by climate instability.

4.4. Path Analysis of Yield-Related Traits

To make sound breeding and management decisions to improve grain yield, plant scientists must clearly understand the different yield-related traits in soybeans. Path analysis was created to examine and interpret relationships between a variety of traits [37,38]. Path analysis has been employed by numerous researchers to predict soybean grain production using various traits [14]. In the current study, the path analysis identified several yield-related traits with significant direct effects on grain yield, providing further insight into the genetic factors driving soybean productivity. The number of lower internodes had the highest positive direct effect on grain yield, followed by the length of the central internodes and the number of filled pods per plant. These traits should be prioritized in breeding programs aiming to enhance yield potential, as they directly contribute to improved productivity [38]. Internode number and length are affected by both genotypic and environmental factors and have been reported to be identical [39]. According to reports, higher CO2 levels and temperatures during the growing season have two effects on plant weight: they increase the number of internodes or internode length [39]. However, internode number and length are also influenced by genotypic factors [40]. According to the current study, grain yield was positively impacted by the number of branches per plant. This agrees with previous studies that have reported that the number of branches per plant has a significant direct contribution to grain yield in soybeans [38].
Grain yield was also directly and significantly impacted by the number of pods per plant. The crop will yield more if it produces more photosynthate (source) and pods (sink) [41]. The availability of enough photosynthate to meet the needs of the developing pod and seeds determines whether the flower is aborted or a pod is set [41]. The amount of photosynthate produced per plant is influenced by both environmental and genetic factors. For instance, more photosynthate is produced and more pods are established during a growing season when the conditions are favorable. The observed results suggest that soybean genotypes with a high number of pods per plant tend to allocate more photosynthate to the development of pods, hence the resultant high grain yields. These findings concur with earlier research that showed that the number of pods per plant is a significant factor in soybean crop yield.
Hundred-seed weight had a direct and significant effect on grain yield. Seed weight is influenced by the length of the seed fill phase and the rate of seed growth [42]. Seeds with a high 100-seed weight typically have faster seed growth rates and more photosynthesis requirements [41]. The weight of the seeds is genetically controlled and largely constant during the seed-filling stage. While favorable late-season rainfall and temperatures do not impact seed number, they can enhance seed weight by extending the seed fill period. Additionally, a severe late-season drought may end the seed-filling cycle early, lower seed size, and result in a low grain yield [41]. Therefore, soybean genotypes with a high 100-seed weight generally have a high seed growth rate or longer seed-filling period or both. The results agree with earlier reports by [25] that 100-seed weight has a positive contribution to grain yield.
Interestingly, the negative direct effects of the number of central internodes and the length of lower internodes suggest that excessive vegetative growth may reduce grain yield. This may be due to the trade-off between vegetative and reproductive growth, where excessive allocation of resources to stem elongation limits the energy available for pod development. These findings align with previous research that highlights the importance of balancing vegetative and reproductive growth for optimizing yield.
Given the anticipated impact of climate change on temperature and moisture availability, these insights are particularly relevant. Selecting genotypes with balanced growth traits that can maintain productivity under both favorable and stressful conditions will be critical for ensuring food security in the coming decades. This reinforces the need for integrating climate resilience into breeding programs, as soybean plants with optimized architecture will be better able to cope with the increasing environmental pressures [41].

5. Conclusions

The results of this study demonstrate that the Maksoy soybean varieties, specifically Maksoy 5N, 4N, and 3N, exhibited superior yield performance and stability across multiple environments in Uganda compared to Seed Co. varieties. Maksoy 5N achieved the highest mean grain yield of 902 kg ha−1, followed closely by Maksoy 4N (896 kg ha−1) and Maksoy 3N (866 kg ha−1), highlighting their adaptability to the diverse agro-ecological conditions of Uganda. These varieties also demonstrated stable performance across environments, as revealed by GGE biplot analysis, making them ideal candidates for low-input agricultural systems in sub-Saharan Africa.
In contrast, Seed Co. varieties, while exhibiting higher yields under favorable conditions, were less stable across environments, indicating that they may be more suited for high-input commercial farming systems where optimal growing conditions can be maintained. Path analysis revealed that traits such as the number of lower internodes, length of central internodes, and filled pods per plant had the highest direct positive effects on grain yield, providing valuable insights for future breeding efforts targeting yield improvement in soybeans.
These findings emphasize the importance of selecting genotypes with both high yield potential and stability to address the challenges of genotype-by-environment interactions. The identified yield-related traits can serve as indirect selection criteria for enhancing soybean productivity in tropical environments. Moving forward, the promotion of Maksoy varieties, particularly for regions with variable climatic conditions, could significantly improve soybean yields and contribute to sustainable agricultural practices in Uganda and similar agro-ecological regions.
Future developments in soybean breeding should focus on enhancing traits like the number of lower internodes, filled pods per plant, and hundred-seed weight, which were identified as key contributors to yield under variable conditions. Additionally, incorporating climate resilience traits such as drought tolerance, disease resistance, and pest tolerance into breeding programs will be essential to sustain high yields as environmental stresses intensify. There is also a need for further research on how climate change will impact different agro-ecological zones in Uganda and beyond, allowing for more precise breeding and management recommendations. Overall, this research provides valuable insights into breeding strategies for soybeans in tropical environments, particularly in the face of climate change. By focusing on stable, high-yielding varieties like Maksoy 5N, 4N, and 3N, breeding programs can contribute to more resilient agricultural systems across sub-Saharan Africa.

Author Contributions

Conceptualization, T.O., M.N. and P.T.; study design, T.O., M.N. and P.T.; data collection, T.O., M.N. and J.M.; data analysis, J.P.S., J.M. and B.A.; data interpretation, J.P.S., J.M. and B.A.; writing, T.O., J.P.S., P.T., M.N., B.A., J.M. and G.C.; literature search, G.T. and G.C.; figures, G.T. and G.C. All authors have read and agreed to the published version of the manuscript.

Funding

This research was funded by the International Institute of Tropical Agriculture (IITA) and Makerere University Centre for Soybean Improvement and Development (MAKCSID).

Data Availability Statement

The original contributions presented in the study are included in the article, further inquiries can be directed to the corresponding author.

Acknowledgments

The authors thank Makerere University for providing the experimental materials used in this research.

Conflicts of Interest

The authors declare no conflicts of interest.

References

  1. Gupta, K.S. Breeding Oilseed Crops for Sustainable Production: Opportunities and Constraints; Academic Press: Cambridge, MA, USA, 2015; ISBN 978-0-12-801309-0. [Google Scholar]
  2. Our World in Data. Available online: https://ourworldindata.org/drivers-of-deforestation#is-our-appetite-for-soy-driving-deforestation-in-the-amazon (accessed on 6 August 2024).
  3. Agralytica. Agralytica United Soybean Board Connections 2012: Soybean Market Scan; Agralytica: Washington, DC, USA, 2012; p. 97. [Google Scholar]
  4. FAOSTAT. 2022. Available online: http://www.fao.org/faostat (accessed on 17 November 2024).
  5. WWF. The Growth of Soy: Impacts and Solutions; WWF International: Gland, Switzerland, 2014; ISBN 978-2-940443-79-6. Available online: http://issuu.com/wwfsoyreport/docs/wwf_soy_report_final_jan_19/1?e=10667775/6569194 (accessed on 26 October 2024).
  6. Joala, R. The Rise of Soya in Zambia and the Integration of smallholder farmers. Inst. Poverty Land Agrar. Stud. 2018, 1–4. [Google Scholar]
  7. Masuda, T.; Goldsmith, P.D. World soybean production: Area harvested, yield, and long-term projections. Int. Food Agribus. Manag. Rev. 2009, 12, 143–162. [Google Scholar] [CrossRef]
  8. Singh, P.; Kumar, R.; Sabapathy, S.N.; Bawa, A.S. Functional and edible uses of soy protein products. Compr. Rev. Food Sci. Food Saf. 2008, 7, 14–28. [Google Scholar] [CrossRef]
  9. Hardarson, G.; Atkins, C. Optimising biological N2 fixation by legumes in farming systems. Plant Soil 2003, 252, 41–54. [Google Scholar] [CrossRef]
  10. Sanginga, N.; Woomer, P.L. Integrated Soil Fertility Management in Africa: Principles Practices and Development Process; Tropical Soil Biology and Fertility (TSBF); International Centre for Tropical Agriculture (CIAT): Nairobi, Kenya, 2009; ISBN 978-92-9059-261-7. [Google Scholar]
  11. Sanginga, P.C.; Adesina, A.A.; Manyong, V.M.; Otite, O.; Dashiell, K.E. Social impact of soybean in Nigeria’s southern Guinea savanna. Trop. Agric. 1999, 34. [Google Scholar]
  12. Sarutayophat, T. Correlation and path coefficient analysis for yield and its components in vegetable soybean. Songklanakarin J. Sci. Technol. 2012, 34, 273–277. [Google Scholar]
  13. Balla, M.Y.; Ibrahim, S.E. Genotypic Correlation and Path Coefficient Analysis of Soybean [Glycine max (L.) Merr.] for Yield and Its Components. Agric. Res. Technol. 2017, 7, 3–7. [Google Scholar]
  14. Ferrari, M.; Carvalho, I.R.; de Pelegrin, A.J.; Nardino, M.; Szareski, V.J.; Olivoto, T.; da Rosa, T.C.; Follmann, D.N.; Pegoraro, C.; da Maia, L.C.; et al. Path analysis and phenotypic correlation among yield compnents of soybean using environmental stratification methods. Aust. J. Crop Sci. 2018, 12, 193–202. [Google Scholar] [CrossRef]
  15. Wei, M.C.F.; Molin, J.P. Soybean yield estimation and its components: A linear regression approach. Agric. Switz. 2020, 10, 348. [Google Scholar] [CrossRef]
  16. Karyawati, A.S.; Puspitaningrum, E.S.V. Correlation and path analysis for agronomic traits contributing to yield in 30 genotypes of soybean. Biodiversitas 2021, 22, 1146–1151. [Google Scholar] [CrossRef]
  17. Lekota, M.P.; Morojele, M.E.; Motanyane, M.S. Assessment of Yield and Yield Components of Soya-Bean (Glycine max (L.) Merril) Grown Under Conventional Agronomic Practices of Lesotho. SSRN Electron. J. 2021, 9, 1–7. [Google Scholar] [CrossRef]
  18. Mulugeta, A.; Kidane, S.; Abadi, S.; Fisha, Z. GGE biplots to analyze soybean multi-environment yield trial data in north Western Ethiopia. J. Plant Breed. Crop Sci. 2013, 5, 245–254. [Google Scholar] [CrossRef]
  19. Adie, M.M.; Krisnawati, A.; Gatut-Wahyu, A.S. Assessment of Genotype × Environment Interactions for Black Soybean Yield using Ammi and GGE Biplot. Int. J. Agric. Innov. Res. 2014, 2, 673–678. [Google Scholar]
  20. Cheelo, P.; Lungu, D.; Mwala, M. GGE Biplot Analysis for Identification of Ideal Soybean [Glycine max L. Merrill] Test and Production Locations in Zambia. J. Exp. Agric. Int. 2017, 15, 1–15. [Google Scholar] [CrossRef]
  21. El-Mohsen, A. Agronomical evaluation of six soybean cultivars using correlation and regression analysis under different irrigation regime conditions. J. Plant Breed. Crop Sci. 2013, 5, 91–102. [Google Scholar] [CrossRef]
  22. de Carvalho, C.G.P.; Arias, C.A.A.; de Toledo, J.F.F.; de Oliveira, M.F.; Vello, N.A. Correlações e análise de trilha em linhagens de soja semeadas em diferentes épocas. Pesqui. Agropecuária Bras. 2002, 37, 311–320. [Google Scholar] [CrossRef]
  23. Akram, R.M.; Fares, W.M.; Fateh, H.S.A.; Rizk1, A.M.A. Genetic variability, correlation and path analysis in soybean. Legume Res. 2011, 34, 36–40. [Google Scholar]
  24. Iqbal, S.; Mahmood, T.; Tahira Muhammad Ali, M.A.; Sarwar, M. Path Coefficient Analysis in Different Genotypes of Soybean (Glycine max (L.) Merril). Pak. J. Biol. Sci. 2003, 6, 1085–1087. [Google Scholar] [CrossRef]
  25. Vu, T.T.H.; Le, T.T.C.; Vu, D.H.; Nguyen, T.T.; Ngoc, T. Correlations and Path Coefficients for Yield Related Traits in Soybean Progenies. Asian J. Crop Sci. 2019, 11, 32–39. [Google Scholar] [CrossRef]
  26. Rodrigues, G.B.; Marim, B.G.; da Silva, D.J.H.; Mattedi, A.P.; de Souza, V. Path analysis of primary and secondary yield components in tomato plants of the Salad group. Pesqui. Agropecu. Bras. 2010, 45, 155–162. [Google Scholar] [CrossRef]
  27. Dvorjak, D.S.; Unêda-Trevisoli, S.H.; De Sousa Leite, W.; Da Silva, A.J.; Da Silva, F.M.; Di Mauro, A.O. Correlations and path analysis in soybean progenies with resistance source to cyst nematode (race 3). Comun. Sci. 2019, 10, 168–175. [Google Scholar] [CrossRef]
  28. De Mendiburu, F. Agricolae: Statistical Procedures for Agricultural Research. R Package Version 1.3-5. 2021. Available online: https://cran.r-project.org/web/packages/agricolae/index.html (accessed on 26 October 2024).
  29. Yan, W.; Rajcan, I. Biplot analysis of test sites and trait relations of soybean in Ontario. Crop Sci. 2002, 42, 11–20. [Google Scholar] [CrossRef] [PubMed]
  30. Wickham, H.; François, R.; Henry, L.; Müller, K. Dplyr: A Grammar of Data Manipulation. R Package Version 0.8.4. Available online: https://CRAN.R-project.org/package=dplyr (accessed on 26 October 2024).
  31. Taiyun, W.; Viliam, S. R package “corrplot”: Visualization of a Correlation Matrix. (Version 0.88). Available online: https://github.com/taiyun/corrplot (accessed on 26 October 2024).
  32. Lenka, D.; Misra, B. Path Coefficient Analysis of Yield in Rice Varieties. Indian J. Agric. Sci. 1973, 43, 376–379. [Google Scholar]
  33. Obua, T.; Sserumaga, J.P.; Awio, B.; Nganga, F.; Odong, T.L.; Tukamuhabwa, P.; Tusiime, G.; Mukasa, S.B.; Nabasirye, M. Multi-environmental evaluation of protein content and yield stability among tropical soybean genotypes using gge biplot analysis. Agronomy 2021, 11, 1265. [Google Scholar] [CrossRef]
  34. Yan, W.; Kang, M.S.; Ma, B.; Woods, S.; Cornelius, P.L. GGE biplot vs. AMMI analysis of genotype-by-environment data. Crop Sci. 2007, 47, 643–655. [Google Scholar] [CrossRef]
  35. Tukamuhabwa, P.; Oloka, H.K.; Sengooba, T.; Kabayi, P. Yield stability of rust-resistant soybean lines at four mid-altitude tropical locations. Euphytica 2012, 183, 1–10. [Google Scholar] [CrossRef]
  36. Valencia-Ramírez, R.A.; Ligarreto-Moreno, G.A. Phenotypic correlation and path analysis for yield in soybean (Glycine max (L.) Merril). Acta Agronómica 2012, 61, 353–363. [Google Scholar]
  37. Kozak, M.; Azevedo, R.A. Does using stepwise variable selection to build sequential path analysis models make sense? Physiol. Plant. 2011, 141, 197–200. [Google Scholar] [CrossRef]
  38. Xu, C.; Li, R.; Song, W.; Wu, T.; Sun, S.; Hu, S.; Han, T.; Wu, C. Responses of Branch Number and Yield Component of Soybean Cultivars Tested in Different Planting Densities. Agriculture 2021, 11, 69. [Google Scholar] [CrossRef]
  39. Allen, L.H.; Zhang, L.; Boote, K.J.; Hauser, B.A. Elevated temperature intensity, timing, and duration of exposure affect soybean internode elongation, mainstem node number, and pod number per plant. Crop J. 2018, 6, 148–161. [Google Scholar] [CrossRef]
  40. Pereira-Flores, M.E.; Justino, F.B. Yield Components and Biomass Partition in Soybean: Climate Change Vision; IntechOpen: London, UK, 2019. [Google Scholar]
  41. Van Roekel, R.J.; Purcell, L.C. Understanding and Increasing Soybean Yields. 2016, 1–6. Available online: https://dr.lib.iastate.edu/entities/publication/864f0deb-5cb3-437d-a0da-ea6b049a2e14 (accessed on 26 October 2024). [CrossRef]
  42. Van Roekel, R.J.; Purcell, L.C.; Salmerón, M. Physiological and management factors contributing to soybean potential yield. Field Crops Res. 2015, 182, 86–97. [Google Scholar] [CrossRef]
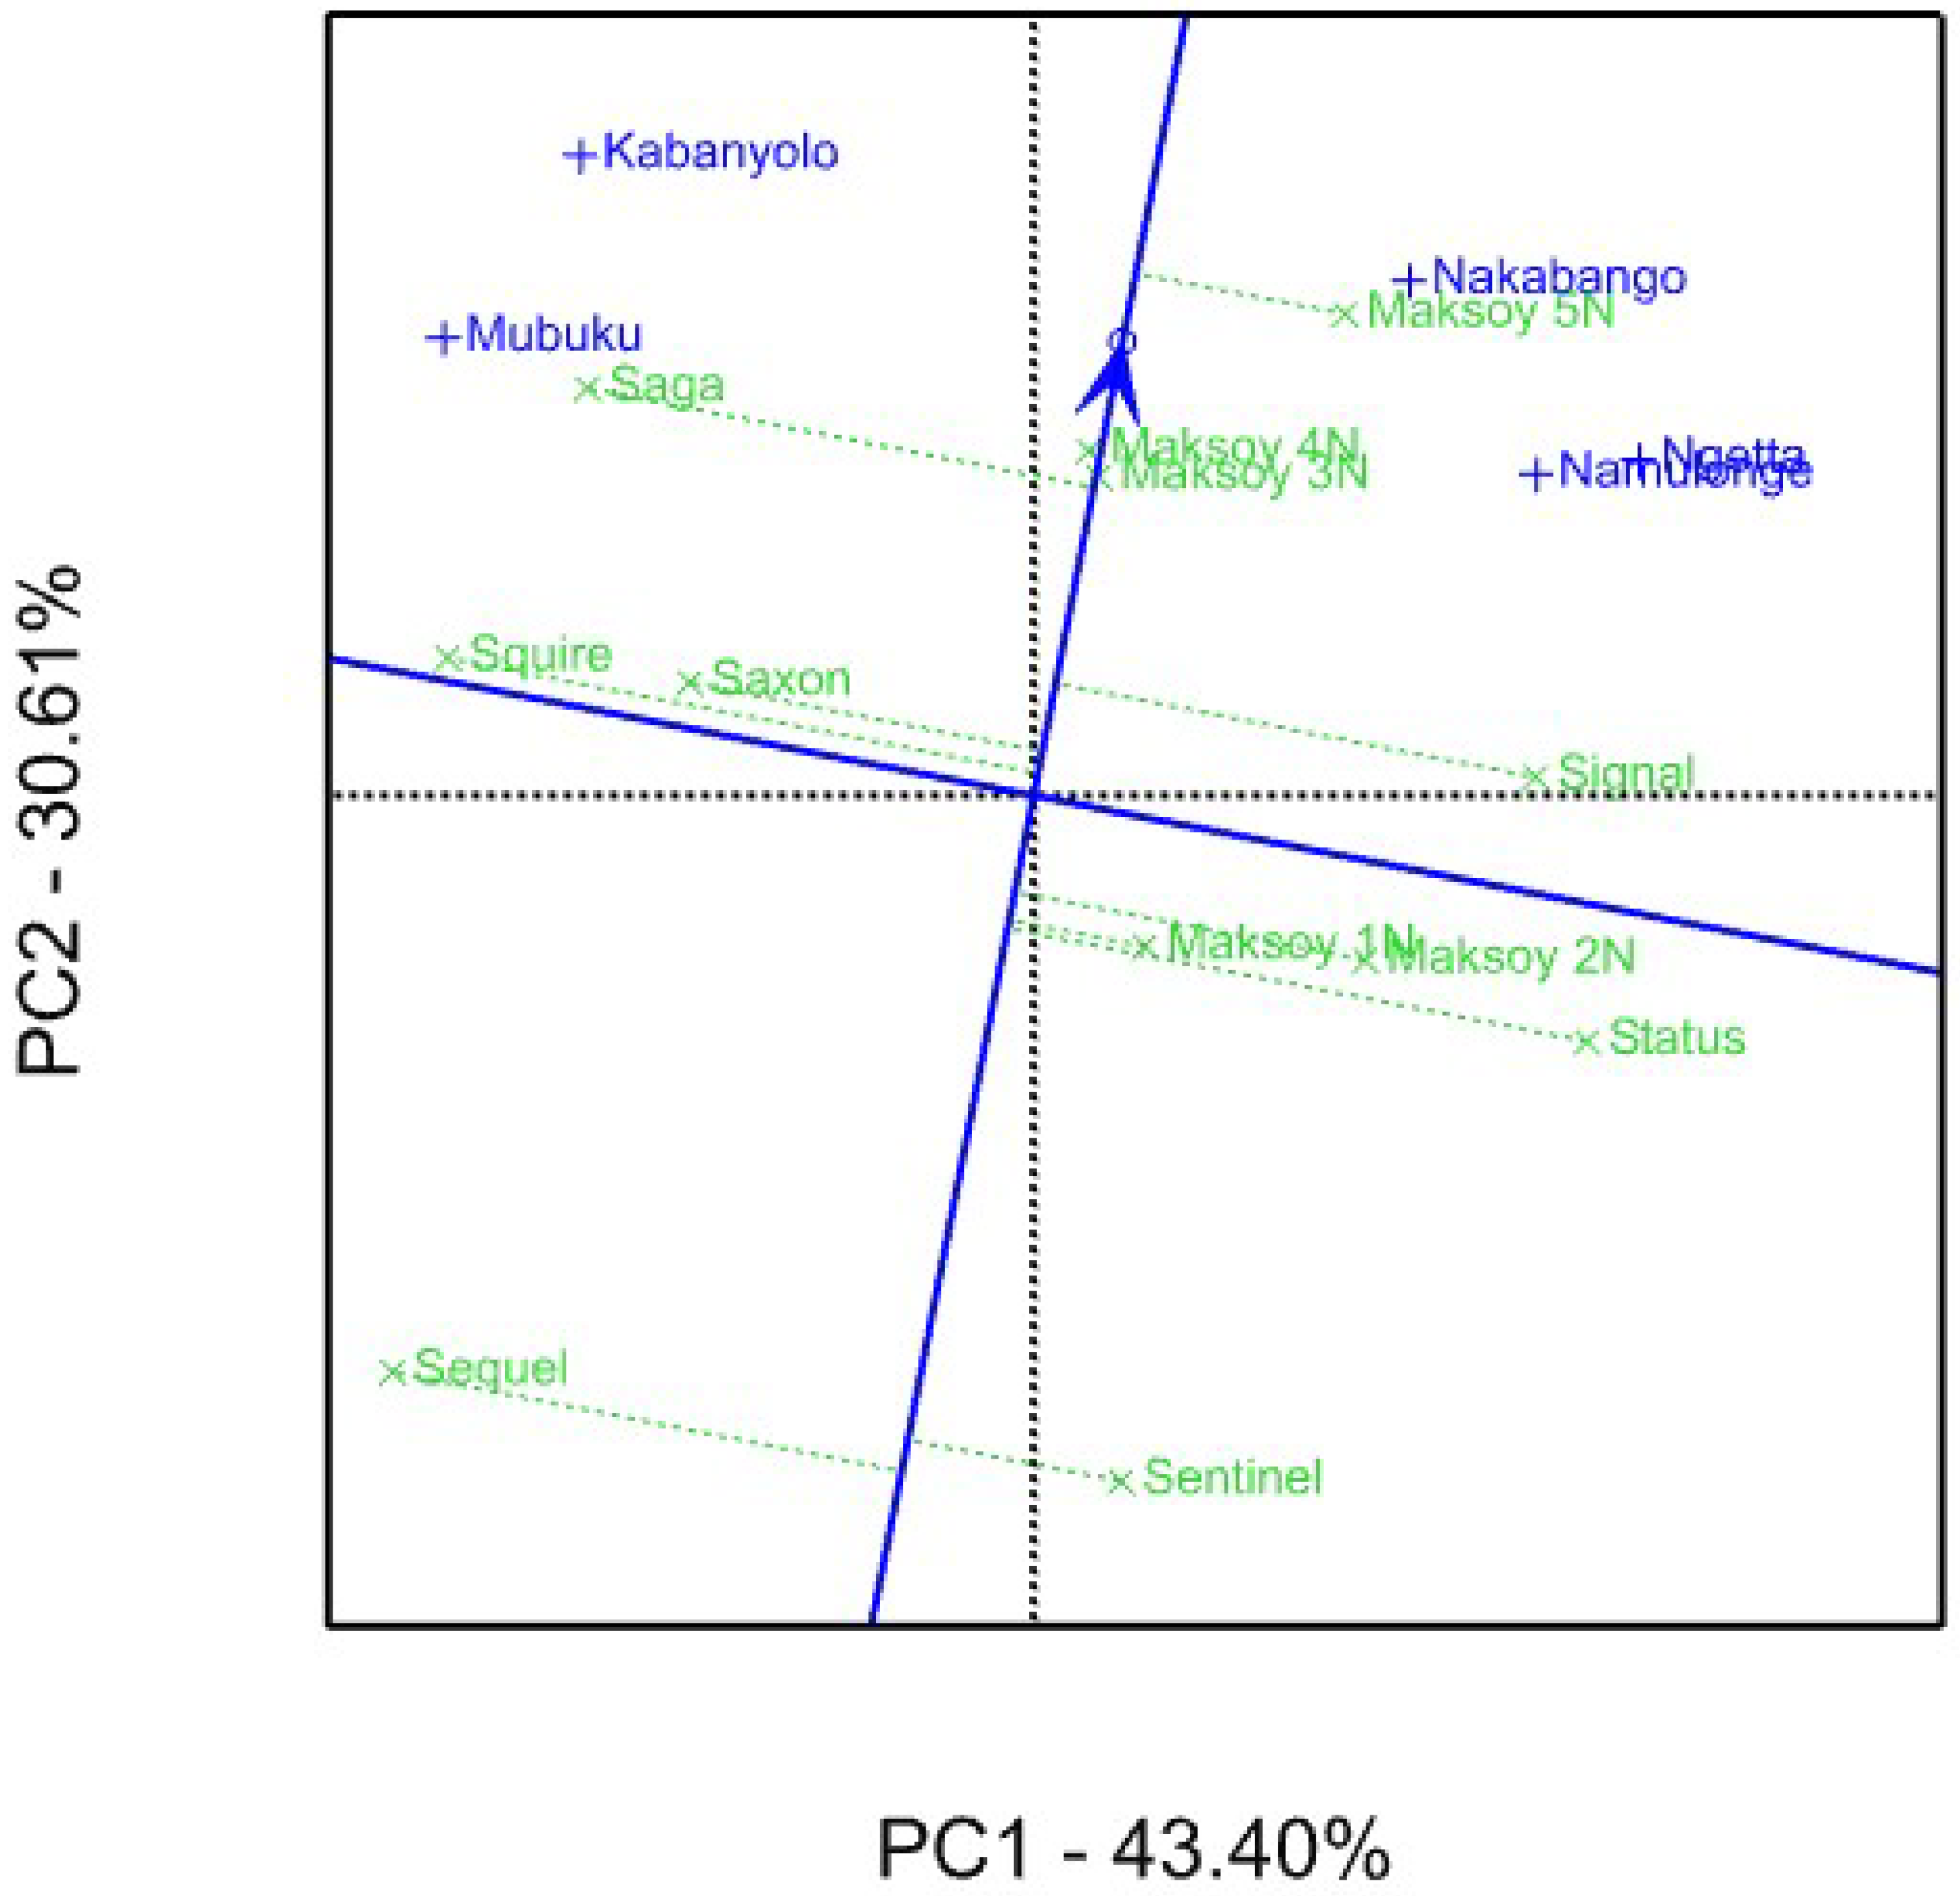
Figure 1. GGE Biplot for combined analysis of 12 soybean genotypes tested for grain yield over two seasons at five locations.
Agronomy 14 02826 g001
Figure 2. GGE Biplot for combined analysis of 12 soybean genotypes tested for grain yield over two seasons at five locations.
Agronomy 14 02826 g002
Figure 3. GGE Biplot for combined analysis of 12 soybean genotypes tested for grain yield over two seasons at five locations.
Agronomy 14 02826 g003
Figure 4. A GGE Comparison biplot displaying performance and stability of 12 soybean genotypes tested in five locations and two seasons concerning grain yield.
Agronomy 14 02826 g004
Figure 5. A corrplot displaying the distribution and association of the studied traits. Flowering = number of days to 50% flowering, maturity = number of days to physiolgical maturity, PH = plant height, PC = pod clearance, FP = number of filled pods per plant, SPP = number of pods per plant, branches = number of branches per plant, LLI = length of lower internodes, LCI = length of central internodes, LUI = length of upper internodes, NLI = number of lower internodes, NCI = number of central internodes, NUI = number of upper internodes, HSW = 100 seed weight (g), yield = grain yield in Kg per hectare. *, **, and *** indicate significance at p ≤ 0.05, p ≤ 0.01, and p ≤ 0.001, respectively; values without * are not significant at p < 0.05.
Agronomy 14 02826 g005
Figure 6. Cause and effect relationships among the predictor traits associated with grain yield. Flw = number of days to 50% flowering, Mtr = number of days to physiological maturity, PH = plant height, PC = pod clearance, FP = number of filled pods per plant, SPP = number of pods per plant, Brn = number of branches per plant, LLI = length of lower internodes, LCI = length of central internodes, LUI = length of upper internodes, NLI = number of lower internodes, NCI = number of central internodes, NUI = number of upper internodes, HSW = 100 seed weight (g), Yld = grain yield in Kg per hectare. Green arrows = positive effects, Red arrows = negative effects.
Agronomy 14 02826 g006
Table 1. Characteristics of the soybean genotypes used in the study.
Genotype Origin
1. Maksoy 1NMakerere University
2. Maksoy 2NMakerere University
3. Maksoy 3NMakerere University
4. Maksoy 4NMakerere University
5. Maksoy 5NMakerere University
6. SagaSeed Co.
7. SaxonSeed Co.
8. SentinelSeed Co.
9. SequelSeed Co.
10. SignalSeed Co.
11. SquireSeed Co.
12. StatusSeed Co.
Table 2. Description of the five locations used in this study.
Location RegionCoordinatesAltitude (masl)Mean Annual Temperature (°C)Mean Annual Rainfall (mm)
NamulongeCentral0o32′ N/32o37′ E116022.61400
KabanyoloCentral0o28′ N/32o36′ E118021.41234
NakabangoEastern0o29′ N/33°14′ E121022.81400
NgettaNorthern2°17′ N/32°56′ E110324.71200
MubukuWestern0o13′ N/30o08′ E100727.8750
Source: Meteorological station data obtained from each location; masl = meters above sea level.
Table 3. Analysis of variance of 12 soybean genotypes tested for grain yield in Uganda across two seasons and five locations.
Source of VariationDFSum SqMean SqF ValueF Pr.
Season15,262,1775,262,17784.68***
Genotype113,408,556309,8694.99***
Location432,565,9928,141,498131.01***
Genotype × Season111,275,954115,9961.87ns
Genotype × Location449,570,005217,5003.5***
Location × Season415,471,8633,867,96662.24***
Genotype × Location × Season442,585,38658,7590.95ns
Rep 251,68125,8400.42
Residual23214,417,73562,145
Total35383,847,837
*** indicate significance at α ≤ 0.001 respectively. ns = not significant.
Table 4. Grain yield (kg ha−1) of 12 soybean genotypes tested in five locations and two seasons in Uganda.
GenotypeKabanyoloMubukuNakabangoNamulongeNgettaMean
Maksoy 1N66610678592861421860 abc
Maksoy 2N6869476895701234825 abc
Maksoy 3N72912428085231349930 bc
Maksoy 4N77411876994591771978 c
Maksoy 5N739109410884061569979 c
Saga80913427653791142887 abc
Saxon76312377263781031827 abc
Sentinel646844648362906681 a
Sequel6741262507212804692 a
Signal6759897875261672930 bc
Squire8161195770343599745 ab
Status6368738444281571870 abc
Mean71811077664061256850
Genotype means followed by different letter(s) are significantly different using LSD (p < 0.05).
Table 5. Estimates of direct and indirect effects of the different traits on grain yield of soybean varieties tested.
Response TraitEstimateStd.ErrZ-Valuep (>|z|)Std.LvStd.All
Flowering1.2068.2800.1460.8841.2060.012
Maturity−10.8843.736−2.9130.004−10.884−0.250
PH7.1593.4002.1050.0357.1590.291
Branches49.67125.3961.9560.05049.6710.114
FP48.6546.9447.0070.00048.6540.608
SPP−31.08729.998−1.0360.300−31.087−0.054
LLI−91.70715.286−5.9990.000−91.707−0.548
LCI54.07614.2253.8010.00054.0760.425
LUI−8.7245.676−1.5370.124−8.724−0.220
NLI373.07580.0814.6590.000373.0750.423
NCI−200.74290.325−2.2220.026−200.742−0.232
NUI−18.97526.594−0.7140.476−18.975−0.074
HSW13.0426.7441.9340.05313.0420.163
Disclaimer/Publisher’s Note: The statements, opinions and data contained in all publications are solely those of the individual author(s) and contributor(s) and not of MDPI and/or the editor(s). MDPI and/or the editor(s) disclaim responsibility for any injury to people or property resulting from any ideas, methods, instructions or products referred to in the content.