Grain-Filling Characteristics and Yield Formation of Rice at Saline Field

Abstract
1. Introduction
2. Materials and Methods
2.1. Experimental Site, Soil Properties, and Meteorological Information
2.2. Rice Cultivar, Experimental Design, and Field Management
2.3. Sampling and Measurement
2.4. Model Analysis of Grain Filling
2.5. Statistical Analysis
3. Results
3.1. Grain Yield and Yield Components
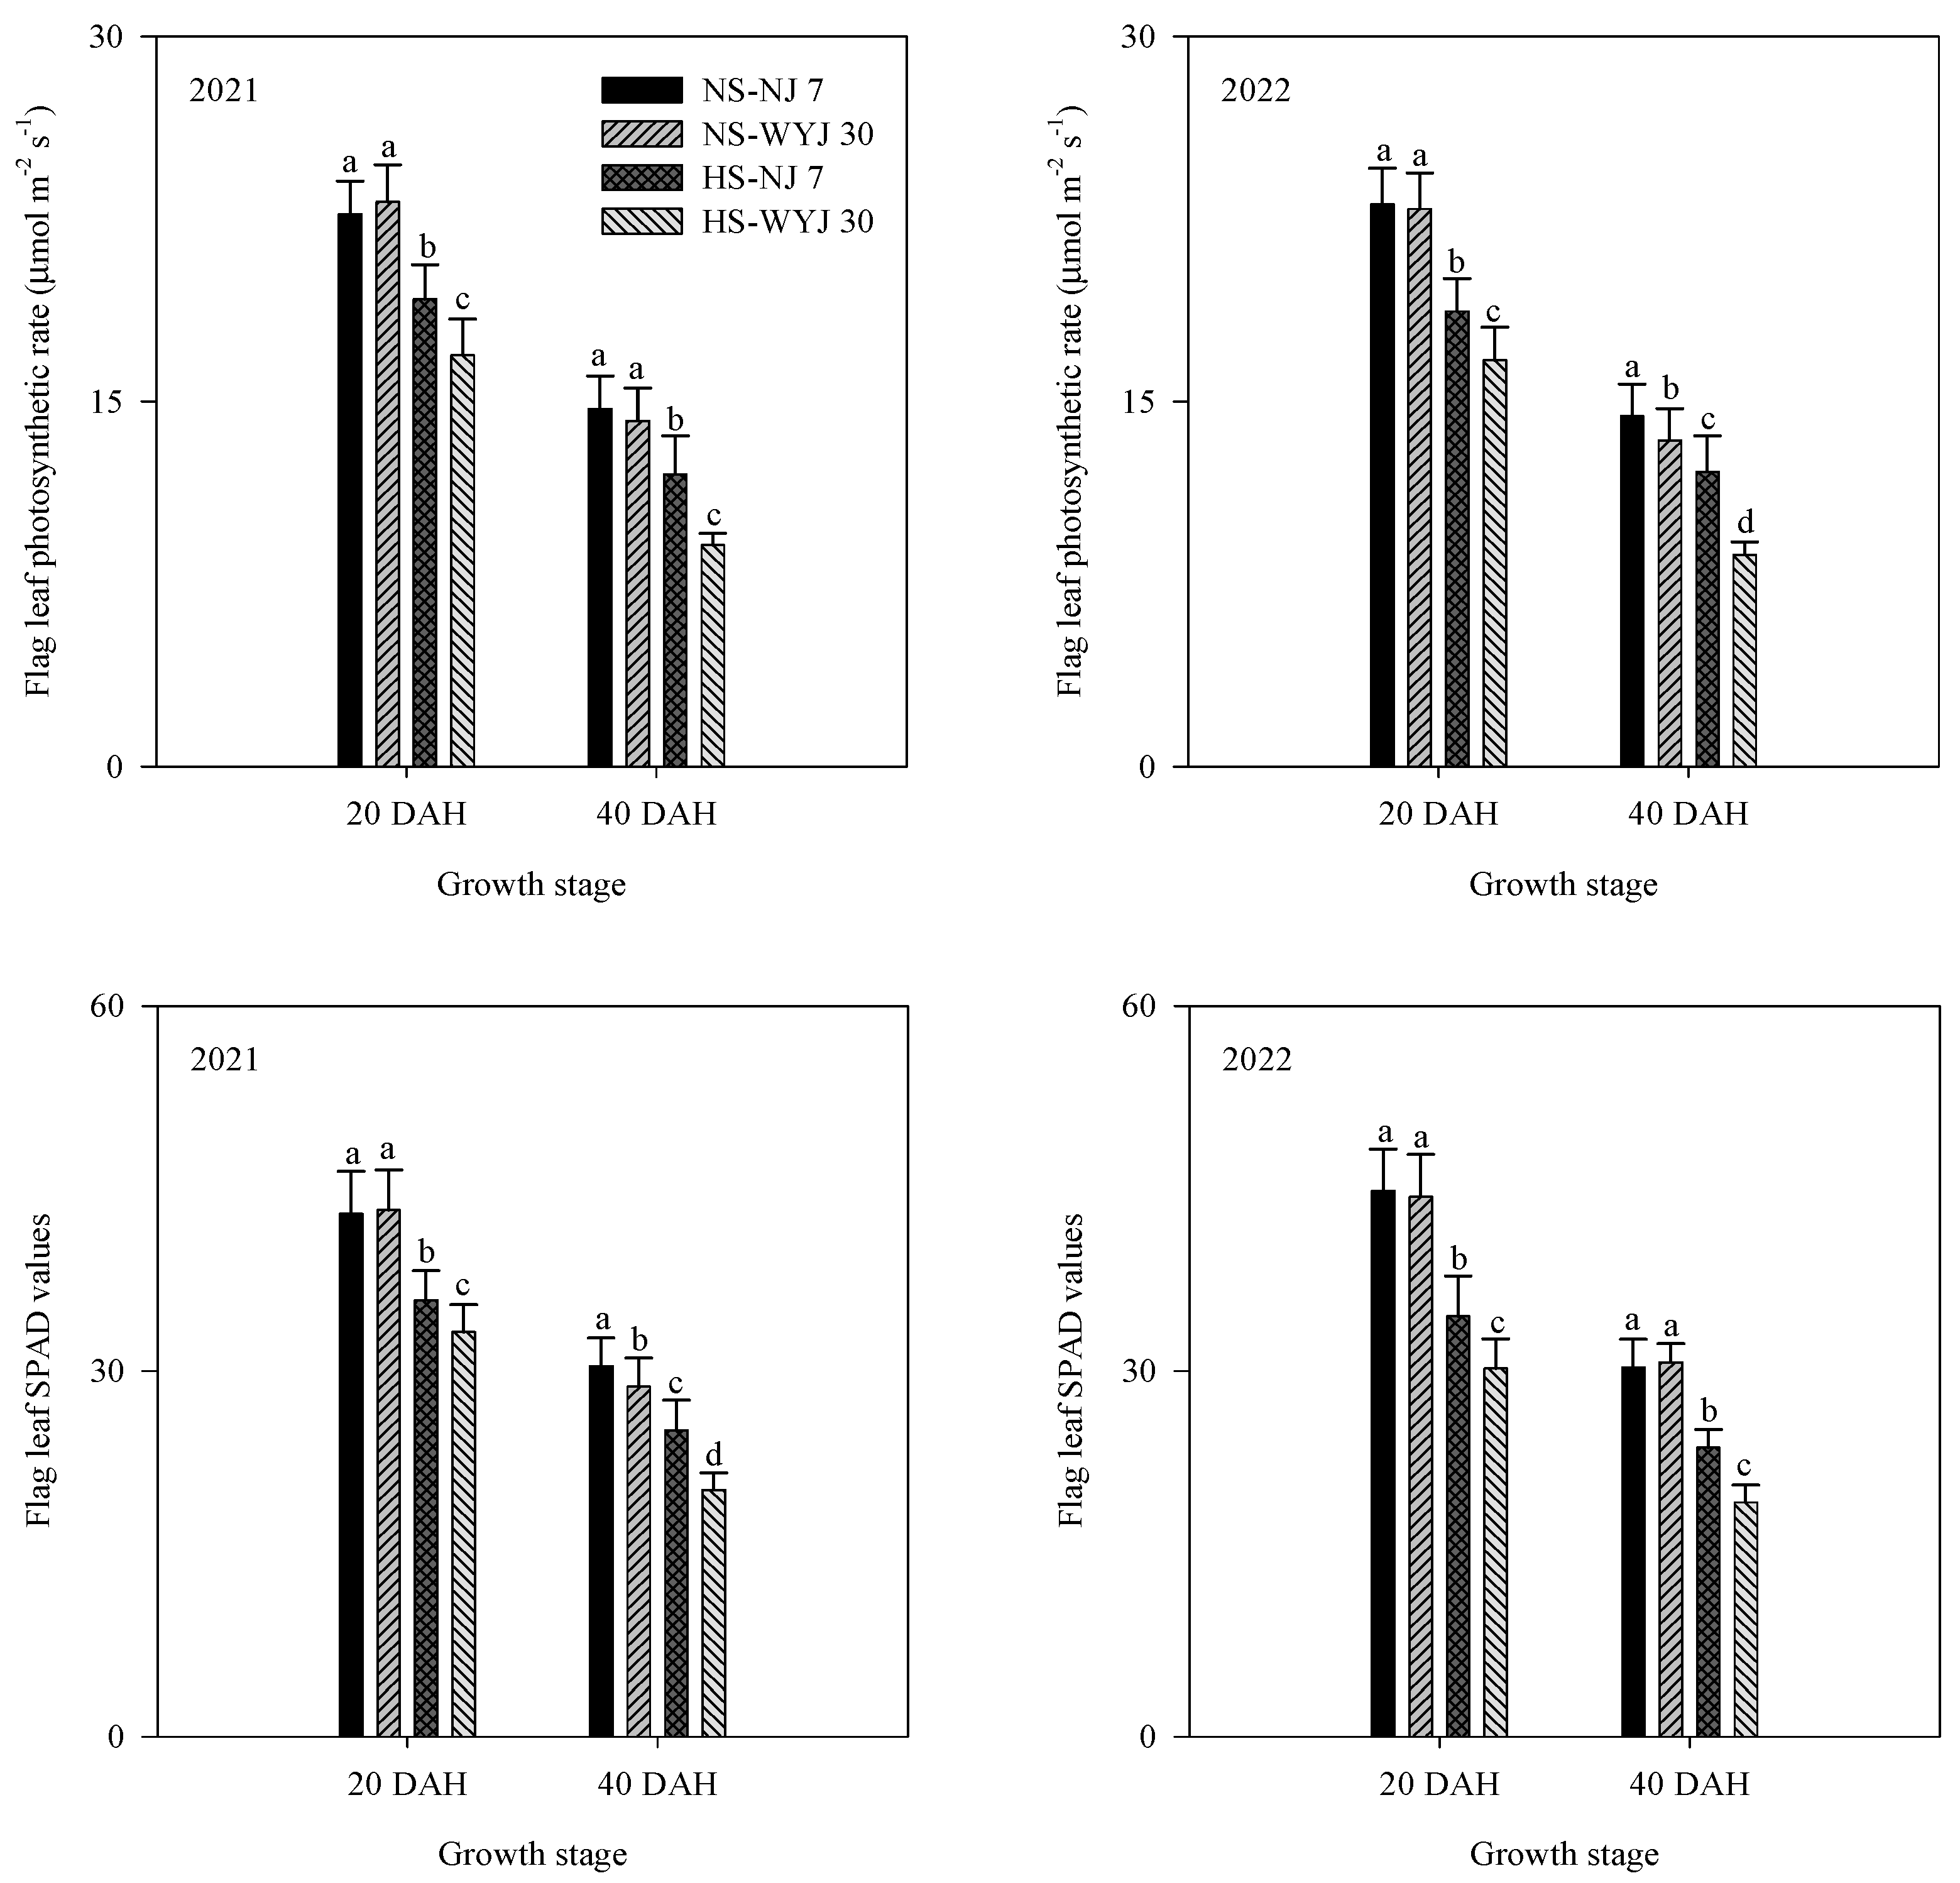
3.2. Dry Matter Weight, Leaf Photosynthetic Rate, and SPAD Values
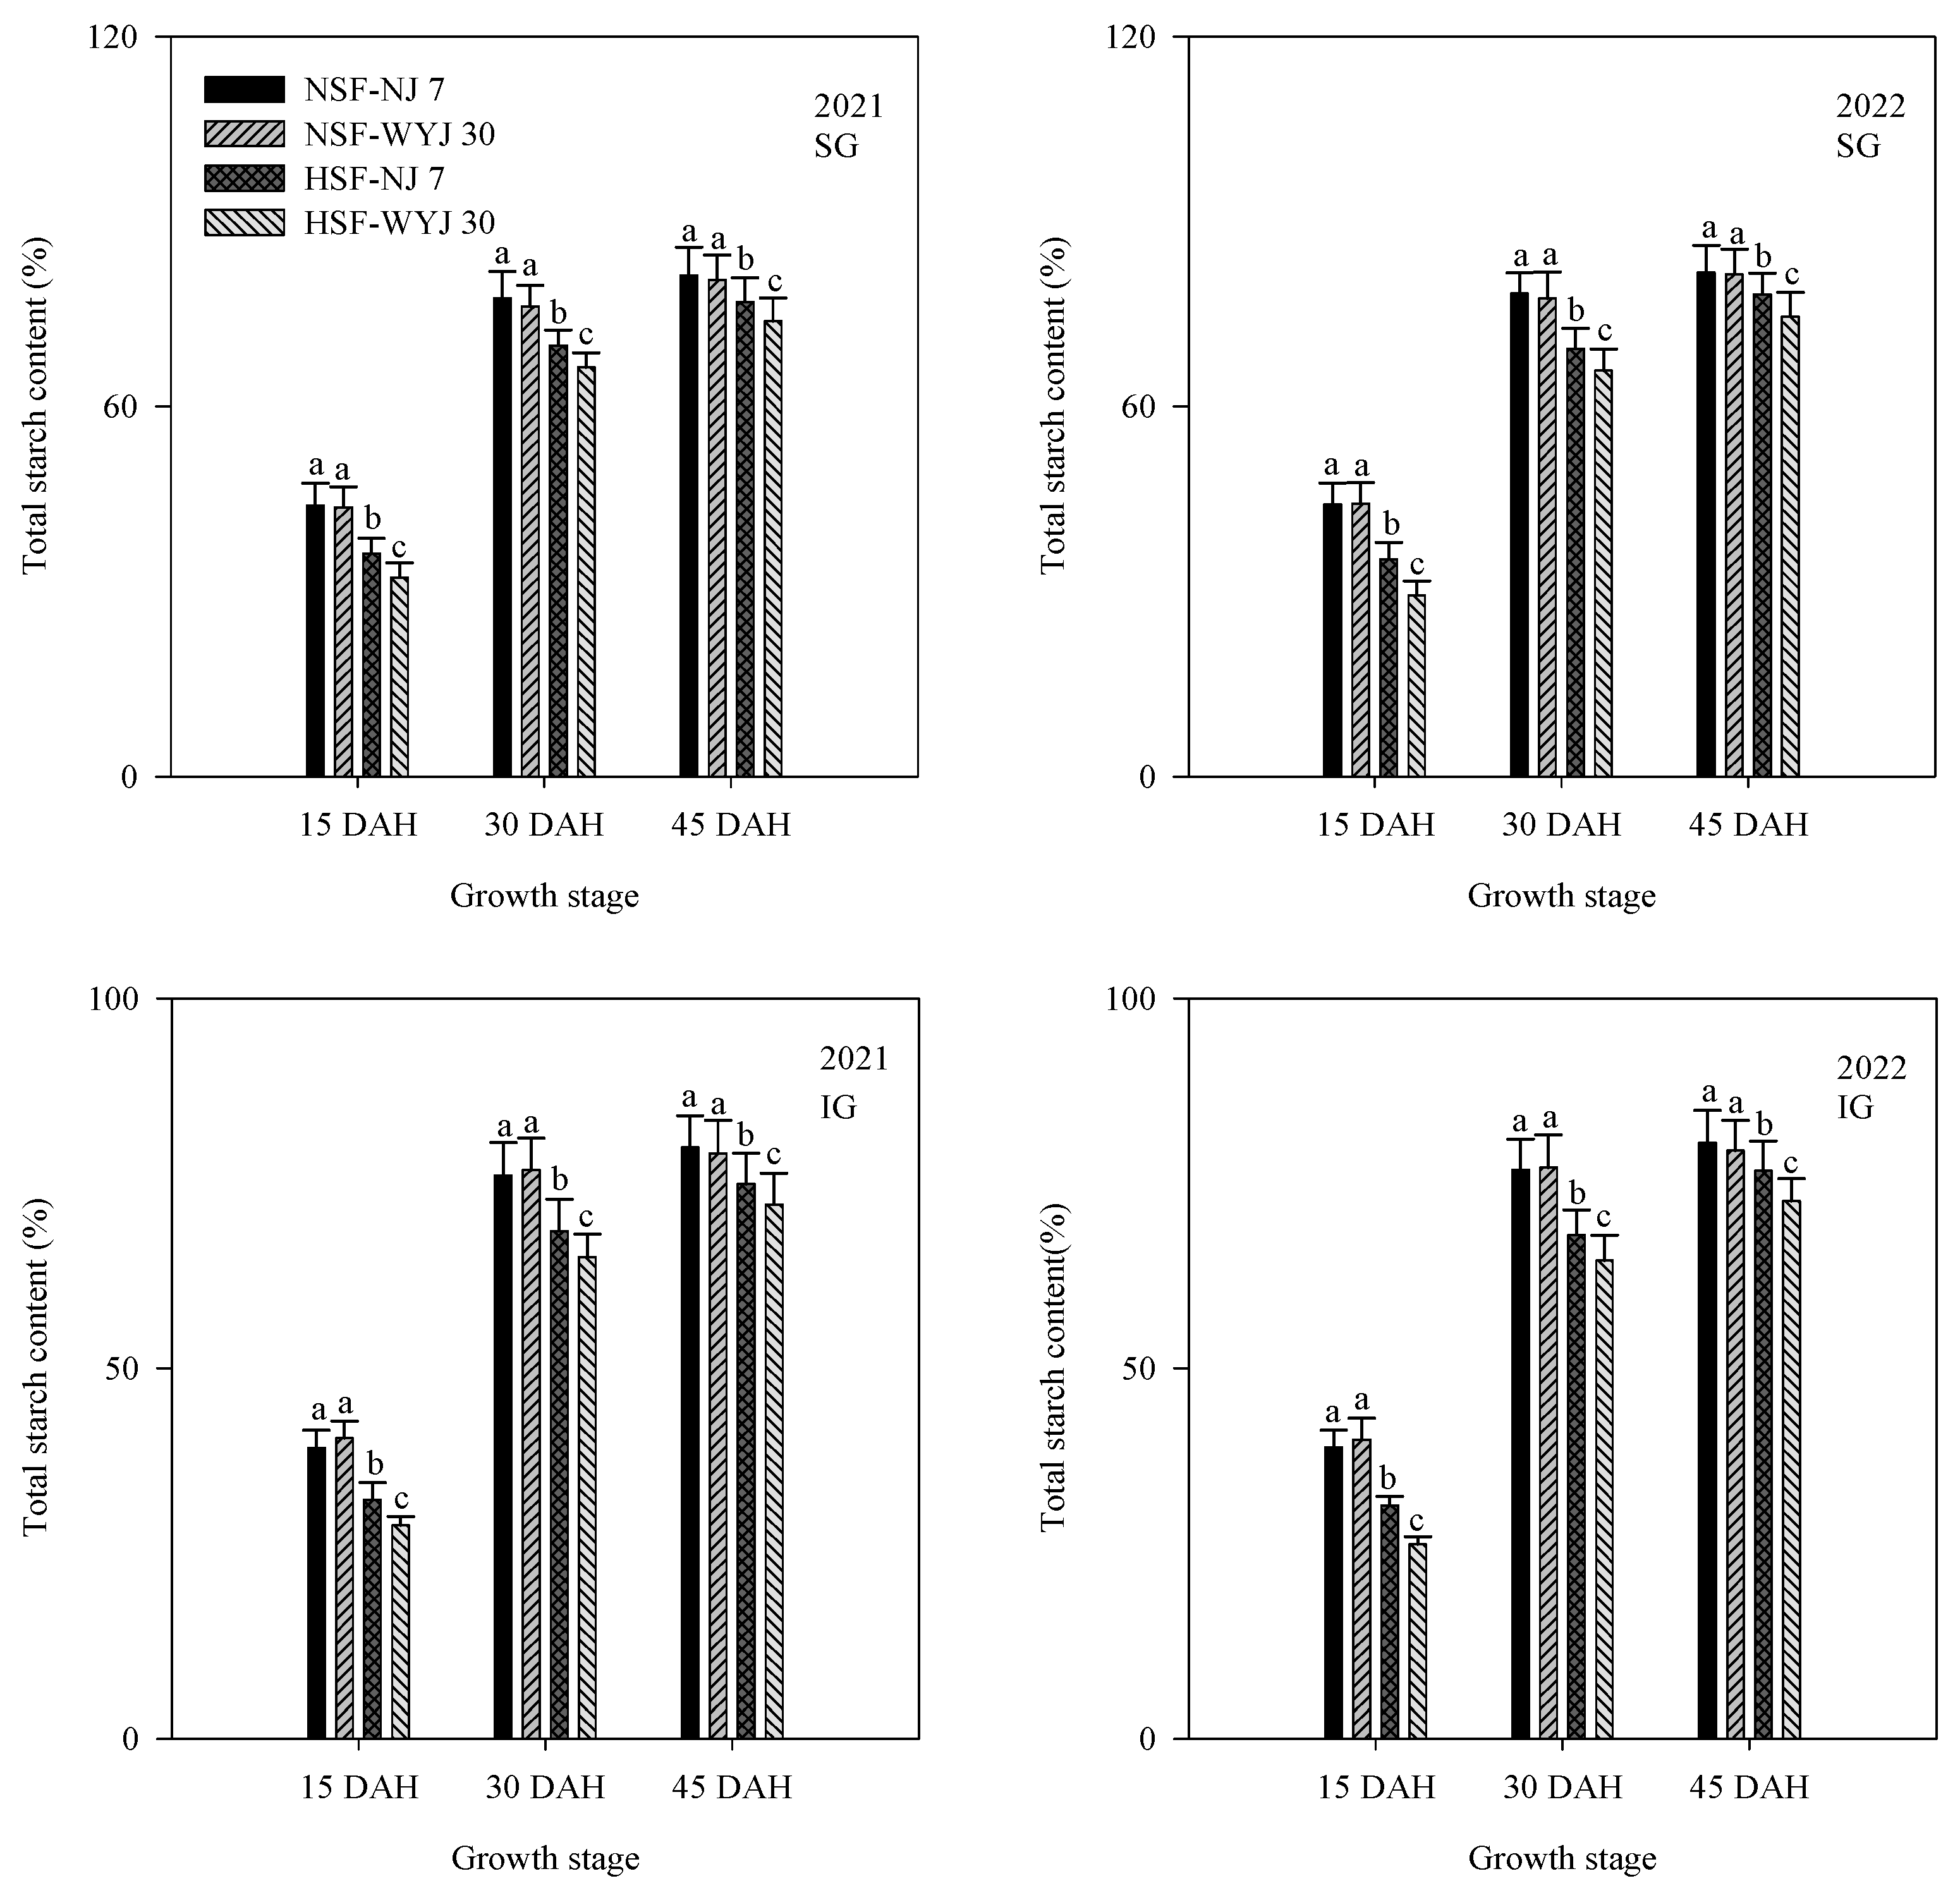
3.3. Total Starch Content and Related Enzyme Activities
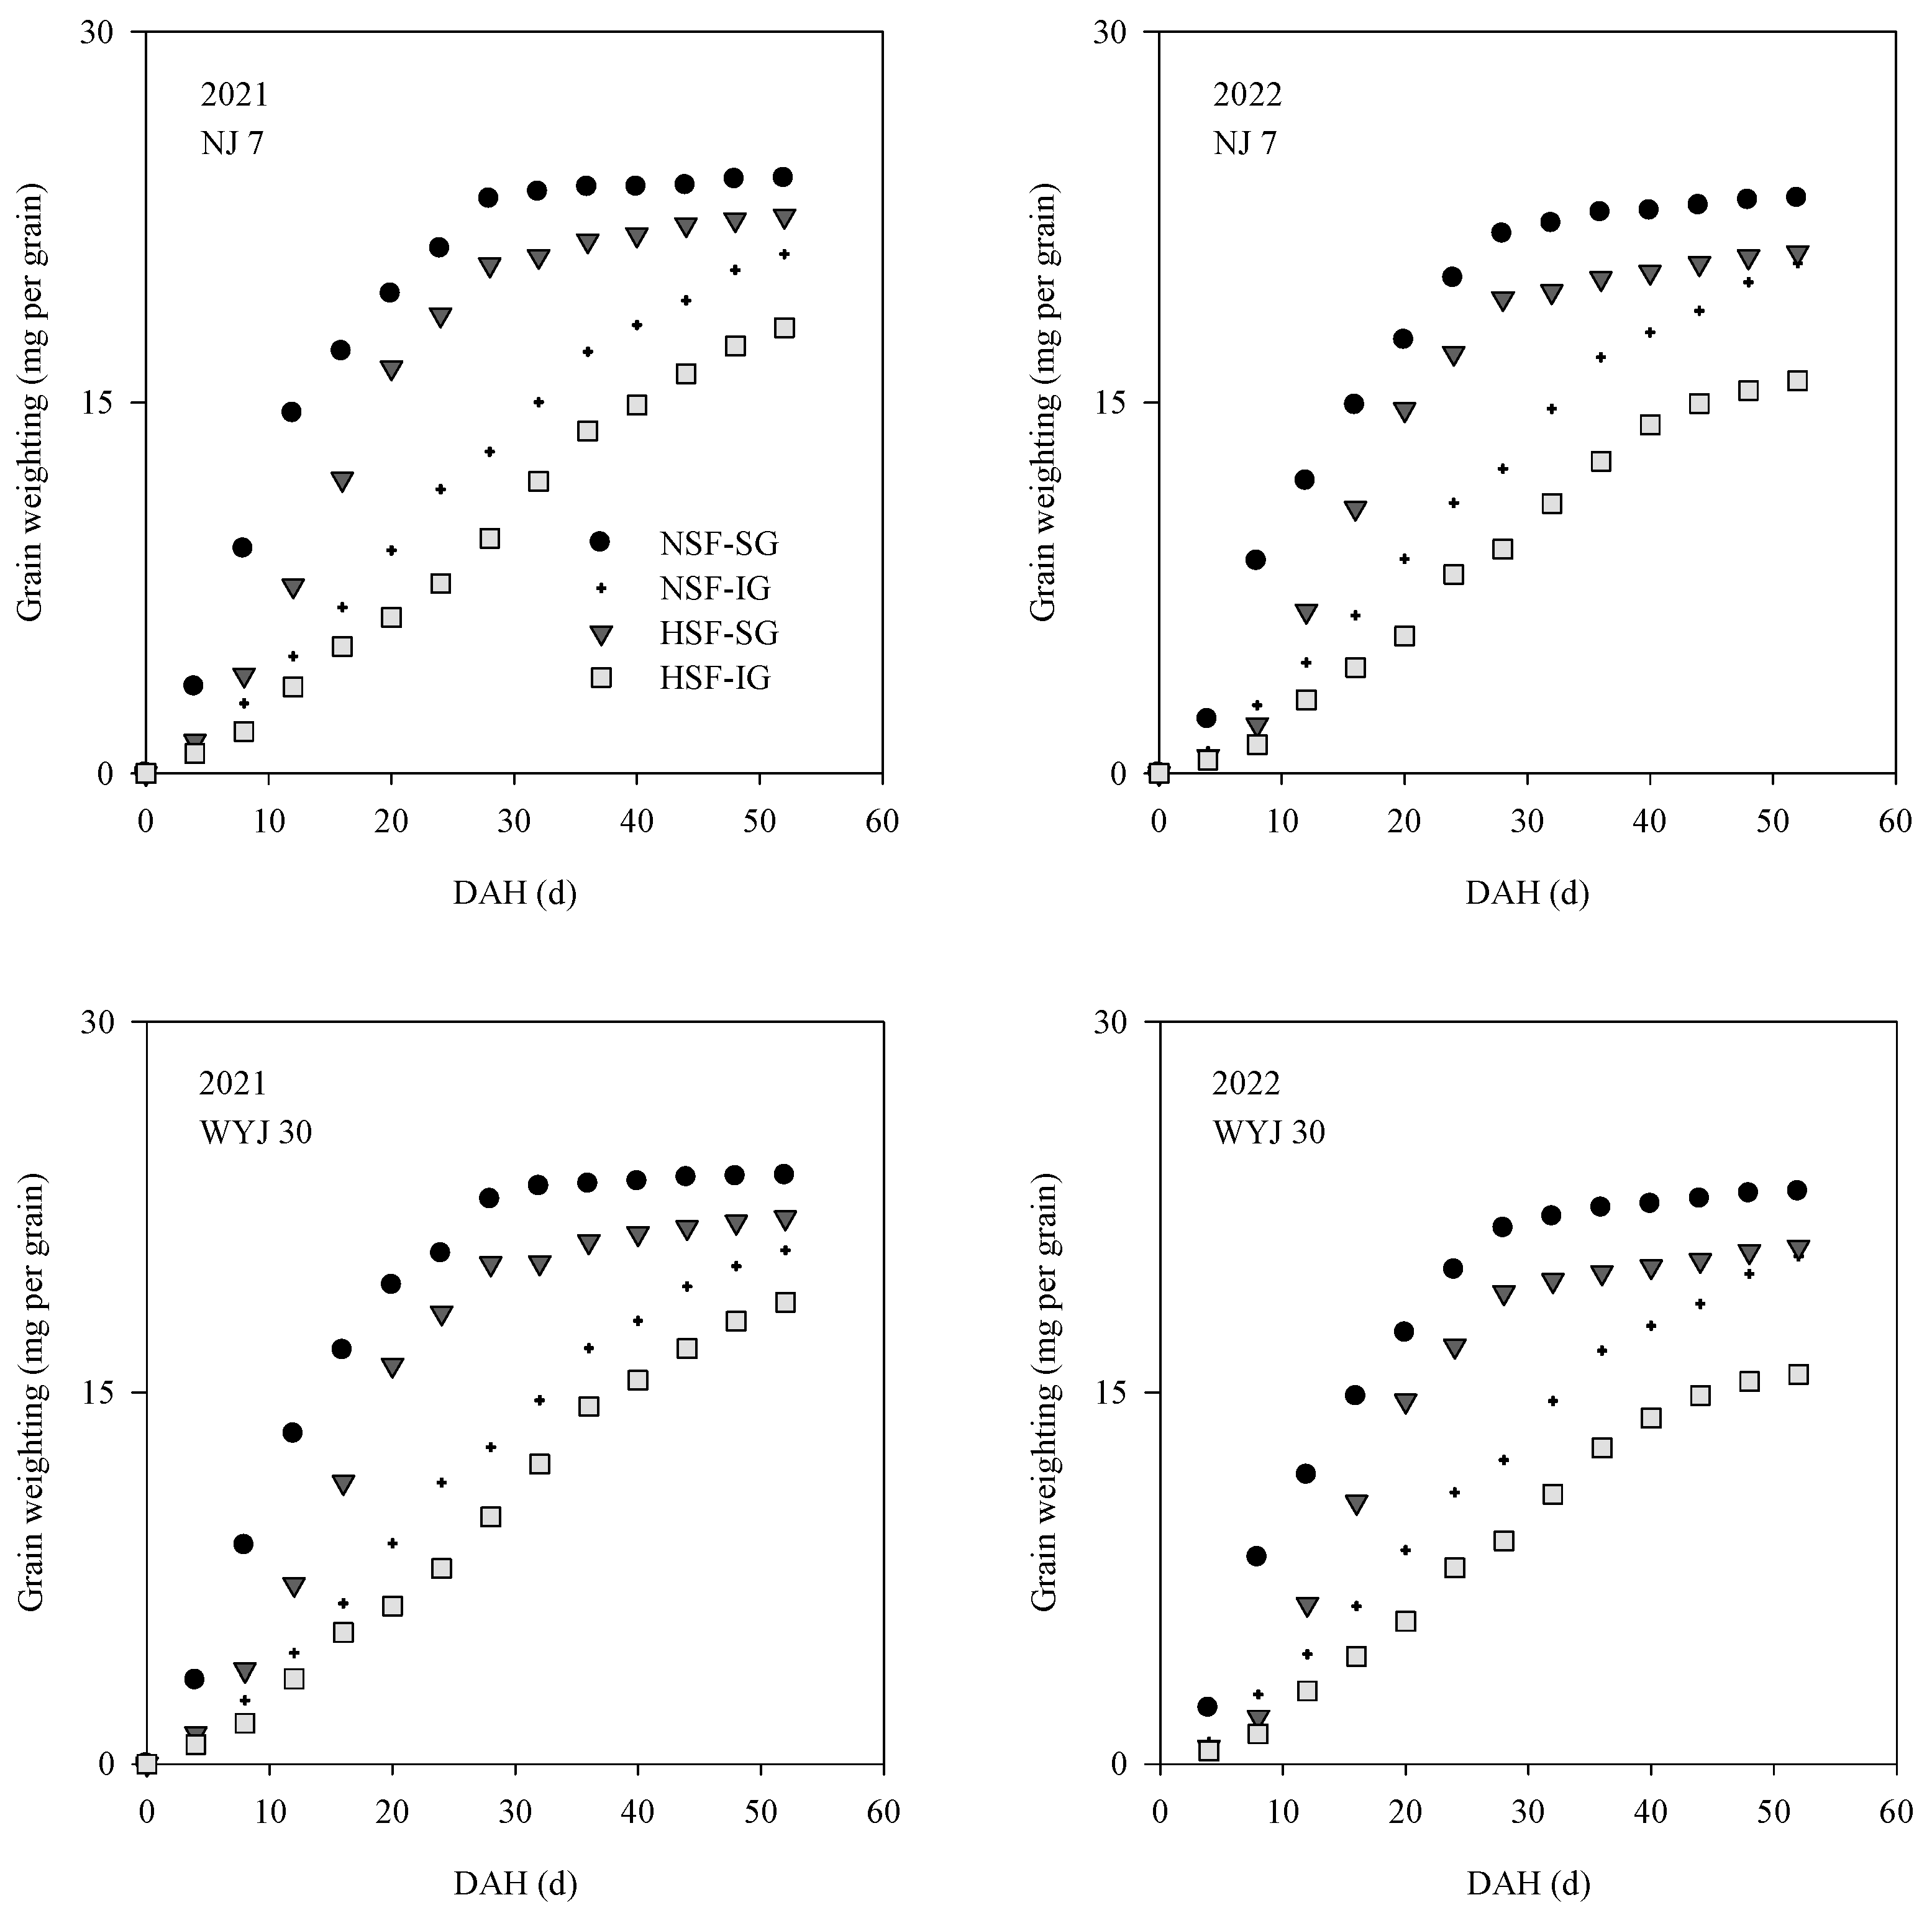
3.4. Grain-Filling Dynamics and Characteristics
3.5. Correlation Analysis
4. Discussion
4.1. Grain Yield Formation of Rice at Saline Field
4.2. Effects of Salinity Stress on Grain-Filling Characteristics of Rice at Saline Field
5. Conclusions
Supplementary Materials
Author Contributions
Funding
Data Availability Statement
Conflicts of Interest
References
- Rezvi, H.U.; Tahjib-Ul-Arif, M.; Azim, M.A.; Tumpa, T.A.; Tio, M.M.H.; Najnine, F.; Dawood, M.F.A.; Skalicky, M.; Brestic, M. Rice and food security: Climate change implications and the future prospects for nutritional security. Food Energy Secur. 2023, 12, 1. [Google Scholar] [CrossRef]
- Clapp, J.; Moseley, W.G.; Burlingame, B.; Termine, P. Viewpoint: The case for a six-dimensional food security framework. Food Policy 2022, 106, 102164. [Google Scholar] [CrossRef]
- Liu, B.S.; Liu, Y.; Huang, G.Z.; Jiang, X.T.; Liang, Y.P.; Yang, C.; Huang, L.H. Comparison of yield prediction models and estimation of the relative importance of main agronomic traits affecting rice yield formation in saline-sodic paddy fields. Eur. J. Agron. 2023, 148, 126870. [Google Scholar] [CrossRef]
- Meng, T.Y.; Zhang, X.B.; Ge, J.L.; Chen, X.; Yang, Y.L.; Zhu, G.L.; Chen, Y.L.; Zhou, G.S.; Wei, H.H.; Dai, Q.G. Agronomic and physiological traits facilitating better yield performance of japonica/indica hybrids in saline fields. Field Crops Res. 2021, 271, 108255. [Google Scholar] [CrossRef]
- Ferichani, M.; Prasetya, D.A. System of rice intensification increases rice productivity on saline soil. Paddy Water Environ. 2017, 15, 649–657. [Google Scholar] [CrossRef]
- Numan, M.; Bashir, S.; Khan, Y.; Mumtaz, R.; Shinwari, Z.K.; Khan, A.L.; Khan, A.; Al-Harrasi, A. Plant growth promoting bacteria as an alternative strategy for salt tolerance in plants: A review. Microbiol. Res. 2018, 209, 21–32. [Google Scholar] [CrossRef] [PubMed]
- Xu, Z.K.; Shao, T.Y.; Lv, Z.X.; Yue, Y.; Liu, A.H.; Long, X.H.; Zhou, Z.S.; Gao, X.M.; Rengel, Z. The mechanisms of improving coastal saline soils by planting rice. Sci. Total Environ. 2020, 703, 135529. [Google Scholar] [CrossRef] [PubMed]
- Liu, E.B.; Zeng, S.Y.; Zhu, S.S.; Liu, Y.; Wu, G.C.; Zhao, K.M.; Liu, X.L.; Liu, Q.M.; Dong, Z.Y.; Dong, X.J.; et al. Favorable alleles of grain-filling rate1 increase the grain-filling rate and yield of rice. Plant Physiol. 2019, 181, 1207–1222. [Google Scholar] [CrossRef]
- Teng, Z.N.; Chen, Y.K.; Yuan, Y.Q.; Peng, Y.Q.; Yi, Y.K.; Yu, H.H.; Yi, Z.X.; Yang, J.C.; Peng, Y.; Duan, M.J. Identification of microRNAs regulating grain filling of rice inferior spikelets in response to moderate soil drying post-anthesis. Crop J. 2022, 10, 962–971. [Google Scholar] [CrossRef]
- Zhang, Z.X.; Zhao, H.; Huang, F.L.; Long, J.F.; Song, G.; Lin, W.X. The 14-3-3 protein GF14f negatively affects grain filling of inferior spikelets of rice (Oryza sativa L.). Plant J. 2019, 99, 344–358. [Google Scholar] [CrossRef] [PubMed]
- Dou, Z.; Zhang, H.X.; Chen, W.Z.; Li, G.H.; Liu, Z.H.; Ding, C.Q.; Chen, L.; Wang, S.H.; Ding, Y.F.; Tang, S. Grain-filling of superior spikelets and inferior spikelets for japonica rice under low-amplitude warming regime in lower reaches of Yangtze River Basin. J. Agr. Sci. 2021, 159, 59–68. [Google Scholar] [CrossRef]
- Kimbembe, R.E.R.; Li, G.Y.; Fu, G.F.; Feng, B.H.; Fu, W.M.; Tao, L.X.; Chen, T.T. Proteomic analysis of salicylic acid regulation of grain filling of two near-isogenic rice (Oryza sativa L.) varieties under soil drying condition. Plant Physiol. Bioch. 2020, 151, 659–672. [Google Scholar] [CrossRef] [PubMed]
- Sun, Y.J.; Yan, F.J.; Sun, Y.Y.; Xu, H.; Guo, X.; Yang, Z.Y.; Yin, Y.Z.; Guo, C.C.; Ma, J. Effects of different water regimes and nitrogen application strategies on grain filling characteristics and grain yield in hybrid rice. Arch. Agron. Soil Sci. 2018, 64, 1152–1171. [Google Scholar] [CrossRef]
- Korres, N.E.; Loka, D.A.; Gitsopoulos, T.K.; Varanasi, V.K.; Chachalis, D.; Price, A.; Slaton, N.A. Salinity effects on rice, rice weeds, and strategies to secure crop productivity and effective weed control. A review. Agron. Sustain. Dev. 2022, 42, 58. [Google Scholar] [CrossRef]
- Zhang, R.; Wang, Y.; Hussain, S.; Yang, S.; Li, R.K.; Liu, S.L.; Chen, Y.L.; Wei, H.H.; Dai, Q.G.; Hou, H.Y. Study on the effect of salt stress on yield and grain quality among different rice varieties. Front. Plant Sci. 2022, 13, 918460. [Google Scholar] [CrossRef]
- Zheng, C.; Liu, C.T.; Liu, L.; Tan, Y.N.; Sheng, X.B.; Yu, D.; Sun, Z.Z.; Sun, X.W.; Chen, J.; Yuan, D.Y.; et al. Effect of salinity stress on rice yield and grain quality: A meta-analysis. Eur. J. Agron. 2023, 144, 126765. [Google Scholar] [CrossRef]
- Faseela, P.; Sinisha, A.K.; Brestic, M.; Puthur, J.T. Chlorophyll a fluorescence parameters as indicators of a particular abiotic stress in rice. Photosynthetica 2020, 58, 293–300. [Google Scholar] [CrossRef]
- Tisarum, R.; Theerawitaya, C.; Samphumphuang, T.; Polispitak, K.; Thongpoem, P.; Singh, H.P.; Cha-um, S. Alleviation of salt stress in upland rice (Oryza sativa L. ssp. indica cv. Leum Pua) using arbuscular mycorrhizal fungi inoculation. Front. Plant Sci. 2020, 11, 348. [Google Scholar] [CrossRef]
- Abulaiti, A.; She, D.L.; Liu, Z.P.; Sun, X.Q.; Wang, H.D. Application of biochar and polyacrylamide to revitalize coastal saline soil quality to improve rice growth. Environ. Sci. Pollut. R. 2023, 30, 18731–18747. [Google Scholar] [CrossRef]
- El-Hendawy, S.E.; Ruan, Y.; Hu, Y.; Schmidhalter, U. A comparison of screening criteria for salt tolerance in wheat under field and controlled environmental conditions. J. Agron. Crop Sci. 2009, 195, 353–367. [Google Scholar] [CrossRef]
- Upadhyay, S.K.; Singh, D.P. Effect of salt-tolerant plant growth-promoting rhizobacteria on wheat plants and soil health in a saline environment. Plant Biol. 2015, 17, 288–293. [Google Scholar] [CrossRef] [PubMed]
- Fujita, N.; Miura, S.; Crofts, N. Effects of various allelic combinations of starch biosynthetic genes on the properties of endosperm starch in rice. Rice 2022, 15, 24. [Google Scholar] [CrossRef] [PubMed]
- Chen, Y.L.; Fang, W.C.; Chen, S.M.; Zhang, Y.; Ansah, E.O.; An, G.H.; Xiong, F.; Wu, Y.F. Effects of endogenous cytokinin on physicochemical properties of superior and inferior grain starch in rice. Starch Starke 2023, 75, 2200151. [Google Scholar] [CrossRef]
- Jiang, Q.; Du, Y.L.; Tian, X.Y.; Wang, Q.S.; Xiong, R.H.; Xu, G.C.; Yan, C.; Ding, Y.F. Effect of panicle nitrogen on grain filling characteristics of high-yielding rice cultivars. Eur. J. Agron. 2016, 74, 185–192. [Google Scholar] [CrossRef]
- Prathap, V.; Ali, K.; Singh, A.; Vishwakarma, C.; Krishnan, V.; Chinnusamy, V.; Tyagi, A. Starch accumulation in rice grains subjected to drought during grain filling stage. Plant Physiol. Biochem. 2019, 142, 440–451. [Google Scholar]
- Chen, Y.; Wang, M.; Ouwerkerk, P.B.F. Molecular and environmental factors determining grain quality in rice. Food Energy Secur. 2012, 1, 111–132. [Google Scholar] [CrossRef]
- Panda, B.B.; Badoghar, A.K.; Sekhar, S.; Kariali, E.; Mohapatra, P.K.; Shaw, B.P. Biochemical and molecular characterisation of salt-induced poor grain filling in a rice cultivar. Funct. Plant Biol. 2016, 43, 266–277. [Google Scholar] [CrossRef]
- Tejada, M.; Garcia, C.; Gonzalez, J.L.; Hernandez, M.T. Use of organic amendment as a strategy for saline soil remediation: Influence on the physical, chemical and biological properties of soil. Soil Biol. Biochem. 2006, 38, 1413–1421. [Google Scholar] [CrossRef]
- United States Salinity Laboratory. Diagnoses and Improvement of Saline and Alkali Soils. In Agriculture Handbook No 60; USDA: Washington, DC, USA, 1954; p. 160. [Google Scholar]
- Wei, H.H.; Zhang, X.B.; Ge, J.L.; Chen, X.; Meng, T.Y.; Yang, Y.; Xiong, F.; Chen, Y.L.; Dai, Q.G. Effects of salinity stress on spikelets formation and grains filling in rice (Oryza sativa L.). Acta Agron. Sin. 2021, 47, 2471–2480. [Google Scholar]
- Zhang, R.; Hussain, S.; Wang, Y.; Liu, Y.H.; Li, Q.; Chen, Y.L.; Wei, H.H.; Gao, P.L.; Dai, Q.G. Comprehensive evaluation of salt tolerance in rice (Oryza sativa L.) germplasm at the germination stage. Agronomy 2021, 11, 1569. [Google Scholar] [CrossRef]
- Singh, K. Microbial and enzyme activities of saline and sodic soils. Land Degrad. Dev. 2016, 27, 706–718. [Google Scholar] [CrossRef]
- Syed, A.; Sarwar, G.; Shah, S.H.; Muhammad, S. Soil salinity research in 21st century in Pakistan: Its impact on availability of plant nutrients, growth and yield of crops. Commun. Soil Sci. Plan. 2021, 52, 183–200. [Google Scholar] [CrossRef]
- Zeng, L.H.; Shannon, M.C. Effects of salinity on grain yield and yield components of rice at different seeding densities. Agron. J. 2000, 92, 418–423. [Google Scholar] [CrossRef]
- Zheng, C.K.; Zhou, G.H.; Zhang, Z.Z.; Li, W.; Peng, Y.B.; Xie, X.Z. Moderate salinity stress reduces rice grain yield by influencing expression of grain number- and grain filling-associated genes. J. Plant Growth Regul. 2021, 40, 1111–1120. [Google Scholar] [CrossRef]
- Zhu, G.L.; Li, H.T.; Shi, X.X.; Wang, Y.; Zhi, W.F.; Chen, X.B.; Liu, J.W.; Ren, Z.; Shi, Y.; Ji, Z.Y.; et al. Nitrogen management enhanced plant growth, antioxidant ability, and grain yield of rice under salinity stress. Agron. J. 2020, 112, 550–563. [Google Scholar] [CrossRef]
- Formentin, E.; Sudiro, C.; Perin, G.; Riccadonna, S.; Barizza, E.; Baldoni, E.; Lavezzo, E.; Stevanato, P.; Sacchi, G.A.; Fontana, P.; et al. Transcriptome and cell physiological analyses in different rice cultivars provide new insights into adaptive and salinity stress responses. Front. Plant Sci. 2018, 9, 204. [Google Scholar] [CrossRef]
- Park, D.Y.; Shim, Y.; Gi, E.; Lee, B.O.; An, G.; Kang, K.; Paek, N.C. The MYB-related transcription factor RADIALIS-LIKE3 (OsRL3) functions in ABA-induced leaf senescence and salt sensitivity in rice. Environ. Exp. Bot. 2018, 156, 86–95. [Google Scholar] [CrossRef]
- Villa, J.E.; Henry, A.; Xie, F.M.; Serraj, R. Hybrid rice performance in environments of increasing drought severity. Field Crops Res. 2012, 125, 14–24. [Google Scholar] [CrossRef]
- Xu, J.M.; Misra, G.; Sreenivasulu, N.; Henry, A. What happens at night? Physiological mechanisms related to maintaining grain yield under high night temperature in rice. Plant Cell Environ. 2021, 44, 2245–2261. [Google Scholar] [CrossRef]
- Yang, J.C.; Zhang, J.H. Grain filling of cereals under soil drying. New Phytol. 2006, 169, 223–236. [Google Scholar] [CrossRef]
- Zakari, S.A.; Asad, M.A.U.; Han, Z.Y.; Guan, X.Y.; Zaidi, S.H.R.; Gang, P.; Cheng, F.M. Senescence-related translocation of nonstructural carbohydrate in rice leaf sheaths under different nitrogen supply. Agron. J. 2020, 112, 1601–1616. [Google Scholar] [CrossRef]
- Tong, H.; Duan, H.; Wang, S.J.; Su, J.P.; Sun, Y.; Liu, Y.Q.; Tang, L.; Liu, X.J.; Chen, W.F. Moderate drought alleviates the damage to grain quality at high temperatures by improving the starch synthesis of inferior grains in japonica rice. J. Integr. Agric. 2022, 21, 3094–3101. [Google Scholar] [CrossRef]
- Chen, H.J.; Chen, J.Y.; Wang, S.J. Molecular regulation of starch accumulation in rice seedling leaves in response to salt stress. Acta Physiol. Plant. 2008, 30, 135–142. [Google Scholar] [CrossRef]
- Razzaq, A.; Ali, A.; Safdar, L.B.; Zafar, M.M.; Rui, Y.; Shakeel, A.; Shaukat, A.; Ashraf, M.; Gong, W.; Yuan, Y. Salt stress induces physiochemical alterations in rice grain composition and quality. J. Food Sci. 2020, 85, 14–20. [Google Scholar] [CrossRef] [PubMed]
- Sangwongchai, W.; Krusong, K.; Thitisaksakul, M. Salt tolerance at vegetative stage is partially associated with changes in grain quality and starch physicochemical properties of rice exposed to salinity stress at reproductive stage. J. Sci. Food Agric. 2022, 102, 370–382. [Google Scholar] [CrossRef] [PubMed]
- You, C.C.; Zhu, H.L.; Xu, B.B.; Huang, W.X.; Wang, S.H.; Ding, Y.F.; Liu, Z.H.; Li, G.H.; Chen, L.; Ding, C.Q.; et al. Effect of removing superior spikelets on grain filling of inferior spikelets in rice. Front. Plant Sci. 2016, 7, 1161. [Google Scholar] [CrossRef]
- Tsukaguchi, T.; Murakami, K.; Michimoto, T. A quantitative measure for assimilate partitioning efficiency in rice (Oryza sativa L.). Field Crops Res. 2016, 198, 122–130. [Google Scholar] [CrossRef]

| Year | Field Type | Cultivar | Panicles per m2 | Spikelets per Panicle | Spikelets per m2 (×103) | Filled-Grain Percentage (%) | Grain Weight (mg) | Actual Grain Yield (t ha−1) |
|---|---|---|---|---|---|---|---|---|
| 2021 | NSF | NJ 7 | 313 a | 148 a | 46.3 a | 87.5 b | 26.2 a | 10.0 a |
| WYJ 30 | 320 a | 143 b | 45.8 a | 88.4 a | 25.4 b | 9.9 a | ||
| HSF | NJ 7 | 274 b | 121 c | 33.2 b | 80.8 c | 24.6 bc | 6.4 b | |
| WYJ 30 | 278 b | 112 d | 31.1 c | 74.3 d | 23.1 c | 5.0 c | ||
| 2022 | NSF | NJ 7 | 324 a | 145 a | 47.0 a | 86.9 a | 25.9 a | 10.2 a |
| WYJ 30 | 332 a | 140 b | 46.5 a | 87.2 a | 25.1 b | 10.2 a | ||
| HSF | NJ 7 | 293 b | 115 c | 33.7 b | 80.5 b | 24.1 c | 6.2 b | |
| WYJ 30 | 286 b | 109 d | 31.2 c | 74.1 c | 22.9 d | 5.1 c | ||
| Analysis of variance (ANOVA) | ||||||||
| Year | ns | ns | ns | ns | ns | ns | ||
| Field type | ** | ** | ** | ** | ** | ** | ||
| Cultivar | ns | * | ns | ** | ** | ** | ||
| Year × Field type | ns | ns | ns | ns | ns | ns | ||
| Year × Cultivar | ns | ns | ns | ns | ns | ns | ||
| Field type × Cultivar | ns | ns | ns | ** | ns | ** | ||
| Year × Field type × Cultivar | ns | ns | ns | ns | ns | ns | ||
| Year | Field Type | Cultivar | Number of SGs on the Panicle | Number of IGs on the Panicle | SG | IG | ||
|---|---|---|---|---|---|---|---|---|
| Filled-Grain Percentage (%) | Grain Weight (mg) | Filled-Grain Percentage (%) | Grain Weight (mg) | |||||
| 2021 | NSF | NJ 7 | 17.2 a | 33.0 a | 91.7 b | 28.1 a | 82.7 b | 25.5 a |
| WYJ 30 | 16.1 b | 30.7 b | 92.6 a | 27.2 b | 83.8 a | 25.0 b | ||
| HSF | NJ 7 | 14.3 c | 26.5 c | 84.8 c | 26.4 c | 75.5 c | 22.5 c | |
| WYJ 30 | 12.4 d | 22.8 d | 77.7 d | 24.6 d | 68.9 d | 20.4 d | ||
| 2022 | NSF | NJ 7 | 16.9 a | 32.4 a | 90.9 a | 27.8 a | 84.4 a | 25.2 a |
| WYJ 30 | 15.8 b | 29.8 b | 90.5 a | 26.9 b | 84.8 a | 24.7 b | ||
| HSF | NJ 7 | 13.6 c | 25.2 c | 85.4 b | 25.8 c | 75.9 b | 22.6 c | |
| WYJ 30 | 12.1 d | 22.2 d | 78.5 c | 24.4 d | 67.3 c | 20.7 d | ||
| Analysis of variance (ANOVA) | ||||||||
| Year | ns | ns | ns | ns | ns | ns | ||
| Field type | ** | ** | ** | ** | ** | ** | ||
| Cultivar | * | ** | ** | ** | ** | ** | ||
| Year × Field type | ns | ns | ** | ns | * | ns | ||
| Year × Cultivar | ns | ns | ns | ns | ns | ns | ||
| Field type × Cultivar | ns | ns | ** | ns | ** | ** | ||
| Year × Field type × Cultivar | ns | ns | ns | ns | ns | ns | ||
| Year | Field Type | Cultivar | Dry Matter Weight (t ha−1) | Dry Matter Accumulation (t ha−1) | Harvest Index | |||
|---|---|---|---|---|---|---|---|---|
| Jointing | Heading | Maturity | Jointing-Heading | Heading-Maturity | ||||
| 2021 | NSF | NJ 7 | 4.1 a | 10.6 a | 17.2 a | 6.5 a | 6.6 a | 0.497 c |
| WYJ 30 | 4.0 a | 10.7 a | 16.9 b | 6.7 a | 6.2 b | 0.501 c | ||
| HSF | NJ 7 | 2.4 b | 6.4 b | 10.3 c | 4.0 b | 3.9 c | 0.531 a | |
| WYJ 30 | 2.0 c | 5.6 c | 8.2 d | 3.6 c | 2.6 d | 0.521 b | ||
| 2022 | NSF | NJ 7 | 3.8 a | 10.8 a | 17.4 a | 7.0 a | 6.6 a | 0.501 c |
| WYJ 30 | 3.9 a | 10.8 a | 17.6 a | 6.9 a | 6.8 a | 0.498 c | ||
| HSF | NJ 7 | 2.2 b | 6.3 b | 10.0 b | 4.1 b | 3.7 b | 0.531 a | |
| WYJ 30 | 1.7 c | 5.8 c | 8.4 c | 4.1 b | 2.6 c | 0.520 b | ||
| Analysis of variance (ANOVA) | ||||||||
| Year | ns | ns | ns | ns | ns | ns | ||
| Field type | ** | ** | ** | ** | ** | ** | ||
| Cultivar | * | * | ** | ns | ** | * | ||
| Year × Field type | ns | ns | ns | ns | ns | ns | ||
| Year × Cultivar | ns | ns | ns | ns | ns | ns | ||
| Field type × Cultivar | * | * | ** | ns | ** | ** | ||
| Year × Field type × Cultivar | ns | ns | ns | ns | ns | ns | ||
| Year | Field Type | Cultivar | AGPase Activity in SG (mol min−1 mg−1) | GBSS Activity in SG (mol min−1 mg−1) | SSS Activity in SG (mol min−1 mg−1) | SBE Activity in SG (U g−1) | ||||||||
|---|---|---|---|---|---|---|---|---|---|---|---|---|---|---|
| 15 DAH | 30 DAH | 45 DAH | 15 DAH | 30 DAH | 45 DAH | 15 DAH | 30 DAH | 45 DAH | 15 DAH | 30 DAH | 45 DAH | |||
| 2021 | NSF | NJ 7 | 15.8 a | 43.8 a | 14.1 a | 6.4 a | 16.8 a | 4.5 a | 3.4 a | 5.3 a | 1.8 a | 3.8 a | 6.5 a | 2.3 a |
| WYJ 30 | 12.5 b | 35.6 b | 11.5 b | 5.1 b | 13.6 b | 3.7 b | 2.9 b | 4.3 b | 1.7 a | 3.0 b | 5.3 b | 1.9 a | ||
| HSF | NJ 7 | 10.3 c | 30.7 c | 7.9 c | 4.2 c | 11.8 c | 2.5 c | 2.3 c | 4.1 b | 1.1 b | 2.5 b | 4.3 c | 1.3 b | |
| WYJ 30 | 6.3 d | 22.7 d | 5.6 d | 2.5 d | 8.9 d | 1.8 d | 1.3 d | 3.1 c | 0.8 b | 2.5 b | 3.5 d | 1.9 a | ||
| 2022 | NSF | NJ 7 | 15.7 a | 42.7 a | 13.5 a | 6.3 a | 16.3 a | 4.3 a | 3.9 a | 5.4 a | 1.9 a | 3.8 a | 6.3 a | 2.2 a |
| WYJ 30 | 11.3 b | 32.9 b | 10.5 b | 4.6 b | 12.6 b | 3.4 b | 2.9 b | 4.3 b | 1.5 b | 3.7 a | 5.9 a | 2.3 a | ||
| HSF | NJ 7 | 10.7 b | 30.8 c | 7.3 c | 4.3 b | 11.9 b | 2.3 c | 2.5 b | 3.5 c | 1.3 b | 2.6 b | 5.4 a | 1.2 b | |
| WYJ 30 | 5.6 c | 21.9 d | 5.4 d | 2.3 c | 8.8 c | 1.7 d | 1.4 c | 2.5 d | 0.7 c | 1.3 c | 3.4 b | 0.9 b | ||
| Analysis of variance (ANOVA) | ||||||||||||||
| Year | ns | ns | ns | ns | ns | ns | ns | ns | ns | ns | ns | ns | ||
| Field type | ** | ** | ** | ** | ** | ** | ** | ** | ** | ** | ** | ** | ||
| Cultivar | ** | ** | ** | ** | ** | ** | ** | ** | * | * | ** | ns | ||
| Year × Field type | ns | ns | ns | ns | ns | ns | ns | ns | ns | ns | ns | ns | ||
| Year × Cultivar | ns | ns | ns | ns | ns | ns | ns | ns | ns | ns | ns | ns | ||
| Field type × Cultivar | ns | ** | ns | ns | * | ns | ns | ns | ns | ns | ns | ns | ||
| Year × Field type × Cultivar | ns | ns | ns | ns | ns | ns | ns | ns | ns | * | ns | ns | ||
| Year | Field Type | Cultivar | AGPase Activity in IG (mol min−1 mg−1) | GBSS Activity in IG (mol min−1 mg−1) | SSS Activity in IG (mol min−1 mg−1) | SBE Activity in IG (U g−1) | ||||||||
|---|---|---|---|---|---|---|---|---|---|---|---|---|---|---|
| 15 DAH | 30 DAH | 45 DAH | 15 DAH | 30 DAH | 45 DAH | 15 DAH | 30 DAH | 45 DAH | 15 DAH | 30 DAH | 45 DAH | |||
| 2021 | NSF | NJ 7 | 11.8 a | 37.4 a | 7.6 a | 5.6 a | 14.8 a | 3.3 a | 3.1 a | 4.9 a | 1.4 a | 3.2 a | 4.8 a | 1.7 a |
| WYJ 30 | 8.7 b | 30.4 b | 6.2 b | 4.1 b | 12.1 b | 2.7 b | 2.5 b | 4.0 b | 1.1 b | 3.3 a | 4.9 a | 1.4 a | ||
| HSF | NJ 7 | 7.7 b | 25.4 c | 4.3 c | 3.6 b | 10.2 c | 1.8 c | 2.2 b | 3.7 c | 0.8 c | 2.1 b | 3.1 b | 1.0 a | |
| WYJ 30 | 4.3 c | 19.7 d | 3.0 d | 2.0 c | 7.8 d | 1.3 d | 1.2 c | 2.6 c | 0.6 d | 1.2 c | 3.6 b | 0.7 a | ||
| 2022 | NSF | NJ 7 | 12.8 a | 36.5 a | 7.3 a | 6.1 a | 14.5 a | 3.1 a | 3.8 a | 4.8 a | 1.3 a | 3.5 a | 4.7 a | 2.1 a |
| WYJ 30 | 8.4 b | 28.1 b | 5.7 b | 4.0 b | 11.1 b | 2.4 b | 2.2 b | 3.7 b | 0.9 b | 2.3 b | 3.6 b | 1.3 b | ||
| HSF | NJ 7 | 8.0 b | 26.2 b | 3.9 c | 3.8 b | 10.9 b | 1.7 c | 2.4 b | 3.3 c | 0.9 b | 2.2 b | 3.3 b | 1.3 b | |
| WYJ 30 | 4.3 c | 19.1 c | 2.9 d | 2.0 c | 7.5 c | 1.1 d | 1.0 c | 2.2 d | 0.4 c | 2.2 b | 3.5 b | 1.7 ab | ||
| Analysis of variance (ANOVA) | ||||||||||||||
| Year | ns | ns | ns | ns | ns | ns | ns | ns | ns | ns | ns | ** | ||
| Field type | ** | ** | ** | ** | ** | ** | ** | ** | ** | ** | ** | ** | ||
| Cultivar | ** | ** | ** | ** | ** | ** | ** | * | ** | * | ns | ns | ||
| Year × Field type | ns | ns | ns | ns | ns | ns | ns | ns | ns | * | ns | ns | ||
| Year × Cultivar | ns | ns | ns | ns | ns | ns | ns | ns | ns | ns | ns | ns | ||
| Field type × Cultivar | ns | * | ns | ns | ns | ns | ns | ns | ns | ns | ns | * | ||
| Year × Field type × Cultivar | ns | ns | ns | ns | ns | ns | ns | ns | ns | * | ns | * | ||
| Year | Field Type | Cultivar | SG | IG | ||||||||
|---|---|---|---|---|---|---|---|---|---|---|---|---|
| A | B | N | K | R2 | A | B | N | K | R2 | |||
| 2021 | NSF | NJ 7 | 23.201 | 7222.224 | 4.300 | 0.507 | 0.964 | 19.741 | 12,351.510 | 4.000 | 0.285 | 0.978 |
| WYJ 30 | 22.410 | 7586.711 | 4.000 | 0.460 | 0.965 | 19.389 | 9851.484 | 3.727 | 0.279 | 0.981 | ||
| HSF | NJ 7 | 21.632 | 4867.788 | 3.100 | 0.409 | 0.990 | 17.128 | 11,967.810 | 3.455 | 0.266 | 0.985 | |
| WYJ 30 | 20.212 | 4417.228 | 3.128 | 0.388 | 0.986 | 15.274 | 12,351.480 | 3.346 | 0.280 | 0.985 | ||
| 2022 | NSF | NJ 7 | 23.006 | 7222.230 | 4.235 | 0.493 | 0.969 | 19.591 | 10,031.540 | 3.727 | 0.281 | 0.978 |
| WYJ 30 | 22.122 | 7951.202 | 4.000 | 0.463 | 0.969 | 19.204 | 9669.743 | 3.782 | 0.277 | 0.980 | ||
| HSF | NJ 7 | 21.190 | 4677.106 | 3.128 | 0.404 | 0.990 | 17.642 | 9467.813 | 3.237 | 0.264 | 0.985 | |
| WYJ 30 | 20.049 | 4417.229 | 3.128 | 0.388 | 0.986 | 15.202 | 12,351.480 | 3.400 | 0.280 | 0.986 | ||
| Year | Field Type | Cultivar | SG | IG | ||||||
|---|---|---|---|---|---|---|---|---|---|---|
| Gmax (mg grain−1 d−1) | Gmean (mg grain−1 d−1) | Tmax (d) | EP (d) | Gmax (mg grain−1 d−1) | Gmean (mg grain−1 d−1) | Tmax (d) | EP (d) | |||
| 2021 | NSF | NJ 7 | 1.51 | 0.934 | 14.6 | 23.7 | 0.752 | 0.469 | 28.2 | 44.3 |
| WYJ 30 | 1.38 | 0.860 | 16.4 | 26.3 | 0.755 | 0.473 | 28.2 | 44.6 | ||
| HSF | NJ 7 | 1.37 | 0.868 | 18.0 | 29.2 | 0.663 | 0.417 | 30.7 | 47.9 | |
| WYJ 30 | 1.21 | 0.764 | 18.7 | 30.5 | 0.635 | 0.401 | 29.3 | 45.6 | ||
| 2022 | NSF | NJ 7 | 1.47 | 0.910 | 15.1 | 24.4 | 0.768 | 0.481 | 28.1 | 44.4 |
| WYJ 30 | 1.37 | 0.853 | 16.4 | 26.3 | 0.736 | 0.460 | 28.3 | 44.8 | ||
| HSF | NJ 7 | 1.32 | 0.834 | 18.1 | 29.5 | 0.704 | 0.445 | 30.2 | 47.6 | |
| WYJ 30 | 1.20 | 0.758 | 18.7 | 30.5 | 0.625 | 0.394 | 29.3 | 45.7 | ||
| Year | Field Type | Cultivar | Early Stage | Middle Stage | Late Stage | ||||||
|---|---|---|---|---|---|---|---|---|---|---|---|
| Duration Days (d) | Gmean (mg grain−1 d−1) | GFA (mg) | Duration Days (d) | Gmean (mg grain−1 d−1) | GFA (mg) | Duration Days (d) | Gmean (mg grain−1 d−1) | GFA (mg) | |||
| SG | |||||||||||
| 2021 | NSF | NJ 7 | 10.8 | 0.965 | 179 | 7.8 | 1.342 | 179 | 5.1 | 0.422 | 37.4 |
| WYJ 30 | 12.2 | 0.795 | 156 | 8.4 | 1.228 | 165 | 5.8 | 0.383 | 35.6 | ||
| HSF | NJ 7 | 13.6 | 0.610 | 119 | 8.7 | 1.216 | 151 | 6.8 | 0.369 | 36.1 | |
| WYJ 30 | 14.1 | 0.553 | 97 | 9.2 | 1.071 | 122 | 7.2 | 0.325 | 29.1 | ||
| 2022 | NSF | NJ 7 | 11.1 | 0.919 | 172 | 7.9 | 1.306 | 175 | 5.3 | 0.410 | 36.7 |
| WYJ 30 | 12.3 | 0.782 | 151 | 8.3 | 1.219 | 160 | 5.7 | 0.380 | 34.5 | ||
| HSF | NJ 7 | 13.7 | 0.597 | 111 | 8.8 | 1.169 | 141 | 6.9 | 0.355 | 33.5 | |
| WYJ 30 | 14.1 | 0.549 | 93.4 | 9.2 | 1.062 | 118 | 7.2 | 0.323 | 28.1 | ||
| IG | |||||||||||
| 2021 | NSF | NJ 7 | 21.5 | 0.399 | 282 | 13.5 | 0.669 | 299 | 9.3 | 0.209 | 64.3 |
| WYJ 30 | 21.5 | 0.379 | 250 | 13.5 | 0.672 | 278 | 9.7 | 0.208 | 61.6 | ||
| HSF | NJ 7 | 23.7 | 0.292 | 184 | 13.8 | 0.589 | 216 | 10.3 | 0.181 | 49.4 | |
| WYJ 30 | 22.8 | 0.267 | 139 | 13.0 | 0.564 | 167 | 9.8 | 0.173 | 38.7 | ||
| 2022 | NSF | NJ 7 | 21.4 | 0.384 | 266 | 13.4 | 0.683 | 296 | 9.6 | 0.211 | 65.6 |
| WYJ 30 | 21.5 | 0.377 | 242 | 13.7 | 0.655 | 266 | 9.7 | 0.203 | 58.6 | ||
| HSF | NJ 7 | 23.4 | 0.296 | 174 | 13.7 | 0.625 | 215 | 10.5 | 0.190 | 50.5 | |
| WYJ 30 | 22.7 | 0.268 | 136 | 13.1 | 0.556 | 161 | 9.8 | 0.170 | 37.1 | ||
| Parameter | Actual Grain Yield | Dry Matter Weight at Maturity | ||
|---|---|---|---|---|
| SG | Total starch content at 15 DAH | 0.83 * | 0.82 * | |
| Total starch content at 30 DAH | 0.90 ** | 0.89 ** | ||
| Total starch content at 45 DAH | 0.81 * | 0.80 * | ||
| IG | Total starch content at 15 DAH | 0.84 ** | 0.83* | |
| Total starch content at 30 DAH | 0.90 ** | 0.89 ** | ||
| Total starch content at 45 DAH | 0.80 * | 0.79 * | ||
| SG | Gmax | 0.84 ** | 0.83 * | |
| Gmean | 0.80 * | 0.79 * | ||
| Tmax | −0.92 ** | −0.92 ** | ||
| EP | −0.94 ** | −0.94 ** | ||
| IG | Gmax | 0.94 ** | 0.93 ** | |
| Gmean | 0.93 ** | 0.92 ** | ||
| Tmax | −0.78 * | −0.80 * | ||
| EP | −0.69 | −0.71 * | ||
| SG | Early stage | Duration days | −0.92 ** | −0.92 ** |
| Gmean | 0.93 ** | 0.93 ** | ||
| GFA | 0.96 ** | 0.96 ** | ||
| Middle stage | Duration days | −0.92 ** | −0.91 ** | |
| Gmean | 0.85 ** | 0.84 ** | ||
| GFA | 0.92 ** | 0.91 ** | ||
| Late stage | Duration days | −0.96 ** | −0.96 ** | |
| Gmean | 0.89 ** | 0.88 ** | ||
| GFA | 0.78 * | 0.76 * | ||
| IG | Early stage | Duration days | −0.86 ** | −0.87 ** |
| Gmean | 0.99 ** | 0.99 ** | ||
| GFA | 0.97 ** | 0.96 ** | ||
| Middle stage | Duration days | 0.41 | 0.38 | |
| Gmean | 0.94 ** | 0.94 ** | ||
| GFA | 0.96 ** | 0.95 ** | ||
| Late stage | Duration days | −0.59 | −0.62 | |
| Gmean | 0.96 ** | 0.95 ** | ||
| GFA | 0.95 ** | 0.94 ** | ||
Disclaimer/Publisher’s Note: The statements, opinions and data contained in all publications are solely those of the individual author(s) and contributor(s) and not of MDPI and/or the editor(s). MDPI and/or the editor(s) disclaim responsibility for any injury to people or property resulting from any ideas, methods, instructions or products referred to in the content. |
© 2024 by the authors. Licensee MDPI, Basel, Switzerland. This article is an open access article distributed under the terms and conditions of the Creative Commons Attribution (CC BY) license (https://creativecommons.org/licenses/by/4.0/).
Share and Cite
Wei, H.; Zuo, B.; Zhu, J.; Ma, W.; Zhang, X.; Wang, L.; Geng, X.; Chen, Y.; Meng, T.; Dai, Q. Grain-Filling Characteristics and Yield Formation of Rice at Saline Field. Agronomy 2024, 14, 2687. https://doi.org/10.3390/agronomy14112687
Wei H, Zuo B, Zhu J, Ma W, Zhang X, Wang L, Geng X, Chen Y, Meng T, Dai Q. Grain-Filling Characteristics and Yield Formation of Rice at Saline Field. Agronomy. 2024; 14(11):2687. https://doi.org/10.3390/agronomy14112687
Chicago/Turabian StyleWei, Huanhe, Boyuan Zuo, Jizou Zhu, Weiyi Ma, Xiang Zhang, Lulu Wang, Xiaoyu Geng, Yinglong Chen, Tianyao Meng, and Qigen Dai. 2024. "Grain-Filling Characteristics and Yield Formation of Rice at Saline Field" Agronomy 14, no. 11: 2687. https://doi.org/10.3390/agronomy14112687
APA StyleWei, H., Zuo, B., Zhu, J., Ma, W., Zhang, X., Wang, L., Geng, X., Chen, Y., Meng, T., & Dai, Q. (2024). Grain-Filling Characteristics and Yield Formation of Rice at Saline Field. Agronomy, 14(11), 2687. https://doi.org/10.3390/agronomy14112687