Article

Micro-CT Analysis of Pore Structure in Upland Red Soil Under Different Long-Term Fertilization Regimes

1
College of Agricultural Science and Engineering, Hohai University, Nanjing 210098, China
2
Institute of Agricultural Resources and Regional Planning, Chinese Academy of Agricultural Sciences, Beijing 100081, China
3
National Observation Station of Qiyang Agri-Ecology System, Qiyang 426182, China
4
College of Land Science and Technology, China Agricultural University, Beijing 100193, China
*
Author to whom correspondence should be addressed.
Agronomy 2024, 14(11), 2668; https://doi.org/10.3390/agronomy14112668
Submission received: 8 October 2024 / Revised: 6 November 2024 / Accepted: 11 November 2024 / Published: 13 November 2024
(This article belongs to the Section Soil and Plant Nutrition)

Abstract

:
This study hypothesized that long-term fertilization alters the pore structure and aggregate stability in upland red soil. A long-term fertilization experiment in Qiyang, Hunan, was conducted with three treatments: no fertilization (CK), nitrogen–phosphorus–potassium fertilization (NPK), and nitrogen–phosphorus–potassium combined with pig manure (NPKOM). X-ray computed tomography (CT) scanning technology was used to assess three-dimensional pore structures at both the soil column (50 mm diameter and 50 mm height) and aggregate scales (diameter 3–5 mm), alongside the evaluation of the soil’s physical and chemical properties. Results showed that the soil organic carbon content (SOC) increased by 44.8% in NPK and 112.5% in NPKOM compared to CK. NPKOM improved the aggregate stability by 51.6%, whereas NPK had no significant effect. At the soil column scale, NPK increased the total porosity by 13.7% but reduced larger pores (>0.06 mm), whereas NPKOM decreased the total porosity by 7.8% and increased larger pores. At the aggregate scale, NPKOM increased the porosity for pores >0.098 mm by 7.6 times compared to CK and 9.5 times compared to NPK. In conclusion, long-term NPKOM significantly enhances the SOC and aggregate stability and promotes larger pore formation, unlike NPK, which mainly increases SOC but does not improve the soil structure.

1. Introduction

Soil structure is the material foundation of soil fertility, playing a critical role in various soil functions. A healthy soil structure consists of a well-aggregated soil matrix and a well-developed pore system, which provides the physical framework for supporting plant growth and maintaining soil health [1,2]. The soil structure influences root penetration, water infiltration, and the movement of air and nutrients within the soil, all of which are essential for crop growth and resilience [3]. In particular, the soil structure affects the ability of plants to access water and nutrients during different growth stages, directly impacting crop yield and stability.
Red soil, one of the dominant soil types in southern China, spans an area of 2.18 million square kilometers, representing 23% of the nation’s land area and playing a vital role in China’s agricultural production [4]. However, red soil is characterized by its low organic matter content, high clay content, and poor soil structure [5], which result in a low water retention capacity, reduced aeration, and restricted root development. These unfavorable properties pose significant challenges to sustainable agriculture in red soil regions. Therefore, improving the physical structure of red soil is essential for enhancing agricultural productivity. Addressing the limitations of red soil through effective soil management practices, such as organic amendments, reduced tillage, and the incorporation of cover crops, can help improve soil aggregation, increase organic matter content, and create a more favorable environment for root growth and microbial activity [6]. These improvements in soil structure are crucial for promoting higher crop yields, enhancing soil fertility, and ensuring the long-term sustainability of agriculture in red soil regions.
Fertilization is one of the most widely adopted practices to enhance soil fertility, playing a pivotal role in replenishing soil nutrients, promoting plant growth, and improving crop yields. However, its effects on the physical properties of upland red soil, particularly the soil structure, remain controversial [7,8]. Many studies have demonstrated that applying organic fertilizers can significantly improve the structure of upland red soil. Organic amendments increase soil organic matter content, which, in turn, enhances soil aggregation, stabilizes soil particles, and improves the overall water retention and porosity of the soil [9,10,11,12]. Despite these positive effects, some research has highlighted potential downsides to the long-term use of organic fertilizers. For instance, studies have found that extended organic fertilizer application can lead to an increase in bulk density, which negatively impacts soil aeration and root penetration by reducing total porosity [13]. In contrast, the effects of chemical fertilizers on upland red soil structures are equally complex and inconsistent. Some studies have reported that applying chemical fertilizers alone can significantly increase the content of large aggregates in upland red soil [14], but some studies indicate that chemical fertilizer application has no significant effect on the distribution of soil aggregate distribution [10,12] or even reduce soil aggregate stability [11]. Given these contrasting findings, it is clear that the effects of fertilization on upland red soil structures depend on a range of factors, including the type of fertilizer used, the duration of application, soil management practices, and the inherent properties of the soil. The complexity of soil responses to different fertilization regimes underscores the need for balanced fertilization strategies that combine both organic and inorganic inputs to optimize soil structures and fertility. Further research is needed to explore the long-term impacts of different fertilization practices and to develop sustainable management approaches tailored to the unique characteristics of upland red soils.
In past research, indicators such as bulk density, aggregate stability, and aggregate size distribution have primarily been used to describe soil structures. While these metrics provide valuable insights into soil physical properties, they offer limited information on the intricate details of pore structures, which play a critical role in determining the overall health and functionality of soils [15]. Understanding pore structures is essential because they control key physical and biological processes in the soil–plant–microbe system, including water retention, air permeability, nutrient transport, and root penetration. Moreover, the pore structure significantly influences microbial activity and the soil’s ability to support healthy plant growth, making it a vital indicator of soil functions [16,17]. X-ray CT technology can non-destructively scan undisturbed soil to obtain the internal pore structure, providing information on pore size distribution, morphology, and connectivity, which offers a good technical means for quantifying the soil pore structure [18]. Currently, in the red soil region of southern China, several studies have utilized CT scanning techniques to explore soil pore structures [19,20]. However, there is still limited research focusing on how different fertilization practices affect the pore structure of upland red soils, which represents a significant knowledge gap in this field.
Both small and large pores are crucial for understanding soil pore structures, as they play different yet complementary roles in soil processes [21,22]. Small pores typically govern water retention, nutrient storage, and microbial activity, while large pores facilitate water infiltration, root penetration, and gas exchange. Therefore, acquiring information on pore structures at multiple scales is essential for a comprehensive understanding of soil function. A multi-scale approach allows us to capture the full spectrum of pore sizes and their respective contributions to hydrological, mechanical, and biological processes in soils [18]. Moreover, the connectivity and distribution of small and large pores are key determinants of soil permeability and aeration [23], which are critical for plant growth and the overall health of soil ecosystems. Without considering both micro- and macro-scale pore structures, our understanding of soil behavior under different environmental and management conditions remains incomplete. A key challenge in X-ray CT scanning lies in balancing the sample size with the resolution. In X-ray CT scanning, there is a balance between the sample size and the resolution: larger samples result in a lower resolution, while higher resolution requires smaller sample sizes. Scanning at multiple scales provides a more detailed and comprehensive view of the pore structure [18]. However, research on how this applies to upland red soil in southern China remains limited.
This study focuses on assessing the impact of long-term fertilization practices on the pore structure of upland red soil in southern China. Given the significance of soil structure for soil health and agricultural productivity, understanding how different fertilization strategies influence pore structures is critical. The findings aim to provide a scientific basis for optimizing the use of cultivated land resources and improving fertilizer management in red soil regions.

2. Materials and Methods

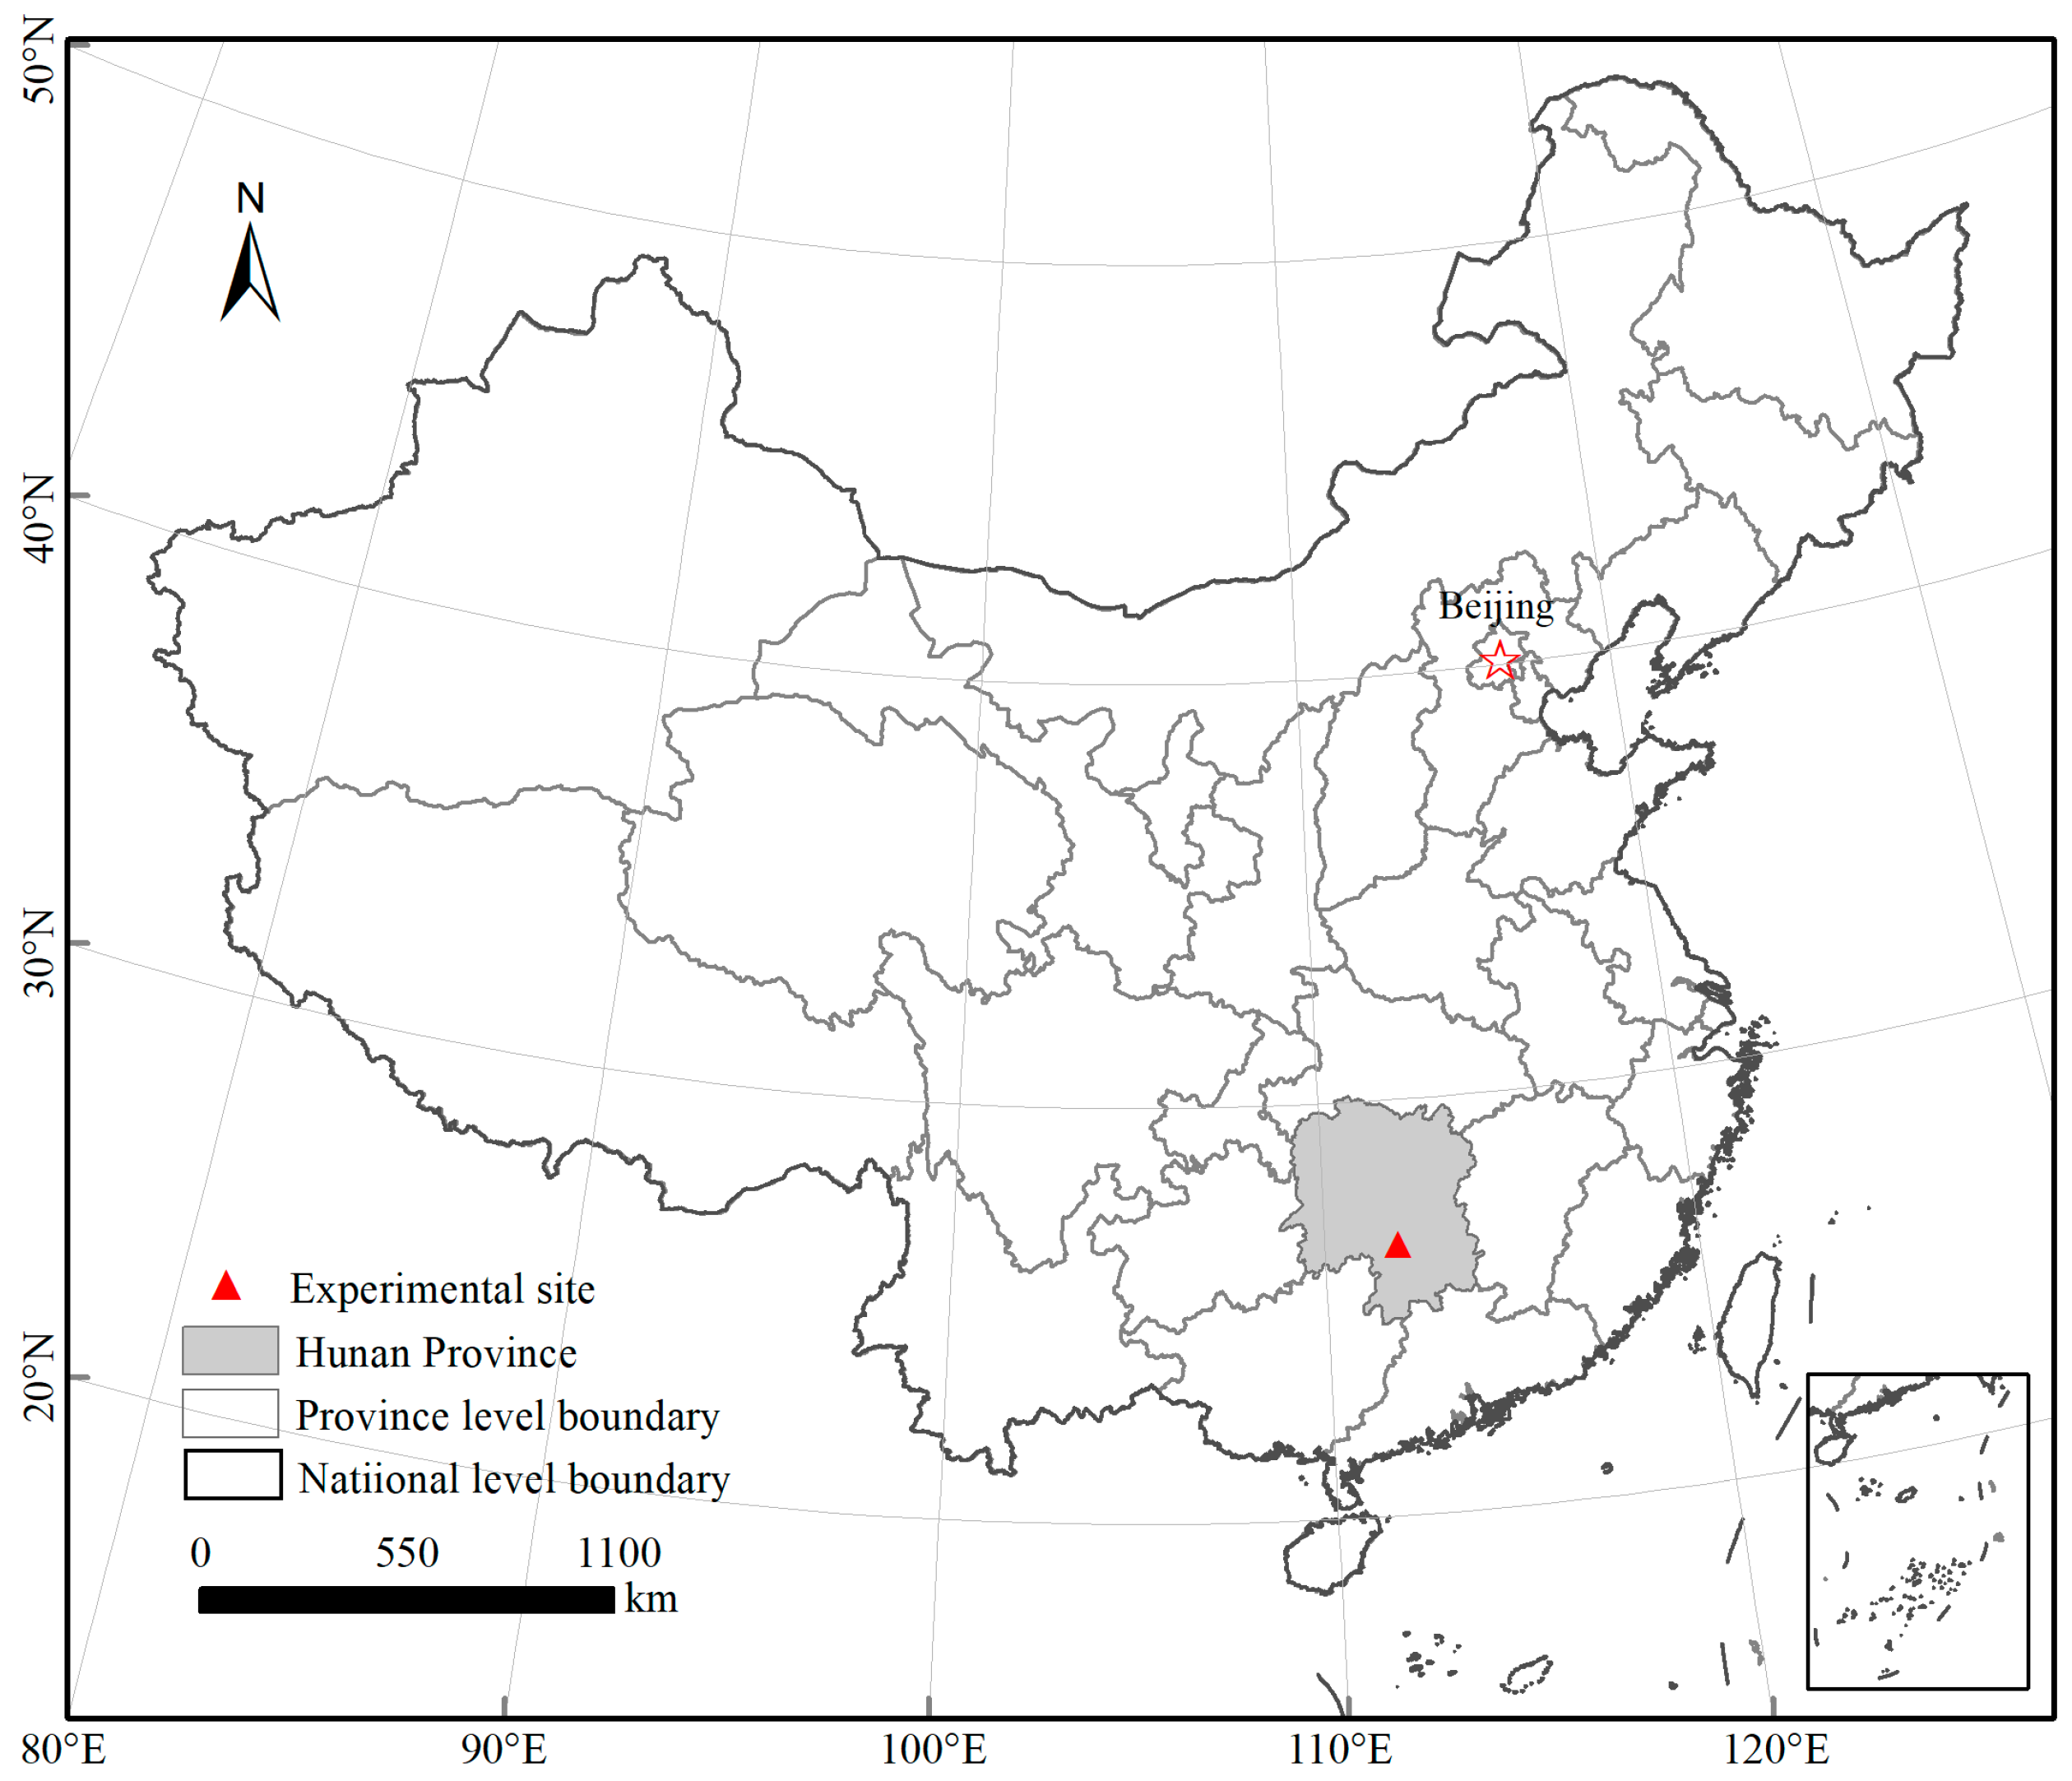
2.1. Experiment Site

Soil samples were collected from the Qiyang Red Soil Experimental Station of the Chinese Academy of Agricultural Sciences (26°45′12″ N, 111°52′32″ E, altitude 120 m) (Figure 1). The annual average rainfall is 1250 mm. The region experiences an annual mean temperature of 18 °C and has a frost-free period of 300 days. The parent material consists of Quaternary red clay, and the soil is classified as siliceous red soil. Long-term fixed-point fertilization experiments have been conducted since 1990. The initial basic properties of the soil are as follows: organic carbon 6.67 g/kg, total nitrogen 1.07 g/kg, total phosphorus 0.45 g/kg, total potassium 13.7 g/kg, alkali hydrolyzable nitrogen 79.0 mg/kg, available phosphorus 13.9 mg/kg, available potassium 104 mg/kg, and a pH value of 5.7. The experimental field included 12 treatments arranged in a randomized block design. Detailed information regarding the soil properties can be found in previous studies [24].
Three fertilization treatments out of the twelve were selected as the subjects of our research.: no fertilizer application (CK), the application of nitrogen, phosphorus, and potassium (NPK), and the application of nitrogen, phosphorus, and potassium plus pig manure (NPKOM). The nitrogen, phosphorus, and potassium fertilizers used are urea, single superphosphate, and potassium chloride, respectively. The fertilizer application rate for the NPK treatment was N 300 kg/hm2, and P2O5 and K2O each 120 kg/hm2. For the NPKOM treatment, the amount of chemical fertilizer applied was N 90 kg/hm2, and the amount of organic fertilizer applied was N 210 kg/hm2, equivalent to the amount of nitrogen. The planting system in the experimental field was a wheat–maize rotation, with 70% of the fertilizer applied during the maize season and 30% during the wheat season. All fertilizers were applied at once during the wheat and maize sowing.

2.2. Sampling and Measurements

Soil samples were collected in October 2015 during the fallow period. Three undisturbed soil column samples (0–15 cm depth) were randomly taken from each plot using a PVC column (50 mm high and 50 mm in diameter) and wrapped in plastic wrap to prevent water loss. At the same time, mixed surface soil samples (0–15 cm depth) were collected from three points in each plot and placed in hard containers for drying in the laboratory. A part of the composite soil sample was sieved to isolate 3–5 mm aggregates for assessing their water stability. Six random aggregates from each treatment were selected for X-ray CT scanning. Another portion of the mixed soil sample was sieved through a 0.25 mm mesh to determine the SOC. The soil column samples were initially scanned using an X-ray CT, followed by oven-drying at 105 °C until reaching a constant weight for bulk density measurements. The SOC was measured using the potassium dichromate oxidation method. Aggregate water stability was determined using the LB rapid wetting method [25]. In summary, 5 g of 3–5 mm soil aggregates were submerged in 50 mL of distilled water for 10 min to allow slaking. The slaked aggregates were then gently transferred into ethanol to halt further disintegration and subsequently oven-dried at 105 °C for 24 h. Once dried, the aggregates were passed through a series of sieves with mesh sizes of 3 mm, 2 mm, 1 mm, 0.5 mm, 0.25 mm, 0.1 mm, and 0.05 mm, and the corresponding weights were recorded. Soil aggregate stability was represented by the mean weight diameter (MWD), which was calculated using the following formula:
MWD = i = 1 n + 1 r i 1 + r i 2 × m i
where ri is the aperture size of the ith sieve (mm); mi is the mass fraction of the soil remaining on the ith sieve; n is the number of the sieves.

2.3. X-Ray CT Scanning and Image Processing

Soil columns and aggregates were scanned using a Phoenix Nanotom X-ray μ-CT (GE, Sensing and Inspection Technologies, GmbH, Wunstorf, Germany) at the Institute of Soil Science, Chinese Academy of Sciences. Six soil columns and six soil aggregates were scanned for each treatment. The scanning parameters were different for the two types of samples and are detailed in Table 1. The reconstructed projection images were used to generate 1800 8-bit grayscale TIFF format images with a size of 2000 × 2000 pixels.
Image processing was performed using ImageJ software. First, the Adjust Brightness function was used to adjust the image brightness, followed by median filtering. The region of interest (ROI) was selected for further image processing and analysis. For aggregate samples, the ROI was a cube with dimensions of 800 voxels per side (2.8 mm), and for soil columns, the ROI was a cube with dimensions of 450 voxels per side (27 mm). Threshold segmentation of the images was carried out using the 3DMA-Rock software, employing the Kriging method. The Kriging method is a local thresholding method based on the spatial correlation analysis of an image’s gray values. Two thresholds, T0 and T1, were selected; pixels with gray values below T0 and above T1 were converted to 0 and 1, respectively. For pixels with gray values between T0 and T1, the semivariogram function between neighboring pixels was calculated to determine their segmentation values [26]. Quantim software was used to calculate pore structure characteristic parameters [27], including pore size distribution, cumulative pore size distribution, pore surface density, and the Euler number. Surface density is the ratio of the pore surface area to pore volume, indicating the surface area corresponding to the unit volume of pores. The Euler number is an indicator of pore connectivity; the smaller the Euler number, the better the pore connectivity [28].

2.4. Statistical Analysis

Data normality was assessed using probability plots, and the homogeneity of variance was also examined. A one-way ANOVA was performed to assess the effect of different treatments on soil structural parameters. Statistical significance was determined with p-values below 0.05, and the means were compared using Tukey’s test. Pearson’s correlation coefficients were calculated to conduct linear correlation analysis. All statistical analyses were carried out using SPSS version 24.0.

3. Results

3.1. Basic Properties and Aggregate Stability of Upland Red Soil

Based on Table 2, it is evident that fertilization notably elevated the SOC in comparison to CK, with the SOC of the NPK treatment increasing by 3.4 g kg−1 (p < 0.05) and the NPKOM treatment increasing by 8.5 g kg−1 (p < 0.05). Soil bulk density also showed significant changes under different fertilization treatments compared to CK, with the bulk density of the NPK treatment decreasing by 14.6% (p < 0.05) and the bulk density of the NPKOM treatment increasing by 8.5% (p < 0.05). Correspondingly, the total porosity of the NPK treatment was higher than that of CK by 0.07 cm3 cm−3 (p < 0.05), while the total porosity of the NPKOM treatment was lower than that of CK by 0.04 cm3 cm−3 (p < 0.05). The MWD for the NPK treatment did not exhibit a significant difference when compared to CK (p > 0.05), whereas the MWD for the NPKOM treatment was 51.6% greater than that of CK (p < 0.05).

3.2. Pore Structure Characteristics of Soil Columns in Upland Red Soil

Figure 2 shows the two-dimensional grayscale, binary, and three-dimensional pore structure images of the intact soil columns for three treatments. In the grayscale image, the light-colored parts represent the soil matrix, while the dark-colored parts represent the soil pores. In the binary image, the white parts represent the soil pores, and the black parts represent the soil matrix. The image resolution is 0.06 mm, so the pores displayed in the image are larger than 0.06 mm and can be defined as macropores [18]. From Figure 2, it can be seen that the pore distribution characteristics of the CK and NPK treatments are similar, while the number of macropores in the NPKOM treatment is significantly increased.
The pore size distribution results are shown in Figure 3a. The horizontal axis indicates the diameter of the pores, and the interval between adjacent horizontal coordinates is 0.12 mm. The vertical axis indicates the pore volume for pores smaller than the corresponding diameter but larger than the diameter of the adjacent coordinate. The pore volume for pores larger than 1.68 mm in diameter is represented by the last horizontal coordinate. For the CK and NPK treatments, the pore volume for pores with diameters ranging from 0.24 to 0.36 mm is the largest, accounting for 18.7% and 24.9% of the total macropores (>0.06 mm), respectively. As the pore diameter increases, the pore volume decreases, and there is an increase in pores larger than 1.68 mm in diameter (Figure 3a). For the NPKOM treatment, the pore volume for pores larger than 1.68 mm is the largest, accounting for 18.6% of all macropores (>0.06 mm). When the pore diameter is larger than 0.84 mm, the pore volume of NPKOM is significantly greater than that of the CK and NPK treatments (p < 0.05) (Figure 3a).
The cumulative pore distribution is shown in Figure 3b, with the horizontal axis representing the pore diameter and the vertical axis representing the pore volume for pores smaller than the corresponding diameter. The pore volume for all macropores (>0.06 mm) in the CT image is represented by the last horizontal coordinate. As shown in Figure 3b, the pore volume of macropores (>0.06 mm) for the CK, NPK, and NPKOM treatments is 0.21, 0.17, and 0.25 mm3 mm−3, respectively. The pore volume of macropores for the NPKOM treatment is 19.0% and 47.1% higher than that of the CK and NPK treatments, respectively. The pore volume for pores smaller than 0.06 mm is obtained by subtracting the pore volume of macropores (>0.06 mm) from the total pore volume. The pore volume for pores smaller than 0.06 mm for the CK, NPK, and NPKOM treatments is 0.30, 0.41, and 0.22 mm3 mm−3, respectively, with significant differences between treatments (p < 0.05).
Figure 3c shows the Euler number of the pores, with the pore diameter on the horizontal axis and the Euler number of pores smaller than and larger than the adjacent pore diameter on the vertical axis. As shown in Figure 3c, the Euler numbers of the three treatments increase with the increase in the pore diameter, indicating that the connectivity of pores decreases with the increase in pore size. When the diameter of the pore is smaller than 0.8 mm, the Euler number is negative, indicating that the number of connected pores is greater than that of closed pores. For pores larger than 0.8 mm, the Euler number is positive, indicating that the number of closed pores is greater than that of connected pores. The differences in the Euler numbers of the pores among the three treatments were not significant (p > 0.05).
Figure 3d shows the surface density of the pores, with the pore diameter on the horizontal axis and the surface density of pores smaller than and larger than the adjacent pore diameter on the vertical axis. With the increase in the pore diameter, the surface density of the pores shows a decreasing trend. For pores smaller than 0.36 mm, the surface density of the NPKOM treatment is lower than that of the CK and NPK treatments, but the differences among the three treatments are not significant (p > 0.05). When the pore diameter is larger than 0.84 mm, the surface density of the NPKOM treatment is notably greater than that of the other two treatments (p < 0.05).

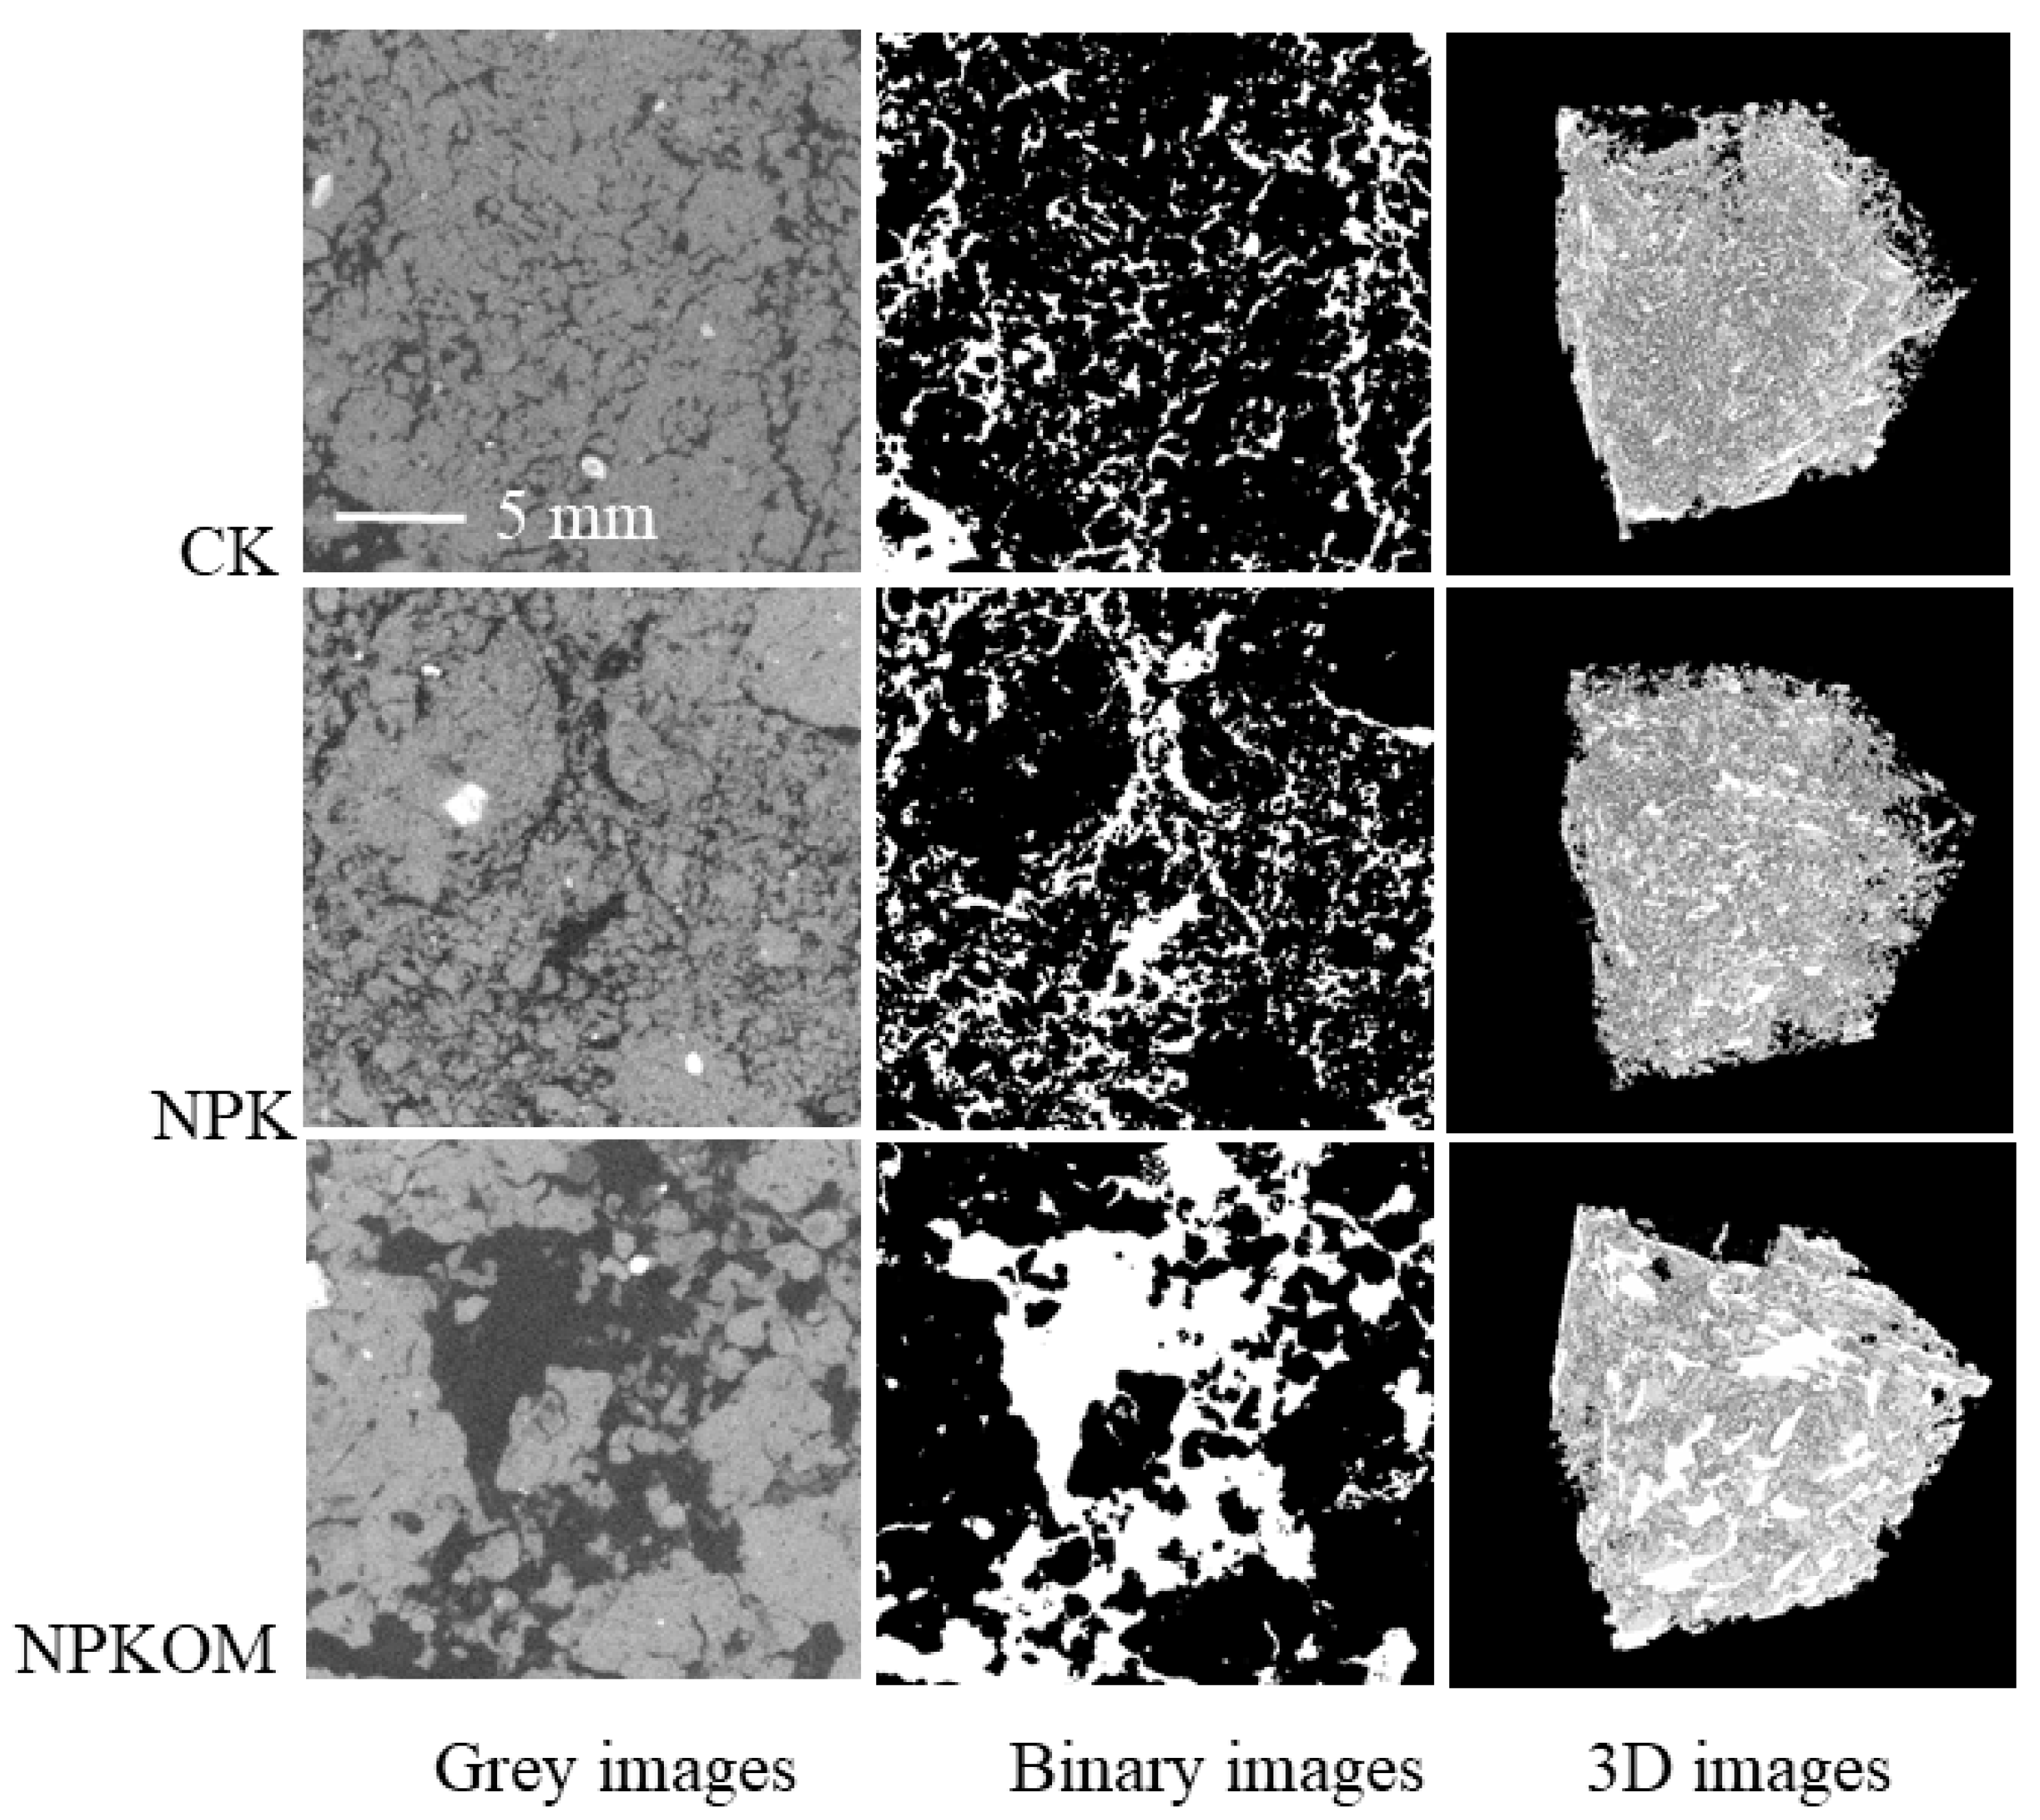
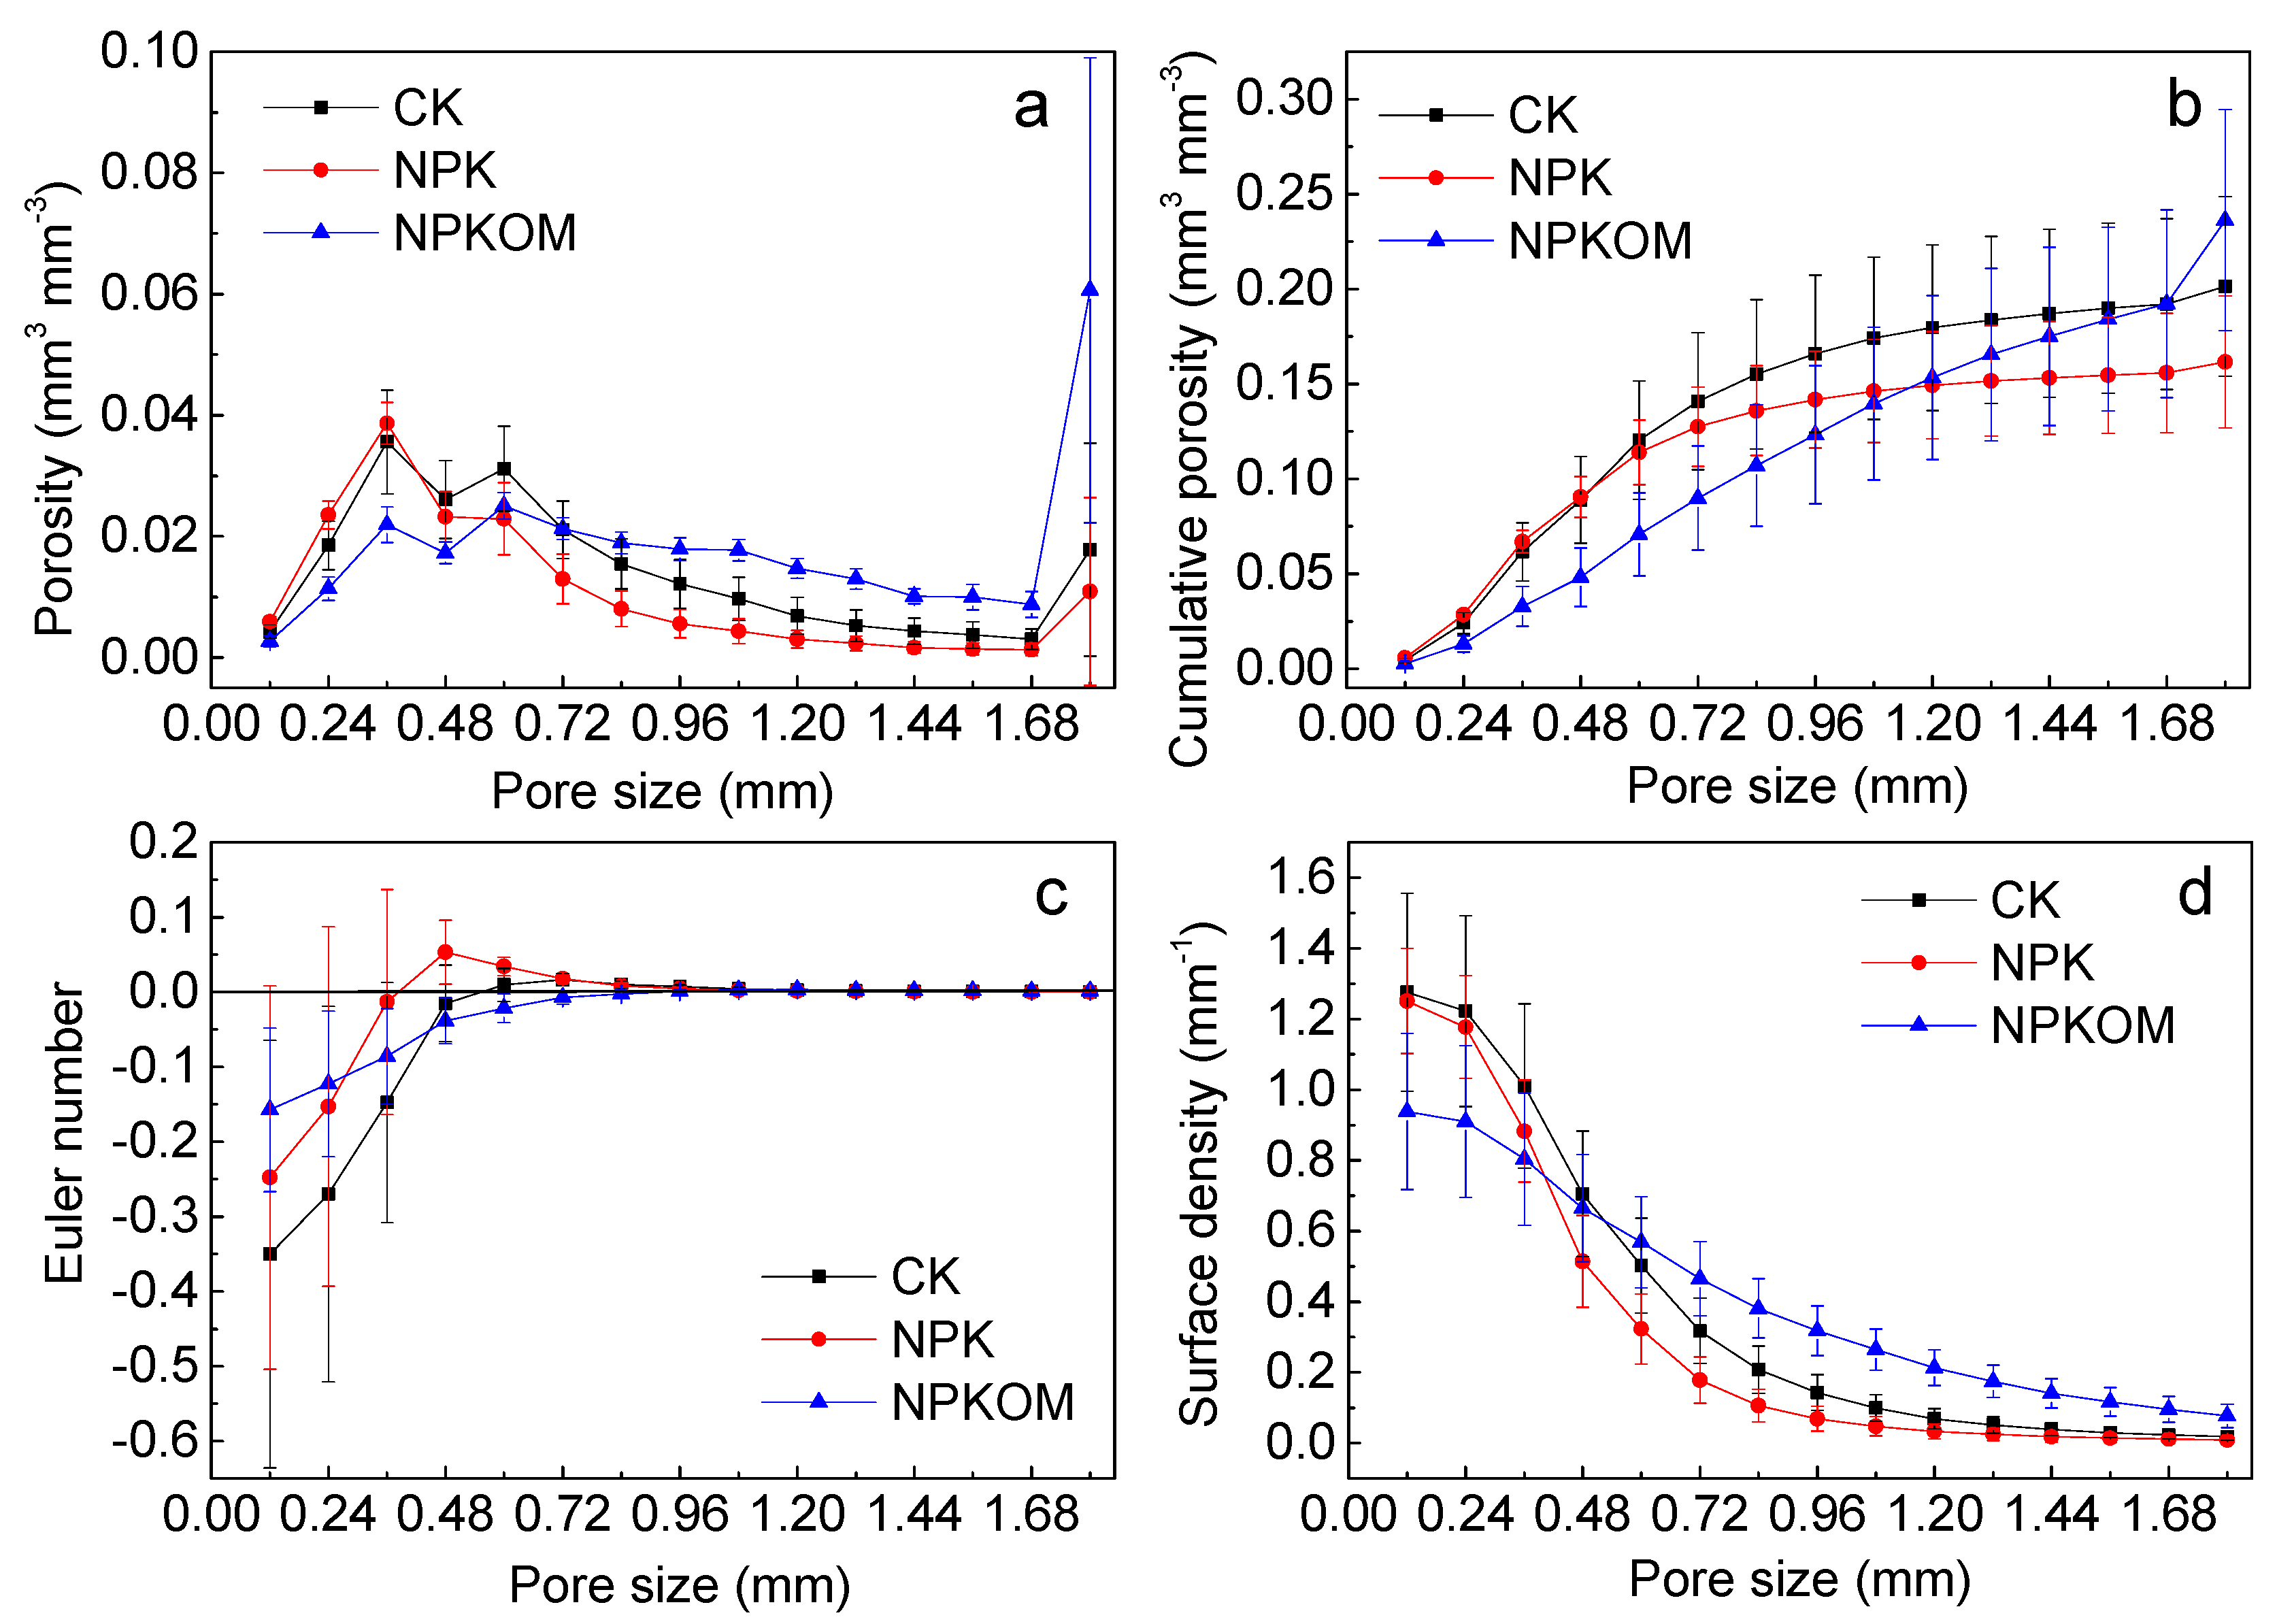
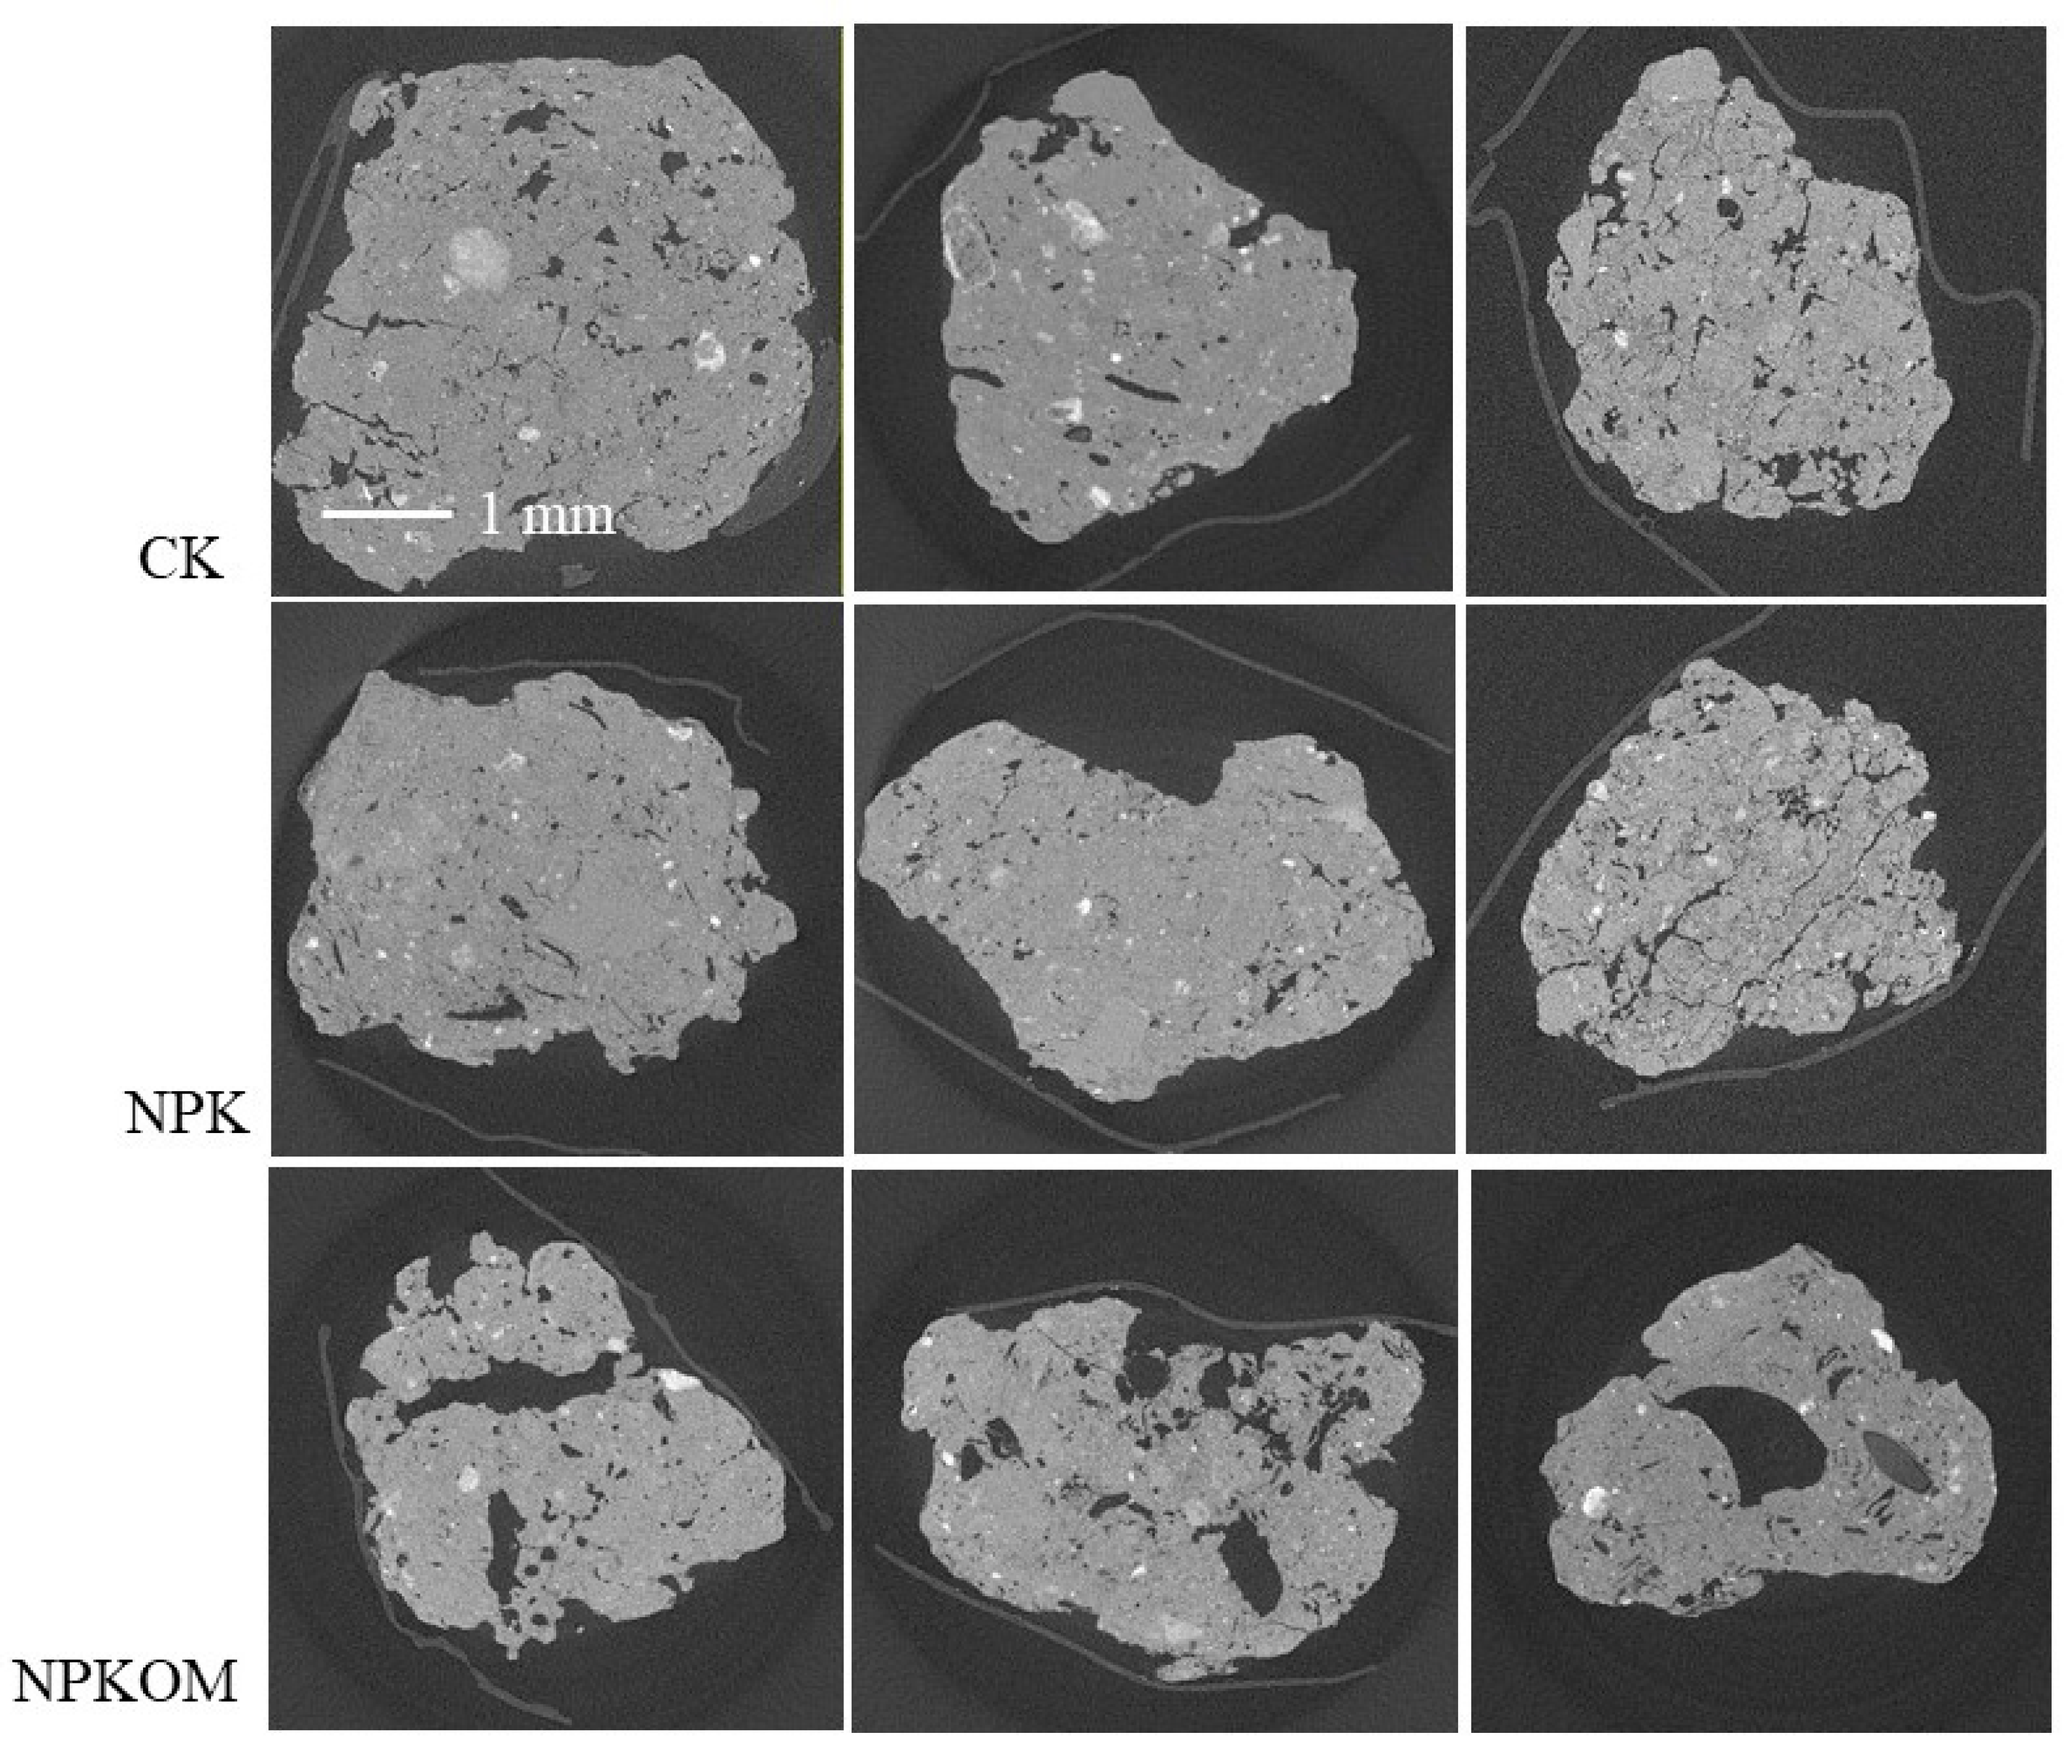
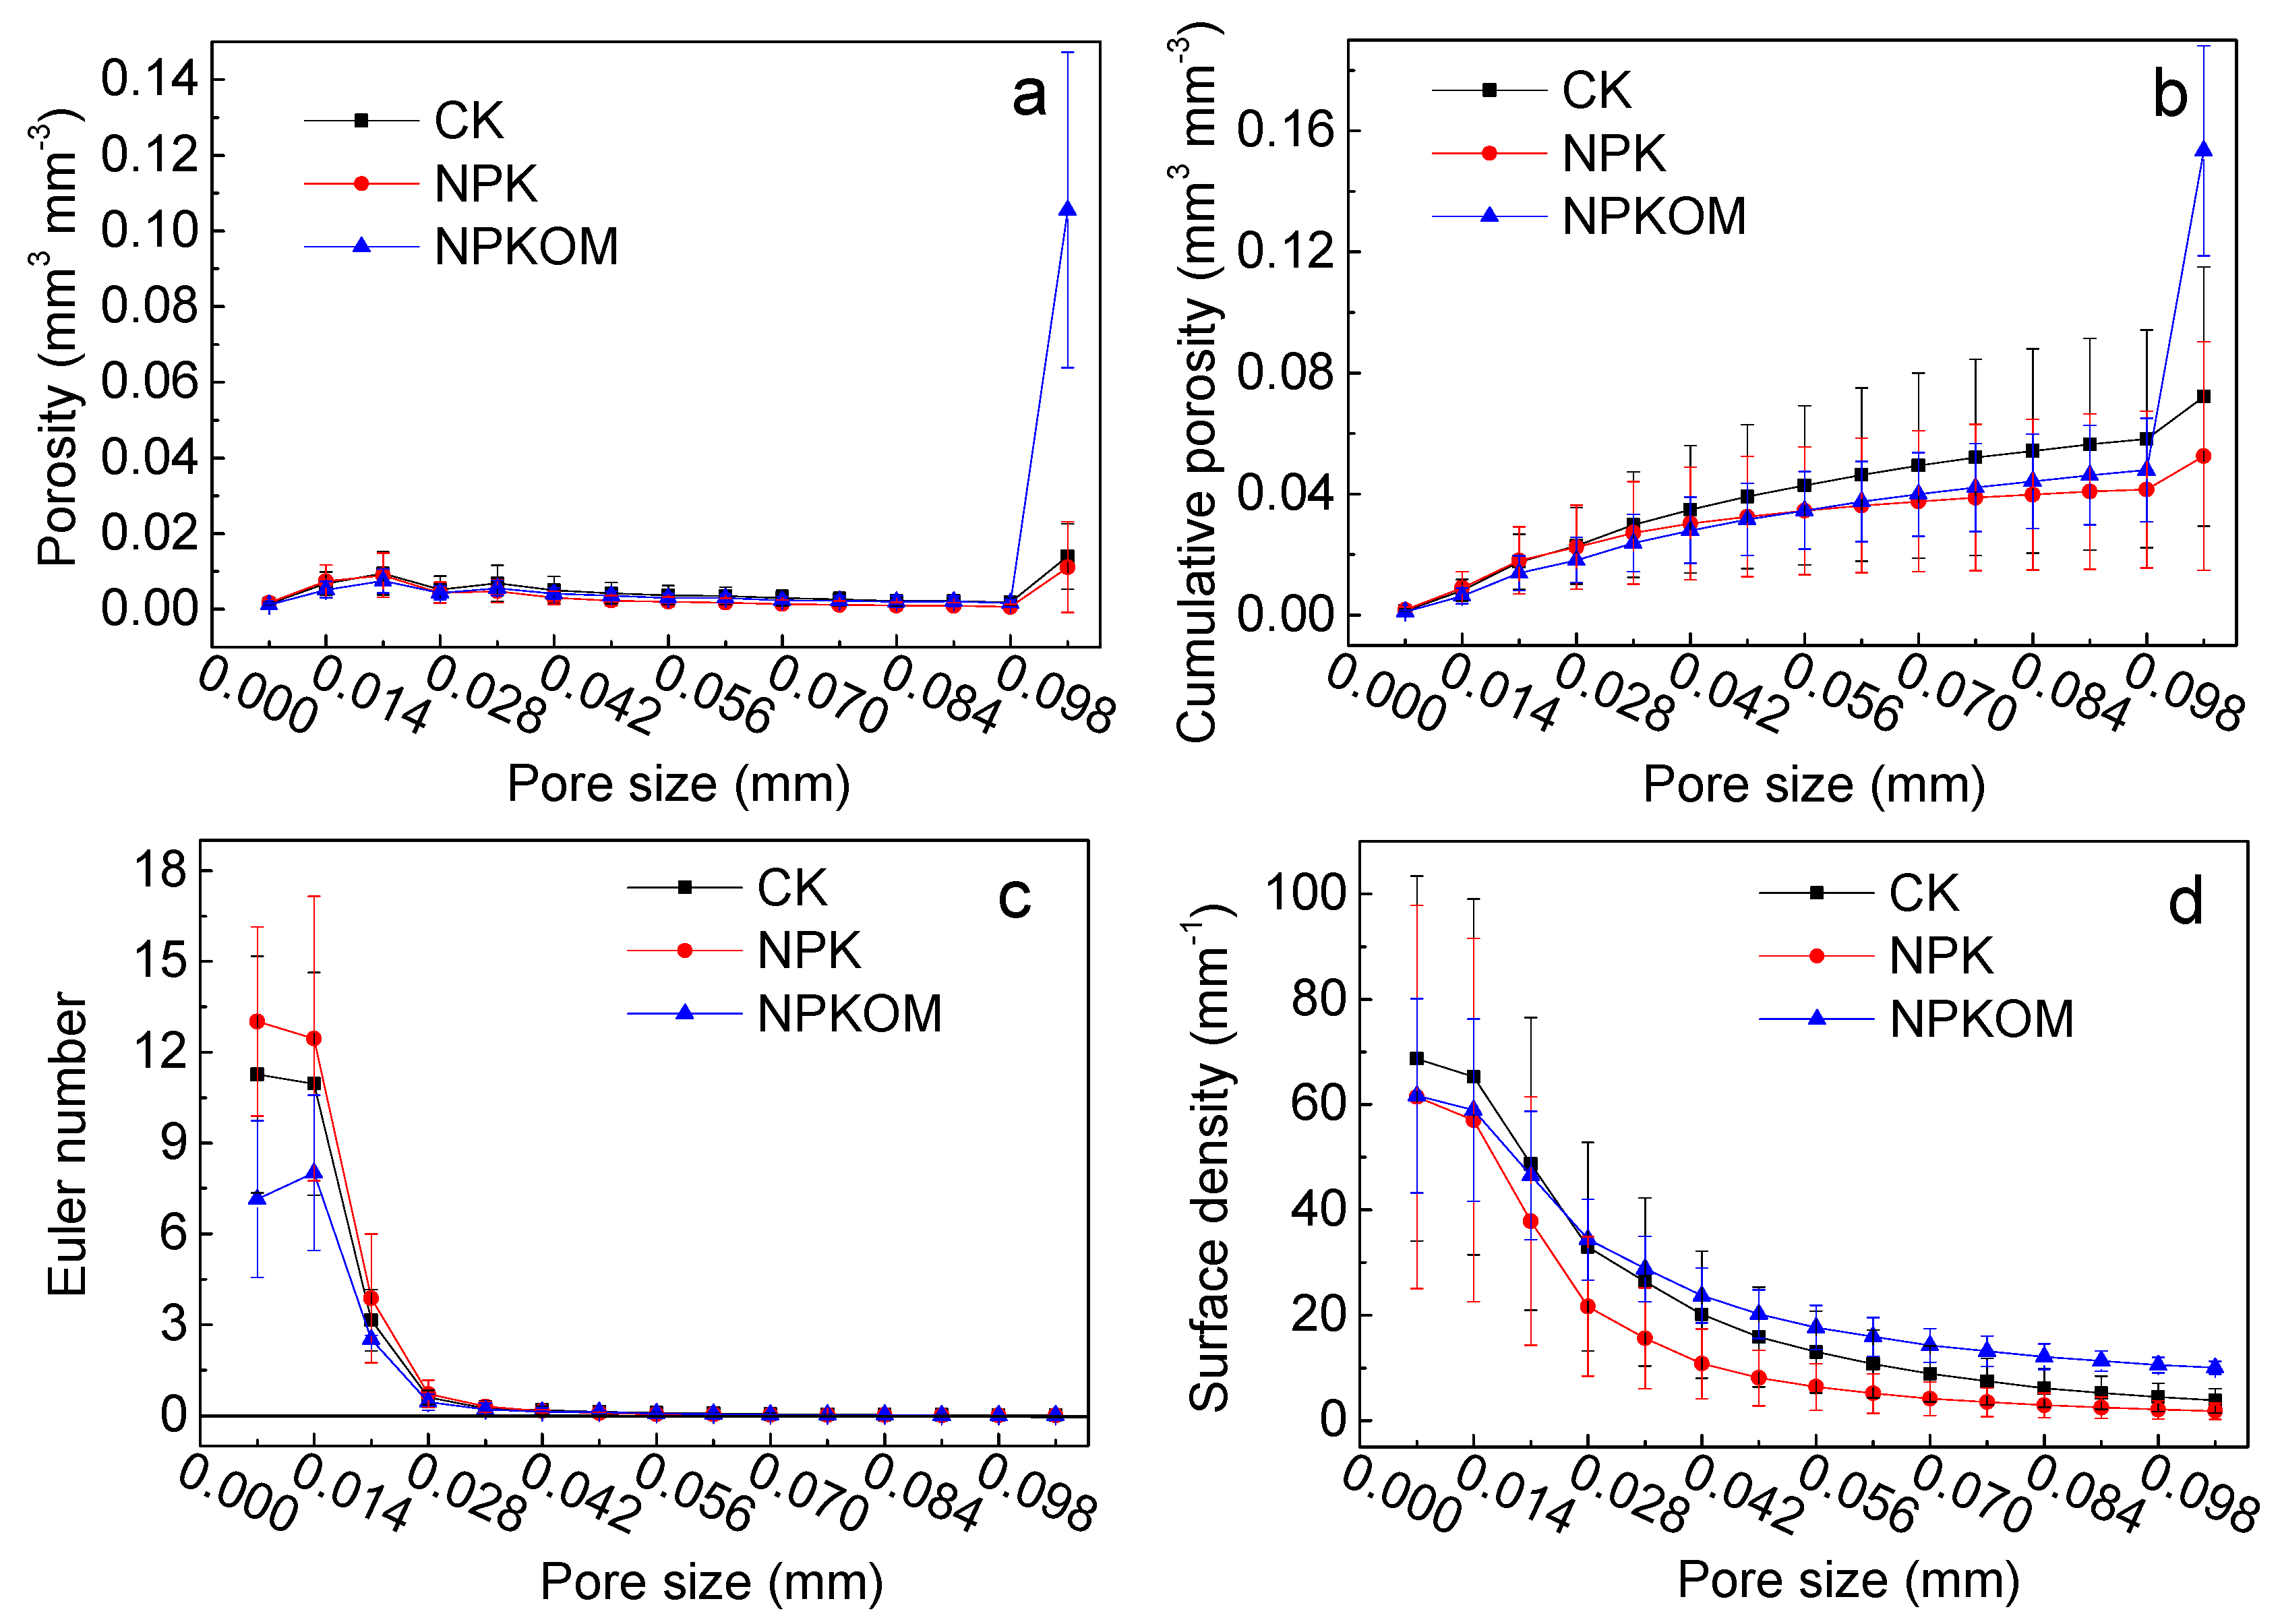
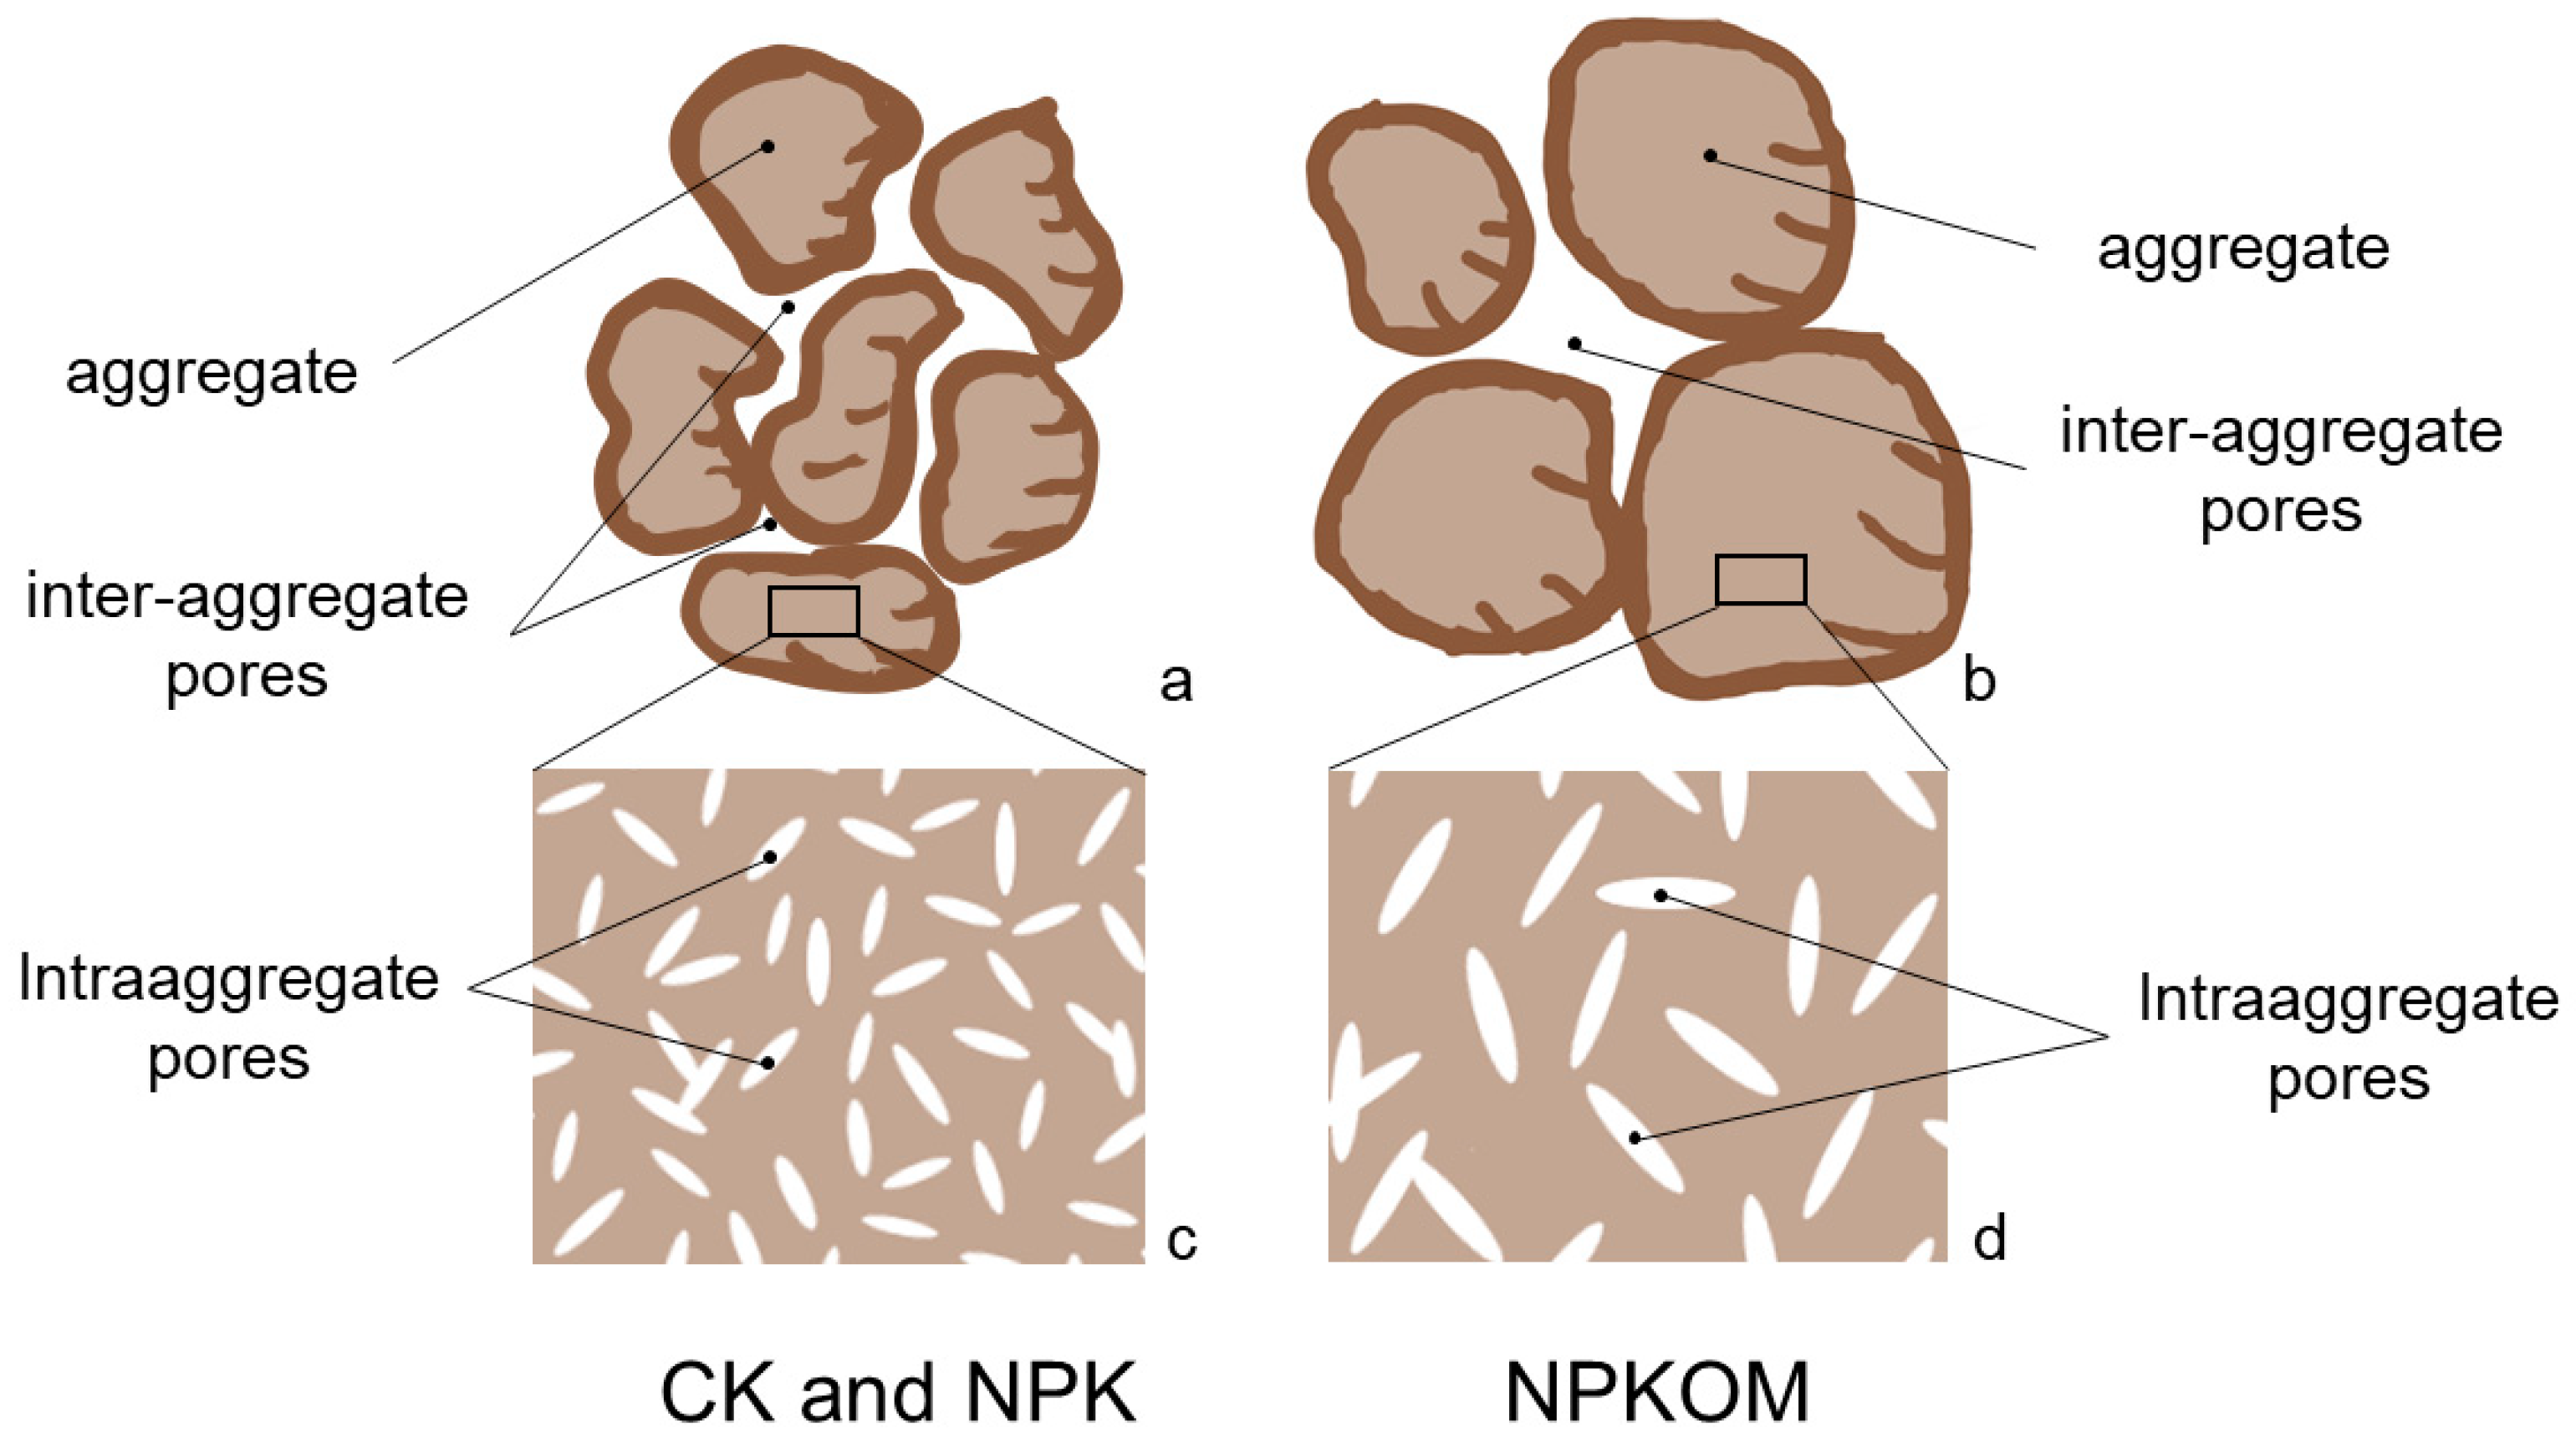
3.3. Pore Structure Characteristics of Soil Aggregates in Upland Red Soil

Figure 4 shows the 2D grayscale images of aggregates for the three treatments. The light gray areas in the images represent the soil matrix, while the dark gray areas are the soil pores. The image resolution is 0.0035 mm, so the displayed pores are larger than 0.0035 mm. The pore structures of CK and NPK treatments are similar and dominated by smaller pores, while larger pores are present in the NPKOM treatment.
The pore size distribution results are shown in Figure 5a, where the horizontal axis represents the pore diameter, with an interval of 0.007 mm between adjacent values, and the vertical axis represents the pore volume between this diameter and the next larger one. The last value on the horizontal axis corresponds to the total pore volume of all pores with diameters >0.098 mm. For pores with diameters <0.098 mm, there was no significant difference in the pore size distribution among the three treatments, consistent with the image features shown in Figure 4. For pores with diameters >0.098 mm, the pore volume of the NPKOM treatment was 7.6 and 9.5 times higher than that of the CK and NPK treatments, respectively.
The cumulative pore volume distribution is shown in Figure 5b. The last value on the horizontal axis corresponds to the total pore volume of all pores >0.0035 mm. From Figure 5b, the pore volume of pores >0.0035 mm for the three treatments was 0.072, 0.053, and 0.153 mm3 mm−3, respectively, with the largest proportion of pores with diameters >0.098 mm, accounting for 19.3%, 21.2%, and 68.8% of the total pore volume, respectively.
The 2D grayscale images of three soil aggregates for handling are shown in Figure 4, where the light areas represent the soil matrix, and the dark areas represent soil pores. The image resolution is 0.0035 mm, so the pores shown in the images are larger than 0.0035 mm. The internal pore structures of CK and NPK-treated aggregates are similar, with mostly small pores, while NPKOM-treated aggregates have larger pores.
Figure 5c shows the Euler numbers of pores of different sizes. As can be seen from the figure, the Euler numbers of the three treatments decrease with an increasing pore diameter, indicating that larger pores have better connectivity. For pores smaller than 0.007 mm, the pore connectivity of NPK-treated aggregates is significantly greater than that of NPKOM-treated aggregates, while there is no significant difference in pore connectivity for other pore diameters. The Euler numbers for all three treatments are positive, indicating that there are more enclosed pores than connected pores in the aggregates.
From Figure 5d, it can be seen that the surface density of the pores decreases with an increasing pore diameter. The surface density of NPK-treated aggregates is lower than that of the other two treatments, and when the pore diameter is larger than 0.077 mm, the surface density of NPKOM-treated aggregates is significantly higher than that of CK and NPK treatments (p < 0.05).

4. Discussion

4.1. Effects of Long-Term Fertilization on SOC and Aggregate Stability in Upland Red Soil

Both NPK and NPKOM treatments significantly increased the SOC, as reported in several studies [4,29,30,31]. Fertilization enhances aboveground and belowground biomass, increasing carbon sequestration through various pathways [30,32]. Additionally, organic fertilizers serve as a carbon source, further boosting carbon inputs [30]. Thus, NPKOM treatment led to a greater increase in the SOC than NPK treatment. Increasing the SOC not only improves soil fertility but also helps mitigate climate change by reducing atmospheric CO2 levels. In the southern red soil region, developing fertilization plans that promote carbon storage can strengthen both agricultural sustainability and climate resilience.
Compared to CK, there was no significant change in the aggregate water stability under NPK treatment. While NPK treatment increased the SOC, which acts as a crucial binder for improving aggregate stability, the correlation analysis revealed a significant positive correlation between the SOC and MWD (Figure 6). Fertilizers increase dispersed ions and lower pH, thereby reducing multivalent cations that contribute to binding [26]. The offsetting positive and negative effects of these mechanisms resulted in no significant change in aggregate stability for the NPK treatment, as noted in other studies [33,34]. NPKOM treatment significantly enhanced aggregate stability by increasing the SOC while reducing fertilizer usage, thus amplifying positive effects and diminishing negative ones. Furthermore, research indicates that organic matter in manure can release polysaccharides and other substances, promoting bonding between soil particles and enhancing aggregate stability [35].

4.2. Effects of Long-Term Fertilization on the Pore Structure Characteristics of the Upland Red Soil

NPK treatment significantly increased total porosity by 0.07 mm3 mm−3 compared to CK, but the porosity of pores >0.06 mm decreased by 0.04 mm3 mm−3, indicating that long-term inorganic fertilizer application hinders large pore formation. Zhou et al. [26] reached a similar conclusion in studies of alluvial and red paddy soils. In contrast, NPKOM treatment reduced total porosity by 0.04 mm3 mm−3 but increased the porosity of pores >0.06 mm by 0.04 mm3 mm−3, suggesting that the combined application of organic and inorganic fertilizers fosters large pore development, consistent with findings from Yu et al. [36] and Singh et al. [37]. This effect may be attributed to the stability of aggregates improved by organic fertilizers, facilitating the formation of large pores [18]. Correlation analysis showed a significant positive relationship between the MWD and pores >0.06 mm (Figure 6). NPKOM treatment notably increased pores >0.84 mm, likely due to healthier crop growth and more developed root systems, which promote larger pore formation [36]. Additionally, organic fertilizer decomposition enhances soil animal activity (e.g., earthworms), leading to increased large pore formation [38]. Studies indicate that pores >0.5 mm effectively promote root penetration and growth, further developing larger soil pores [39,40].
Pore surfaces influence water movement, gas exchange, and microbial activity in soil, making them critical for soil functions [16,28,41]. However, as pore size increases, surface density decreases, which can affect various processes within the soil [16]. NPKOM treatment significantly increased the surface density of pores greater than 0.84 mm, effectively improving the pore structure of upland red soil.
The distribution of pores smaller than 0.098 mm did not differ significantly among the three treatments, but NPKOM treatment significantly increased larger pores within the aggregates (Figure 5a). NPKOM treatment significantly improved aggregate water stability, allowing large pores to remain intact [42]. Correlation analysis revealed a strong positive correlation between the MWD and pores larger than 0.098 mm (Figure 6). In contrast, CK and NPK treatments exhibited poor aggregate water stability, leading to the destruction of large pores upon water exposure [34]. Additionally, pig manure decomposition contributed to the formation of large pores within aggregates [18]; NPKOM treatment significantly increased the organic matter content. Organic matter serves as a crucial binding agent in aggregates [43], enhancing the stability of the pore structure. The surfaces of pores within soil aggregates facilitate water vapor exchange, particularly around larger pores where activity is heightened [28]. As the pore size increases, the aggregate surface density decreases rapidly. However, NPKOM treatment significantly enhances the surface density of larger pores (>0.077 mm), allowing various processes within the aggregates to function effectively.
Based on the CT scan results (Figure 7), we propose an arrangement of aggregates and pore distribution under different fertilization treatments. In CK and NPK treatments, aggregates are small, with small inter-aggregate pores. In contrast, the NPKOM treatment leads to larger aggregates and larger inter-aggregate pores. Additionally, CK and NPK treatments have small internal pores within aggregates, whereas NPKOM treatment shows larger internal pores.

5. Conclusions

Long-term NPK and NPKOM treatments profoundly influenced the pore structure of the dry red soil columns. NPK significantly increased pores <0.06 mm and decreased pores >0.06 mm, while NPKOM significantly decreased pores <0.06 mm and increased pores >0.06 mm. Long-term NPK treatment did not markedly affect the pore structure of the soil aggregates, while long-term NPKOM treatment significantly increased pores >0.098 mm within the aggregates. NPK treatment significantly increased the organic carbon content of the dry red soil but had no significant effect on the stability of the aggregates. NPKOM treatment significantly increased both the organic carbon content and stability of the aggregates. This indicates that the long-term combined application of an inorganic fertilizer and pig manure can effectively improve the physical structure of the dry red soil, while a single application of chemical fertilizer cannot improve its physical structure. The findings of this study offer a scientific foundation for designing effective fertilizer application strategies in the southern red soil region.

Author Contributions

Conceptualization, H.F. and H.Z.; Formal analysis, N.Z.; Resources, D.L.; Data curation, N.Z.; Writing—original draft, H.F., N.Z., Z.Y. and D.L.; Writing—review & editing, H.F., Z.Y., X.P. and H.Z.; Supervision, X.P. and H.Z.; Funding acquisition, H.F. All authors have read and agreed to the published version of the manuscript.

Funding

This research was funded by Jinggang Shan Agricultural Hi-tech District Project (20222-051261), National Natural Science Foundation of China (42007009), Natural Science Foundation of Jiangsu Province (BK20200507).

Data Availability Statement

The data presented in this study are available on request from the corresponding author.

Conflicts of Interest

The authors declare no conflict of interest.

References

  1. Guo, Y.; Fan, R.; Zhang, X.; Zhang, Y.; Wu, D.; McLaughlin, N.; Zhang, S.; Chen, X.; Jia, S.; Liang, A. Tillage-induced effects on SOC through changes in aggregate stability and soil pore structure. Sci. Total Environ. 2020, 703, 134617. [Google Scholar] [CrossRef] [PubMed]
  2. Eden, M.; Moldrup, P.; Schjønning, P.; Vogel, H.J.; Scow, K.M.; de Jonge, L.W. Linking soil physical parameters along a density gradient in a loess-soil long-term experiment. Soil Sci. 2012, 177, 1–11. [Google Scholar] [CrossRef]
  3. Pardo, A.; Amato, M.; Chiarandà, F.Q. Relationships between soil structure, root distribution and water uptake of chickpea (Cicer arietinum L.). Plant growth and water distribution. Eur. J. Agron. 2000, 13, 39–45. [Google Scholar] [CrossRef]
  4. Tong, X.; Xu, M.; Wang, X.; Bhattacharyya, R.; Zhang, W.; Cong, R. Long-term fertilization effects on organic carbon fractions in a red soil of China. Catena 2014, 113, 251–259. [Google Scholar] [CrossRef]
  5. Zhang, H.; Wang, B.; Xu, M.; Fan, T. Crop yield and soil responses to long-term fertilization on a red soil in southern China. Pedosphere 2009, 19, 199–207. [Google Scholar] [CrossRef]
  6. Baligar, V.C.; Fageria, N.K.; Eswaran, H.; Wilson, M.J.; He, Z. Nature and properties of red soils of the world. In The Red Soils of China: Their Nature, Management and Utilization; Springer: Dordrecht, The Netherlands, 2004; pp. 7–27. [Google Scholar]
  7. Dong, W.; Zhang, X.; Wang, H.; Dai, X.; Sun, X.; Qiu, W.; Yang, F. Effect of different fertilizer application on the soil fertility of paddy soils in red soil region of southern China. PLoS ONE 2012, 7, e44504. [Google Scholar] [CrossRef] [PubMed]
  8. Celik, I.; Ortas, I.; Kilic, S. Effects of compost, mycorrhiza, manure and fertilizer on some physical properties of a Chromoxerert soil. Soil Tillage Res. 2004, 78, 59–67. [Google Scholar] [CrossRef]
  9. Adnan, M.; Xu, M.; Syed, A.; Muhammad, M.; Sun, N.; Wang, B.; Cai, Z.; Qudsia, S.; Muhammad, N.; Khalid, M. Soil aggregation and soil aggregate stability regulate organic carbon and nitrogen storage in a red soil of southern China. J. Environ. Manag. 2020, 270, 110894. [Google Scholar]
  10. Liu, K.; Han, T.; Huang, J.; Huang, Q.; Li, D.; Hu, Z.; Yu, X.; Muhammad, Q.; Ahmed, W.; Hu, H.; et al. Response of soil aggregate-associated potassium to long-term fertilization in red soil. Geoderma 2019, 352, 160–170. [Google Scholar] [CrossRef]
  11. Di, J.; Liu, X.; Du, Z.; Xiao, X.; Yang, G.; Ren, T. Influences of long-term organic and chemical fertilization on soil aggregation and associated organic carbon fractions in a red paddy soil. Chin. J. Eco-Agric. 2014, 22, 1129–1138. [Google Scholar]
  12. Huang, S.; Peng, X.; Huang, Q.; Zhang, W. Soil aggregation and organic carbon fractions affected by long-term fertilization in a red soil of subtropical China. Geoderma 2010, 154, 364–369. [Google Scholar] [CrossRef]
  13. Sun, M. Characteristics of Pore Size Distribution and Change in Upland Res Soil under Long-Term Manure Application. Master’s Thesis, Hunan Agriculture University, Changsha, China, 2014. (In Chinese). [Google Scholar]
  14. Liu, K.; Huang, J.; Zhang, H.; Li, D.; Han, T.; Cai, Z.; Wang, B.; Huang, Q. Effect of long-term fertilization on aggregation characteristics and distribution of potassium fractions in red soil. Acta Pedol. Sin. 2018, 55, 443–454. (In Chinese) [Google Scholar]
  15. Dal Ferro, N.; Charrier, P.; Morari, F. Dual-scale micro-CT assessment of soil structure in a long-term fertilization experiment. Geoderma 2013, 204, 84–93. [Google Scholar] [CrossRef]
  16. Rabot, E.; Wiesmeier, M.; Schlüter, S.; Vogel, H.J. Soil structure as an indicator of soil functions: A review. Geoderma 2018, 314, 122–137. [Google Scholar] [CrossRef]
  17. Young, I.M.; Crawford, J.W. Interactions and self-organization in the soil-microbe complex. Science 2004, 304, 1634–1637. [Google Scholar] [CrossRef]
  18. Zhou, H.; Fang, H.; Mooney, S.J.; Peng, X. Effects of long-term inorganic and organic fertilizations on the soil micro and macro structures of rice paddies. Geoderma 2016, 266, 66–74. [Google Scholar] [CrossRef]
  19. Ju, X.; Gao, L.; She, D.; Jia, Y.; Pang, Z.; Wang, Y. Impacts of the soil pore structure on infiltration characteristics at the profile scale in the red soil region. Soil Tillage Res. 2024, 236, 105922. [Google Scholar] [CrossRef]
  20. Zhang, S.Y.; He, B.; Hao, B.; Lv, D. Quantification of red soil macropores affected by slope erosion and sediment using computed tomography. Vadose Zone J. 2023, 22, e20276. [Google Scholar] [CrossRef]
  21. Hartmann, M.; Six, J. Soil structure and microbiome functions in agroecosystems. Nat. Rev. Earth Environ. 2023, 4, 4–18. [Google Scholar] [CrossRef]
  22. Peng, J.; Yang, Q.; Zhang, C.; Ni, S.; Wang, J.; Cai, C. Aggregate pore structure, stability characteristics, and biochemical properties induced by different cultivation durations in the Mollisol region of Northeast China. Soil Tillage Res. 2023, 233, 105797. [Google Scholar] [CrossRef]
  23. Pulido-Moncada, M.; Petersen, S.O.; Clough, T.J.; Munkholm, L.J.; Squartini, A.; Longo, M.; Dal Ferro, N.; Morari, F. Soil pore network effects on the fate of nitrous oxide as influenced by soil compaction, depth and water potential. Soil Biol. Biochem. 2024, 197, 109536. [Google Scholar] [CrossRef]
  24. Zhang, W.; Xu, M.; Wang, B.; Wang, X. Soil organic carbon, total nitrogen and grain yields under long-term fertilizations in the upland red soil of southern China. Nutr. Cycl. Agroecosystems 2009, 84, 59–69. [Google Scholar] [CrossRef]
  25. Le Bissonnais, Y.L. Aggregate stability and assessment of soil crustability and erodibility: I. Theory and methodology. Eur. J. Soil Sci. 1996, 47, 425–437. [Google Scholar] [CrossRef]
  26. Zhou, H.; Fang, H.; Hu, C.; Mooney, S.J.; Dong, W.; Peng, X. Inorganic fertilization effects on the structure of a calcareous silt loam soil. Agron. J. 2017, 109, 2871–2880. [Google Scholar] [CrossRef]
  27. Schlüter, S.; Weller, U.; Vogel, H.J. Soil-structure development including seasonal dynamics in a long-term fertilization experiment. J. Plant Nutr. Soil Sci. 2011, 174, 395–403. [Google Scholar] [CrossRef]
  28. Martínez, F.S.J.; Ortega, F.M.; Monreal, F.C.; Kravchenko, A.N.; Wang, W. Soil aggregate geometry: Measurements and morphology. Geoderma 2015, 237, 36–48. [Google Scholar] [CrossRef]
  29. Liu, Y.; Li, C.; Cai, G.; Sauheitl, L.; Xiao, M.; Shibistova, O.; Ge, T.; Guggenberger, G. Meta-analysis on the effects of types and levels of N, P, and K fertilization on organic carbon in cropland soils. Geoderma 2023, 437, 116580. [Google Scholar] [CrossRef]
  30. Yang, Z.; Zhao, N.; Huang, F.; Lv, Y. Long-term effects of different organic and inorganic fertilizer treatments on soil organic carbon sequestration and crop yields on the North China Plain. Soil Tillage Res. 2015, 146, 47–52. [Google Scholar] [CrossRef]
  31. Šimanský, V.; Juriga, M.; Jonczak, J.; Uzarowicz, Ł.; Stępień, W. How relationships between soil organic matter parameters and soil structure characteristics are affected by the long-term fertilization of a sandy soil. Geoderma 2019, 342, 75–84. [Google Scholar] [CrossRef]
  32. Bhattacharyya, R.; Prakash, V.; Kundu, S.; Srivastva, A.K.; Gupta, H.S.; Mitra, S. Long term effects of fertilization on carbon and nitrogen sequestration and aggregate associated carbon and nitrogen in the Indian sub-Himalayas. Nutr. Cycl. Agroecosystems 2010, 86, 1–16. [Google Scholar] [CrossRef]
  33. Xin, X.; Zhang, J.; Zhu, A.; Zhang, C. Effects of long-term (23 years) mineral fertilizer and compost application on physical properties of fluvo-aquic soil in the North China Plain. Soil Tillage Res. 2016, 156, 166–172. [Google Scholar] [CrossRef]
  34. Blanco-Canqui, H.; Schlegel, A.J. Implications of inorganic fertilization of irrigated corn on soil properties: Lessons learned after 50 years. J. Environ. Qual. 2013, 42, 861–871. [Google Scholar] [CrossRef]
  35. Bronick, C.J.; Lal, R. Soil structure and management: A review. Geoderma 2005, 124, 3–22. [Google Scholar] [CrossRef]
  36. Yu, X.; Hong, C.; Peng, G.; Lu, S. Response of pore structures to long-term fertilization by a combination of synchrotron radiation X-ray microcomputed tomography and a pore network model. Eur. J. Soil Sci. 2018, 69, 290–302. [Google Scholar] [CrossRef]
  37. Singh, N.; Kumar, S.; Udawatta, R.P.; Anderson, S.H.; de Jonge, L.W.; Katuwal, S. X-ray micro-computed tomography characterized soil pore network as influenced by long-term application of manure and fertilizer. Geoderma 2021, 385, 114872. [Google Scholar] [CrossRef]
  38. Pagenkemper, S.K.; Athmann, M.; Uteau, D.; Kautz, T.; Peth, S.; Horn, R. The effect of earthworm activity on soil bioporosity–Investigated with X-ray computed tomography and endoscopy. Soil Tillage Res. 2015, 146, 79–88. [Google Scholar] [CrossRef]
  39. Colombi, T.; Braun, S.; Keller, T.; Walter, A. Artificial macropores attract crop roots and enhance plant productivity on compacted soils. Sci. Total Environ. 2017, 574, 1283–1293. [Google Scholar] [CrossRef]
  40. Wendel, A.S.; Bauke, S.L.; Amelung, W.; Knief, C. Root-rhizosphere-soil interactions in biopores. Plant Soil 2022, 475, 253–277. [Google Scholar] [CrossRef]
  41. Siedt, M.; Schäffer, A.; Smith, K.E.; Nabel, M.; Roß-Nickoll, M.; Van Dongen, J.T. Comparing straw, compost, and biochar regarding their suitability as agricultural soil amendments to affect soil structure, nutrient leaching, microbial communities, and the fate of pesticides. Sci. Total Environ. 2021, 751, 141607. [Google Scholar] [CrossRef]
  42. Ozlu, E.; Kumar, S. Response of soil organic carbon, pH, electrical conductivity, and water stable aggregates to long-term annual manure and inorganic fertilizer. Soil Sci. Soc. Am. J. 2018, 82, 1243–1251. [Google Scholar] [CrossRef]
  43. Six, J.; Elliott, E.T.; Paustian, K. Soil structure and soil organic matter II. A normalized stability index and the effect of mineralogy. Soil Sci. Soc. Am. J. 2000, 64, 1042–1049. [Google Scholar] [CrossRef]
Figure 1. The location of the experimental site.
Agronomy 14 02668 g001
Figure 2. The 2D and 3D characteristics of pores of columns from upland red soils under different fertilizations (27 mm × 27 mm × 27 mm).
Agronomy 14 02668 g002
Figure 3. Pore size distribution (a), cumulative porosity (b), Euler number (c) and surface density (d) of upland red soil columns under different fertilizations.
Agronomy 14 02668 g003
Figure 4. The 2D characteristics of pores of soil aggregates from upland red soils under different fertilizations.
Agronomy 14 02668 g004
Figure 5. Pore size distribution (a), cumulative porosity (b), Euler number (c) and surface density (d) of upland red soil aggregates under different fertilizations.
Agronomy 14 02668 g005
Figure 6. Pearson’s correlation coefficients between soil characteristics and soil pore parameters. EN is Euler number and SD is surface density.
Agronomy 14 02668 g006
Figure 7. Schematic representation of the arrangement of aggregates and pore distribution within aggregates under different fertilization treatments. (a): the arrangement of aggregates under CK and NPK treatments; (b): the arrangement of aggregates under NPKOM treatments; (c): pore distribution within aggregates under CK and NPK treatments; (d): pore distribution within aggregates under NPKOM treatments.
Agronomy 14 02668 g007
Table 1. Sample size and X-ray CT scan parameters.
SamplesSample Size/
(mm)
Voltage/
(kV)
Current/
(μA)
Resolution/
(mm)
Soil columnsDiameter 50, height 501101100.06
Soil aggregatesDiameter 3–5 1101200.0035
Table 2. Basic properties of the upland red soil as affected by different fertilizations.
TreatmentsSOC/
(g kg−1)
Bulk Density/
(g cm−3)
Total Porosity/
(mm3 mm−3)
MWD/
(mm)
CK7.53 ± 0.33 c1.30 ± 0.05 b0.51 ± 0.02 b0.64 ± 0.10 b
NPK10.9 ± 0.23 b1.11 ± 0.03 c0.58 ± 0.01 a0.67 ± 0.19 b
NPKOM16.0 ± 1.20 a1.41 ± 0.04 a0.47 ± 0.01 c0.97 ± 0.14 a
Note: The data in the table are mean values and standard error values. The different lowercases within the same column mean significant differences at 0.05 level. MWD is mean weight diameter.
Disclaimer/Publisher’s Note: The statements, opinions and data contained in all publications are solely those of the individual author(s) and contributor(s) and not of MDPI and/or the editor(s). MDPI and/or the editor(s) disclaim responsibility for any injury to people or property resulting from any ideas, methods, instructions or products referred to in the content.

