Article

Efficiency of Vivianite from Water Purification Depending on Its Mixing with Superphosphate and Application Method

by
Tolulope Ayeyemi
1,
Ramiro Recena
1,
Ana María García-López
1,
José Manuel Quintero
1,
María Carmen del Campillo
2 and
Antonio Delgado
1,*
1
Department of Agronomy, University of Sevilla, ETSIA, Ctra. Utrera km 1, 41013 Sevilla, Spain
2
Department of Agronomy, University of Córdoba, Edificio C4, Campus de Rabanales, 14071 Córdoba, Spain
*
Author to whom correspondence should be addressed.
Agronomy 2024, 14(11), 2639; https://doi.org/10.3390/agronomy14112639
Submission received: 10 October 2024 / Revised: 3 November 2024 / Accepted: 5 November 2024 / Published: 8 November 2024
(This article belongs to the Section Agroecology Innovation: Achieving System Resilience)

Abstract

:
Vivianite precipitation is gaining attention in phosphorus (P) removal from water purification. It is an iron (Fe)- and P-rich compound that can be used as a slow-release P fertilizer. However, this slow release can constrain P supply to crops in the initial growing stages. This limitation can be overcome by mixing with soluble P fertilizers and with banding application. Thus, the objective of this study was to assess the fertilizer effect of vivianite and superphosphate mixtures and determine the most effective application method for vivianite and its mixture with superphosphate as a soluble fertilizer. A pot experiment was conducted by growing sunflowers in calcareous soil under controlled conditions involving two factors. The first factor was the combinations of vivianite and superphosphate: 100% Vivianite + 0% Superphosphate –T2–, 70% Vivianite + 30% Superphosphate –T3–, 30% Vivianite + 70% Superphosphate –T4–, 0% Vivianite + 100% Superphosphate –T5—at a single P rate of 50 mg P kg−1 and a non-fertilized control –T1–. The second factor was the application method: (i) mixing vivianite powder with the bulk soil and (ii) applying it in bands at three points around the plants. The dry matter (DM) yield in the roots and shoots of the sunflower when all P was applied as superphosphate was higher than when it was applied as vivianite. However, the combination of superphosphate and vivianite in different proportions (T3 and T4) led to a considerably higher DM yield compared to sole vivianite application (T2). The highest plant P uptake was observed in T5, while the lowest was in T1 and T2. The replacement values on a dry matter (PFRVDM) and P uptake (PFRVP Uptake) basis and the nutrient use efficiency of T3 and T4 were higher than that of T2. However, the PFRVDM and the PFRVP Uptake were in the same range as the proportion of the superphosphate added to the fertilizer mix. Thus, increased P use efficiency could be achieved with mixtures of vivianite and superphosphate. However, the contribution of vivianite to the fertilizer mix is difficult to access in a short growing cycle. Hence, further research is recommended on the residual effect of vivianite in such fertilizer mix on subsequent growing cycles.

1. Introduction

Increased agricultural production has been made possible with a considerable use of fertilizers containing nitrogen (N), phosphorus (P), and potassium (K) for decades [1]. Phosphorus fertilizers have been produced from phosphate rock since the end of the 19th century, and this raw material now faces challenges of rapid depletion [2,3]. Of all three primary macronutrients, the continued supply of P fertilizers for sustainable and global food security has been described as a looming crisis by several studies [1,4,5]. Therefore, there is an urgent and increasing need to make efficient use of the limited P reserves and search for alternative and sustainable sources of P to support crop production to feed the world’s rapidly growing population.
Mineral P fertilizers such as superphosphate have been used by farmers to meet the P demand of agricultural crops for food production [6,7]. These fertilizers are highly water soluble, and when added to soils, they result in immediately high soil solution P concentrations for early crop growth [8]. However, a large proportion of the P from mineral P fertilizer is readily adsorbed by soil particles, thus resulting in a pool of residual P [9]. A proportion of this P is unavailable to plants [10]. On the other hand, in soils where sorbing capacity is saturated, there is a possibility that P can be lost through leaching, or when bound to soil particles, it can be lost through runoff or erosion, thereby causing eutrophication in waterbodies [11,12]. As a result of its reactions in soil, when P demand is high at a later stage of crop growth, there is less P available for plant uptake and growth [13]. This may partly explain why a high supply of P in soluble form does not automatically translate to high crop biomass production in P-deficient soils [14]. However, P limitation at a later stage of crop growth is believed to have a reduced impact on production compared to P limitation at the early stage of crop growth [15].
With the imminent phosphate rock scarcity crisis, attention has been drawn to the recovery and recycling of P from different sources [1,16,17]. Vivianite is one of the P-removal products that has been identified as a potential P fertilizer product from the water purification process [18]. Removal of P from wastewater as vivianite is gaining attention since it has a high P concentration, and the recovery of this product is easier than other products, such as struvite, due to its magnetic properties [14]. Some promising results have been obtained using vivianite as a P fertilizer [14,19]. However, its efficiency is not fully comparable with that of soluble mineral fertilizer. Unlike superphosphate, vivianite has a low solubility [20,21] and probably releases P slowly and in a controlled manner. With this attribute, it is expected to be less susceptible to losses through leaching or reactions promoting a decrease in its availability to plants, such as the precipitation of insoluble metal phosphates. Although the release of P from vivianite at the early stages of crop growth may be too slow to meet crop demands at the beginning of the growing cycle, it may be able to serve as a source of P for crops at a later growing stage and a residual source of P for subsequent crops when compared to readily soluble P fertilizers. With the combined application of soluble phosphate and vivianite, the demand for P at the early stage of crop growth is supplied by the soluble form, while demand at the later stages of growth can be supplied by vivianite. This will allow crops to access P throughout all stages of growth. However, there is no evidence of the potential benefits of mixtures of soluble P fertilizers and vivianite on crops.
According to the 4R nutrient stewardship, the method of fertilizer application plays a crucial role in ensuring positive nutrient use efficiency [22]. The banding of P fertilizers in soils with limited P availability has improved crop yields [23]. This is ascribed to the increased P availability in a volume of soil with a high root density. This enhances the absorption of the nutrient, which essentially moves to roots through diffusion [24]. In addition, the banding promotes a high concentration of P in a restricted volume of soil, leading to a saturation of the sorbent capacity of soils and, consequently, to an increased availability to plants [25]. In the case of vivianite, an increased solubilization and P release in the rhizosphere due to the release of low-molecular-weight acids has been shown in a study conducted by Yang et al. [26]. All these suggest that placing vivianite close to the root system with a banding application may increase its efficiency as a P fertilizer.
Soluble fertilizers are usually applied in granule form to soils. However, mixing P fertilizers, especially less soluble products like struvite, in powder form with soil was effective in supplying P to crops in a study by Degryse et al. [27]. Thus, particle size and application method may have an effect on the efficiency of less soluble P fertilizers, such as vivianite. Hence, it is relevant to assess the best application method to achieve maximum efficiency in the use of vivianite as a P fertilizer. Therefore, the objective of this study was to evaluate the fertilizer effect of mixtures of a soluble P form, superphosphate, and vivianite and to determine the most effective application method, i.e., banding or mixed as powder with soil, when vivianite is applied as a P fertilizer to crops.

2. Materials and Methods

2.1. Experimental Design

2.1.1. Soil

The soil used for this experiment was obtained from an olive grove in the Aljarafe area of Seville, Spain. It is located in the municipality of Bollulos de la Mitación (37°19′10.6″ N, 6°07′58.7″ W). The soil sample was taken at a depth of 0–15 cm, after which it was air-dried, homogenized, and sieved to 4 mm. This soil was selected because of its low Olsen P content (3.5 mg P kg−1). The soil was classified as a Calcic Haploxeralf, according to the Soil Taxonomy of the USDA [28]. The properties of the soil used in this experiment are shown in Table 1.

2.1.2. Experimental Factors: Fertilizer Treatments and Application Methods

In this experiment, two treatment factors were considered.
  • Fertilizer Treatment: Two sources of P (vivianite and superphosphate) were used in this experiment. We used four different combinations of vivianite and superphosphate, and a non-fertilized control making a total of five fertilizer treatments. The summary of the five fertilizer treatments is given below:
0% Vivianite + 0% Superphosphate − Control − T1
100% Vivianite + 0% Superphosphate − T2
70% Vivianite + 30% Superphosphate − T3
30% Vivianite + 70% Superphosphate − T4
0% Vivianite + 100% Superphosphate − T5
The vivianite used in this experiment was recovered from Wastewater Treatment Plants (WWTPs) during the process of water purification, and it was provided by Wetsus (European Centre of Excellence for Sustainable Water Technology) from Leeuwarden, the Netherlands. The elemental composition was determined with the use of ICP-OES after acid digestion. The Fe2+ to Fe3+ ratio was determined by Mössbauer and X-ray photoelectron spectroscopy (XPS). The scanning electron microscope image of the recovered vivianite was obtained with the use of a microscope (JEOL JSM 6300, Freising, Germany) at the SCAI—University of Cordoba (Spain) facilities. Monocalcium phosphate (Ca(H2PO4)2.H2O) was used as soluble P fertilizer (superphosphate).
2.
Fertilizer Application Method: Two fertilizer application methods were used in the experiment.
(a)
Banding (fertilizer product placed at certain points in the soil in the pot around the plants).
(b)
Powder mix (mixing of fertilizer product with soil).

2.1.3. Plant Material

The crop selected for this experiment was sunflower (Helianthus annuus L.) variety LG CLP clearfield 5 2 1 High oleic. Sunflower was selected because it can provide a substantial amount of biomass and high nutrient uptake in short-term experiments. The seeds were pre-germinated in darkness for four days, after which they were transplanted.

2.1.4. Pot Experimental Design

The pot experiment was conducted in a randomized block design with five replicates for each treatment. Each pot corresponded to a replication with one sunflower plant. As mentioned above, two factors were involved in this experiment (i) fertilizer treatments—vivianite and superphosphate combined in four different proportions at a single application rate of 50 mg P kg−1 and control without the application of P fertilizer (five fertilizer treatments), and (ii) two fertilizer application methods (banding and powder mix).

2.1.5. Experimental Setup

A 300 g portion of soil was weighed (Ohaus AR3130, Shanghai, China) and placed in transparent cylindrical polyethylene pots with a capacity of 350 mL (height 150 mm, diameter 55 mm). For the powder mix fertilizer application method, the corresponding dose of the fertilizer product was carefully mixed with the soil in powder form two days before transplanting the sunflower seedlings. For the banded (or localized) application, the corresponding dose of the fertilizer product was applied at three points in the pot at a depth of approximately 10 cm. Special care was taken to ensure that the small root of the sunflower did not come into direct contact with the applied products or the walls of the pot. Pots were then placed in the growing chamber with temperatures of 25 °C/18 °C day/night. During the first week of the experiment, the sunflower plants were only irrigated with water, after which a P and Fe nutrient-free Hoagland solution (pH 6–6.5) was applied between 30–40 mL per irrigation periodically. The composition of the solution was (all concentrations in mmol L–1): MgSO4 (2), Ca(NO3)2 (5), KNO3 (5), KCl (0.05), H3BO3 (0.024), MnCl2 (0.0023), CuSO4 (0.0005), ZnSO4 (0.002) and H2MoO4 (0.0005). The volume of irrigation solution at the end of the cropping period was 1.64 L pot−1.

2.2. Collection and Analysis of Plant and Soil Samples

2.2.1. Collection of Plant and Soil Samples

At the end of the experiment (94 days), the root, shoot, and flower heads of sunflower plants were collected separately. The root was carefully separated from the soil, washed with deionized water, and dried. All parts were left to dry in a forced air oven dryer (J.P Selecta, Incubig, Barcelona, Spain) at a constant temperature of 65 °C for 48 h, after which the dry matter (DM) in each organ was weighed (Ohaus AR3130, Shanghai, China). Soil samples were also collected for Olsen P and DTPA Fe analyses. These samples were airdried and milled to pass through a 2 mm screen.

2.2.2. Plant and Soil Analysis at the End of the Experiment

Plant organs were ground separately. 0.25 g of ground plant material was mineralized in porcelain crucibles in a muffle furnace (Carbolite, ELF 11/14B, Hope Valley, UK) at 550 °C for eight hours. Subsequently, ashes were dissolved with 1 M HCl and heated at 100 °C on a hotplate (J.P. Selecta, Barcelona, Spain) for 15 min. Phosphorus concentrations were determined by the colorimetric method according to Murphy & Riley [29], with subsequent measurement in a spectrophotometer (UNICAM UV2-200, Cambridge, UK) at 882 nm. Iron was determined by atomic absorption spectrophotometry (AAS) (UNICAM Solaar M5, Cambridge, UK). The total P uptake was determined as the sum of the product of the dry weight of each organ and its P concentration. Available P in soil after the sunflower crops were harvested was determined by the method of Olsen et al. [30]. To this end, two grams of each soil sample were weighed (Ohaus AR3130, Shanghai, China) into 50 mL falcon tubes, and 40 mL of NaHCO3 0.5 M extractant at pH 8.5 was added. This combination was shaken (Heidolph, Promax 2020, Schwabach, Germany) for 30 min at 180 rpm and then centrifuged (Eppendorf AG, 5810, Hamburg, Germany) at 900 g for 10 min. The P content of the extract was determined by colorimetry following the methodology of Murphy & Riley [29] in a spectrophotometer (UNICAM UV2-200, Cambridge, UK) at 882 nm. The DTPA (Diethylenetriaminepentaacetic acid) extractable Fe determination was carried out according to Lindsay & Norvell [31] with slight modifications. Five grams of soil were weighed (Ohaus AR3130, Shanghai, China) into 50 mL falcon tubes, and 20 mL of DTPA/CaCl2 TEA (triethanolamine) was added and stirred (Heidolph, Promax 2020, Schwabach, Germany) for two hours at 160 rpm. The suspension was then placed in the centrifuge (Eppendorf AG, 5810, Hamburg, Germany) for 15 min at 900 g. The Fe content of the extract was determined with the use of an Atomic Absorption Spectrometer (AAS) (UNICAM Solaar M5, Cambridge, UK).

2.3. Fertilizer Efficiency Indexes

The P fertilizer replacement value (PFRV) was adapted from [32] as the amount of commercial mineral P fertilizer that is saved or replaced when using an alternative fertilizer (vivianite in this case) to obtain the same P uptake or yield. This was estimated on a P uptake basis as:
P F R V P U p t a k e = P u p t a k e i P u p t a k e c P u p t a k e s P u p t a k e c
where, Puptakei is the P uptake by the crop in the treatment with alternative fertilizer i, Puptakec is the average P uptake in the non-fertilized control treatment, and Puptakes is the average P uptake in the superphosphate treatment at the same P rate as i.
The PFRV was also estimated on a total dry matter (DM) basis as:
P F R V D M = D M i D M c D M s D M c
where, DMi is the DM of the crop in the treatment with alternative fertilizer i, DMc is the average DM of the control treatment, and DMs, is the average DM of the superphosphate treatment at the same P rate as i. PFRVDM can also be referred to as Agronomic Replacement Value (APV).
The nutrient use efficiency (NUE) of the sunflower plant was estimated through the agronomic efficiency (AE), apparent P recovery (APR), and Olsen P recovery (OPR). Agronomic efficiency was adapted from [33,34], which is defined as the efficiency of applied fertilizer nutrients in increasing biomass yield. It is calculated as:
A E = D M i D M c A p p l i e d P r a t e
where DMi is the DM of the crop in the treatment with alternative fertilizer i, DMc is the average DM of the control treatment and applied P rate is the rate of P fertilizer (50 mg P kg−1) used for the experiment.
Apparent P recovery (APR) was adapted from [33,34] and is defined as the difference in P uptake between pots where P is applied and control pots where P is not applied relative to the amount of P fertilizer applied. It is calculated as:
A P R = P u p t a k e i P u p t a k e c A p p l i e d P r a t e
where, Puptakei is the P uptake by the crop in the treatment with alternative fertilizer i, Puptakec is the average P uptake in the non-fertilized control treatment, and applied P rate is the rate of P fertilizer used for the experiment.
Olsen P recovery (OPR) is defined as the difference in soil P availability index (measured as Olsen P) between pots where P is applied and control pots where P is not applied relative to the amount of P fertilizer applied. It is calculated as:
O P R = O l s e n P i O l s e n P c A p p l i e d P r a t e
where Olsen Pi is the Olsen p value of the treatment with alternative fertilizer i, Olsen Pc is the Olsen p value of the control treatment and applied P rate is the rate of P fertilizer used for the experiment.

2.4. Statistical Analysis

Statistical analysis was carried out with Statgraphics Centurion XVI (Statgraphics Technologies Inc., The Planes, VA, USA). Analysis of variance (ANOVA) was used to assess the effect of the factors (source of P—fertilizer treatment and fertilizer application method) and the interaction between factors. The homogeneity of the variance (Levene’s test) and normality (Smirnof-Kolmogorov test) were verified in all variables, transforming the data if necessary (power transformation). Means were compared using the Bonferroni test at p < 0.05.

3. Results

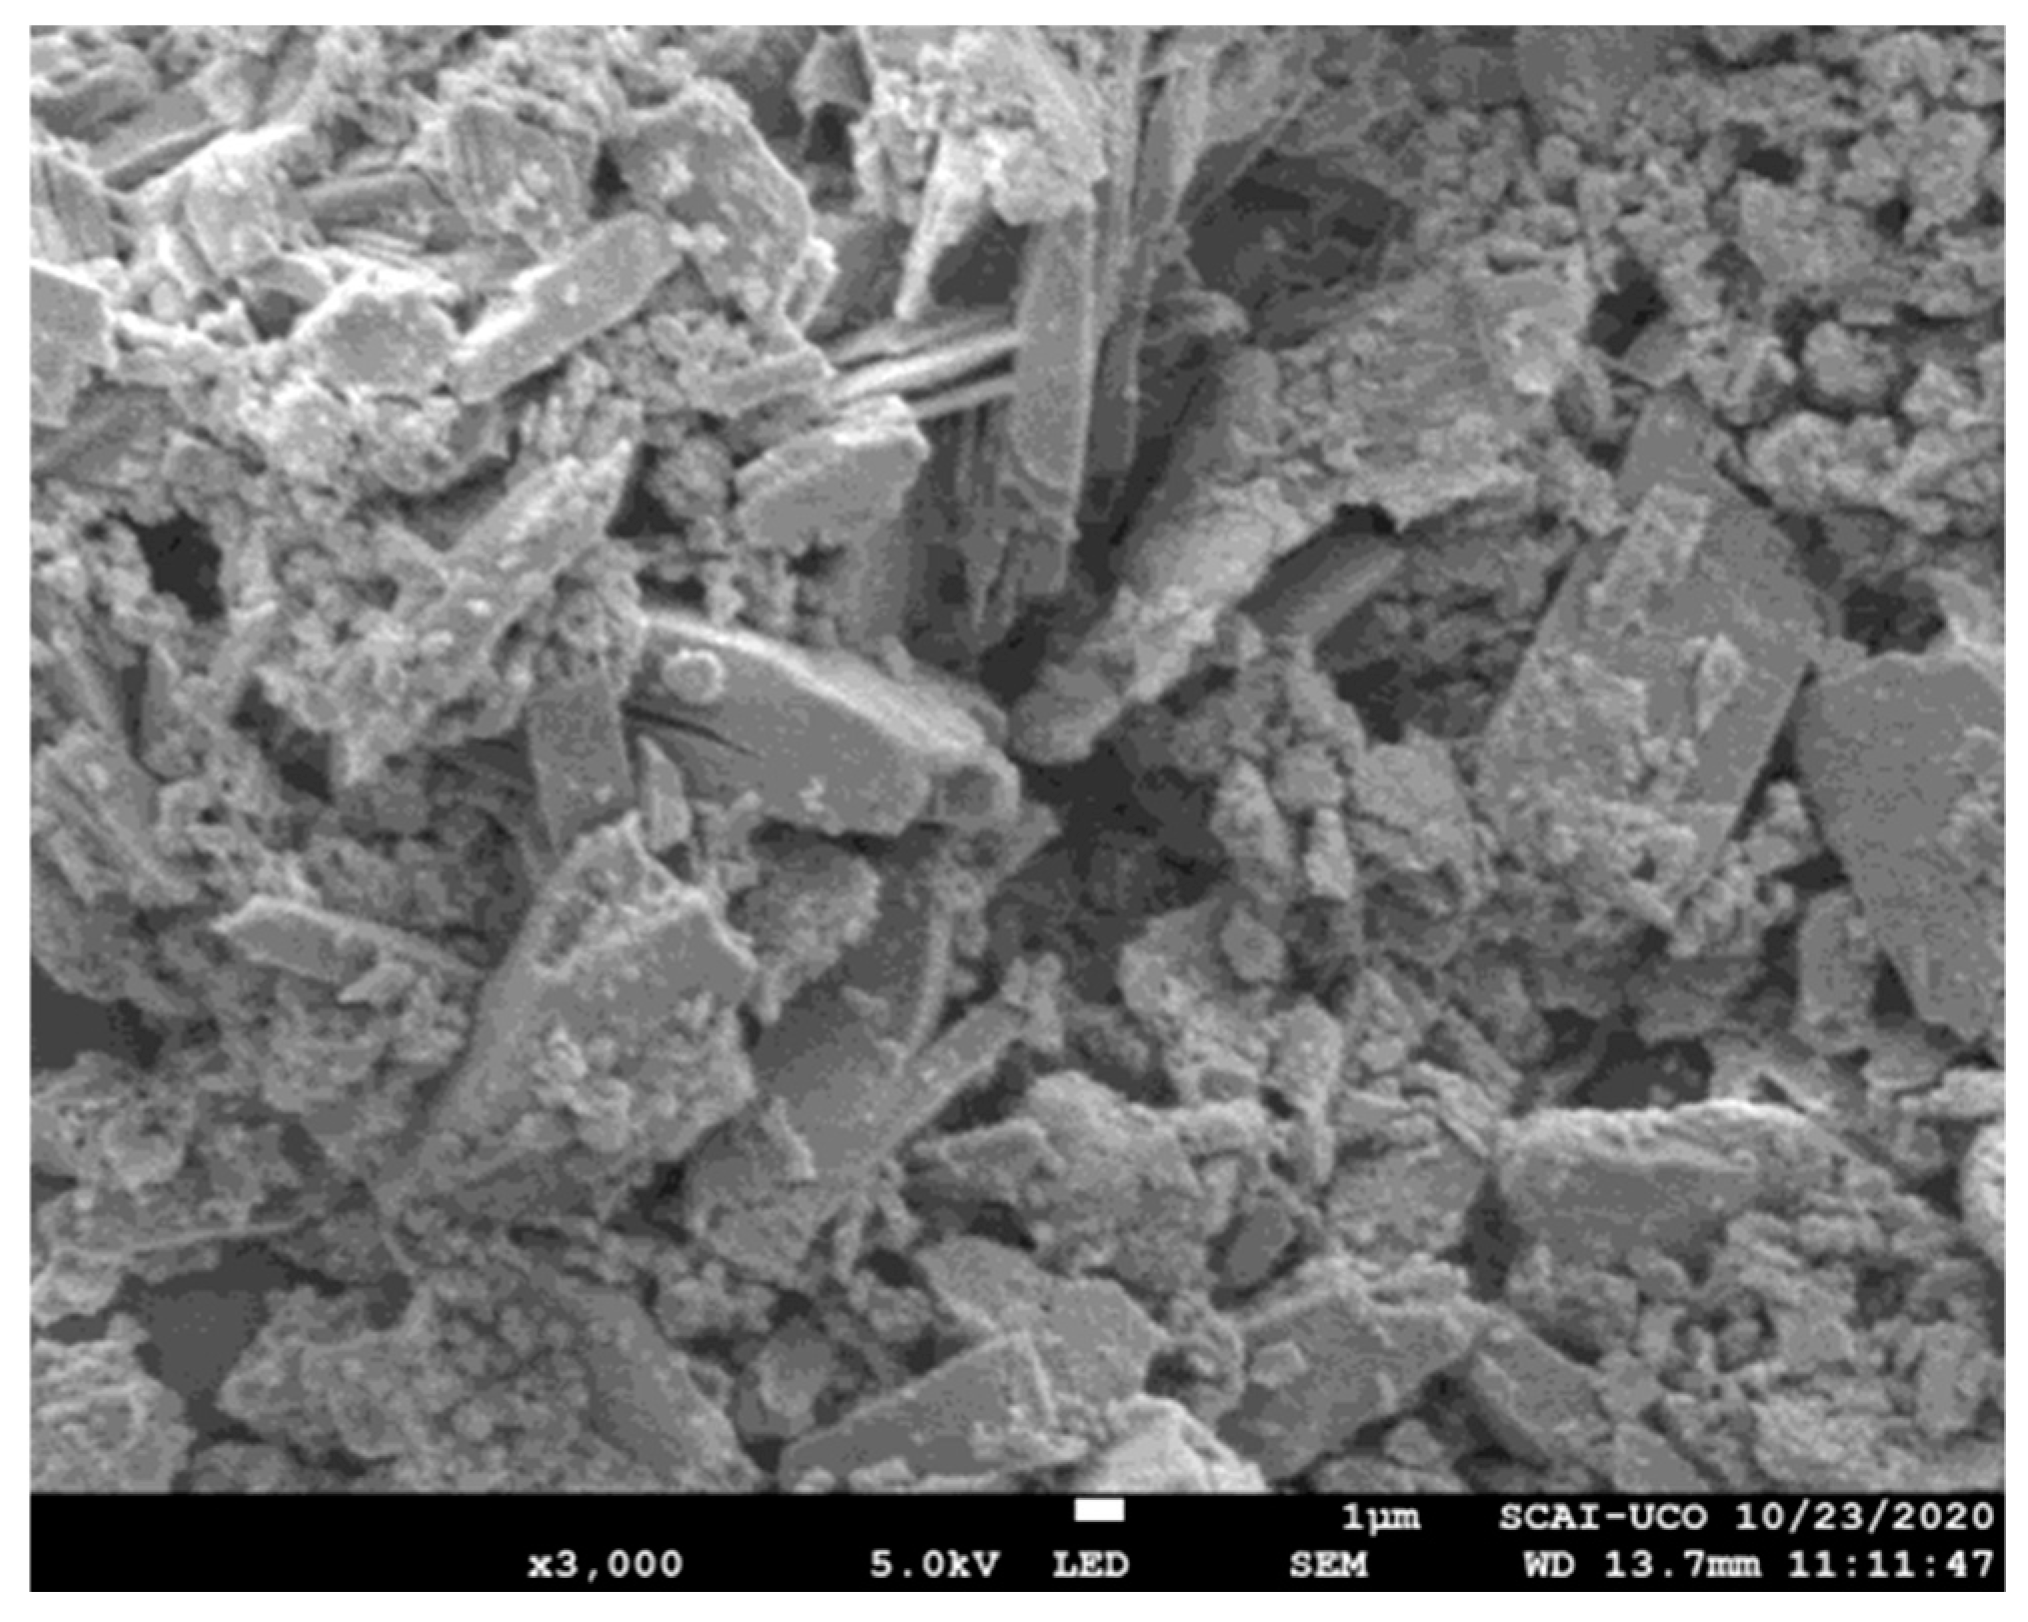
3.1. Fertilizer Properties

The properties of the recovered vivianite used as a fertilizer in this experiment are shown in Table 2. Vivianite had 108 g kg–1 of P and 280 g kg–1 of Fe; it also contained significant amounts of Ca and Mg. There was a variation between the Fe2+ to Fe3+ ratio obtained by Mössbauer spectroscopy (75 to 25%) and that of XPS (X-ray photoelectron spectroscopy) (41 to 59%). A high heterogeneity in crystallinity and uneven crystal sizes is observed in the vivianite, as shown in the electron microscope image (Figure 1).

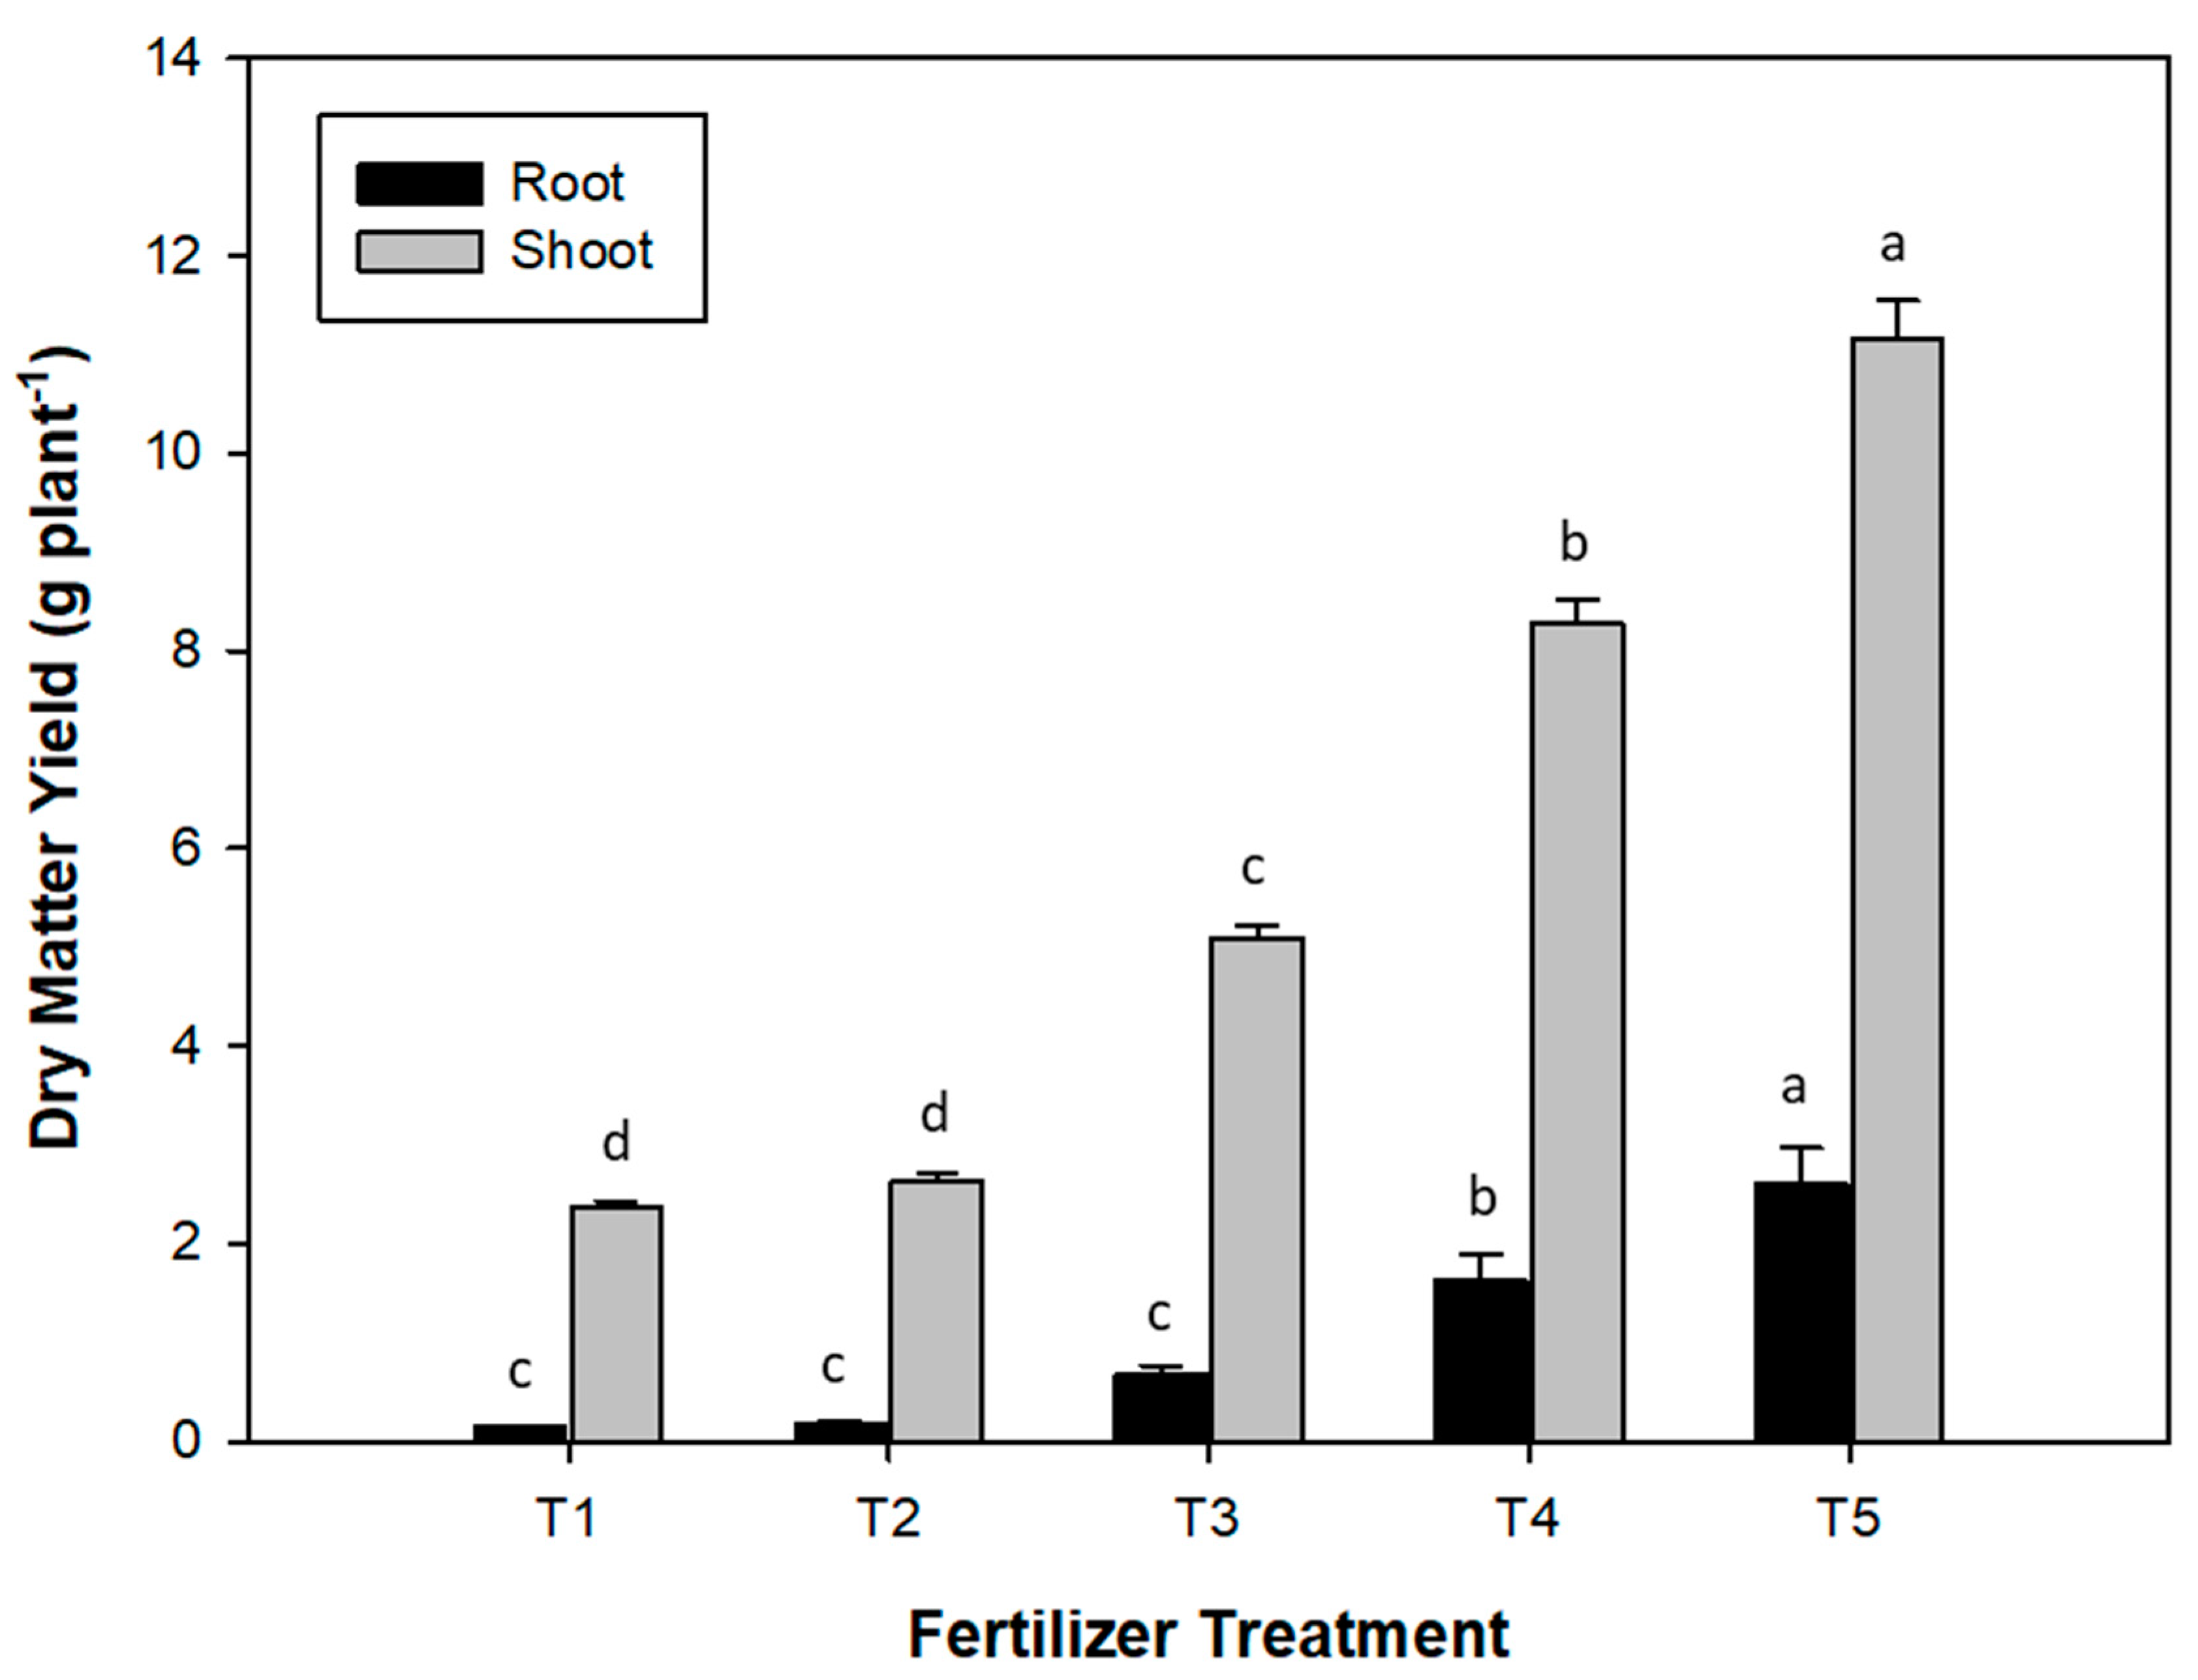
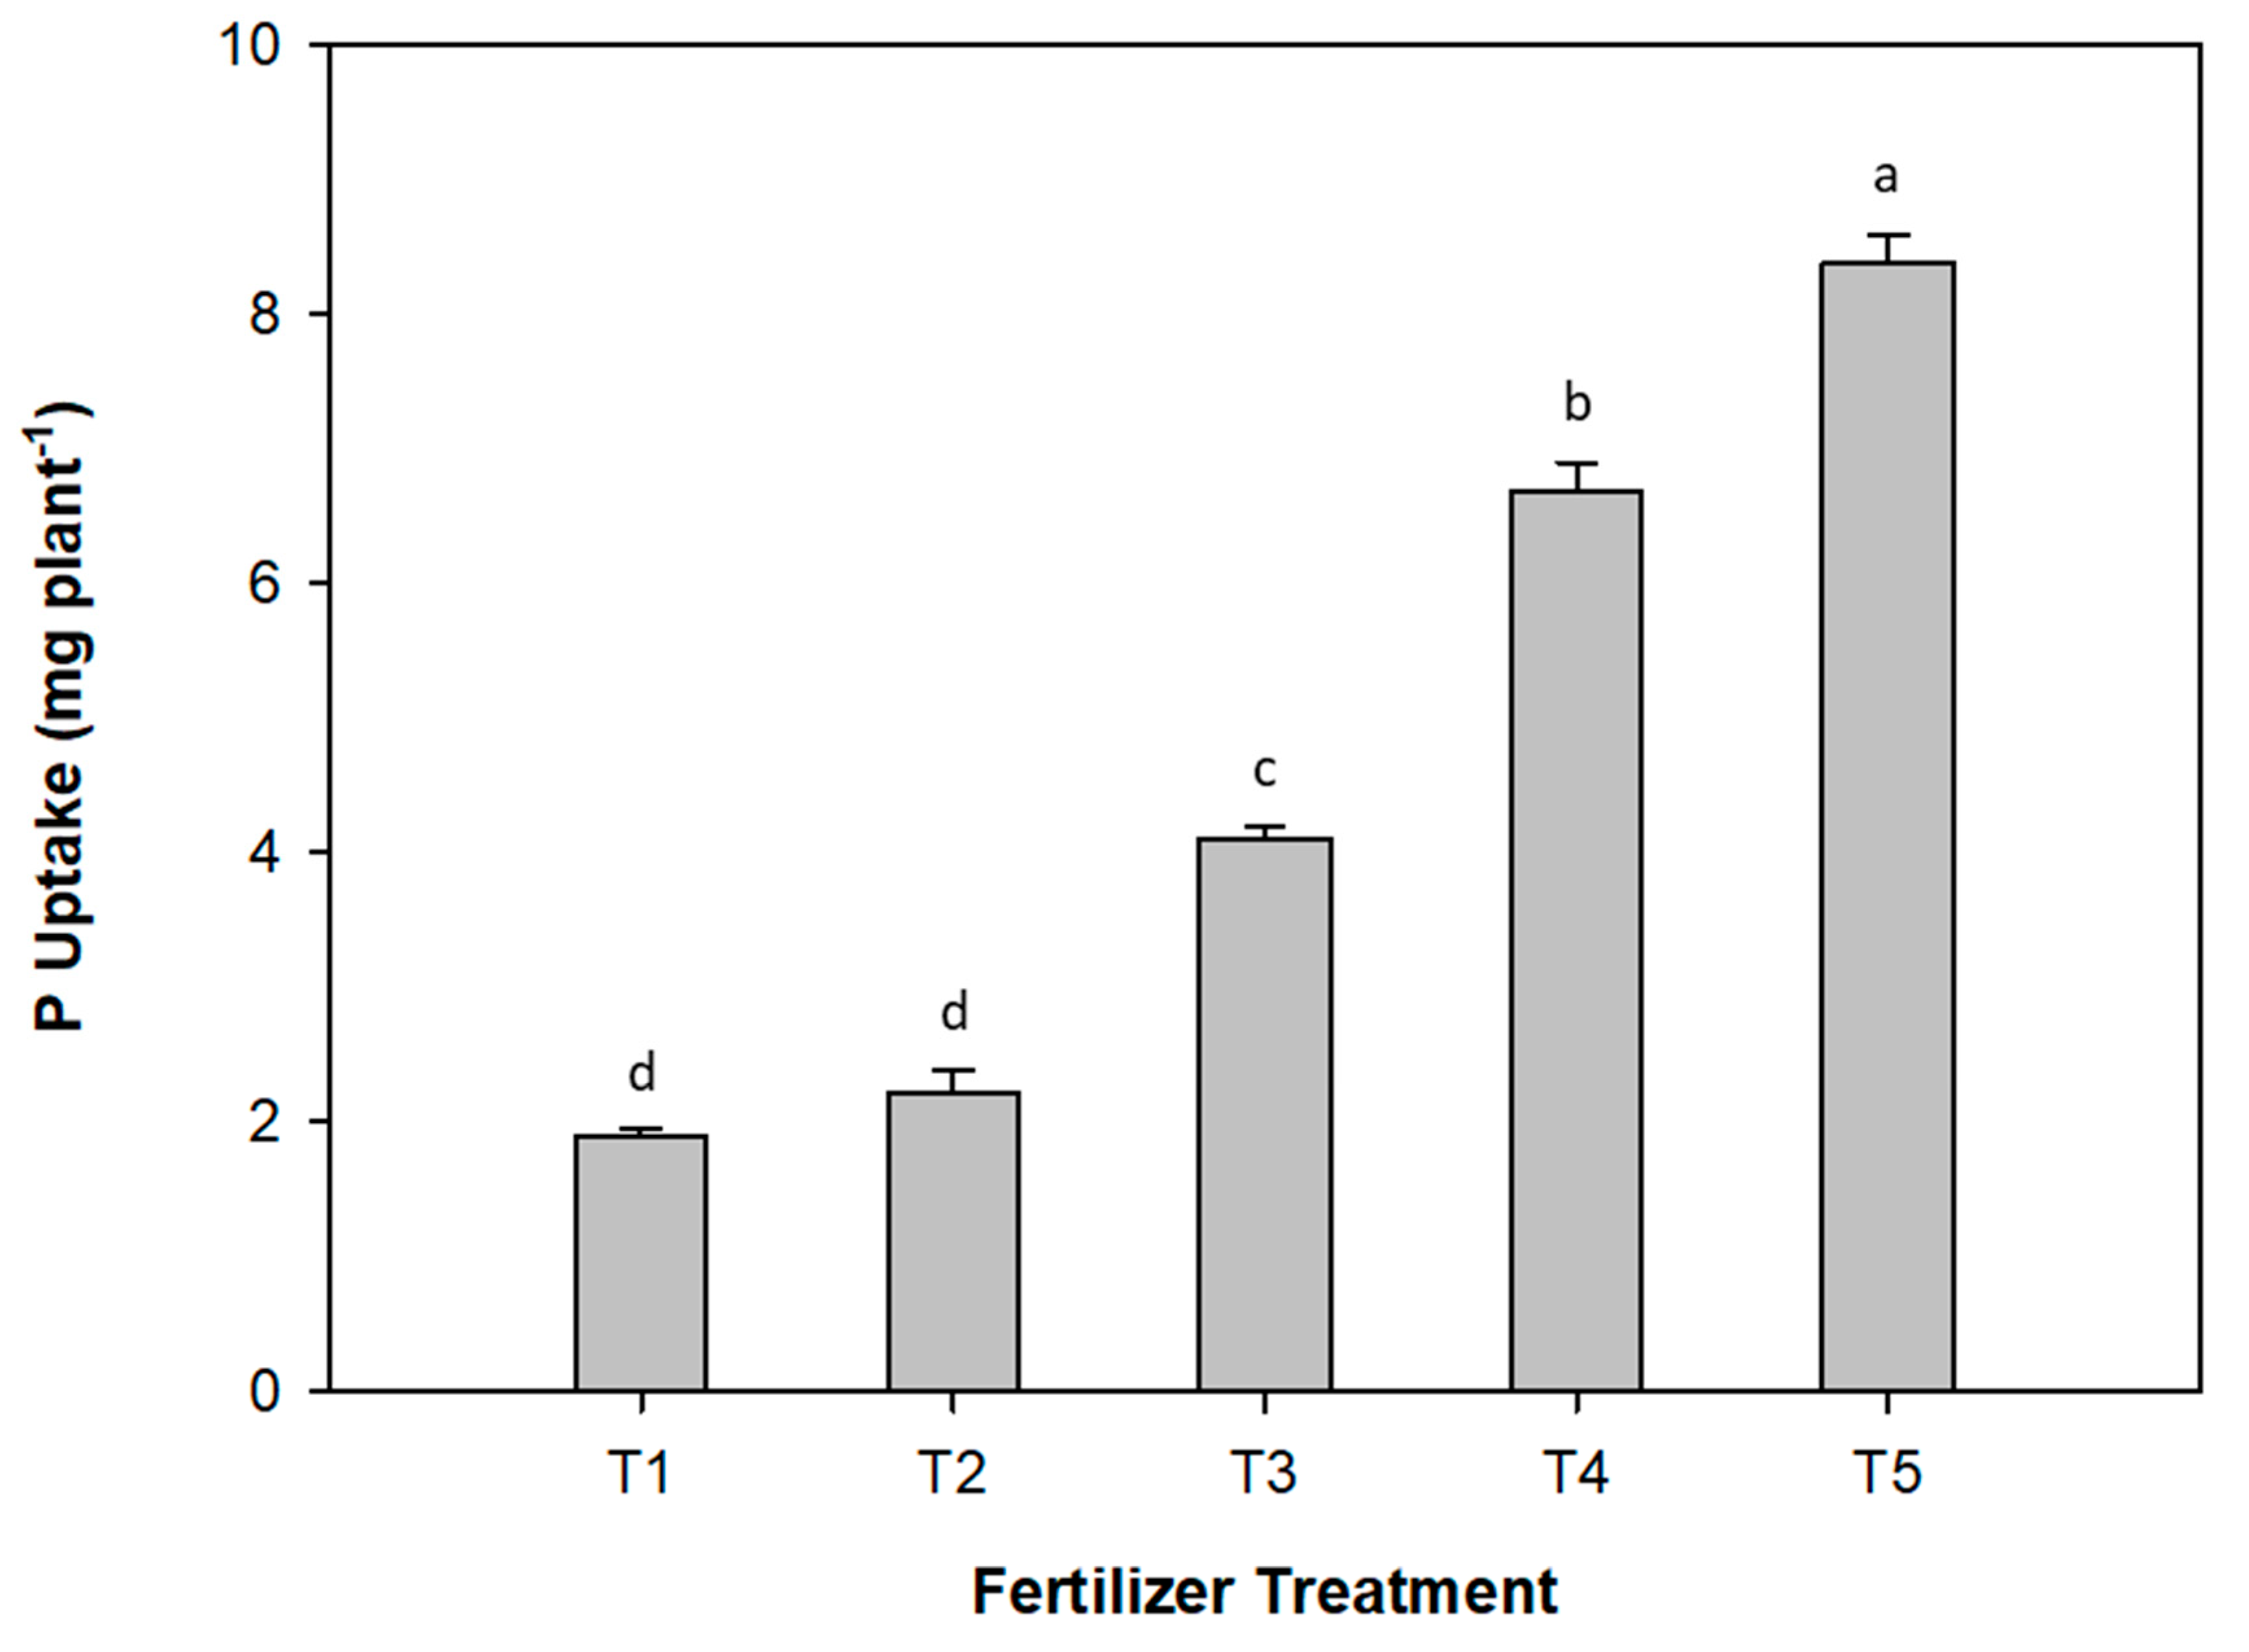
3.2. Effect of Fertilizer on Plant Development and Nutrition

The application methods did not have a significant effect on most of the parameters measured. There was also no interaction between the two factors considered in this experiment, i.e., fertilizer treatment and application methods, except for Fe uptake by crops. As a result, the effect of the fertilizer treatment as a main factor can be analyzed across both application methods. The dry matter yield obtained with the use of the tested fertilizer products is displayed in Figure 2. The two lowest shoot dry matter (DM) yields were observed in the control (T1) and 100% vivianite (T2) treatments; there were no significant differences between these two treatments. The highest shoot dry matter (DM) yield was observed in T5 (100% Superphosphate). T3 (70% Vivianite + 30% superphosphate) and T4 (30% Vivianite + 70% Superphosphate) promoted significantly higher shoot DM yields than T1 and T2. The root DM yield followed a similar trend as the shoot DM yield, with the lowest root DM yield in T1 and T2 and the highest in T5, i.e., with all the P applied as superphosphate. This treatment had the highest P uptake, while the lowest was observed in the non-fertilized control treatment (T1; Figure 3). Although P uptake in the T2 treatment was slightly higher than in T1, there was no significant difference between the two. P uptake in T3 and T4 was significantly higher than in T1 and T2. In terms of Fe uptake, T4 and T5 had the highest Fe update, with no significant differences between them (Table 3). The lowest Fe uptake was obtained with the non-fertilized control (T1 treatment), which was not significantly different from the T2 and T3 treatments. Iron uptake was the only variable where a significant interaction between both factors was observed (Table 3). This was ascribed to the increased Fe uptake with banding relative to mixing with soil in the T4 treatment (Figure S1). The Fe concentration was observed to be significantly higher in the roots than in the aerial parts in all treatments (Table S1). However, the highest Fe concentration in the root was observed in the T2 treatment (all P applied as vivianite).

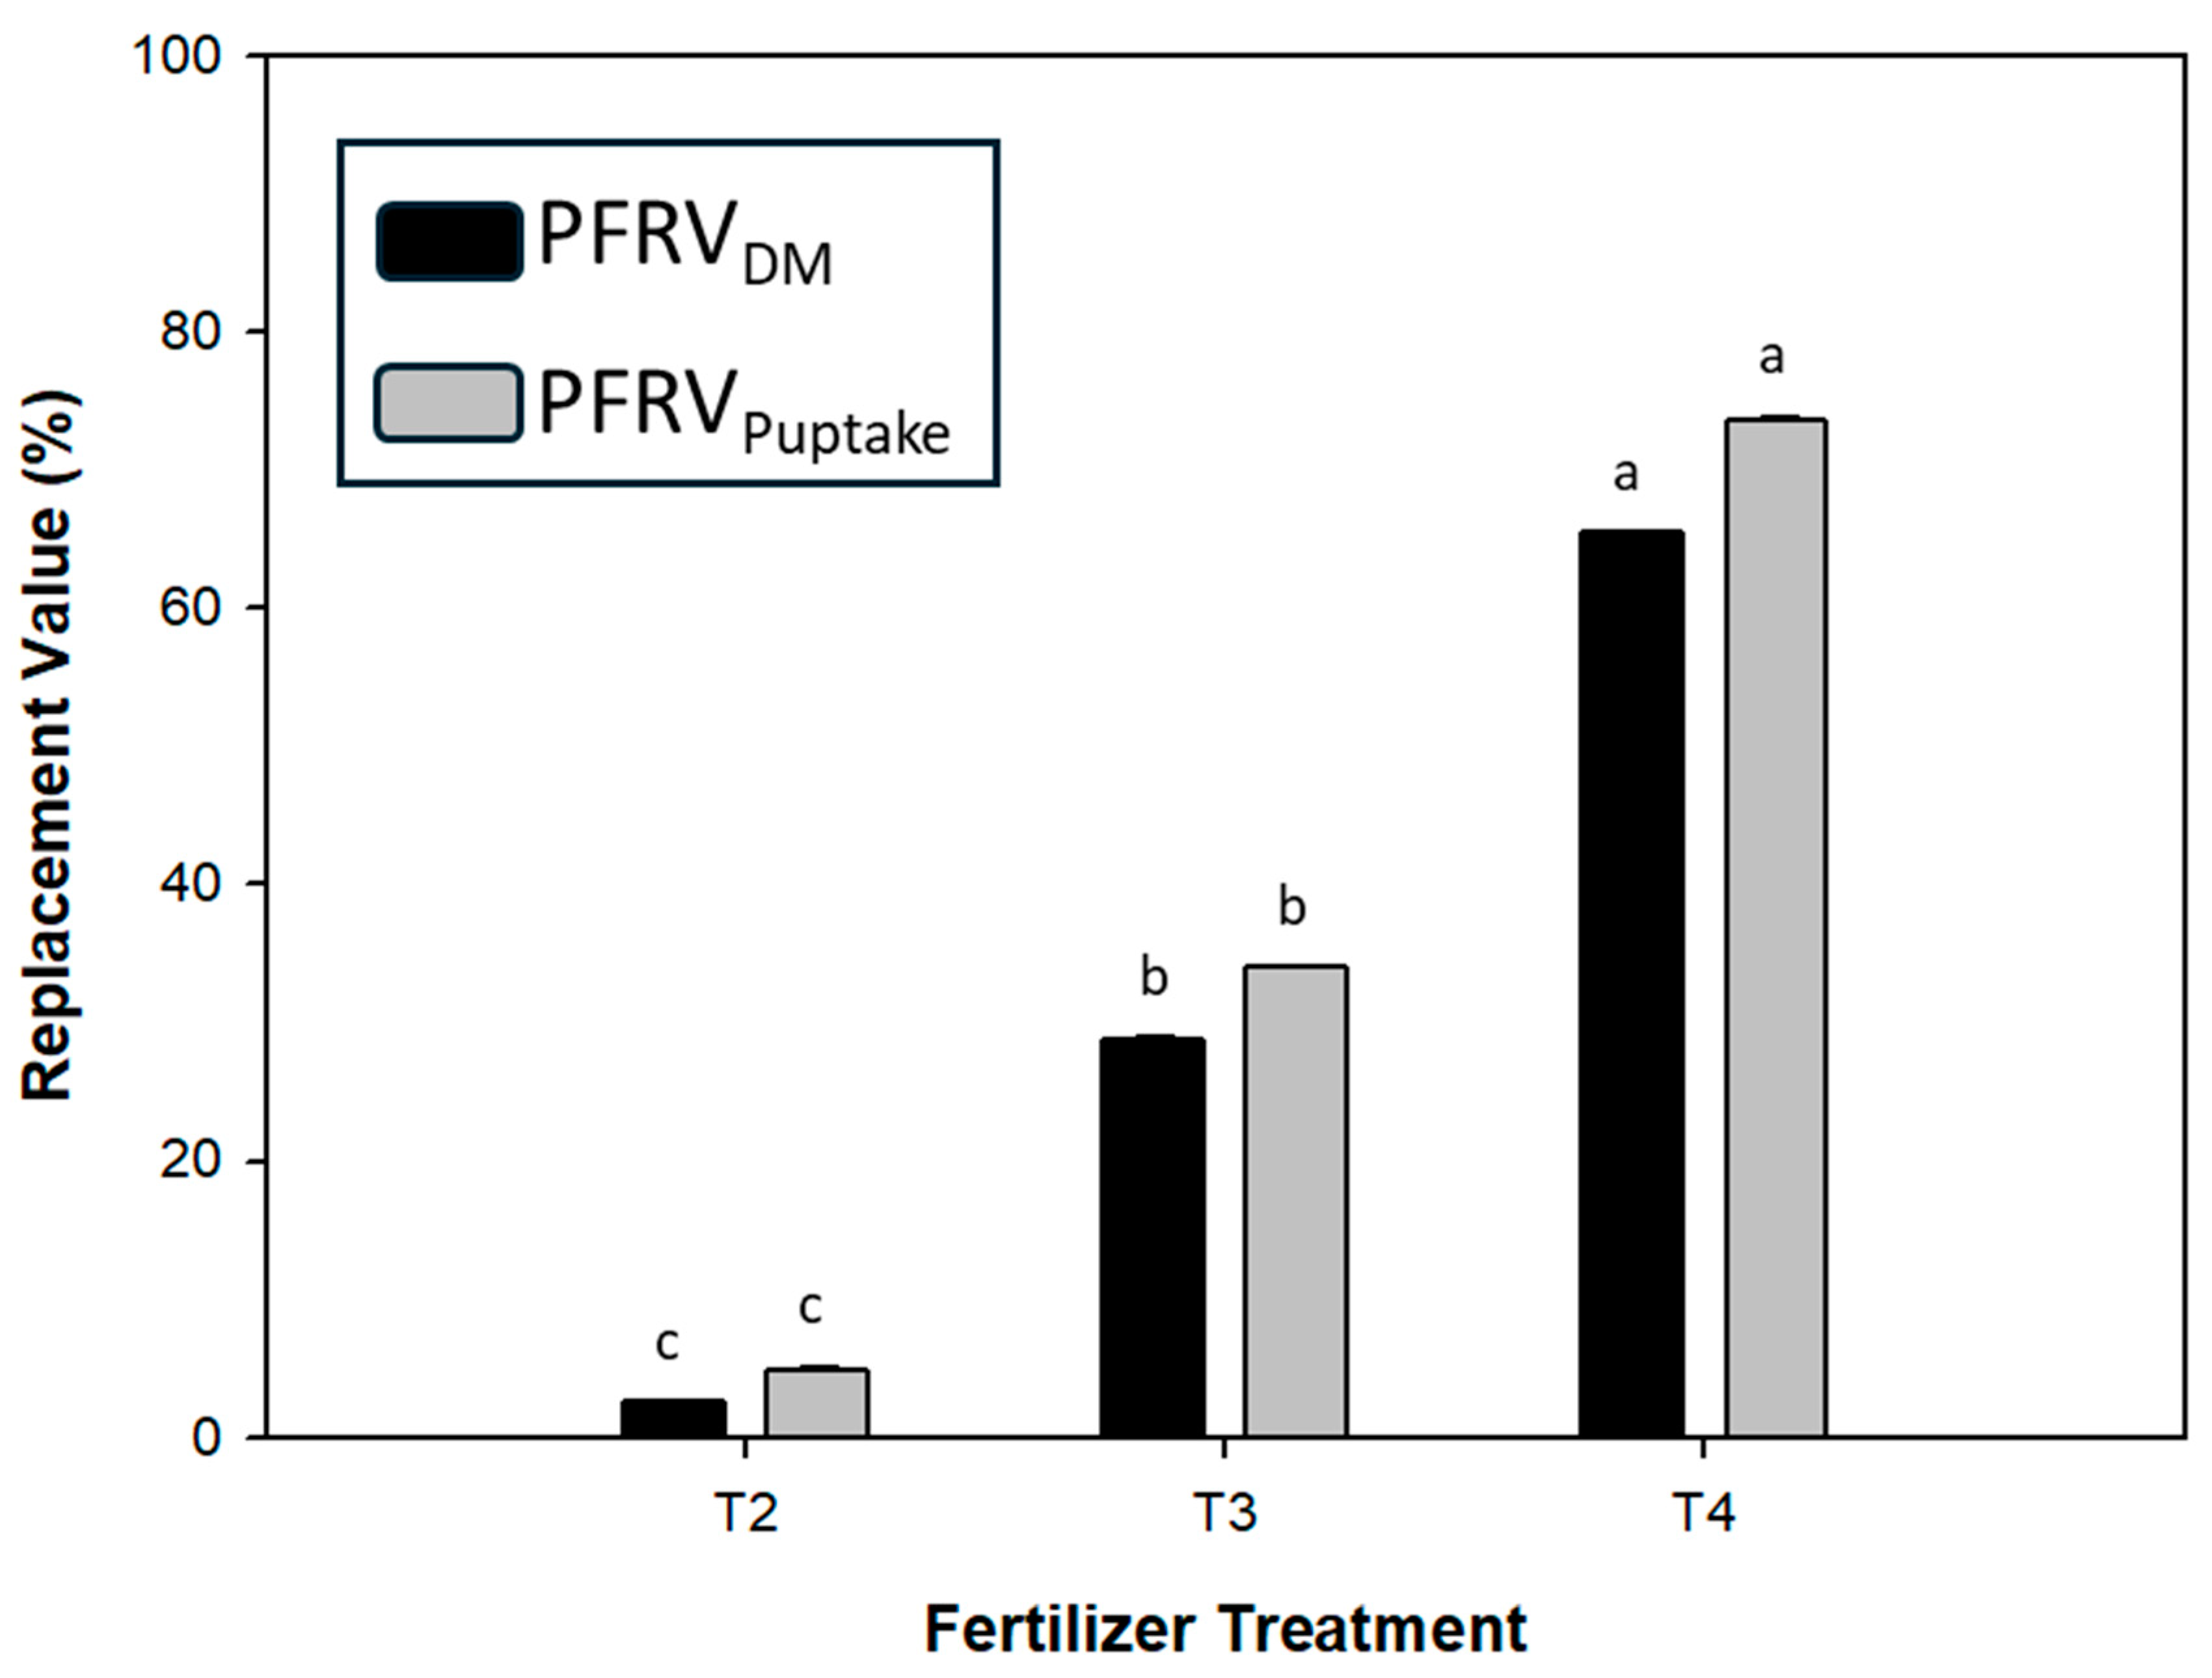
3.3. Phosphorus Fertilizer Replacement Value and Nutrient Use Efficiency

Treatments T3 and T4 had a significantly higher PFRVDM (29% and 65%, respectively) compared with T2 (100% vivianite), which had 2.6%. However, PFRVP Uptake followed a similar trend, with slightly higher values than PFRVDM. The PFRVP Uptake of T3 and T4 was 34% and 74%, respectively, while that of T2 was 4.9% (Figure 4). The nutrient use efficiency estimated by the parameters, agronomic efficiency (AE), apparent P recovery (APR), and Olsen P recovery (OPR) followed a similar trend (Table 4). The highest AE, APR, and OPR were observed in T5 (100% superphosphate), while the lowest was in T2. T3 and T4 showed significantly higher efficiency parameters than T2 (100% vivianite).

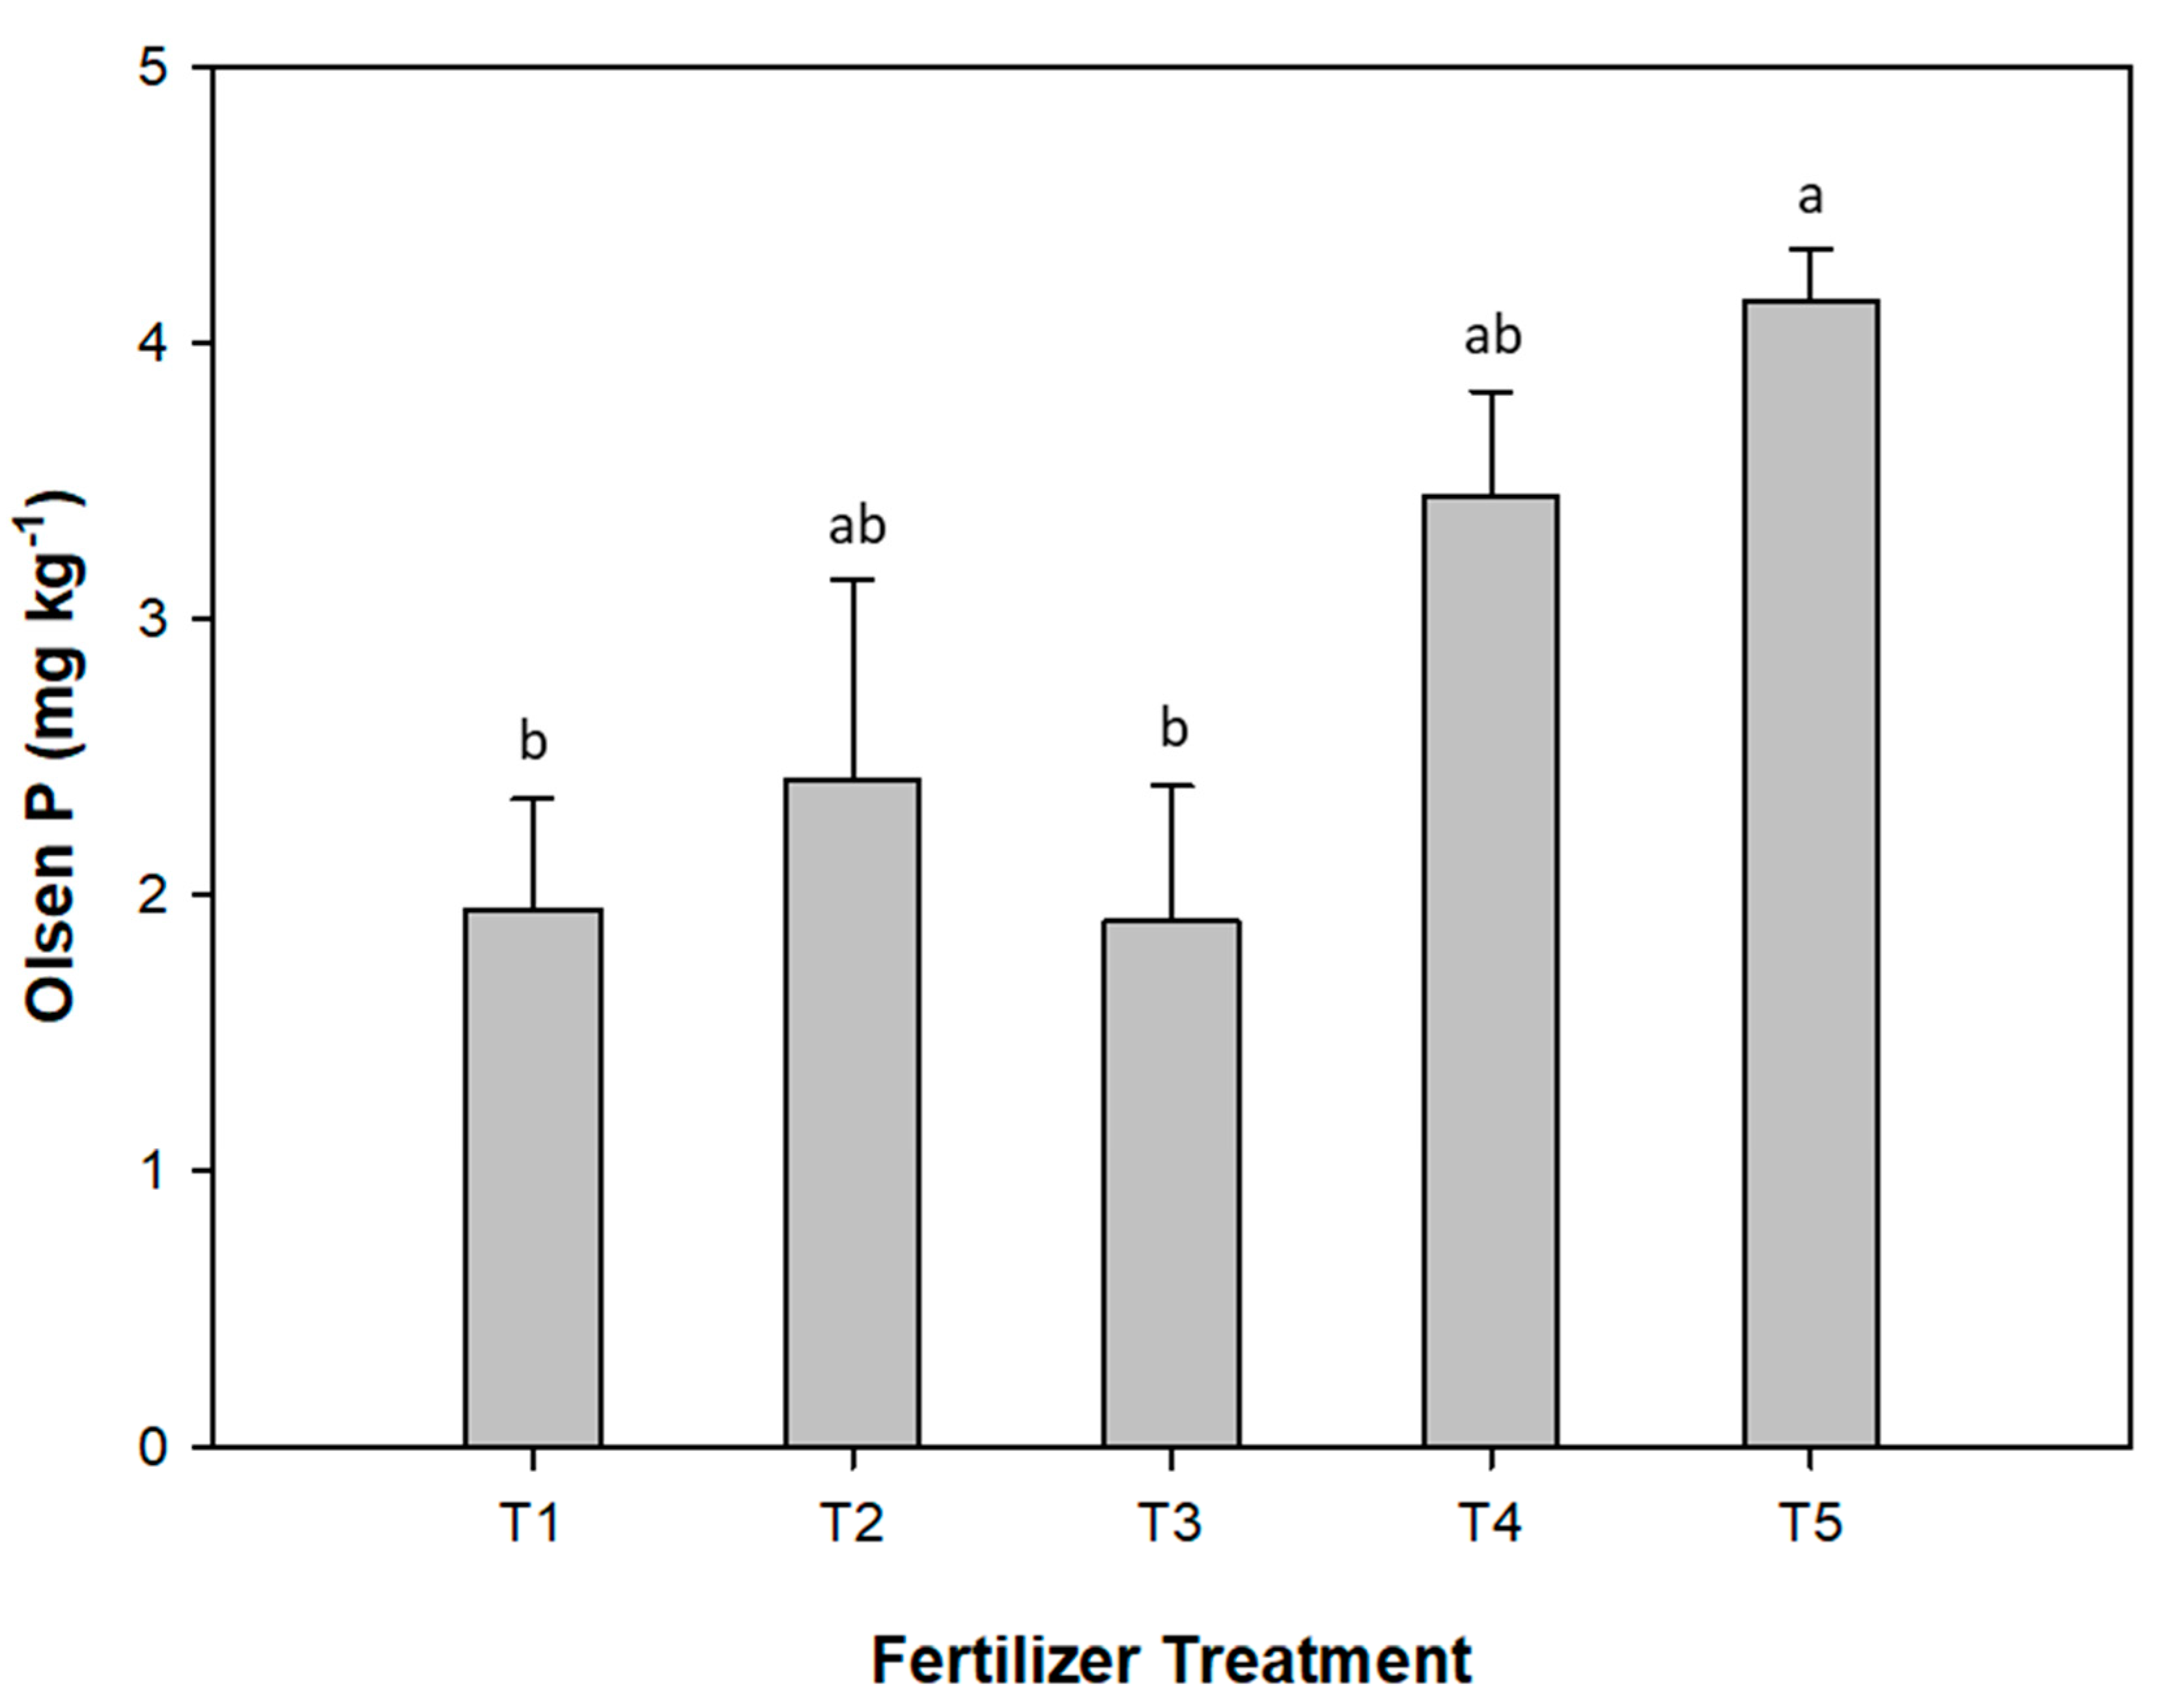
3.4. Effect of Fertilizers on Soil Phosphorus and Iron Availability Index

The P availability in soils measured by Olsen P was the highest in T5, followed by T4 (Figure 5). There were no significant differences in Olsen P values between T2, T4, and T5. Treatments T3 and T1 showed the lowest Olsen P values, with no significant differences between them. All five treatments had similar DTPA Fe values (Table 3). The DTPA extractable Fe in the soil was highest in the T2 treatment. However, this was not significantly different from T1. The lowest DTPA Fe was observed in T5.

4. Discussion

4.1. Efficiency of Vivianite as a Phosphorus and Iron Fertilizer

In the current study, the application of all the P as superphosphate (T5) produced a considerably higher dry matter yield in the root and shoot of sunflowers than when all P was applied as vivianite (T2). While the release of P from soluble P fertilizers like superphosphate is often very rapid [35], hence supplying P in an adequate quantity to the sunflower plants in the early stage of crop growth, the reverse is the case for vivianite, being a slow-release fertilizer [18]. The low plant development observed with P applied only as vivianite could be the consequence of a slow and limited P release from vivianite at the early stage of plant development, hence limiting the vegetative development of the sunflower plants. An inadequate supply of P, especially at the start of the vegetative cycle of sunflower crops, often results in lower growth, delayed flowering, less filling of the achenes, and reduced oil content [36]. According to Grant et al. [15], crop growth restrictions resulting from limited P supply in the early stage of crop growth may be difficult to recover from, even when P supply is increased to adequate levels in the later stage of crop growth. However, the two treatments where superphosphate and vivianite were mixed in different proportions (T3 and T4) resulted in considerably higher DM yields compared to vivianite application alone (T2). This could suggest that the early supply of P from superphosphate in these treatments was able to meet the P demand of sunflower plants at the start of plant growth, perhaps until the late solubilization and release of P from vivianite. A mix of slow and fast-release fertilizers for agricultural practices has been proposed by De-Bashan and Bashan [37] for significant economic and environmental advantages in new fertilizer development strategies.
When only vivianite (T2) was applied, the P uptake was considerably lower than the combined application of vivianite and superphosphate (T3 and T4). This finding is consistent with a study showing the use of struvite (a slow-release P fertilizer), which confirmed that the sole application of struvite does not lead to sufficient early crop uptake. However, this did not have a detrimental effect on the final yield [8]. According to Talboys et al. [8], even though fewer grain heads were observed at the early stage of wheat growth, the sustained release of P from struvite enhanced carbohydrate translocation into the ripening grains and, consequently, promoted higher grain weights. This was different for vivianite in this study, as the insufficient uptake of P at the beginning of crop growth led to reduced sunflower plant yield altogether. The quantity of the most common soil P sorbents, such as carbonates, in the soil used for this experiment was relatively low. This could have resulted in a limited adsorption of P, leading to an increased soil P availability in treatments fertilized with superphosphate. Hence, the negative behavior of highly soluble P fertilizers was not observed in this study, probably because the soil appeared not to be highly reactive to P.
Iron was not supplied in any other form in this experiment aside from the treatments with vivianite (T2, T3, and T4). Yet, no deficiency symptoms of Fe in the sunflower plants were observed throughout the experiment. The concentration of Fe in the root was higher than that in the shoot, which cuts across all treatments (Table S1). High concentrations of Fe in the root are often expected because of the high energy requirement of the translocation process of Fe to the leaves of the plants [38,39]. Sunflower is often referred to as a Fe-efficient plant and can survive even in conditions of limited Fe supply through the acidification of the rhizosphere and root-reducing capacity [40]. The increased Fe uptake in the two treatments with the highest superphosphate supply did not correspond to the values of DTPA extractable Fe in the soil. This reveals that P deficiency can lead to decreased Fe uptake since there is a significant constraint on plant development, which negatively affects the accumulation of other nutrients. Banding only effectively increased Fe uptake in the treatment with 30% of P applied as vivianite (T4). Thus, it seems that a mix with soluble P fertilizer, counteracting the conditions of P deficiency in soil, promotes that vivianite leads to an increased absorption of Fe when it is concentrated in soil, simulating a banding application. Overall, this localized application did not have benefits in this experiment, likely due to the restricted volume of soil in pots where there is a high concentration of roots, not allowing a differential effect of banded and broadcast applications. It might be interesting to study it under field conditions.

4.2. Mixture of Vivianite and Superphosphate as Phosphorus Fertilizers

The replacement value and nutrient use efficiency of the mixed fertilizer products (T3 and T4) were significantly higher than vivianite alone (T2). However, the replacement values of T3 and T4 on a dry matter and P uptake basis were in the same range as the proportion of superphosphate added to the fertilizer mix. This suggests that P for the sunflower plant growth was supplied only by superphosphate in the fertilizer mix without a significant contribution from vivianite. According to a previous study by Talboys et al. [8], the release of P from slow-release fertilizers when mixed with soluble P fertilizers could be determined by the ratio of the combination. This explains why the higher the percentage of soluble P fertilizer is in the fertilizer mix, the lower the ability of slow-release fertilizers is to dissolve and release P. When the percentage of soluble P fertilizer is low, slow-release fertilizers may dissolve and release P gradually without providing enough P for early plant growth. This appears to be consistent with the current study on recovered vivianite. This is because plants can easily access the P released by superphosphate at the start of plant growth; hence, P release from vivianite will only be promoted when P from superphosphate becomes limited due to plant uptake or by P reactions in soil. However, for crops with short growing cycles, coupled with the fact that P release from vivianite happens slowly, P release from vivianite might not necessarily meet up with supplying P in the first growing cycle but instead have a residual effect on succeeding crops in the next growing cycle. A 50:50 ratio of recycled Fe phosphate and Russian Kola Apatite as a source of P fertilizers for Scots pine led to the highest growth of Scots pine trees [41] as compared to 100% of either type of fertilizer. However, this increased growth was only visible after almost ten years of the tree establishment. The dynamics of plant nutrition in tree crops differ significantly from those of short-growing crops, but perhaps the results from this study provide additional insight into the slow release of P from vivianite, an example of a recycled Fe phosphate fertilizer. An additional factor that could explain the limited contribution to P supply to crops of vivianite from its mix with superphosphate is that there is no triggering of P mobilizing mechanisms by roots, such as the low-molecular-weight acid exudation. These compounds contribute to vivianite dissolution in the rhizosphere [26], and their exudation is a response to P-deficient conditions [42]. Thus, a decreased exudation of these acids promoted by the application of soluble P sources can contribute to a decreased P supply to crops from vivianite. However, the sole application of vivianite was not very successful in supplying P to sunflower crops, and in fact, the results were worse than in our previous study [14]. In this case, a significantly reduced root development (Figure 2) can contribute to the little mobilization of P from vivianite. This negative effect could be more evident in sunflowers than in wheat.
In general, the mixed fertilizers (T3 and T4) had higher agronomic efficiencies when compared with only vivianite (T2). However, it seems that the higher the amount of superphosphate is in the mix, the higher the agronomic efficiency is. This was also similar for apparent P recovery and Olsen P recovery. It is generally believed that P recovery in the year of P fertilizer application is often about 10–15% and rarely exceeds 25%, giving the impression that applied P is used inefficiently [43,44]. However, previous studies have shown that residual P can be available to crops in the subsequent growing seasons and is not permanently tied up or fixed in soils [45]. The potential of a slow-release fertilizer like vivianite may be difficult to access in a single short growing cycle; perhaps its residual fertilizer effect may be better than its initial effect.

4.3. The Effect of Fertilizer Products on Soil Phosphorus and Iron Availability Index

Only T5 significantly increased Olsen P in soils relative to control after crop harvest. Other fertilizer treatments did not promote significantly different Olsen P values from those with soluble fertilizer. However, these values were not significantly different from the control. This reveals that in soil with a low Olsen p value (3.5 mg kg–1), only soluble P fertilizer effectively increased the available P status of the soil. Although the highest DTPA extractable Fe was recorded in the treatment with the highest rate of vivianite, as expected, the result does not sound very convincing as it was not significantly different from that in the non-fertilized control. This disagrees with results from several previous studies on the effect of vivianite as a Fe fertilizer with a residual effect for years [46,47,48]. Most of these previous studies have been carried out with fruit crops on the field and for longer growing periods. Perhaps the release of Fe from vivianite in soils is favored by longer growing periods as opposed to the short duration of growing sunflowers in pots under controlled conditions in the current study. As mentioned above, the supply of soluble P may prevent the triggering of P mobilization mechanisms by roots that promote vivianite dissolution. Therefore, the joint supply of soluble P fertilizer and vivianite can constrain the dissolution of this latter compound, thus decreasing its effect on the Fe availability index in soil. In addition, DTPA Fe extraction has been stated not to be an accurate measure of the Fe availability index in soils [49].

5. Conclusions

Increased P use efficiency could be achieved with mixtures of vivianite and superphosphate (T3 and T4). The contribution of vivianite in these short-term experiments when mixed with soluble P fertilizer seems negligible. This can likely be ascribed to an inhibition of the rhizospheric mechanism involved in P mobilization when soluble fertilizer is applied. The application method did not have a significant effect on the efficiency of vivianite as a P fertilizer. Short growing cycles, as in this experiment, do not allow us to see the benefits of slow-release fertilizers, such as vivianite. Further research is recommended to assess the residual effect of vivianite in subsequent growing cycles.

Supplementary Materials

The following supporting information can be downloaded at: www.mdpi.com/article/10.3390/agronomy14112639/s1, Table S1: Iron concentration in aerial parts and roots of sunflower plants; Figure S1: Effect of fertilizer treatments on total Fe uptake of sunflower plants.

Author Contributions

Conceptualization, T.A., R.R. and A.D.; data curation, T.A.; formal analysis, T.A, J.M.Q. and A.D; investigation, T.A., R.R., J.M.Q., A.M.G.-L. and A.D.; methodology, T.A., R.R. and A.M.G.-L.; supervision, A.D. and M.C.d.C.; writing—original draft, T.A., M.C.d.C. and A.D.; writing—review and editing, T.A., M.C.d.C. and A.D. All authors have read and agreed to the published version of the manuscript.

Funding

This research was funded by the European Union’s Horizon 2020 Research and Innovation Programme under the Marie Sklodowska-Curie grant agreement No 813438 and is a part of the P-TRAP (Diffuse phosphorus input to surface waters—new concepts in removal, recycling, and management) Project.

Data Availability Statement

The data that support the findings of this study are available from the corresponding author upon reasonable request.

Acknowledgments

The authors would like to appreciate Wetsus (a non-academic partner—NAPO) of the P-TRAP project for providing the vivianite from water purification used in this study. Our sincere gratitude also goes to Vidal Barrón for assisting with the characterization of the fertilizer product used in the study.

Conflicts of Interest

The authors declare no conflicts of interest.

References

  1. Cordell, D.; Drangert, J.O.; White, S. The story of phosphorus: Global food security and food for thought. Glob. Environ. Change 2009, 19, 292–305. [Google Scholar] [CrossRef]
  2. International Fertilizer Development Centre. World Phosphate Rock Reserves and Resources; International Fertilizer Development Centre: Muscle Shoals, AL, USA, 2010. [Google Scholar]
  3. Available online: https://www.earthmagazine.org/article/mineral-resource-month-phosphate-rock/ (accessed on 24 May 2024).
  4. Vaccari, D.A. Phosphorus: A looming crisis. Sci. Am. 2009, 300, 54–59. [Google Scholar] [CrossRef]
  5. Blackwell, M.; Darch, T.; Haslam, R. Phosphorus use efficiency and fertilizers: Future opportunities for improvements. Front. Agric. Sci. Eng. 2019, 6, 332–340. [Google Scholar] [CrossRef]
  6. Schröder, J.J.; Smit, A.L.; Cordell, D.; Rosemarin, A. Improved phosphorus use efficiency in agriculture: A key requirement for its sustainable use. Chemosphere 2011, 84, 822–831. [Google Scholar] [CrossRef]
  7. Sharmin Hoque, T.; Sarkar, D.; Datta, R.; Golam Kibria, M.; Ullah, R.; Ahmed, N.; Anwar Hossain, M.; Masood, A.; Anjum, N.A. Sustainable Management of Phosphorus in Agriculture for Environmental Conservation. In Phosphorus in Soils and Plants; IntechOpen: London, UK, 2023. [Google Scholar] [CrossRef]
  8. Talboys, P.J.; Heppell, J.; Roose, T.; Healey, J.R.; Jones, D.L.; Withers, P.J.A. Struvite: A slow-release fertiliser for sustainable phosphorus management? Plant Soil 2016, 401, 109–123. [Google Scholar] [CrossRef] [PubMed]
  9. Bindraban, P.S.; Dimkpa, C.O.; Pandey, R. Exploring phosphorus fertilizers and fertilization strategies for improved human and environmental health. Biol. Fertil. Soils 2020, 56, 299–317. [Google Scholar] [CrossRef]
  10. Delgado, A.; Scalenghe, R. Aspects of phosphorus transfer from soils in Europe. J. Plant Nutr. Soil Sci. 2008, 171, 552–575. [Google Scholar] [CrossRef]
  11. Sharpley, A.N.; Mcdowell, R.W.; Kleinman, P.J.A. Phosphorus loss from land to water: Integrating agricultural and environmental management. Plant Soil 2001, 237, 287–307. [Google Scholar] [CrossRef]
  12. Conijn, J.G.; Bindraban, P.S.; Schröder, J.J.; Jongschaap, R.E.E. Can our global food system meet food demand within planetary boundaries? Agric. Ecosyst. Environ. 2018, 251, 244–256. [Google Scholar] [CrossRef]
  13. Veneklaas, E.J.; Lambers, H.; Bragg, J.; Finnegan, P.M.; Lovelock, C.E.; Plaxton, W.C.; Price, C.A.; Scheible, W.R.; Shane, M.W.; White, P.J.; et al. Opportunities for improving phosphorus-use efficiency in crop plants. New Phytol. 2012, 195, 306–320. [Google Scholar] [CrossRef]
  14. Ayeyemi, T.; Recena, R.; García-López, A.M.; Delgado, A. Circular Economy Approach to Enhance Soil Fertility Based on Recovering Phosphorus from Wastewater. Agronomy 2023, 13, 1513. [Google Scholar] [CrossRef]
  15. Grant, C.A.; Flaten, D.N.; Tomasiewicz, D.J.; Sheppard, S.C. The importance of early season phosphorus nutrition. Can. J. Plant Sci. 2001, 81, 211–224. [Google Scholar] [CrossRef]
  16. Desmidt, E.; Ghyselbrecht, K.; Zhang, Y.; Pinoy, L.; Van Der Bruggen, B.; Verstraete, W.; Rabaey, K.; Meesschaert, B. Global phosphorus scarcity and full-scale P-recovery techniques: A review. Crit. Rev. Environ. Sci. Technol. 2015, 45, 336–384. [Google Scholar] [CrossRef]
  17. Recena, R.; García-López, A.M.; Quintero, J.M.; Skyttä, A.; Ylivainio, K.; Santner, J.; Buenemann, E.; Delgado, A. Assessing the phosphorus demand in European agricultural soils based on the Olsen method. J. Clean. Prod. 2022, 379, 134749. [Google Scholar] [CrossRef]
  18. Wilfert, P.; Dugulan, A.I.; Goubitz, K.; Korving, L.; Witkamp, G.J.; Van Loosdrecht, M.C.M. Vivianite as the main phosphate mineral in digested sewage sludge and its role for phosphate recovery. Water Res. 2018, 144, 312–321. [Google Scholar] [CrossRef]
  19. Eshun, L.E.; García-López, A.M.; Recena, R.; Coker, V.; Shaw, S.; Lloyd, J.; Delgado, A. Assessing microbially mediated vivianite as a novel phosphorus and iron fertilizer. Chem. Biol. Technol. Agric. 2024, 11, 47. [Google Scholar] [CrossRef]
  20. Rosenqvist, I.T. Formation of vivianite in holocene clay sediments. Lithos 1970, 3, 327–334. [Google Scholar] [CrossRef]
  21. Al-Borno, A.; Tomson, M.B. The temperature dependence of the solubility product constant of vivianite. Geochim. Cosmochim. Acta 1994, 58, 5373–5378. [Google Scholar] [CrossRef]
  22. Johnston, A.M.; Bruulsema, T.W. 4R Nutrient Stewardship for Improved Nutrient Use Efficiency. Procedia Eng. 2014, 83, 365–370. [Google Scholar] [CrossRef]
  23. Jing, J.; Rui, Y.; Zhang, F.; Rengel, Z.; Shen, J. Localized application of phosphorus and ammonium improves growth of maize seedlings by stimulating root proliferation and rhizosphere acidification. Field Crops Res. 2010, 119, 355–364. [Google Scholar] [CrossRef]
  24. Van Noordwijk, M.; De Willigen, P. Calculation of the root density required for growth in soils of different p-status. In The Soil–Root Interface; Academic Press: Cambridge, MA, USA, 1979; pp. 381–390. [Google Scholar] [CrossRef]
  25. Delgado, A.; Quemada, M.; Villalobos, F.J.; Mateos, L. Fertilization with Phosphorus, Potassium, and Other Nutrients. In Principles of Agronomy for Sustainable Agriculture; Springer International Publishing: Cham, Switzerland, 2016; pp. 381–405. [Google Scholar] [CrossRef]
  26. Yang, S.; Yang, X.; Zhang, C.; Deng, S.; Zhang, X.; Zhang, Y.; Cheng, X. Significantly enhanced P release from vivianite as a fertilizer in rhizospheric soil: Effects of citrate. Environ. Res. 2022, 212, 113567. [Google Scholar] [CrossRef] [PubMed]
  27. Degryse, F.; Baird, R.; da Silva, R.C.; McLaughlin, M.J. Dissolution rate and agronomic effectiveness of struvite fertilizers—Effect of soil pH, granulation and base excess. Plant Soil 2017, 410, 139–152. [Google Scholar] [CrossRef]
  28. Soil Survey Staff. Keys to Soil Taxonomy, 11th ed.; USDA-NRCS: Washington, DC, USA, 2010.
  29. Murphy, J.A.; Riley, J.P. A modified single solution method for the determination of phosphate in natural waters. Anal. Chim. Acta 1962, 27, 31–36. [Google Scholar] [CrossRef]
  30. Olsen, S.R.; Cole, C.V.; Watanabe, F.S.; Dean, L.A. Estimation of Available Phosphorus in Soils by Extraction with Sodium Bicarbonate; U.S. Department of Agriculture Circular: Washington, DC, USA, 1954; No. 939.
  31. Lindsay, W.L.; Norvell, W.A. Development of a DTPA Soil Test for Zinc, Iron, Manganese, and Copper. Soil Sci. Soc. Am. J. 1978, 42, 421–428. [Google Scholar] [CrossRef]
  32. Hijbeek, R.; ten Berge HF, M.; Whitmore, A.P.; Barkusky, D.; Schröder, J.J.; van Ittersum, M.K. Nitrogen fertiliser replacement values for organic amendments appear to increase with N application rates. Nutr. Cycl. Agroecosystems 2018, 110, 105–115. [Google Scholar] [CrossRef]
  33. Craswell, E. The efficiency of nitrogen fertilizers applied to cereals in different climates. Adv. Plant Nutr. 1984, 1, 1–55. Available online: https://www.researchgate.net/publication/284635091 (accessed on 28 May 2024).
  34. Mengel, K.; Hütsch, B.; Kane, Y. Nitrogen fertilizer application rates on cereal crops according to available mineral and organic soil nitrogen. Eur. J. Agron. 2006, 24, 343–348. [Google Scholar] [CrossRef]
  35. Weeks, J.J.; Hettiarachchi, G.M. A Review of the Latest in Phosphorus Fertilizer Technology: Possibilities and Pragmatism. J. Environ. Qual. 2019, 48, 1300–1313. [Google Scholar] [CrossRef]
  36. de Oliveira, A.K.S.; Soares, E.B.; Dos Santos, M.G.; Lins, H.A.; de Freitas Souza, M.; dos Santos Coêlho, E.; Silveira, L.M.; Mendonça, V.; Barros Júnior, A.P.; de Araújo Rangel Lopes, W. Efficiency of Phosphorus Use in Sunflower. Agronomy 2022, 12, 1558. [Google Scholar] [CrossRef]
  37. De-Bashan, L.E.; Bashan, Y. Recent advances in removing phosphorus from wastewater and its future use as fertilizer (1997–2003). Water Res. 2004, 38, 4222–4246. [Google Scholar] [CrossRef] [PubMed]
  38. Morrissey, J.; Guerinot, M.L. Iron uptake and transport in plants: The good, the bad, and the ionome. Chem. Rev. 2009, 109, 4553–4567. [Google Scholar] [CrossRef] [PubMed]
  39. Krohling, C.A.; Eutrópio, F.J.; Bertolazi, A.A.; Dobbss, L.B.; Campostrini, E.; Dias, T.; Ramos, A.C. Ecophysiology of iron homeostasis in plants. Soil Sci. Plant Nutr. 2016, 62, 39–47. [Google Scholar] [CrossRef]
  40. Alcantara, E.; De La Guardia, M.D. Variability of sunflower inbred lines to iron deficiency stress. Plant Soil 1991, 130, 93–96. [Google Scholar] [CrossRef]
  41. Nieminen, M.; Laurén, A.; Hökkä, H.; Sarkkola, S.; Koivusalo, H.; Pennanen, T. Recycled iron phosphate as a fertilizer raw material for tree stands on drained boreal peatlands. For. Ecol. Manag. 2011, 261, 105–110. [Google Scholar] [CrossRef]
  42. Wang, B.L.; Shen, J.B.; Zhang, W.H.; Zhang, F.S.; Neumann, G. Citrate exudation from white lupin induced by phosphorus deficiency differs from that induced by aluminum. New Phytol. 2007, 176, 581–589. [Google Scholar] [CrossRef]
  43. Delgado, A.; Madrid, A.; Kassem, S.; Andreu, L.; Del Carmen Del Campillo, M. Phosphorus fertilizer recovery from calcareous soils amended with humic and fulvic acids. Plant Soil 2002, 245, 277–286. [Google Scholar] [CrossRef]
  44. Roberts, T.L.; Johnston, A.E. Phosphorus use efficiency and management in agriculture. Resour. Conserv. Recycl. 2015, 105, 275–281. [Google Scholar] [CrossRef]
  45. Syers, J.K.; John, K.; Johnston, A.E.; Curtin, D.; Food and Agriculture Organization of the United Nations. Efficiency of Soil and Fertilizer Phosphorus Use: Reconciling Changing Concepts of Soil Phosphorus Behaviour with Agronomic Information; Food and Agriculture Organization of the United Nations: Rome, Italy, 2008. [Google Scholar]
  46. Eynard, A.; Del Campillo, M.C.; Barr6n, V.; Torrent, J. Use of vivianite (Fe3(PO4)2.8H2O) to prevent iron chlorosis in calcareous soils. Fertil. Res. 1992, 31, 61–67. [Google Scholar] [CrossRef]
  47. Rosado, R.; Del Campillo, M.C.; Martínez, M.A.; Barrón, V.; Torrent, J. Long-term effectiveness of vivianite in reducing iron chlorosis in olive trees. Plant Soil 2002, 241, 139–144. [Google Scholar] [CrossRef]
  48. Díaz, I.; Barrón, V.; Del Campillo, M.C.; Torrent, J. Vivianite (ferrous phosphate) alleviates iron chlorosis in grapevine. Vitis 2009, 48, 107–113. [Google Scholar]
  49. de Santiago, A.; Delgado, A. Predicting Iron Chlorosis of Lupin in Calcareous Spanish Soils from Iron Extracts. Soil Sci. Soc. Am. J. 2006, 70, 1945–1950. [Google Scholar] [CrossRef]
Figure 1. Electron microscope image of recovered vivianite.
Agronomy 14 02639 g001
Figure 2. Effect of fertilizer treatments on dry matter yield of sunflower plants. Means with the same letter were not significantly different according to the Bonferroni test (p < 0.05). Error bars represent the standard error for each fertilizer treatment. T1, non-fertilized control; T2, 100% vivianite; T3, 70% vivianite + 30% superphosphate; T4, 30% vivianite + 70% superphosphate; T5, 100% superphosphate.
Agronomy 14 02639 g002
Figure 3. Effect of fertilizer treatments on P uptake of sunflower plants. Means with the same letter were not significantly different according to the Bonferroni test (p < 0.05). Error bars represent the standard error for each fertilizer treatment. T1, non-fertilized control; T2, 100% vivianite; T3, 70% vivianite + 30% superphosphate; T4, 30% vivianite + 70% superphosphate; T5, 100% superphosphate.
Agronomy 14 02639 g003
Figure 4. Effect of fertilizer treatments on PFRV on DM and P uptake basis for sunflower plants. Means with the same letter were not significantly different according to the Bonferroni test (p < 0.05), with PFRVDM and PFRVP Uptake analyzed independently. Error bars represent the standard error for each fertilizer treatment. T2, 100% vivianite; T3, 70% vivianite + 30% superphosphate; T4, 30% vivianite + 70% superphosphate.
Agronomy 14 02639 g004
Figure 5. Effect of fertilizer treatments on Olsen P in soil after harvesting of sunflower plants. Means with the same letter were not significantly different according to the Bonferroni test (p < 0.05). Error bars represent the standard error for each fertilizer treatment. T1, non-fertilized control; T2, 100% vivianite; T3, 70% vivianite + 30% superphosphate; T4, 30% vivianite + 70% superphosphate; T5, 100% superphosphate.
Agronomy 14 02639 g005
Table 1. Soil properties.
ClaySiltSand CCESOCpHECCECCaMgKNaOlsen PFeMnZnCu
% dS m–1cmolc kg−1mg kg−1
1519663.300.458.340.1310.459.430.530.420.073.510.713.40.4319.6
CCE, Ca carbonate equivalent; SOC, soil organic C; EC, electrical conductivity; CEC, cation exchange capacity; Ca, Mg, K, and Na, exchangeable cations; Fe, Mn, Zn, and Cu extracted with DTPA, Diethylenetriaminepentaacetic acid.
Table 2. Elemental composition and proportion of Fe2+ and Fe3+ in the recovered vivianite.
Cnd
Nnd
P108 g kg−1
K0.25 g kg−1
Ca8.9 g kg−1
Mg9.2 g kg−1
Fe280 g kg−1
Zn0.16 g kg−1
Mn1.14 g kg−1
Cu0.04 g kg−1
Mössbauer Fe speciation
Fe2+ 75%
Fe3+25%
XPS Fe Speciation
Fe2+41%
Fe3+59%
nd: not detectable, XPS, X-ray photoelectron spectroscopy.
Table 3. Effect of fertilizer treatment on sunflower plants Fe uptake and soil DTPA Fe.
Fertilizer TreatmentFe Uptake (mg Plant−1)DTPA Fe (mg kg−1)
T1 (non-fertilized control)0.70 ± 0.05 b4.82 ± 0.26 ab
T2 (100% vivianite)0.99 ± 0.18 b4.97 ± 0.23 a
T3 (70% vivianite + 30% superphosphate)1.50 ± 0.27 b4.25 ± 0.15 bc
T4 (30% vivianite + 70% superphosphate)3.43 ± 0.80 a4.22 ± 0.15 bc
T5 (100% superphosphate3.43 ± 0.57 a4.20 ± 0.22 c
Anovap Value
Fertilizer Treatment (A)0.00000.0005
Fertilizer Location (B)0.00740.5627
A × B0.00040.2770
Means ± standard error; means with the same letter were not significantly different according to the Bonferroni test (p < 0.05). DTPA, Diethylenetriaminepentaacetic acid.
Table 4. Effect of fertilizer treatments on agronomic efficiency, apparent P recovery, and Olsen P recovery.
Fertilizer TreatmentAgronomic Efficiency (AE)Apparent P Recovery (APR)Olsen P Recovery (OPR)
kg DM g–1 Pkg kg–1kg kg–1
T2 (100% vivianite)0.018 ± 0.005 d0.016 ± 0.011 d0.009 ± 0.014 ab
T3 (70% vivianite + 30% superphosphate0.214 ± 0.010 c0.142 ± 0.006 c0.000 ± 0.010 b
T4 (30% vivianite + 70% superphosphate)0.489 ± 0.028 b0.314 ± 0.014 b0.030 ± 0.007 ab
T5 (100% superphosphate)0.747 ± 0.035 a0.427 ± 0.014 a0.044 ± 0.004 a
ANOVAp Value
Fertilizer Treatment (A)0.00000.00000.0054
Fertilizer Location (B)0.21560.55560.9963
A × B0.12460.10180.5448
Means ± standard error; means with the same letter were not significantly different according to the Bonferroni test (p < 0.05).
Disclaimer/Publisher’s Note: The statements, opinions and data contained in all publications are solely those of the individual author(s) and contributor(s) and not of MDPI and/or the editor(s). MDPI and/or the editor(s) disclaim responsibility for any injury to people or property resulting from any ideas, methods, instructions or products referred to in the content.

